Embed Size (px)
Citation preview
Advanced Solid-State Photonics
Real time 3D nonlinear microscopy
B. Rozsa, E. S. ViziInstitute for Experimental Medicine, Department for Pharmacology, P.O. Box 67, H-1450 Budapest, Hungary
G.Katona, A. LukácsR & D Ultrafast Lasers Kft. P.O. Box 622, H-1539 Budapest, Hungary
Z. Várallyay, A. Sághy, L. Valenta, P. MaákBudapest University of Technology and Economics, Budafoki út 8, H-llll Budapest, Hungary
J. Fekete, Á. Bányász, R. Szipocs*Research Institute for Solid State Physics and Optics, P.O. Box 49, H-1525 Budapest, Hungary
[email protected]*also with Institutefor Experimental Medicine, Departmentfor Pharmacology
Abstract. We propose a nonlinear microscope scheme capable of real time, 3Dinvestigation of the electric activity pattern of neural networks or signal summationrules of individual neurons in a 0.6 x 0.6 x 0.2 mm3 volume with sub-micrometer
spatial resolution.OCIS codes: 170.5810Scanningmicroscópy;320.2250 Femtosecondphenomena
Introduction
Recent investigations in neurology pointed out the importance of nonlinear effects such as two-photon absorption and second-harmonic generation in high spatial resolution microscopy [1].Dendritic integration at the cell level and arithmetics of neuronal signaling at the network levelhowever show a need for real time measurements meanwhile keeping the advantages of nonlinearmicroscopy.
The problem of measuring within the signal transition time across neurons or neural networkshas not been solved yet. The reason for this is the following: current nonlinear microscope systemsobtain images by scanning a laser beam in 20 and the 3D volume can be reconstructed only aftersubsequent recording of hundreds of 20 images along the opticai axis (z-axis). This proceduretypically takes a few minutes which is several orders of magnitude longer than the signal transitiontime « 1 ms) of a neuron. Looking at signal propagationin neurons the points to be investigated(such as dendritic spines) lie randomly distributed in 3D space. This requires the ability to carry outmeasurements on arbitrary points within a 3D volume well within the signal transition time.
In this paper we present a nove1 two-photon microscope scheme being capable of high speedmeasurement of signal transitions in neural networks or through single neurons in a 3D volume ofapprox. 0.6 x 0.6 x 0.2 mm3.
Concept
As an initial step, a conventional 3D image is obtained by taking 2D scanning two-photon images ofthe biologicai sampie. From this image the coordinates of those points (PI, P2 ... Pn) are determinedin the 3D volume that are to be investigated (see Fig. l(a)). Ouring the measurement of neuralactivity, only these points are sequentially addressed by a high speed acousto-optic (AO) switchcombined with a fiber bundle (of n opticai fibers) and a properly designed opticai imaging system(see Fig. l(b)).
858
Advanced Solid-State Photonics
,, """"'
Ji" """,
, , l , , , ,, sampl"i :.~c.~:~,.z_J. i;",.-. -. -.-'. -. -.-
(a) (b)
Fig. 1 (a) Dendritic spines to be measured in a 3D volume (projection of several two-photon images in the z-direction)and (b) the scheme of the acousto-optic switch, optical fibers and imaging system which label the chosen points of thesample for 2-photon measurements
Experimental setup
In order to achieve effective two-photon excitation, high energy density is needed. This requirementcan be met by minimization of pulse duration and focused beam diameter. The minimization of pulseduration is limited by the finite absorption bandwidth of fluorescent dyes. Fluorescent dyes used fordetecting Ca2+etc. ions typically have a full width at half maximum (FWHM) absorption bandwidth(~A) of tens of nm-soThis bandwidth supports excitation pulses with time durations of around 20 fsand above.
Initially we used standard single mode opticai fibers (SMF) (Thorlabs 780HP) in our work.The temporal shape of the fs laser pulses and the aaussian shape of the laser beam profile aremaintained by minimizing nonlinear effects during propagation. Distortion-free fiber delivery isachieved by (1) applyingrelativelybroadband(Le. temporallyshort, ~'t ::::: 25 fs transformlimited)infrared laser pulses and (2) applying the chirped pulse concept widely used in chirped pulseamplification (CPA) systems. Briefly, the CPA consists of the following steps: (a) stretching of theinitially short pulses by high second order dispersion (aDD) in order to decrease the maximumintensity hence the nonlinearity in the fiber/amplifying media; (b) propagation in the fiber/nonlinearmedia, (c) recompression of the laser pulses by introducing nearly the same dispersion of theopposite sign. Since the free space between the two objectives (OBJl, OBJ2, see Fig. 2) is limitedwe use the high spacedemandingnegativeaDD setup beforethe fiber. Highnegativechirp (aDD :::::
- 14000 fs2) - i.e. pulse stretching - was introduced by a Proctor & Wise four-prism sequence whichis adequate for the control of third-order dispersion (TOD) as well [2]. High positive aDD after thefiber is realized by a highly dispersive polarizing beam splitter cube (PBS) built into the imagingsystem.
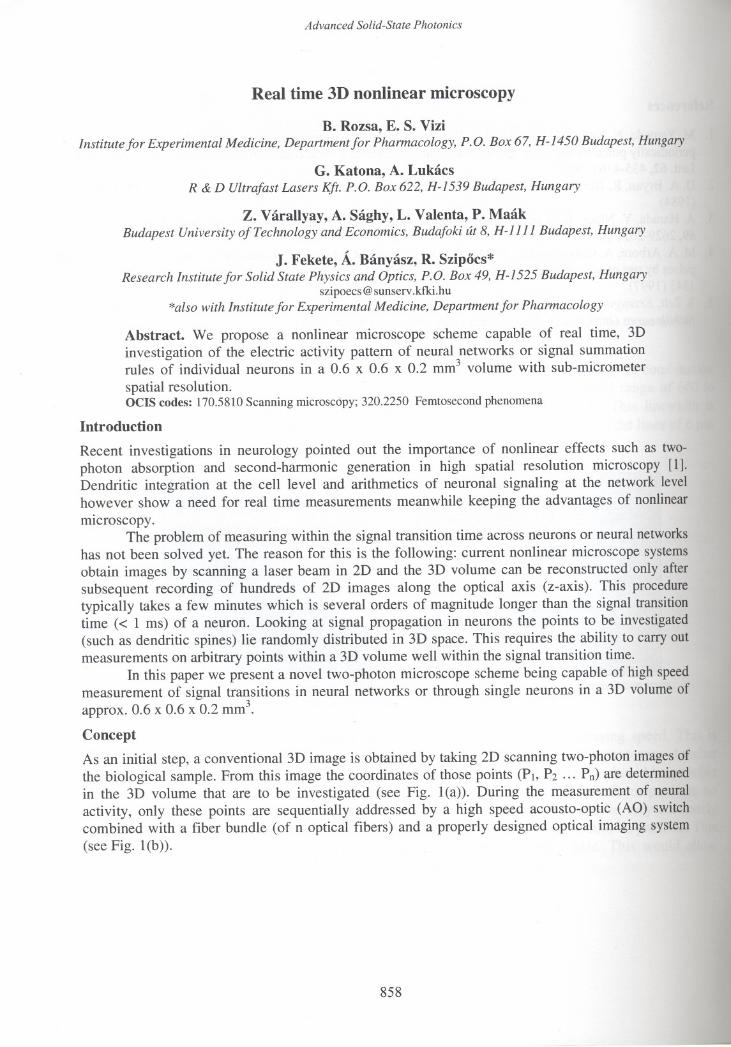
Our experimental setup is shown in Fig. 2. In our measurements, we used a mode-Iocked Ti-sapphire laser oscillator (FemtoRose 20 MCD [3]) with a central wavelength of 795 nm and FWHMbandwidth of -20 nm.
A Faraday isolator (FI) was placed after the Proctor & Wise four prism sequence in order toavoid any disturbance of the laser operation by back reflections from the fibers. This FI reduced thenegative dispersion by aDD::::: 2,700 fs2. Switching between the opticai fibers is carried out bycomputer controlled acousto-optic switches [4]. Switching time between the fibers could be reduceddown to 1-3 flSdepending on the number of fibers (up to lOxlO) to be addressed. The acousto-opticswitches exhibit an additional positive aDD of - 1,500 fs2. Angular dispersion of the AO switches iscompensated by properly designed, anti-reflection coated prisms made of SFl1 glass. The AOswitches are then imaged onta a fiber coupling lens by a large diameter doublet lens free of spherical
859
Advanced Solid-State Photonics
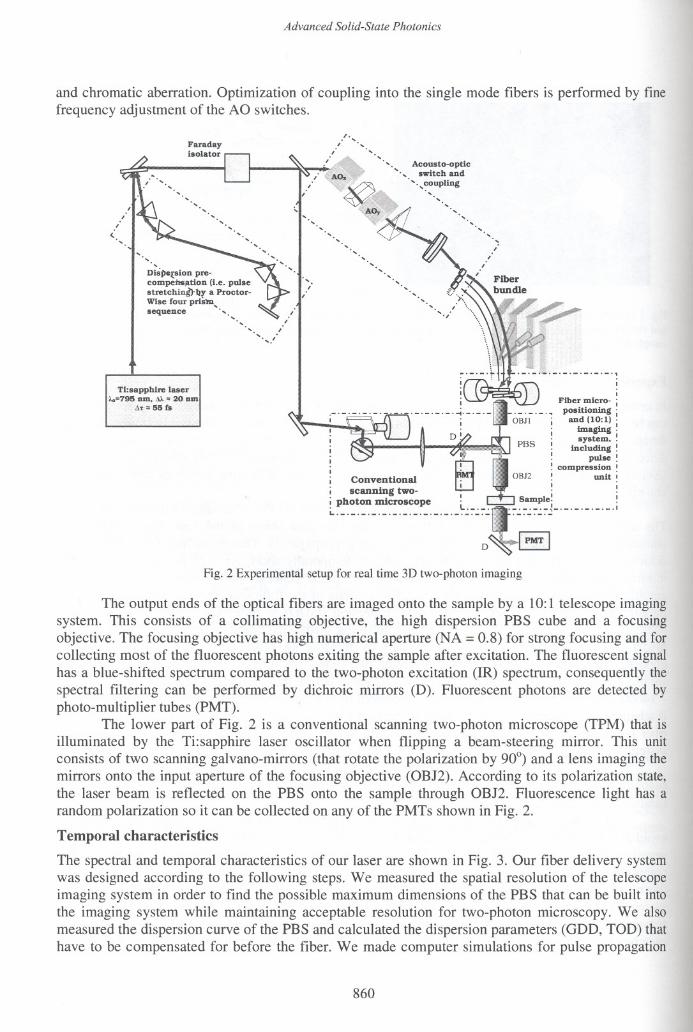
and chromatic aberration. Optimization of coupling into the single mode fibers is performed by finefrequency adjustment of the AO switches.
<-
"',1,., "
Dispe(sion pre-compei1sjltion (l.e. pulsestretching)' bY a Proctor-Wise four priS'tll,
sequence ., ., "
"' ,/
Faradayisolator
.t'.. '.. '..'.."'. Acousto-optic
"'.. switch and. .. ...cDupling
, "
"'..""~,,
,. '... '..""'"
""" ;""" '..'..
"""'" '.."'.
..,
,
Ti:sapphire laser,u-20nm
55 fs
I Conventional
i scanning two-i photonmicroscope L.- .- ....- .-. -._.-. -.-.-._._.-
Fig. 2 Experimental setup for real time 3D two-photon imaging
The output ends of the optical fibers are imaged onta the sample by a 10:1 telescope imagingsystem. This consists of a collimating objective, the high dispersion PBS cube and a focusingobjective. The focusing objective has high numerical aperture (NA =0.8) for strong focusing and forcollecting most of the fluorescent photons exiting the sample after excitation. The fluorescent signalhas a blue-shifted spectrum compared to the two-photon excitation (IR) spectrum, consequently thespectral filtering can be performed by dichroic mirrors (D). Fluorescent photons are detected byphoto-multiplier tubes (PMT). '
The lower part of Fig. 2 is a conventional scanning two-photon microscope (TPM) that isilluminated by the Ti:sapphire laser oscillator when flipping a beam-steering mirror. This unitconsists of two scanning galvano-mirrors (that rotate the polarization by 900) and a lens imaging themirrors onta the input aperture of the focusing objective (OBJ2). According to its polarization state,the laser beam is reflected on the PBS onta the sample through OBJ2. Fluorescence light has arandom polarization so it can be collected on any of the PMTs shown in Fig. 2.
Temporal characteristics
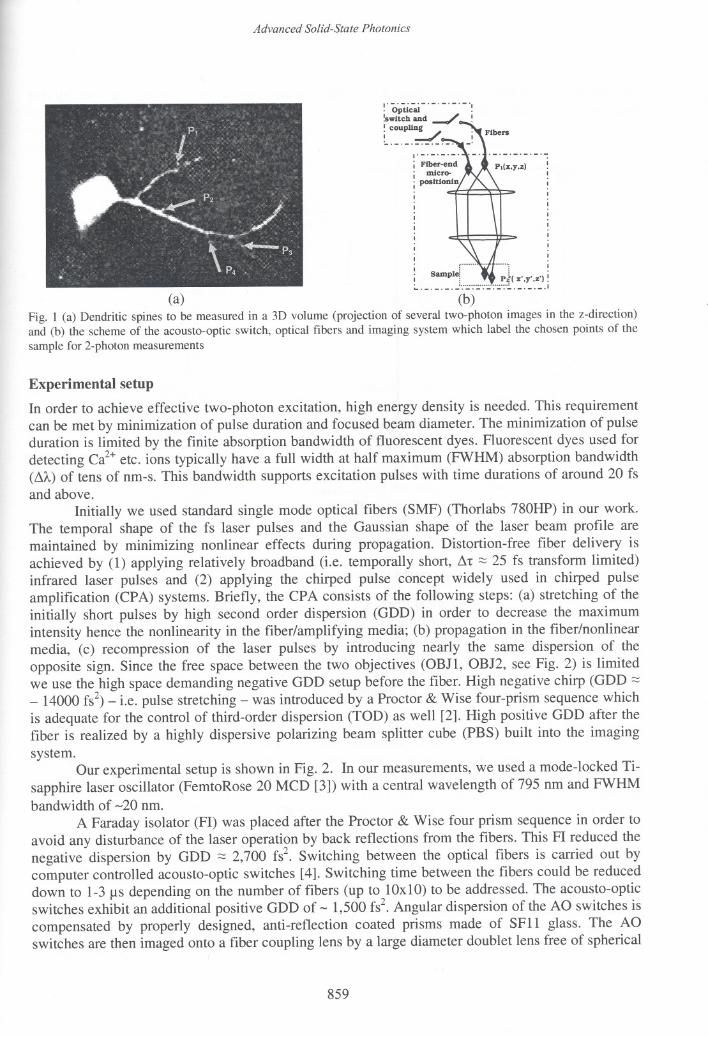
The spectral and temporal characteristics of our laser are shown in Fig. 3. Our fiber delivery systemwas designed according to the following steps. We measured the spatial resolution of the telescopeimaging system in order to find the possible maximum dimensions of the PBS that can be built intathe imaging system while maintaining acceptable resolution for two-photon microscopy. We alsameasured the dispersion curve of the PBS and calculated the dispersion parameters (GDD, TOD) thathave to be compensated for before the fiber. We made computer simulations for pulse propagation
860
Advanced Solid-State Photonics
through the opticai fiber in order to control the pre-chirp and optimize pulse parameters for oursystem. In order to find the optimum arrangement of the Proctor & Wise four-prism sequence [5], wemeasured dispersion all of the optical components in the system and ca1culated the correspondingdistance values for pulse stretching.
1,03,5
0,9
0.83.0
,50 50 100 150 200
0,7 2,5
::i 0,6tÚ
i- 0,5'iic 0,4S.E 0,3
~ 2,0'iic
~ 1,5CI
iii 1,0
0,2 0,5
0,10,0
0,0
770 780 790 800 BIO B20 .200 ,150 ,100
WavAIAnath (nm) Delay (Is)
(a) (b)
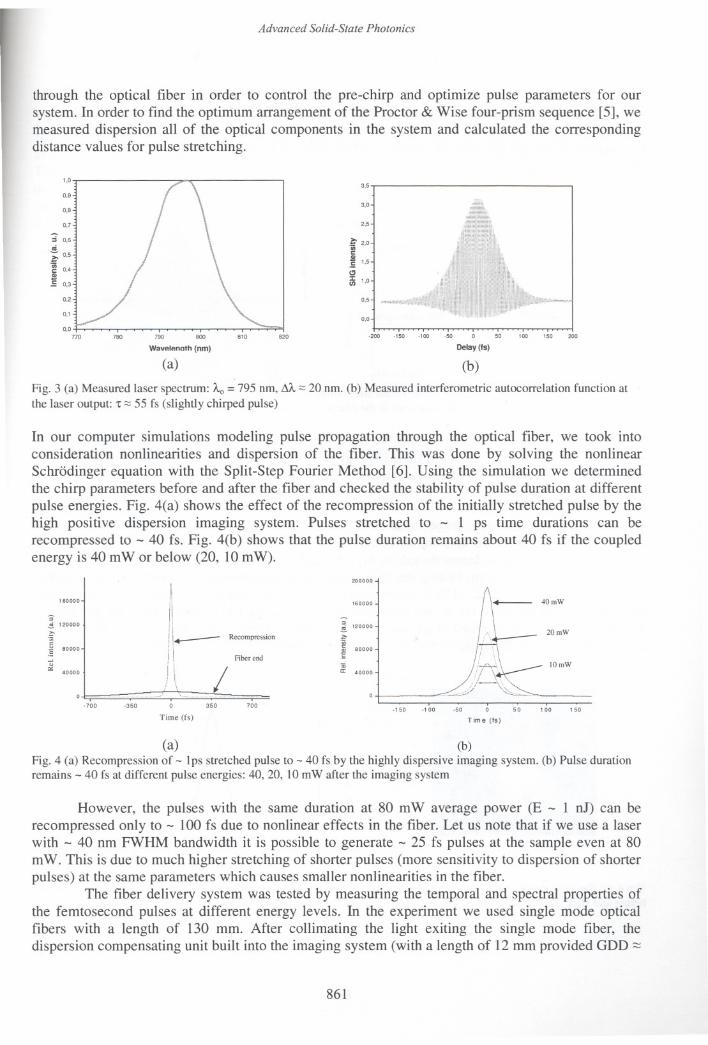
Fig. 3 (a) Measured laser spectrum: A" =795 nm, M:::; 20 nm. (b) Measured interferometric autocorrelation function atthe laser output: 't:::;55 fs (slightly chirped pulse)
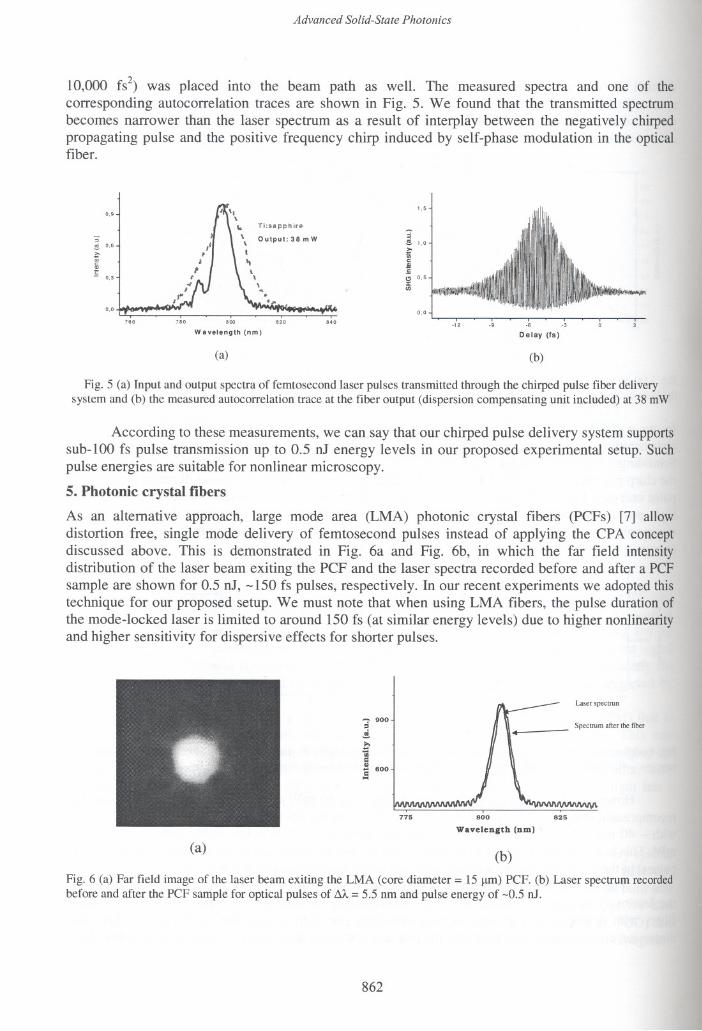
In our computer simulations modeling pulse propagation through the opticai fiber, we took inteconsideration nonlinearities and dispersion of the fiber. This was done by solving the nonlinearSchrödinger equation with the Split-Step Fourier Method [6]. Using the simulation we determinedthe chirp parameters before and after the fiber and checked the stability of pulse duration at differentpulse energies. Fig. 4(a) shows the effect of the recompression of the initially stretched pulse by thehigh positive dispersion imaging system. Pulses stretched to - 1 ps time durations can berecompressed to - 40 fs. Fig. 4(b) shows that the pulse duration remains about 40 fs if the coupledenergy is 40 mW or below (20, 10 m W).
200000
s~ 120000>,=
,11 BOOOO
'11,
ii
!\--- Recompressioni\ Fiber end
I!i \í \
160000
IOmW
160000
~'"'" 40000 I
,;~ 120000~111'" 60000~'"CI: 40000
o..., ,.700 ,350 350 700
.150 ,100 ,50 50 100 150
Time (Cs) Time (ts)
(a) (b)
Fig. 4 (a) Recompression of - Ips stretched pulse to - 40 fs by the highly dispersive imaging system. (b) Pulse durationremains - 40 fs at different pulse energies: 40, 20, 10m W after the imaging system
However, the pulses with the same duration at 80 mW average power (E - 1 nJ) can berecompressed only to - 100 fs due to nonlinear effects in the fiber. Let us note that if we use a laserwith - 40 nm FWHM bandwidth it is possible to generate - 25 fs pulses at the sampie even at 80mW. This is due to much higher stretching of shorter pulses (more sensitivity to dispersion of shorterpulses) at the same parameters which causes smaller nonlinearities in the fiber.
The fiber delivery system was tested by measuring the temporal and spectral properties ofthe femtosecond pulses at different energy levels. In the experiment we used single mode opticaifibers with a length of 130 mm. After collimating the light exiting the single mode fiber, thedispersion compensating unit built inte the imaging system (with a length of 12 mm provided GDD::::::
861
Advanced Solid-State Photonics
10,000 fs2) was placed into the beam path as weIl. The measured spectra and one of thecorresponding autocorrelation traces are shown in Fig. 5. We found that the transmitted spectrumbecomes narrower than the laser spectrum as a result of interplay between the negatively chirpedpropagating pulse and the positive frequency chirp induced by se1f-phase modulation in the opticaifiber.
0,9"
\.. Tio.apphir.
\ Output: 38 mWt"
\\,"..
1,5
~~ 0,6~
i- 0,3
~~ 1O
,~ '..cI!!,5" 0,5:J:lJ>
0,00,0
800 820 840-12 -, -6 -3
Wa velength (nm) Delay (Is)
(a) (b)
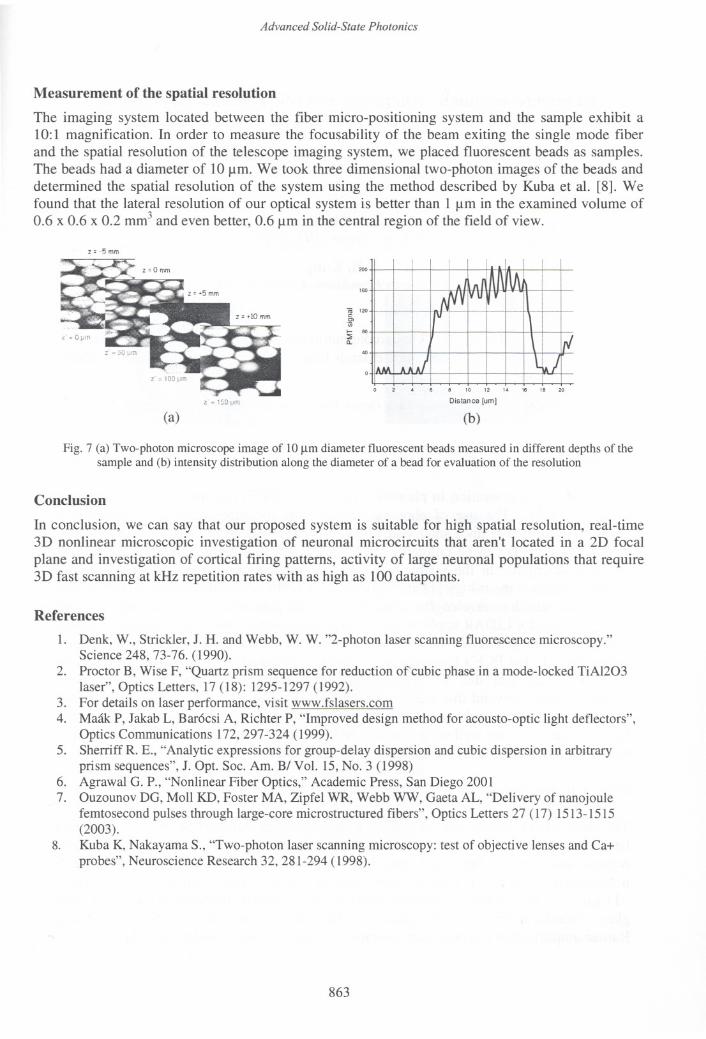
Fig. 5 (a) Input and output spectra of femtosecond laser pulses transmitted through the chirped pulse fiber deliverysystem and (b) the measured autocorrelation trace at the fiber output (dispersion compensating unit included) at 38 mW
According to these measurements, we can say that our chirped pulse delivery system supportssub-lOO fs pulse transmission up to 0.5 nj energy levels in our proposed experimental setup. Suchpulse energies are suitable for nonlinear microscopy.
5. Photonic crystal fibers
As an altemative approach, large mode area (LMA) photonic crystal fibers (PCFs) [7] allowdistortion free, single mode delivery of femtosecond pulses instead of applying the CPA conceptdiscussed above. This is demonstrated in Fig. 6a and Fig. 6b, in which the far field intensitydistribution of the laser beam exiting the PCF and the laser spectra recorded before and after a PCFsampie are shown for 0.5 nj, -150 fs pulses, respectively. In our recent experiments we adopted thistechnique for our proposed setup. We must note that when using LMA fibers, the pulse duration ofthe mode-locked laser is limited to around 150 fs (at similar energy levels) due to higher nonlinearityand higher sensitivity for dispersive effects for shorter pulses.
775
Laser spectrun
- 900:i$t-öl1':.!! 600OS
Spectrum after the fiber
800 825
Wavelength (nm)
(a)(b)
Fig. 6 (a) Far field image of the laser beam exiting the LMA (core diameter =15 !-tm)PCF. (b) Laser spectrum recordedbefore and after the PCF sampie for optical pulses of !1'A=5.5 nm and pulse energy of -0.5 nj.
862
Advanced Solid-State Photonics
Measurement of the spatial resolution
The imaging system located between the fiber micro-positioning system and the sampie exhibit a10:1 magnification. In order to meaSUfethe focusability of the beam exiting the single mode fiberand the spatial resolution of the telescope imaging system, we placed fluorescent beads as samples.The beads had a diameter of 1O~m. We took three dimensional two-photon images of the beads anddetermined the spatial resolution of the system using the method described by Kuba et al. [8]. Wefound that the lateral resolution of oUf opticai system is better than 1 ~m in the examined volume of0.6 x 0.6 x 0.2 mm3 and even better, 0.6 ~m in the central region of the field of view.
z ~ -5 mm
'"
. 10 12 14 16 " 20
200
160
"jg 120CI'u;
~ 80Il.
z .150 pn Distance [um]
(a) (b)
Fig. 7 (a) Two-photon microscope image of 10 11mdiameter fluorescent beads measured in different depths of thesampie and (b) intensity distribution along the diameter of a bead for evaluation of the resolution
Conclusion
In conclusion, we can say that oUf proposed system is suitable for high spatial resolution, real-time3D nonlinear microscopic investigation of neuronal microcircuits that aren't located in a 2D focalplane and investigation of corticai firing patterns, activity of large neuronal populations that require3D fast scanning at kHz repetition rates with as high as 100 datapoints.
References
1. Denk, W., Strickler, J. H. and Webb, W. W. "2-photon laser scanning fluorescence microscopy."Science 248, 73-76. (1990).
2. Proctor B, Wise F, "Quartz prism sequence for reduction of cubic phase in a mode-Iocked TiAl203laser", Optics Letters, 17 (18): 1295-1297 (1992).
3. For details on laser performance, visit www.fslasers.com4. Maák P, Jakab L, Barócsi A, Richter P, "Improved design method for acousto-optic light deflectors",
Optics Communications 172,297-324 (1999).5. Sherriff R. E., "Analytic expressions for group-delay dispersion and cubic dispersion in arbitrary
prism sequences", J. Opt. Soc. Am. BI Vol. 15, No. 3 (1998)6. Agrawal G. P., "Nonlinear Fiber Optics," Academic Press, San Diego 20017. Ouzounov DG, Moll KD, Foster MA, Zipfel WR, Webb WW, Gaeta AL, "Delivery of nanojoule
femtosecond pulses through large-core microstructured fibers", Optics Letters 27 (17) 1513-1515(2003).
8. Kuba K, Nakayama S., "Two-photon laser scanning microscopy: test of objective lenses and Ca+probes", Neuroscience Research 32, 281-294 (1998).
863