Embed Size (px)
Citation preview

Quality of Service, Efficiency, and Scale in Network Industries:
An Analysis of European Electricity Distribution
Christian Growitsch Tooraj Jamasb Michael Pollitt
July 2005 No. 3
Institut für Halle Institute for Economic Research
Wirtschaftsforschung Halle
IWH-DiskussionspapiereIWH-Discussion Papers
Quality of Service, Efficiency, and Scale in Network Industries:
An Analysis of European Electricity Distribution
Christian Growitsch Tooraj Jamasb Michael Pollitt
July 2005 No. 3
IWH __________________________________________________________________
IWH-Diskussionspapiere 3/2005 2
Autor: Christian Growitsch
Department of Industrial Organisation and Regulation
Tel.: ++49 345 77 53-864
The responsbility for discussion papers lies solely with the individual authors. The views expressed herein do not necessarily represent those of the IWH.
Questions, comments and suggestions are welcome.
Herausgeber: INSTITUT FÜR WIRTSCHAFTSFORSCHUNG HALLE – IWH Das IWH ist Mitglied der Leibniz-Gemeinschaft
Hausanschrift: Kleine Märkerstraße 8, 06108 Halle (Saale) Postanschrift: Postfach 11 03 61, 06017 Halle (Saale) Telefon: (0345) 77 53-60 Telefax: (0345) 77 53-8 20 Internetadresse: http://www.iwh-halle.de
__________________________________________________________________ IWH
IWH-Diskussionspapiere 3/2005 3
Quality of Service, Efficiency, and Scale in Network Industries:
An Analysis of European Electricity Distribution
Christian Growitsch∗ Tooraj Jamasb∗∗ Michael Pollitt∗∗∗
Abstract
Quality of service is of major economic significance in natural monopoly infrastructure industries and is increasingly addressed in regulatory schemes. However, this important aspect is generally not reflected in efficiency analysis of these industries. In this paper we present an efficiency analysis of electricity distribution networks using a sample of about 500 electricity distribution utilities from seven European countries. We apply the stochastic frontier analysis (SFA) method on multi-output translog input distance func-tion models to estimate cost and scale efficiency with and without incorporating quality of service. We show that introducing the quality dimension into the analysis affects es-timated efficiency significantly. In contrast to previous research, smaller utilities seem to indicate lower technical efficiency when incorporating quality. We also show that incor-porating quality of service does not alter scale economy measures. Our results empha-sise that quality of service should be an integrated part of efficiency analysis and incen-tive regulation regimes, as well as in the economic review of market concentration in regulated natural monopolies.
Keywords: efficiency, quality of service, scale economies, input distance function, sto-chastic frontier analysis.
JEL: L15, L51, L94
∗ Halle Institute for Economic Research.
∗∗ Faculty of Economics, University of Cambridge.
∗∗∗ Judge Business School, University of Cambridge
We thank Catherine Morrison-Paul, Tim Coelli, Toru Hattori and Michael Kuenzle for helpful comments and discussions. Growitsch acknowledges support by the Ministry of Science and Culture of Lower Saxony and Jamasb and Pollitt acknowledge the support of the Cambridge – MIT Institute via its CMI IR-45 grant.
IWH __________________________________________________________________
IWH-Diskussionspapiere 3/2005 4
1. Introduction
Infrastructure industries, such as electricity, telecommunications, gas, transport, and wa-ter continue to maintain their strategic importance in modern economies. Since the 1990s, the globally dominant paradigms governing the structure and ownership models of these industries, natural monopoly, vertical integration, and public ownership, have been challenged. Liberal models based on competition, economic incentives, and private ownership have been adopted to achieve internal and external efficiency improvements in these sectors and to benefit customers in the form of lower costs and higher service quality.
The electricity sector has witnessed considerable liberalisation activities in many coun-tries around the world. The main tenets of electricity sector liberalisation have been re-structuring, regulation, and privatization. Implementing the new model required restruc-turing of the industries to separate potentially competitive segments (generation and re-tail supply) from natural monopoly activities (distribution and transmission) that would need to be regulated. Independent regulation would oversee the successful functioning of competitive power markets and regulated transmission and distribution networks. Private ownership and profit incentive would promote internal efficiency in the firms. Moreover, two important aspects of the new industry structure have been widely ne-glected: the question of (efficient) optimal firm size in natural monopolies and its rela-tion to quality of service (QoS).
In competitive markets, competition and market size are important determinants of firm size and market concentration (subject to rules and policy). In natural monopolies, in the absence of market forces, public intervention, regulation, and history are often factors that affect efficiency and scale of firms. Theory characterises natural monopolies to be the most technically efficient market structure when a single firm can produce a specific output vector at less cost than two or more firms (subadditivity). Subadditive cost struc-tures have been theoretically and empirically shown in networks of infrastructure indus-tries (e.g. Gilsdorf, 1995 and Salvanes and Tjøtta, 1998). However, the appropriate scale (of production) of natural monopolies is also of economic interest. Optimal firm size as well as technical efficiency is related to the underlying production technology and struc-ture of an industry. Therefore, in any given industry, the relationship between efficiency and scale is an empirical question.
In the context of European electricity sector reform, the natural monopoly characteristics and economic importance of firm size and quality of service in distribution networks has led to public intervention and regulation in these activities. First, at the time of restruc-turing and unbundling, political decision-makers were faced with decisions regarding the number and size of firms. Second, in the post-reform period since the end of the 1990s, mergers and acquisitions – vertically and horizontally – increased market con-centration dramatically and changed the size of the firms requiring an informed policy

__________________________________________________________________ IWH
IWH-Diskussionspapiere 3/2005 5
towards this development. At the same time, the desirability of having a large number of utilities in small countries (e.g. Nordic countries) poses an interesting policy question. Third, adoption of incentive regulation models in recent years has given rise to concerns that, if left unregulated, the pursuit of profit maximisation is likely to result in deteriora-tion of quality of service.
In particular, a formal treatment of QoS from an industrial organisation point of view and/or as an integrated part of regulatory analysis has been widely neglected. This is es-pecially problematic as there are interactions and trade-offs between utilities’ costs (capital as well as operating and maintenance expenditures) and their size and quality of services. A simple cost-only approach to efficiency in regulated utilities will, therefore, not take an essential aspect of their activities into account. It is conceivable that quality-incorporated efficiency and scale measures of firms might differ from those of a cost-only approach. It is therefore important to enhance understanding of the significance of quality of service for efficiency and scale in network industries. Specifically, it might be that small operations are justified even where they have high costs but provide higher service quality and vice versa.
This paper aims to fill the void in previous research and shed some empirical light on the effects of including quality dimensions into the analysis of technical efficiency and optimal firm size. We estimate technical efficiency and scale economies of a sample of about 500 electricity distribution utilities from seven European countries, applying sto-chastic frontier analysis (SFA) method and multi-output translog input distance function models. The outline for the remainder of this paper is as follows. The theoretical foun-dations and previous literature are presented in Section 2. Section 3 discusses the meth-odology, and the estimation method. In Section 4 we introduce the modelling approach and specify the estimated models. The data is described in Section 5. Estimation results are presented in Section 6. Section 7 contains conclusions and highlights policy implica-tions and directions for future research.
2. Efficiency and Quality of Service
The nature of electricity distribution has been examined in a number of theoretical and empirical studies, which predominantly support the existence of natural monopoly con-ditions in distribution networks.1 This section recapitulates the basic conditions of natu-ral monopoly theory and reviews previous research on (international) productivity analysis, optimal firm size, and on quality of service in network industries. We then pre-
1 For example, Gilsdorf (1994, 1995), Filippini (1998), Salvanes and Tjøtta (1998), and Yatchew (2000).
IWH __________________________________________________________________
IWH-Diskussionspapiere 3/2005 6
sent two hypotheses regarding the relationship between quality of service, technical effi-ciency, and firm size in electricity distribution networks.
The natural monopoly characteristics in electricity distribution can be attributed to three major aspects (e.g. Growitsch and Wein 2004): the high degree of sunk investments in network assets (e.g. power lines and transformers), economies of scale in electricity supply, and economies of scope between the major services in electricity distribution, namely ‘customer connection’ and ‘energy delivery’.2 In economic theory, a natural monopoly is described as a market structure, where it is technically efficient to produce a certain output vector by a single firm. Technically, this condition occurs if the cost structure of such a market is strictly and globally subadditive for output vectors Yi, i = 1,…,m:
)()(11∑∑==
≤m
i
im
i
i YCYC (1)
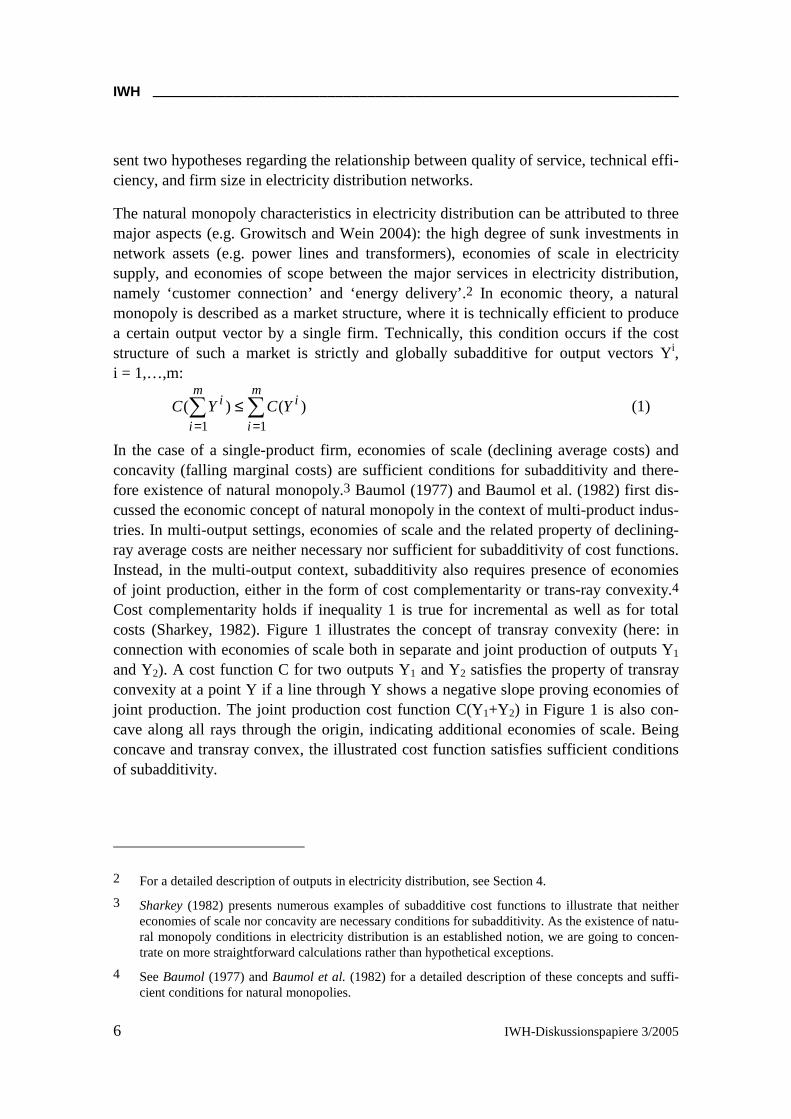
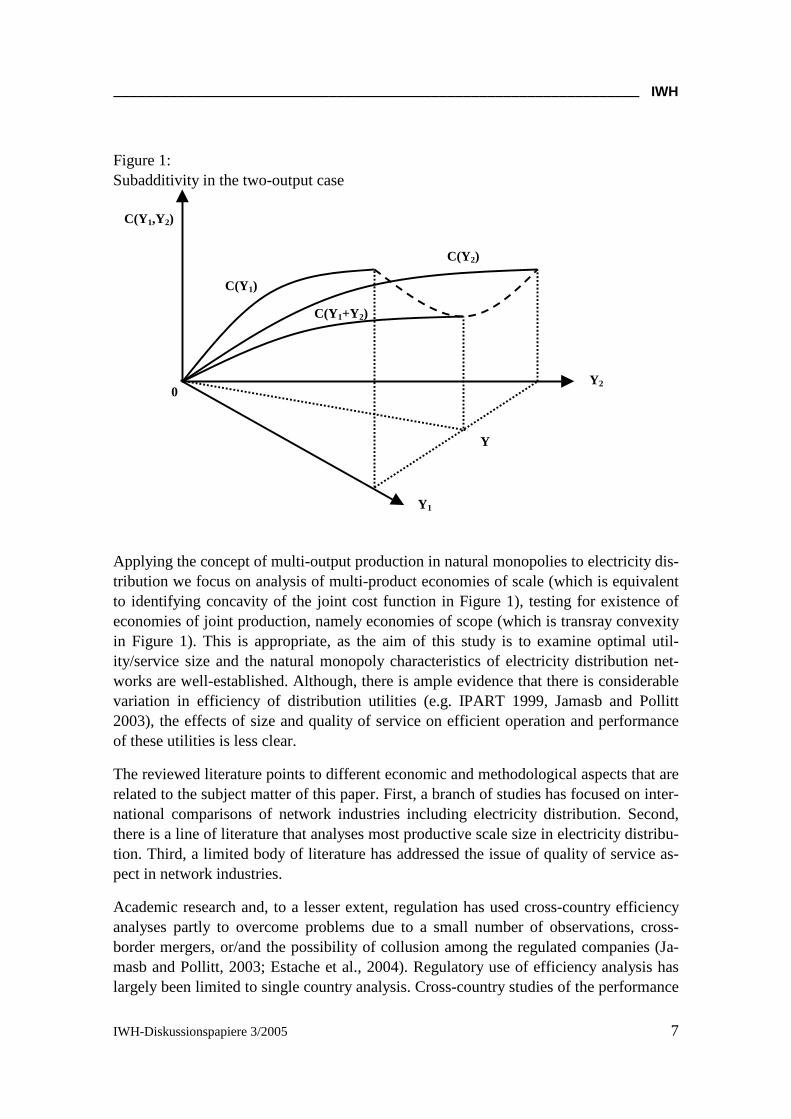
In the case of a single-product firm, economies of scale (declining average costs) and concavity (falling marginal costs) are sufficient conditions for subadditivity and there-fore existence of natural monopoly.3 Baumol (1977) and Baumol et al. (1982) first dis-cussed the economic concept of natural monopoly in the context of multi-product indus-tries. In multi-output settings, economies of scale and the related property of declining-ray average costs are neither necessary nor sufficient for subadditivity of cost functions. Instead, in the multi-output context, subadditivity also requires presence of economies of joint production, either in the form of cost complementarity or trans-ray convexity.4 Cost complementarity holds if inequality 1 is true for incremental as well as for total costs (Sharkey, 1982). Figure 1 illustrates the concept of transray convexity (here: in connection with economies of scale both in separate and joint production of outputs Y1 and Y2). A cost function C for two outputs Y1 and Y2 satisfies the property of transray convexity at a point Y if a line through Y shows a negative slope proving economies of joint production. The joint production cost function C(Y1+Y2) in Figure 1 is also con-cave along all rays through the origin, indicating additional economies of scale. Being concave and transray convex, the illustrated cost function satisfies sufficient conditions of subadditivity.
2 For a detailed description of outputs in electricity distribution, see Section 4.
3 Sharkey (1982) presents numerous examples of subadditive cost functions to illustrate that neither economies of scale nor concavity are necessary conditions for subadditivity. As the existence of natu-ral monopoly conditions in electricity distribution is an established notion, we are going to concen-trate on more straightforward calculations rather than hypothetical exceptions.
4 See Baumol (1977) and Baumol et al. (1982) for a detailed description of these concepts and suffi-cient conditions for natural monopolies.
__________________________________________________________________ IWH
IWH-Diskussionspapiere 3/2005 7
Figure 1: Subadditivity in the two-output case
Applying the concept of multi-output production in natural monopolies to electricity dis-tribution we focus on analysis of multi-product economies of scale (which is equivalent to identifying concavity of the joint cost function in Figure 1), testing for existence of economies of joint production, namely economies of scope (which is transray convexity in Figure 1). This is appropriate, as the aim of this study is to examine optimal util-ity/service size and the natural monopoly characteristics of electricity distribution net-works are well-established. Although, there is ample evidence that there is considerable variation in efficiency of distribution utilities (e.g. IPART 1999, Jamasb and Pollitt 2003), the effects of size and quality of service on efficient operation and performance of these utilities is less clear.
The reviewed literature points to different economic and methodological aspects that are related to the subject matter of this paper. First, a branch of studies has focused on inter-national comparisons of network industries including electricity distribution. Second, there is a line of literature that analyses most productive scale size in electricity distribu-tion. Third, a limited body of literature has addressed the issue of quality of service as-pect in network industries.
Academic research and, to a lesser extent, regulation has used cross-country efficiency analyses partly to overcome problems due to a small number of observations, cross-border mergers, or/and the possibility of collusion among the regulated companies (Ja-masb and Pollitt, 2003; Estache et al., 2004). Regulatory use of efficiency analysis has largely been limited to single country analysis. Cross-country studies of the performance
Y1
Y2 0
C(Y1)
C(Y1+Y2)
C(Y2)
Y
C(Y1,Y2)

IWH __________________________________________________________________
IWH-Diskussionspapiere 3/2005 8
of electric utilities are, however, rather few. In a comparison of UK and US distribution utilities, Pollitt (1995) finds a comparable performance in both countries. IPART (1999), in a study for the Independent Pricing and Regulatory Tribunal in Australia fo-cuses primarily on Australian distribution companies, taking UK and New Zealand utili-ties as additional observations. In another comparison of seven Australian and 32 inter-national electricity utilities Whiteman (1995) uses an international reference set to ana-lyse the development of X-inefficiency in Australian electricity utilities.
In a comparison of Scandinavian and Dutch electricity distribution companies, Edvard-sen and Førsund (2003) show the advantage of international comparisons in identifying peer companies. Jamasb and Pollitt (2003) compare the efficiency of 63 distribution utilities from six European countries using parametric and non-parametric benchmark-ing methods. They find that efficiency results tend to be rather sensitive in level, al-though not in rank order. Additionally, they report methods of introducing comparability in international samples. Analysing panel data of 84 South American electricity distribu-tors from eight countries, Estache et al. (2004) point out the importance of international benchmarking and the coordination of regulators in order to reduce information asym-metries. In a recent study, Hattori et al. (2005) analyse the efficiency development of UK and Japanese distribution utilities using panel data from 1985-1998, reporting an acceleration of productivity growth over time and positive economies of scale for UK companies relative to Japanese firms.
Previous research on scale economies and optimal firm size commonly applies the Data Envelopment Analysis (DEA) technique to calculate the scale efficiency by comparing the efficiency results from constant and variable returns to scale models.5 Empirical re-sults from parametric models tend to be rather few and predominantly applied cost func-tions for the analysis. For electricity distribution, an early contribution was by Nerlove (1963), who applies a cost function based on a generalized Cobb-Douglas production function and gives evidence for the possibility of substitution among factors of produc-tion. In two studies of Swiss electricity distribution utilities, Filippini (1996) and Filipinni and Wild (2001) using a flexible translog and a linear average cost function find evidence of increasing returns to scale throughout their sample of 39 and 59 utilities respectively.
Other studies address the issue of minimum efficient scale size. Giles and Wyatt (1993) estimate a total cost function from a sample of 60 New Zealand electricity distributors, reporting an efficient scale for a sales range of 500 to 3500 GWh. Yatchew (2000) con-verted the results from Giles and Wyatt on a number of customer basis and reports a minimum efficient scale size at 30000 customers. Salvanes and Tjøtta (1994) in a cross-sectional analysis of 100 Norwegian electricity distribution utilities find an optimal firm
5 For an introduction see Coelli et al. (1998).
__________________________________________________________________ IWH
IWH-Diskussionspapiere 3/2005 9
size at about 20,000 customers and that is relatively independent from the GWh sales. These results confirm Yatchew’s (2000) findings based on a four-year panel of 81 Ca-nadian distributors. The study estimated a semi-parametric translog cost function and reports substantial scale economies and a minimum efficient scale achieved by firms with about 20000 customers.
Empirical research on quality of service in network industries is scarce and mostly con-centrated on telecommunications sector (Resende and Façanha, 2004; Sappington, 2002; Ai and Sappington, 1998; Kridel et al., 1996). For the electricity sector, Ter-Martirosyan (2003) analyses the effect of incentive regulation on duration and frequency of electric outages for a panel of 78 U.S. utilities, reporting an increase in the duration of outages associated with incentive regulation. The study also finds that outages decrease when explicit quality benchmarks are introduced. Korhonen and Syrjänen (2003) find im-provement in technical efficiency after incorporating quality of service (interruption time per customer) in their DEA analysis of 106 Finish distribution utilities. CEPA (2003) applies a two step DEA model to cross-sectional data for the UK and finds no significant correlation between technical efficiency measures and service quality in terms of minutes lost per customer. Ajodhia et al. (2004) apply a DEA and a Corrected Ordinary Least Squares (COLS) model to a cross-sectional sample of 44 electric utilities from four countries (UK, Netherlands, Hungary and Malaysia), reporting a significant efficiency increase when quality is taken into account especially for smaller utilities. Giannakis et al. (2005) carried out a quality incorporated efficiency study with panel data on UK electricity distribution. They show that technical efficiency does not neces-sarily also involve high service quality and state that quality incorporated regulatory benchmarking is superior to cost-only approaches.
The relationship of efficiency, firm size, and quality in regulated network industries has not been addressed previously. Kwoka (2005) is an exception, who in an analysis of pri-vate and public U.S. electric utilities estimates a quadratic cost function and reports lower distribution costs and higher quality in terms of lower duration of interruptions for smaller (public) companies. However, he did not apply frontier analysis and was not able to measure individual companyefficiency.
Our review of natural monopoly theory and previous studies on electricity distribution suggests that important aspects of industry structure have not been addressed. The first issue is the relationship between technical efficiency and firm size. Insofar as economies of scale exist, larger firms are expected to demonstrate higher technical efficiency ce-teris paribus. This relationship also applies to economies of scope between outputs (e.g. customer numbers and energy supplied). Natural monopoly theory would then suggest increasing service area size until scale economies are exploited.
Inclusion of the quality dimension into technical efficiency analysis might alter the op-timal firm size. Kwoka presents the hypothesis, that smaller utilities supply higher qual-ity, as they have easier access to local market and customer specific information (such as
IWH __________________________________________________________________
IWH-Diskussionspapiere 3/2005 10
demand characteristics and special technical conditions), being important for service quality and reliability. Moreover, organizational aspects such as multiple objectives combined with observability of results and measurement problems in large firms can explain higher quality of service in small firms (Holmström, 1989 and Dixit, 1997). In addition, quality criteria are difficult to specify and to enforce (Kwoka, 2005). Also, it has been argued that closeness to customer leads to higher quality of service.6 If the above proposition holds, incorporating quality of service in electricity distribution utili-ties’ production function and technical efficiency measurement could reduce economies of scale and decrease optimal utility size relative to a pure cost analysis. The following two main hypotheses can be drawn:
(i) In a pure cost efficiency analysis, there are significant economies of scale and
relative efficiency associated with firm size (‘economies of scale’ hypothesis).
(ii) The relative cost and efficiency advantage of large firms declines when quality
of service is taken into account. (‘proximity to customers’ hypothesis).
We test these hypotheses by applying stochastic frontier analysis and distance functions to examine the technical efficiency, scale economies and scope economies of electricity distribution utilities using a pure cost and combined cost-quality analysis.
3. Methodology
Shephard (1953, 1970) proposed the distance function approach for specifying the pro-duction technology of a multi-output multi-input firm. When analysing regulated indus-tries this approach has advantages over cost or revenue functions since the behavioural assumptions of the latter approaches are likely to be violated (Estache et al., 2004).7 Distance functions can be differentiated into input and output distance functions. The former describes the maximum radial contraction of the input vector while keeping the output vector constant. The latter gives information about the maximum producible out-put given an input vector. For the purpose of this study, we use the input distance func-tion approach as outputs of electricity distribution networks are exogenously determined due to the derived nature of demand (i.e. that is distribution of a given amount of energy demanded to a given number of customers) for their output.
6 However, it should be mentioned that some degree of self-selection may exist as small firms with low quality of service may have gradually been acquired by larger and more efficient firms.
7 Estache et al. (2004) refer to a violation of standard assumptions (for example profit maximisation or efficient production) in production economics due to regulation and public ownership.
__________________________________________________________________ IWH
IWH-Diskussionspapiere 3/2005 11
The input distance function summarizing all economically relevant characteristics of the
production technology can be defined as
DI (X,Y)=max{ρ : (X/ρ) ∈L(Y)} (2)
where the input set L(Y) represents the set of all input vectors X that can produce out-puts Y. We assume this production technology satisfies the properties discussed in Färe and Primont (1995). From X∈L(Y) follows that DI (X,Y) ≥ 1, equalling unity for any company on the frontier of the input set. The input distance function has some addi-tional properties, it is linear homogenous and concave in X. The translog (transcendental logarithmic) functional form, originally introduced as a cost function model by Chris-tensen et al. (1973), has several virtues, which apply to a distance function as well (Kumbhakar and Lovell, 2000). The translog input distance function is flexible and al-lows imposition of assumptions from microeconomic theory such as homogeneity, symmetry and monotonicity.
When defined for the case of K inputs and M outputs, the translog input distance func-tion is specified as
miki
M
mkm
K
kliki
K
lkl
K
kki
K
kk
nimi
M
nmn
M
mmi
M
mm
Ii
yxxxx
yyyD
lnln2
1lnln
2
1ln
lnln2
1lnln
11111
1110
∑∑∑∑∑
∑∑∑
=====
===
+++
++=
δββ
ααα (3)
with α , β and δ being parameters to be estimated and i denoting the ith firm of the sample. To impose the properties proposed by microeconomic theory, some constraints on the unknown parameters are required. Symmetry is given if the second order coeffi-cients satisfy
MmKknmmnlkkl ,...,2,1 and ,...,2,1for and ==== ααββ . (4)
The restrictions required for homogeneity of degree + 1 in inputs are
MmKkM
mkm
K
lkl
K
kk ,...,2,1 ,0 and ,...,2,1 0, 1,
111
===== ∑∑∑===
δββ . (5)
The monotonicity constraint is satisfied if and only if
0ln
ln
11
≥+=∂∂
∑∑=
+=
M
mmkml
K
lkl
k
Iyxkx
D δββ . (6)
and
IWH __________________________________________________________________
IWH-Diskussionspapiere 3/2005 12
0ln
ln
11
≤+=∂∂
∑∑=
+=
K
kkkm
M
nnmnm
m
Ixy
Y
D δαα . (7)
Based on the above formalisation, it is possible to calculate additional economic charac-teristics of the corresponding technology. A focal point of this study is the analysis of optimal firm size. As shown above, this is related to scale elasticities and returns to scale, which can be obtained from the input distance function as shown by Färe and Primont (1995). For the multi-output case, returns to scale can be defined as follows:
yxyDRTS
I ),(
1
∇−= . (8)
where ),( xyID∇ is the vector of first order partial derivatives of the distance function with respect to outputs (Rungsuriyawiboon and O’Donnell, 2004). Values of RTS greater than one indicate increasing returns to scale, whereas values smaller than one imply decreasing returns to scale. The optimal firm size is where RTS equals unity; con-stant returns to scale are a necessary and sufficient condition for optimal scale size in electricity distribution. Nevertheless, there is a distinction between scale economies and scale efficiency. The latter is, in a parametric setting, equivalent to the ray average pro-ductivity at the observed input bundle relative to the constant returns to scale input vec-tor and differs from the scale economy value except for bundles of constant returns to scale (Morrison-Paul et al., 2004).8 We calculate the returns to scale as the negative in-verse of the scale elasticities: the (negative) scale elasticity is defined as the sum of pro-duction elasticities:
ln
ln
I
DIYmm
D
yε ∂− = −∂∑ . (9)
As Morrison-Paul et al. (2004) state, this formula is consistent with Equation 8 and con-ceptually comparable to the multi-output cost elasticities in Baumol et al. (1982).
Indeed, this measure of multi-product scale elasticities includes economies of joint pro-duction. Denny and Pinto (1978) showed that economies of joint production (scope economies) exist in translog functions if *m n mnα α α<− . To control for joint production effects, we impose the constraint *mn m nα α α= − into the scale elasticity formula and calculate a net scale elasticity measure. Subtracting net scale elasticity from the scale elasticity defined in formula 9 gives a measure of economies of scope.
Atkinson and Primont (2002) show that it is possible to calculate ‘implicit input value shares’ (Rungsuriyawiboon and O’Donnell, 2004) for any input k by
ln
ln
I IkI
k k
xD D
x xD
∂ ∂=∂ ∂
. (10)
8 See Ray (1999, 2003), Balk (2001), and Orea (2002) for more detailed discussions.
__________________________________________________________________ IWH
IWH-Diskussionspapiere 3/2005 13
Ratios of these derivatives can be interpreted as a unit-less rate of input substitution (Rungsuriyawiboon and O’Donnell, 2004).
In order to estimate firm specific technical efficiency, we apply stochastic frontier analy-sis (SFA), originally introduced by Aigner et al. (1977) and Meeusen and van den Broeck (1977). SFA is a parametric method which can also estimate an efficient or best practice frontier from a distance function model and firm specific deviations (i.e. ineffi-ciency) from the frontier in the form of technical efficiency scores (see e.g. Coelli et al. 1998). The estimated technical efficiency scores range between 1 and 0 where a score of 1 means that a firm is the most efficient in the sample and is on the efficient frontier while 0 represents the least efficiency.
Imposing the restrictions specified above, a stochastic frontier model of firm i can be modelled as follows (Coelli and Perelman 1999, Rungsuriyawiboon and O’Donnell, 2004):
( )
iuivyx
x
x
x
x
x
x
x
yyy
x
miKi
kiM
mkm
K
k
Ki
li
Ki
kiK
lkl
K
kKi
kiK
kk
nimi
M
nmn
M
mmi
M
mm
Ki
−++
++
++
=−
∑∑
∑∑∑
∑∑∑
=
−
=
−
=
−
=
−
=
===
ln)ln(2
1
)ln()ln(2
1)ln(
lnln2
1ln
ln
1
1
1
1
1
1
1
1
1
1110
δ
ββ
ααα
(11)
where α , β and δ are unknown parameters, ν is a random error term, and ui = IiDln
is the (non-negative) technical inefficiency term. The error term ν is distributed as iid N(0, σ2), for u we assume a truncated normal distribution N+(m, σ2) as suggested by Ste-venson (1980).
In order to capture systematic differences in exogenous factors between firms, we also include environmental variables to allow variation of a company’s mean efficiency, as-suming environmental factors directly affecting technical efficiency. As suggested by Battese and Coelli (1995), we assume the mean of the truncated normal distributed inef-ficiency term to be a linear function of environmental variables z (here as country dum-mies or density factors). For our model, m is specified as:
01
S
i s sis
m zλ λ=
= +∑ (12)
Following Battese and Coelli (1995), we estimate the coefficients α , β , δ and λ , the standard deviations of the error components vu σσ and , the total error variance
222vu σσσ += and the ratio of the variance of the inefficiency component to the total
error variance 22 σσγ u= . γ is bounded between zero and unity and indicates the rela-tive contribution of inefficiency to total error variance.
IWH __________________________________________________________________
IWH-Diskussionspapiere 3/2005 14
The technical efficiency scores are calculated following the procedure by Coelli et al. (1999). Technical efficiency for the i-th firm in a set of cross-sectional data is defined by:
**2
*
*
[exp( )]
1exp
2
i i i
i
ii
TE E u ε
µ σσ
µ σµσ
= −
Φ −
= − + ⋅ Φ
(13)
with
0 ,1
(1 )S
i s s i is
zµ γ δ δ γε=
= − + −
∑ (14)
and
2 2* (1 )σ γ γ σ= − (15)
4. Modelling Approach and Estimation Strategy
We now turn to the modelling of the electricity distribution technology. First, we specify the relevant input and output variables for the stochastic frontier model. Second, we specify the functional form of the models to be estimated. Concerning the variables, previous research on efficiency measurement in electricity distribution has used a vari-ety of variables and models (Jamasb and Pollitt, 2001). This may be explained partly by lack of data and partly by the nature of issues addressed (Hattori et al., 2005).
In order to estimate relative efficiency and optimal firm size when taking the quality di-mension into account, we specify two basic models. The first model (Cost-Only) fo-cuses on efficiency only and consists of one input variable and three output variables. A single cost input is used to represent total expenditures (TOTEX) or total cash cost in monetary terms defined as the sum of operating expenditures (OPEX) and capital ex-penditures (CAPEX). While OPEX represents operating and maintenance (O&M) costs, CAPEX represents the annual gross capital outlays of a company. Using a single mone-tary measure for inputs facilitates international comparison, as it reflects differences in relative factor prices and substitution between OPEX and CAPEX among the countries. The issues of differences in cost levels, accounting rules, currencies conversion and other input level influencing factors will be discussed later.
__________________________________________________________________ IWH
IWH-Diskussionspapiere 3/2005 15
The second model (Cost-Quality) incorporates quality of service by using the number of customer minutes lost (CML) for each firm. CML represents the continuity dimension of quality of service, it measures the average duration of outages per connected customer and is a proxy for service reliability. Following Yaisawarng and Klein (1994) and Gian-nakis et al. (2005), we treat outage duration as an undesirable input, assuming a substi-tutive relationship between total spending and duration of outages. In an input distance function model, an efficient firm can reduce CML and cost while maintaining a given level of outputs.
Electricity distribution utilities operate in a regulated environment and provide a re-quired amount of energy to a given number of customers as a joint service. The two elements of this service, electricity delivered and number of customers supplied, can be treated separately, as they (i) drive different costs, and (ii) interact with each other tech-nically. Therefore, we use two output variables in the cost-only and the cost-quality models. These variables have been identified based on the “separate marketability of components” property suggested by Neuberg (1977), that is total number of customers and number of energy units supplied measured in Gigawatt-hours (GWh). The two out-put variables also reflect the structure of a two-part tariff, i.e. a fixed charge per cus-tomer as well as a variable part dependent on consumed energy. In addition, economies of scope between customers and supplied energy have been theoretically identified based on advantages in load-management due to a lower risk of stochastic demand ef-fects (law of large numbers) and the possibility of pooling non-perfectly correlated de-mands to flatten total demand (Brunekreeft, 2003). These effects gain importance with increasing number of customers, relating economies of scope to economies of scale. A separate analysis of number of customers and energy units delivered allows the identifi-cation of economies of scale and scope.
In addition to input and output variables, environmental factors can influence the tech-nical efficiency of a firm but are beyond managerial control. We use customer density (number of customer per network kilometre) as an environmental variable to control for density advantages. A set of country dummy variables is used to capture national differ-ences such as ownership structure, regulation (antitrust rules), different objectives for utilities as well as differences in historical developments regarding size of service area and regulation regime.
Since the translog functional form requires an approximation of an underlying function to a specific point of the sample, we correct the variables by sample means. This proce-dure reduces the influence of outliers without affecting the structure of data. In addition, the first order coefficients can be interpreted as estimates of production elasticities at sample means (Coelli et al., 2003).
For the cost-only model (Model I), the outputs are energy delivered and number of cus-tomers, and the single input is total expenditures (TOTEX). Inclusion of country dum-mies as environmental variables allows us to adjust estimates of relative efficiency for
IWH __________________________________________________________________
IWH-Diskussionspapiere 3/2005 16
structural differences which might be attributed to the regulatory regime, historical in-dustry structure and results of former regulation. Moreover, we control for the differ-ences in customer density which is expected to have an effect on firm-specific technical efficiency.
( )0 1 2
2 211 22
12
ln
ln ln
1 1ln ln
2 2ln *ln
i
i i
TOTEX
energy customers
energy customers
energy customers
v u
α α α
α α
α
− =+ +
+ +
++ −
(16)
and,
denscustNethItNoSwFiUKi _0 λλλλλλλλµ +++++++= (17)
We now extend the discussion to a cost-quality model (Model II), which incorporates customer minutes lost as a second input.
( )0 1 2
2 211 22
12
21 11
1 2
ln
ln ln
1 1ln ln
2 2ln *ln
1ln( ) ln( )
2
ln( )*ln ln( )*ln
i
i i
TOTEX
energy customers
energy customers
energy customers
CML CML
TOTEX TOTEXCML CML
energy customersTOTEX TOTEX
v u
α α α
α α
α
β β
δ δ
− =+ +
+ +
+
+ +
+ +
+ −
(18)
and,
denscustNethItNoSwFiUKi _0 λλλλλλλλµ +++++++= (19)
Table 1 shows the inputs, outputs, and environmental variables used in our models.
__________________________________________________________________ IWH
IWH-Diskussionspapiere 3/2005 17
Table 1: Specification of models
Variable Model I Model II
Inputs
TOTEX √ √
CML √
Outputs
No. of customers √ √
Units of energy (GWh) √ √
Environmental Factors (z)
Country dummies √ √
Customer density √ √
5. Data and Descriptive Information
The data set used for this study consists of 505 electricity distribution utilities from eight European countries, namely Finland, Ireland, Italy, the Netherlands, Norway, Spain, Sweden and the United Kingdom. The data was collected from national regulators and utility associations for the financial year 2002. This section describes in detail how the data was harmonized and processed.
Using monetary values of input variables from an international data set bears some problems, the most relevant being comparability. As stated in Edvardsen and Førsund (2003), the range of practical alternatives for harmonizing is small. We convert the fi-nancial data to a single monetary unit, the euro, as suggested in Jamasb and Pollitt (2003). Five of eight countries in the sample have euro as their common currency. As conventional exchange rates do not fully cover country specific differences in price level and purchasing power, we adjusted the OPEX and CAPEX with the comparative price levels for 2002 using purchasing power parities (OECD, 2004). Table 2 shows descrip-tive information of the data set and the variables. Table 3 describes the variables and summary statistics of data used.
IWH __________________________________________________________________
IWH-Diskussionspapiere 3/2005 18
Table 2: Number of utilities in the sample
Country Number of utilities
United Kingdom 14
Ireland 1
Netherlands 7
Finland 100
Norway 145
Sweden 226
Italy 8 Enel departments
Spain 4
Total 505
Table 3: Variables and summary statistics
Variable Min Max Mean
No. of customers 310 5759000 136500
Energy supplied (GWh) 4280 48330000 1684856
Network length (km) 52 225299 6096
TOTEX 79140 770643600 25285020
CML 0.02 4834.68 123.04
As shown in the Table 2, the number of companies per country varies widely. For the UK, Ireland, Finland, Norway, Sweden and Spain, our sample is a near complete inven-tory count of utilities. For the Netherlands, separate financial data was not available for 2002 and we aggregated the technical and quality variables at the holding company level. Data for Italy’s Enel distribution region information was aggregated from 19 sub-departments to 8 departments. Despite the data aggregation in both Italy and the Nether-lands, our data set covers nearly the whole of the national distribution networks. The large differences between the minimum and maximum values of variables (Table 3) demands interpretation of results with care; on the other hand, it allows an unbiased identification of optimal firm size across a wider range.
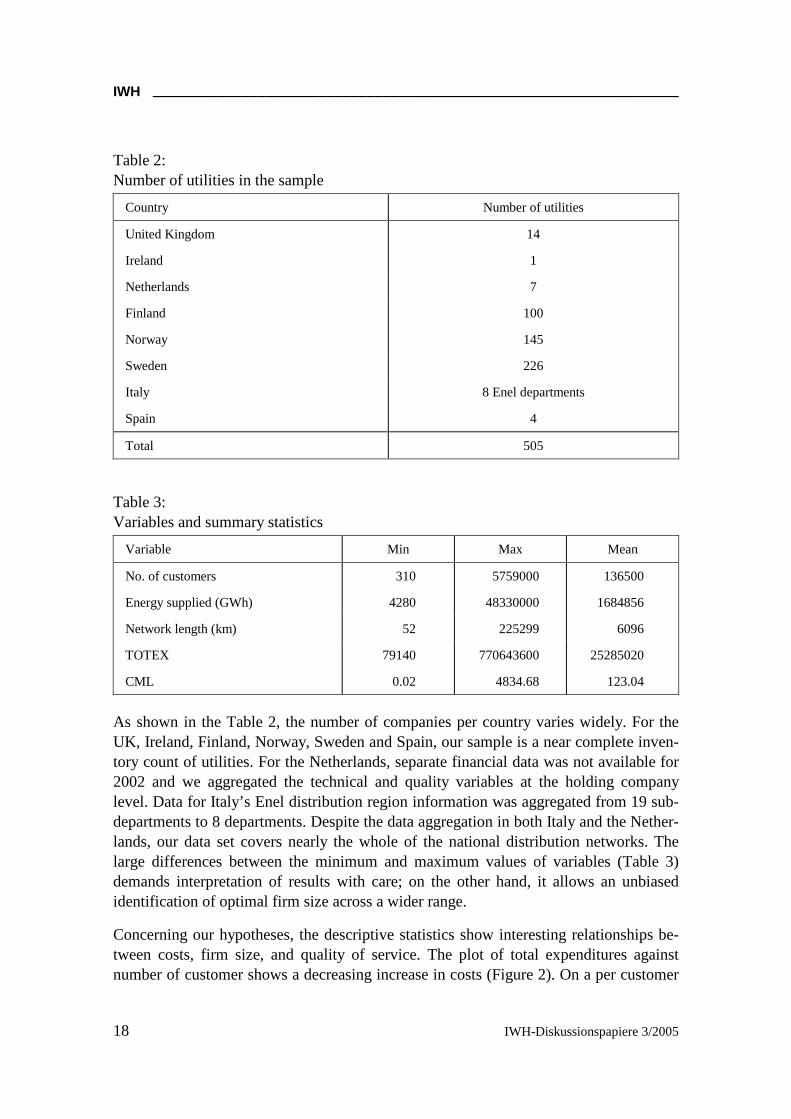
Concerning our hypotheses, the descriptive statistics show interesting relationships be-tween costs, firm size, and quality of service. The plot of total expenditures against number of customer shows a decreasing increase in costs (Figure 2). On a per customer
__________________________________________________________________ IWH
IWH-Diskussionspapiere 3/2005 19
basis, Figure 3 indicates a cost advantage for larger companies, supporting the econo-mies of scale hypothesis.
Figure 2: Total expenses and firm size
0
10
1000
100000
10000000
0 1 10 100 1000 10000
Number of customers in 1000
TO
TE
X in
100
0 €
Figure 3: Total expenses per customer and firm size
0
500
1000
0 1 10 100 1000 10000
Number of customers in 1000
TO
TE
X p
er c
ust
omer
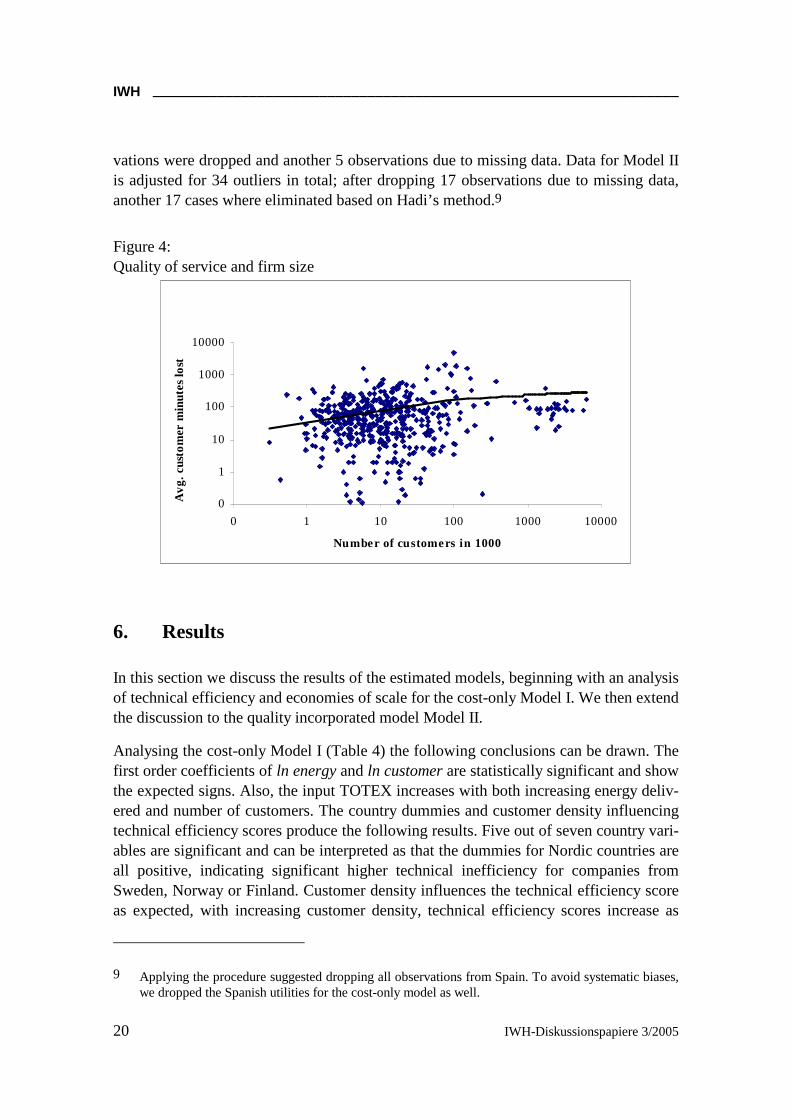
Figure 4 shows a scatter plot of the quality dimension (i.e. customer minute lost) against the number of customers as the relevant dimension of firm size. The figure shows that smaller firms exhibit a higher degree of service quality, supporting our proximity to cus-tomer hypothesis.
We controlled the data for outliers by applying the method suggested by Hadi (1992, 1994), which identifies multiple outliers in multivariate data. For the Model I, 15 obser-
IWH __________________________________________________________________
IWH-Diskussionspapiere 3/2005 20
vations were dropped and another 5 observations due to missing data. Data for Model II is adjusted for 34 outliers in total; after dropping 17 observations due to missing data, another 17 cases where eliminated based on Hadi’s method.9
Figure 4: Quality of service and firm size
0
1
10
100
1000
10000
0 1 10 100 1000 10000
Number of customers in 1000
Avg
. cu
sto
mer
min
ute
s lo
st
6. Results
In this section we discuss the results of the estimated models, beginning with an analysis of technical efficiency and economies of scale for the cost-only Model I. We then extend the discussion to the quality incorporated model Model II.
Analysing the cost-only Model I (Table 4) the following conclusions can be drawn. The first order coefficients of ln energy and ln customer are statistically significant and show the expected signs. Also, the input TOTEX increases with both increasing energy deliv-ered and number of customers. The country dummies and customer density influencing technical efficiency scores produce the following results. Five out of seven country vari-ables are significant and can be interpreted as that the dummies for Nordic countries are all positive, indicating significant higher technical inefficiency for companies from Sweden, Norway or Finland. Customer density influences the technical efficiency score as expected, with increasing customer density, technical efficiency scores increase as
9 Applying the procedure suggested dropping all observations from Spain. To avoid systematic biases, we dropped the Spanish utilities for the cost-only model as well.
__________________________________________________________________ IWH
IWH-Diskussionspapiere 3/2005 21
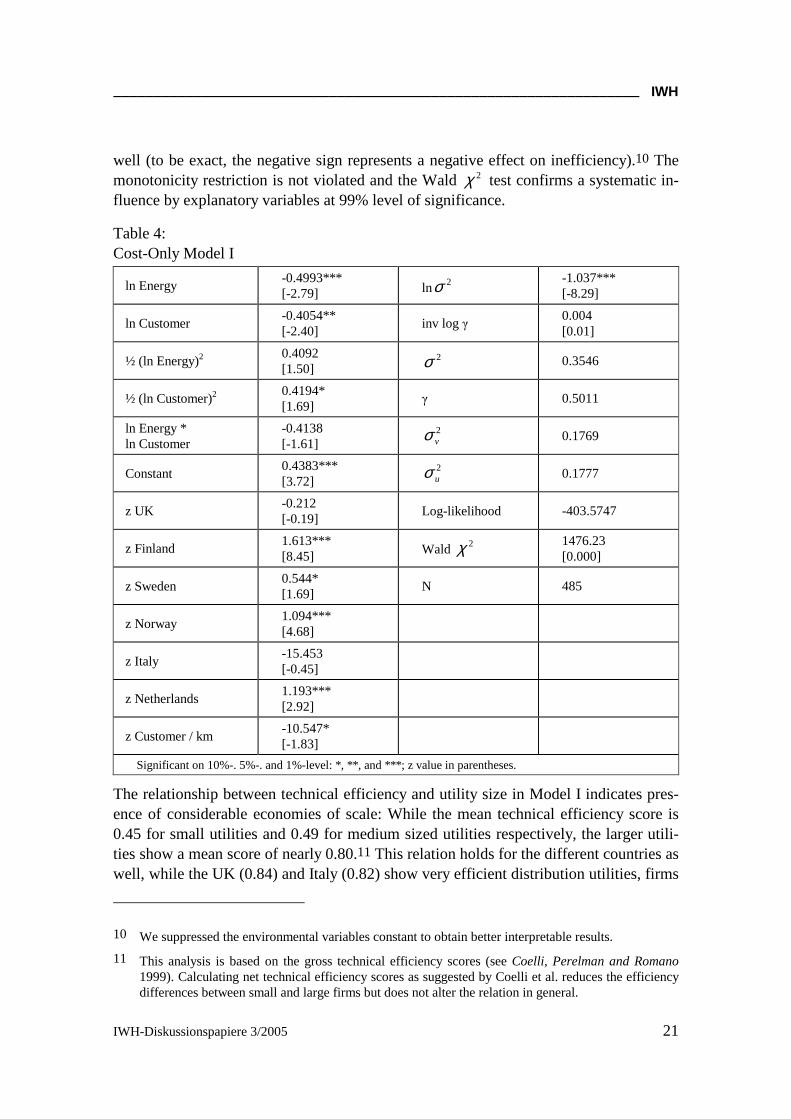
well (to be exact, the negative sign represents a negative effect on inefficiency).10 The monotonicity restriction is not violated and the Wald 2χ test confirms a systematic in-fluence by explanatory variables at 99% level of significance.
Table 4: Cost-Only Model I
ln Energy -0.4993*** [-2.79] ln 2σ
-1.037*** [-8.29]
ln Customer -0.4054** [-2.40]
inv log γ 0.004 [0.01]
½ (ln Energy)2 0.4092 [1.50]
2σ 0.3546
½ (ln Customer)2 0.4194* [1.69]
γ 0.5011
ln Energy * ln Customer
-0.4138 [-1.61]
2vσ 0.1769
Constant 0.4383*** [3.72]
2uσ 0.1777
z UK -0.212 [-0.19]
Log-likelihood -403.5747
z Finland 1.613*** [8.45] Wald 2χ
1476.23 [0.000]
z Sweden 0.544* [1.69]
N 485
z Norway 1.094*** [4.68]
z Italy -15.453 [-0.45]
z Netherlands 1.193*** [2.92]
z Customer / km -10.547* [-1.83]
Significant on 10%-. 5%-. and 1%-level: *, **, and ***; z value in parentheses.
The relationship between technical efficiency and utility size in Model I indicates pres-ence of considerable economies of scale: While the mean technical efficiency score is 0.45 for small utilities and 0.49 for medium sized utilities respectively, the larger utili-ties show a mean score of nearly 0.80.11 This relation holds for the different countries as well, while the UK (0.84) and Italy (0.82) show very efficient distribution utilities, firms
10 We suppressed the environmental variables constant to obtain better interpretable results.
11 This analysis is based on the gross technical efficiency scores (see Coelli, Perelman and Romano 1999). Calculating net technical efficiency scores as suggested by Coelli et al. reduces the efficiency differences between small and large firms but does not alter the relation in general.
IWH __________________________________________________________________
IWH-Diskussionspapiere 3/2005 22
from Nordic countries tend to be rather inefficient. An interesting and not expected re-sult are the comparatively low efficiency scores for Ireland (0.54) and the Netherlands (0.45). However, the confidence intervals of the efficiency scores are large and to some extent overlap. This indeed coincides with other research and does not alter the results in general.12
Also, returns to scale in relation to number of customers, economies of scale can be found throughout the sample. The RTS measure remains constant at about 1.1, which is the observed scale economies at the sample mean as well.13 Concerning the issue of op-timal firm size, these findings suggest that even the largest firms in the sample have not exploited all scale economies; a further increase of the joint output vector seems reason-able for the entire sample.
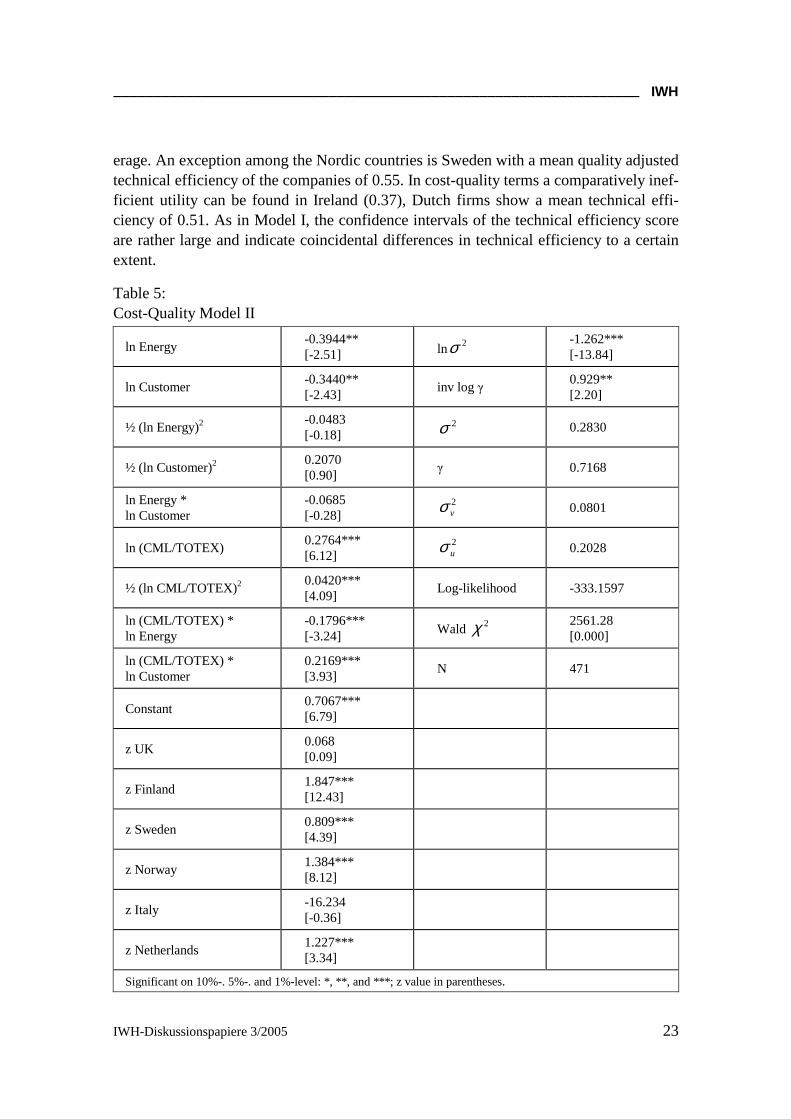
For the Model II with incorporated customer minutes lost as an additional input factor, we estimated a two input two-output translog input distance function (Table 5). The first order coefficients of ln energy, ln customer, and ln cml (normalized by TOTEX vari-able) are highly significant and show the expected signs. While total expenditures in-crease with energy delivered and number of customers, customer minutes lost decrease with cost, indicating a trade-off relation between cost and quality. Again, five out of seven environmental variables are significantly influencing firm’s technical (in) effi-ciency.14 The Nordic firms as well as those from the Netherlands are significantly less efficient. The control variable for customer density shows a highly significant negative relation between number of customers per kilometre of network length and technical in-efficiency. As in Model I, the monotonicity restriction is not violated. The Wald 2χ test confirms a systematic influence by explanatory variables at 99% level of significance.
The estimated efficiency scores clearly contradict the proximity to customer hypothesis. While small firms show the lowest mean efficiency scores (0.38), technical efficiency increases to 0.44 for medium sized and 0.81 for large firms.15 Again, this relationship holds for the countries as well. Italy (0.99) and the UK (0.82) show rather high mean ef-ficiency scores while Finish (0.22) and Norwegian (0.30) utilities are inefficient on av-
12 To estimate the confidence intervals of the technical efficiency scores, we applied the procedure sug-gested in Horrace and Schmidt (1996) and Kumbhakar and Lovell (2000). In Kumbhakar and Lovell (2000), formula (3.2.34) contains a typo. We thank William C. Horrace for bringing this to our atten-tion. The interested reader may be referred to Horrace and Schmidt (2000).
13 Applying the procedure of testing for economies of joint production (Denny and Pinto 1978) indi-cates that this result of constant scale economies throughout the sample cannot be explained by scope economies. This seems to be counter-intuitive, as a comparable RTS measure for Model 2 can clearly be described by increasing economies of scope with firm size (see below).
14 Again, we suppressed the environmental variables constant to obtain better interpretable results.
15 The net technical efficiency scores are less different between small and large firms; but again, this re-lation still holds in general.
__________________________________________________________________ IWH
IWH-Diskussionspapiere 3/2005 23
erage. An exception among the Nordic countries is Sweden with a mean quality adjusted technical efficiency of the companies of 0.55. In cost-quality terms a comparatively inef-ficient utility can be found in Ireland (0.37), Dutch firms show a mean technical effi-ciency of 0.51. As in Model I, the confidence intervals of the technical efficiency score are rather large and indicate coincidental differences in technical efficiency to a certain extent.
Table 5: Cost-Quality Model II
ln Energy -0.3944** [-2.51] ln 2σ
-1.262*** [-13.84]
ln Customer -0.3440** [-2.43]
inv log γ 0.929** [2.20]
½ (ln Energy)2 -0.0483 [-0.18]
2σ 0.2830
½ (ln Customer)2 0.2070 [0.90]
γ 0.7168
ln Energy * ln Customer
-0.0685 [-0.28]
2vσ 0.0801
ln (CML/TOTEX) 0.2764*** [6.12]
2uσ 0.2028
½ (ln CML/TOTEX)2 0.0420*** [4.09]
Log-likelihood -333.1597
ln (CML/TOTEX) * ln Energy
-0.1796*** [-3.24] Wald 2χ
2561.28 [0.000]
ln (CML/TOTEX) * ln Customer
0.2169*** [3.93]
N 471
Constant 0.7067*** [6.79]
z UK 0.068 [0.09]
z Finland 1.847*** [12.43]
z Sweden 0.809*** [4.39]
z Norway 1.384*** [8.12]
z Italy -16.234 [-0.36]
z Netherlands 1.227*** [3.34]
Significant on 10%-. 5%-. and 1%-level: *, **, and ***; z value in parentheses.
IWH __________________________________________________________________
IWH-Diskussionspapiere 3/2005 24
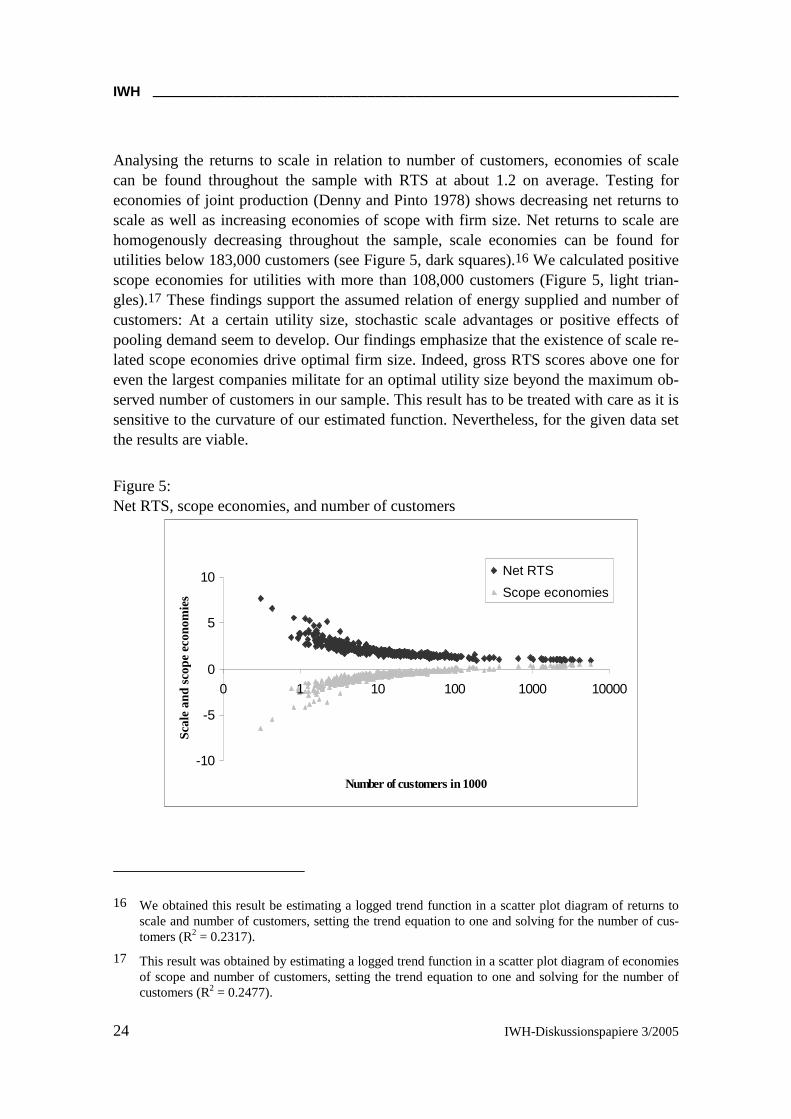
Analysing the returns to scale in relation to number of customers, economies of scale can be found throughout the sample with RTS at about 1.2 on average. Testing for economies of joint production (Denny and Pinto 1978) shows decreasing net returns to scale as well as increasing economies of scope with firm size. Net returns to scale are homogenously decreasing throughout the sample, scale economies can be found for utilities below 183,000 customers (see Figure 5, dark squares).16 We calculated positive scope economies for utilities with more than 108,000 customers (Figure 5, light trian-gles).17 These findings support the assumed relation of energy supplied and number of customers: At a certain utility size, stochastic scale advantages or positive effects of pooling demand seem to develop. Our findings emphasize that the existence of scale re-lated scope economies drive optimal firm size. Indeed, gross RTS scores above one for even the largest companies militate for an optimal utility size beyond the maximum ob-served number of customers in our sample. This result has to be treated with care as it is sensitive to the curvature of our estimated function. Nevertheless, for the given data set the results are viable.
Figure 5: Net RTS, scope economies, and number of customers
-10
-5
0
5
10
0 1 10 100 1000 10000
Number of customers in 1000
Sca
le a
nd s
cope
eco
nom
ies
Net RTS
Scope economies
16 We obtained this result be estimating a logged trend function in a scatter plot diagram of returns to scale and number of customers, setting the trend equation to one and solving for the number of cus-tomers (R2 = 0.2317).
17 This result was obtained by estimating a logged trend function in a scatter plot diagram of economies of scope and number of customers, setting the trend equation to one and solving for the number of customers (R2 = 0.2477).
__________________________________________________________________ IWH
IWH-Diskussionspapiere 3/2005 25
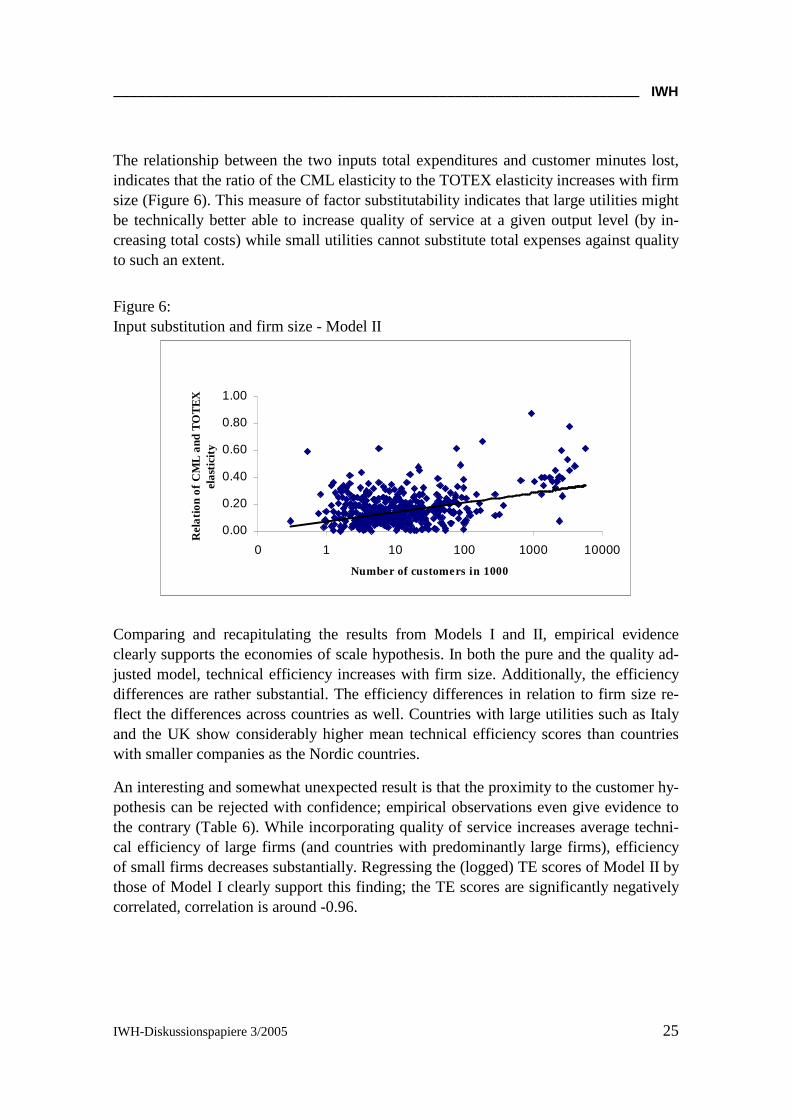
The relationship between the two inputs total expenditures and customer minutes lost, indicates that the ratio of the CML elasticity to the TOTEX elasticity increases with firm size (Figure 6). This measure of factor substitutability indicates that large utilities might be technically better able to increase quality of service at a given output level (by in-creasing total costs) while small utilities cannot substitute total expenses against quality to such an extent.
Figure 6: Input substitution and firm size - Model II
0.00
0.20
0.40
0.60
0.80
1.00
0 1 10 100 1000 10000
Number of customers in 1000
Rel
atio
n o
f C
ML
and
TO
TE
X
ela
stic
ity
Comparing and recapitulating the results from Models I and II, empirical evidence clearly supports the economies of scale hypothesis. In both the pure and the quality ad-justed model, technical efficiency increases with firm size. Additionally, the efficiency differences are rather substantial. The efficiency differences in relation to firm size re-flect the differences across countries as well. Countries with large utilities such as Italy and the UK show considerably higher mean technical efficiency scores than countries with smaller companies as the Nordic countries.
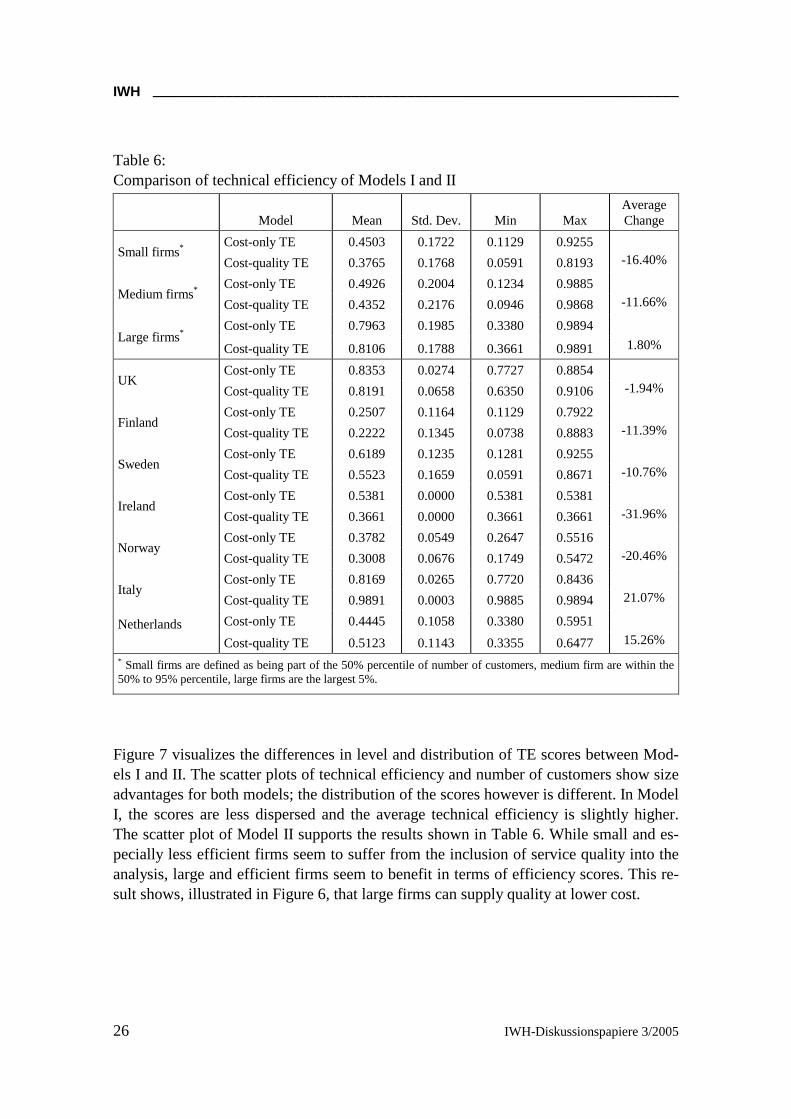
An interesting and somewhat unexpected result is that the proximity to the customer hy-pothesis can be rejected with confidence; empirical observations even give evidence to the contrary (Table 6). While incorporating quality of service increases average techni-cal efficiency of large firms (and countries with predominantly large firms), efficiency of small firms decreases substantially. Regressing the (logged) TE scores of Model II by those of Model I clearly support this finding; the TE scores are significantly negatively correlated, correlation is around -0.96.
IWH __________________________________________________________________
IWH-Diskussionspapiere 3/2005 26
Table 6: Comparison of technical efficiency of Models I and II
Model Mean Std. Dev. Min Max Average Change
Cost-only TE 0.4503 0.1722 0.1129 0.9255 Small firms*
Cost-quality TE 0.3765 0.1768 0.0591 0.8193
-16.40%
Cost-only TE 0.4926 0.2004 0.1234 0.9885 Medium firms*
Cost-quality TE 0.4352 0.2176 0.0946 0.9868
-11.66%
Cost-only TE 0.7963 0.1985 0.3380 0.9894 Large firms*
Cost-quality TE 0.8106 0.1788 0.3661 0.9891
1.80%
Cost-only TE 0.8353 0.0274 0.7727 0.8854 UK
Cost-quality TE 0.8191 0.0658 0.6350 0.9106
-1.94%
Cost-only TE 0.2507 0.1164 0.1129 0.7922 Finland
Cost-quality TE 0.2222 0.1345 0.0738 0.8883
-11.39%
Cost-only TE 0.6189 0.1235 0.1281 0.9255 Sweden
Cost-quality TE 0.5523 0.1659 0.0591 0.8671
-10.76%
Cost-only TE 0.5381 0.0000 0.5381 0.5381 Ireland
Cost-quality TE 0.3661 0.0000 0.3661 0.3661
-31.96%
Cost-only TE 0.3782 0.0549 0.2647 0.5516 Norway
Cost-quality TE 0.3008 0.0676 0.1749 0.5472
-20.46%
Cost-only TE 0.8169 0.0265 0.7720 0.8436 Italy
Cost-quality TE 0.9891 0.0003 0.9885 0.9894
21.07%
Cost-only TE 0.4445 0.1058 0.3380 0.5951 Netherlands Cost-quality TE 0.5123 0.1143 0.3355 0.6477
15.26%
* Small firms are defined as being part of the 50% percentile of number of customers, medium firm are within the 50% to 95% percentile, large firms are the largest 5%.
Figure 7 visualizes the differences in level and distribution of TE scores between Mod-els I and II. The scatter plots of technical efficiency and number of customers show size advantages for both models; the distribution of the scores however is different. In Model I, the scores are less dispersed and the average technical efficiency is slightly higher. The scatter plot of Model II supports the results shown in Table 6. While small and es-pecially less efficient firms seem to suffer from the inclusion of service quality into the analysis, large and efficient firms seem to benefit in terms of efficiency scores. This re-sult shows, illustrated in Figure 6, that large firms can supply quality at lower cost.

__________________________________________________________________ IWH
IWH-Diskussionspapiere 3/2005 27
Figure 7: Technical efficiency and firm size - Models I and II
0,00
0,20
0,40
0,60
0,80
1,00
0 1 10 100 1000 10000
Number of customers in 1000
Tec
hnic
al e
ffici
ency
small firms
medium firms large firms
7. Conclusions
Our analysis of the relationship between firm size, technical efficiency, and quality of service for European electricity distribution utilities shows evidence of significant economies of scale in electricity distribution networks. In addition, we found economies of scope between energy delivered and number of customers can be observed among larger firms.
Concerning quality of service and firm size, the results are ambiguous: our descriptive results indicate that small firms perform better in terms of quality of service. Since pro-vision of quality is related to level of costs, this finding alone is not conclusive; the cost-quality models revealed that large utilities are technically more efficient even when quality is controlled for, indicating that larger firms can supply a given level of quality of service at lower cost. Therefore, the hypothesis of customer proximity was rejected.
Regarding natural monopoly theory, the “proper” size of the natural monopoly utility does not appear to be affected when quality is incorporated in the analysis. Our analysis of the mean technical efficiency of utilities confirms the findings on firm size; we found significant differences among the countries and showed that smaller utilities and coun-tries with smaller firms (i.e. Nordic utilities) tend be significantly less efficient than large utilities from, for example, Italy or the UK. Additionally, the relationship between input elasticities (factor substitution) indicates that larger companies might, in contrast

IWH __________________________________________________________________
IWH-Diskussionspapiere 3/2005 28
to small utilities, be able to increase quality more easily by increasing total expenses. These findings contradict previous studies on optimal utility size, such as Yatchew (2000) and Salvanes and Tjøtta (1994). While they found optimal size at a rather low scale; our analysis shows unexploited scale economies throughout the sample, indicat-ing that utility size should be increased further even for large companies. These differ-ences might be explained by basically three different factors. First, our analysis is based on a significantly larger sample with a broader range of firms. Second, in contrast to those previous studies, our sample includes a variety of comparably very large firms. And third, the positive scale ecnomies throughout the sample can be explained by the re-lationship of firm size and economies of scope between number of customers and deliv-ered energy, which has not been analysed in detail before.
The policy implications from our study are threefold. First, the possibility of factor sub-stitution indicates the option of an increase in quality of service when appropriately regulated especially in countries with large utilities. This might diminish the current quality advantages of small utilities. Second, countries with a large number of small utilities should allow mergers in order to exploit potential gains. Third, in order to avoid collusion among utilities against regulatory agencies, we suggest a European harmonisa-tion of data definition and collection and regulatory accounts to facilitate international comparisons and benchmarking.
Future research on technical efficiency, firm size and quality of service in network in-dustries in general and electricity distribution in particular should address the issue of productivity development over time. This would require panel data analysis to control for cyclical effects and to overcome the shortcomings of cross-sectional analyses. An-other important aspect, not addressed in this study, is the relationship between effi-ciency, quality, and ownership structure. Publicly owned utilities may, due to differing managerial or corporate objectives, exhibit different performance in terms of efficiency from private companies. Finally, the socio-economic costs of outages as well as the cost of quality improvement need to be incorporated in the analysis in order to improve in-centive regulation schemes for quality of service.
__________________________________________________________________ IWH
IWH-Diskussionspapiere 3/2005 29
References
Ai, C. and Sappington, D. E. M (1998), The Impact of State Incentive Regulation on the U.S. Telecommunications Industry, University of Florida Discussion Paper.
Aigner, D., Lovell, C. A. K., and Schmidt, P. (1977), Formulation and Estimation of Sto-chastic Frontier Production Function Models, Journal of Econometrics, 6: 21-37.
Ajodhia, V., Petrov, K., and Scarsi, G. C. (2004). Economic Benchmarking and its Ap-plications. In: Proceedings of the 3rd International Conference on Applied Infra-structures Research, Oct. 9th (2004). Berlin, Germany.
Atkinson, S. E. and Primont, D. (2002), Stochastic Estimation of Firm Technology, Inef-ficiency, and Productivity Growth Using Shadow Cost and Distance Functions, Journal of Econometrics, 108: 203-225.
Balk, B. M. (2001), Scale Efficiency and Productivity Change, Journal of Productivity Analysis, 15: 159-183.
Battese, G. and Coelli, T. (1995), A Model for Technical Inefficiency Effects in a Sto-chastic Frontier Production Function, Empirical Economics, 20: 325-332.
Baumol, W. J. (1977), On the Proper Cost Tests for Natural Monopoly in a Multiproduct Industry, American Economic Review, 67: 809-822.
Baumol, W. J., Panzar, J. C., and Willig, R. (1982), Contestable Markets and the Theory of Industry Structure, Harcourt Brace Jovanovich, New York.
Brunekreeft, G. (2003), Regulation and Competition Policy in the Electricity Market: Economic analysis and German experience, Nomos.
CEPA (2003), Background to Work on Assessing Efficiency for the 2005 Distribution Price Control Review, scope study – final report prepared for OFGEM.
Christensen, L. R., Jorgenson, D. W., and Lau, L. J. (1973), Transcendental Logarithmic Frontiers, Review of Economics and Statistics, 55: 28-45.
Coelli, T., Rao, P. D. S., and Battese, G. (1998), An Introduction to Efficiency and Pro-ductivity Analysis, Kluwer Academic Publishers, New York.
Coelli, T., Perelman, S., and Romano, E. (1999), Accounting for Environmental Influ-ences in Stochastic Frontier Models: With Application to International Airlines, Journal of Productivity Analysis, 11: 251-273.
IWH __________________________________________________________________
IWH-Diskussionspapiere 3/2005 30
Coelli, T., Estache, A., Perelman, S., and Trujillo, L. (2003), A Primer on Efficiency Measurement for Utilities and Transport Regulators, WBI Development Studies, Washington.
Denny, M. and Pinto, C (1978), An Aggregate Model with Multi-Product Technologies, in: Melvyn, F. and McFadden, D. (eds.), Production Economics: A Dual Approach to Theory and Applications, Volume 2, North Holland, Amsterdam.
Dixit, A. (1997), Power of Incentives in Private vs. Public Organizations, American Economic Review, Papers and Proceedings, 87 (2): 378-382.
Edvardsen, D. F. and Førsund, F. R. (2003), International Benchmarking of Electricity Distribution Utilities, Resource and Energy Economics, 25: 353-371.
Estache, A., Rossi, M,. and Ruzzier, C. (2004), The Case for International Coordination of Electricity Regulation: Evidence from the Measurement of Efficiency in South America, Journal of Regulatory Economics, 25 (3): 271-295.
Färe, R. and Primont, D. (1995). Multi-Output Production and Duality: Theory and Ap-plications, Kluwer Academic Publishers, New York.
Filippini, M. (1996), Economies of Scale and Utilization in the Swiss Electric Power Distribution Industry, Applied Economics, 28: 543-550.
Filippini, M. (1998), Are Municipal Electricity Distribution Utilities Natural Monopo-lies?, Annals of Public and Cooperative Economics, 69 (2): 157-174.
Filippini, M. and Wild, J. (2001), Regional Differences in Electricity Distribution Costs and their Consequences for Yardstick Regulation of Access Prices, Energy Eco-nomics, 23 (4): 477-488.
Giannakis, D., Jamasb, T., and Pollitt, M. (2005), Benchmarking and Incentive Regula-tion of Quality of Service: An Application to the UK Electricity Distribution Utili-ties, Energy Policy, 33 (17): 2256-2271.
Giles, D. and Wyatt, N. S. (1993), Economies of Scale in the New Zealand Electricity Distribution Industry, in: Phillips, P. C. B. (ed.), Models, Methods and Applica-tions of Econometrics, Blackwell, Oxford: 370-382.
Gilsdorf, K. (1994), Vertical Integration Efficiencies and Electric Utilities: A Cost Com-plementarity Perspective, Quarterly Review of Economics and Finance, 261-282.
Gilsdorf, K. (1995), Testing for Subadditivity of Vertically Integrated Electric Utilities, Southern Economic Journal, 62 (1): 126-137.
Growitsch, C. and Wein, T. (2004), The Contestable Markets Theory: Efficient Advice for Economic Policy, in Hirschhausen, C., Beckers, T. and Mitusch, K. (eds.),
__________________________________________________________________ IWH
IWH-Diskussionspapiere 3/2005 31
Trends in Infrastructure Regulation and Financing, Chapter 3, Edward Elgar, Al-dershot.
Hadi, A. S. (1992), Identifying Multiple Outliers in Multivariate Data, Journal of the Royal Statistical Society, Series B, 54: 761-771.
Hadi, A. S. (1994), A Modification of a Method for the Detection of Outliers in Multi-variate Samples, Journal of the Royal Statistical Society, Series B, 56: 393-396.
Hattori, T., Jamasb, T., and Pollitt, M. (2005), Electricity Distribution in the UK and Japan: A Comparative Efficiency Analysis 1985-1998, Energy Journal, 26 (2): 23-47.
Holmström, B. (1989), Agency Costs and Innovation, Journal of Economic Behavior and Organisation, 12 (3): 305-327.
Horrace, W. C. and Schmidt, P. (1996), Confidence Statements for Efficiency Estimates from Stochastic Frontier Models, Journal of Productivity Analysis, 7: 257-282.
Horrace, W. C. and Schmidt, P. (2000), Multiple Comparisons with the Best, with Eco-nomic Applications, Journal of Applied Econometrics, 15: 1-26,
IPART (1999), Efficiency and Benchmarking Study of the NSW Distribution Busi-nesses, Research Paper No. 13, Sydney. Prepared by London Economics for the Independent Pricing and Regulatory Tribunal (IPART), New South Wales.
Jamasb, T. and Pollitt, M. (2001), Benchmarking and Regulation: International Electric-ity Experience, Utilities Policy, 9 (3): 107-130.
Jamasb, T. and Pollitt, M. (2003), International Benchmarking and Regulation: An Ap-plication to European Electricity Distribution Utilities, Energy Policy, 31: 1609-1622.
Korhonen, P. and Syrjänen, M. (2003), Evaluation of Cost Efficiency in Finnish Elec-tricity Distribution, Annals of Operations Research, 121 (1): 105-122.
Kridel, D. J., Sappington, D. E. M., and Weisman, D.L. (1996), The Effects of Incentive Regulation in The Telecommunications Industry: A Survey, Journal of Regulatory Economics, 9(3): 269-306.
Kwoka, J. E. (2005), The Comparative Advantage of Public Ownership: Evidence from U.S. Electric Utilities, Canadian Journal of Economics, 38 (2):622-640.
Kumbhakar, S. C. and Lovell, C. A. K. (2000), Stochastic Frontier Analysis, Cambridge University Press, Cambridge.
IWH __________________________________________________________________
IWH-Diskussionspapiere 3/2005 32
Morrison Paul, C., Nehring, R., Banker, D., and Somwaru, A. (2004), Scale Economies and Efficiency in U.S. Agriculture: Are Traditional Farms History?, Journal of Productivity Analysis, 22: 185-205.
Meeusen, W. and van den Broeck, J. (1977), Efficiency Estimation from Cobb-Douglas Production Functions with Composed Error, International Economic Review, 18 (2): 435-444.
Nerlove, M. (1963), Returns to Scale in Electricity Supply, in: Christ, C.F. (ed.), Meas-urement in Economics, Stanford University Press, Stanford.
Neuberg, L. (1977), Two Issues in Municipal Ownership of Electric Power Distribution Systems, Bell Journal of Economics, 8 (Spring): 303-323.
OECD (2004), Main Economic Indicators. Organisation for Economic Cooperation and Development, Paris.
Orea, L. (2002), Parametric Decomposition of a Generalized Malmquist Productivity Index, Journal of Productivity Analysis, 18: 5-22.
Pollitt, M. (1995), Ownership and Performance in Electric Utilities, Oxford University Press, Oxford.
Ray, S. (1999), Measuring Scale Efficiency from a Translog Production Function, Jour-nal of Productivity Analysis, 11: 183-195.
Ray, S. (2003), Measuring Scale Efficiency from the Translog Multi-Input, Multi- Out-put Distance Function, Working Paper 2003-25, University of Connecticut.
Resende, M. and Façanha, L. O. (2005), Price-Cap Regulation and Service-Quality in Telecommunications: an Empirical Study, Information Economics and Policy, 2005, 17: 1-12.
Rungsuriyawiboon, S. and O’Donnell, C. (2004), Curvature-Constrained Estimates of Technical Efficiency and Returns to Scale for U.S. Electric Utilities, CEPA Work-ing Paper Series, No. 07/2004.
Salvanes, K. G. and Tjøtta, S. (1994), Productivity Differences in Multiple Output In-dustries: An Empirical Application to Electricity Distribution, Journal of Produc-tivity Analysis, 5: 23-43.
Salvanes, K. G. and Tjøtta, S. (1998), A Test for Natural Monopoly with Application to Norwegian Electricity Distribution, Review of Industrial Organization, 13: 669-685.
__________________________________________________________________ IWH
IWH-Diskussionspapiere 3/2005 33
Sappington, D. E. M. (2002), Price Regulation and Incentives, in: Cave, M., Majumdar, S. and Vogelsang, I. (eds.), Handbook of Telecommunications Economics, North-Holland, Amsterdam.
Sharkey, W. H. (1982), The Theory of Natural Monopoly, Cambridge University Press,
Cambridge.
Shephard, R. W. (1953), Cost and Production Functions, Princeton University Press, Princeton.
Shephard, R. W. (1970), Theory of Cost and Production Functions, Princeton University Press, Princeton.
Stevenson, R. E. (1980), Likelihood Functions for Generalized Stochastic Frontier Esti-mation, Journal of Econometrics, 13 (1): 57-66.
Ter-Martirosyan, A. (2003), The Effects of Incentive Regulation on Quality of Service in Electricity Markets, Department of Economics, George Washington University, Working Paper, http://www.ios.neu.edu/iioc2003/paper/termar.pdf.
Whiteman, J. (1995), Benchmarking Developing Country Electricity Systems Using Data Envelopment Analysis, Asia-Pacific Economic Review, 1 (3): 71-78.
Wood, A. J. and Wollenberg, B. F. (1984), Power Generation, Operation and Control, John Wiley & Sons, London.
Yaisawarng, S. and Klein, J. D. (1994), The Effects of Sulfur Dioxide Controls on Pro-ductivity Change in the US Electric Power Industry, The Review of Economics and Statistics, LXXVI (3): 447-460.
Yatchew, A. (2000), Scale Economies in Electricity Distribution – A Semiparametric Analysis, Journal of Applied Econometrics, 15: 187-210.


![[Economics for managers] presentation natural monopoly](https://img.pdfslide.us/doc/110x75/55cde1abbb61eb036c8b484d/economics-for-managers-presentation-natural-monopoly.jpg)