Embed Size (px)
Citation preview


Regulated monopoly remains the dominant paradigm for electricity retailing in the United States.
Scholarly research, however, clearly refutes the idea that monopoly is the most efficient market
structure for retail electricity sales. In 13 states and the District of Columbia, the electric wires are
still regulated monopolies but customers have the right to choose their electricity retailers. The
available scholarly evidence suggests that well-designed and fully implemented retail competition
programs more closely align prices with marginal costs, can reduce prices below the level where
they would be in the absence of competition, and might promote some product differentiation. But
attaining these results depends crucially on whether the competition program is well-designed and
fully implemented. Studies of duopolistic competition between utilities that engage in both
retailing and distribution produce results qualitatively similar to the studies of states that
implemented retail competition while treating the wires as regulated monopolies. Contrary to
natural monopoly theory, no studies find that retail competition, per se, increased prices, although
several studies find that flaws in market design have led to higher prices.
Jerry Ellig, Research Professor, The George Washington University Regulatory Studies Center
This working paper is a draft of a chapter in Adam Hoffer and Todd Nesbit, Regulation and
Economic Opportunity: Blueprints for Reform (Logan, UT: Center for Growth and Opportunity,
forthcoming). The author would like to thank Adam Hoffer, Mark Febrizio, Todd Nesbit, and two
anonymous referees for helpful comments on earlier drafts, and the Center for Growth and
Opportunity for research funding.
Established in 2009, the GW Regulatory Studies Center is an academic center of the George
Washington University and its Trachtenberg School of Public Policy and Public Administration.
The Center’s mission is to improve regulatory policy through research, education, and outreach.
The Center is a leading source for applied scholarship in regulatory issues, and a training ground
for anyone who wants to understand the effects of regulation and ensure that regulatory policies
are designed in the public interest.

During the past four decades, competition has come to several industries previously
thought to be natural monopolies, including previously-unlikely candidates such as telephone
service and video. Economic studies generally show, contrary to natural monopoly theory, that
competition has produced cost reductions, price reductions, and other consumer benefits.1 Indeed,
competition in these industries has become explicit national policy.
In contrast, regulated monopoly remains the dominant paradigm for electricity retailing in
the United States. Most customers can choose their electricity suppliers in just 13 states and the
District of Columbia. These jurisdictions account for about one-third of the nation’s power production and consumption.2 Even in these states, electric distribution wires remain regulated
monopolies. Direct competition between electric utilities that each own overlapping networks of
distribution wires is quite rare. Retail competition – whether or not accompanied by competition
in distribution -- remains a controversial concept.
This chapter seeks to advance the policy discussion on electric competition by comparing
the results of monopoly and competition in retail electricity sales. It reviews empirical research on
two different models for achieving retail competition: competition between electricity retailers to
serve customers who have access to a regulated monopoly wires network, and duopolistic
competition between electric utilities with overlapping wires networks. Under both models,
competition is associated with substantial price reductions, cost reductions, and some degree of
innovative product differentiation.
Policymakers’ interest in retail electric competition tends to increase when new
technologies push the cost of power from new plants below the average cost of power from old
plants.3 In recent years the U.S. has seen significant reductions in the cost of gas-fired generation
(largely due to fracking) and renewable sources. 4 If history repeats itself, the availability of new,
1 For a sample of the relevant literature, see Robert W. Crandall, After the Breakup: U.S. Telecommunications in a
More Competitive Era (Washington, DC: Brookings, 1991); Robert W. Crandall and Jerry Hausman, “Competition in U.S. Telecommunications Services: Effects of the 1996 Legislation,” in Deregulation of Network Industries: What’s Next?, ed. Sam Peltzman and Clifford Winston (Washington, DC: AEI-Brookings Joint Center for Regulatory Studies,
1991), 73-112; Robert W. Crandall and Jerry Ellig, Economic Deregulation and Customer Choice: Lessons for the
Electric Industry (Fairfax, VA: Center for Market Processes, 1997); Thomas W. Hazlett, “Cable Television,” in Handbook of Telecommunications Economics: Technology Evolution and the Internet, ed. Sumit Majumdar et. al.
(Amsterdam and New York: Elsevier Science, 2006); Thomas W. Hazlett, The Political Spectrum (New Haven: Yale
University Press, 2017). 2 Philip R. O’Connor, “Restructuring Recharged: The Superior Performance of Competitive Electricity Markets 2008– 2016” (Hummelstown, PA: Retail Energy Supply Association, 2017): 12. 3 Severin Borenstein and James Bushnell, “The U.S. Electric Industry After 20 Years of Restructuring,” National
Bureau of Economic Research Working Paper 21113 (April 2015). 4 Regarding fracking, see Catherine Hausman and Ryan Kellogg, “Welfare and Distributional Implications of Shale
Gas,” Brookings Papers on Economic Activity (2015): 71-125. Regarding renewable energy, see Michael Giberson
and Lynne Kiesling, “Markets as Network Governance: Regulation by Networks in Electric Power Markets in Texas,” Chapter __ in this volume.

lower-cost power sources will lead to renewed interest in retail competition. Indeed, retail electric
competition was the subject of a ballot initiative in Nevada in 2018, Virginia legislators introduced
a bipartisan retail competition bill in January 2020, and retail competition has been proposed in
South Carolina’s ongoing debate over privatization of Santee Cooper, the state-owned electric
utility.5 A review of the economic evidence on retail electric competition is thus clearly timely.
The electric industry consists of four conceptually distinct functions that operated as
monopolies in most of the United States for most of the 20th century: (1) power generation, (2)
high-voltage transmission wires, (3) lower-voltage distribution wires, and (4) retail sales to
customers.6 Power generation was believed to be a natural monopoly due to economies of scale; it
was less expensive for one firm to operate a few large power plants than for many firms to operate
smaller power plants. Similarly, the wires businesses are still usually assumed to be natural
monopolies on the grounds that having one set of wires is less expensive than having duplicate
sets of wires. The retail sales function was typically bundled with the monopoly local distribution
function, as there seemed to be little reason to have competing retailers when power generation
and wires were both monopolies. In addition, all four functions were frequently operated together
by vertically integrated monopolies due to economies of scope – primarily efficiencies stemming
from the need for minute-by-minute coordination of power generation with power use.
Technological changes altered these relationships beginning in the 1980s. Economies of
scale became a questionable argument for monopoly in generation as smaller cogenerators and
gas-fired power plants became competitive with larger, utility-owned generation. Economies of
scope became a questionable argument for vertical integration as computers and communication
technology reduced coordination costs, enabling competition first in bulk (wholesale) power
markets and then in retail sales. The wires are still almost always regulated by federal and state
governments as monopolies, although there are some examples of competing local distribution
companies with competing wires (discussed in section 5 below).
5 Kelsey Misbrener, “Energy Choice Coalition Supports New Virginia Energy Reform Act,” Solar Power World,
January 9, 2020, https://www.solarpowerworldonline.com/2020/01/energy-choice-coalition-supports-new-virginia-
energy-reform-act/; “Nevada Question 3, Changes to Energy Market and Prohibit State-Sanctioned Electric-
Generation Monopolies Amendment (2018),”
https://ballotpedia.org/Nevada_Question_3,_Changes_to_Energy_Market_and_Prohibit_State-Sanctioned_Electric-
Generation_Monopolies_Amendment_(2018); Oran P. Smith and Michael T. Maloney, “Energizing Enterprise:
How Energy Market Reforms in the Wake of the V.C. Summer Debacle Can Transform South Carolina’s Economy,” Palmetto Promise Institute Report (November 2018); Jerry Ellig, “Selling Santee Cooper: Competition Should be Part of the Plan,” The Post and Courier (Charleston, SC, April 14, 2019),
https://www.postandcourier.com/opinion/commentary/selling-santee-cooper-competition-should-be-part-of-the-
plan/article_fb9d24a0-5c96-11e9-b09d-0307a94ec914.html. 6 These first two paragraphs are based largely on Giberson and Kiesling, “Markets as Network Governance.” Readers are referred to that chapter for a more extensive discussion.

The mere existence of retail competition does not necessarily refute the claim that retail
competition sacrifices economies of scale or scope. As a matter of economic theory, an industry
can be a natural monopoly and nevertheless be vulnerable to inefficient competition. Protection
from competition is required to ensure economic efficiency if the natural monopoly is
“unsustainable,” which means a peculiar set of cost and demand conditions leads to the presence
of competitors in the market even though one firm can serve the entire market at the lowest cost.7
Thus, it is possible in theory that competition in electricity retailing could lead to higher prices or
other, less favorable contract terms than customers would receive from a regulated monopoly.
On the other hand, if retail electricity sales do not involve large economies of scale or
scope, then retail competition could potentially improve economic welfare, compared to regulated
monopoly, in at least three ways: more efficient pricing, price reductions driven by cost reductions,
and product differentiation. Efficient pricing of a homogeneous commodity promotes the
allocative efficiency described in textbook models of competition. But since real-world
competition is a rivalrous process of experimentation and discovery, competition can also generate
productive efficiency -- reductions in cost, improvements in productivity, and increased innovation
that lead to price reductions and product differentiation.8
More efficient pricing. Traditional public utility regulation tends to set prices equal to
average costs, and it may also permit the utility to earn some monopoly profits. Prices that reflect
marginal costs promote economic efficiency and enhance overall welfare.9 Competition should be
expected to eliminate monopoly profits and generate electricity prices that more closely reflect
marginal costs – primarily the price of natural gas – instead of the utility’s average costs.10 True
marginal cost retail prices would vary minute-by-minute as wholesale prices change, and few
customers currently see such prices even where retail competition exists.11 However, one would
expect prices in a competitive retail market to be at least somewhat more reflective of marginal
costs than prices set under rate-of-return regulation.
Of course, price increases due to spikes in marginal costs rarely seem like a benefit from
the customer’s perspective. When marginal costs in competitive markets jump, average-cost
7 William J. Baumol, John C. Panzar, and Robert D. Willig, Contestable Markets and the Theory of Industry
Structure (New York: Harcourt Brace Jovanovich, 1982), 192-208. 8 Friedrich A. Hayek, “Competition as a Discovery Procedure,” in Hayek, New Studies in Philosophy, Politics,
Economics, and the History of Ideas (London: Routledge & Kegan Paul, 1978): 179-90. On the distinction between
allocative and productive efficiency, see W. Kip Viscusi, Joseph E. Harrington, Jr., and John M. Vernon, Economics
of Regulation and Antirust, 4th ed. (Cambridge, MA: MIT Press, 2005), 79-95. 9 Borenstein and Bushnell, “The U.S. Electric Industry,” 10. 10 Jay Zarnikau and Doug Whitworth, “Has Electricity Utility Restructuring Led to Lower Electricity Prices for Residential Consumers in Texas?,” Energy Policy 34:15 (2006): 2199-2200. 11 Lynne Kiesling, “Incumbent Vertical Market Power, Experimentation, and Institutional Design in the
Deregulating Electricity Industry,” The Independent Review 19:2 (Fall 2014): 239-64, describes experimental
programs that show consumers value and respond to real-time price signals when they have access to technology
(smart meters) that enables them to pre-program their responses.

pricing under monopoly regulation can look like a better deal for the consumer, even if it does
misallocate resources. Nevertheless, competition could improve overall welfare by driving prices
closer to marginal costs, even if competitive retail prices (based on marginal cost) sometimes
exceed regulated monopoly prices (based on average cost).
Price reductions. Inefficiencies created by public utility regulation are well-known in the
economics literature. Rate-of-return regulation can increase the regulated firm’s costs by promoting an inefficient substitution of capital for labor.12 On the other hand, utility regulation
may diminish the firm’s incentive to invest if the regulator cannot credibly commit that it will not expropriate the value of the firm’s investments after they are made.13 Utility regulation can reduce
the firm’s incentive to cut costs or innovate more generally, because the firm’s rates get adjusted
to eliminate the profits from innovation.14 In addition, the protection of a utility from competition
can also diminish its incentive to control costs or innovate because it does not have to fear losing
business to competitors.15 If these inefficiencies are sufficiently large, the introduction of
competition can drive reductions in costs, improvements in productivity, and increased service
innovation.
Product differentiation. If customers value differentiated electricity products, then
competition creates the opportunity for diverse electricity providers to provide additional features,
services, or quality attributes. Competition is the process that allows different retailers to offer
additional features or services in order to discover which ones have enough value to customers to
justify their costs.
Joskow notes several ways retailers might add value, such as less expensive metering,
billing, or customer service; procuring power at lower cost; installation of more sophisticated
metering and control technology; offering products that let customers hedge risks; green power;
and products, applications, and services “behind the meter.” He also argues that many value-added
functions retailers provide in other industries – such as more convenient locations, more
convenient delivery options, maintaining inventories, offering complementary products, point-of-
sale service, post-sale service and/or returns, providing information about the product, or
negotiating quantity discounts with manufacturers – are not very relevant in electricity. He
12 Harvey Averch and Leland L. Johnson, “Behavior of the Firm Under Regulatory Constraint,” American Economic
Review 52 (December 1962): 1052-69. 13 Graeme Guthrie, “Regulating Infrastructure: The Impact on Risk and Investment,” Journal of Economic
Literature 44:4 (Dec. 2006): 925-72. 14 M. E. Beesley and S.C. Littlechild, “The Regulation of Privatized Monopolies in the United Kingdom,” Rand
Journal of Economics 20:3 (1989): 454-72; Mark W. Frank, “An Empirical Analysis of Electricity Regulation on Technical Change in Texas,” Review of Industrial Organization 22 (2003): 313-31; Israel Kirzner, “The Perils of Regulation: A Market Process Approach,” in Discovery and the Capitalist Process. Chicago: University of Chicago
Press. 15 Harvey Leibenstein, “Allocative Efficiency versus ‘X-efficiency,’” American Economic Review 56 (1966): 392-
413; Rodney Stevenson, “X-Inefficiency and Interfirm Rivalry: Evidence from the Electric Utility Industry,” Land
Economics 58:1 (1982): 52-66.

recommends that retailers should be allowed to compete but doubts that differentiated services will
be attractive for many smaller customers.16
Littlechild offers a more sanguine view of the potential for product differentiation, noting
that the experience in the Untied Kingdom and elsewhere suggests that consumers value fixed-
price contracts, smoothed payment plans, and bundling of electricity and gas. 17 Choice
experiments conducted by Goett, Hudson, and Train provide additional insight on the potential for
product differentiation in electricity retailing. They find that noticeable percentages of small and
medium commercial and industrial customers express a positive willingness to pay more for
service from a company they are familiar with, a company with a local office, electricity generated
from renewable sources, a choice of payment options, customized billing, a web site with usage
information, a real person answering customer service calls instead of a voice response system,
bundling with other products such as other fuels or warranties, or a company that earmarks funds
for local economic development or local charities. Signup bonuses are generally viewed
negatively. The majority of customers regard variable rates and one-, two- or three-year contracts
negatively, but a sizeable minority value these kinds of arrangements.18
Whether competition in retail electricity supply enhances or diminishes economic welfare
is ultimately an empirical question. Studies of formerly monopolized or cartelized network
industries that were restructured to introduce competition typically find that competition leads to
more efficient pricing, and it also generates innovative cost reductions, productivity gains, and
nonprice competition.19 Thus, there is ample reason to consider whether retail electric competition
has produced some of the same kinds of benefits.
Retail electric competition became a subject of significant debate in Washington, DC, and state
capitals during the 1990s. All states that implemented some form of retail competition at the state
level continued to treat the wires used for long-distance transmission and local distribution as
16 Paul L. Joskow, "Why Do We Need Electricity Retailers? Or Can You Get It Cheaper Wholesale?” Working Paper, Harvard Electricity Policy Group, 2000. 17 Stephen C. Littlechild, "Wholesale Spot Price Pass-Through," Journal of Regulatory Economics 23:1 (2003): 71. 18 Andrew A. Goett, Kathleen Hudson, and Kenneth E. Train, “Customers’ Choice Among Retail Energy Suppliers: The Willingness-to-Pay for Service Attributes,” The Energy Journal 21:4 (2000): 1-28. 19 Crandall, After the Breakup; Crandall and Ellig, Economic Deregulation; Crandall and Hausman, “Competition in U.S. Telecommunications”; Hazlett, The Political Spectrum; Jerry Ellig, “Railroad Deregulation and Consumer Welfare,” Journal of Regulatory Economics 21:2 (2002): 143-67; Clifford Winston, “U.S. Industry Adjustment to Economic Deregulation,” Journal of Economic Perspectives 12 (1998): 89-110; 1993. Clifford Winston, “Economic
Deregulation: Days of Reckoning for Microeconomists,” Journal of Economic Literature 31 (1993): 1263-89.
regulated monopolies. Power generation and marketing to retail customers were opened to
competition.
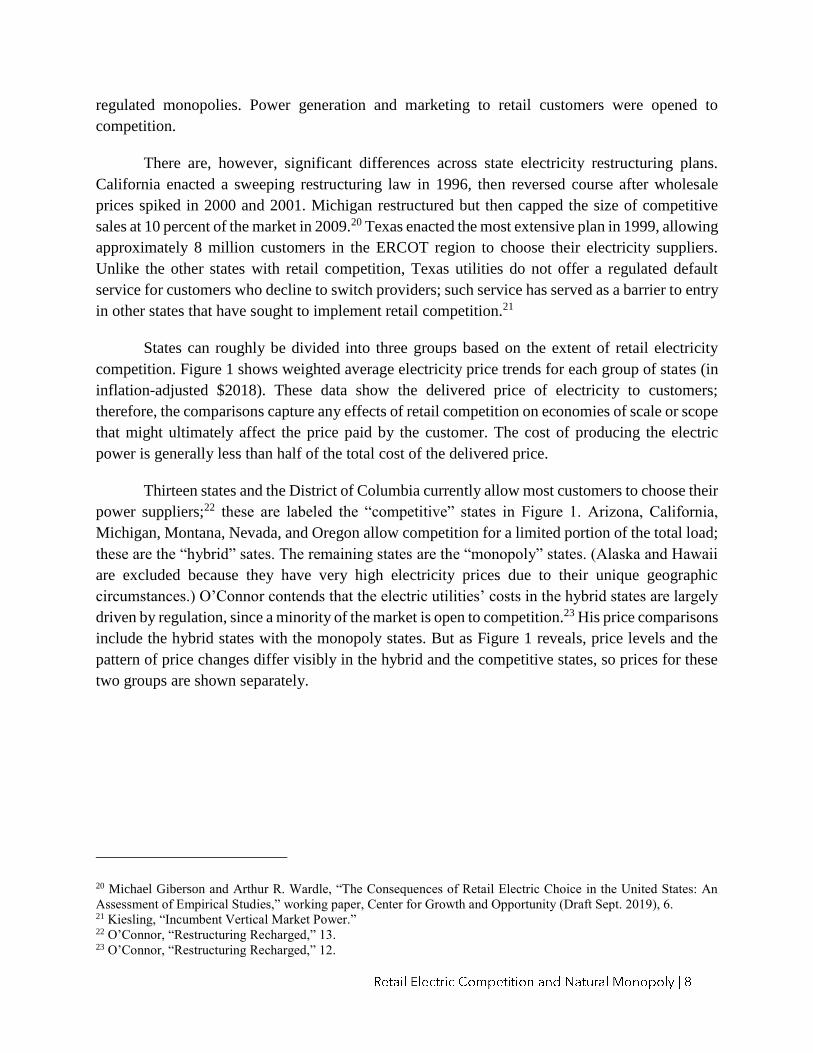
There are, however, significant differences across state electricity restructuring plans.
California enacted a sweeping restructuring law in 1996, then reversed course after wholesale
prices spiked in 2000 and 2001. Michigan restructured but then capped the size of competitive
sales at 10 percent of the market in 2009.20 Texas enacted the most extensive plan in 1999, allowing
approximately 8 million customers in the ERCOT region to choose their electricity suppliers.
Unlike the other states with retail competition, Texas utilities do not offer a regulated default
service for customers who decline to switch providers; such service has served as a barrier to entry
in other states that have sought to implement retail competition.21
States can roughly be divided into three groups based on the extent of retail electricity
competition. Figure 1 shows weighted average electricity price trends for each group of states (in
inflation-adjusted $2018). These data show the delivered price of electricity to customers;
therefore, the comparisons capture any effects of retail competition on economies of scale or scope
that might ultimately affect the price paid by the customer. The cost of producing the electric
power is generally less than half of the total cost of the delivered price.
Thirteen states and the District of Columbia currently allow most customers to choose their
power suppliers;22 these are labeled the “competitive” states in Figure 1. Arizona, California,
Michigan, Montana, Nevada, and Oregon allow competition for a limited portion of the total load;
these are the “hybrid” sates. The remaining states are the “monopoly” states. (Alaska and Hawaii are excluded because they have very high electricity prices due to their unique geographic
circumstances.) O’Connor contends that the electric utilities’ costs in the hybrid states are largely driven by regulation, since a minority of the market is open to competition.23 His price comparisons
include the hybrid states with the monopoly states. But as Figure 1 reveals, price levels and the
pattern of price changes differ visibly in the hybrid and the competitive states, so prices for these
two groups are shown separately.
20 Michael Giberson and Arthur R. Wardle, “The Consequences of Retail Electric Choice in the United States: An Assessment of Empirical Studies,” working paper, Center for Growth and Opportunity (Draft Sept. 2019), 6. 21 Kiesling, “Incumbent Vertical Market Power.” 22 O’Connor, “Restructuring Recharged,” 13. 23 O’Connor, “Restructuring Recharged,” 12.

6.00
9.00
12.00
15.00
18.001990
1993
1996
1999
2002
2005
2008
2011
2014
2017
cen
ts/k
wh
($2018)
Competitive Hybrid Monopoly
6.00
9.00
12.00
15.00
18.00
1990
1993
1996
1999
2002
2005
2008
2011
2014
2017
cen
ts/k
wh
($2018)
Competitive Hybrid Monopoly
6.00
9.00
12.00
15.00
18.00
1990
1993
1996
1999
2002
2005
2008
2011
2014
2017
cen
ts/k
wh
($2018)
Competitive Hybrid Monopoly
4.00
7.00
10.00
13.00
16.00
1990
1993
1996
1999
2002
2005
2008
2011
2014
2017
cen
ts/k
wh
($2018)
Competitive Hybrid Monopoly
Source: Author’s calculations using data from https://www.eia.gov/electricity/data.php
Figure 1 shows that electricity prices were falling in all three kinds of states during the
1990s. This occurred largely due to the lower marginal cost of new generation, primarily fueled
by natural gas. The pattern was similar across all states, since the regulated monopoly model
prevailed everywhere during this time. However, the states that eventually became the competitive
and the hybrid states had substantially higher electricity prices than the states where retail sales
remained a monopoly; indeed, the relatively high prices may have motivated the interest in
competition and may be part of the reason the competitive states experienced price reductions.
During the transitional period to competition (roughly 1998-2008 for most states), the
competitive and hybrid states implemented restructuring plans that opened retail markets to

competition. Figure 1 shows that prices in these states became more volatile than prices in the
monopoly states. Most of the empirical evidence suggests that retail competition aligned retail
prices more closely with fluctuating marginal costs – usually the price of natural gas.24 The primary
exception is a study of Connecticut, which found that retail prices tracked the utilities’ regulated rate for “standard offer service” more closely than they tracked wholesale electric prices.25
In California, prices spiked due to supply shortages and manipulation of the wholesale
power market in 2001 and 2002. These California price spikes largely account for Figure 1’s spikes
in the weighted average price of electricity in the hybrid states for those years. The competitive
states experienced price increases later, between 2002 and 2008. These increases largely reflect
the fact that the price of natural gas more than doubled over this period, from $3.32 per mmBTU
in 2002 to $8.50 per mmBTU in 2008.26
Kwoka concluded that academic studies of the early years of electricity restructuring could
not adequately separate the effects of fuel price changes, excess generation capacity, mandatory
rate reductions, price caps, stranded cost recovery mechanisms, and other transition issues to
determine what if any price effects could be attributed to restructuring.27 Most competitive states
retained rate caps until at least 2007, which tended to blunt customers’ incentive to shop for better
electricity prices.28
By 2008, however, non-utilities owned a substantial amount of generation and served a
substantial number of customers in these competitive states, and transitional issues had largely
been resolved. Eight years later, non-utility competitors served almost three-quarters of the load
that was eligible to switch in the 13 competitive states and DC, including 49 percent of residential
customers.29 As Figure 1 shows, after 2008 the price trend in competitive states diverges
significantly from the trend in the hybrid and the monopoly states. Prices in competitive states
declined steeply after 2008, whereas prices in hybrid and monopoly states generally increased.
Residential, commercial, and industrial customers all received price reductions in the competitive
states. Table 1 shows the percentage change in prices between 2008 and 2017 in all three types of
states.
24 Giberson and Wardle, “The Consequences,” 12. 25 Giberson and Wardle, “The Consequences,” 20-21. 26 Potomac Economics, “2018 State of the Market Report for the ERCOT Electricity Markets” (Fairfax, VA, 2019), 5. 27 John Kwoka, "Restructuring the US Electric Power Sector: A Review of Recent Studies," Review of Industrial
Organization 32: 3-4 (2008), 165-196. 28 Giberson and Wardle, “The Consequences,” 13-14. 29 O’Connor, “Restructuring Recharged,”13-16.

______________________________________________________________________________
______________________________________________________________________________
Competitive Hybrid Monopoly
Total -19% +8% +2%
Residential -10% +14% +5%
Commercial -22% +6% 0%
Industrial -31% -1% -2%
Source: Author’s calculations using https://www.eia.gov/electricity/data.php.
This comparison suggests that retail competition, when fully implemented, may have
generated significant price reductions. But raw price data are only suggestive. Prices in many
competitive electricity markets are lower than prior regulated prices, but that information alone
does not tell us how much of the price difference is due to competition. Prices in competitive
markets tend to be higher than prices in monopoly markets, but it would be erroneous to conclude
that competition increases prices. Prices in the competitive states were higher than prices in the
monopoly states before the former introduced competition. Numerous other factors that could
affect prices in the two sets of markets may not be the same.
An accurate assessment of the effects of competition requires a comparison of prices paid
in competitive markets to a relevant counterfactual estimate of what the prices would have been in
the absence of competition.30 Two types of scholarly studies attempt to identify a relevant
counterfactual by controlling for other factors that could increase electricity prices. Some compare
price trends in competitive and monopoly states after controlling for other factors that influence
prices. Others focus on the pattern of prices over time in a single state.
The studies comparing monopoly and competitive states generally find that competition is
associated with at least small price reductions for residential customers. Some of these studies find
30 Lynne Kiesling, “Retail Restructuring and Market Design in Texas,” in Electricity Restructuring: The Texas Story,
ed. L. Lynne Kiesling and Andrew N. Kleit (Washington, DC: AEI Press, 2009), 171-72.

no change in commercial or industrial rates, but one study finds that commercial and industrial
rates fell too.31
Single-state studies have been conducted on Illinois, Ohio, and Texas. The Illinois study
found that Illinois avoided price increases that affected neighboring states between 1997 and 2007,
and the authors argue that this result can be attributed to competition in Illinois. A study of Ohio
found that restructuring is associated with increased prices in parts of the state where utilities did
not divest their generation assets to independent companies, but competition is associated with
price reductions in the service territory of Duke Energy, which did divest its generation assets.32
(Multiple studies of Texas will be discussed in the following section.)
One study assesses the extent of product differentiation in competitive versus
noncompetitive states. Competitive states have more customers selecting green power and
dynamic pricing.33
The available scholarly evidence suggests that well-designed and fully implemented retail
competition programs more closely align prices with marginal costs, can reduce prices below the
level where they would be in the absence of competition, and might promote some product
differentiation. But attaining these results depends crucially on whether the competition program
is well-designed and fully implemented. For this reason, it is instructive to take a closer look at the
two states commonly regarded as retail competition’s most significant success and most
spectacular failure. The most notable success occurred in the state of Texas, where approximately
8 million residential, commercial, and industrial customers have the right to choose their power
supplier.34 The most spectacular failure occurred in California, where skyrocketing electricity
prices bankrupted one of the largest utilities in the state and led to the recall of Gov. Gray Davis
and election of Gov. Arnold Schwarzenegger in 2003.
Texas is widely recognized for achieving the most extensive retail electric competition in
the United States.35 Texas introduced electricity competition in the portion of the state covered by
the Electric Reliability Council of Texas (ERCOT). The transmission grid in the ERCOT region
31 Giberson and Wardle, “The Consequences,” 15-17. 32 Giberson and Wardle, “The Consequences,” 14-19. 33
Mathew J. Morey and Laurence D. Kirsch, "Retail Choice in Electricity: What Have We Learned in 20 Years?"
(Christensen Associates Energy Consulting LLC for Electric Markets Research Foundation, 2016). 34 Electric Reliability Council of Texas, “About ERCOT” (2020), http://www.ercot.com/about. 35 Borenstein and Bushnell, “The U.S. Electric Industry,” 9.
is completely under the jurisdiction of the state; hence, the state of Texas has jurisdiction to
regulate wholesale as well as retail transactions within ERCOT.36
Texas enacted its electricity restructuring bill in 1999. Senate Bill 7 allowed the
approximately 60 electric co-ops and 50 municipal utilities within ERCOT to opt in to
competition;37 most of them declined to do so. Indeed, in 2018 Lubbock Power and Light became
the first municipal utility to opt in to competition. The switch will occur once the construction of
transmission interconnections with ERCOT is completed in 2021.38
Vertically integrated utilities were separated into a transmission and distribution utility, a
power generation company, and a retail electric provider. No generator was allowed to own
generation capacity exceeding 20 percent of the load in its service territory.39
Retail competition began in 2002. For five years, each utility’s marketing affiliate was
required to offer residential and small commercial customers in its service territory a regulated
“price to beat” that was set 6 percent below 1999 rates. After three years or after the utility lost 40
percent of its customers to competitors, the utility’s marketing affiliate was permitted to offer
service at rates below the price to beat.40
The price to beat could be adjusted twice yearly for changes in fuel costs.41 This provision
was critical because natural gas accounts for approximately half of the electric power consumed
in Texas,42 and gas-fired plants are the marginal source of power about 85 percent of the time.43 If
the regulated default price was not flexible, competitors would be reluctant to enter the market,
because they would have to compete against an artificially low regulated price when the cost of
gas is high. An inflexible regulated retail price also could have created financial stress or even
bankruptcy for the incumbent utilities as wholesale prices fluctuated.44
Substantial new generation entered the market in the years prior to competition. Between
1995 and 2000, 5,700 megawatts of new power plant capacity were built. Most of these plants
36 For a more detailed description of ERCOT, see Giberson and Kiesling, “Markets as Networks;” David Spence and
Darren Bush, “Why Does ERCOT Have Only One Regulator?,” in in Electricity Restructuring: The Texas Story, ed.
L. Lynne Kiesling and Andrew N. Kleit (Washington, DC: AEI Press, 2009), 9-21.. 37 Jay Zarnikau, “A Review of Efforts to Restructure Texas’ Electricity Market,” Energy Policy 33 (2005): 15. 38 Lubbock Power and Light, “The ERCOT Solution” (2020), http://lpandl.com/ercot/. 39 Kiesling, “Incumbent Vertical Market Power,” 156-57. 40 Pat Wood III and Gürcan Gülen, “Laying the Groundwork for Power Competition in Texas,” in Electricity
Restructuring: The Texas Story, ed. L. Lynne Kiesling and Andrew N. Kleit (Washington, DC: AEI Press, 2009), 30. 41 Kiesling, “Retail Restructuring,”166. 42 Public Utility Commission of Texas (PUCT), “Scope of Competition in Electric Markets in Texas,” Report to the 85th Texas Legislature (2017), 15. 43 Zarnikau and Whitworth, “Has Electric Utility Restructuring Led,” 2193. 44 Wood and Gülan, “Laying the Groundwork,” 30; Zarnikau, “A Review,” 20.

were built by non-utility generators. The Texas wholesale power market is based largely on
confidential, bilateral contracts rather than a centralized spot market. ERCOT does operate an
auction market for balancing energy and for ancillary services such as reserves. 45
Figure 2 compares inflation-adjusted electricity price trends in Texas and the monopoly
states between 1990 and 2017. Texas residential and commercial customers paid higher prices than
their counterparts in monopoly states during the decade when competition was being debated
(1990-1999). Prices became more volatile during the transition years, 2000-2007. Texas prices
peaked in 2008, then declined so sharply that the average price in Texas was below the price in
monopoly states after 2012.
45 Zarnikau, “A Review,” 30.

6.00
9.00
12.00
15.00
18.00
1990
1993
1996
1999
2002
2005
2008
2011
2014
2017
cen
ts/k
wh
($2018)
Monopoly Texas
6.00
9.00
12.00
15.00
18.00
1990
1993
1996
1999
2002
2005
2008
2011
2014
2017
cen
ts/k
wh
($2018)
Monopoly Texas
6.00
9.00
12.00
15.00
18.00
1990
1993
1996
1999
2002
2005
2008
2011
2014
2017
cen
ts/k
wh
($2018)
Monopoly Texas
4.00
7.00
10.00
13.00
16.00
1990
1993
1996
1999
2002
2005
2008
2011
2014
2017
cen
ts/k
wh
($2018)
Monopoly Texas
Source: Author’s calculations using data from https://www.eia.gov/electricity/data.php
Every two years, the Texas Public Utility Commission produces a report for the Texas
legislature on competition in the electric industry. Figure 3 shows that in 2018, the average price
for residential power plans in all five ERCOT distribution regions was between 10 and 24 percent
below the last regulated price. The least expensive 12-month fixed price plan offered even larger
savings.

0.00
3.00
6.00
9.00
12.00
15.00
AEP Central AEP North Oncor CenterPoint TNMP
cen
ts/k
wh
Inflation-adjusted last regulated rate (2001)
Lowest 2018 fixed price for a 12-month plan
2018 average across all plans
Data source: Public Utility Commission of Texas, “Scope of Competition in Electric Markets in Texas,” Report to the
86th Legislature (2019), 3.
The available evidence suggests that under competition, the price of electricity is more
closely linked to the price of natural gas. Figure 4 shows that wholesale electricity prices in
ERCOT’s real-time balancing market have tracked natural gas prices in most years since 2001.
Gas prices dropped substantially after 2008, largely due to fracking technology.46
46 Hausman and Kellogg, “Welfare and Distributional Implications.”

0
20
40
60
80
100
2002
2003
2004
2005
2006
2007
2008
2009
2010
2011
2012
2013
2014
2015
2016
2017
2018
Natural gas ($/MBTU) ERCOT electricity ($/MWh)
Data source: Potomac Economics, “2018 State of the Market Report for the ERCOT Electricity Markets” (2019), 5.
Competition and the fuel cost adjustments in the regulated price to beat conveyed these
changes in the marginal cost of power to customers. Raw data show that Texas retail electric prices
have generally tracked wholesale prices since 2002.47 The advent of retail electric competition in
2002 was followed by a runup in the price of natural gas in 2003 and 2004, which led to increases
in wholesale prices, the regulated price to beat, and the offers from competitive retail electricity
providers.48 As a result, Zarnikau and Whitworth concluded that residential consumers in Texas
markets open to competition paid more for electricity than consumers in Texas’ monopoly markets in 2002-2004.49 Because the price to beat was more directly linked to natural gas prices than
traditional regulated prices were, the price to beat increased faster than prices in regulated
monopoly markets between January 2002 and December 2004. Residential consumers who
switched providers paid lower rates than the price to beat, but only 18 percent had done so by
September 2004.50
In some cases, the price to beat allowed the utility to over-recover its costs; for example,
one utility was permitted a 23.4 percent increase in the price to beat because gas prices increased
23.4 percent, even though gas-fired plants accounted for only 42 percent of the company’s power
47 Giberson and Kiesling, “Markets as Networks,” Figure 4. 48 Linhong Kang and Jay Zarnikau, "Did the Expiration of Retail Price Caps Affect Prices in the Restructured Texas
Electricity Market?" Energy Policy 37:5 (2009): 1713-14. 49 Zarnikau and Whitworth, “Has Electric Utility Restructuring Led,” 2200. 50 Public Utility Commission of Texas, “Scope of Competition in Electric Markets in Texas,” Report to the 79th Texas
Legislature (2005), 60.

supply.51 This occurred because the Texas PUC recognized that the marginal cost of gas-fired
generation sets the price in a competitive market.52
A study using more recent data found that retail prices more closely reflect marginal costs
in the state’s competitive markets than in the monopoly markets. The econometric analysis covers the years 2002-2016 and examines pricing trends for customers using 1000 kwh of power per
month. The authors analyzed factors that affect prices in the five competitive regions of ERCOT
and eight noncompetitive markets: the territories served by two investor-owned utilities, three co-
ops, and three municipal utilities. In all five competitive regions, retail residential prices are
positively correlated with the wholesale price of power and utility wages. In other words, retail
prices vary with marginal costs, as one would expect in a competitive market. Retail prices are
positively correlated with wholesale electricity prices in only three of the noncompetitive markets
and positively correlated with wages in only one of the noncompetitive markets.53
Efficiency of pricing for commercial customers has also been examined. Analysis using a
sample of commercial rates gathered directly from customers, found that between 2005 and late
2009, commercial rates in competitive markets were above commercial rates in noncompetitive
markets. Between late 2009 and 2016, commercial rates in competitive markets fell below
commercial rates in noncompetitive markets by an ever-widening amount. The authors conclude
that commercial rates more closely track wholesale prices in the competitive markets, and
commercial customers in noncompetitive markets are likely cross-subsidizing other customers.54
Several empirical studies have attempted to identify the price effect of retail competition in Texas
after controlling for other factors that could influence prices. One early study found that
competition likely reduced prices for larger customers but not for residential customers.55
Competition appears to have placed a significant constraint on prices only after the
regulated price to beat was eliminated in 2007. A 2009 study found that the disappearance of the
price to beat is associated with a drop in residential electric prices of about 2.3-2.4 cents per kwh,
or roughly 19-20 percent. There are several reasons why elimination of a price cap could be
associated with lower prices. Natural gas prices peaked above 11 cents per MMbtu in 2005 and
dropped below 6 cents per MMbtu in 2006, but the price to beat did not drop as quickly as the
price of natural gas and was likely above the competitive level. Once it was eliminated, retail
51 Robert W. Michaels, “Competition in Texas Electric Markets: What Texas Did Right & What’s Left to Do,” Texas Public Policy Foundation Report (2007), 9. 52 Kiesling, “Retail Restructuring,” 158-59. 53 Peter R. Hartley, Kenneth B. Medlock III, and Olivera Jankovska, ”Electricty Reform and Retail Pricing in Texas,” Energy Economics 80 (2019), 1-11. 54 Hartley et. al, “Electricity Reform,” 10. 55 Zarnikau and Whitworth, “Has Electric Utility Restructuring Led.”

electric providers competed against each other instead of competing against the artificially high
price to beat. Alternatively, the existence of the cap may have reduced the profitability of entry
and increased uncertainty for competitive providers, thus discouraging entry and constraining
competition until the price to beat was eliminated.56
A 2019 study found evidence that competition has spurred retail cost reductions. A time
trend variable in the econometric analysis reveals that the spread between retail and wholesale
prices in competitive regions declined after the regulated price-to-beat expired in January 2007.
The regression results indicate that the spread between retail and wholesale prices in competitive
regions fell by between 0.6 cent and 2.0 cents per kwh between 2007 and 2016. By comparison,
this spread increased over time in three of the noncompetitive regions and was unchanged in four
others.57 Thus, the existence of competition is associated with a noticeable reduction in retailers’
non-energy costs over time.
The raw data in Figure 5 provide a visualization of the results of the econometric results.
At the advent of competition in 2002, retail prices in the five competitive markets on the left were
higher than retail prices in the eight noncompetitive markets on the right. By 2016, inflation-
adjusted retail prices had fallen in the competitive markets by between 1.04 cents and 1.82 cents
per kwh. During that same time period, retail prices rose in the noncompetitive markets by
between 0.23 cents and 2.07 cents per kwh. Between 2002 and 2016, wholesale prices fell by
between 0.55 cents and 1.1 cents per kwh, depending on the wholesale region. Thus, retail prices
in competitive markets fell by more than the wholesale price, at the same time retail prices were
rising in the noncompetitive markets.
56 Kang and Zarnikau, “Did the Expiration.” 57 Hartley et. al, “Electricity Reform,” 9.

0
2
4
6
8
10
12
14
AEP C
entra
l
AEP N
orth
Onc
or
Cen
terP
oint
TNM
P
SWPS
SWEP
Mag
ic V
alle
y
UpS
hur
Victo
ria
Austin
CPS
San M
arco
s
Cen
ts/k
wh
in
$2015
2002 average 2016 average
Data source: Peter R. Hartley, Kenneth B. Medlock III, and Olivera Jankovska, ”Electricty Reform and Retail Pricing
in Texas,” Energy Economics 80 (2019), Table 1.
The ability to choose among differentiated products can be a source of value to customers
in addition to competition’s effect on prices. Although retail electricity providers did not initially offer a lot of differentiated products,58 product differentiation has expanded as the market has
matured. As Table 2 shows, in the competitive regions residential customers could choose from
between 24 and 51 different suppliers offering hundreds of different products in 2018. Product
offerings include 100 percent renewable energy, time of use pricing, free electricity on weekends,
prepaid plans, and price guarantees lasting from one to 60 months.59 By 2018, 94 percent of
residential customers, 94 percent of small non-residential customers, and 98 percent of large non-
residential customers had affirmatively chosen an electricity supplier at least once.60
58 Kiesling, “Retail Restructuring,” 163; Zarnikau, “A Review,” 24. 59 Public Utility Commission of Texas (PUCT), “Scope of Competition in Electric Markets in Texas,” Report to the 86th Texas Legislature (2019), 3. 60 Electric Reliability Council of Texas, “Supplemental Information: Retail Electric Market” (2018),
http://ercot.com/content/wcm/key_documents_lists/89277/Observed_Selection_of_Electric_Providers_September_2
018.ppt.pptx.

Service Territory Residential Suppliers Number of Products
AEP Central 48 282
AEP North 24 237
CenterPoint 52 305
Oncor 50 311
TNMP 42 247
Data source: Public Utility Commission of Texas, “Scope of Competition in Electric Markets in Texas,” Report to the
86th Legislature (2019), 2.
California enacted its restructuring law in 1996. California did not fare nearly as well as Texas
during its brief experiment with retail electricity competition.
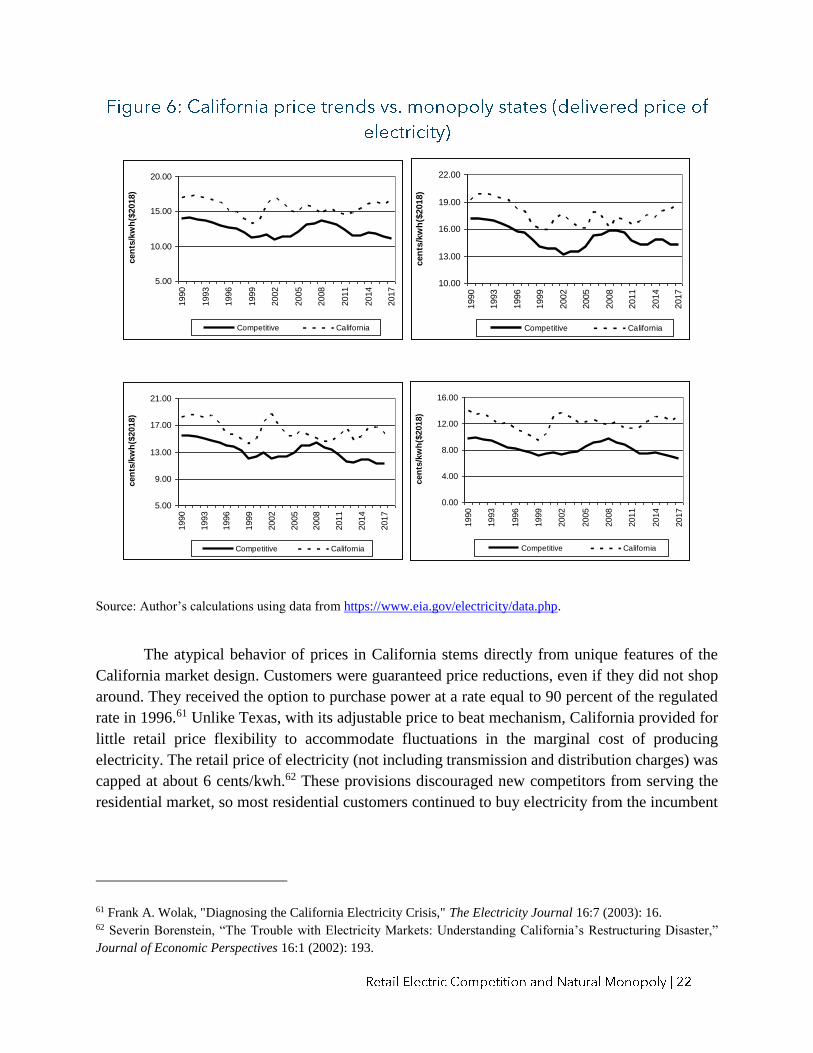
Figure 6 shows that California’s electricity prices have always been substantially above the
prices in the states where retail competition currently exists. Prices fell steadily until 1998 or 1999,
then rose modestly for a year or two. Prices spiked in 2001 and 2002, especially for commercial
and industrial customers. After 2008, California prices began to rise, whereas prices in states with
retail competition began a steady fall.
5.00
10.00
15.00
20.001990
1993
1996
1999
2002
2005
2008
2011
2014
2017
cen
ts/k
wh
($2018)
Competitive California
10.00
13.00
16.00
19.00
22.00
1990
1993
1996
1999
2002
2005
2008
2011
2014
2017
cen
ts/k
wh
($2018)
Competitive California
5.00
9.00
13.00
17.00
21.00
1990
1993
1996
1999
2002
2005
2008
2011
2014
2017
cen
ts/k
wh
($2018)
Competitive California
0.00
4.00
8.00
12.00
16.00
1990
1993
1996
1999
2002
2005
2008
2011
2014
2017
cen
ts/k
wh
($2018)
Competitive California
Source: Author’s calculations using data from https://www.eia.gov/electricity/data.php.
The atypical behavior of prices in California stems directly from unique features of the
California market design. Customers were guaranteed price reductions, even if they did not shop
around. They received the option to purchase power at a rate equal to 90 percent of the regulated
rate in 1996.61 Unlike Texas, with its adjustable price to beat mechanism, California provided for
little retail price flexibility to accommodate fluctuations in the marginal cost of producing
electricity. The retail price of electricity (not including transmission and distribution charges) was
capped at about 6 cents/kwh.62 These provisions discouraged new competitors from serving the
residential market, so most residential customers continued to buy electricity from the incumbent
61 Frank A. Wolak, "Diagnosing the California Electricity Crisis," The Electricity Journal 16:7 (2003): 16. 62 Severin Borenstein, “The Trouble with Electricity Markets: Understanding California’s Restructuring Disaster,”
Journal of Economic Perspectives 16:1 (2002): 193.

utilities at a fixed price. Competitive suppliers never served more than 12 percent of power
demand.63
The three investor-owned California utilities – Pacific Gas & Electric, Southern California
Edison, and San Diego Gas & Electric -- were required to purchase all power in a state-mandated,
day-ahead wholesale spot market. They retained no right to buy power under long-term contracts
from generation facilities that they divested. The combination of inflexible retail prices and
fluctuating wholesale prices left the utilities exposed to substantial financial risk, which they did
not hedge.64 The wholesale market commenced operation on April 1, 1998.65
Generators selling in the wholesale market learned that higher bids would not lead to a
significant reduction in the quantity sold. The capped retail prices did not signal to consumers
when power became more scarce. Since utilities were obligated to satisfy consumer demand at the
fixed retail price, they had to procure sufficient power regardless of the wholesale price. The
absence of demand response allowed generators to exercise market power by withholding supply
and bidding high prices.
Unique features of California’s electricity supply situation also made it easier for
generators to exercise market power in 2000 and 2001. Just 672 MW of new power plants were
built during 1995-2000 in the runup to competition. California is heavily dependent on power
imports from neighboring states, and hydroelectric power accounted for 20-25 percent of the total
supply. Due to a dryer than normal year, hydroelectric imports in 2000 were 47 percent below their
level in 1999.66 With less supply available on the market, individual generators had greater ability
to influence prices by withholding supply.
Price spikes and shortages were the inevitable result. California experienced rolling
blackouts in January, March, and May 2001.67 One major utility, Pacific Gas & Electric, declared
bankruptcy in March 2001. Rates of other California utilities were increased in order to prevent
additional bankruptcies.
The state sought to prevent further wholesale price spikes by signing $45 billion worth of
long-term contracts to purchase electricity in 2001.68 “By mid-summer 2001, spot electricity prices
were back to pre-crisis levels, and the state was committed to over $40 billion worth of long-term
63 Joskow, “Why Do We Need,” 10. 64 Wolak, “Diagnosing the California Electricity Crisis,” 17-18. 65 Borenstein, “The Trouble with Electricity Markets,” 195. 66 Wolak, “Diagnosing the California Electricity Crisis,” 20-21. 67 Wolak, “Diagnosing the California Electricity Crisis,” 29. 68 Wolak, “Diagnosing the California Electricity Crisis,” 30.

electricity contracts at prices that are likely more than 50 percent above the expected future spot
prices.”69 Retail competition was also repealed.
Clearly, the failure of retail competition in California has nothing to do with any inherent
tendency of electricity markets toward natural monopoly. Rather, California chose an inherently
unstable combination of mandatory retail rate reductions, inflexible retail prices, and a requirement
that utilities buy most of their power in a volatile day-ahead spot market that was highly vulnerable
to manipulation.
Not all network industries utilize shared access to monopoly infrastructure. Railroads,
cable television, wireless, broadband, satellite communications, and even wireline telephone
involve significant competition between firms that build their own infrastructure.70 Even in
electricity, some duopolistic competition between local distribution companies that own their own
wires has existed in the United States. These duopolies engage both in retailing and in distribution,
and sometimes also in transmission and generation. Empirical research finds that costs and prices
are both substantially lower where competition exists; this result suggests that the salutary effects
of competition outweigh any lost economies of scale.
In 1966, 49 U.S. cities had direct competition between an investor-owned electric utility
and a municipal electric utility; by 1981, that number had declined to 27.71 Not surprisingly,
economists have studied these duopoly electric markets to see how competition affects prices and
service. Empirical research focuses on the municipal utilities because the data for these utilities
are available for the individual cities where competition exists. The municipal utilities’ prices are set by local officials, and they are not subject to rate-of-return regulation.72
The first extensive econometric studies were conducted by Primeaux and summarized in a
1986 book, Direct Electric Utility Competition. There are two reasons that competition could lead
to lower prices: competition could force firms to set prices closer to costs, and competitive firms
may have lower costs due to X-efficiency. Employing a sample that matched municipal utilities
that faced competition with municipal utilities in similar cities with similar sources of electricity
supply that did not face competition, Primeaux found that the marginal price of moving from the
750 kwh rate block to the 1000 kwh rate block was 19 percent lower in cities with competition.
69 Borenstein, “The Trouble with Electricity Markets,” 209. 70 Crandall and Ellig, “Economic Deregulation;” Hazlett, The Political Spectrum; Ellig, “Railroad Deregulation.” 71 Walter J. Primeaux, Jr., Direct Electric Utility Competition (New York: Praeger 1986), 19, 188. 72 Walter J. Primeaux, Jr., “Estimate of the Price Effect of Competition: The Case of Electricity,” Resources and
Energy 7 (1985), 327-30.

Average revenue per kwh, a proxy for the average electric rate, is 33 percent lower where
competition exists.73
Primeaux also found that competition is associated with a reduction in average costs of 11
percent at the mean value of average cost.74 The overall effect of competition on costs varies with
the size of the firm, because competition sacrifices some economies of scale. The increased costs
due to lost economies of scale exceed the decreased costs due to X-efficiency at annual sales above
222 million kwh. At the time of the study, 92 percent of publicly owned systems and 60 percent
of investor-owned systems had annual sales below 100 million kwh.75 There was no difference in
capacity utilization in monopoly and duopoly markets.76
The size of the cost reduction suggests that lower costs account for a significant portion,
but not all, of the price reduction associated with competition. It appears that competitive rivalry
also pushes prices closer to costs. Duopoly firms changed their prices more frequently than
monopoly firms, which implies a greater degree of rivalry.77
If natural monopoly exists anywhere in electricity, it is likely in transmission and
distribution.78 Using data from 1961-1976, Nelson and Primeaux estimated a cost function for
transmission and distribution that controls for whether a utility faces direct competition. They find
that the average cost curve for transmission and distribution is likely U-shaped, which suggests
that larger, monopolized transmission and distribution utilities have exhausted the economies of
scale.79 The analysis focused on the combined cost of transmission and distribution; it did not test
to see whether there are economies of scope from combining transmission and distribution.
Case studies revealed several examples of product differentiation in duopoly markets.
Utilities serving multiple cities addressed customer complaints more quickly in cities where they
faced competition. Competing utilities installed standby facilities so they could offer more reliable
service, cut down trees for customers, provided free poles for television antennae, and furnished
contractors with outside wiring for free.80 Other inducements offered by competitors in some cities
73 Walter J. Primeaux, Jr., “Estimate of the Price Effect of Competition: The Case of Electricity,” Resources and
Energy 7 (1985),:325-40. The marginal price result is significant at the 5 percent level, and the average revenue result
is statistically significant at the 10 percent level. 74 Walter J. Primeaux, Jr., “An Assessment of X-efficiency Gained Through Competition,” Review of Economics and
Statistics 59:1 (1977), 105-08; Walter J. Primeaux, Jr., “A Re-Examination of the Monopoly Market Structure for
Electric Utilities,” in Promoting Competition in Regulated Markets, ed. Almarin Phillips (Washington, DC:
Brookings, 1974), 175-200. 75 Primeaux, “A Re-Examination,” 195-96. 76 Primeaux, Direct Electric Utility Competition, 66-68. 77 Walter J. Primeaux, Jr., and Mark Bomball, “A Re-Examination of the Kinky Oligopoly Demand Curve,” Journal
of Political Economy 82 (1974): 851-62. 78 Kiesling, “Incumbent Vertical Market Power.” 79 Randy A. Nelson and Walter E. Primeaux, Jr., “The Effects of Competition on Transmission and Distribution Costs in the Municipal Electric Industry,” Land Economics 64:4 (1988): 338-46. 80 Primeaux, Direct Electric Utility Competition, 123, 134-39.

included free temporary service for new construction, free labor for inside wiring, appliance sales,
and appliance service.81 Companies rarely charged for connection or disconnection, and deposits
required from new customers were low.82
In a 1996 study, Kwoka identified 22 cities with multiple electric utilities where at least
some customers were permitted to switch providers as of 1989. In 12 of these cities, current
customers could switch; in the others, only new residents or new industrial customers could choose
their electric company. Kwoka’s (1996, 62-65) regression results find that companies that face
competition may have higher fixed costs (although the correlation is not statistically significant).
Companies facing competition have lower variable costs, and this relationship is statistically
significant. The net effect is that electric utilities that face competition have costs that are 16
percent lower than utilities that do not face competition.83 Direct wire-on-wire competition is also
associated with an 8.1 percent reduction in price, in addition to the effect on costs. Thus, direct
competition is associated with a 24 percent reduction in electricity prices.84
It is interesting to compare the size of the price reductions associated with direct
infrastructure competition with the price reductions associated with retail choice and open access
to the wires. Direct infrastructure competition preserves economies of scope and subjects a larger
portion of the industry to competition, but it also involves duplicative facilities. Retail choice with
open access to the wires could sacrifice economies of scope, and it leaves the wires monopolized,
but it avoids the cost of duplicating the wires.
Kwoka’s and Primeaux’s results suggest that direct infrastructure competition is associated
with price reductions of 24-33 percent. The raw data in Table 1 show that after 2008, when
competition was fully implemented, average prices in competitive states declined by 19 percent
while prices in monopoly states were rising. Kang and Zarnikau found that in Texas, residential
electric prices fell by about 19-20 percent after the price to beat was phased out.85 The Public
Utility Commission of Texas reports that average electricity prices in competitive regions of the
state in 2018 were 10-23 percent below both the last regulated price and the national average. 86
These results suggest that retail competition between companies with their own distribution wires
delivers price reductions at least as large as those produced by customer choice with monopoly
wires. Indeed, the price reductions from infrastructure competition may be even larger. Such
comparisons are, of course, only suggestive, since they involve studies conducted with different
data sets at different times that control for different factors that influence prices.
81 Primeaux, Direct Electric Utility Competition, 208. 82 Nelson and Primeaux, “The Effects of Competition,” 304. 83John Kwoka, Power Structure: Ownership, Integration, and Competition in the U.S. Electric Industry (Boston:
Kluwer Academic Publishers, 1996), 62-65. 84 John Kwoka, Power Structure, 91-92. 85 Kang and Zarnikau, “Did the Expiration.” 86 PUCT, “Scope of Competition” (2019), 3.

Scholarly research on retail competition suggests that competition can produce a more
efficient retail price structure, reduce retail price levels, and promote the introduction of value-
added services. The research also shows, however, that retail reform can be a quite complex
undertaking, with results that vary greatly depending on how the rules and institutions governing
the retail market are established.
The most common type of reform leaves transmission and distribution wires as regulated
monopolies and implements competition in the retailing function. In general, policymakers who
seek to introduce or expand this type of retail electric competition would do well to follow the
Texas model as described above and in Chapter __ of this volume. A key feature that allowed retail
competition to flourish in Texas, even for residential customers, was the elimination of a standby
regulated service offering from the incumbent electric utilities. The “price to beat” mechanism was temporary and adjusted to reflect changes in the marginal cost of generation. Competition
intensified greatly, and consumers reaped greater benefits, after the price to beat mechanism
expired.
California also offers two important lessons for electricity market reform. First, it is clear
that requiring a utility to offer a regulated standby rate creates a substantial barrier to entry on the
retail level – especially if the regulated rate gives customers who do not shop a guaranteed price
cut. Second, requiring utilities to buy all of their power in a spot market prone to manipulation is
a recipe for disaster. Policymakers seem to have heeded the second lesson, as no state has tried to
replicate California’s mandatory spot market requirement. However, it is not clear if the first lesson
has been learned; even the states with retail competition (other than Texas) still require the
incumbent utility to offer consumers standby service at a regulated rate. This may explain why
none of the competitive states have seen as much competition for retail customers as Texas has.
Studies of duopolistic retail competition between vertically integrated utilities suggest that
this form of competition can also be viable. However, the number of jurisdictions with duopolistic
utility competition has fallen over time, and it is not clear why. Nevertheless, the empirical research
suggests that there is no economic justification for granting exclusive monopoly territories to
electric distribution companies. States should abolish monopoly electric franchises and allow
competition to emerge if and where it is practicable.
The available scholarly evidence clearly refutes the idea that monopoly is the most efficient
market structure for retail electricity sales. Many of the studies summarized above find that
electricity prices in states that allow widespread retail choice tend to be lower than they would
have been under monopoly, once the lengthy transition period concludes. Prices more closely
reflect marginal costs, and costs themselves appear to have fallen. Moreover, at least in the state

with the most developed retail market – Texas – there is evidence of product differentiation that
may create additional value for consumers. Contrary to natural monopoly theory, no studies find
that retail competition, per se, increased prices, although several studies find that flaws in market
design have led to higher prices. Aside from California, whose experience was covered in depth
above, the most common design flaw involves failure to sufficiently “quarantine” the remaining
utility monopoly so it cannot distort the retail market.87
Studies of duopolistic competition between utilities that engage in both retailing and
distribution produce results qualitatively similar to the studies of states that implemented retail
competition while treating the wires as regulated monopolies. Econometric studies find that under
duopoly, electric utilities have lower costs and charge lower prices that seem to reflect both the
cost difference and the effects of competitive rivalry. Case studies reveal numerous ways in which
duopoly firms compete through product differentiation.
Regardless of which form retail competition takes, there is no economic justification for
monopolizing electricity retailing.
87 Kiesling, “Incumbent Vertical Market Power.”