Embed Size (px)
Citation preview

rebuilding America’s Infrastructure
Insteel IndustrIes 2007 AnnuAl report

FInAncIAl HIgHlIgHts
(In thousands, except for per share amounts) 2007 2006 2005
operating results:
Net sales $ 297,806 $ 329,507 $ 309,320 Gross profit 56,061 70,871 57,898 % of net sales 18.8% 21.5% 18.7% Earnings from continuing operations $ 24,284 $ 34,377 $ 24,499 % of net sales 8.2% 10.4% 7.9% Net earnings $ 24,162 $ 33,040 $ 25,045
per share data:
Basic: Earnings from continuing operations $ 1.34 $ 1.88 $ 1.31 Net earnings 1.33 1.80 1.34 Diluted: Earnings from continuing operations 1.33 1.86 1.29 Net earnings 1.32 1.79 1.32 Cash dividends declared 0.12 0.12 0.06
returns:
Return on capital(1) 18.2% 29.7% 21.1% Return on equity(2) 18.2% 31.3% 29.1%
Financial position:
Total assets $ 173,529 $ 166,596 $ 138,276 Total long-term debt — — 11,860 Shareholders’ equity 143,850 122,438 97,036
cash Flows:
Net cash provided by operating activities of continuing operations $ 17,065 $ 42,650 $ 41,830
Capital expenditures 17,013 18,959 6,302 Depreciation and amortization 6,209 5,107 5,627 Repurchase of common stock — 8,529 — Cash dividends paid 2,176 2,222 566
(1) Earnings from continuing operations/(average total long-term debt + average shareholders’ equity).(2)Earnings from continuing operations/(average shareholders’ equity).
Net Sales(in millions)
’07’06
$309.3
’05
$329.5
$297.8
0
50000
100000
150000
200000
250000
300000
350000
0.0
0.5
1.0
1.5
2.0
0
5
10
15
20
25
30
35
’07’06’05
Diluted Earnings Per Share From Continuing Operations
$1.29 $1.33
$1.86
’07’06’05
Return on Equity(2)
31.3%29.1%
18.2%

Insteel Industries is one of the nation’s largest manufacturers of steel wire reinforcing products for concrete construction applications. We manufacture and market prestressed concrete strand (“pc strand”) and welded wire reinforcement, including concrete pipe reinforcement, engineered structural mesh and standard welded wire reinforcement. our products are sold primarily to manufacturers of concrete products that are used in nonresidential construction. Headquartered in Mount Airy, north carolina, we operate six manufacturing facilities located in the united states.
Welded WIre reInForceMentprefabricated reinforcement consisting of high-strength, cold-drawn or cold-rolled longitudinal and transverse wires welded together in square or rectangular grids according to customer requirements. Wire intersections are electrically resistance-welded by a computer-controlled continuous automatic welder which uses pressure and heat to fuse all wires in their proper position, creating a consistent high-quality reinforcing product.
CoNCrete PIPe reINforCemeNtEngineered made-to-order product that is used as the primary reinforcement in concrete pipe and box culverts for drainage and sewage systems, water treatment facilities and other related applications.
PLANT LOCATIONS CuSTOmeR SegmeNTS eND uSeS
Dayton, TexasMount Airy, North CarolinaWilmington, Delaware
Concrete Pipe and Precast Producers Nonresidential ConstructionResidential Construction
eNgINeered StruCtural meShEngineered made-to-order product that is used as the primary reinforcement in concrete elements or structures, frequently serving as a replacement for hot-rolled rebar.
PLANT LOCATIONS CuSTOmeR SegmeNTS eND uSeS
Dayton, TexasMount Airy, North Carolina
Precast and Prestressed ProducersRebar FabricatorsDistributors
Nonresidential Construction
StaNdard Welded WIre reINforCemeNtSecondary reinforcing product that is produced in standard styles for crack control applications in residential and light nonresidential construction, including driveways, sidewalks and a wide range of slab-on-grade applications.
PLANT LOCATIONS CuSTOmeR SegmeNTS eND uSeS
Dayton, TexasHickman, KentuckyMount Airy, North CarolinaWilmington, Delaware
Rebar FabricatorsDistributors
Nonresidential ConstructionResidential Construction
prestressed concrete strAndHigh-strength seven-wire reinforcement consisting of six cold-drawn wires that are continuously wrapped around a center wire forming a strand. the strand is heat-treated while under tension, which imparts low relaxation characteristics and increases the working range of the product, providing engineers with greater flexibility in its application and the ability to better utilize its reinforcing properties. pc strand is used to impart compression forces into prestressed concrete elements and structures, which may be either pretensioned or posttensioned. pretensioned means that the strands are tensioned to their design load and anchored at the ends of a form. After concrete has been placed and allowed to cure to sufficient strength, the load on the strand is transferred from the external anchors to the cured member, creating compression forces within the element, or “prestressing” it. posttensioned means that the strands are tensioned after the concrete has been placed and allowed to cure.
PLANT LOCATIONS CuSTOmeR SegmeNTS eND uSeS
Gallatin, TennesseeSanderson, Florida
Precast Prestress ProducersPosttension Suppliers
Nonresidential ConstructionResidential Construction

America faces a growing infrastructure crisis.Deterioration. Congestion. Reduced reliability. A projected funding gap of $1.6 trillion over the next five years.
After years of neglect, the warning signs are becoming increasingly apparent
across all sectors of our nation’s infrastructure. Nearly 30% of the bridges in the
U.S. are structurally deficient or functionally obsolete. Our interstate highway
system is reaching the end of its 50-year life cycle and will require substantial
rebuilding and maintenance. A recent study indicates that 83% of our transportation
infrastructure is incapable of meeting the country’s needs over the next 10 years.
In its most recent report card on America’s infrastructure, the American Society
of Civil Engineers gave our system an overall “D” which included 4 Cs and 10 Ds.


2
Our roads are becoming increasingly congested as the number of miles driven rose 23% from 1995
to 2005 while the length of roads increased only 2%. The average metropolitan driver spends
46 hours a year stuck in traffic which doubles for daily rush-hour commuters in large cities. The
lack of comprehensive and coordinated long-term strategies and financing solutions has left us
playing catch-up to other nations. Addressing these needs will require substantial increases in
funding at the federal, state and local level, which are likely to come from higher taxes and user
fees in addition to various forms of public/private partnerships and bond issues funded by user
fees and general tax revenues.
2

Insteel IndustrIes, Inc. and subsIdIarIes 3
How does our nation’s infrastructure strategy impact Insteel? Through the intensive use of
our concrete reinforcing products in highway and infrastructure construction…PC strand and
ESM in bridges and overpasses, concrete pipe reinforcement in road drainage systems and
ESM in concrete barrier medians. We believe the heightened interest in addressing our nation’s
infrastructure needs will ultimately yield financing solutions that represent a substantial growth
opportunity for Insteel.
Insteel IndustrIes, Inc. and subsIdIarIes 3

Insteel IndustriesA name largely unfamiliar outside of the building
materials industry. A company that is one of the
largest manufacturers of steel wire reinforcing
products for concrete construction applications. A
leader in its markets with state-of-the-art facilities
and manufacturing capabilities. A provider of
concrete reinforcing solutions ideally positioned
to capitalize on the critical infrastructure needs
of our nation.

us82—Greenville bridgeThe new Greenville Bridge on I-82 crossing the Mississippi River which incorporated Insteel’s concrete reinforcing products and was previously featured on the cover of our 2005 annual report.

6
Engineered structural meshA welded wire reinforcing product manufactured to customer specifications that frequently serves as a
replacement for hot-rolled rebar. A product produced as prefabricated sheets that offers significant
labor savings versus the time-intensive placing and tying inherent to rebar and requires less steel due
to its superior strength. A product gaining momentum in penetrating the rebar market in response to:
(1) increasing construction labor constraints and costs; and (2) improvements in welding equipment
technology that have made small batch production and quick delivery feasible. A product that can serve as
6

Insteel IndustrIes, Inc. and subsIdIarIes 7
a substitute for rebar sizes representing approximately 80% of domestic rebar consumption. A market for
Insteel that could double in volume on just a few percentage points of market share growth. A product
frequently used with PC strand to provide a comprehensive concrete reinforcing solution.
With the two new production lines that started up during 2007 in our North Carolina and Texas facilities,
each with the capacity to generate $16–$20 million of revenues annually (at current average selling prices),
we are well-positioned to capitalize on the growing acceptance of ESM as a superior reinforcing solution
for many concrete construction applications.
new esM production line at our Mount airy, nc plant
Insteel IndustrIes, Inc. and subsIdIarIes 7

Investing for the future
During 2006 and 2007, we’ve invested $36 million in our manufacturing facilities. Adding new ESM
production lines in our North Carolina and Texas plants. Upgrading the equipment and reconfiguring
the process flow of our Tennessee and Florida PC strand facilities. Adding a new standard welded wire
reinforcement line in our Delaware plant. These projects share common characteristics by providing
additional capacity to satisfy future growth in demand and facilitating substantial improvements in our
labor productivity and unit conversion costs. When fully ramped up, they should add over $70 million
of revenue-generating capacity annually (at current average selling prices) and advance our ongoing
initiatives to operate as the lowest cost producer.
0 10 20 30 40 50
0 10 20 30 40 50
$2.9 $6.3 $19.0 $17.0
2003 2004 2005 2006 2007

10
FInancIal HIgHlIgHts
Sales for 2007 decreased 9.6% to $297.8 million from $329.5 million in 2006 as an 11.4% drop-off in
shipments offset a 2.0% increase in average selling prices. Earnings from continuing operations fell to
$24.3 million ($1.33 per diluted share) from $34.4 million ($1.86 per diluted share) in the prior year due to
the reduced shipments, increasing raw material costs and higher unit conversion costs resulting from lower
production levels.
Business conditions continued to be mixed during the year, characterized by strong demand for concrete
reinforcing products that are primarily used in nonresidential construction and weak demand from customers
with significant exposure to the housing market. During the second half of the year, our sales of PC strand
to commercial posttension accounts focused on residential construction applications declined due to
the elevated level of irrationally priced import competition, primarily from China. As a result, shipments
to posttensioners, which represented 14% of our total shipments in 2006 were minimal during the second
half of 2007.
We ended the year debt-free with $8.7 million of cash on hand. Our strong balance sheet and flexible
capital structure position us to enhance value for our shareholders by investing in the growth of our core
businesses through capital expenditures and acquisitions, paying cash dividends and utilizing our share
repurchase program on an opportunistic basis.
capItal ExpEndIturE program
Capital expenditures were $17.0 million in 2007 as we continued to invest in a wide range of important
initiatives to expand revenues and drive cost improvements at our manufacturing facilities. When fully operational,
these projects have the capability of generating over $70.0 million of incremental revenues annually (at
current average selling prices) in addition to significantly reducing our unit conversion costs through higher
productivity and increased throughput.
Letter to SharehoLderS
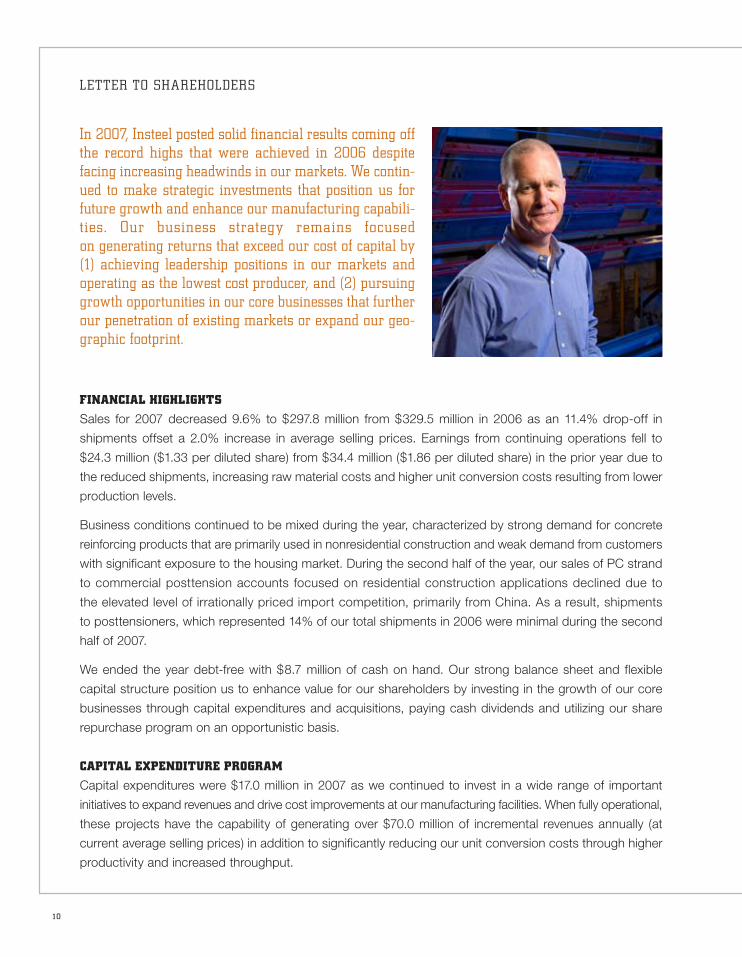
In 2007, Insteel posted solid financial results coming off the record highs that were achieved in 2006 despite facing increasing headwinds in our markets. We contin-ued to make strategic investments that position us for future growth and enhance our manufacturing capabili-t ies. our business strategy remains focused on generating returns that exceed our cost of capital by (1) achieving leadership positions in our markets and operating as the lowest cost producer, and (2) pursuing growth opportunities in our core businesses that further our penetration of existing markets or expand our geo-graphic footprint.
Insteel IndustrIes, Inc. and subsIdIarIes 11
With most of the outlays for these projects behind us, we plan on significantly scaling back capital
expenditures in 2008 as we assess the uncertainty in our markets and in the economy in general. At the
same time, our financial flexibility will allow us to capitalize on any growth opportunities that may develop.
Engineered Structural Mesh (“ESM”). We started up a new ESM production line in our North Carolina
facility during the first quarter and a second new line at our Texas plant during the fourth quarter. These
expansions position us to benefit from the growing market acceptance for ESM as a replacement for
hot-rolled rebar due to the inherent labor, cycle time and material cost advantages it offers for many concrete
reinforcing applications. With total domestic consumption of ESM representing less than 5% of the rebar
volume it could potentially replace, the product is still early in its life cycle where just a few percentage points
of market share growth translate into a substantial increase in demand. We expect each of the new
lines to generate $16.0 to $20.0 million of annual revenues (at current average selling prices) when ramped
up to capacity.
PC strand. During the first quarter, we completed the reconfiguration and expansion of our Tennessee PC
strand operation which entailed the consolidation of manufacturing processes previously performed in two
adjacent facilities together with the installation of a new production line. We also began work on the
upgrading of our Florida PC strand facility which is expected to be completed during the third quarter of
2008. These projects add a combined $30.0 million of annual revenue capacity (at current average selling
prices)—$25.0 million at the Tennessee facility and $5.0 million at the Florida plant. While the timing of these
additions may not coincide with robust market conditions, we view them as critical to extending our
leadership position in the North American market.
Standard welded wire reinforcement. During the fourth quarter, we started up a new standard welded
wire reinforcement line in our Delaware plant that adds $7.0 million of annual revenue capacity (at current
average selling prices).
lookIng aHEad
As we move into 2008, we face significant near-term challenges in the form of rising raw material costs,
PC strand import competition and the continuation of mixed market conditions.
Raw materials. Prices for hot-rolled steel wire rod, our primary raw material, are on the rise and are likely
to continue trending up until the pricing for imports into the U.S. becomes more competitive with domestic
producers. These additional costs may be difficult to recover in our markets depending upon the strength
of demand and competitive dynamics, although we are hopeful that the increased discipline that has been
evident in our markets since 2004 continues going forward.
PC strand imports. Imports of PC strand from China continue to enter the U.S. market at unrealistically
low prices reflecting the dysfunctional nature of China’s non-market economy. It is clear that Chinese
producers lack any inherent manufacturing cost advantage relative to state-of-the-art domestic producers
such as Insteel. The Chinese pursuit of the U.S. market is largely a result of distorted economics resulting

12
from the availability of low-cost financing and government subsidies that have resulted in an explosion of
capacity well in excess of China’s home market requirements. In July 2007, the Chinese government took
the first step towards leveling the competitive playing field by reducing the VAT rebate for exported PC strand
from 13% to 5%. This reduction, together with recent escalation in wire rod costs and ocean freight rates,
has made exporting to the U.S. substantially less attractive for Chinese producers, forcing them to raise
their selling prices. Although it would be premature to assume that these favorable trends will continue, we
believe the unfair trade practices of the Chinese will ultimately be resolved—either through further proactive
changes on the part of the Chinese government that allow true economics to prevail or through the filing of
trade actions on the part of U.S. strand producers should market conditions deteriorate to the point where we
can demonstrate injury. Under either scenario, Insteel will be well-positioned to capitalize through the expansion
and upgrading of our Tennessee and Florida PC strand facilities and our world-class cost structure.
Market outlook. We expect market conditions to remain mixed in 2008 with some moderation in the growth
rate for nonresidential construction from the elevated level of recent years due to the anticipated softening in
commercial construction. Other categories within nonresidential construction, however, are expected to remain
strong driven by continued growth in infrastructure-related spending and post-hurricane reconstruction in
the Gulf region. Longer term, we believe the heightened focus on addressing the critical infrastructure needs
that exist will yield creative financing solutions that favorably impact demand for our concrete reinforcing
products for an extended period.
In view of the inventory overhang of unsold homes and tightening in the credit markets, we expect the
weakness in residential construction to persist through 2009 and continue to adversely affect shipments to
customers that have greater exposure to the housing sector.
Despite these challenges, we anticipate gradually increasing returns from the substantial investments
we have made in our facilities over the past two years through reduced operating costs and additional
revenues, particularly for ESM as we further our penetration of the rebar market. In addition, we will
continue to evaluate and pursue other growth opportunities—organic as well as through acquisitions—that
strengthen our competitive position and create value for our shareholders.
We wish to thank our customers, employees and shareholders for their continued trust, confidence and
support. As we move into 2008, we are well-positioned to capitalize on the opportunities and respond to
the challenges that lie ahead.
Sincerely,
H.O. Woltz III
President and Chief Executive Officer
Contents
14 Management’s Discussion and Analysis of Financial Condition and Results of Operations
21 Management’s Report on Internal Control Over Financial Reporting
22 Report of Independent Registered Public Accounting Firm Consolidated Financial Statements
23 Report of Independent Registered Public Accounting Firm Internal Control Over Financial Reporting
24 Consolidated Statements of Operations
25 Consolidated Balance Sheets
26 Consolidated Statements of Cash Flows
28 Consolidated Statements of Shareholders’ Equity and Comprehensive Income
29 Notes to Consolidated Financial Statements
44 Stock Performance Graph
45 Financial Information by Quarter (Unaudited)
46 Selected Financial Data—Five-Year History
F ina nci a l Rev iew

14
ManageMent’s Discussion anD analysis of financial conDition anD Results of opeRations
Forward-Looking StatementS
This annual report contains forward-looking statements within the meaning of the safe harbor provisions of the Private Securities Litigation Reform Act of 1995. When used in this report, the words “believes,” “anticipates,” “expects,” “estimates,” “plans,” “intends,” “may,” “should” and similar expressions are intended to identify forward-looking statements. Although we believe that our plans, intentions and expectations reflected in or suggested by such forward-looking statements are reasonable, such forward-looking statements are subject to a number of risks and uncertainties, and we can provide no assurances that such plans, intentions or expectations will be achieved. All forward-looking statements attributable to us or persons acting on our behalf are expressly qualified in their entirety by these cautionary statements. All forward-looking statements speak only to the respective dates on which such statements are made and we do not undertake and specifically decline any obligation to publicly release the results of any revisions to these forward- looking statements that may be made to reflect any future events or circumstances after the date of such statements or to reflect the occurrence of anticipated or unanticipated events. It is not possible to anticipate and list all r isks and uncertainties that may affect our future operations or financial performance; however, they include, but are not limited to, the risks discussed below and in our Form 10-K for the year ended September 29, 2007 under the caption “Risk Factors” which includes the following: • Our business is cyclical and prolonged economic declines, particularly in the level of construction activity, could have a material adverse effect on our financial results. • Demand for our products is highly variable and difficult to forecast due to our minimal backlog and the unanticipated changes that can occur in customer order patterns or inventory levels. • Our financial results can be negatively impacted by the volatility in the cost and availability of our primary raw mate-rial, hot-rolled carbon steel wire rod. • Foreign competition could adversely impact our financial results. • Our manufacturing facilities are subject to unexpected equipment failures, operational interruptions and casualty losses. • Our financial results could be adversely impacted by the continued escalation in certain of our operating costs. • Our capital resources may not be adequate to provide for our capital investment and maintenance expenditures if we were to experience a substantial downturn in our financial performance.
• Environmental compliance and remediation could result in substantially increased capital investments and operating costs. • Our production and earnings could be reduced by strikes or work stoppages by our unionized employees. • Our stock price can be volatile, often in connection with matters beyond our control.
overview
Following our exit from the industrial wire busi-ness (see Note 7 to the consolidated financial state-ments), our operations are entirely focused on the manufacture and marketing of concrete reinforcing products for the concrete construction industry. The results of operations for the industrial wire business have been reported as discontinued operations for all periods presented. Our business strategy is focused on: (1) achieving leadership positions in our markets and operating as the lowest cost producer; and (2) pursuing growth opportunities within our core businesses that further our penetration of current markets served or expand our geographic reach.
CritiCaL aCCounting PoLiCieS
Our financial statements have been prepared in accordance with accounting principles generally accepted in the U.S. Our discussion and analysis of our financial condition and results of operations are based on these financial statements. The preparation of our financial statements requires the application of these accounting principles in addition to certain estimates and judgments based on current available information, actuarial estimates, historical results and other assump-tions believed to be reasonable. Actual results could differ from these estimates. The following critical accounting policies are used in the preparation of the financial statements:
Revenue recognition and credit risk. We recognize revenue from product sales in accordance with Staff Accounting Bulletin (“SAB”) No. 104 when products are shipped and risk of loss and title has passed to the customer. Substantially all of our accounts receivable are due from customers that are located in the United States and we generally require no collateral depending

insteel industRies, inc. and subsidiaRies 15
upon the creditworthiness of the account. We provide an allowance for doubtful accounts based upon our assessment of the credit risk of specific customers, historical trends and other information. There is no disproportionate concentration of credit risk.
Allowance for doubtful accounts. We maintain allowances for doubtful accounts for estimated losses resulting from the potential inability of our customers to make required payments. If the financial condition of our customers were to change significantly, adjust-ments to the allowances may be required. While we believe our recorded trade receivables will be collected, in the event of default in payment of a trade receivable, we would follow normal collection procedures.
Excess and obsolete inventory reserves. We write down the carrying value of our inventory for estimated obsolescence to reflect the lower of the cost of the inventory or its estimated net realizable value based upon assumptions about future demand and market conditions. If actual market conditions for our products are substantially different than our projections, adjust-ments to these reserves may be required.
Accruals for self-insured liabilities and litigation. We accrue estimates of the probable costs related to self-insured medical and workers’ compensation claims and legal matters. These estimates have been devel-oped in consultation with actuaries, our legal counsel and other advisors and are based on our current under-standing of the underlying facts and circumstances. Because of uncertainties related to the ultimate out-come of these issues as well as the possibility of changes in the underlying facts and circumstances, adjustments to these reserves may be required in the future.
Recent accounting pronouncements. In July 2006, the Financial Accounting Standards Board (“FASB”) issued Interpretation No. 48, “Accounting for Uncer-tainty in Income Taxes” (“FIN No. 48”) which clarifies the criteria for the recognition of tax benefits under Statement of Financial Accounting Standards (“SFAS”) No. 109, “Accounting for Income Taxes.” FIN No. 48 specifies how tax benefits for uncertain tax positions are to be recognized, measured and derecognized in
financial statements; requires certain disclosures of uncertain tax matters; specifies how reserves for uncer-tain tax positions should be classified on the balance sheet; and provides transition and interim period guid-ance, among other provisions. FIN No. 48 is effective for us beginning in fiscal 2008 and requires that the cumulative effect of applying its provisions be disclosed separately as a one-time, non-cash charge against the opening balance of retained earnings in the year of adoption. Based on our preliminary analysis, the adoption of FIN No. 48 is expected to result in an estimated charge to retained earnings of approximately $260,000. The actual amount of the adjustment will be recorded in the first quarter of 2008 upon the finaliza-tion of our analysis. In September 2006, the FASB issued SFAS No. 157, “Fair Value Measurements” which defines fair value, establishes a framework for measuring fair value in generally accepted accounting principles, and expands disclosures about fair value measurements. SFAS No. 157 is effective for us beginning in fiscal 2009. At this time, we have not determined what effect, if any, the adoption of SFAS No. 157 will have on our financial position or results of operations. In September 2006, the FASB issued SFAS No. 158, “Employers’ Accounting for Defined Benefit Pension and Other Postretirement Plans.” SFAS No. 158 requires that an employer recognize the overfunded or underfunded status of a defined benefit postretire-ment plan in its statement of financial position and changes in the funded status through other compre-hensive income in the year in which the changes occur. SFAS No. 158 also requires the measurement of defined benefit plan assets and obligations as of the date of the employer’s fiscal year-end statement of financial position. The provisions regarding the recog-nition of a plan’s funding status were effective for us in fiscal 2007 and resulted in a $2.1 million decrease in shareholders’ equity, net of tax. The provisions regard-ing the change in the measurement date are effective for us beginning in fiscal 2009. The adoption of SFAS No. 158 is further discussed in Note 8 to the consoli-dated financial statements.

16
ManageMent’s Discussion anD analysis of financial conDition anD Results of opeRations (continued)
reSuLtS oF oPerationS
Statements of Operations—Selected DataYear Ended
(Dollars in thousands)september 29,
2007 ChangeSeptember 30,
2006 ChangeOctober 1,
2005
Net sales $297,806 (9.6%) $329,507 6.5% $ 309,320Gross profit 56,061 (20.9%) 70,871 22.4% 57,898 Percentage of net sales 18.8% 21.5% 18.7%Selling, general and administrative expense $ 17,583 3.5% $ 16,996 5.1% $ 16,175 Percentage of net sales 5.9% 5.2% 5.2%Other expense (income), net $ 4 N/M $ (446) N/M $ (73)Interest expense 592 (11.5%) 669 (80.5%) 3,427Effective income tax rate 36.6% 36.2% 36.1%Earnings from continuing operations $ 24,284 (29.4%) $ 34,377 40.3% $ 24,499Earnings (loss) from discontinued operations (122) N/M (1,337) N/M 546Net earnings 24,162 (26.9%) 33,040 31.9% 25,045
“N/M” = not meaningful
2007 ComPared with 2006
Net Sales Net sales decreased 9.6% to $297.8 million in 2007 from $329.5 million in 2006 as lower shipments more than offset higher average selling prices. Shipments for the year decreased 11.4% while average selling prices rose 2.0% from the prior year. The reduction in shipments was driven by a combination of factors including: (1) the continuation of weak demand and inventory reduction measures pursued by customers that have been negatively impacted by the downturn in residential construction activity; (2) our decision to solicit minimal new business from posttension custom-ers in the PC strand market due to low-priced import competition; and (3) less favorable weather conditions in certain of our markets relative to the prior year which reduced the level of construction activity.
Gross Profit Gross profit decreased 20.9% to $56.1 million, or 18.8% of net sales in 2007 from $70.9 million, or 21.5% of net sales in 2006. The decrease was primarily due to the reduction in shipments, higher unit manufacturing costs resulting from lower operating levels and higher raw material costs which were partially offset by the increase in average selling prices.
Selling, General and Administrative Expense Selling, general and administrative expense (“SG&A expense”) increased 3.5% to $17.6 million, or 5.9% of net sales in 2007 from $17.0 million, or 5.2% of net sales in 2006. The increase was primarily due to higher compensation expense ($989,000) which was partially offset by lower employee benefit costs ($387,000).
Other Expense (Income), Net Other expense was $4,000 in 2007 compared with income of $446,000 in 2006. The income for the prior year was primarily related to a $247,000 litigation settlement and $128,000 of duties related to the dumping and countervailing duty cases that were filed by a coalition of domestic PC strand producers which included us.
Interest Expense Interest expense decreased $77,000, or 11.5%, to $592,000 in 2007 from $669,000 in 2006. The decrease was primarily due to lower average outstanding bal-ances on the revolving credit facility in the current year together with lower amortization expense associ-ated with capitalized financing costs.
Income Taxes Our effective income tax rate was relatively flat for 2007 at 36.6% compared with 36.2% in 2006.

insteel industRies, inc. and subsidiaRies 17
Earnings From Continuing Operations Earnings from continuing operations for 2007 decreased to $24.3 million, or $1.33 per diluted share, compared to $34.4 million, or $1.86 per diluted share in 2006 primarily due to the lower sales and gross profit.
Earnings (Loss) From Discontinued Operations The loss from discontinued operations for 2007 was $122,000, or $0.01 per diluted share compared to $1.3 million, or $0.07 per diluted share in 2006. The current year loss reflects the closure costs incurred to exit the industrial wire business and close our Fredericksburg, Virginia manufacturing facility. The prior year loss reflects the operating losses incurred by the industrial wire business together with the closure costs which were partially offset by a $1.3 million pre-tax gain on the sale of certain machinery and equip-ment associated with the industrial wire business for $6.0 million.
Net Earnings Net earnings for 2007 decreased to $24.2 million, or $1.32 per diluted share, compared to $33.0 million, or $1.79 per diluted share in 2006 primarily due to the lower sales and gross profit which was partially offset by the reduction in the loss from discontinued opera-tions associated with our exit from the industrial wire business and closure of our Fredericksburg, Virginia manufacturing facility.
2006 ComPared with 2005
Net Sales Net sales increased 6.5% to $329.5 million in 2006 from $309.3 million in 2005 as higher shipments more than offset lower average selling prices. Shipments for the year increased 11.0% while average selling prices decreased 4.0% from the prior year. The increase in shipments was primarily due to the continued improve-ment in nonresidential construction activity and demand for our concrete reinforcing products together with the completion of the inventory reduction mea-sures pursued by customers during the prior year. The decrease in average selling prices was due to compe-titive activity in our markets which was offset by reduc-tions in raw material costs.
Gross Profit Gross profit increased 22.4% to $70.9 million, or 21.5% of net sales in 2006 from $57.9 million, or 18.7% of net sales in 2005. The increase in gross profit was driven by higher shipments together with wider spreads between average selling prices and raw material costs. In addition, gross profit for 2005 was negatively impacted by the sale of higher cost inventory as raw material costs and selling prices declined over the course of the year.
Selling, General and Administrative Expense SG&A expense increased 5.1% to $17.0 million, or 5.2% of net sales in 2006 from $16.2 million, or 5.2% of net sales in 2005. We adopted SFAS No. 123(R) as of the beginning of fiscal 2006 which required all share-based payments to be recognized as expense over the requisite service period based upon their fair values as of the grant dates. Under the provisions of SFAS No. 123(R), total stock-based compensation expense for 2006 amounted to $1.2 million comprised of $535,000 of stock option expense and $638,000 of restricted stock amortization. Although we elected to adopt SFAS No. 123(R) using the modified prospective method, the 2005 amounts also reflect stock option expense due to certain previous option plans that were required to be accounted for as variable plans. Under variable plan accounting, compensation expense was recognized for the excess of the market price over the exercise price and adjusted to reflect changes in market valuation. As a result, total stock-based compensation expense for 2005 amounted to $805,000 comprised of $571,000 of stock option expense resulting from the increase in our share price that occurred during 2005 and $234,000 of restricted stock amortization. Excluding the stock-based compensation expense from both peri-ods, SG&A expense increased $453,000 primarily due to increases in compensation expense ($445,000), allowance for doubtful accounts ($299,000), employee benefit costs ($295,000), and travel-related expenses ($211,000) partially offset by lower legal expenses ($556,000) and consulting fees ($244,000).

18
ManageMent’s Discussion anD analysis of financial conDition anD Results of opeRations (continued)
Other Expense (Income), Net Other income was $446,000 in 2006 compared with $73,000 in 2005. The income for 2005 was pri-marily related to a $247,000 litigation settlement and $128,000 of duties related to the dumping and coun-tervailing duty cases that were filed by a coalition of domestic PC strand producers which included us.
Interest Expense Interest expense decreased $2.8 million, or 80.5%, to $669,000 in 2006 from $3.4 million in 2005. The decrease was primarily due to the reduction in average borrowing levels on our senior secured credit facility ($1.8 million) and lower amortization expense associ-ated with capitalized financing costs and the unreal-ized loss on the terminated interest rate swaps which was fully amortized in 2005 ($959,000).
Income Taxes Our effective income tax rate was relatively flat for 2006 at 36.2% compared with 36.1% in 2005.
Earnings From Continuing Operations Earnings from continuing operations for 2006 increased to $34.4 million, or $1.86 per diluted share, compared to $24.5 million, or $1.29 per diluted share in 2005 primarily due to the higher sales and gross profit together with the reduction in interest expense in 2006.
Earnings (Loss) From Discontinued Operations The loss from discontinued operations for 2006 was $1.3 million, or $0.07 per diluted share com-pared with earnings from discontinued operations of $546,000, or $0.03 per diluted share in 2005. The 2006 loss related to the operating losses and closure costs associated with our exit from the industrial wire busi-ness and closure of our Fredericksburg, Virginia manu-facturing facility. In 2006, we completed the sale of certain machinery and equipment associated with the industrial wire business for $6.0 million and recorded a pre-tax gain of $1.3 million. The 2005 earnings con-sisted of a $793,000 gain on the disposal of real estate, the collection of a note receivable and the settlement on the release of an equipment lien associated with Insteel Construction Systems, a discontinued operation that we had previously exited in 1997, partially offset by a loss of $247,000 from the operations of the indus-trial wire business.
Net Earnings Net earnings for 2006 increased to $33.0 million, or $1.79 per diluted share, compared to $25.0 million, or $1.32 per diluted share in 2005 primarily due to the higher sales and gross profit together with the reduc-tion in interest expense during 2006 which was par-tially offset by the loss from discontinued operations.
Liquidity and CaPitaL reSourCeS
Selected Financial DataYear Ended
(Dollars in thousands)september 29,
2007September 30,
2006October 1,
2005
Net cash provided by operating activities of continuing operations $ 17,065 $ 42,650 $ 41,830Net cash used for investing activities of continuing operations (17,062) (19,472) (6,036)Net cash used for financing activities of continuing operations (1,842) (22,008) (40,931)
Net cash provided by (used for) operating activities of discontinued operations (147) 2,185 2,630Net cash provided by investing activities of discontinued operations — 5,963 2,120Net cash used for financing activities of discontinued operations — — (560)
Working capital 70,697 56,938 51,662Total long-term debt — — 11,860 Percentage of total capital — — 11%Shareholders’ equity $143,850 $122,438 $ 97,036 Percentage of total capital 100% 100% 89%Total capital (total long-term debt + shareholders’ equity) $143,850 $122,438 $ 108,896

insteel industRies, inc. and subsidiaRies 19
CaSh FLow anaLySiS
Operating activities of continuing operations pro-vided $17.1 million of cash in 2007 compared with $42.7 million in 2006 and $41.8 million in 2005. The year-over-year decrease in 2007 was largely due to the $10.1 million reduction in earnings from continuing operations and $18.9 million decrease in cash provided by working capital. In 2007, the net change in receiv-ables, inventory and accounts payable and accrued expenses used $14.6 million of cash while providing $4.3 million and $7.9 million in 2006 and 2005, respec-tively. The cash used by working capital in the current year was primarily due to the $17.0 million decrease in accounts payable and accrued expenses resulting from the sharp reduction in raw material purchases during the fourth quarter together with changes in the mix of vendor payment terms. Depreciation and amortization rose $1.1 million, or 24.7%, primarily due to the increase in capital expenditures during the current and prior years and related asset additions. Deferred income taxes provided $2.0 million of cash during 2007 while using $1.6 million in 2006 primarily due to higher tax basis gains on the sale of fixed assets in the prior year. Investing activities of continuing operations used $17.1 million of cash in 2007 compared with $19.5 mil-lion in 2006 and $6.0 million in 2005. Capital expen-ditures amounted to $17.0 million, $19.0 million and $6.3 million in 2007, 2006 and 2005, respectively, with the higher levels in the current and prior years primar-ily related to capital outlays for the expansions of the ESM and PC strand businesses. Capital expenditures are expected to be $10.0 million in 2008 primarily related to the upgrading of our Florida PC strand facil-ity. The actual timing of these expenditures as well as the amounts are subject to change based on adjust-ments in the project timelines or scope, future market conditions, our financial performance and additional growth opportunities that may arise. In 2007, we sold an idle facility which had been classified as assets held for sale and realized net proceeds of $590,000. Investing activities from discontinued operations did not provide or utilize cash in 2007 while providing $6.0 million in
2006 from the net proceeds on the sale of certain machinery and equipment associated with our discon-tinued industrial wire business. Financing activities of continuing operations used $1.8 million of cash in 2007 compared with $22.0 mil-lion in 2006 and $40.9 million in 2005. The year-over-year decrease in 2007 was due to the $16.0 million reduction in long-term debt and the $8.5 million of share repurchases in the prior year.
Credit FaCiLitieS
As of September 29, 2007, we had a $100.0 mil-lion revolving credit facility in place to supplement our operating cash flow in funding our working capital, capital expenditure and general corporate require-ments. No borrowings were outstanding on the credit facility as of September 29, 2007 and September 30, 2006 and outstanding letters of credit totaled $1.9 mil-lion and $1.4 million, respectively. As of September 29, 2007, $54.7 million of borrowing capacity was available on the credit facility (see Note 4 to the consolidated financial statements). Our balance sheet was debt-free as of September 29, 2007 and September 30, 2006. We believe that, in the absence of significant unanticipated cash demands, net cash generated by operating activities and amounts available under our revolving credit facility will be sufficient to satisfy our expected requirements for work-ing capital, capital expenditures, dividends and share repurchases, if any.
oFF-BaLanCe Sheet arrangementS
We do not have any material transactions, arrangements, obligations (including contingent obli-gations), or other relationships with unconsolidated entities or other persons, as defined by Item 303(a)(4) of Regulation S-K of the SEC, that have or are reason-ably likely to have a material current or future impact on our financial condition, results of operations, liquid-ity, capital expenditures, capital resources or significant components of revenues or expenses.
20
ManageMent’s Discussion anD analysis of financial conDition anD Results of opeRations (continued)
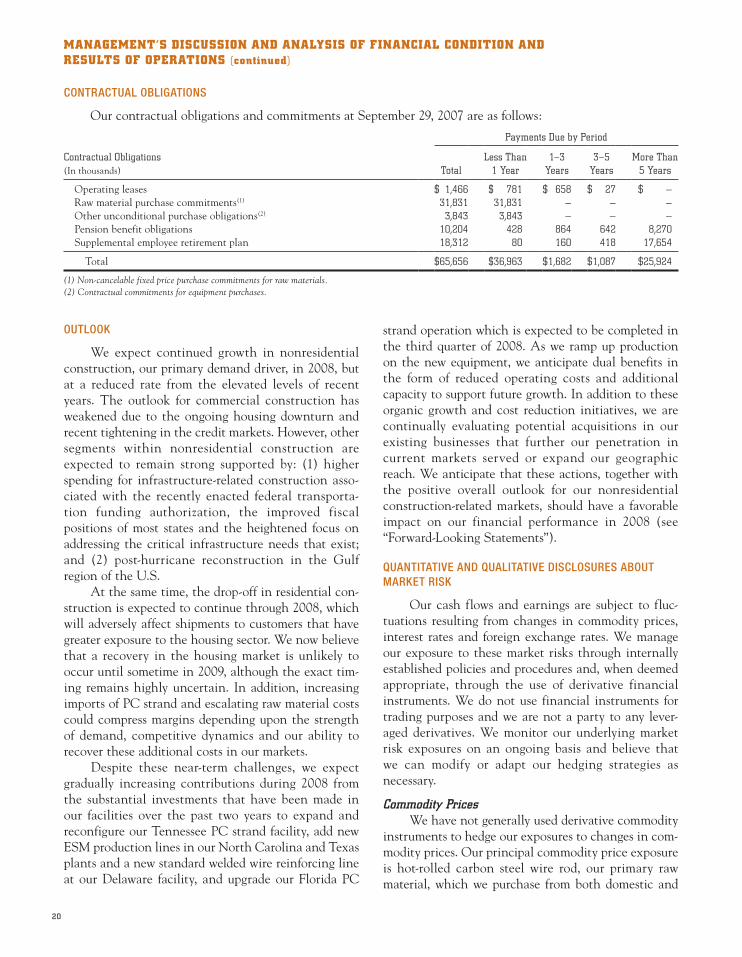
ContraCtuaL oBLigationS
Our contractual obligations and commitments at September 29, 2007 are as follows:
Payments Due by Period
Contractual Obligations(In thousands) Total
Less Than 1 Year
1–3 Years
3–5 Years
More Than 5 Years
Operating leases $ 1,466 $ 781 $ 658 $ 27 $ — Raw material purchase commitments(1) 31,831 31,831 — — — Other unconditional purchase obligations(2) 3,843 3,843 — — — Pension benefit obligations 10,204 428 864 642 8,270 Supplemental employee retirement plan 18,312 80 160 418 17,654
Total $ 65,656 $ 36,963 $ 1,682 $ 1,087 $ 25,924
(1) Non-cancelable fixed price purchase commitments for raw materials.(2) Contractual commitments for equipment purchases.
outLook
We expect continued growth in nonresidential construction, our primary demand driver, in 2008, but at a reduced rate from the elevated levels of recent years. The outlook for commercial construction has weakened due to the ongoing housing downturn and recent tightening in the credit markets. However, other segments within nonresidential construction are expected to remain strong supported by: (1) higher spending for infrastructure-related construction asso-ciated with the recently enacted federal transporta-tion funding authorization, the improved fiscal positions of most states and the heightened focus on addressing the critical infrastructure needs that exist; and (2) post-hurricane reconstruction in the Gulf region of the U.S. At the same time, the drop-off in residential con-struction is expected to continue through 2008, which will adversely affect shipments to customers that have greater exposure to the housing sector. We now believe that a recovery in the housing market is unlikely to occur until sometime in 2009, although the exact tim-ing remains highly uncertain. In addition, increasing imports of PC strand and escalating raw material costs could compress margins depending upon the strength of demand, competitive dynamics and our ability to recover these additional costs in our markets. Despite these near-term challenges, we expect gradually increasing contributions during 2008 from the substantial investments that have been made in our facilities over the past two years to expand and reconfigure our Tennessee PC strand facility, add new ESM production lines in our North Carolina and Texas plants and a new standard welded wire reinforcing line at our Delaware facility, and upgrade our Florida PC
strand operation which is expected to be completed in the third quarter of 2008. As we ramp up production on the new equipment, we anticipate dual benefits in the form of reduced operating costs and additional capacity to support future growth. In addition to these organic growth and cost reduction initiatives, we are continually evaluating potential acquisitions in our existing businesses that further our penetration in current markets served or expand our geographic reach. We anticipate that these actions, together with the positive overall outlook for our nonresidential construction-related markets, should have a favorable impact on our financial performance in 2008 (see “Forward-Looking State ments”).
quantitative and quaLitative diSCLoSureS aBout market riSk
Our cash flows and earnings are subject to fluc-tuations resulting from changes in commodity prices, interest rates and foreign exchange rates. We manage our exposure to these market risks through internally established policies and procedures and, when deemed appropriate, through the use of derivative financial instruments. We do not use financial instruments for trading purposes and we are not a party to any lever-aged derivatives. We monitor our underlying market risk exposures on an ongoing basis and believe that we can modify or adapt our hedging strategies as necessary.
Commodity Prices We have not generally used derivative commodity instruments to hedge our exposures to changes in com-modity prices. Our principal commodity price exposure is hot-rolled carbon steel wire rod, our primary raw material, which we purchase from both domestic and

insteel industRies, inc. and subsidiaRies 21
foreign suppliers and is denominated in U.S. dollars. Prior to 2004, we typically negotiated quantities and pricing on a quarterly basis for both domestic and foreign steel wire rod purchases to manage our expo-sure to price fluctuations and to ensure adequate avail-ability of material consistent with our requirements. However, beginning in 2004, a tightening of supply in the rod market together with fluctuations in the raw material costs of rod producers resulted in increased price volatility which has continued through 2007. In some instances, wire rod producers have resorted to increasing the frequency of price adjustments, typically on a monthly basis as well as unilaterally changing the terms of prior commitments. Our ability to acquire steel wire rod from foreign sources on favorable terms is impacted by fluctuations in foreign currency exchange rates, foreign taxes, duties, tariffs and other trade actions. Although changes in wire rod costs and our selling prices may be correlated over extended periods
of time, depending upon market conditions, there may be periods during which we are unable to fully recover increased rod costs through higher selling prices, which reduces our gross profit and cash flow from operations.
Interest Rates Although we were debt-free as of September 29, 2007, future borrowings under our senior secured credit facility are sensitive to changes in interest rates.
Foreign Exchange Exposure We have not typically hedged foreign currency exposures related to transactions denominated in cur-rencies other than U.S. dollars and any such trans-actions have not been material in the past. We will occasionally hedge firm commitments for equipment purchases that are denominated in foreign currencies. The decision to hedge any such transactions is made by us on a case-by-case basis. There were no forward contracts outstanding as of September 29, 2007.
ManageMent’s RepoRt on inteRnal contRol oVeR financial RepoRting
Insteel’s management is responsible for establish-ing and maintaining adequate internal control over financial reporting, as such term is defined in Rules 13a-15(f) and 15d-15(f) under the Securities Exchange Act of 1934, as amended. Insteel’s internal control over financial reporting is designed to provide reason-able assurance regarding the reliability of financial reporting and the preparation of financial statements for external purposes in accordance with generally accepted accounting principles. The Company’s inter-nal control over financial reporting includes those written policies and procedures that: (1) pertain to maintaining records that in reasonable detail accu-rately and fairly reflect the transactions and disposi-tions of assets; (2) provide reasonable assurance that transactions are recorded as necessary to permit prepa-ration of financial statements in accordance with gen-erally accepted accounting principles, and that receipts and expenditures are made in accordance with autho-rizations of management and directors; and (3) provide reasonable assurance regarding prevention or timely detection of unauthorized acquisition, use, or disposi-tion of assets that could have a material effect on the financial statements.
Because of its inherent limitations, internal con-trol over financial reporting may not prevent or detect misstatements. Also, projections of any evaluation of effectiveness to future periods are subject to the risk that controls may become inadequate because of changes in conditions, or that the degree of compli-ance with the policies or procedures may deteriorate. Management assessed the effectiveness of Insteel’s internal control over financial reporting as of Sep-tember 29, 2007. In making this assessment, manage-ment used the criteria set forth by the Committee of Sponsoring Organizations of the Treadway Commis-sion in Internal Control—Integrated Framework. Based on its assessment, management believes that, as of September 29, 2007, Insteel’s internal control over financial reporting was effective based on those criteria. Grant Thornton LLP, an independent registered public accounting firm, has audited management’s assessment of the effectiveness of Insteel’s internal con-trol over financial reporting and has issued an attesta-tion report concurring with management’s assessment which is on page 23.

22
RepoRt of inDepenDent RegisteReD puBlic accounting fiRMconsoliDateD financial stateMents
The Board of Directors and ShareholdersInsteel Industries, Inc.:
We have audited the accompanying consolidated balance sheets of Insteel Industries, Inc. and subsidiary (a North Carolina corporation) as of September 29, 2007 and September 30, 2006 and the related consoli-dated statements of operations, shareholders’ equity and comprehensive income and cash flows for each of the three years in the period ended September 29, 2007. These financial statements are the responsibility of the Company’s management. Our responsibility is to express an opinion on these financial statements based on our audits. We conducted our audits in accordance with the standards of the Public Company Accounting Over-sight Board (United States). Those standards require that we plan and perform the audit to obtain reason-able assurance about whether the financial statements are free of material misstatement. An audit includes examining, on a test basis, evidence supporting the amounts and disclosures in the financial statements. An audit also includes assessing the accounting principles used and significant estimates made by man-agement, as well as evaluating the overall financial statement presentation. We believe that our audits provide a reasonable basis for our opinion. In our opinion, the consolidated financial state-ments referred to above present fairly, in all material respects, the financial position of Insteel Industries, Inc. and subsidiary as of September 29, 2007 and
September 30, 2006 and the results of their opera-tions and their cash flows for each of the three years in the period ended September 29, 2007, in conformity with accounting principles generally accepted in the United States. As discussed in Note 8 to the financial statements, the Company has adopted Financial Accounting Standards Board Statement No. 158, “Employers’ Accounting for Defined Benefit Pension and Other Postretirement Plans,” as of September 29, 2007. In addition, as discussed in Note 1, the Company adopted Financial Accounting Standards Board Statement No. 123(R), “Share-Based Payment” on October 2, 2005. We also have audited, in accordance with the standards of the Public Company Accounting Over-sight Board (United States), the effectiveness of Insteel Industries, Inc. and subsidiary’s internal control over financial reporting as of September 29, 2007, based on criteria established in Internal Control—Integrated Framework issued by the Committee of Sponsoring Organizations of the Treadway Commission (COSO) and our report dated November 19, 2007 expressed an unqualified opinion.
Greensboro, North CarolinaNovember 19, 2007

insteel industRies, inc. and subsidiaRies 23
RepoRt of inDepenDent RegisteReD puBlic accounting fiRMinteRnal contRol oVeR financial RepoRting
To the Board of Directors and ShareholdersInsteel Industries, Inc.:
We have audited Insteel Industries, Inc. and sub-sidiary’s (a North Carolina corporation) internal con-trol over financial reporting as of September 29, 2007, based on criteria established in Internal Control—Integrated Framework issued by the Committee of Sponsoring Organizations of the Treadway Commis-sion (COSO). Insteel Industries, Inc. and subsidiary’s management is responsible for maintaining effective internal control over financial reporting and for its assessment of the effectiveness of internal control over financial reporting. Our responsibility is to express an opinion on Insteel Industries, Inc. and subsidiary’s internal control over financial reporting based on our audit. We conducted our audit in accordance with the standards of the Public Company Accounting Over-sight Board (United States). Those standards require that we plan and perform the audit to obtain reason-able assurance about whether effective internal control over financial reporting was maintained in all material respects. Our audit included obtaining an understand-ing of internal control over financial reporting, assess-ing the risk that a material weakness exists, testing and evaluating the design and operating effectiveness of internal control based on the assessed risk, and performing such other procedures as we considered necessary in the circumstances. We believe that our audit provides a reasonable basis for our opinion. A company’s internal control over financial reporting is a process designed to provide reasonable assurance regarding the reliability of financial report-ing and the preparation of financial statements for external purposes in accordance with generally accepted accounting principles. A company’s internal control over financial reporting includes those policies and procedures that (1) pertain to the maintenance of records that, in reasonable detail, accurately and fairly reflect the transactions and dispositions of the assets of the company; (2) provide reasonable assurance that transactions are recorded as necessary to permit prepa-ration of financial statements in accordance with gen-erally accepted accounting principles, and that receipts and expenditures of the company are being made only
in accordance with authorizations of management and directors of the company; and (3) provide reasonable assurance regarding prevention or timely detection of unauthorized acquisition, use, or disposition of the company’s assets that could have a material effect on the financial statements. Because of its inherent limitations, internal con-trol over financial reporting may not prevent or detect misstatements. Also, projections of any evaluation of effectiveness to future periods are subject to the risk that controls may become inadequate because of changes in conditions, or that the degree of compli-ance with the policies or procedures may deteriorate. In our opinion, Insteel Industries, Inc. and sub-sidiary maintained, in all material respects, effective internal control over financial reporting as of Sep-tember 29, 2007 based on criteria established in Internal Control—Integrated Framework issued by the Com-mittee of Sponsoring Organizations of the Treadway Commission (COSO). We have also audited, in accordance with the standards of the Public Company Accounting Over-sight Board (United States), the consolidated balance sheets of Insteel Industries, Inc. and subsidiary as of September 29, 2007 and September 30, 2006 and the related consolidated statements of operations, share-holders’ equity and comprehensive income and cash flows for each of the three years in the period ended September 29, 2007, and our report dated November 19, 2007, expressed an unqualified opinion on those financial statements and contains an explanatory para-graph relating to the adoption of Financial Account-ing Standards Board Statement (“SFAS”) No. 158, “Employers’ Accounting for Defined Benefit Pension and Other Postretirement Plans.” In addition, as dis-cussed in Note 1, the Company adopted SFAS No. 123(R), “Share-Based Payment” on October 2, 2005.
Greensboro, North CarolinaNovember 19, 2007

24
consoliDateD stateMents of opeRations
Year Ended
(In thousands, except for per share amounts)september 29,
2007September 30,
2006October 1,
2005
Net sales $297,806 $329,507 $309,320Cost of sales 241,745 258,636 251,422
Gross profit 56,061 70,871 57,898Selling, general and administrative expense 17,583 16,996 16,175Other expense (income), net 4 (446) (73)Interest expense 592 669 3,427Interest income (415) (255) —
Earnings from continuing operations before income taxes 38,297 53,907 38,369Income taxes 14,013 19,530 13,870
Earnings from continuing operations 24,284 34,377 24,499 Earnings (loss) from discontinued operations net of income taxes of
($77), ($851) and $330 (122) (1,337) 546
Net earnings $ 24,162 $ 33,040 $ 25,045
Per share amounts: Basic: Earnings from continuing operations $ 1.34 $ 1.88 $ 1.31 Earnings (loss) from discontinued operations (0.01) (0.08) 0.03
Net earnings $ 1.33 $ 1.80 $ 1.34
Diluted: Earnings from continuing operations $ 1.33 $ 1.86 $ 1.29 Earnings (loss) from discontinued operations (0.01) (0.07) 0.03
Net earnings $ 1.32 $ 1.79 $ 1.32
Cash dividends declared $ 0.12 $ 0.12 $ 0.06
Weighted shares outstanding: Basic 18,142 18,307 18,656 Diluted 18,314 18,473 18,954
See accompanying notes to consolidated financial statements.

insteel industRies, inc. and subsidiaRies 25
consoliDateD Balance sHeets
(In thousands, except for per share amounts)september 29,
2007September 30,
2006
Assets:Current assets: Cash and cash equivalents $ 8,703 $ 10,689 Accounts receivable, net 34,518 37,519 Inventories 47,401 46,797 Prepaid expenses and other 4,640 2,675 Current assets of discontinued operations — 411
Total current assets 95,262 98,091Property, plant and equipment, net 67,147 55,217Other assets 7,485 9,653Non-current assets of discontinued operations 3,635 3,635
Total assets $ 173,529 $ 166,596
Liabilities and shareholders’ equity:Current liabilities: Accounts payable $ 16,705 $ 30,691 Accrued expenses 7,613 9,819 Current liabilities of discontinued operations 247 643
Total current liabilities 24,565 41,153Other liabilities 4,862 2,713Long-term liabilities of discontinued operations 252 292Commitments and contingenciesShareholders’ equity: Preferred stock, no par value Authorized shares: 1,000 None issued — — Common stock, $1 stated value Authorized shares: 40,000 Issued and outstanding shares: 2007, 18,303; 2006, 18,213 18,303 18,213 Additional paid-in capital 48,939 47,005 Deferred stock compensation (1,132) (662) Retained earnings 79,859 57,882 Accumulated other comprehensive loss (2,119) —
Total shareholders’ equity 143,850 122,438
Total liabilities and shareholders’ equity $ 173,529 $ 166,596
See accompanying notes to consolidated financial statements.

26
consoliDateD stateMents of casH floWs
Year Ended
(In thousands)september 29,
2007September 30,
2006October 1,
2005
Cash Flows From Operating Activities: Net earnings $ 24,162 $ 33,040 $ 25,045 Earnings (loss) from discontinued operations 122 1,337 (546)
Earnings from continuing operations 24,284 34,377 24,499 Adjustments to reconcile earnings from continuing operations to net cash
provided by operating activities of continuing operations: Depreciation and amortization 5,711 4,578 4,139 Amortization of capitalized financing costs 498 529 651 Amortization of unrealized loss on financial instruments — — 837 Stock-based compensation expense 1,258 1,173 805 Excess tax benefits from exercise of stock options (122) (459) — Loss on sale of property, plant and equipment 301 82 63 Deferred income taxes 2,003 (1,627) 2,004 Increase in cash surrender value of life insurance over premiums paid (277) (193) — Net changes in assets and liabilities: Accounts receivable, net 3,001 1,082 481 Inventories (604) (15,228) 6,753 Accounts payable and accrued expenses (17,019) 18,456 640 Other changes (1,969) (120) 958
Total adjustments (7,219) 8,273 17,331
Net cash provided by operating activities— continuing operations 17,065 42,650 41,830 Net cash provided by (used for) operating activities— discontinued operations (147) 2,185 2,630
Net cash provided by operating activities 16,918 44,835 44,460
Cash Flows From Investing Activities: Capital expenditures (17,013) (18,959) (6,302) Proceeds from sale of assets held for sale 590 — 904 Proceeds from sale of property, plant and equipment — 52 27 Premium payments on life insurance policies (639) (565) (665)
Net cash used for investing activities— continuing operations (17,062) (19,472) (6,036) Net cash provided by investing activities— discontinued operations — 5,963 2,120
Net cash used for investing activities (17,062) (13,509) (3,916)
(continued)

insteel industRies, inc. and subsidiaRies 27
Year Ended
(In thousands)september 29,
2007September 30,
2006October 1,
2005
Cash Flows From Financing Activities: Proceeds from long-term debt 16,999 135,219 329,562 Principal payments on long-term debt (16,999) (147,079) (370,070) Financing costs — (307) (23) Cash received from exercise of stock options 162 360 175 Excess tax benefits from exercise of stock options 122 459 — Repurchase of common stock — (8,529) — Cash dividends paid (2,176) (2,222) (566) Other 50 91 (9)
Net cash used for financing activities— continuing operations (1,842) (22,008) (40,931) Net cash used for financing activities— discontinued operations — — (560)
Net cash used for financing activities (1,842) (22,008) (41,491)
Net increase (decrease) in cash and cash equivalents (1,986) 9,318 (947)Cash and cash equivalents at beginning of period 10,689 1,371 2,318
Cash and cash equivalents at end of period $ 8,703 $ 10,689 $ 1,371
Supplemental Disclosures of Cash Flow Information: Cash paid during the period for: Interest $ 93 $ 202 $ 3,531 Income taxes 16,785 17,489 12,001 Non-cash financing activity: Cashless exercise of stock options — — 338 Purchases of property, plant and equipment in accounts payable 937 — — Issuance of restricted stock 1,215 792 742 Declaration of cash dividends to be paid 544 543 565 Other — — 105
See accompanying notes to consolidated financial statements.

28
consoliDateD stateMents of sHaReHolDeRs’ eQuity anD coMpReHensiVe incoMe
Common StockAdditional
Paid-In Deferred Retained
Accumulated Other
ComprehensiveTotal
Shareholders’(In thousands) Shares Amount Capital Compensation Earnings Income (Loss)(1) Equity
Balance at October 2, 2004 18,244 $ 18,244 $ 43,677 $ — $ 10,927 $ (1,637) $ 71,211
Comprehensive income: Net earnings 25,045 25,045 Amortization of loss on financial instruments
included in net earnings 656 656 Recognition of additional pension plan liability (111) (111)
Comprehensive income(1) 25,590Stock options exercised 570 570 (395) 175Restricted stock granted 82 83 659 (742) —Restricted stock shares from dividend 3 3Compensation expense associated with stock-
based plans 571 234 805Retirement of shares held within grantor trust (36) (36) (69) (105)Cash dividends declared (1,131) (1,131)Excess tax benefits from exercise of stock options 488 488
Balance at October 1, 2005 18,860 $ 18,861 $ 45,003 $ (508) $ 34,772 $ (1,092) $ 97,036
Comprehensive income: Net earnings 33,040 33,040 Reduction in pension liability 1,092 1,092
Comprehensive income(1) 34,132Stock options exercised 101 101 259 360Restricted stock granted 51 50 742 (792) —Restricted stock shares from dividend 1 1 7 8Compensation expense associated with stock-
based plans 535 638 1,173Excess tax benefits from exercise of stock options 459 459Repurchase of common stock (800) (800) (7,729) (8,529)Cash dividends declared (2,201) (2,201)
Balance at September 30, 2006 18,213 $ 18,213 $ 47,005 $ (662) $ 57,882 $ — $ 122,438
Comprehensive income: Net earnings 24,162 24,162 Recognition of additional pension plan liability (9) (9) Adjustment to adopt SFAS No. 158 (2,110) (2,110)
Comprehensive income(1) 22,043Stock options exercised 23 23 139 162Restricted stock granted 67 67 1,148 (1,215) —Restricted stock shares from dividend 12 12Compensation expense associated with stock-
based plans 513 745 1,258Excess tax benefits from exercise of stock options 122 122Cash dividends declared (2,185) (2,185)
Balance at September 29, 2007 18,303 $ 18,303 $48,939 $(1,132) $79,859 $(2,119) $143,850
(1) Components of accumulated other comprehensive income (loss) are reported net of related income taxes.
See accompanying notes to consolidated financial statements.

insteel industRies, inc. and subsidiaRies 29
notes to consoliDateD financial stateMentsYears Ended September 29, 2007, September 30, 2006 and October 1, 2005
(1) deSCriPtion oF BuSineSS
Insteel Industries, Inc. (“Insteel” or “the Com-pany”) is one of the nation’s largest manufacturers of steel wire reinforcing products for concrete construc-tion applications. Insteel is the parent holding com-pany for a wholly-owned operating subsidiary, Insteel Wire Products Company (“IWP”). The Company manufactures and markets PC strand and welded wire reinforcement products, including concrete pipe rein-forcement, engineered structural mesh and standard welded wire reinforcement. The Company’s products are primarily sold to manufacturers of concrete prod-ucts and to a lesser extent to distributors and rebar fabricators that are located nationwide as well as into Canada, Mexico, and Central and South America. The Company’s exit from the industrial wire business in June 2006 (see Note 7 to the consolidated financial statements) narrowed its strategic and opera-tional focus to concrete reinforcing products. The results of operations for the industrial wire products business have been reported as discontinued operations for all periods presented.
(2) Summary oF SigniFiCant aCCounting PoLiCieS
Fiscal year. The Company’s fiscal year is the 52 or 53 weeks ending on the Saturday closest to September 30. Fiscal years 2007, 2006 and 2005 were 52-week fis-cal years. All references to years relate to fiscal years rather than calendar years.
Principles of consolidation. The consolidated finan-cial statements include the accounts of the Company and its subsidiaries. All significant intercompany bal-ances and transactions have been eliminated.
Use of estimates. The preparation of financial statements in conformity with accounting principles generally accepted in the U.S. requires management to make estimates and assumptions that affect the amounts reported in the financial statements and accompanying notes. There is no assurance that actual results will not differ from these estimates.
Cash equivalents. The Company considers all highly liquid investments purchased with original maturities of three months or less to be cash equivalents.
Stock options. Effective October 2, 2005, the Company began recording compensation expense asso-ciated with stock options and other forms of equity compensation in accordance with Statement of Finan-cial Accounting Standards (“SFAS”) No. 123(R), “Share-Based Payment” as interpreted by Staff Accounting Bulletin (“SAB”) No. 107. Previously the Company had accounted for stock option plans under the intrinsic value method prescribed by Accounting Principals Board Opinion (“APB”) No. 25, “Accounting for Stock Issued to Employees,” and therefore no related compensation expense was recorded for awards granted with no intrinsic value. The Company adopted the modified prospective transition method provided for under SFAS No. 123(R) and consequently, has not ret-roactively adjusted results from prior periods. Under this transition method, (1) stock compensation expense associated with options granted on or after October 2, 2005 is recorded in accordance with the provisions of SFAS No. 123(R); and (2) stock compensation expense associated with the remaining unvested portion of stock options granted prior to October 2, 2005 is recorded based on the grant date fair value of the options estimated in accordance with the original provisions of SFAS No. 123, “Accounting for Stock-Based Compensation.” Under the provisions of SFAS No. 123(R), the Company recorded $513,000 and $535,000 of compen-sation expense for stock options within selling, general and administrative expense for the years ended September 29, 2007 and September 30, 2006, respec-tively. The Company recorded $571,000 of compensa-tion expense for the year ended October 1, 2005 for stock options associated with certain previous option plans that were required to be accounted for as vari-able plans under the provisions of APB No. 25. Under variable plan accounting, compensation expense was recognized for the excess of the market price over the exercise price and adjusted each reporting period to reflect changes in market valuation. Under the pro-visions of SFAS No. 123(R), these options are now accounted for as equity awards and, since the options were fully vested as of October 2, 2005, no compensa-tion expense was recorded in 2006 and 2007.

30
notes to consoliDateD financial stateMents (continued)Years Ended September 29, 2007, September 30, 2006 and October 1, 2005
Prior to the adoption of SFAS No. 123(R), the benefit of tax deductions in excess of recognized stock compensation expense was reported as a reduction of taxes paid within operating cash flow. SFAS No. 123(R) requires that such benefits be reported as a financing cash flow. For the years ended September 29, 2007 and September 30, 2006, $122,000 and $459,000 of excess tax benefits were generated from option exer-cises, respectively. The following table illustrates the effect on net earnings and earnings per share if the Company had applied the fair value recognition provisions of SFAS No. 123 to options granted under the Company’s option plans for the year ended October 1, 2005:
(In thousands, except for per share amounts)
Year Ended October 1,
2005
Net earnings—as reported $25,045Stock-based compensation expense included in
reported net earnings, net of related tax effects (214)Total stock-based compensation expense determined
under fair-value based method for all awards, net of related tax effects (141)
Net earnings—pro forma $24,690
Basic net earnings per share—as reported $ 1.34Basic net earnings per share—pro forma 1.32Diluted net earnings per share—as reported 1.32Diluted net earnings per share—pro forma 1.30Basic shares outstanding—as reported and pro forma 18,656Diluted shares outstanding—as reported 18,954Diluted shares outstanding—pro forma 18,940
Revenue recognition and credit risk. The Company recognizes revenue from product sales in accordance with SAB No. 104 when the products are shipped and risk of loss and title has passed to the customer. Sub-stantially all of the Company’s accounts receivable are due from customers that are located in the U.S. and the Company generally requires no collateral depend-ing upon the creditworthiness of the account. The Company provides an allowance for doubtful accounts based upon its assessment of the credit risk of specific customers, historical trends and other information. The Company writes off accounts receivable when they become uncollectible and payments subsequently received are credited to the allowance for doubtful accounts. There is no disproportionate concentration of credit risk.
Shipping and handling costs. The Company includes all of the outbound freight, shipping and han-dling costs associated with the shipment of products to customers in cost of sales. Any amounts paid by customers to the Company for shipping and handling are recorded in net sales on the consolidated statement of operations.
Inventories. Inventories are valued at the lower of average cost (which approximates computation on a first-in, first-out basis) or market (net realizable value or replacement cost).
Property, plant and equipment. Property, plant and equipment are stated at cost or otherwise at reduced values to the extent there have been asset impairment write-downs. Expenditures for maintenance and repairs are charged directly to expense when incurred, while major improvements are capitalized. Depreciation is computed for financial reporting purposes principally by use of the straight-line method over the following estimated useful lives: machinery and equipment, 3–15 years; buildings, 10–30 years; land improvements, 5–15 years. Depreciation expense was approximately $5.7 million in 2007, $4.6 million in 2006 and $4.1 million in 2005. Capitalized software is amortized over the shorter of the estimated useful life or 5 years. No inter-est costs were capitalized in 2007, 2006 or 2005.
Other assets. Other assets consist principally of non-current deferred tax assets, capitalized financing costs, the cash surrender value of life insurance policies and assets held for sale. Capitalized financing costs are amortized using the straight-line method, which approximates the effective interest method over the life of the related credit agreement.
Long-lived assets. Long-lived assets include prop-erty, plant and equipment and identifiable intangible assets with definite useful lives. The Company assesses the impairment of long-lived assets whenever events or changes in circumstance indicate that the carrying value may not be fully recoverable. When the Company determines that the carrying value of such assets may not be recoverable, it measures recoverability based on the undiscounted cash flows expected to be generated by the related asset or asset group. If it is determined that an impairment loss has occurred, the loss is recog-nized during the period incurred. An impairment loss is calculated as the difference between the carrying

insteel industRies, inc. and subsidiaRies 31
value and the present value of estimated future net cash flows or comparable market values. There were no impairment losses in 2007, 2006 or 2005.
Fair value of financial instruments. The carrying amounts for cash and cash equivalents, accounts receiv-able, and accounts payable and accrued expenses approximate fair value because of their short maturities.
Income taxes. Income taxes are based on pretax financial accounting income. Deferred tax assets and liabilities are recognized for the expected tax conse-quences of temporary differences between the tax bases of assets and liabilities and their reported amounts. The Company assesses the need to establish a valua-tion allowance against its deferred tax assets to the extent the Company no longer believes it is more likely than not that the tax assets will be fully utilized.
Earnings per share. Basic earnings per share (“EPS”) are computed by dividing net earnings by the weighted average number of common shares outstand-ing during the period. Diluted EPS are computed by dividing net earnings by the weighted average number of common shares and other dilutive equity securities outstanding during the period. Securities that have the effect of increasing EPS are considered to be anti-dilutive and are not included in the computation of diluted EPS.
Recent accounting pronouncements. In July 2006, the Financial Accounting Standards Board (“FASB”) issued Interpretation No. 48, “Accounting for Uncer-tainty in Income Taxes” (“FIN No. 48”) which clarifies the criteria for the recognition of tax benefits under SFAS No. 109, “Accounting for Income Taxes.” FIN No. 48 specifies how tax benefits for uncertain tax positions are to be recognized, measured and derecog-nized in financial statements; requires certain disclo-sures of uncertain tax matters; specifies how reserves for uncertain tax positions should be classified on the balance sheet; and provides transition and interim period guidance, among other provisions. FIN No. 48 is effective for the Company beginning in fiscal 2008 and requires that the cumulative effect of applying its provisions be disclosed separately as a one-time, non-cash charge against the opening balance of retained earnings in the year of adoption. Based on the Company’s preliminary analysis, the adoption of
FIN No. 48 is expected to result in an estimated charge to retained earnings of approximately $260,000. The actual amount of the adjustment will be recorded in the first quarter of 2008 upon the finalization of the Company’s analysis. In September 2006, the FASB issued SFAS No. 157, “Fair Value Measurements” which defines fair value, establishes a framework for measuring fair value in generally accepted accounting principles, and expands disclosures about fair value measurements. SFAS No. 157 is effective for the Company beginning in fiscal 2009. At this time, the Company has not determined what effect, if any, the adoption of SFAS No. 157 will have on its financial position or results of operations. In September 2006, the FASB issued SFAS No. 158, “Employers’ Accounting for Defined Benefit Pension and Other Postretirement Plans.” SFAS No. 158 requires that an employer recognize the overfunded or underfunded status of a defined benefit postretire-ment plan in its statement of financial position and changes in the funded status through comprehensive income in the year in which the changes occur. SFAS No. 158 also requires the measurement of defined benefit plan assets and obligations as of the date of the employer’s fiscal year-end statement of financial position. The provisions regarding the recognition of a plan’s funding status were effective for the Company in fiscal 2007 and resulted in a $2.1 million decrease in shareholders’ equity, net of tax. The provisions regarding the change in the measurement date are effective for the Company beginning in fiscal 2009. The adoption of SFAS No. 158 is further discussed in Note 8 to the consolidated financial statements.
(3) StoCk SPLit
On May 16, 2006, the Board of Directors approved a two-for-one split of the Company’s common stock payable in the form of a stock dividend. The stock split entitled each shareholder of record on June 2, 2006 to receive one share of common stock for each outstanding share of common stock held on that date and was distributed on June 16, 2006. Unless other-wise indicated, the capital stock accounts and all share and earnings per share amounts in this report give effect to the stock split, applied retroactively, to all periods presented.

32
notes to consoliDateD financial stateMents (continued)Years Ended September 29, 2007, September 30, 2006 and October 1, 2005
(4) Credit FaCiLitieS
As of September 29, 2007, the Company had a $100.0 million revolving credit facility in place to sup-plement its operating cash flow in funding its working capital, capital expenditure and general corporate requirements. No borrowings were outstanding on the credit facility as of September 29, 2007 and September 30, 2006 and outstanding letters of credit totaled $1.9 million and $1.4 million, respectively. As of September 29, 2007, $54.7 million of borrowing capacity was avail-able on the credit facility. Advances under the credit facility are limited to the lesser of the revolving credit commitment or a bor-rowing base amount that is calculated based upon a percentage of eligible receivables and inventories plus, upon the Company’s request and subject to certain conditions, a percentage of eligible equipment and real estate. Interest rates on the revolver are based upon (1) a base rate that is established at the higher of the prime rate or 0.50% plus the federal funds rate, or (2) at the election of the Company, a LIBOR rate, plus in either case, an applicable interest rate margin. The applicable interest rate margins are adjusted on a quar-terly basis based upon the amount of excess availability on the revolver within the range of 0.00%–0.50% for the base rate and 1.25%–2.00% for the LIBOR rate. In addition, the applicable interest rate margins would be adjusted to the highest percentage indicated for each range upon the occurrence of certain events of default provided for under the credit facility. Based on the Company’s excess availability as of September 29, 2007, the applicable interest rate margins were 0.00% for the base rate and 1.25% for the LIBOR rate on the revolver. In connection with the refinancing of the pre-vious credit facility, the Company terminated interest rate swap agreements for payments totaling $2.1 mil-lion and recorded a corresponding unrealized loss for hedging instruments in fiscal 2004 which, in accor-dance with generally accepted accounting principals (“GAAP”) was amortized and recorded as interest expense through the original termination date of the swap agreement of January 31, 2005. The Company’s ability to borrow available amounts under the revolving credit facility will be restricted or eliminated in the event of certain cove-nant breaches, events of default or if the Company is unable to make certain representations and warranties.
Financial Covenants The terms of the credit facility require the Company to maintain a Fixed Charge Coverage Ratio (as defined in the Credit Agreement) of not less than: (1) 1.10 at the end of each fiscal quarter for the twelve-month period then ended when the amount of excess availability on the revolving credit facility is less than $10.0 million and the applicable borrowing base only includes eligible receivables and inventories; or (2) 1.15 at the end of each fiscal quarter for the twelve-month period then ended when the amount of excess avail-ability on the revolving credit facility is less than $10.0 million and the applicable borrowing base includes eligible receivables, inventories, equipment and real estate. As of September 29, 2007, the Company was in compliance with all of the financial covenants under the credit facility.
Negative Covenants In addition, the terms of the credit facility restrict the Company’s ability to, among other things: engage in certain business combinations or divestitures; make investments in or loans to third parties, unless certain conditions are met with respect to such investments or loans; pay cash dividends or repurchase shares of the Company’s stock subject to certain minimum bor-rowing availability requirements; incur or assume indebtedness; issue securities; enter into certain trans-actions with affiliates of the Company; or permit liens to encumber the Company’s property and assets. As of September 29, 2007, the Company was in compli-ance with all of the negative covenants under the credit facility.
Events of Default Under the terms of the credit facility, an event of default will occur with respect to the Company upon the occurrence of, among other things: a default or breach by the Company or any of its subsidiaries under any agreement resulting in the acceleration of amounts due in excess of $500,000 under such agree-ment; certain payment defaults by the Company or any of its subsidiaries in excess of $500,000; certain events of bankruptcy or insolvency with respect to the Company; an entry of judgment against the Company or any of its subsidiaries for greater than $500,000, which amount is not covered by insurance; or a change of control of the Company.

insteel industRies, inc. and subsidiaRies 33
Amortization of capitalized financing costs asso-ciated with the senior secured facility was $498,000 in 2007, $529,000 in 2006 and $651,000 in 2005. Accumulated amortization of capitalized financing costs was $2.6 million and $2.1 million as of September 29, 2007 and September 30, 2006, respectively. The Company expects the amortization of capitalized financing costs to approximate the following amounts for the next five fiscal years:
Fiscal year In thousands
2008 $4992009 4992010 3452011 —2012 —
(5) StoCk-BaSed ComPenSation
Under the Company’s stock option plans, employ-ees and directors may be granted options to purchase shares of common stock at the fair market value on the date of the grant. Options granted under these plans generally vest over three years and expire ten years from the date of the grant. The fair value of each option award granted prior to October 1, 2005 was estimated on the date of grant using a Black-Scholes option-pricing model. With the adoption of SFAS No. 123(R), the Company determined that it would use a Monte Carlo valuation model for options that are granted subsequent to October 1, 2005. The weighted average estimated fair values of stock options granted
during 2007, 2006, and 2005 were $8.69, $8.82 and $7.74 per share, respectively, based on the following weighted average assumptions:
Year Ended
september 29, 2007
September 30, 2006
October 1, 2005
Expected term (in years) 3.16 3.20 7.00
Risk-free interest rate 4.70% 4.82% 4.14%
Expected volatility 65.84% 74.72% 180.40%
Expected dividend yield 0.65% 0.70% 0.79%
The assumptions utilized in the model are evalu-ated and revised, as necessary, to reflect market condi-tions and actual historical experience. The risk-free interest rate for periods within the contractual life of the option was based on the U.S. Treasury yield curve in effect at the time of the grant. The dividend yield was calculated based on the Company’s annual divi-dend as of the option grant date. The expected vol-atility was derived using a term structure based on historical volatility and the volatility implied by exchange-traded options on the Company’s stock. The expected term for options was based on the results of a Monte Carlo simulation model, using the model’s estimated fair value as an input to the Black-Scholes-Merton model, and then solving for the expected term.
At September 29, 2007, there were 1,340,000 shares available for future grants under the Company’s equity incentive plans. The following table summarizes stock option activity during 2005, 2006 and 2007:
Exercise Price Per ShareContractual
Term— Aggregate
(Share amounts in thousands)Options
Outstanding RangeWeighted Average
Weighted Average
Intrinsic Value(in thousands)
Outstanding at October 2, 2004 938 $ 0.18 – $ 5.43 $ 2.36 Granted 96 6.89 – 9.12 8.24 Exercised (706) 0.18 – 5.43 2.17 $4,762
Outstanding at October 1, 2005 328 0.18 – 9.12 4.48 Granted 55 15.64 – 20.26 17.54 Exercised (101) 0.18 – 9.12 3.56 1,396
Outstanding at September 30, 2006 282 0.18 – 20.26 7.37 Granted 79 17.11 – 20.27 18.54 Exercised (23) 4.56 – 15.64 7.12 228 Forfeited (2) 20.26 – 20.26 20.26
Outstanding at September 29, 2007 336 0.18 – 20.27 9.95 6.70 years 2,179
Vested and anticipated to vest in future at September 29, 2007 327 9.79 6.64 years 2,165Exercisable at September 29, 2007 196 5.41 5.08 years 1,989

34
notes to consoliDateD financial stateMents (continued)Years Ended September 29, 2007, September 30, 2006 and October 1, 2005
The remaining unrecognized compensation cost related to unvested awards at September 29, 2007 was $582,000 which is expected to be recognized over a weighted average period of 1.26 years.
Restricted stock awards. During the years ended September 29, 2007, September 30, 2006 and October 1, 2005, the Company granted 67,000, 51,000 and 82,000 shares of restricted stock, respectively, to key employees and directors which had a total market value of $1.2 million, $792,000 and $742,000, respectively, as of the grant date. The following table summarizes restricted stock activity during 2005, 2006 and 2007:
(Share amounts in thousands)
Restricted Stock Awards Outstanding
Weighted Average
Grant Date Fair Value
Balance, October 2, 2004 — $ — Granted 82 8.98 Released — —
Balance, October 1, 2005 82 8.98 Granted 51 15.64 Released (30) 8.72
Balance, September 30, 2006 103 12.27 Granted 67 18.18 Released (28) 12.51
Balance, September 29, 2007 142 15.00
The Company recorded amortization expense of $745,000, $638,000 and $234,000 pertaining to the restricted stock for the years ended September 29, 2007, September 30, 2006 and October 1, 2005, respectively. The Company will continue to amortize the remaining unamortized balance of $1.1 million over the vesting period of one to three years.
(6) inCome taxeS
The components of the provision for income taxes on continuing operations are as follows:
Year Ended
(Dollars in thousands)
september 29, 2007
September 30, 2006
October 1, 2005
Provision for income taxes: Current: Federal $10,801 $18,603 $10,457 State 1,209 2,554 1,409
12,010 21,157 11,866 Deferred: Federal 1,821 (1,437) 1,802 State 182 (190) 202
2,003 (1,627) 2,004
Income taxes $14,013 $19,530 $13,870
Effective income tax rate 36.6% 36.2% 36.1%
The reconciliation between income taxes computed at the federal statutory rate and the provision for income taxes on continuing operations is as follows:
Year Ended
(Dollars in thousands)september 29,
2007September 30,
2006October 1,
2005
Provision for income taxes at federal statutory rate $13,403 35.0% $18,867 35.0% $13,429 35.0%State income taxes, net of federal tax benefit 904 2.4 1,381 2.6 1,166 3.0Qualified production activities deduction (374) (1.0) (490) (0.9) — —Other permanent book and tax differences, net — — — — 77 0.2Stock option expense (benefit) 126 0.3 151 0.3 (575) (1.5)Valuation allowance — — (37) (0.1) (227) (0.6)Revisions to estimates based on filing of final tax return (32) (0.1) (21) (0.1) — —Other, net (14) (0.0) (321) (0.6) — —
Provision for income taxes $14,013 36.6% $19,530 36.2% $13,870 36.1%

insteel industRies, inc. and subsidiaRies 35
The components of deferred tax assets and liabili-ties are as follows:
(In thousands)september 29,
2007September 30,
2006
Deferred tax assets: Accrued expenses or asset
reserves for financial statements, not yet deductible for tax purposes $ 2,492 $ 2,440
State net operating loss carryforwards 601 944
Goodwill, amortizable for tax purposes 2,346 2,686
Defined benefit plans 1,299 — Nonqualified stock
options not deductible in current year 239 204
Valuation allowance (601) (599)
Gross deferred tax assets 6,376 5,675Deferred tax liabilities: Plant and equipment
principally due to differ-ences in depreciation and impairment charges (3,001) (1,467)
Other reserves (671) (800)
Gross deferred tax liabilities (3,672) (2,267)
Net deferred tax asset $ 2,704 $ 3,408
The Company has recorded the following amounts for deferred taxes on its consolidated balance sheets as of September 29, 2007 and September 30, 2006: a current deferred tax asset (net of valuation allowance) of $1.2 million for both years in prepaid expenses and other, and a non-current deferred tax asset (net of val-uation allowance) of $1.5 million and $2.2 million, respectively, in other assets. The Company has $9.6 million of gross state operating loss carryforwards that begin to expire in six years, but principally expire in 13–17 years. The realization of the Company’s deferred tax assets is entirely dependent upon the Company’s abil-ity to generate future taxable income in applicable jurisdictions. GAAP requires that the Company peri-odically assess the need to establish a valuation allow-ance against its deferred tax assets to the extent the Company no longer believes it is more likely than not that they will be fully utilized. As of September 29, 2007, the Company had recorded a valuation allow-ance of $601,000 pertaining to various state NOLs that were not anticipated to be utilized. The valuation allowance established by the Company is subject to
periodic review and adjustment based on changes in facts and circumstances and would be reduced should the Company utilize the state net operating loss carry-forwards against which an allowance had been pro-vided or determine that such utilization is more likely than not.
(7) diSContinued oPerationS
In April 2006, the Company decided to exit the industrial wire business with the closure of its Fredericksburg, Virginia facility which manufactured tire bead wire and other industrial wire for commer-cial and industrial applications. The Company’s deci-sion was based on the weakening in the business outlook for the facility and the expected continua-tion of difficult market conditions and reduced operat-ing levels. Manufacturing activities at the Virginia facility ceased in June 2006 and the Company is cur-rently in the process of liquidating the remaining assets of the business. The Company has determined that the exit from the industrial wire business meets the criteria of a discontinued operation in accordance with SFAS No. 144, “Accounting for the Impairment or Disposal of Long-Lived Assets.” Accordingly, the results of opera-tions and related non-recurring closure costs associated with the industrial wire business have been reported as discontinued operations for all periods presented. Additionally, the assets and liabilities of the discontin-ued operations have been segregated in the accompa-nying consolidated balance sheets. The following table summarizes the results of dis-continued operations for the years ended September 29, 2007, September 30, 2006 and October 1, 2005, respectively:
Year Ended
(In thousands)september 29,
2007September 30,
2006October 1,
2005
Net sales $ — $22,544 $36,216Earnings (loss)
before income taxes (199) (2,188) 876
Income taxes (77) 851 (330)Net earnings
(loss) (122) (1,337) 546
Included within results from discontinued opera-tions is an allocation of interest expense which was calculated based on the net assets of the industrial wire business relative to the consolidated net assets of the Company. Interest expense allocated to discontinued

36
notes to consoliDateD financial stateMents (continued)Years Ended September 29, 2007, September 30, 2006 and October 1, 2005
operations was $64,000 and $802,000 for the years ended September 30, 2006 and October 1, 2005, respectively. The net loss from discontinued operations for the year ended September 30, 2006 includes a pre-tax gain of $1.3 million on the sale of certain machinery and equipment associated with the industrial wire business. The net earnings from discontinued operations for the year ended October 1, 2005 includes a pre-tax gain of $1.3 million relating to the disposal of real estate, the collection of a note receivable, and the settlement on the release of an equipment lien associated with Insteel Construction Systems (“ICS”), a discontinued opera-tion that the Company had previously exited in 1997. Assets and liabilities of discontinued operations as of September 29, 2007 and September 30, 2006 are as follows:
(In thousands)september 29,
2007September 30,
2006
Assets:Current assets: Accounts receivable, net $ — $ 407 Prepaid expenses and other — 4
Total current assets — 411 Other assets 3,635 3,635
Total assets $3,635 $4,046
Liabilities:Current liabilities: Accounts payable $ 4 $ 25 Accrued expenses 243 618
Total current liabilities 247 643 Other liabilities 252 292
Total liabilities $ 499 $ 935
As of September 29, 2007, there was approximately $285,000 of accrued expenses and other liabilities related to ongoing lease obligations and closure-related liabilities incurred as a result of the Company’s exit from the industrial wire business.
(8) emPLoyee BeneFit PLanS
Adoption of SFAS No. 158. On September 29, 2007, the Company adopted the recognition and disclosure provisions of SFAS No. 158, “Employers’ Accounting for Defined Benefit Pension and Other Postretirement Plans.” Prior to the adoption of SFAS No. 158, the
Company accounted for its defined benefit postretire-ment plans under SFAS No. 87, “Employers’ Account-ing for Pensions” and SFAS No. 106, “Employers’ Accounting for Postretirement Benefits Other than Pensions.” SFAS No. 158 requires an employer to rec-ognize the funded status of its defined benefit plans in its statement of financial position, with a correspond-ing adjustment to accumulated other comprehensive income, net of tax. The adjustment to accumulated other comprehensive income at adoption represents the net unrecognized actuarial gains and unrecognized prior service costs which were previously netted against the funded status of the plans in the Company’s state-ment of financial position. These amounts will subse-quently be recognized as net benefit cost consistent with the Company’s historical accounting policy for amortizing such amounts. In addition, actuarial gains and losses that arise in subsequent periods and are not recognized as net periodic benefit cost in the same periods will be recognized as a component of net periodic benefit cost on the same basis as the amount recognized in accumulated other comprehensive income at the adoption of SFAS No. 158. SFAS No. 158 affects the accounting for the Company’s defined benefit pension plan and its supple-mental employee retirement plan, both of which are discussed below. The effects of adopting the provisions of SFAS No. 158 on the Company’s consolidated bal-ance sheet as of September 29, 2007 are presented in the following table. The adoption of SFAS No. 158 had no effect on the Company’s consolidated statement of operations for the year ended September 29, 2007 or for any prior period presented, and will not affect the Company’s operating results in future periods.
(In thousands)
Before Application
of SFAS No. 158 Adjustments
After Application
of SFAS No. 158
Prepaid expenses and other $5,960 $(1,320) $4,640
Deferred tax asset 1,410 1,294 2,704Other non-current
liabilities 2,779 2,083 4,862Accumulated other com-
prehensive income 9 2,110 2,119

insteel industRies, inc. and subsidiaRies 37
Retirement plans. The Company has one defined benefit pension plan, the Insteel Wire Products Company Retirement Income Plan for Hourly Employees, Wilmington, Delaware (“the Delaware Plan”). The Delaware Plan provides benefits for eligible employees based primarily upon years of service and compensation levels. The Company’s funding policy is to contribute amounts at least equal to those required by law. No contributions were made to the Delaware Plan during 2007. The Company expects to contribute $200,000 to the Delaware Plan in 2008. The reconciliation of the projected benefit obligation, plan assets, funded status of the plan and amounts recognized in the Company’s consolidated balance sheets at September 29, 2007, September 30, 2006 and October 1, 2005 is as follows:
Year Ended
(In thousands)september 29,
2007September 30,
2006October 1,
2005
Change in benefit obligation: Benefit obligation at beginning of year $ 4,527 $ 4,702 $ 4,036 Service cost 78 82 91 Interest cost 269 253 268 Actuarial loss (gain) 203 (306) 512 Distributions (642) (204) (205)
Benefit obligation at end of year $4,435 $4,527 $ 4,702
Change in plan assets: Fair value of plan assets at beginning of year $ 4,527 $3,334 $ 2,633 Actual return on plan assets 536 79 350 Employer contributions — 1,318 556 Distributions (642) (204) (205)
Fair value of plan assets at end of year $4,421 $4,527 $ 3,334
Reconciliation of funded status to net amount recognized: Funded status $ (14) $ — $(1,368) Unrecognized net loss — 1,476 1,762 Unrecognized prior service cost — 2 2
Net amount recognized $ (14) $ 1,478 $ 396
Amounts recognized in the consolidated balance sheet consist of: Current prepaid pension asset $ — $ 236 $ 396 Non-current prepaid pension asset — 1,242 — Accrued benefit liability (14) — (1,764) Intangible asset related to prior service cost — — 2 Accumulated other comprehensive loss (net of tax) 827 — 1,092
Net amount recognized $ 813 $ 1,478 $ (274)
Amounts recognized in accumulated other comprehensive income: Unrecognized net loss $1,333 Unrecognized prior service cost 1
Net amount recognized $1,334
Other changes in plan assets and benefit obligations recognized in other comprehensive income: Net gain $ (143) Amortization of prior service cost (1)
Total recognized in other comprehensive income $ (144)

38
notes to consoliDateD financial stateMents (continued)Years Ended September 29, 2007, September 30, 2006 and October 1, 2005
Net periodic pension cost includes the following components:Year Ended
(In thousands)september 29,
2007September 30,
2006October 1,
2005
Service cost $ 78 $ 82 $ 91Interest cost 269 253 268Expected return on plan assets (324) (243) (217)Amortization of prior service cost 1 1 3Recognized net actuarial loss 134 143 151
Net periodic pension cost $ 158 $ 236 $ 296
The estimated net loss and prior service cost that will be amortized from accumulated other comprehen-sive income into net periodic pension cost over the next fiscal year is $96,000 and $1,000, respectively. The assumptions used in the valuation of the plan are as follows:
Measurement Date
september 29, 2007
September 30, 2006
October 1, 2005
Assumptions at year-end:
Discount rate 6.50% 6.25% 6.00% Rate of increase
in compensa-tion levels n/a N/A N/A
Expected long- term rate of
return on assets 8.00% 8.00% 8.00%
The projected benefit payments under the plan are as follows:
Fiscal year(s) In thousands
2008 $ 4282009 4282010 4362011 4372012 2052013–2017 1,617
The Delaware Plan has a long-term target asset mix of 65% equities and 35% fixed income. The ranges for the long-term allocation are: equities 60% to 80%, fixed income 20% to 40% and cash reserves 0 to 10%. The investment strategy for equities emphasizes U.S. large cap equities with the portfolio’s performance
measured against the S&P 500 index or other applica-ble indices. The investment strategy for fixed income investments is focused on maintaining an overall port-folio with a minimum credit rating of A-1 as well as a minimum rating of any security at the time of purchase of Baa/BBB by Moody’s or Standard & Poor’s, if rated. The total fund has an expected return of 8.0% based on the overall policy allocation and historical market returns, compared to the expected long-term rate of return of 8.0% used to develop the plan’s net periodic pension cost.
Supplemental employee retirement plan. The Company has Retirement Security Agreements (each, a “SERP”) with certain of its employees (each, a “Participant”). Under the SERP, if the Participant remains in continuous service with the Company for a period of at least 30 years, the Company will pay to the Participant a supplemental retirement benefit for the 15-year period following the Participant’s retirement equal to 50% of the Participant’s highest average annual base salary for five consecutive years in the 10-year period preceding the Participant’s retirement. If the Participant retires prior to the later of age 65 or the completion of 30 years of continuous service with the Company, but has completed at least 10 years of continuous service with the Company, the amount of the supplemental retirement benefit will be reduced by 1/360th for each month short of 30 years that the Participant was employed by the Company. In 2005, the Company amended the SERP to add Participants and increase benefits to certain Participants already included in the plan.

insteel industRies, inc. and subsidiaRies 39
The reconciliation of the projected benefit obligation, plan assets, funded status of the plan and amounts recognized in the Company’s consolidated balance sheets for the SERP at September 29, 2007, September 30, 2006 and October 1, 2005 is as follows:
Year Ended
(In thousands)september 29,
2007
(Revised) September 30,
2006
(Revised) October 1,
2005
Change in benefit obligation: Benefit obligation at beginning of year $ 3,868 $ 3,574 $ 3,315 Service cost 163 106 103 Interest cost 230 207 196 Actuarial loss 11 61 — Distributions (80) (80) (40)
Benefit obligation at end of year $ 4,192 $ 3,868 $ 3,574
Change in plan assets: Actual employer contributions $ 80 $ 80 $ 40 Actual distributions (80) (80) (40)
Plan assets at fair value at end of year $ — $ — $ —
Reconciliation of funded status to net amount recognized: Funded status $(4,192) $(3,868) $ (3,574) Unrecognized net loss — 510 451 Unrecognized prior service cost — 1,588 1,815
Net amount recognized $(4,192) $ (1,770) $(1,308)
Amounts recognized in accumulated other comprehensive loss: Unrecognized prior service costs $ 2,083
Net amount recognized $ 2,083
Other changes in plan assets and benefit obligations recognized in other comprehensive loss:
Net loss $ 1 Prior service costs (227)
Total recognized in other comprehensive loss $ (226)
Net periodic pension cost includes the following components:Year Ended
(In thousands)september 29,
2007September 30,
2006October 1,
2005
Service cost $ 163 $ 106 $ 103Interest cost 230 207 196Prior service cost 227 227 227Recognized net actuarial loss 10 2 11
Net periodic pension cost $ 630 $ 542 $ 537
The estimated net loss and prior service costs that will be amortized from accumulated other comprehensive income into net periodic pension cost over the next fiscal year is $8,000 and $227,000, respectively.

40
The assumptions used in the valuation of the SERP are as follows:
Measurement Date
september 29, 2007
December 1, 2005
December 1, 2004
Assumptions at year-end: Discount rate 6.25% 5.60% 5.60% Rate of
increase in compensa-tion levels 3.00% 3.00% 3.00%
The projected benefit payments under the SERP are as follows:
Fiscal year(s) In thousands
2008 $ 802009 802010 802011 1692012 2492013–2017 1,375
As noted above, the SERP was amended in 2005 to add Participants and increase benefits to certain Participants already included in the plan. However, for certain Participants the Company still maintains the benefits of the SERP that were in effect prior to the 2005 amendment. These Participants are entitled to fixed cash benefits upon retirement at age 65, payable annually for 15 years. This plan is supported by life insurance polices on the Participants purchased and owned by the Company. The cash benefits paid under this plan were $74,000 in 2007, 2006 and 2005, respec-tively. The plan expense was $11,000 in 2007, $10,000 in 2006 and $3,000 in 2005.
Retirement savings plan. In 1996, the Company adopted the Retirement Savings Plan of Insteel Industries, Inc. (“the Plan”) to provide retirement ben-efits and stock ownership for its employees. The Plan is an amendment and restatement of the Company’s Employee Stock Ownership Plan (“ESOP”). As allowed under Sections 401(a) and 401(k) of the Internal Revenue Code, the Plan provides for tax-deferred salary deductions for eligible employees.
Employees may contribute up to 15% of their annual compensation to the Plan, limited to a maxi-mum annual amount as set periodically by the Internal Revenue Code. The Plan allows for discretionary con-tributions to be made by the Company as determined by the Board of Directors. Such contributions to the Plan are allocated among eligible participants based on their compensation relative to the total compensation of all participants. In 2007, the Company matched employee contributions up to 50% of the first 7% of eligible compensation that was contributed by employ-ees. In 2006 and 2005, the Company matched employee contributions up to 50% of the first 5% of eligible com-pensation that was contributed by employees. Company contributions to the Plan were $402,000 in 2007, $351,000 in 2006 and $265,000 in 2005.
Voluntary Employee Beneficiary Associations (“VEBA”). The Company has a VEBA. Under the plan, both employees and the Company may make contribu-tions to pay for medical costs. Company contributions to the VEBA were $2.4 million in 2007, $3.1 million in 2006 and $2.5 million in 2005. The Company is pri-marily self-insured for employee’s healthcare costs, car-rying stop-loss insurance coverage for individual claims in excess of $150,000. The Company’s self-insurance liabilities are based on the total estimated costs of claims filed and claims incurred but not reported, less amounts paid against such claims. Management reviews current and historical claims data in developing its estimates.
(9) CommitmentS and ContingenCieS
Leases and purchase commitments. The Company leases a portion of its equipment under operating leases that expire at various dates through 2010. Under most lease agreements, the Company pays insurance, taxes and maintenance. Rental expense for operating leases was $920,000 in 2007, $836,000 in 2006 and $701,000 in 2005. Minimum rental commitments under all non-cancelable leases with an initial term in excess of one year are payable as follows: 2008, $781,000; 2009, $445,000; 2010, $213,000; 2011, $27,000; 2012 and beyond, $0.
notes to consoliDateD financial stateMents (continued)Years Ended September 29, 2007, September 30, 2006 and October 1, 2005

insteel industRies, inc. and subsidiaRies 41
As of September 29, 2007, the Company had $31.8 million in non-cancelable fixed price purchase commitments for raw material extending as long as approximately 120 days. In addition, the Company has contractual commitments for the purchase of certain equipment. Portions of such contracts not completed at year-end are not reflected in the consolidated finan-cial statements and amounted to $3.8 million as of September 29, 2007.
Legal proceedings. On November 19, 2007, Dywidag Systems International, Inc. (“DSI”) filed a third-party lawsuit in the Ohio Court of Claims alleging that certain epoxy-coated strand sold by the Company to DSI in 2002, and supplied by DSI to the Ohio Department of Transportation (“ODOT”) for a bridge project, was defective. The third-party action seeks recovery of any damages which may be assessed against DSI in the action against it filed by ODOT, which allegedly could be in excess of $8.3 million, plus $2.7 million in damages allegedly incurred by DSI. The Company had previously filed a lawsuit in North Carolina against DSI seeking recovery of $1.4 million (plus interest) owed for other products sold to DSI and a judgment declaring that the Company had no liability to DSI arising out of the bridge project. The Company believes North Carolina is the appropriate venue for these proceedings and otherwise intends to vigorously defend the claims asserted against it by DSI in addition to pursuing full recovery of the amounts owed to it by DSI. The Company also is involved in other lawsuits, claims, investigations and proceedings, including com-mercial, environmental and employment matters, which arise in the ordinary course of business. The Company does not expect that the ultimate costs to resolve these matters will have a material adverse effect on its financial position, results of operations or cash flows.
Severance and change of control agreements. The Company has entered into severance agreements with its Chief Executive Officer and Chief Financial Officer that provide certain termination benefits to these executives in the event that an executive’s employment
with the Company is terminated without cause. The initial term of each agreement is two years and the agreements provide for an automatic renewal of one year unless the Company or the executive provides notice of termination as specified in the agreement. Under the terms of these agreements, in the event of termination without cause, the executives would receive termination benefits equal to one and one-half times the executive’s annual base salary in effect on the termination date and the continuation of health and welfare benefits for eighteen months. In addition, all of the executive’s stock options and restricted stock would vest immediately and outplacement services would be provided. The Company has also entered into change in control agreements with key members of management, including its executive officers, which specify the terms of separation in the event that termination of employ-ment followed a change in control of the Company. The initial term of each agreement is two years and the agreements provide for an automatic renewal of one year unless the Company or the executive provides notice of termination as specified in the agreement. The agreements do not provide assurances of contin-ued employment, nor do they specify the terms of an executive’s termination should the termination occur in the absence of a change in control. Under the terms of these agreements, in the event of termination within two years of a change of control, the Chief Executive Officer and Chief Financial Officer would receive severance benefits equal to two times base compensation, two times the average bonus for the prior three years and the continuation of health and welfare benefits for two years. The other key members of management, including the Company’s other two executive officers, would receive severance benefits equal to one times base compensation, one times the average bonus for the prior three years and the con-tinuation of health and welfare benefits for one year. In addition, all of the executive’s stock options and restricted stock would vest immediately and outplace-ment services would be provided.

42
notes to consoliDateD financial stateMents (continued)Years Ended September 29, 2007, September 30, 2006 and October 1, 2005
(10) earningS Per Share
The reconciliation of basic and diluted earnings per share (“EPS”) is as follows:Year Ended
(In thousands, except for per share amounts)september 29,
2007September 30,
2006October 1,
2005
Net earnings $24,162 $33,040 $25,045
Weighted average shares outstanding: Weighted average shares outstanding (basic) 18,142 18,307 18,656 Dilutive effect of stock-based compensation 172 166 298
Weighted average shares outstanding (diluted) 18,314 18,473 18,954
Per share (basic): Earnings from continuing operations $ 1.34 $ 1.88 $ 1.31 Earnings (loss) from discontinued operations (0.01) (0.08) 0.03
Net earnings $ 1.33 $ 1.80 $ 1.34
Per share (diluted): Earnings from continuing operations $ 1.33 $ 1.86 $ 1.29 Earnings (loss) from discontinued operations (0.01) (0.07) 0.03
Net earnings $ 1.32 $ 1.79 $ 1.32
Options to purchase 67,000 shares in 2007, 42,000 shares in 2006 and 34,000 shares in 2005 were anti-dilutive and were not included in the diluted EPS computation.
(11) BuSineSS Segment inFormation
Following the Company’s exit from the industrial wire business (see Note 7 to the consolidated financial statements), the Company’s operations are entirely focused on the manufacture and marketing of concrete reinforcing products for the concrete construction industry. Based on the criteria specified in SFAS No. 131, “Disclosures about Segments of an Enterprise and Related Information,” the Company has one reportable segment. The results of operations for the industrial wire products business have been reported as discon-tinued operations for all periods presented.
(12) reLated Party tranSaCtionS
In connection with the Company’s stock repur-chase program, on January 30, 2006, the Company repurchased approximately 400,000 shares of its com-mon stock held by the Chairman of the Company’s Board of Directors and his wife. The purchase price for the shares repurchased was $21.322 per share based on
a predetermined formula, which represented a 15% discount from the closing price on January 27, 2006. The number of shares repurchased and purchase price per share are prior to the effect of the two-for-one split of the Company’s common stock that was distributed as a stock dividend on June 16, 2006. Sales to a company affiliated with one of the Company’s directors amounted to $967,000 in 2007, $929,000 in 2006 and $701,000 in 2005. Purchases from a company affiliated with one of the Company’s directors amounted to $418,000 in 2007 and $1.5 mil-lion in 2006.
(13) ComPrehenSive LoSS
The components of accumulated other compre-hensive loss are as follows:
(In thousands)september 29,
2007September 30,
2006
Adjustment to adopt SFAS No. 158 $(2,110) $ —
Additional pension plan liability (9) —
Accumulated other compre- hensive loss $(2,119) $ —
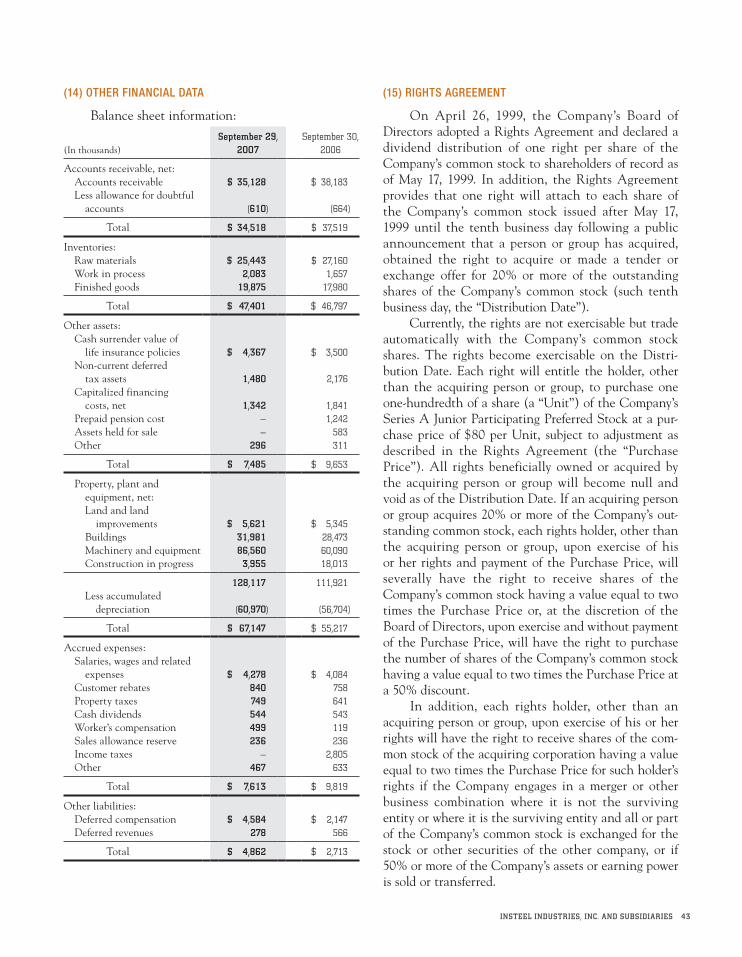
insteel industRies, inc. and subsidiaRies 43
(14) other FinanCiaL data
Balance sheet information:
(In thousands)september 29,
2007September 30,
2006
Accounts receivable, net: Accounts receivable $ 35,128 $ 38,183 Less allowance for doubtful
accounts (610) (664)
Total $ 34,518 $ 37,519
Inventories: Raw materials $ 25,443 $ 27,160 Work in process 2,083 1,657 Finished goods 19,875 17,980
Total $ 47,401 $ 46,797
Other assets: Cash surrender value of
life insurance policies $ 4,367 $ 3,500 Non-current deferred
tax assets 1,480 2,176 Capitalized financing
costs, net 1,342 1,841 Prepaid pension cost — 1,242 Assets held for sale — 583 Other 296 311
Total $ 7,485 $ 9,653
Property, plant and equipment, net:
Land and land improvements $ 5,621 $ 5,345
Buildings 31,981 28,473 Machinery and equipment 86,560 60,090 Construction in progress 3,955 18,013
128,117 111,921 Less accumulated
depreciation (60,970) (56,704)
Total $ 67,147 $ 55,217
Accrued expenses: Salaries, wages and related
expenses $ 4,278 $ 4,084 Customer rebates 840 758 Property taxes 749 641 Cash dividends 544 543 Worker’s compensation 499 119 Sales allowance reserve 236 236 Income taxes — 2,805 Other 467 633
Total $ 7,613 $ 9,819
Other liabilities: Deferred compensation $ 4,584 $ 2,147 Deferred revenues 278 566
Total $ 4,862 $ 2,713
(15) rightS agreement
On April 26, 1999, the Company’s Board of Directors adopted a Rights Agreement and declared a dividend distribution of one right per share of the Company’s common stock to shareholders of record as of May 17, 1999. In addition, the Rights Agreement provides that one right will attach to each share of the Company’s common stock issued after May 17, 1999 until the tenth business day following a public announcement that a person or group has acquired, obtained the right to acquire or made a tender or exchange offer for 20% or more of the outstanding shares of the Company’s common stock (such tenth business day, the “Distribution Date”). Currently, the rights are not exercisable but trade automatically with the Company’s common stock shares. The rights become exercisable on the Distri-bution Date. Each right will entitle the holder, other than the acquiring person or group, to purchase one one-hundredth of a share (a “Unit”) of the Company’s Series A Junior Participating Preferred Stock at a pur-chase price of $80 per Unit, subject to adjustment as described in the Rights Agreement (the “Purchase Price”). All rights beneficially owned or acquired by the acquiring person or group will become null and void as of the Distribution Date. If an acquiring person or group acquires 20% or more of the Company’s out-standing common stock, each rights holder, other than the acquiring person or group, upon exercise of his or her rights and payment of the Purchase Price, will severally have the right to receive shares of the Company’s common stock having a value equal to two times the Purchase Price or, at the discretion of the Board of Directors, upon exercise and without payment of the Purchase Price, will have the right to purchase the number of shares of the Company’s common stock having a value equal to two times the Purchase Price at a 50% discount. In addition, each rights holder, other than an acquiring person or group, upon exercise of his or her rights will have the right to receive shares of the com-mon stock of the acquiring corporation having a value equal to two times the Purchase Price for such holder’s rights if the Company engages in a merger or other business combination where it is not the surviving entity or where it is the surviving entity and all or part of the Company’s common stock is exchanged for the stock or other securities of the other company, or if 50% or more of the Company’s assets or earning power is sold or transferred.

44
The rights will expire on April 26, 2009, and may be redeemed by the Company at any time prior to the Distribution Date at a price of $0.01 per right.
(16) ProduCt warrantieS
The Company’s products are used in applications which are subject to inherent risks including perfor-mance deficiencies, personal injury, property damage,
environmental contamination or loss of production. The Company warrants its products to meet certain specifications and actual or claimed deficiencies from these specifications may give rise to claims. The Company does not maintain a reserve for warranties as the historical claims have been immaterial. The Company maintains product liability insurance cover-age to minimize its exposure to such risks.
notes to consoliDateD financial stateMents (continued)Years Ended September 29, 2007, September 30, 2006 and October 1, 2005
totaL return to SharehoLderS
The following graph compares the total returns (including the reinvestment of dividends) of the Company, the S&P 500 Index and the S&P Building Products Index. The graph assumes $100 invested on September 28, 2002 in the Company’s stock and September 30, 2002 in each of the indices. Total returns for the indices are calculated on a month-end basis.
(In dollars) 9/28/02 9/27/03 10/2/04 10/1/05 9/30/06 9/29/07
Insteel Industries 100.00 110.29 2,136.62 2,267.65 5,938.86 4,619.25S&P 500 100.00 124.40 141.65 159.01 176.17 205.13S&P Building Products 100.00 130.00 184.61 186.79 171.61 172.86
stock peRfoRMance gRapH
0
1,000
9/28/02 9/27/03
Insteel IndustriesS&P 500S&P Building Products
10/2/04 10/1/05 9/30/06 9/29/07
2,000
3,000
4,000
5,000
$6,000
0
1,000
2,000
3,000
4,000
5,000
6,000

insteel industRies, inc. and subsidiaRies 45
Quarter ended
(In thousands, except for per share and price data) december 30 March 31 June 30 september 29
2007Operating results: Net sales $69,716 $74,766 $ 78,966 $74,358 Gross profit 13,624 12,358 17,352 12,727 Earnings from continuing operations 5,931 4,944 8,344 5,065 Earnings (loss) from discontinued operations (152) (31) (37) 98 Net earnings 5,779 4,913 8,307 5,163Per share data:Basic: Earnings from continuing operations 0.33 0.27 0.46 0.28 Earnings (loss) from discontinued operations (0.01) — — — Net earnings 0.32 0.27 0.46 0.28Diluted: Earnings from continuing operations 0.32 0.27 0.46 0.28 Earnings (loss) from discontinued operations — — (0.01) — Net earnings 0.32 0.27 0.45 0.28Stock prices(1)
High 21.97 19.06 19.66 23.00 Low 16.58 15.89 16.43 15.35Cash dividends declared 0.03 0.03 0.03 0.03
Quarter Ended
December 31 April 1 July 1 September 30
2006Operating results: Net sales $ 75,604 $ 79,776 $ 91,644 $ 82,483 Gross profit 17,113 16,979 18,486 18,293 Earnings from continuing operations 8,013 7,845 9,066 9,453 Earnings (loss) from discontinued operations (335) (444) (1,184) 626 Net earnings 7,678 7,401 7,882 10,079Per share data:Basic: Earnings from continuing operations 0.43 0.43 0.50 0.52 Earnings (loss) from discontinued operations (0.02) (0.02) (0.07) 0.04 Net earnings 0.41 0.41 0.43 0.56Diluted: Earnings from continuing operations 0.42 0.42 0.50 0.52 Earnings (loss) from discontinued operations (0.02) (0.02) (0.07) 0.03 Net earnings 0.40 0.40 0.43 0.55Stock prices(1)
High 8.68 29.70 30.00 24.85 Low 6.89 8.13 18.77 16.33Cash dividends declared 0.03 0.03 0.03 0.03
(1) Prices adjusted to reflect 2-for-1 stock split on June 16, 2006.
financial infoRMation By QuaRteR (unauDiteD)

46
Year Ended
(In thousands, except for per share amounts)
(52 weeks) september 29,
2007
(52 weeks) September 30,
2006
(52 weeks) October 1,
2005
(53 weeks) October 2,
2004
(52 weeks) September 27,
2003
Operating Results:Net sales $ 297,806 $ 329,507 $309,320 $ 298,754 $184,868Gross profit 56,061 70,871 57,898 78,956 19,632 % of net sales 18.8% 21.5% 18.7% 26.4% 10.6%Selling, general and administrative expense $ 17,583 $ 16,996 $ 16,175 $ 21,194 $ 11,165Interest expense 592 669 3,427 5,832 4,126Earnings from continuing operations 24,284 34,377 24,499 32,035 9,512 % of net sales 8.2% 10.4% 7.9% 10.7% 5.1%Earnings (loss) from discontinued operations $ (122) $ (1,337) $ 546 $ (546) $ (2,790)Net earnings 24,162 33,040 25,045 31,489 6,722
Per Share Data:Per share (basic): Earnings from continuing operations $ 1.34 $ 1.88 $ 1.31 $ 1.85 $ 0.56 Earnings (loss) from discontinued
operations (0.01) (0.08) 0.03 (0.03) (0.16) Net earnings 1.33 1.80 1.34 1.82 0.40Per share (diluted): Earnings from continuing operations 1.33 1.86 1.29 1.78 0.55 Earnings (loss) from discontinued
operations (0.01) (0.07) 0.03 (0.03) (0.16) Net earnings 1.32 1.79 1.32 1.75 0.39Cash dividends declared 0.12 0.12 0.06 — —
Returns:Return on capital(1) 18.2% 29.7% 21.1% 28.6% 9.7%Return on equity(2) 18.2% 31.3% 29.1% 62.5% 34.8%
Financial Position:Total assets $173,529 $166,596 $ 138,276 $151,291 $132,930Total long-term debt — — 11,860 52,368 69,453Shareholders’ equity 143,850 122,438 97,036 71,211 31,272
Cash Flows:Net cash provided by operating activities $ 16,918 $ 44,835 $ 44,460 $ 28,122 $ 5,290Capital expenditures 17,013 18,959 6,302 2,921 933Depreciation and amortization 6,209 5,108 5,627 6,209 5,143Repurchase of common stock — 8,529 — — —Cash dividends paid 2,176 2,222 566 — —
Other Data:Number of employees at year-end 559 621 655 669 677
(1) Earnings from continuing operations/(average total long-term debt + average shareholders’ equity).(2) Earnings from continuing operations/(average shareholders’ equity).
selecteD financial Data—fiVe-yeaR HistoRy

de
sig
ned
by
curr
an &
co
nno
rs, i
nc. /
ww
w.c
urra
n-c
onn
ors
.co
m
Board of directors
louis e. hannen(1)
Retired Senior Vice President Wheat, First Securities, Inc.
Charles B. Newsome(2)
Executive Vice President Johnson Concrete Company
gary l. Pechota(1)
Retired Chairman, President and Chief Executive Officer Giant Cement Holding, Inc.
W. allen rogers II(1)
Principal Ewing Capital Partners, LLC
William J. Shields(2)
Retired Chairman and Chief Executive Officer Co-Steel, Inc.
C. richard Vaughn(2,3)
Chairman John S. Clark Company, Inc.
howard o. Woltz, Jr.(3)
Chairman of the Board Insteel Industries, Inc.
h.o. Woltz III(3)
President and Chief Executive Officer Insteel Industries, Inc.
(1) Member of the Audit Committee(2) Member of the Executive Compensation
Committee(3) Member of the Executive Committee
executive officers
h.o. Woltz IIIPresident and Chief Executive Officer
michael C. gazmarianVice President, Chief Financial Officer and Treasurer
James f. PetelleVice President—Administration and Secretary
richard t. WagnerVice President and General Manager—Insteel Wire Products Company
shareholder information
corporate headquarters1373 Boggs Drive Mount Airy, North Carolina 27030-2148 (336) 786-2141
independent Public accountantsGrant Thornton LLP Greensboro, North Carolina
annual meetingInsteel shareholders are invited to attend our annual meeting which will be held at 10:00 A.M. on Tuesday, February 19, 2008, at the Cross Creek Country Club, 845 Greenhill Road, Mount Airy, North Carolina.
common stockThe Common Stock of Insteel Industries, Inc. is traded on the NASDAQ Global Select Market under the symbol IIIN. At November 27, 2007, there were 1,142 shareholders of record.
shareholder servicesFor change of name, address, ownership of stock; to replace lost stock certificates; or to consolidate accounts, please contact:
American Stock Transfer & Trust Company 59 Maiden Lane New York, New York 10038 (866) 627-2704 www.amstock.com
investor relationsFor information on the Company, additional copies of this report, Form 10-K, or other financial infor-mation, contact Michael C. Gazmarian, Vice President, Chief Financial Officer and Treasurer, at the Company’s head-quarters. You may also visit the Investor Information section on the Company’s Web site at www.investor.insteel.com.
corporAte InForMAtIon

Insteel IndustrIes, Inc.1373 Boggs Drive, Mount Airy, North Carolina 27030-2148 phone (336) 786-2141 www.insteel.com
ListeD oN uNDer the syMBoL “IIIN”