Embed Size (px)
Citation preview
Instantaneous EEG coherence analysis during the Stroop task
B. Schacka,*, A.C.N. Chenb, S. Meschaa, H. Wittea
aInstitute of Medical Statistics, Computer Science and Documentation, University of Jena, Jahnstraza 3, D-07740 Jena, GermanybHuman Brain Mapping and Cortical Imaging Laboratory, Centre for Sensory-Motor Interaction, Aalborg University, Aalborg, DK 9220, Denmark
Accepted 19 April 1999
Abstract
Objective: In the present study the Stroop effect is analyzed by means of EEG coherence analysis in addition to traditional analysis of
behavioral data (reaction time) and ERP analysis. Data from 10 normal subjects are examined.
Methods: In particular, a special dynamic approach for a continuous coherence estimation is applied to investigate the procedural
evolution of functional cortical relationships during the Stroop task.
Results: The frequency band of 13±20 Hz is found to be sensitive to the discrimination between the congruent and the incongruent task
conditions on the basis of instantaneous coherence analysis. The magnitude of coherence values within the time interval of late potentials and
the maximal coherence values are used to assess the strength of interaction between distinct areas of the cortex. Higher coherences are
observed within the left frontal and left parietal areas, as well as between them for the incongruent situation in comparison with the congruent
situation. Furthermore, the time-points of maximal coherence allows a procedural discrimination between both situations. The peak
synchrony described by the time-points of maximal coherence correlates strongly with the reaction times mainly within the frontal area
and between fronto-parietal areas in the incongruent case, whereas this correlation is restricted to the right hemisphere in the congruent case.
q 1999 Elsevier Science Ireland Ltd. All rights reserved.
Keywords: Stroop task; Frontal and parietal area of the cortex; Hemispheres; Event-related potentials; Instantaneous EEG coherence
1. Introduction
In the Stroop color-word task subjects are confronted
with words written in different colors and are asked to
name the colors as quickly as possible while ignoring the
words themselves. In the standard version of the task Stroop
(1935) the words are color names and are written in
incongruent colors (e.g. the word RED written in blue
ink).
The interference of the word with color-naming is a reli-
able phenomenon. Not only is response time longer but the
errors in naming are more numerous. The fact that word-
reading is generally faster than color-naming in non-
con¯ict, i.e. congruent situations, suggests an explanation
of what is happening, namely that the stronger habit of read-
ing words is dif®cult to suppress and must be inhibited
before the color-naming response can be made.
Depending on the hypothesized locus of the Stroop effect,
three classes of explanations can be distinguished.
1. Hock and Egeth (1970) suggest that the color-word
disrupts the identi®cation of the color by diverting atten-
tion from it. This `distraction effect' is largest for words
semantically related to the color-naming task because the
subjects are sensitized to them. The most important
objection against this perceptual-encoding hypothesis is
that it cannot explain why the congruent stimuli do not
cause interference although the semantic similarity
between word and color is maximal.
2. The response-competition hypothesis of the Stroop
phenomenon (Morton, 1969; Keele, 1972; Warren,
1972; Posner and Snyder, 1975) states that word and
color are processed in a parallel manner until their
motor programs are activated. As only the program that
corresponds to the relevant stimulus dimensions is
admitted to response execution, the program that corre-
sponds to the irrelevant stimulus dimension must be
prevented from gaining control over the overt response.
There is no con¯ict when congruent stimuli are to be
named or read, because both stimulus components acti-
vate the same response program. Neither does reading
incongruent stimuli provide a problem as the relevant
motor program reaches the execution stage before the
Clinical Neurophysiology 110 (1999) 1410±1426
CLINPH 986061388-2457/99/$ - see front matter q 1999 Elsevier Science Ireland Ltd. All rights reserved.
PII: S1388-2457(99)00111-X
* Corresponding author. Tel.: 1 49-3641-9-33651; fax: 1 49-3641-9-
33200.
E-mail address: [email protected] (B. Schack)

irrelevant one does. If, on the other hand, incongruent
stimuli have to be named, the irrelevant motor code
arrive at the response execution stage before the relevant
one does. The delay in reaction time and the other beha-
vioral signs of a con¯ict are explained as a consequence
of the subject's dif®culty in suppressing the ®rst and
executing the second of two articulatory codes that arrive
at the response execution stage in close succession.
3. Contradicting this view, however, are experimental ®nd-
ings that suggest that the main con¯ict occurs at an
earlier stage when the color information makes contact
with semantic memory after perceptual encoding. These
results support a semantic-encoding hypothesis as
proposed bySeymour, 1974,1977). The simultaneous
activation of two distinct semantic codes that are closely
related leads to an ambiguity that must be resolved
before further processing. The Stroop phenomenon is
an indication of the extra processing time needed to
delete the irrelevant code. Processing congruent stimuli
causes no response delay because both components of the
stimulus activate the same semantic code.
All three explanations are related to the observation of
longer reaction time due to the Stroop effect. This beha-
vioral parameter indicates different information processes
with regard to their time evolution in incongruent and
congruent cases.
In order to connect the time information simultaneously
with the topographic information, the event-related poten-
tials method has been proposed for studying the Stroop
effect. The P3 latency and the level of negativity of late
potentials in particular were examined in order to investi-
gate the locus of interference in the Stroop task. Differences
with regard to the Stroop effect were found mainly for the
parietal electrode positions (Warren and Marsch, 1979;
Czigler and Csibra 1991; Soininen et al., 1995). Further,
EEG power for different frequency bands of the frontal
and parietal regions were implicated in these examinations
(Hasenfratz and BaÈttig 1992; Willis et al., 1996; West and
Bell, 1997). Hasenfratz and BaÈttig (1992) found a signi®-
cant in¯uence of smoking and caffeine on the Stroop effect
primarily for increased Beta-power (12±25 Hz) for the elec-
trodes P3 and P4. West and Bell (1997) observed an
increased Alpha1-power (8±10 Hz) within the prefrontal
and parietal areas and assumed an interaction between
prefrontal and parietal regions.
In order to get topological information about the Stroop
effect, modern imaging methods such as PET and fMRI
have been applied during the Stroop task. The neuroimaging
studies indicated that the prefrontal cortex is closely
involved in the performance of the Stroop task (see e.g.
Bench et al., 1993). In medical approaches functional
imaging techniques have been increasingly used for explor-
ing the relationship between brain activity and particular
psychological functions (in normal volunteers) or symptoms
(in psychiatric patients). Resting-state studies in patients
with depression, in whom attentional de®cits are common,
have identi®ed cingulate abnormalities (Bench et al., 1993;
Taylor et al., 1994). Furthermore, abnormalities in Stroop
test performance have frequently been used to indicate fron-
tal dysfunctions in patients without clear focal frontal
lesions, for instance on the basis of MRI measurements
(Vrendell et al., 1995).
The three different approaches ± analysis of behavioral
data, ERP-analysis and neuroimaging techniques ± serve the
examination of the Stroop task, either for the time behavior
of this information process or for the location within the
cortex area. An investigation of the functional relationship
between different areas of the cortex is not possible on the
basis of these methods.
The aim of this study is the detection of interaction
processes of different brain instances during the Stroop
task in relation to the time-evolution of the cognitive
process on the basis of instantaneous coherence analysis.
Interactions are expected within and between the left frontal
and parietal topographic areas due to the fact that frontal
areas are strongly implicated in the execution of frontal
functions, such as planning and response selection, and,
further, left parietal area may also be implicated since the
Stroop task utilizes color-word perception and retrieval of
semantic memory.
First, the Stroop effect will be examined with regard to
the reaction time and ERP to show comparability with prior
behavioral and EEG studies.
The aims, with respect to the coherence analysis, are as
follows:
1. First of all, the existence of a frequency band for the
discrimination between the two task-situations by
means of the coherence has to be considered with regard
to frontal and parietal topographic areas,
2. Further, starting from the results of the ERP analysis with
regard to late potentials, the interactions of different
topographic areas of the cortex during the second half
of the task (400 ms by the end of the task) will be inves-
tigated by means of calculating the values of coherence
of the sensitive frequency band in order to examine the
Stroop effect.
3. The question of a correlation between the reaction time
as an external parameter and the time of maximal inter-
action (described by the time-point of maximal coher-
ence) as an internal parameter of the information process
during the Stroop task arises. A high correlation between
these two time parameters would indicate interaction
processes as characteristic events associated with the
Stroop task.
4. Topographic differences between congruent and incon-
gruent task-situations will be analyzed with regard to the
strength of the correlation between reaction time and the
time-point of maximal coherence and the strength of
interaction described by the maximal coherence.
B. Schack et al. / Clinical Neurophysiology 110 (1999) 1410±1426 1411

2. Materials and methods
2.1. Subjects
Ten, healthy right-handed male undergraduate and grad-
uate student volunteers (aged 20±30) participated in the
study. Each subject was free from neurological or psychia-
tric disorders, had a normal EEG, and gave his written
informed consent to take part in the project in accordance
with the Helsinki Declaration. None of the subjects was
familiar with the aims of the research work.
2.2. EEG session
The EEG was recorded from the scalp by means of a 19
non-polarizable Ag±AgCl electrode-cap using the Neuro
Scan Medical System (10/20-Systems, Impedance ,5
KV , sampling frequency at 250 Hz, bandpass of 0.1±50
Hz, 16 bit resolution). Simultaneously the electrooculogram
(EOG) was recorded on one additional channel. EOG arti-
facts were selected by correlation analysis between the EOG
and the EEG, as well as by visual control. Only trials with-
out artifacts were included in further data-processing.
In order to ensure the comparability with the results of
other EEG studies of the Stroop task the unipolar derivation
with linked ear-lobes as reference was used (e.g. Warren
and Marsch, 1979; Czigler and Csibra, 1991; Hasenfratz
and BaÈttig 1992).
2.3. Task design
The subject sits in front of a 17 00 computer screen, where
color words are presented written in ink of different colors.
The task-order of congruent cases, such as the word `red'
written in red ink, and incongruent cases, such as the word
`red' written in blue ink, was random. The subject has to
name the color as quickly as possible. The number of tasks
was 21 for the congruent case and 29 for the incongruent
case. The answers were recorded with a microphone
continuously in time in order to detect erroneous answers
and to register the reaction time (RT).
2.4. Methods
In addition to the procedural investigation by means of
event-related potentials, an adaptive estimation method of
the coherence function is used which allows a high time and
frequency resolution. This general method of estimating
instantaneous coherence was developed in Schack et al.
(1995). The basic idea of the method is as follows: a pair
of EEG channels is understood as a two-dimensional insta-
tionary signal process. This process is modeled as a two-
dimensional autoregressive moving-average model with
time-dependent parameters. The optimization criterion for
adapting parameters is the minimization of the prediction
error of the model in the least mean square sense. The
correction of the model according to this criterion is
performed at every sample point. Thus, the parameters of
the model are functions of time and allow the parametric
calculation of the momentary spectral density matrix of the
ARMA model, which approximates the spectral density
matrix of the underlying pair of EEG channels for the
momentary time-point. Subsequently, the continuous esti-
mation of the coherence is derived from the momentary
B. Schack et al. / Clinical Neurophysiology 110 (1999) 1410±14261412
Fig. 1. ERP (in mV) of the Stroop task for incongruent (bold curves) and congruent (thin curves) situations for the frontal electrode positions F3, F4 (upper
panels), for the fronto- and parieto-central electrode positions Fz and Pz (middle panels) and for the parietal electrode positions P3 and P4 (panels below).

spectral density matrix of the ®tted ARMA model. Although
the correction will be performed at every sample point, a
smearing of the time evolution of the coherence estimation
cannot be prevented. The continuous coherence estimation
depends on the past with an exponentially decreasing
memory. Nevertheless, the time resolution is much higher
than that for estimation methods on the basis of the Fourier
transformation. The interested reader can ®nd the detailed
estimation procedure in Schack (1999); Schack et al.
(1999a) and a short description in the Appendix. This
approach allows the time-dependent calculation of the full
coherence spectrum and therefore the prede®nition of a
sensitive frequency band for the investigation of the infor-
mation processing considered.
The coherence analysis was performed for 30 adjacent
electrode pairs in the longitudinal and transversal directions
± so-called local coherences ± and additionally for 9 fronto-
parietal electrode pairs F3/P3, F3/Pz, F3/P4, Fz/P3, Fz/Pz,
Fz/P4, F4/P3, F4/Pz and F4/P4. For a topographic presenta-
tion of local synchronization processes the mapping proce-
dure for local coherences was used (Rappelsberger and
Petsche, 1988). With this aim, ®ctive coherence positions
were placed in the middle of the 30 adjacent electrode pairs
considered. The linear interpolation procedure led to the
local coherence map.
3. Results
3.1. Behavioral data
The well-known Stroop effect for the reaction times could
be veri®ed in our examination. The mean reaction times and
the correspondent standard deviations of 10 subjects were,
for the incongruent task, 793 ms (109 ms SD) and for the
congruent task 708 ms (114 ms SD) Thus, the mean duration
of the incongruent task was 85 ms longer than the duration
of the congruent task. This difference in reaction time is
signi®cantly high (paired samples t test at the signi®cance
level of 1%).
3.2. Event-related potentials
Fig. 1 shows the event-related potentials for selected elec-
trode positions within the frontal and parietal area. Differ-
ences appear for the late potentials 400-600 ms after the
presentation of the word in the parietal regions (see Fig. 1).
B. Schack et al. / Clinical Neurophysiology 110 (1999) 1410±1426 1413
Fig. 2. Time-frequency-analyses of instantaneous coherence of the electrode pair F3/Pz for the incongruent (upper left panel) and congruent (upper right panel)
situations. In the lower left panel the difference (incongruent-congruent) between them is illustrated. The lower right panel shows the time course of the
difference between the band coherences (incongruent-congruent) for the frequency band 13±20 Hz. The average of the time-frequency-matrices and the band
coherences was performed for all single trials and all 10 subjects.

For a statistical validation, the mean values of the ERP for
the time interval 450±550 ms were calculated for all elec-
trode positions. The one-way ANOVA for all 19 electrode
positions with the factor discriminating between the congru-
ent and incongruent cases resulted in signi®cant differences
(signi®cance level of 5%) for the electrode positions C3, C4,
T5, P3, Pz, P4, T6, O1 and O2. No differences appear within
the frontal area.
3.3. Coherence analysis
3.3.1. Choice of a sensitive frequency band for the
discrimination between the two task situations
Given our hypotheses, differences in topography of
coherence values between the congruent and the incongru-
ent task will be searched primarily within the left frontal and
within the left parietal area and also between the frontal and
parietal areas.
In order to determine a sensitive frequency band in this
regard mean time-coherence-analyses according to equation
(Eq. (10)) in the Appendix were performed for the electrode
pairs Fp1/F7, Fp1/F3, F7/F3, F3/Fz and F3/C3 within the
left frontal area, for the electrode pairs Fp2/F8, Fp2/F4, F8/
F4, F4/Fz and F4/C4 within the right frontal area, for the
electrode pairs P3/C3, P3/Pz, P3/T5, P3/O1 and T5/O1
within the left parieto-temporal area, for the electrode
pairs P4/C4, P4/Pz, P4/T6, P4/O2 and T6/O2 within the
right parieto-temporal area and for the fronto-parietal elec-
trode pairs F3/P3, F3/Pz, F4/P4 and F4/Pz.
The mean time-frequency-matrices of coherence were
calculated for all 10 subjects and both task conditions.
Afterwards, the difference (incongruent minus congruent
situation) of the mean matrices was taken to ®nd frequency
bands with the highest differences. Fig. 2 shows these 3
mean matrices (incongruent case, congruent case and their
difference) for the fronto-parietal electrode pair F3/Pz.
High coherences appear during the whole task for lower
(,10 Hz) frequencies for both conditions. At the end of the
B. Schack et al. / Clinical Neurophysiology 110 (1999) 1410±14261414
Fig. 3. Mean time courses of band coherences (in ms) of the incongruent (bold curves) and the congruent (thin curves) situations for the frequency bands 1.5±4,
4±8, 8±13, 13±20, 20±25, 25±35 and 35±45 Hz for the electrode pair F3/Pz. The thin vertical line denotes the mean reaction time for the congruent situation
(708 ms), the thick vertical line denotes the mean reaction time for the incongruent situation (793 ms).

task, an increase of the coherences may be seen especially
around 30 and 40 Hz, again for both task conditions. For the
time interval 400±700 ms, the highest differences between
the two situations appear within the frequency band 13±20
Hz. On the right lower panel, the time course of the differ-
ence in band coherences (calculated according to Eq. 11 in
the Appendix) for this frequency band is illustrated. There is
a clear positive difference, approximately within the time
interval from 300 ms by the end of the task.
For an objective rating of the sensitivity of different
frequency bands, the mean time course (average for all 10
subjects) of band coherences for standard frequency bands
and additional bands including the 30 Hz and 40Hz compo-
nents were calculated according to Eqs. 10 and 11 in the
Appendix for both congruent and incongruent situations.
Fig. 3 shows these time courses of band coherences for
the electrode pair F3/Pz.
The highest differences between both situations within
the time interval, from 400 ms by the end of the task, appear
within the frequency band 13-20 Hz. An increase of higher
frequency band coherences (especially 25±35 Hz and 35±45
Hz) may be observed at the end of the task. Thereby, coher-
ences increase earlier in the case of congruent situations
than for incongruent situations. This phenomenon possibly
could be explained by the smaller task duration and the
earlier preparation on speech in the congruent case. The
time-delay of these band coherences reaching a level
between 0.45±0.5, seems to be the same as the time-delay
in reaction times.
The observations described concern the coherences for
one electrode pair, namely F3/Pz. Fig. 4 shows that they
are valid for frontal and parietal areas of the left hemisphere.
In Fig. 4 the mean time courses of band coherences aver-
aged over the electrode pairs Fp1/F3, Fp1/F7, F7/F3, F3/Fz,
F3/P3, F3/Pz, P3/Pz of the left hemisphere are represented.
Because of averaging the curves are smoother. But, the
B. Schack et al. / Clinical Neurophysiology 110 (1999) 1410±1426 1415
Fig. 4. Mean time courses of band coherences (in ms) of the incongruent (bold curves) and the congruent (thin curves) situations for the frequency bands 1.5±4,
4±8, 8±13, 13±20, 20±25, 25±35 and 35±45Hz averaged over the electrode pairs Fp1/F3, Fp1/F7, F7/F3, F3/Fz, F3/P3, F3/Pz, P3/Pz. The thin vertical line
denotes the mean reaction time for the congruent situation (708 ms), the thick vertical line denotes the mean reaction time for the incongruent situation (793
ms).

same effects may be observed here as they were for the
single electrode pair F3/Pz. The highest difference of coher-
ences between the incongruent and the congruent situation
is visible within the frequency band 13±20 Hz.
We get a different picture for coherences of electrode
pairs of the right hemisphere. In Fig. 5, the mean time
courses of band coherences averaged over the electrode
pairs Fp2/F4, Fp2/F8, F8/F4, F4/Fz, F4/P4, F4/Pz, P4/Pz
of the right hemisphere are selected.
In contrast to the effect of the left hemisphere, the coher-
ences are slightly higher in the congruent case for the
frequency band 13±20 Hz (and also for the frequency
band 35±45 Hz). The Stroop effect seems to be expressed
as a lateralization effect of the synchronization phenomenon
described by the coherence of the frequency band 13±20 Hz.
The investigation of averaged band coherences with
regard to the discrimination between the two task situations
indicate the frequency band of 13±20 Hz. For this reason,
the frequency band of 13±20 Hz was chosen and ®xed for
further detailed statistical investigations.
3.3.2. Coherences within the time interval of late potentials
The local coherence mapping procedure was used to give
a topographical overview of differences between local
coherences in the incongruent and congruent situations.
The continuous estimation procedure results from the
sampling frequency of 250 Hz in a time resolution for
instantaneous coherence of 4 ms. Therefore, it is possible
to produce local coherence maps for every 4 ms. Fig. 6
shows the difference sequence of local instantaneous coher-
ence maps with a time resolution of 20 ms (every 5 succes-
sive maps are averaged).
Starting with approximately 400 ms, strong positivity of
B. Schack et al. / Clinical Neurophysiology 110 (1999) 1410±14261416
Fig. 5. Mean time courses of band coherences (in ms) of the incongruent (bold curves) and the congruent (thin curves) situations for the frequency bands 1.5±4,
4±8, 8±13, 13±20, 20±25, 25±35 and 35±45 Hz averaged over the electrode pairs Fp2/F4, Fp2/F8, F8/F4, F4/Fz, F4/P4, F4/Pz, P4/Pz. The thin vertical line
denotes the mean reaction time for the congruent situation (708 ms), the thick vertical line denotes the mean reaction time for the incongruent situation (793
ms).

difference may be observed within the left frontal area and
slight positivity of difference within the left parietal area.
In order to concentrate on electrode pairs of the frontal
and parietal regions which are of special interest in our
hypotheses testing the electrode pairs Fp1/F7, Fp1/F3, F7/
F3, F3/Fz, Fp2/F8, Fp2/F4, F8/F4, F4/Fz, F3/Pz, F4/Pz, P3/
Pz and P4/Pz were selected to illustrate the mean time
course of coherences. Thereby, the instantaneous band
coherences (13±20 Hz) of the left frontal area Fp1/F7,
Fp1/F3, F7/F3 and F3/Fz and of the right frontal area Fp2/
F8, Fp2/F4, F8/F4 and F4/Fz were averaged over the corre-
spondent regions. The global effect of higher local coher-
ences (13±20 Hz) within the left frontal area for the
incongruent situation in comparison with the congruent
situation is depicted in Fig. 8, where the differences (incon-
gruent minus congruent situation), sample point by sample
point, are shown.
For the averaged coherences of the electrode pairs Fp1/F7,
Fp1/F3, F7/F3 and F3/Fz within the left frontal area obvious
higher positive differences appear within the left frontal area
within the time interval 400 ms by the end
of the task. This fact is completed by the higher fronto-parie-
tal coherence F3/Pz within the same time interval for the
incongruent case. For P3/Pz, positive differences also appear.
There are no obvious differences between the two task
conditions within the right frontal and parietal areas. In
contrast to the positivity of the difference for the left
fronto-parietal coherence F3/Pz we have a negative differ-
ence for the right fronto-parietal coherence F4/Pz.
For statistical veri®cation, the mean coherences for the
time interval from 400 ms after the stimulus by the end of
the task were calculated for each subject (individual reac-
tion times varied from 600±900 ms). Mean values of coher-
ences for selected electrode pairs for both task conditions
are listed in Table 1.
Afterwards, Fisher's z-transformation was applied to
coherence values in order to enforce normality. Univariate
t tests for paired samples provided signi®cant differences of
coherences between incongruent and congruent task situa-
tions mainly for electrode pairs of the left hemisphere (signif-
icance level of 5%). But, the execution of multiple statistical
univariate tests may increase the possibility to obtain signi®-
cance results by chance alone for alpha in¯ation. Therefore,
the performance of multivariate tests is necessary.
Classical multivariate signi®cance tests often are not
feasible if the number of variables is greater than the
number of observations. Thus, from the ANOVA no signif-
icant differences were obtained. Because of the high dimen-
sionality Bonferroni or Holm correction was not suitable
ditto. Therefore, a parametric test for multivariate data
(Standardized Sum Test, SS test) was used (LaÈuter, 1996;
LaÈuter et al., 1996).
B. Schack et al. / Clinical Neurophysiology 110 (1999) 1410±1426 1417
Fig. 6. Mean difference sequence (incongruent - congruent) of local coherence maps for ten subjects. The mean task-ends are denoted by end con. and end inc.,
respectively. The results showed higher local coherences for the incongruent task in the left frontal and left temporo-visual areas; in contrast, for the congruent
task in the right parietal area.
Fig. 7. Gradual application of the standardized sum test to mean band
coherences (frequency band: 13±20 Hz; time interval: 400 ms by the end
of the task). Sets of electrode pairs with signi®cant difference between
incongruent and congruent task situations with regard to mean band coher-
ences are written in bold font.

In the ®rst step the SS test was performed for all 22
electrode pairs listed in the upper box of Fig. 7. This multi-
variate test resulted in a signi®cant difference between
incongruent and congruent situations (a � 5%). After-
wards, the SS test was executed for both particular hemi-
spheres with 11 electrode pairs at each case. For the set of
electrode pairs of the right hemisphere no signi®cant differ-
ence could be obtained. The SS test for the set of electrode
pairs of the left hemisphere provided signi®cance of the
difference between both task situations (a � 5%). The
application of the SS test to subsets of electrode pairs (left
frontal, parieto-temporal and fronto-parietal areas according
to lower boxes in Fig. 7) led to P-values between 5 and 10%
for the left frontal and for the left parieto-temporal area.
By means of the statistical analysis, the visual impression
of Figs. 6 and 8 of higher coherences within the left frontal
B. Schack et al. / Clinical Neurophysiology 110 (1999) 1410±14261418
Table 1
Mean band coherences (13±20 Hz) for the time interval 400 ms by the end of the task for frontal, parietal and fronto-parietal electrode pairs of the left and right
hemisphere. Signi®cant different coherence values are written in bold font (t test for paired samples of z-transformed coherence values with a signi®cance level
of 5%).
Left hemisphere Right hemisphere
Electrode pairs Area Incongr. task Congr. task Electrode pairs Area Incongr. task Congr. Task
Fp1/F7 Left frontal 0.43 0.37 Fp2/F8 Right frontal 0.57 0.56
Fp1/F3 0.48 0.46 Fp2/F4 0.50 0.47
F7/F3 0.56 0.50 F8/F4 0.57 0.58
F3/Fz 0.79 0.77 F4/Fz 0.81 0.81
F3/C3 0.61 0.56 F4/C4 0.61 0.60
F3/P3 Left fronto-parietal 0.42 0.40 F4/P4 Right fronto-parietal 0.39 0.41
F3/Pz 0.44 0.40 F4/Pz 0.41 0.43
P3/Pz Left parieto-temporal 0.83 0.82 P4/Pz Right parieto-temporal 0.79 0.75
T5/P3 0.70 0.67 T6/P4 0.64 0.61
T5/O1 0.64 0.61 T6/O2 0.56 0.54
P3/O1 0.71 0.68 P4/O2 0.65 0.65
Fig. 8. Mean time courses of differences of band coherences (incongruent minus congruent task condition) for the frequency band 13±20 Hz. For the frontal
areas the time courses were averaged over the electrode pairs Fp1/F7, Fp1/F3, F7/F3 and F3/Fz (upper left panel) and correspondingly over the electrode pairs
Fp2/F8, Fp2/F4, F8/F4 and F4/Fz (upper right panel). The lower panels show the difference curves for the electrode pairs P3/Pz (left) and P4/Pz (right). The
vertical lines denote the mean reaction time for the congruent situation (RTC � 708 ms) and for the incongruent situation (RTI � 793 ms).
and parietal areas for the incongruent case was con®rmed in
a global sense. For a topographical representation of this
result the mapping procedure of local coherences was
again carried out.
Fig. 9 illustrates the mean difference map of coherences
for the time interval 400 ms by the end of the task (reaction
time) and completes the results of Table 1. Obviously, in the
case of the incongruent Stroop task there are higher local
coherences for the electrode pairs in the left hemisphere and
slightly lower local coherences for the electrode pairs in the
right hemisphere within the second half of the task. We get
equivalent results for the fronto-parietal electrode pairs.
Differences in coherence of the electrode pairs F3/P3, F3/
Pz, F3/P4 show positivity whereas differences in coherence
of the electrode pairs F4/P3, F4/Pz, F4/P4 are negative.
These results support our hypotheses of stronger interac-
tions within and between the left frontal and parietal topo-
graphic areas.
3.4. Correlation between reaction time and time-point of
maximal coherence
Using our time-continuous approach it is possible to look
for connections between the chronometric behavioral para-
meters of the task and the characteristic time-events of the
instantaneous band coherences. For this reason time-points
of maximal coherences during the task were calculated for
each of the 30 local and 9 fronto-parietal electrode pairs
according to Eq. 12 in the Appendix. In order to avoid
local maxima the time courses of band coherences were
smoothed with a rectangular time window of 300 ms. There-
after, the correlation coef®cients between the mean time-
points of maximal coherence and the mean reaction times
of the 10 subjects were calculated for all 39 electrode pairs
examined.
In the upper panels of Fig. 10, electrode pairs with signif-
icant correlation between time-points of maximal band
coherence and reaction times are marked by arrows. In the
case of the incongruent Stroop task there are high correla-
tions within the left frontal, central and parietal regions as
well as for 7 of the 9 fronto-parietal electrode pairs. In the
congruent case there are high correlations above all in the
right hemisphere. This impression of a lateralization effect
will be mainly supported by the mapping of the correlation
coef®cients between the time-points of maximal coherence
for 30 adjacent electrode pairs and the reaction times by
themselves. These `local correlation' maps are illustrated
on the lower two panels of Fig. 10.
From Fig. 10 (panels one and two) it can be seen that a
signi®cantly high correlation exists between the time-points
of maximal coherence and the reaction time for the four
fronto-parietal electrode pairs F3/P3, F3/Pz, F4/Pz and F4/
P4 in the incongruent case, whereas there is only a signi®-
cantly high correlation between the time-points of maximal
coherence and the reaction time for one of these 4 fronto-
parietal electrode pairs in the congruent case, namely F4/P4.
The concrete values of correlation coef®cients are listed in
Table 2.
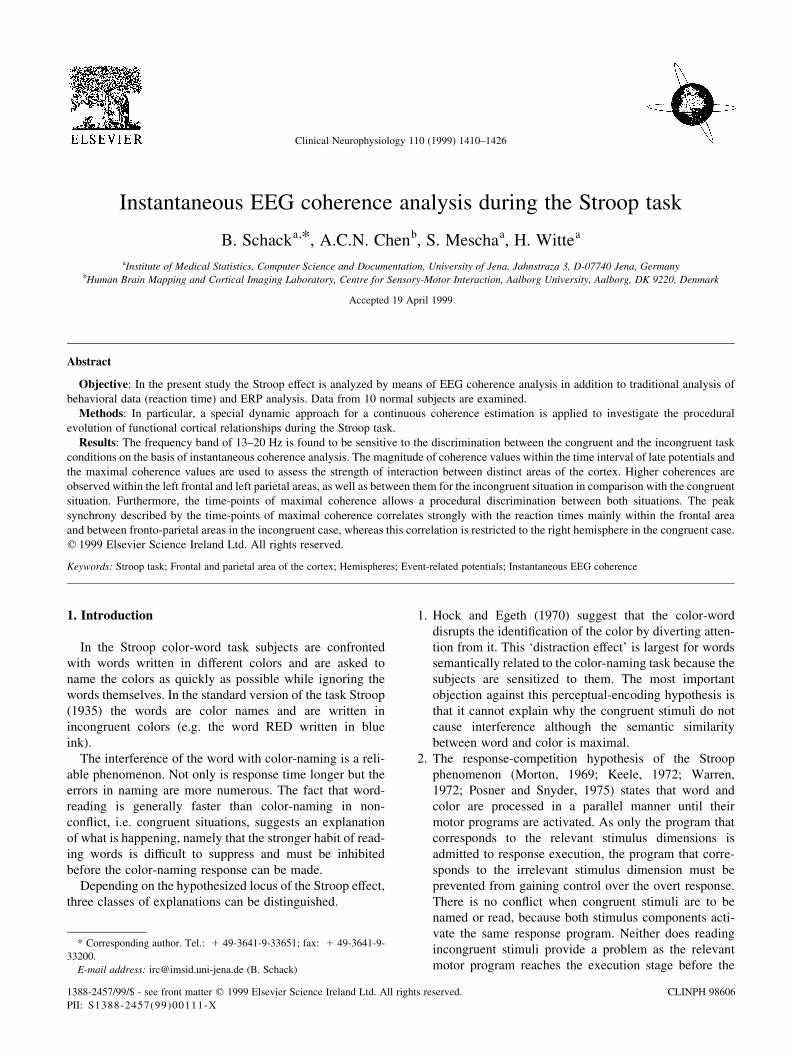
The stronger correlation within the left hemisphere for the
incongruent case in comparison with the congruent case and
the equivalent strength of correlation within the right hemi-
sphere for both situations are illustrated in the scatterplots in
Fig. 12.
The average of fronto-parietal electrodes F3/P3 and F3/Pz
represent the left hemisphere and the average of fronto-
parietal electrodes F4/P4 and F4/Pz represent the right
hemisphere, analogously.
3.5. The Stroop effect and the time evolution of interaction
processes
Table 2 and Figs. 10 and 11 show the lateralization of
strength of correlation between time-points of high synchro-
nization described by coherence and the reaction time.
Furthermore, it is interesting for a procedural analysis to
compare the absolute values of these time-points of maxi-
mal coherence for the two task conditions. The ®rst main
result is that the time-points of maximal coherences appear
overall later for the incongruent Stroop task than for the
congruent one. In Table 3, the time-points of maximal
coherence are listed for selected electrode pairs of the fron-
tal and parietal areas.
From Table 3 it may be observed that the peak of network
synchronization, described by the coherence, appears later
for the incongruent task. This is generally the case for all
electrode pairs under consideration. Thereby, after perform-
ing the square root transform for time-points of maximal
coherence to enforce normality, the one-way ANOVA
results in signi®cant time differences for the electrode
pairs Fp1/F7, F3/P3, F3/Pz, F4/P4 and P4/Pz. Additionally,
the univariate Wilcoxon test performed shows further
signi®cant differences. Thus, the time evolution of the inter-
B. Schack et al. / Clinical Neurophysiology 110 (1999) 1410±1426 1419
Fig. 9. Mean difference map (incongruent ± congruent) of local coherences
of the time interval 400 ms by the end of the task for 10 subjects.

action processes described by instantaneous coherences of
local and fronto-parietal electrode pairs are different for the
congruent and incongruent task situations. A topographic
overview of this general effect is given by the maps of
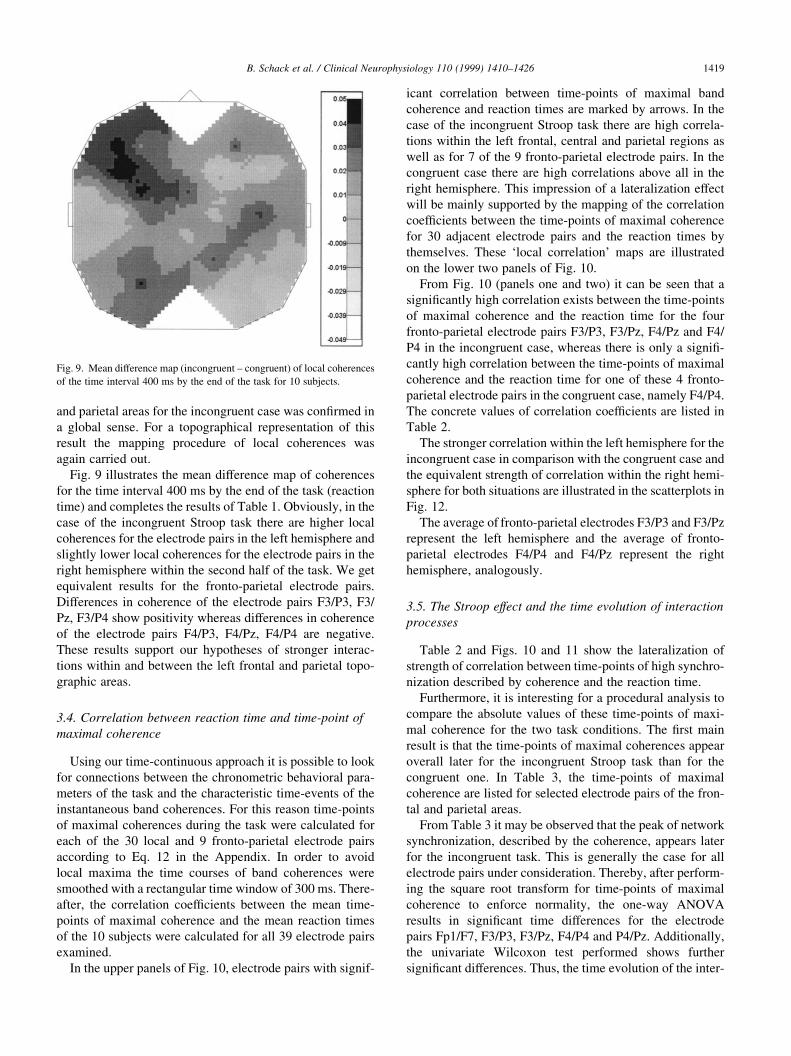
time-points of maximal local coherences in Fig. 12.
The scales (in ms) of the left and the middle maps of time-
points of maximal coherence in Fig. 12 and also the scale of
positive numbers only for their difference map (right), show
that the time-points of maximal coherence come later for all
adjacent electrode pairs in the incongruent case.
Further, from the left and the middle maps in Fig. 12 and
from Table 3 it can be seen that the time of maximal
synchronization appear later for the parietal electrode
pairs P3/Pz and P4/Pz than for the electrode pairs within
the frontal areas. Therefore, a MANOVA was performed
with two steps for the task condition factor (congruent and
B. Schack et al. / Clinical Neurophysiology 110 (1999) 1410±14261420
Fig. 10. Arrows and lines mark electrode pairs with signi®cant high (1%) correlation (Pearson's correlation coef®cient) between the time-points of maximal
coherence and reaction time. (A) Incongruent Stroop task. (B) Congruent Stroop task. Maps of correlation coef®cients: (C) Incongruent Stroop task. (D)
Congruent Stroop task.
Table 2
Pearson's correlation coef®cient between time-point of maximal coherence
and reaction time for the fronto-parietal electrode pairs F3/P3, F3/Pz, F4/
Pz, F4/P4
Correlation between time-point of max. coherence and reaction time
Situation F3/P3 F3/Pz F4/Pz F4/P4
Incongruent 0.90a 0.97a 0.861a 0.781a
Congruent 0.55 0.62 0.68 0.81a
a Correlation is signi®cant at the 0.01 level.
incongruent) and two steps of the topographic area factor
(parietal for P3/Pz and P4/Pz and frontal for F3/C3, F3/Fz,
F7/F3, Fp1/F3, Fp1/F7, F4/C4, F4/Fz, F8/F4, Fp2/F4 and
Fp2/F8) for all ten adjacent electrode pairs from Table 3.
Again, a square root transformation was performed to
enforce the normal distribution of the time-points of maxi-
mal coherence. For the task condition factor, the time-points
of maximal coherence were higher (signi®cance level of
5%) in the incongruent case for all 10 electrode pairs and
for the topographic area factor the time-points of maximal
coherence within the parietal area came later than those for
the electrode pairs F3/C3, F7/F3, Fp1/F3, Fp1/F7 and Fp2/
F4 (signi®cance level at 5%). The results of a subsequent t
test are listed in Table 4.
Evidently, the highest differences appear within the left
hemisphere and for the congruent case. The peak of
network synchronization within the left hemisphere
described by the coherence of the correspondent electrode
pairs appears later within the parietal area than within the
frontal area. This fact speaks for the procedural behavior of
the interaction process and indicates, possibly, a color-
word perception.
Because of the sensitivity of these time-events it seems to
be useful to calculate the values of maximal coherences by
themselves. The calculation was done for every single trial.
For each person these values were averaged individually for
the two situations. Fig. 13 shows the mean difference map of
maximal coherences for all 10 subjects.
For a statistical validation, analogously as in the case of
mean band coherences, ®rstly univariate t tests for z-trans-
formed maximal coherences were executed (see Table 5).
Afterwards, the multivariate SS test was performed to z-
transformed values of maximal coherences for 22 electrode
pairs listed in the upper box of Fig. 14.
The application of the global test for all electrode pairs
resulted in a signi®cant difference between incongruent and
congruent task conditions (a � 10%). After subdividing the
whole set of electrode pairs into two subsets according to
Fig. 14, from the global test for 11 electrode pairs of the left
hemisphere a signi®cant difference was obtained (a � 5%),
B. Schack et al. / Clinical Neurophysiology 110 (1999) 1410±1426 1421
Fig. 12. Maps of time-points (in ms) of maximal coherence in the incongruent and congruent situations and of their differences (incongruent-congruent).
Fig. 11. Scatterplots between the time-points of maximal coherence of the average of the electrode pairs F3/P3 and F3/Pz and the reaction time (left panel) and
correspondingly between the time-points of maximal coherence of the average of the electrode pairs F4/P4 and F4/Pz (right panel) for the incongruent and the
congruent Stroop tasks, respectively.

whereas the global test for 11 electrode pairs of the right
hemisphere showed no signi®cant difference. The execution
of the SS test for subareas (see Fig. 14) of the left hemi-
sphere resulted in signi®cant differences for the left parieto-
temporal area only (a � 5%).
In comparison with the mean coherences at the end of the
task there are, above all, higher differences within the left
posterior hemisphere. This result indicates a stronger color-
word perception in the incongruent task situation. Thus, the
single trial-dependent detection of the time-point of maxi-
mal coherence increases the sensitivity of the discrimination
between the congruent and the incongruent task within the
left temporo-parietal area by means of instantaneous coher-
ence.
4. Discussion
Coherence has been frequently used to investigate cogni-
tive processes (Petsche et al., 1993; Petsche, 1996; Petsche
and Etlinger 1998; Sarnthein et al., 1998).
Our previous studies have shown that an instantaneous
approach increases the sensitivity of coherence when
considering information processing (Schack and Krause,
1995; Krause et al., 1998; Schack et al., 1999a,b). The inter-
ference during incongruent Stroop tasks may be described in
detail on the basis of this parameter. Values of coherence in
the time interval of late potentials and values of maximal
coherences in particular are quantitative parameters for
distinguishing between the congruent and the incongruent
cases. During incongruent Stroop tasks, high coherences
within the frequency band 13±20 Hz appeared within the
left frontal, central, and left parietal regions, and addition-
ally for fronto-parietal electrode pairs in the left hemisphere.
In contrast, in the congruent case, the coherence values in
the right hemisphere increased in comparison to the incon-
gruent case.
Additionally, the time-points of maximal coherence are
qualitative parameters which demonstrate persuasively the
close connection between the time evolution of the task and
the behavior of the instantaneous coherence. The correlation
between synchronization processes described by instanta-
neous coherence and the time evolution of the task quanti-
®ed by the reaction time was very close in the incongruent
case, whereas such correlations were restricted to the right
hemisphere in the congruent case. The evolution of peak
synchrony appeared earlier in the frontal areas than in the
parietal area as listed in Table 3. This fact suggests the
plausible early frontal `executive functions' with subse-
quent synchrony in the parietal areas which indicates a
B. Schack et al. / Clinical Neurophysiology 110 (1999) 1410±14261422
Table 3
Time-points of maximal coherence (ms) and their differences for selected electrode pairs. (Bold font denotes signi®cant differences between incongruent and
congruent situations on the basis of one-way ANOVA on the square root transformed values of time-points. Italicized font denotes additional signi®cant
differences on the basis of the Wilcoxon test for paired samples (signi®cance level of 1%)
Time-points of maximal coherence (ms)
Left hemisphere Right hemisphere
Electrode pairs Incongr. Task Congr. task Difference Electrode pairs Incongr. task Congr. task Difference
Fp1/F7 391 322 69 Fp2/F8 411 367 44
Fp1/F3 360 284 76 Fp2/F4 365 303 63
F7/F3 406 331 75 F8/F4 419 349 70
F3/Fz 424 335 89 F4/Fz 440 372 69
F3/C3 394 310 84 F4/C4 430 370 60
F3/P3 394 317 78 F4/P4 416 307 109
F3/Pz 389 308 82 F4/Pz 383 327 56
P3/Pz 473 399 74 P4/Pz 480 379 102
Table 4
Comparison of square-root transformed time-points of maximal coherence between the parietal electrode pairs P3/Pz and P4/Pz and selected frontal electrode
pair positions corresponding to the left and right hemispheres
P-values of paired samples t test
P3/Pz P4/Pz
Electrode pairs Incongruent task Congruent task Electrode pairs Incongruent task Congruent task
Fp1/F7 0.094 0.012 Fp2/F8 0.159 0.699
Fp1/F3 0.006 0.003 Fp2/F4 0.007 0.053
F7/F3 0.096 0.017 F8/F4 0.041 0.216
F3/Fz 0.088 0.023 F4/Fz 0.256 0.774
F3/C3 0.024 0.021 F4/C4 0.092 0.762

semantic memory retrieval in the parietal regions, similar to
N400 components of linguistic ERP studies.
Furthermore, the topographic predications coincide with
the results achieved on the basis of other investigation meth-
ods such as PET and MRI analysis (Bench et al., 1993;
Taylor et al., 1994; Vrendell et al., 1995).
Similarities appeared with a previous ERP analyses of the
Stroop task (Warren and Marsch, 1979; Czigler and Csibra,
1991; Hasenfratz and BaÈttig 1992; Soininen et al., 1995;
Willis et al., 1996; West and Bell 1997) in relation to the
late cognitive potentials as a sensitive time interval for the
distinction between congruent and incongruent Stroop tasks.
The discrimination between the incongruent and congruent
task by means of ERP could only be shown for the posterial
cortex in this study. The coherence analysis pointed out
mainly the interaction phenomena of the Stroop effect
within the left frontal area and between the left frontal
and parietal areas. The investigation of chronometric corre-
lation between the internal interaction process described by
peak instantaneous coherence and the reaction time as exter-
nal behavior data, support these results.
Modern neuroimaging methods like PET and fMRT
opens possibilities of ®nding locations of sources for infor-
mation processing. In contrast to these methods, coherence
analysis enables the investigation of interaction processing
for different topographic areas and thus adds a new aspect to
the consideration of cognitive processes. The instantaneous
approach used in this study additionally allows one to
describe the procedural character of interaction processes
for cognitive processes like the Stroop test, where fast
changes with regard to interaction are expected.
All results described above were achieved with unipolar
linked ears reference. The choice of a suitable derivation is
one general problem in EEG analysis. Therefore, several
authors have demonstrated that the reference also in¯uences
the value of coherence (Fein et al., 1988; Biggins et al.,
1991; Lagerlund et al., 1995; Andrew and Pfurtscheller,
1996; Nunez et al., 1997; Essl and Rappelsberger, 1998
etc.). In order to avoid this in¯uence, different `reference-
free' derivations as common average reference, bipolar deri-
vations or different Laplacian derivation types has been used
or constructed (Hjorth, 1975; Perrin et al., 1987, 1989;
B. Schack et al. / Clinical Neurophysiology 110 (1999) 1410±1426 1423
Fig. 13. Map of differences of values of maximal coherence (incongruent±
congruent) for the frequency band 13±20 Hz.
Table 5
Maximal band coherences (13±20 Hz) for frontal, parietal and fronto-parietal electrode pairs of the left and right hemisphere. Signi®cant different coherence
values are written in bold font (t-test for paired samples of z-transformed coherence values with a signi®cance level of 5%)
Left hemisphere Right hemisphere
Electrode pairs Area Incongr. task Congr. task Electrode pairs Area Incongr. Task Congr. task
Fp1/F7 Left frontal 0.56 0.53 Fp2/F8 Right frontal 0.68 0.67
Fp1/F3 0.59 0.59 Fp2/F4 0.62 0.61
F7/F3 0.68 0.66 F8/F4 0.68 0.68
F3/Fz 0.86 0.84 F4/Fz 0.87 0.87
F3/C3 0.72 0.70 F4/C4 0.72 0.71
F3/P3 Left fronto-parietal 0.57 0.55 F4/P4 Right fronto-parietal 0.53 0.53
F3/Pz 0.59 0.55 F4/Pz 0.568 0.574
P3/Pz Left parieto-temporal 0.88 0.86 P4/Pz Right parieto-temporal 0.84 0.83
T5/P3 0.79 0.77 T6/P4 0.74 0.72
T5/O1 0.75 0.72 T6/O2 0.66 0.65
P3/O1 0.80 0.78 P4/O2 0.75 0.75
Fig. 14. Gradual application of the standardized sum test to maximal band
coherences (13±20 Hz). Sets of electrode pairs with signi®cant difference
between incongruent and congruent task situations with regard to maximal
coherences are written in bold font.

Perrin, 1992; Biggins et al., 1992; Pascual-Marqui, 1993;
Law et al., 1993; Lagerlund et al., 1995 etc.).
Nunez et al. (1997) examined and compared coherence
estimates with regard to different derivations. He recom-
mended solving the problem of choosing the reference in
order to provide the most robust indicators of clinical or
cognitive state for each study individually. Nunez (1997)
argued that average reference, cortical image and reduced
coherencies behave in way that are qualitatively similar to
reference coherence when large regions are compared.
In this context a strong topographic interpretation of our
results seems to be not advisable. Independent of this fact,
the major aim of the study, namely a clear discrimination
between the congruent and incongruent task situations on
the basis of instantaneous coherence parameters as
described above, could be ful®lled.
Because the Stroop effect is very robust under changes in
experimental conditions and contains elements of selective
attention, word-reading, and color-naming processes, it is
useful for testing a variety of cognitive theories. Thus, the
Stroop effect continues to be important in psychology and is
the goal of many cognitive models (Cohen et al., 1992;
Mewhort et al., 1992; Sugg and McDonald, 1994).
Further, the results found in this study with regard to
interaction phenomena connected with the Stroop effect
may be helpful for the more certain indication of dysfunc-
tions in patients without clear focal lesions.
5. Appendix
The adaptive estimation procedure of instantaneous
coherence was conducted in two steps as follows: the ®rst
step was the adaptive ®tting of a linear model to a pair of
EEG channels. Let
x � x1i x2
i
� �T� �
i�0;1;2;¼
be the sample values of two channels of an EEG record,
where
x1i x2
i
� �T� x1i
x2i
!T
and i denotes the number of the sample value. This two-
dimensional EEG signal was ®tted by a two-dimensional
autoregressive moving average (ARMA) model with time-
varying parameters:
yn 1Xp
k�1
Ak n� �yn2k � zn 2Xq
j�1
Bj n� �zn2j �1�
where p and q are the orders of the model, z is a two-dimen-
sional independent white noise process, y is the two-dimen-
sional model process, and Ak(n) and Bl(n) are 2*2- matrices
of the autoregressive and moving average parameters. The
minimization of the momentary quadratic prediction error
of the model leads to the following adaptive estimation
procedure for the parameter matrices:
Ak n� � � Ak n 2 1� �2 cnenxTn2k; k � 1;¼; p
Bj n� � � Bj n 2 1� �2 cneneTn2j; j � 1;¼; q �2�
where {en}n�1,2,¼ is the estimated vector sequence of the
prediction error:
e0 � 0
en � xn 2 yn
� xn 1Xp
k�1
Ak n 2 1� �´xn2k 1Xq
j�1
B n 2 jÿ �
´eTn2j �3�
The algorithm in Eqs. (2,3) is a generalization of the LMS
algorithm for adaptive ®ltering of one-dimensional signals
by autoregressive models for the case of adaptive ®ltering of
multi-dimensional signals by autoregressive moving-aver-
age models. The time-varying stepwidth cn was chosen reci-
procally proportional to the sum of momentary variances of
the two EEG signals (for details see Schack et al., 1999a).
This signal-dependent determination of the stepwidth cn
guarantees the stability of the adaptive estimation proce-
dure. The model order (p,q) was established in accordance
with the Hannan criterion (Hannan and Kavalieris, 1984).
The second step of the adaptive estimation procedure
consists of the parametric calculation of the spectral density
matrix for each sample point. The momentary transfer func-
tion Hn(l ) of the ®tted ARMA model may be calculated by
the formula
Hn l� � � A21n l� �*Bn l� �; �4�
with the momentary parameter matrices
An l� � � I 1Xp
k�1
Ak n� �e2ikl and
Bn l� � � I 2Xq
k�1
Bj n� �e2ijl: �5�
The momentary covariance matrix Sn of the bivariate
prediction error {en}n�1,2,¼ may also be estimated in an
adaptive manner according to:
sij 0� � � 0
sij n� � � sij n 2 1� �2 cs´ sij n 2 1� �2 ein´ej
n
� �; i � 1; 2; n
� 1; 2;¼ �6�where cs is a constant with 0 , cs , 1. It is now possible to
calculate the spectral density matrix at every sample point n
by
fn l� � � Hn l� �*Sn*H*Tn l� �; �7�
B. Schack et al. / Clinical Neurophysiology 110 (1999) 1410±14261424

where H*Tn denotes the complex conjugate and transpose of
Hn(l ). This means that this adaptively estimated spectral
density matrix
fn l� � �f11;n l� � f12;n l� �f21;n l� � f22;n l� �
!
is a function in frequency and in time. In such a way, we
obtain the instantaneous quadratic coherence function at
every sample point:
r2n l� � � uf12;n l� �u2
f11;n l� �*f22;n l� � : �8�
Because of the high variability of the EEG, and therefore of
the adaptive EEG coherence, it is often necessary to esti-
mate a mean time coherence analysis. For this purpose the
following estimation procedure was executed. The ARMA
model parameter matrices with time-dependent parameters
are ®tted for each single trial m, m � 1;¼, M, according to
the adaptive estimation procedure (1)±(3):
Akm n� � � Ak
m n 2 1� �2 cnem;nxTm;n2k; k � 1;¼; p
Bjm n� � � Bj
m n 2 1� �2 cnem;neTm;n2j; j � 1;¼; q �9�
Afterwards, the time-frequency-matrices for momentary
coherence have to be calculated for each single trial accord-
ing to Eqs.(4)±(8) and then averaged:
�r2n l� � � 1
M
XMm�1
r2n l� � �10�
In this way we get a mean time-coherence-analysis for a
cognitive operation which is assumed to be repeatable.
The limitation to sensitive frequency bands enables a
necessary data reduction. As a result we get the time
curve of mean band coherence. For a chosen frequency
band [l low, l upper] the mean band coherence is computed by
r2i;j n� � � 1
card
Xllow#lk#lupper
r2n;i;j lk
ÿ � �11�
for each sample point n and arbitrary EEG channel pair (i, j).
The number of discrete frequency points with llow # lk #lupper is denoted by card. The instantaneous mean band
coherence (Eq. 11) can be regarded as a stochastic process
by itself which is bounded by 0 and 1. Now it is possible to
detect phases of high synchronization by smoothing the time
curve (Eq. 11) and ®nding the time-point of maximal coher-
ence tC for any time interval [t1,t2] of interest:
r2i;j tcÿ �
$ r2i;j t� �;;t [ t1; t2
� �: �12�
Furthermore, the value
r2i;j tc
ÿ �indicates the intensity of maximal synchronization.
Acknowledgements
The authors would like to thank W. Krause for helpful
suggestions and discussions and G. Grieszbach, J. Bolten
and E. MoÈller for help in programming. (This study was
supported by the Federal Ministry of Research and Technol-
ogy (BMBF 01ZZ9602, DFG Scha 741/1-1 and DFG Scha
741/1-2).
References
Andrew C, Pfurtscheller G. Dependence of coherence measurements on
EEG derivation type. Med Biol Eng Comput 1996;34:232±238.
Bench CJ, Frith CD, Grasby PM, Friston KJ, Paulesu E, Frackowiak RSJ,
Dolan RJ. Investigations of the functional anatomy of attention using
the stroop test. Neuropsychologia 1993;31:907±922.
Biggins CA, Fein G, Raz J, Amir A. Artifactually high coherences result
from using spherical spline computation of scalp current density. Elec-
troenceph clin Neurophysiol 1991;79:413±419.
Biggins CA, Ezekiel F, Fein G. Spline computation of scalp current density
and coherence: a reply to Perrin. Electroenceph clin Neurophysiol
1992;83:172±174.
Cohen JD, Servan-Schreiber D, McCelland JL. A parallel distributed
processing approach to automaticity. Am J Psychology
1992;105:239±268.
Czigler I, Csibra G. Event-related potentials in a lexical stroop task. Int J
Psychophysiol 1991;11:281±293.
Essl M, Rappelsberger P. EEG coherence and reference signals: experi-
mental results and mathematical explanations. Med Biol Eng Comput
1998;36:1±8.
Fein G, Raz J, Brown FF, Merrin EL. Common reference coherence data
are confounded by power and phase. Electroenceph clin Neurophysiol
1988;69:581±584.
Hannan EJ, Kavalieris L. Multivariate linear time series models. Biome-
trika 1984;69:81±94.
Hasenfratz M, BaÈttig K. Action pro®les of smoking and caffeine: stroop
effect. EEG, and periphal physiology. Pharmacol Biochem Behav
1992;42:155±161.
Hjorth B. An on-line transformation of EEG scalp potentials into orthogo-
nal source derivations. Electroenceph clin Neurophysiol 1975;39:526±
530.
Hock HS, Egeth H. Verbal interference with encoding in a perceptual
classi®cation task. J Exp Psychol 1970;83:299±303.
Keele SW. Attention demands of memory retrieval. J Exp Psychol
1972;93:245±248.
Krause W, Gibbons H, Schack B. Concept activation and coordination of
activation procedure require two different networks. NeuroReport
1998;9:1649±1653.
Lagerlund TD, Sharbrough FW, Busacker NE, Cicora KM. Interelectrode
coherences from nearest-neighbor and spherical harmonic expansion
computation of laplacian of scalp potential. Electroenceph clin Neuro-
physiol 1995;95:178±188.
LaÈuter J, Glimm E, Kropf S. New multivariate tests for data with an inher-
ent structure. Biom J 1996;38:5±23.
LaÈuter J. Exact t- and F-tests for analysing studies with multiple endpoints.
Biometrics 1996;52:964±970.
Law SK, Nunez PL, Wijesinghe RS. High-resolution EEG using spline
generated surface laplacians on spherical and ellipsoidal surfaces.
IEEE Trans Biomed Eng 1993;40(2):145±153.
Mewhort DJK, Braun JG, Heathcote A. Response time distributions and the
stroop task: a test of the Cohen, Dunbar, and McClelland (1990) model.
J Exp Psychol 1992;18:872±882.
Morton J. Categories of interference: verbal mediation and con¯ict in card
sorting. Br J Psychol 1969;60:329±346.
B. Schack et al. / Clinical Neurophysiology 110 (1999) 1410±1426 1425

Nunez PL, Srinivasan R, Wijesinghe RS, Westdorp AF, Tucker DM, Silber-
stein RB, Cadusch PJ. EEG Coherency I: statistics, reference electrode,
volume conduction, laplacians, cortical imaging, and interpretation at
multiple scales. Electroenceph clin Neurophysiol 1997;103:499±515.
Nunez PL, EEG coherence measures in medical and cognitive science: a
general overview of experimental methods, computer algorithms, and
accuracy. In: Witte H, Zwiener U, Schack B, Doering A, editors. Quan-
titative and topological EEG and MEG analysis. Druckhaus Mayer
Verlag GmbH Jena Erlangen, 1997:385±392. ISBN 3-925978-67-4.
Pascual-Marqui RD, et al. The spherical spline Laplacian does not produce
artifactually high coherences: comments on two articles by Biggins.
Electroenceph clin Neurophysiol 1993;87:62±64.
Perrin F, Bertrand O, Pernier J. Scalp current density mapping: value and
estimation from potential data. IEEE Trans Biomed Eng 1987;34(4):
283±288.
Perrin F, Pernier J, Bertrand O, Echallier JF. Spherical splines for scalp
potential and current density mapping. Electroenceph clin Neurophysiol
1989;72:184±187.
Perrin F, et al. Comments on article by Biggins. Electroenceph clin Neuro-
physiol 1992;83:171±172.
Petsche, H., Etlinger, S.C., EEG and thinking. Verlag der OÈ sterreichischen
Akademie der Wissenschaften. Wien, 1998.
Petsche H, Etlinger SC, Filz O. Brain electric mechanisms of bilingual
speech administration: an initial investigation. Electroenceph clin
Neurophysiol 1993;96:281±304.
Petsche H. Approaches to verbal, visual and musical creativity by EEG
coherence analysis. Int J Psychophysiol 1996;24:145±160.
Posner MJ, Snyder CRR. Attention and cognitive control. In: Solso RL,
editor. Information processing and cognition: the Loyola symposium,
Hillsdale, NJ: Erlbaum, 1975.
Rappelsberger P, Petsche H. Probability mapping. Power and coherence
analysis of cognitive processes. Brain Topogr 1988;1:46±54.
Sarnthein J, Petsche H, Rappelsberger P, Shaw GL, von Stein A. Synchro-
nization between prefrontal and posterior association cortex during
human working memory. Proc Natl Acad Sci USA 1998;95:7092±7096.
Schack B, Krause W. Dynamic power and coherence analysis of ultra short-
term cognitive processes ± a methodical study. Brain Topogr
1995;8:127±136.
Schack B. Dynamic topographic spectral analysis of cognitive processes.
In: Uhl Ch, editor. Analysis of neurophysiological brain functioning,
Berlin: Springer, 1999. pp. 230.
Schack B, Grieszbach G, Arnold M, Bolten J. Dynamic cross-spectral
analysis of biological signals by means of bivariate arma processes
with time-dependent coef®cients. Med Biol Eng Comput 1995;33:
605±610.
Schack B, Grieszbach G, Krause W. The sensitivity of instantaneous coher-
ence for considering elmentary comparison processing. Part I: the rela-
tionship between mental activities and instantaneous EEG coherence.
Int J Psychophysiol 1999;31:219±240.
Schack B, Grieszbach G, Nowak H, Krause W. The sensitivity of instanta-
neous coherence for considering elementary comparison processing.
Part II: similarities and differences between EEG and MEG coherences.
Int J Psychophysiol 1999;31:241±259.
Seymour PHK. Stroop interference with response, comparison, and encod-
ing stages in a sentence-picture comparison task. Memory Cognition
1974;2:19±26.
Seymour PHK. Conceptual encoding and locus of the Stroop effect. Q J Exp
Psychol 1977;29:245±265.
Soininen HS, Karhu J, Partanen J, PaÈaÈkoÈnen A, JousmaÈki V, HaÈnninen T,
Hallikainen M, Partanen K, Laakso MP, Koivisto K, Riekkinen PJ.
Habituation of auditory N100 correlates with amygdaloid volumes
and frontal functions in age-associated memory impairment. Physiol
Behav 1995;57:927±935.
Stroop JR. Studies of interference in serial verbak reactions. J Exp Psychol
1935;18:643±661.
Sugg MJ, McDonald JE. Time course of inhibition in color-response and
word-response versions of the stroop task. J Exp Psychol 1994;20:647±
675.
Taylor SF, Kornblum S, Minoshima S, Oliver LM, Koeppers RA. Changes
in medial cortical blood ¯ow with a stimulus-response comparability
task. Neuropsychologia 1994;32:249±255.
Vrendell P, Junque C, Pujol J, Jurado MA, Molet J, Grafman J. The role of
prefrontal regions in the stroop task. Neuropsychologia 1995;3:341±
352.
Warren LR, Marsch GR. Changes in event-related potentials during proces-
sing of stroop stimuli. Intern J Neurosci 1979;9:217±223.
Warren RE. Stimulus encoding and memory. J Exp Psychol 1972;94:90±
100.
West R, Bell MA. Stroop color-word interference and electroencephalo-
gram activation: evidence for age-related decline of the anterior atten-
tion system. Neuropsychology 1997;11:421±427.
Willis J, Nelson A, Black W, Borges A, An A, Rice J. Barbiturate antic-
onvulsants: a neuropsychological and quantitative electroencephalo-
graphic study. J Child Neurol 1996;12:169±171.
B. Schack et al. / Clinical Neurophysiology 110 (1999) 1410±14261426