Embed Size (px)
Citation preview
Instagram Post Data Analysis
Steve ChangUniversity of California, Los Angeles
USA
ABSTRACTBecause of the spread of the Internet, social platforms becomebig data pools. From there we can learn about the trends,culture and hot topics. This project focuses on analyzing thedata from Instagram. It shows the relationship of Instagramfilter data with location and number of likes to give users filtersuggestion on achieving more likes based on their location.It also analyzes the popular hashtags in different locations toshow visual culture differences between different cities.
ACM Classification KeywordsH.5.m. Information Interfaces and Presentation (e.g. HCI):Miscellaneous
Author Keywordsdata visualization, instagram, filter, hashtag
INTRODUCTIONAs "a picture is worth a thousand words", more and morepeople are sharing their daily life, personal interests, news andevents using images on social platform. Instagram is such aplatform which is a popular mobile photo sharing application.It launched in October 2010, and rapidly gained popularity,with over 100 million active users as of April 2012 and over300 million as of December 2014. Because of these hugeamount of information in the dataset of Instagram, and we areinterested in analyzing and visualizing the patterns of them.
This project is focusing on analyzing Instagram data to learnabout the culture differences between different places. Thisproject analyzes how filter usage are distributed in 50 cities,which are the cities with most population in each state ofUnited States. This give us the information about how filterpreference and vision culture varies in different states. Theproject also analyzes the number of hashtags been labeled onthe posts for each city. It shows the popular hashtags for eachcity which reveal the popular event or hot terms in differentcities.
Paste the appropriate copyright statement here. ACM now supports three differentcopyright statements:• ACM copyright: ACM holds the copyright on the work. This is the historical ap-proach.• License: The author(s) retain copyright, but ACM receives an exclusive publicationlicense.• Open Access: The author(s) wish to pay for the work to be open access. The addi-tional fee must be paid to ACM.This text field is large enough to hold the appropriate release statement assuming it issingle spaced.
While you are using the Instagram, you may also have everscrolled through the Instagram filter list back and force worry-ing about which one to use, and how to make more people likeit. But since culture background and contents varies a lot fromphoto to photo, it is hard to make a simple suggestion that leteveryone like it. Our project also analyzes the Instagram filterdata based on location and like to help you solve this problem.
The goal of this project is to learn about visual culture andcontent differences to help catch both the artistic trends andevent trends for different places. It can also help user to makebetter filter selection to improve photo quality and reach morelikes.
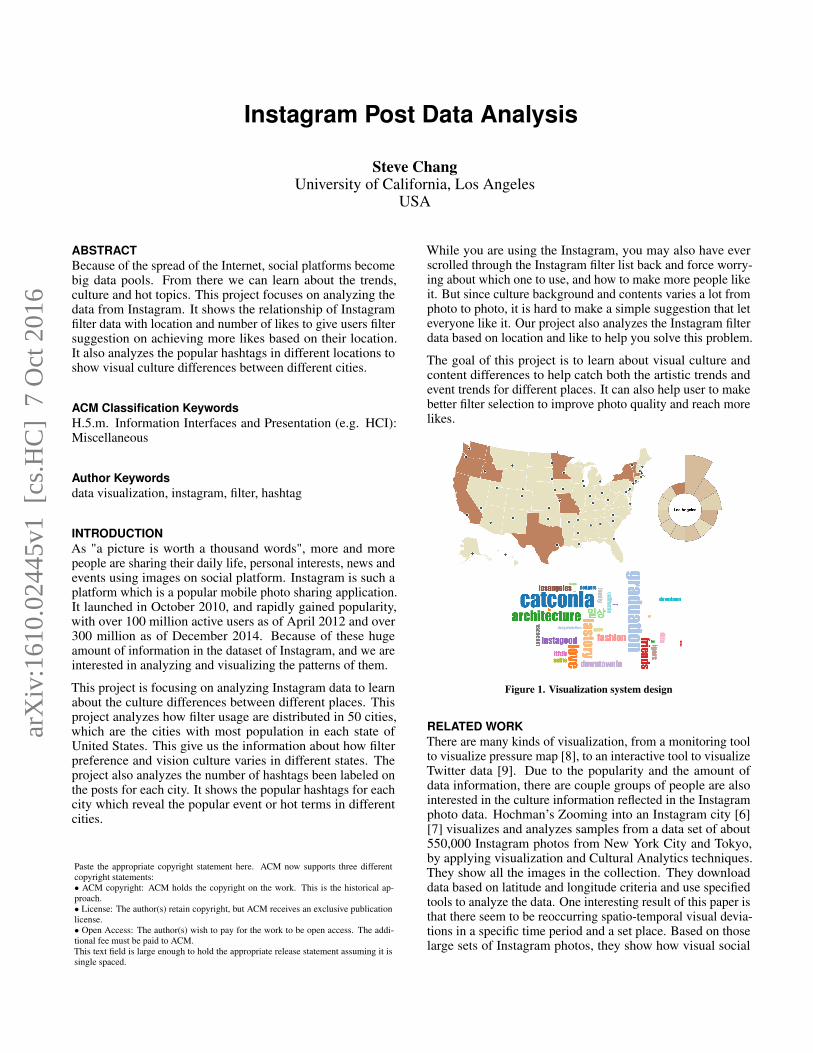
Figure 1. Visualization system design
RELATED WORKThere are many kinds of visualization, from a monitoring toolto visualize pressure map [8], to an interactive tool to visualizeTwitter data [9]. Due to the popularity and the amount ofdata information, there are couple groups of people are alsointerested in the culture information reflected in the Instagramphoto data. Hochman’s Zooming into an Instagram city [6][7] visualizes and analyzes samples from a data set of about550,000 Instagram photos from New York City and Tokyo,by applying visualization and Cultural Analytics techniques.They show all the images in the collection. They downloaddata based on latitude and longitude criteria and use specifiedtools to analyze the data. One interesting result of this paper isthat there seem to be reoccurring spatio-temporal visual devia-tions in a specific time period and a set place. Based on thoselarge sets of Instagram photos, they show how visual social
arX
iv:1
610.
0244
5v1
[cs
.HC
] 7
Oct
201
6
media can be analyzed at multiple spatial and temporal scales.They also present analysis of social and cultural dynamicsin specific places and particular times, and introduce new vi-sualization techniques which can show tens of thousands ofindividual images sorted by their metadata or algorithmicallyextracted visual features. But as they only focuses on photocolor and photo style, but our project cares more anout thelabel information and filter data. They shows the differencesof visual styles in different time different cities, while we areanalyzing the exact events and objects that people are capturedand marked in different cities.
There are also some existing analytical tools for Instagram.Iconosquare (formerly Statigram) [4] provides useful statisticsabout Instagram. It can also respond to comments and monitorhashtags. Instagram-analytics [2] contains huge amount ofraw instagram data for users. Instastats [3] is python scriptsto pull data from Instagram API. Those work shows us whatdata information are available from Instagram and our projectuses some of the tools to get our desired data for analysis.
METHODSWe implement a software tool for user to navigate the Insta-gram data. The implementation details are divided into fourparts:
Data preparation: getting data from Instagram and sorted ourdesired data into useable csv format.
Data analysis: we use table and chart to pre-analyze the data.
Function design: our system filters data based on location, andvisualizes filter and tag data.
Visual style design: our system uses map to display locationdata, uses Aster chart to visualize filter data, and uses wordcloud to visualize hashtag data.
Data PreparationFirst, we get Instagram data from Instagram API which allowsus to specify the scope of the access we are requesting fromthe user. It provides four types of scopes:
basic - to read data on a user’s behalf, e.g. recent media,following lists (granted by default);
comments - to create or delete comments on a user’sbehalf;
relationships - to follow and unfollow accounts on a user’sbehalf;
likes - to like and unlike media on a user’s behalf.
In our project, we are insisting in the basic and likes scopesincluding filter types, tags, likes, image link and locationinformation. We get the data through API endpoint and useinstastats python script to pull data. The example data is shownbelow:
"data": [{"filter": "Earlybird","tags": ["expobar"],"likes": {
"count": 35,},"link": "http://instagr.am/p/BUS3X/","location": {
"latitude": 37.780885099999999,"longitude": -122.3948632,
}}]
We found data collection process is painful. Instagram’s APIhas unpredictable behavior. For example, even if we indicatethe number of post we want in query, its API will still giveus different number of result in each run. Thus, in order toget enough data, we need to run multiple times and removeduplicate results.
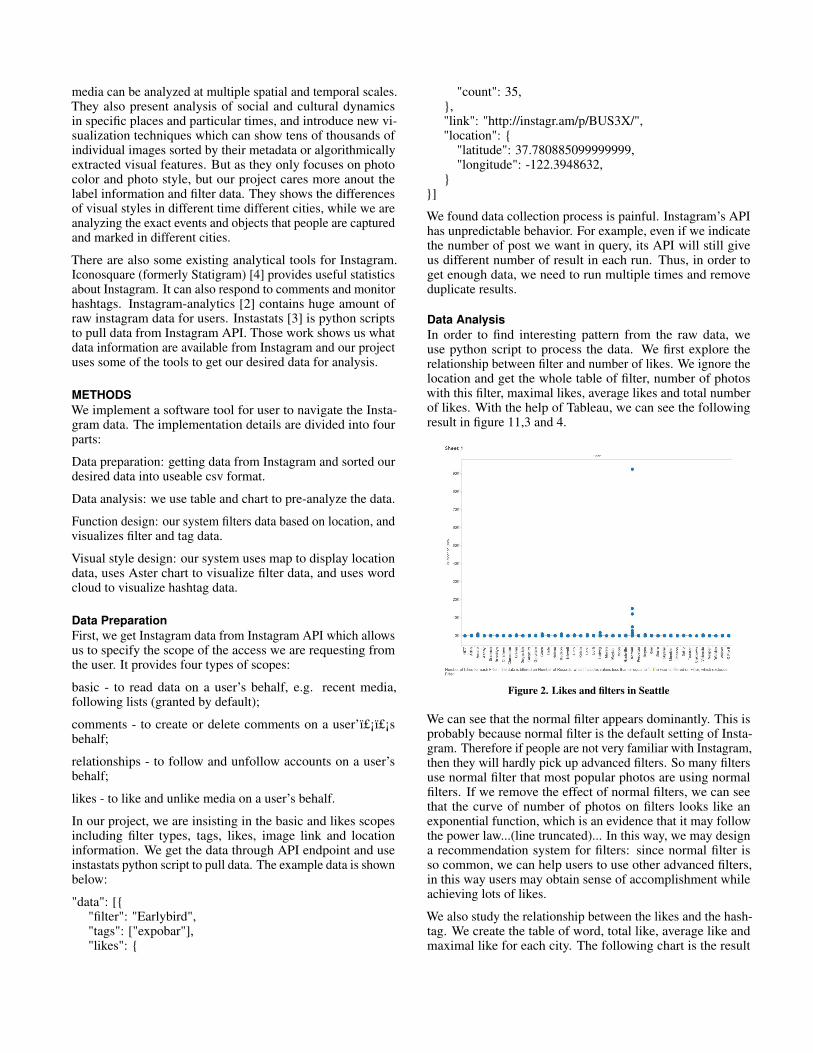
Data AnalysisIn order to find interesting pattern from the raw data, weuse python script to process the data. We first explore therelationship between filter and number of likes. We ignore thelocation and get the whole table of filter, number of photoswith this filter, maximal likes, average likes and total numberof likes. With the help of Tableau, we can see the followingresult in figure 11,3 and 4.
Figure 2. Likes and filters in Seattle
We can see that the normal filter appears dominantly. This isprobably because normal filter is the default setting of Insta-gram. Therefore if people are not very familiar with Instagram,then they will hardly pick up advanced filters. So many filtersuse normal filter that most popular photos are using normalfilters. If we remove the effect of normal filters, we can seethat the curve of number of photos on filters looks like anexponential function, which is an evidence that it may followthe power law...(line truncated)... In this way, we may designa recommendation system for filters: since normal filter isso common, we can help users to use other advanced filters,in this way users may obtain sense of accomplishment whileachieving lots of likes.
We also study the relationship between the likes and the hash-tag. We create the table of word, total like, average like andmaximal like for each city. The following chart is the result
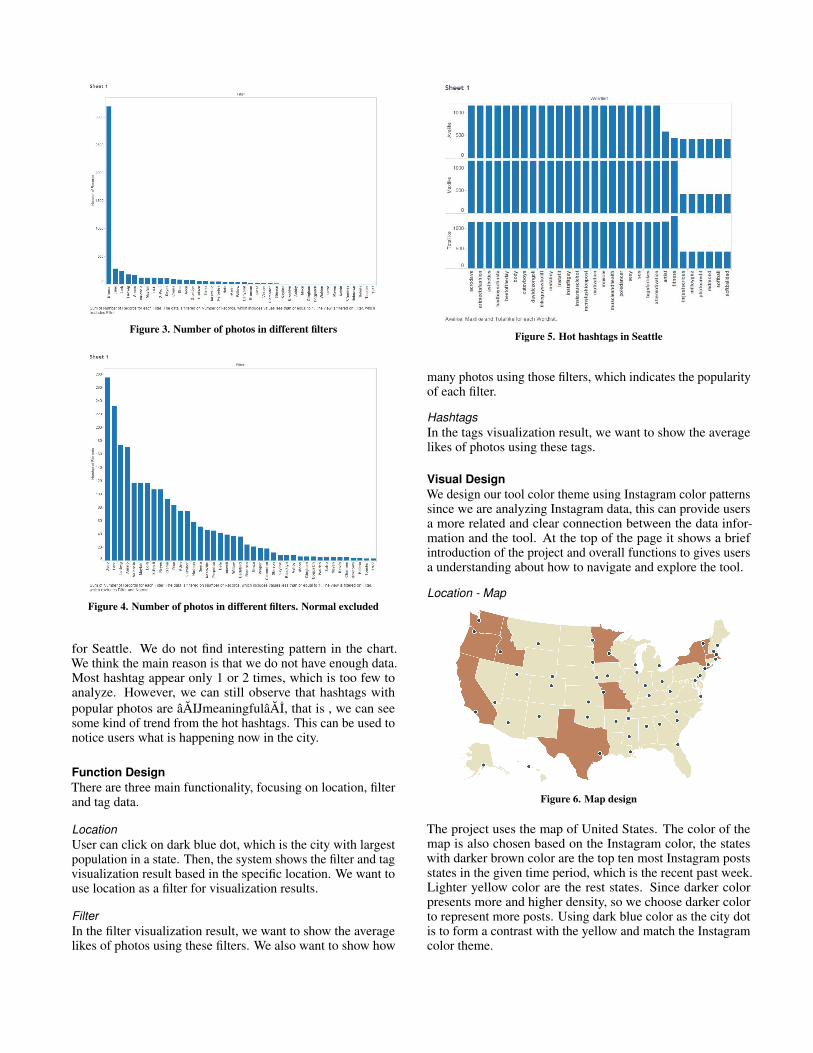
Figure 3. Number of photos in different filters
Figure 4. Number of photos in different filters. Normal excluded
for Seattle. We do not find interesting pattern in the chart.We think the main reason is that we do not have enough data.Most hashtag appear only 1 or 2 times, which is too few toanalyze. However, we can still observe that hashtags withpopular photos are âAIJmeaningfulâAI, that is , we can seesome kind of trend from the hot hashtags. This can be used tonotice users what is happening now in the city.
Function DesignThere are three main functionality, focusing on location, filterand tag data.
LocationUser can click on dark blue dot, which is the city with largestpopulation in a state. Then, the system shows the filter and tagvisualization result based in the specific location. We want touse location as a filter for visualization results.
FilterIn the filter visualization result, we want to show the averagelikes of photos using these filters. We also want to show how
Figure 5. Hot hashtags in Seattle
many photos using those filters, which indicates the popularityof each filter.
HashtagsIn the tags visualization result, we want to show the averagelikes of photos using these tags.
Visual DesignWe design our tool color theme using Instagram color patternssince we are analyzing Instagram data, this can provide usersa more related and clear connection between the data infor-mation and the tool. At the top of the page it shows a briefintroduction of the project and overall functions to gives usersa understanding about how to navigate and explore the tool.
Location - Map
Figure 6. Map design
The project uses the map of United States. The color of themap is also chosen based on the Instagram color, the stateswith darker brown color are the top ten most Instagram postsstates in the given time period, which is the recent past week.Lighter yellow color are the rest states. Since darker colorpresents more and higher density, so we choose darker colorto represent more posts. Using dark blue color as the city dotis to form a contrast with the yellow and match the Instagramcolor theme.
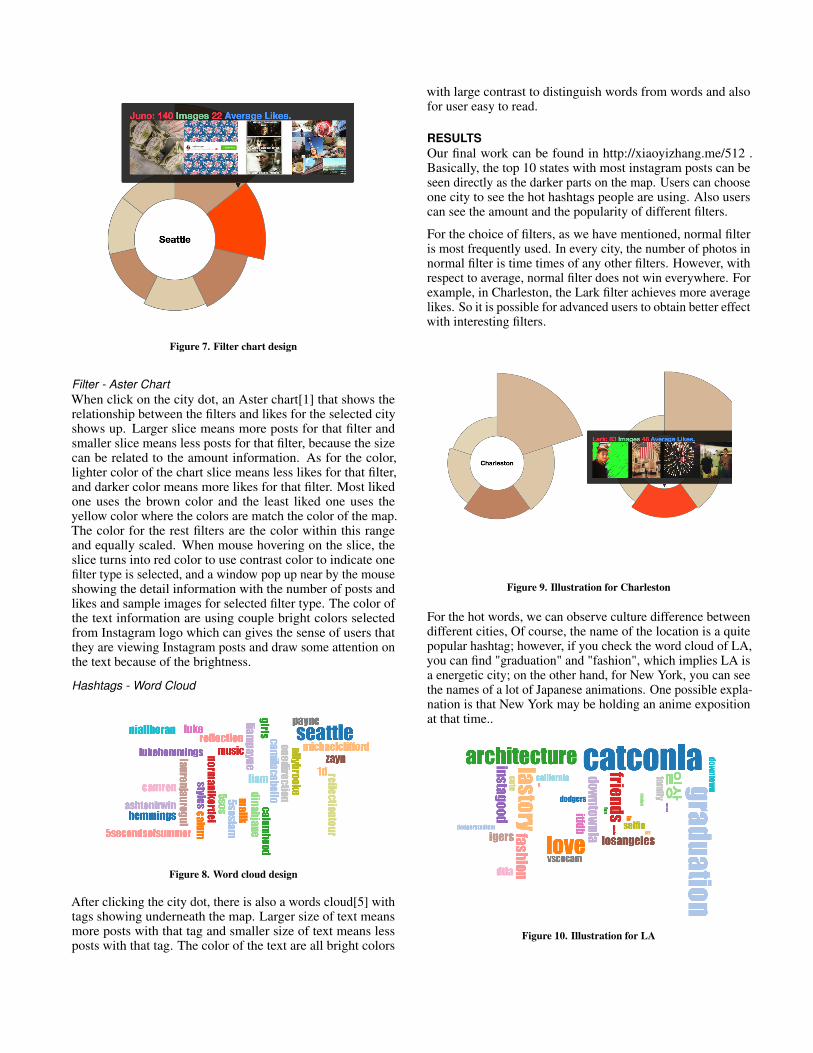
Figure 7. Filter chart design
Filter - Aster ChartWhen click on the city dot, an Aster chart[1] that shows therelationship between the filters and likes for the selected cityshows up. Larger slice means more posts for that filter andsmaller slice means less posts for that filter, because the sizecan be related to the amount information. As for the color,lighter color of the chart slice means less likes for that filter,and darker color means more likes for that filter. Most likedone uses the brown color and the least liked one uses theyellow color where the colors are match the color of the map.The color for the rest filters are the color within this rangeand equally scaled. When mouse hovering on the slice, theslice turns into red color to use contrast color to indicate onefilter type is selected, and a window pop up near by the mouseshowing the detail information with the number of posts andlikes and sample images for selected filter type. The color ofthe text information are using couple bright colors selectedfrom Instagram logo which can gives the sense of users thatthey are viewing Instagram posts and draw some attention onthe text because of the brightness.
Hashtags - Word Cloud
Figure 8. Word cloud design
After clicking the city dot, there is also a words cloud[5] withtags showing underneath the map. Larger size of text meansmore posts with that tag and smaller size of text means lessposts with that tag. The color of the text are all bright colors
with large contrast to distinguish words from words and alsofor user easy to read.
RESULTSOur final work can be found in http://xiaoyizhang.me/512 .Basically, the top 10 states with most instagram posts can beseen directly as the darker parts on the map. Users can chooseone city to see the hot hashtags people are using. Also userscan see the amount and the popularity of different filters.
For the choice of filters, as we have mentioned, normal filteris most frequently used. In every city, the number of photos innormal filter is time times of any other filters. However, withrespect to average, normal filter does not win everywhere. Forexample, in Charleston, the Lark filter achieves more averagelikes. So it is possible for advanced users to obtain better effectwith interesting filters.
Figure 9. Illustration for Charleston
For the hot words, we can observe culture difference betweendifferent cities, Of course, the name of the location is a quitepopular hashtag; however, if you check the word cloud of LA,you can find "graduation" and "fashion", which implies LA isa energetic city; on the other hand, for New York, you can seethe names of a lot of Japanese animations. One possible expla-nation is that New York may be holding an anime expositionat that time..
Figure 10. Illustration for LA
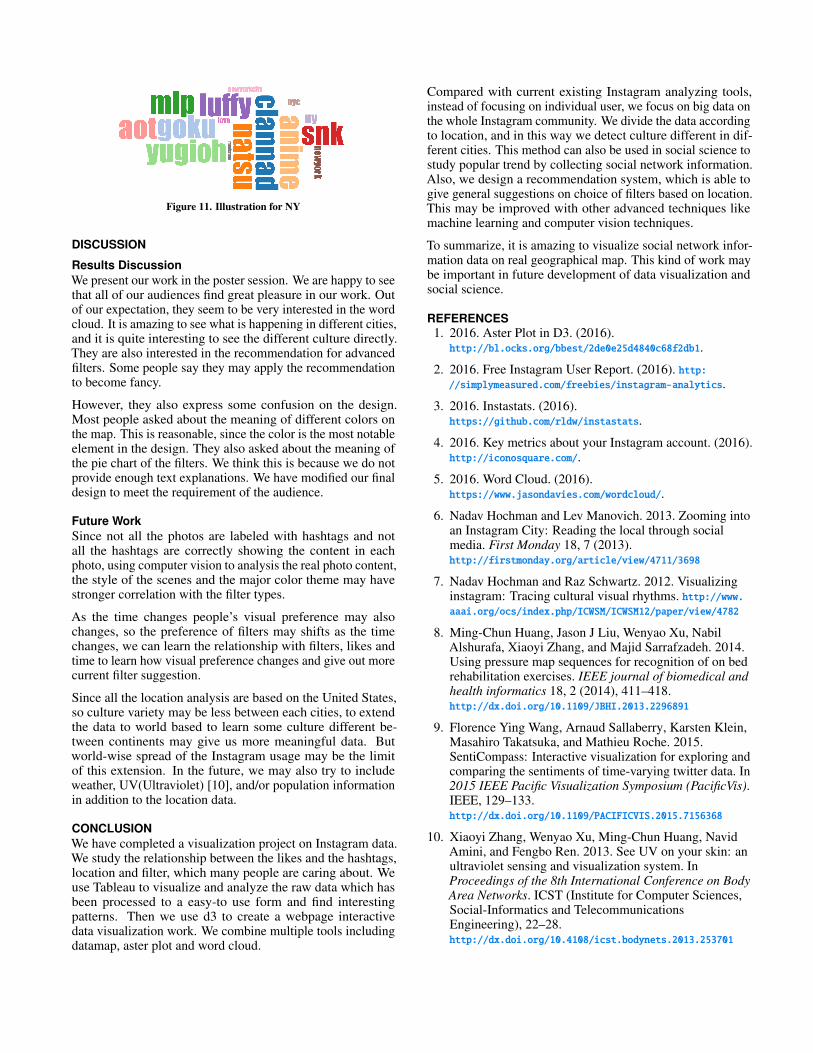
Figure 11. Illustration for NY
DISCUSSION
Results DiscussionWe present our work in the poster session. We are happy to seethat all of our audiences find great pleasure in our work. Outof our expectation, they seem to be very interested in the wordcloud. It is amazing to see what is happening in different cities,and it is quite interesting to see the different culture directly.They are also interested in the recommendation for advancedfilters. Some people say they may apply the recommendationto become fancy.
However, they also express some confusion on the design.Most people asked about the meaning of different colors onthe map. This is reasonable, since the color is the most notableelement in the design. They also asked about the meaning ofthe pie chart of the filters. We think this is because we do notprovide enough text explanations. We have modified our finaldesign to meet the requirement of the audience.
Future WorkSince not all the photos are labeled with hashtags and notall the hashtags are correctly showing the content in eachphoto, using computer vision to analysis the real photo content,the style of the scenes and the major color theme may havestronger correlation with the filter types.
As the time changes people’s visual preference may alsochanges, so the preference of filters may shifts as the timechanges, we can learn the relationship with filters, likes andtime to learn how visual preference changes and give out morecurrent filter suggestion.
Since all the location analysis are based on the United States,so culture variety may be less between each cities, to extendthe data to world based to learn some culture different be-tween continents may give us more meaningful data. Butworld-wise spread of the Instagram usage may be the limitof this extension. In the future, we may also try to includeweather, UV(Ultraviolet) [10], and/or population informationin addition to the location data.
CONCLUSIONWe have completed a visualization project on Instagram data.We study the relationship between the likes and the hashtags,location and filter, which many people are caring about. Weuse Tableau to visualize and analyze the raw data which hasbeen processed to a easy-to use form and find interestingpatterns. Then we use d3 to create a webpage interactivedata visualization work. We combine multiple tools includingdatamap, aster plot and word cloud.
Compared with current existing Instagram analyzing tools,instead of focusing on individual user, we focus on big data onthe whole Instagram community. We divide the data accordingto location, and in this way we detect culture different in dif-ferent cities. This method can also be used in social science tostudy popular trend by collecting social network information.Also, we design a recommendation system, which is able togive general suggestions on choice of filters based on location.This may be improved with other advanced techniques likemachine learning and computer vision techniques.
To summarize, it is amazing to visualize social network infor-mation data on real geographical map. This kind of work maybe important in future development of data visualization andsocial science.
REFERENCES1. 2016. Aster Plot in D3. (2016).http://bl.ocks.org/bbest/2de0e25d4840c68f2db1.
2. 2016. Free Instagram User Report. (2016). http://simplymeasured.com/freebies/instagram-analytics.
3. 2016. Instastats. (2016).https://github.com/rldw/instastats.
4. 2016. Key metrics about your Instagram account. (2016).http://iconosquare.com/.
5. 2016. Word Cloud. (2016).https://www.jasondavies.com/wordcloud/.
6. Nadav Hochman and Lev Manovich. 2013. Zooming intoan Instagram City: Reading the local through socialmedia. First Monday 18, 7 (2013).http://firstmonday.org/article/view/4711/3698
7. Nadav Hochman and Raz Schwartz. 2012. Visualizinginstagram: Tracing cultural visual rhythms. http://www.aaai.org/ocs/index.php/ICWSM/ICWSM12/paper/view/4782
8. Ming-Chun Huang, Jason J Liu, Wenyao Xu, NabilAlshurafa, Xiaoyi Zhang, and Majid Sarrafzadeh. 2014.Using pressure map sequences for recognition of on bedrehabilitation exercises. IEEE journal of biomedical andhealth informatics 18, 2 (2014), 411–418.http://dx.doi.org/10.1109/JBHI.2013.2296891
9. Florence Ying Wang, Arnaud Sallaberry, Karsten Klein,Masahiro Takatsuka, and Mathieu Roche. 2015.SentiCompass: Interactive visualization for exploring andcomparing the sentiments of time-varying twitter data. In2015 IEEE Pacific Visualization Symposium (PacificVis).IEEE, 129–133.http://dx.doi.org/10.1109/PACIFICVIS.2015.7156368
10. Xiaoyi Zhang, Wenyao Xu, Ming-Chun Huang, NavidAmini, and Fengbo Ren. 2013. See UV on your skin: anultraviolet sensing and visualization system. InProceedings of the 8th International Conference on BodyArea Networks. ICST (Institute for Computer Sciences,Social-Informatics and TelecommunicationsEngineering), 22–28.http://dx.doi.org/10.4108/icst.bodynets.2013.253701