Embed Size (px)
Citation preview

ORIGINAL PAPER
Instability of Supported Platinum Nanoparticlesin Low-Temperature Fuel Cells
Y. Shao-Horn Æ W. C. Sheng Æ S. Chen ÆP. J. Ferreira Æ E. F. Holby Æ D. Morgan
� Springer Science+Business Media, LLC 2007
Abstract This paper discusses the mechanisms of surface
area loss of supported platinum (Pt) electrocatalysts in low-
temperature fuel cells. It is argued that submonolayer dis-
solution of Pt nanoparticles governs the surface area loss at
high voltages by increasing the loss of Pt from carbon and
coarsening of Pt nanoparticles on carbon.
Keywords Fuel cell � Catalyst � Platinum �Nanoparticles � Durability � Dissolution � Coarsening �Crystal migration � Transmission electron microscopy �TEM � Ostwald ripening � Solubility � Coalescence
1 Introduction
A fuel cell directly converts chemical energy to electricity
via electrochemical reactions. Although conversion of
hydrocarbon fuels is highly desirable in low-temperature
fuel cell technologies in terms of system energy density,
known electrocatalysts cannot provide conversion effi-
ciencies and rates acceptable for practical applications.
Therefore, hydrogen is typically used as the fuel and
oxygen in air is employed as the oxidant. We here use
proton exchange membrane (PEM) fuel cells to illustrate
the components and the operation of low-temperature fuel
cells. The schematic of a PEM fuel cell is shown in Fig. 1.
Protons produced from oxidation of hydrogen in the anode
flow to the cathode through the membrane, and combine
with oxygen to form water in the cathode. Compensating
charge in the form of electrons flows through the external
circuit and provides the useful work done by the fuel cell.
The three-layer structure of anode, cathode and proton-
conducting medium is referred commonly to as membrane
electrode assembly (MEA). PEM fuel cell electrodes typ-
ically have a thickness of *10 lm, and consist of
electrically connected catalysts in three dimensions (3D)
and an impregnated proton-conducting phase. This elec-
trode structure provides active sites for electrochemical
reactions as well as electron and ion conduction pathways
in 3D. Electrochemical oxidation of hydrogen and reduc-
tion of oxygen can only occur at interfacial boundary
regions, where gas molecules reach catalyst surfaces that
are connected electrically to the external circuit through a
3D conducting network (usually carbon) and are accessible
to the 3D proton-conducting medium. Conventional PEM
fuel cell catalysts typically consist of Pt nanoparticles on
the order of 2–3 nm in diameter, which are dispersed on
the surface of primary carbon particles of 20–50 nm to
maximize the surface area of Pt per unit Pt mass, as shown
in the schematic in Fig. 2a. These primary carbon particles
can form carbon particle aggregates of 100–300 nm in
diameter, which are connected electrically in 3D. Pt
Electronic supplementary material The online version of thisarticle (doi:10.1007/s11244-007-9000-0) contains supplementarymaterial, which is available to authorized users.
Y. Shao-Horn (&) � S. Chen
Electrochemical Energy Laboratory, Department of Mechanical
Engineering, Massachusetts Institute of Technology, Cambridge,
MA 02139, USA
e-mail: [email protected]
W. C. Sheng
Electrochemical Energy Laboratory, Department of Chemistry,
Massachusetts Institute of Technology, Cambridge, MA 02139,
USA
P. J. Ferreira
Materials Science and Engineering Program, University of Texas
at Austin, Austin, TX 78712, USA
E. F. Holby � D. Morgan
Department of Materials Science and Engineering, University of
Wisconsin-Madison, Madison, WI 53706, USA
123
Top Catal
DOI 10.1007/s11244-007-9000-0

loading (measured in mgPt/cm2electrode) and Pt dispersion in
the cathode significantly influence the activation overpo-
tential for oxygen reduction, the efficiency, and the cost of
PEM fuel cells [1, 2]. The state-of-the-art Pt loading is
0:4 mgPt=cm2electrode in the cathode [2] while that required
in the anode can be much lower due to fast electrochemical
oxidation of hydrogen on Pt. Not only is it important to
lower Pt loading in order to reduce fuel cell cost but also it
is essential to maintain the activity of Pt catalysts during
the lifetime of fuel cells.
Coarsening of Pt nanoparticles, which decreases the
ratio of Pt surface atoms to bulk atoms and the availability
of triple phase boundary (TPB) regions in electrodes, and
loss of Pt from the 3D carbon network, increases the
activation overpotential and results in decreased cell volt-
age, efficiency, and lifetime of fuel cells. A dispersion of Pt
nanocrystals is thermodynamically unstable to the growth
and formation of larger crystals or particles driven by
reduction of surface energies. As approximately 5,500 h of
fuel cell operation are required in a vehicle [3], long-term
stability of Pt nanoparticles on carbon is critical to meet the
required lifetime and efficiency of PEM fuel cells. Multiple
processes can degrade the electrochemically active surface
area, particularly at the cathode, and long-term stability of
cathode activity has now emerged as one of the major
challenges to developing commercially viable PEM fuel
cells for automotive applications. Essential to developing
better catalyst stability is an understanding of the funda-
mental mechanisms leading to catalyst activity loss or
surface area loss. Unfortunately, the mechanism of surface
area loss of supported Pt nanoparticles on carbon in contact
with an ion-conducting phase at temperatures lower than
200 �C are not well understood. The mechanism of surface
area loss in the cathode in low-temperature fuel cells has
been a subject of debate in the last three decades with a
resurgence of work in PEM fuel cells in the last 5 years.
In this paper, the microstructure of conventional carbon
supported Pt nanoparticle electrocatalysts is first discussed,
which includes the size, morphology and distribution of Pt
nanoparticles. We then analyze reported evidence for the
two main mechanisms of Pt surface area loss in low-tem-
perature fuel cells, which are Pt migration and coalescence,
and Pt dissolution and redeposition, and summarize dif-
ferent processes that can contribute to Pt surface area loss
in fuel cell electrodes. It is proposed from these analyses
that Pt dissolution governs the surface area loss of fuel cell
electrodes that are exposed to voltages greater than 0.8 V
vs. RHE. The surface area loss results from Pt coarsening
on carbon, and Pt loss from fuel cell electrodes and pre-
cipitation in the ion-conducting phase. We further examine
assumptions used in the debate over the coarsening
mechanism of Pt nanoparticles on carbon, via particle
migration and coalescence and Ostwald ripening. Although
there is no unique evidence to support crystal migration of
Pt nanoparticles on carbon at low temperatures, we argue
that it cannot be ruled out on theoretical grounds.
As controlling Pt dissolution is essential to maintaining
activity of fuel cell electrodes, we focus the latter part of
the paper on the dissolution thermodynamics and kinetics
of Pt nanoparticles. Reported Pt solubility data in acid
solutions and fuel cells are compiled, which show that Pt
solubility is potential and temperature dependent as pre-
dicted by Pourbaix. However, Pt dissolution seen in many
experiments exhibits much weaker potential dependence
than that expected from the Nernstian principle. We pro-
pose that this phenomenon can be attributed to dissolution
Cathode
H2 O2/Air
H2O
Electrical Load
e- e-
H+ OH+
H2O H2O
Proton ExchangeMembrane
Membrane Electrode Assembly
Carbon SupportedPt Particles
Anode
H2 => 2H+ + 2e- 2H+ + 2e- + 1/2O2 => H2O
Fig. 1 Schematic of a typical PEM fuel cell. Hydrogen oxidation and
oxygen/Air reduction take place at the anode and the cathode,
respectively. The electrons generated upon hydrogen oxidation in the
anode pass through the external circuit, combine with oxygen and
protons to form water in the cathode and provide work
(a)
Three-Dimensional Carbon Network
(b)
(111)
(010)
(111) (111)
(001)
(100)
-
-
Equilibrium shape of Pt crystals
Fig. 2 (a) Schematic of Pt
nanoparticles dispersed on
primary carbon particles in
supported Pt electrocatalyst
samples. Pt nanoparticles are
about 2–3 nm in diameter and
the size of the primary carbon
particles is 20–50 nm; (b):
truncated octahedron consisting
of {111}Pt and {100}Pt facets,
which is the equilibrium shape
of Pt crystals at 0 K
Top Catal
123

within the top monolayer, which may be governed largely
by surface defects and defect energetics. Moreover, it is
postulated that the Gibbs–Thomson effect on Pt nanopar-
ticles can lead to dramatically increased driving force for
dissolution and faster dissolution kinetics at room tem-
perature from a theoretical standpoint. This hypothesis is
supported by recent experiment results, which have shown
that increasing average Pt nanoparticle sizes from *2 to
*4 nm, and reducing the number of Pt nanoparticles
smaller than 2 nm, can greatly improve the stability and
reduce Pt surface loss during voltage cycling. Finally, we
conclude with some general remarks about the status of our
understanding in crystal migration, Pt dissolution and
redeposition of Pt nanoparticles at the atomic scale, and
potential opportunities to enhance the stability of supported
Pt electrocatalysts in low-temperature fuel cells.
2 Microstructure of Pristine Supported Pt
Nanoparticles
Supported Pt electrocatalysts can be prepared by either (1)
impregnation of carbon support with Pt precursor solution
and precipitation of Pt nanoparticles by reduction [4]; (2)
adsorption of colloidal Pt particles produced from reactions
of H2PtCl6 and sodium salts on carbon support [5].
Detailed synthetic processes and the effects of carbon
supports on the size and distribution of Pt nanoparticles can
be found in review articles of Auer et al. [6] and Antolini
[4]. We here discuss the size, morphology and distribution
of Pt nanoparticles supported on carbon in conventional
electrocatalysts for PEM fuel cells.
We here show the microstructure of two commercial Pt
catalyst powder samples [46 wt% Pt/C, Tanaka Kikinzoku
Kogyo (TKK)] supported on Vulcan, and a proprietary
high surface area carbon, which are commonly used in
PEM fuel cells. Transmission electron microscopy (TEM)
images of these two samples at low and high magnifica-
tions are shown in Figs. 3a–d and 4a–d, respectively. The
high-resolution TEM images in Figs. 3d and 4d show that
individual Pt nanoparticles are single crystals. It is inter-
esting to note that Pt nanoparticles on carbon typically
appear quasi-circular, on the order of 2–3 nm, and exhibit a
lack of facets. Although it is difficult to tell the 3D shapes
of Pt nanoparticles in the TEM images that project 3D
objects into two-dimensional (2D) images, a few Pt nano-
particles present on the edge of primary carbon particles in
Figs. 3b–d and 4b–c reveal that they are disk-like. From a
thermodynamic point of view, the equilibrium shape of Pt
nanoparticles will be determined by minimization of sur-
face energy per unit area of exposed Pt surfaces provided
that edge and curvature effects are negligible. For ideal
face-centered-cubic (fcc) metals such as Pt, the surface
energy (c) of atomic planes with high symmetry follow the
order of c {111}Pt \ c {100}Pt \ c {110}Pt, as expected
from the surface atomic density [7, 8]. The equilibrium
shape of a Pt crystal at zero temperature has been shown to
be a truncated octahedron (cubo-octahedron) consisting of
Fig. 3 Typical TEM images of
46 wt% of Pt supported on
Vulcan (TKK) from low to high
magnifications (a, c, b to d). The
Pt nanoparticles appear to be
quasi-circular and on the order
of 2–3 nm. High-resolution
TEM images show that
individual Pt nanoparticles are
single crystals (d). The Pt
dispersion is poor on Vulcan.
Some Pt particles agglomerate
near the junctions among
primary carbon particles and
some areas on the surface of
Vulcan carbon have no Pt
nanoparticle (b). The Pt
nanoparticles aspect ratio is of
1.5–4.5
Top Catal
123

{111}Pt and {100}Pt facets [9], as shown in Fig. 2b. Pt
nanoparticles supported on carbon in these TKK fuel cell
electrocatalysts have flattened shapes that deviate from the
equilibrium cubo-octahedron geometry. Some Pt nanopar-
ticles supported on high surface area carbon appear to
exhibit pronounced {111}Pt surfaces as marked in Fig. 4d,
which is consistent with the observations by Ross et al.
[10] for Pt nanoparticles less than 3.5 nm. The shapes of Pt
nanoparticles are dependent on synthesis conditions, which
may vary the nucleation and growth rates of Pt clusters on
carbon surface, the energy of Pt surfaces, and the interface
between Pt and carbon support [11]. The disk-like geom-
etries can provide more contact area with carbon surface,
which may be important to anchoring of Pt nanoparticles
on carbon. In addition, they can yield Pt surface facets
other than the {111}Pt and {100}Pt, and change the size-
dependent surface distribution of Pt atoms as reported by
Kinoshita [12].
Measurements of individual Pt nanoparticles (particle
agglomerates are excluded) in the TEM images show that
Pt nanoparticles supported on Vulcan and high surface area
carbon have very similar sizes and size distributions, which
are shown in Fig. 5a–b. Both sizes and distributions of
these two 46 wt% TKK catalysts are comparable to those
of 20 wt% E-TEK catalysts reported previously [13], and
those found by Markovic et al. [14]. The histograms of Pt
nanoparticles can be used to compute the volume/area
averaged surface area, which is comparable to surface area
measured by electrochemical methods. Typically electro-
chemically active surface area is equal to *70% of the
Fig. 4 Typical TEM images of
46 wt% of Pt supported on high
surface area carbon (TKK) from
low to high magnifications (a, b,
c to d). The Pt nanoparticles
appear to be quasi-circular and
on the order of 2–3 nm. High-
resolution TEM images show
that individual Pt nanoparticles
are single crystals (d). Pt
nanoparticles are well dispersed
on high surface area carbon
support. The Pt nanoparticles
aspect ratio is of 1–3. Some Pt
nanoparticles exhibit
pronounced {111}Pt surfaces as
shown in (d)
2 4 6 8 10 12 14 16 182 4 6 8 10 12 14 16 180
10
20
30
40
50
60
70
80
(a) (b)
0
10
20
30
40
50
60
70
80
Mean=2.5SD = 0.53Min = 1.17Max = 3.8
Sample = 200 particles
Mean=2.8SD = 0.51Min = 1.3Max = 4.0
Sample = 200 particles
Data: Data2_BModel: Gauss
Chi^2/DoF = 3.4848R^2 = 0.99771
y0 -4.88163 ±4.44841xc 2.75149 ±0.01592w 1.30434 ±0.09672A 116.79278 ±14.42983
Data: Data1_BModel: Gauss
Chi^2/DoF = 74.06649R^2 = 0.95321
y0 3.79311 ±5.94694xc 2.98076 ±0.06151w 0.93339 ±0.15965A 84.23166 ±17.44387
Num
ber
of P
artic
les
Num
ber
of P
artic
les
Spherical Particle Size (nm)Spherical Particle Size (nm)
Fig. 5 Histograms of the Pt
nanoparticle size distribution of
the two catalysts in Figs. 3 and
4: (a) 46 wt% of Pt supported
on Vulcan (TKK); and (b)
46 wt% of Pt supported on high
surface area carbon (TKK).
Both of the two catalysts have
similar Pt nanoparticle sizes and
size distributions
Top Catal
123

volume/area averaged surface area from TEM measure-
ments [15, 16]. This difference might be attributed to the
contact area between the Pt nanoparticles and carbon
support, which is considered in the volume/area averaged
surface area calculation but would not be accessed in the
electrochemical measurements.
While the sizes and distributions of Pt nanoparticles are
similar, Pt nanoparticles supported on high surface area
carbon (Fig. 4) show better dispersion than those found on
Vulcan (Fig. 3) as evidenced by the higher number of Pt
nanoparticle agglomerates on Vulcan. Primary Vulcan
carbon particles have a diameter on the order of *40 nm
while that of the high surface area carbon is smaller
(*20 nm). Some Pt particles agglomerate near the junc-
tions among primary carbon particles, and some areas on
the surface of Vulcan carbon have no Pt nanoparticles, as
shown in Fig. 3b. Poor dispersion of Pt nanoparticles on
Vulcan found in the TEM images is consistent with the fact
that the specific area of Pt nanoparticles on Vulcan deter-
mined from measuring the charge of hydrogen adsorption
or desorption in cyclic voltammetry (210 mC=cm2Pt is
assumed) is only 63 m2/gPt [17], which is considerably
lower than Pt supported on high surface area carbon (80–
96 m2/gPt) [1, 17].
3 Instability of Supported Pt Nanoparticles in Low-
Temperature Fuel Cells
Activity loss or electrochemically active surface area loss
of electrodes that consist of Pt nanoparticles supported on
carbon or Pt/C electrocatalysts have been studied exten-
sively in acid solution, phosphoric acid (PA) fuel cells [18–
21] and in PEM fuel cells [3, 15, 22–28]. The loss of
electrochemically active surface area of Pt with time is a
major source of reduced fuel cell voltage. This effect can
be seen in Fig. 6, which shows the degradation during
constant potential holds for a PEM fuel cell short stack
(operated with H2 air (stoichiometric flows of 2/2) under
80 �C, 150 kPaabs, and 100% relative humidity (RH) [15].
The measured surface area loss in Fig. 6a can be related to
the cathode kinetics to show that surface area loss makes a
major contribution to the drop in cell potential shown in
Fig. 6b, particularly at the open circuit voltage condition
[15]. Two major mechanisms have been proposed to
describe Pt surface area loss in fuel cell electrodes: (i)
crystal migration and coalescence, and (ii) Pt dissolution
and redeposition. In the following, we analyze experi-
mental evidence in support of each mechanism, and
summarize potential mechanisms responsible for surface
area loss of supported Pt electrocatalysts in low-tempera-
ture fuel cells.
3.1 Reported Evidence in Support of Pt Coarsening via
Crystal Migration
The two primary arguments in support of Pt coarsening via
crystal migration are based on the absence of voltage
dependence and the shape and growth of the particle size
distributions. Many earlier studies [21, 29, 30] of Pt
nanoparticles supported on carbon fail to observe a sig-
nificant potential dependence (0 V to *0.8 V) of the Pt
area loss over time in phosphoric acid (H3PO4), from
which it was concluded that simple Pt dissolution and
redeposition cannot be the dominating mechanism. Gruver
et al. [30] have shown that the change in the electro-
chemical surface area of Pt nanoparticles supported on
carbon varies to a small extent with the applied potential
[up to 0.75 V vs. the reversible hydrogen electrode (RHE)],
and no change in Pt loading is noted in the cathode, where
the electrodes have been preflooded with *100% H3PO4
and purged with nitrogen at 191 �C.
The particle migration mechanism has implications for
the growth rate and asymptotic shape of the particle size
distribution. The mechanism can be described generally by
surface migration of adatoms on the Pt crystal surface, 2D
motion of Pt crystals on the carbon support, and coales-
cence when crystals meet [31, 32]. In the crystal migration
model, Granqvist and Buhrman [32] have used a simple
Fig. 6 Cell voltage (a) and Pt
surface area (b) as a function of
short-stack runtime. Dashed line
in (b) corresponds to the
calculated Pt surface area loss
[15]. Short stacks were operated
with hydrogen/air
(stoichiometric flows of 2/2)
under 80 �C, 150 kPaabs, and
100% RH
Top Catal
123

statistical method, to show that the asymptotic particle size
distribution is log-normal with respect to volume (with a
distinctive tail at large particle sizes) and Ruckenstein and
Pulvermacher [31] have shown that the rate of particle
growth is dependent on particle loading on support. These
properties have been used to identify when crystal migra-
tion is occurring. For example, Blurton et al. have shown
an asymptotic Pt particle size distribution of Pt nanoparti-
cles with a tail at large particle sizes in an electrode
exposed to air and held at *0.6 V and 163 �C for 645 h
[21]. Based on the shape of this asymptotic distribution,
these authors have related the surface area loss of Pt
nanoparticles in the PA fuel cell environment to the
mechanism of crystal migration and coalescence. The
correlation between steady-state particle size distribution
and the coarsening process has been used later by Wilson
et al. [24] and Tada et al. [25] in understanding the deg-
radation of Pt nanoparticles supported on Vulcan aged
under a constant voltage (0.5 V) or constant current density
(1.5 A/cm2) over a few thousands of hours of operation in a
hydrogen/oxygen PEM fuel cell. As asymptotic Pt particle
size distributions with a tail toward large particle sizes
were found in their cathode, a growth mechanism via
crystal migration was proposed. Although the surface area
loss of Pt nanoparticles is found to be potential dependent,
the difference noted between the cathode and anode has
been attributed to higher levels of hydration [24] or carbon
corrosion [25] at the cathode.
3.2 Reported Evidence in Support of Pt Coarsening and
Loss by Pt Dissolution and Redeposition
During steady-state or transient operation with electrodes
exposed to voltages greater than 0.8 V vs. RHE, the
following observations have been made in support of Pt
surface area loss induced by Pt dissolution and redepo-
sition: (i) the extent of Pt surface area loss is potential
dependent; (ii) loss of Pt from fuel cell electrodes and
detection of Pt nanocrystals in the ion-conducting phase
of low-temperature fuel cells; (iii) the rate of Pt surface
area loss can be accelerated by voltage cycling and
increases with the upper voltage limit; (iv) changes in
the size and distributions of Pt nanoparticles. We will
discuss these four aspects in detail in the following
section.
3.2.1 Potential Dependent Pt Surface Area Loss
Several studies have found that the degree of coarsening of
Pt nanoparticles supported on carbon clearly exhibits
strong voltage dependence at voltages higher than 0.8 V
vs. RHE. This observation supports coarsening of Pt
nanoparticles by the mechanism of Pt dissolution and
redeposition first proposed from studies of Pt black in
H3PO4 by Tseung [33]. Honji et al. [20] have found that Pt
nanoparticles coarsen to larger sizes and the loading of Pt
in the cathode decreases with increasing applied potentials
after a 100-h constant voltage hold (0–0.9 V vs. RHE) at
205 �C in an electrochemical cell setup flooded with
H3PO4 and purged with nitrogen gas. These authors have
thus proposed that the growth of Pt nanoparticles occurs by
redeposition of dissolved Pt in the acid, and reduction of Pt
loading in the cathode is caused by Pt dissolution at volt-
ages greater than 0.8 V vs. RHE. This process of Pt
coarsening is analogous to classical Ostwald ripening,
which describes the growth of large particles at the expense
of small particles through 3D transport of atomic and
molecular species [34–36]. In this context, Ostwald rip-
ening of Pt nanoparticles involves dissolution of Pt from
small nanoparticles, transport of dissolved Pt species and
redeposition (reduction) of Pt species from solution onto
large nanoparticles, as first conceptualized by Ross [37].
It should be mentioned that a different Ostwald ripening
process has been suggested by Bett et al. [29], where Pt
transport would occur via transport of molecular Pt species
on the carbon support, referred to here as ‘‘2D Ostwald
ripening’’. This hypothesis has been proposed based on
experimental findings that neither the effect of Pt loading
(5 wt% Pt/C vs. 20 wt% Pt/C) nor the potential depen-
dence (0.1 to 1 V vs. RHE) on the Pt area loss is significant
[29]. However, to the authors’ knowledge, no definitive
experimental evidence of Pt atom transport on carbon has
been reported to date.
3.2.2 Pt Deposition in the Ion-Conducting Phase
Aragane et al. [19, 38] have first reported the presence of
Pt particles in the matrix of PA fuel cells and Pt loss from
the cathode, which has provided direct evidence for Pt
dissolution from supported Pt nanoparticles in the cathode
and reduction of soluble Pt species with permeated
hydrogen gas molecules in the membrane. Similarly,
Yasuda et al. [28, 39] have detected the appearance of
numerous Pt single crystals on the order of 10–100 nm in
the membrane after potential holds at high voltages such as
0.8 V and 1.0 V in air and nitrogen in PEM fuel cells. In
addition, the amount of Pt found in the matrix and thus the
amount of Pt dissolution has been shown to increase with
increasing cathode potentials [19, 28, 38]. The presence
and diffusion of soluble Pt species in fuel cell electrodes is
further confirmed by the fact that soluble Pt species have
been found in the water collected from the reactant gases
exiting the cell [27].
Top Catal
123

3.2.3 Enhanced Pt Loss upon Voltage Cycling
Pt surface area loss is accelerated upon voltage cycling
compared to extended holds at constant potentials. Ki-
noshita et al. first studied potential cycling effects on Pt
black and Pt nanoparticles on carbon [40] in 1 M sulfuric
acid (H2SO4) purged with nitrogen at 23 �C. They have
shown that the surface area of Pt nanoparticles significantly
decreases upon voltage cycling from 0.05 to 1.25 V vs.
RHE, a result of Pt dissolution into the acid and growth of
large Pt nanoparticles at the expense of small ones. This
phenomenon has been reported for the first time in PEM
fuel cells by Patterson [41], where accelerated Pt area loss
of a hydrogen-air PEM cathode is observed when subjected
to square-wave voltage cycles between 0.87 and 1.20 V
(65 �C and 60 s per cycle). Post-mortem analysis of the
MEA after *100 h reveals the presence of Pt in the
membrane, which implies that Pt diffusion occurs on the
micrometer scale (i.e., *10 lm from the cathode into the
membrane in comparison to *10 nm from a Pt nanopar-
ticle to a neighboring nanoparticle) [41]. Darling and
Meyers [42, 43] have recently developed a numerical
model for the Pt area loss induced by voltage cycling,
which includes a potential-dependent dissolution of Pt
(Pt $ Pt2+ + 2e-, i.e., a 2.303RT/2F potential depen-
dence), chemical dissolution of Pt oxide
(PtO + 2H+ $ Pt2+ + H2O), and surface tension driven
growth of Pt nanoparticles. This analysis has been used to
reasonably model and reproduce Patterson’s voltage
cycling data [41]. Although the model considers diffusion
of Pt2+ from the cathode to the anode and electrochemical
reduction into Pt (Pt2+ + 2e- ? Pt), it does not explicitly
account for the fact that Pt particles have been detected
inside the membrane, as reported by Patterson [41].
The rate and extent of electrochemical surface area loss of
Pt becomes larger with an increase in the upper voltage limit
from 0.8 to 1.2 V (with flowing nitrogen to the cathode)
during voltage cycling, which is accompanied by an
increasing number of Pt crystals observed in the membrane
[44]. It is noted that the distribution of Pt deposition in the
membrane is unaffected by the lower voltage limit [44]. The
presence of hydrogen in the membrane has been shown to be
essential to the appearance of these Pt crystals in the mem-
brane, which supports the claim that these Pt crystals form
by chemical reduction of Pt soluble species with hydrogen
gas [44]. The mechanism of hydrogen induced reduction and
precipitation is in good agreement with the observation that
the location of Pt deposition in the membrane is dependent
on the membrane hydrogen partial pressure and moves
toward the anode with flowing oxygen relative to flowing
nitrogen in the cathode [44]. Although electrochemical
surface area loss of Pt has been qualitatively related to the
amount of Pt deposited in the membrane, the coarsening of
Pt nanoparticles on carbon in the cathode during cycling is
not considered in this study [44].
3.2.4 Changes in the Size and Morphology of Pt
Nanoparticles
Aragane et al. [19, 38] have first analyzed Pt particle size
distributions on carbon in the cathode using TEM. It has
been shown that Pt nanoparticles coarsen to the same
degree from *4 to *7 nm throughout the thickness of the
cathode, and that the loading of Pt on carbon decreases in
the cathode approaching the cathode–electrolyte (matrix)
interface after PA fuel cell operation at 0.7 V for 1,500 h at
190 �C (presumably in 99% H3PO4 and air input for the
cathode). Similar observations have been made in PEM
fuel cell MEA cathode samples (Pt nanoparticles supported
on Vulcan and supported on high surface area carbon) after
voltage cycling between 0.6 V and 1.0 V (with fully
humidified nitrogen at the cathode) at 80 �C [15, 16]. We
show and discuss these findings in some detail. Four TEM
micrographs taken from four different locations, 1, 4, 7 and
10 lm from the diffusion-medium (DM) and cathode
interface, are shown in Fig. 7, respectively. Supported Pt
nanoparticles on the order of 2–3 nm in the pristine MEA
have grown to *6 nm on carbon in the cycled MEA
cathode, which is comparable across the entire cathode.
This observation supports that the coarsening of spherical
Pt particles on carbon across the cycled MEA cathode
thickness proceeds in one single process—Ostwald ripen-
ing on the nanometer-scale. As Ostwald ripening is driven
by reduction of surface energy of Pt particles, very small Pt
particles should disappear, and the small particle size end
of the distribution should shift to larger values in the cycled
MEA cathode relative to the pristine sample. This is con-
sistent with the fact that the number of Pt particles no
larger than 5 nm is reduced significantly in the cycled
MEA cathode in Fig. 7. Moving toward the membrane, the
weight of Pt on carbon decreases while the amount of Pt
deposited in the ionomer phase increases in the cycled
MEA cathode. The increasing weight percentage of Pt in
the ionomer phase towards the cathode/membrane interface
can be explained by the fact that the flux of cross-over
hydrogen required for Pt precipitation in the ionomer phase
is the highest at the cathode/membrane interface in the
cathode, and it decreases considerably with increasing
distance from the cathode/membrane interface upon fast
electro-oxidation and depletion of hydrogen in the cathode.
Relative contributions of Pt coarsening on carbon and loss
of Pt from carbon in the cathode have been quantified from
analysis of cross-sectional TEM images, as shown by
previous studies [15, 16]. The decrease in the weight of Pt
remaining on carbon has been quantified from the
Top Catal
123

histograms of Pt nanoparticles across the cathode thickness
[15], from which the amount of Pt crystals precipitated in
the ionomer phase is obtained. Although the Pt precipita-
tion mechanism dominates near the cathode–membrane
interface, the contributions of Pt loss and Pt coarsening to
the overall Pt surface area loss averaged over the entire
cathode have been found similar. It is assumed that each
mechanism is responsible for 50% of total Pt area loss
(reduction of roughly 1/3 of the original Pt surface area in
the fresh MEA cathode), as shown in Fig. 8 [15, 16]. It
should be noted that cycled cathode samples that consist of
Pt nanoparticles supported on Vulcan and high surface area
carbon exhibit similar changes across the cathode thickness
[15, 16], which may indicate that the impact of support in
Pt surface area loss in this cycling experiment is small. No
significant change is noted in the anode in the cycled MEA,
as shown in Fig. 9, which further confirms that Pt disso-
lution activated at high voltages is key to Pt loss from fuel
cell electrodes and coarsening of Pt nanoparticles on car-
bon during voltage cycling.
3.3 Proposed Mechanisms for Instability of Pt
Nanoparticles in Low-Temperature Fuel Cells
In general, there are four processes that have been con-
sidered relevant to the loss of electrochemically active
surface area of Pt in the fuel cell electrodes:
1. Ostwald ripening based coarsening of individual Pt
nanoparticles on carbon, which may involve dissolu-
tion of Pt from small particles, diffusion of soluble Pt
species from small to large particles in the ionomer
phase and redeposition/reduction of soluble Pt species
onto large particles on the nanometer-scale, as shown
in Fig. 10a. This process is analogous to the Ostwald
ripening process [34–36] that typically involves trans-
port of atoms or molecules from small particles to
large particles and growth of large particles at the
expense of small ones, driven by reduction in the
surface energy. This mechanism is likely to be in part
responsible for surface area loss in the fuel cell
Fig. 7 Top: Schematic of the cycled cross-sectional MEA cathode
and TEM images were obtained sequentially in the direction
perpendicular to the membrane surface from the diffusion medium–
cathode interface to the cathode/membrane interface. Middle: (1)–(4)
are corresponding TEM micrographs obtained from locations 1, 2, 3
and 4 in the cross-sectional MEA cathode shown in the schematic
(top). Bottom: (1)–(4) Pt particle size histograms measured from
TEM micrographs (middle) of the cross-sectional cycled MEA
cathode. All four histograms were obtained from a measurement of
100 particles [15].
Top Catal
123
cathode when the cathode is exposed to voltages
higher than 0.8 V vs. RHE (steady-state or transient),
where the solubility of Pt nanoparticles is significant
[15, 20, 45–48].
2. Pt crystal migration and coalescence, which involves
motion of Pt particles and coalescence where they
meet on the carbon support, as shown in Fig. 10b.
Crystallite migration and coalescence in the absence of
electrolyte is observed clearly in gas-phase sintering
studies of Pt/C catalysts but is insignificant at temper-
atures below 500 �C in the gas-phase [49]. Although
unique experimental evidence of crystal migration of
Pt nanoparticles in low-temperature fuel cells has not
been reported, it has been proposed [24, 25] that this
process is responsible for surface area loss in the fuel
cell cathode when the cell voltages are low, since the
solubility of Pt nanoparticles is believed to be negli-
gible at voltages lower than 0.7 V vs. RHE from bulk
Pt measurements [46].
3. Detachment of Pt nanoparticles from the carbon
support and agglomeration of Pt nanoparticles, gener-
ally induced by carbon corrosion, as shown in
Fig. 10c. The extent by which this process contributes
to the loss of electrochemical activity of fuel cell
electrodes is dependent on the cell voltage, the nature
of interactions between Pt nanoparticles and the carbon
support, the degree of graphitization of carbon support,
and potentially other factors, such as the RH value.
Although corrosion of conventional carbon supports
such as Vulcan is considered negligible at cell voltages
lower than 0.8 V in low-temperature fuel cells [50],
carbon corrosion and weight loss has been shown to be
significant at voltages higher than 1.1 V vs. RHE
[50, 51].
4. Dissolution and reprecipitation of Pt single crystals in
the ionomer and membrane by chemical reduction of
soluble Pt species with hydrogen molecules, which
result in loss of Pt from the carbon support and loss of
electrode activity, as shown in Fig. 10d. A consider-
able number of hydrogen molecules can permeate
through the proton-conducting membranes in the
MEA, and the location of Pt deposition in the
membrane is dependent on the partial pressure of
oxygen in the cathode [39, 44] (the higher partial
pressure of oxygen, the closer Pt deposition relative to
the anode in the MEA). Pt coarsening via this process
Fig. 8 Relative Pt surface area loss (solid triangles) on the nanome-
ter-scale (Ostwald ripening on the carbon support) and the
micrometer-scale (diffusion of oxidized Pt species and precipitation
of Pt particles in the ionomer phase) mechanisms across the cathode
after 10,000 voltage cycles. The lower line depicts the percentages
(solid circles) of the remaining electrochemically active Pt surface
area (on the carbon support) across the electrode (lower gray region).
The upper gray region corresponds to the Pt surface area lost by Pt
precipitation in the ionomer phase. The white region depicts the
relative Pt surface area lost associated with Ostwald ripening of Pt on
the carbon support. The inserted upper TEM image: nonspherical
particles off carbon support are increasingly more abundant toward
the cathode/membrane interface. The inserted lower TEM image:
spherically shaped Pt nanoparticles on carbon predominate near the
DM/cathode interface [15].
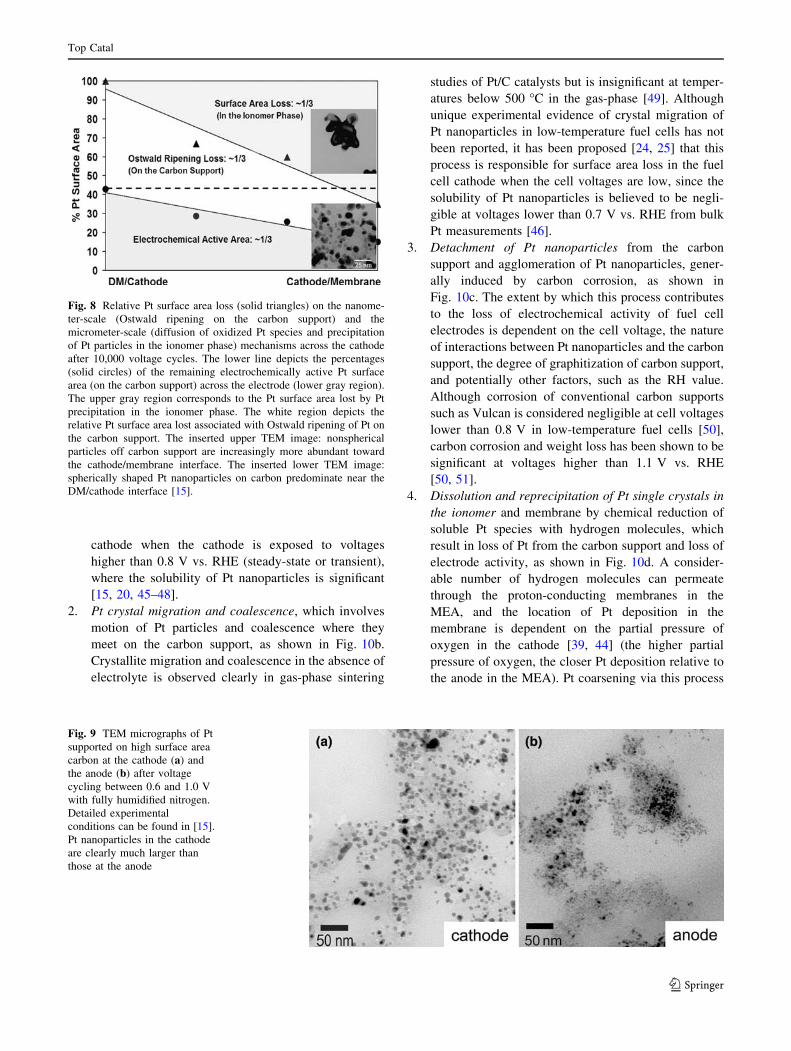
Fig. 9 TEM micrographs of Pt
supported on high surface area
carbon at the cathode (a) and
the anode (b) after voltage
cycling between 0.6 and 1.0 V
with fully humidified nitrogen.
Detailed experimental
conditions can be found in [15].
Pt nanoparticles in the cathode
are clearly much larger than
those at the anode
Top Catal
123

occurs on the micrometer-scale, which leads to
substantial loss in Pt available for electrochemical
reactions at the cathode.
A large amount of uncertainty still surrounds the active
coarsening mechanism (Ostwald ripening or crystal
migration) under different conditions, which we discuss in
detail below.
3.3.1 Ostwald Ripening vs. Crystal Migration
Whether coarsening of Pt nanoparticles on carbon occurs by
crystal migration and coalescence or Ostwald ripening via Pt
dissolution and redeposition has been a long-standing debate
in the literature. We here discuss underlying assumptions
used to distinguish these two mechanisms and discuss their
validity. Ample experimental evidence for the presence of
soluble Pt species and growth of large Pt nanoparticles at the
expense of small particles has been reported, which is
indicative of the Ostwald ripening mechanism. However,
detailed atomic processes associated with Ostwald ripening
via Pt dissolution and redeposition are not understood. The
idealized crystal migration model implies an asymptotic
particle size distribution that is log-normal in volume (with a
distinctive tail at large particle sizes) [32] and a rate of par-
ticle growth that depends on particle loading [31]. In
contrast, Ostwald ripening results in an asymptotic particle
size distribution with a tail on the small particle end, a
maximal particle size cutoff, and a Pt-loading-independent
growth rate [36, 52, 53]. These characteristics have been
used frequently in the identification of coarsening mecha-
nisms underlying experimental data in the previous studies.
Unfortunately, these comparisons have failed to yield defi-
nite results for Pt coarsening mechanisms in PEM and PA
fuel cells. We believe this is largely due to the fact that
experimental and computational limitations have forced the
use of approximate models for complex real situations. There
are several major challenges in the deduction of Pt
(a) Growth via Modified Ostwald Ripening
Carbon support
Pt => Pt x+ + xe - Ptx+ + xe - => Pt
Dissolution Redeposition
Transportof Pt x+ complex
(c) Detachment from carbon support
Carbon support
Detachment
(b) Coalescence via Crystal Migration
Carbon support
(d) Dissolution and Precipitation in the Ion Conductor
Pt => Pt x+ + xe -
Ptx+
complex
Membrane/ionomer
H2 Pt single crystals
H2 + Pt x+ => Pt + 2H +
Fig. 10 Proposed mechanisms
for instability of Pt
nanoparticles in low-
temperature fuel cells: (a):
dissolved Pt species from
smaller particles diffuse through
ionomer phase and redeposit
onto the surfaces of larger
particles (Ostwald ripening);
(b): Pt nanoparticles migrate on
the surface of carbon support
and coalesce; (c): Pt
nanoparticles detach from the
carbon support and/or
agglomerate due to carbon
corrosion; (d): Soluble Pt
species from the cathode are
reduced and precipitated out in
the ionomer and membrane by
chemical reduction by
permeated hydrogen molecules
from the anode
Top Catal
123

coarsening mechanisms based on comparing to theoretical
load dependence, surface area loss rate laws, and asymptotic
particle size distributions. First, uncertainties reside in
comparison between experimental and computational par-
ticle size distributions as experimentally determined particle
size distributions of Pt might not reach the asymptotic limit.
Second, multiple coarsening processes can simultaneously
give rise to the experimental particle size distributions. This
can be particularly problematic in the crystal size distribution
of Pt particles in the aged cathode determined from X-ray
powder diffraction, which averages over many areas and
may consist of Pt crystals that have been coarsened by dif-
ferent processes. A particle size distribution that involves
multiple processes cannot be used to deduce the mechanism
of Pt coarsening by comparison to single process models. For
example, Ferreira et al. have shown [15, 16] Pt nanoparticles
averaged across the thickness of the cycled MEA cathode
show a particle size distribution with a tail at large Pt crystal
sizes, where most particles greater than 10 nm correspond to
Pt crystals off the carbon support. Although the particle size
distributions of image 2–4 in Fig. 7 have a tail towards large
Pt crystals, it is apparent from these TEM images and the
location of these large Pt crystals (off the carbon support) that
they cannot be formed by crystal migration and coalescence.
A third problem associated with particle size distributions
comes from tying mechanisms to the overall rate law for
surface area loss. The reaction rate laws of the different
coarsening mechanisms overlap enough that it is very diffi-
cult to differentiate these processes using kinetic parameter
fitting alone. Finally, observation of necked Pt nanoparticles
on carbon has been used to support crystal migration, which
is an important aspect of cycled cathodes not captured by the
particle size distribution based analyses discussed above. An
example of necking of Pt crystals is shown in Fig. 11, where
several single crystals of Pt on the order of*5 nm are joined
together on the carbon support. While necking is expected
during the coalescence of migrating particles, the observa-
tion of these necked Pt nanoparticles does not provide
unambiguous evidence for crystal migration as these necked
regions can be developed by effective capture of soluble Pt
species and preferred Pt deposition in the region between
adjacent Pt nanoparticles. Therefore, to the authors’
knowledge, there is no unique experimental evidence in the
literature to support the mechanism of crystal migration and
coalescence in PEM fuel cells.
Corrosion of carbon support can contribute to the
movement of Pt nanoparticles, which can lead to coales-
cence of Pt nanoparticles and the formation of necked
regions, which further complicates the identification of
active crystal migration. Although it is believed that carbon
corrosion is not significant upon voltage cycling between
0.6 and 1.0 V with fully humidified nitrogen, a few primary
carbon particles in the MEA cathode have been found to
exhibit rougher particle edges and non-uniform transmitted
intensities within the particle in comparison to pristine
Vulcan particles, as shown in Fig. 12a–b. It is surprising to
note, however, that carbon corrosion in the cathode has
been shown to be severe in a fuel cell held at a low voltage
of *0.67 V vs. RHE with flowing air in a recent work of
Guilminot et al. [54]. Localized thinning (corrosion) of
carbon particles may weaken the attachment of Pt nano-
particles on the carbon support and may result in migration,
coalescence and agglomeration of Pt nanoparticles.
Although the electrochemical area loss of Pt in the MEA
cathode upon voltage cycling with the upper voltage limit
higher than 0.8 V has been attributed primarily to coars-
ening of individual Pt nanoparticles on carbon and Pt loss
from the carbon support associated with Pt dissolution and
redeposition, movement and coalescence of Pt nanoparti-
cles on carbon can also contribute the MEA cathode
surface loss. The extent may depend on the interactions
between Pt nanoparticles and the carbon support, the
degree of graphitization of carbon support, etc. Although
there is no definitive experimental evidence for crystal
migration of Pt nanoparticles under PEM fuel cell condi-
tions, the possibility is still under active consideration,
particularly for Pt particles supported on graphitized sur-
faces. Therefore, we here discuss what might influence the
mobility of Pt particles from theoretical grounds.
3.3.2 Mobility of Pt Nanoparticles on Carbon
A more quantitative understanding of Pt particle mobility
on carbon is desired to establish if crystal migration is
likely to play a significant role. This would allow one to
assess the likely contribution of crystal migration under
PEM fuel cell temperatures. Some insight on the possible
physics underlying crystal migration can be obtained by
stepping back from the full PEM fuel cell liquid environ-
ment and considering the simpler case of diffusion in the
gas environment. If we assume a typical interparticle dis-
tance of l, we can then assume that significant coarsening
occurs in a time s over which particles move approximately
this distance. An effective diffusion constant D can be
estimated by D = l2/s. By considering l = 10 nm (corre-
sponding to a particle density of 1012/cm2) and a
characteristic time of about s = 105 s (approximately the
time to lose a quarter of the surface area at 600 �C in the
data from Bett et al. [49]) we get D(600 �C) = 10-21 m2/s.
While this is very approximate, it can be usefully compared
to recent molecular dynamic simulations by Chen and
Chan [55], who have found D values around 10-12 m2/s at
room temperature for Pt nanoparticles up to 500 atoms
(about 2.5 nm diameter) on an idealized graphite surface.
Although the simulations make use of quite simplified
Top Catal
123

interatomic potentials, the vast difference of an increase of
9 orders of magnitude, which would only be further
increased by performing the molecular dynamics at
600 �C, strongly suggests that a model of Pt particles dif-
fusing on idealized graphite is inadequate to explain the gas
phase data of Bett et al. [49]. The discrepancy suggests that
other Pt–carbon interactions, presumably trapping at car-
bon defects, must dominate the physics of Pt particle
migration. This hypothesis was suggested by Bett et al.
[49] who used a trapping model from Phillips et al. [56] to
explain anomalously fast coarsening for high Pt loading. In
order to explain their surface area changes in nitrogen for
5 wt% Pt on carbon at 600 �C, Bett et al. [49] proposed a
trapping energy of 1.8 eV. This large value would likely
rule out any significant transport at 80 �C. However, it is
not clear that this large trapping energy would persist in a
liquid environment. For example, a likely candidate for
trapping sites are step edges, whose dangling bonds have
been shown to strongly bond Au atoms in ab initio studies
[57]. Competitive binding from ions in the electrolyte for
these step edges might greatly reduce the effective trapping
barrier, enhancing mobility of Pt particles by many orders
of magnitude. If such a model were valid, a strong
dependence of Pt coarsening on the carbon defect con-
centration is expected. Further work is necessary to
determine realistic trapping models to quantitatively
describe the Pt particle motion in an electrolyte environ-
ment and assess the conditions under which particle
migration and coalescence might be active. Such models
would provide new insights into synthesis of stable metal
nanoparticles supported on graphitized surfaces.
4 Solubility of Bulk Pt and Pt Nanoparticles in Acid
Solutions
Understanding and reducing Pt dissolution is key to
increase Pt catalyst stability in low-temperature fuel cells.
In particular, dissolution underlies the 3D Ostwald rip-
ening mechanism, which can enable the growth of large
Pt nanoparticles at the expense of small ones (Fig. 10a)
and loss of Pt from the carbon support via precipitation of
Pt in the ionomer and membrane (Fig. 10d). Therefore, it
is of great importance to understand processes and
parameters that influence Pt dissolution so that they can
be controlled. The starting point for understanding Pt
dissolution in PEM fuel cells is the equilibrium concen-
tration of dissolved Pt at a given potential and
temperature in acidic environments (consistent with those
found in PEM fuel cells).
Fig. 12 TEM micrographs
show the carbon structures in
the MEA cathode before (left)
and after (right) voltage cycling
between 0.6 and 1.0 V with
fully humidified nitrogen.
Detailed experimental
conditions can be found in [15].
The right image exhibits
rougher particle edges and non-
uniform transmitted intensities
within the particle in
comparison to carbon particles
in the pristine Pt/Vulcan sample
Fig. 11 TEM images from low to high magnifications (left to right)
show Pt nanoparticle necking in the cycled MEA cathode after
voltage cycling between 0.6 and 1.0 V with fully humidified nitrogen.
Detailed experimental conditions can be found in [15]. Several single
crystals of Pt on the order of *5 nm joint together on the carbon
support
Top Catal
123

4.1 Potential and Temperature Dependent Pt Solubility
Both potential and temperature can strongly influence
equilibrium Pt solubility. In order to understand Pt disso-
lution thermodynamics relevant to stability of Pt
nanoparticles in low-temperature fuel cells, we here com-
pare equilibrium Pt solubility behavior as predicted by
Pourbaix and reported steady-state Pt solubility data in the
literature.
4.1.1 Nernstian Prediction of Pt Solubility
Pt is electrochemically stable in acids at low potentials
relative to RHE potential but Pt dissolves in acidic solu-
tions at high potentials. At 25 �C, Pourbaix [45] has
suggested that Pt dissolution can occur at voltages greater
than 0.85 V vs. RHE and pH values in the range of 0 and -
2. Following Pourbaix [45], Pt may be oxidized by the
following two reactions:
PtðsÞ $ Pt2þðaqÞ þ 2e� ð1aÞ
PtðsÞ þ H2O$ PtOðsÞ þ 2Hþ þ 2e� ð1bÞ
where PtO(s) may be dissolved chemically in acid to form
Pt2+. The equilibrium concentration of soluble Pt2+ in
reaction (1a) can be related to the applied potential E using
the Nernst equation:
cPt2þ ¼ exp2FðE � E0ðTÞÞ
RT
� �ð2Þ
where the activity coefficient of soluble Pt2+ ions is
assumed to be 1 and cPt2þ is the Nernstian concentration of
soluble Pt2+ in molar (M) under the applied voltage E. E
and E0(T) are the applied and reversible voltages versus
RHE at a given temperature T, respectively. It should be
noted that as the Nernstian concentration of soluble Pt2+ in
Eq. 2 is independent of pH. RHE and standard hydrogen
electrode (SHE) may be used interchangeably in the
following discussion. At 25 �C, E0 = 1.188 V vs. SHE or
RHE [45]. The Nernstian concentration of Pt2+ as shown by
Pourbaix is very low but increases over three orders of
magnitude from 0.8 to 0.95 V vs. RHE, as shown in
Fig. 13. The Nernstian principle in Eq. (2) predicts that, on
a log plot vs. potential, the overall magnitude of the Pt2+
concentration for zero potential is set by -E0(T) 9 2F/
(2.303RT). The slope is such that a 10-fold increase of the
Pt2+ concentration is correlated to every 2.303RT/2F
increase in potential, which translates to 29.5 mV at
25 �C and 46.5 mV at 196 �C. Bindra and Yeager [46]
have measured dissolution of Pt foil in the voltage range of
0.8 to 0.95 V in 96% H3PO4 at 196 �C, and have shown
Nernstian potential dependence that is in good agreement
with the reaction in Eq. 1 as proposed by Pourbaix, as
shown in Fig. 13. It should be noted that the concentration
of soluble Pt species increases considerably with
temperature. This is primarily due to the RT term in the
denominator of the exponential, but also in part due to the
reduction in the equilibrium potential E0(T) at elevated
temperatures. The equilibrium potential E0(T) is related to
the change in Gibbs free energy of the chemical reaction
associated with oxidation of Pt and reduction of hydrogen,
which can be written as:
DG0ðTÞ ¼ �ð2FÞE0ðTÞ ð3ÞAlthough the temperature-dependent data of DG0(T) are
not available in the literature to the authors’ knowledge,
one can estimate DG0(T) and E0(T) at other temperatures
from the values at 25 �C [45] and 196 �C [46] from the
following equation [59]:
DG0ðT2Þ � DG0ðT1Þ ¼ DC0PðT2 � T1Þ
� DS0ðT298 KÞðT2 � T1Þ � DC0PT2 ln
T2
T1
ð4Þ
We can further simplify Eq. 4 and obtain a linear
temperature dependence by assuming that DC0P for the
chemical reaction is very small:
DG0ðT469 KÞ � DG0ðT298 KÞ � CðT469 K � T298 KÞ ð5Þ
Here C is a constant that can be fit to experimental
dissolution data. One may estimate DG0(T) and E0(T) at a
Fig. 13 The equilibrium dissolved Pt concentrations taken from
previous studies of Ferreira [15], Wang-pc [47], Wang-np [58], Honji
[20], Bindra [46], and predicted with a Nernstian relationship for
Pt ? Pt2+ + 2e-. Pourbaix data are calculated from Eq. 2 for
temperatures 25, 80, and 196 �C [45]. Experimental details for each
of the other data sets are given in Table 1
Top Catal
123

given temperature between 25 and 196 �C from the
following:
DG0ðTÞ � DG0ðT298 KÞ þ CðT � T298 KÞ ð6Þ
�2FE0ðTÞ ¼�DG0ðT298 KÞ þ
�DG0ðT469 KÞ � DG0ðT298 KÞ
T469 K � T298 K
�
� ðT � T298 KÞ�
ð7Þ
DG0(T298 K) can be calculated from the Pourbaix
E0(298 K) using Eq. 3 while the value of DG0(T469 K)
can be estimated from Bindra and Yeager’s Pt
concentration data [46] using the Nernst principle and
Eq. 3. The solubility of Pt as a function of potential at
80 �C can then be interpolated from Eq. 7 and is shown as
the dashed line in Fig. 13.
4.1.2 Reported Pt Solubility Data
Solubility data of Pt in acid reported in the literature are
compared in Fig. 13, and key experimental conditions of
these studies such as Pt morphology (e.g., due to Pt foil vs.
nanoparticles), temperature, and atmosphere are summa-
rized in Table 1 (a more complete set of solubility data can
be found in Supporting Information—Fig. S1). We here
compare experimental findings of Pt solubility with the
proposed surface oxidation mechanism of Pt and the
Nernstian prediction in detail. Although the reported con-
centrations of soluble Pt species are found to generally
increase with increasing temperature and voltage at volt-
ages lower than *1.0 V vs. RHE, the potential dependence
and the magnitude of solubility considerably deviate from
the Nernstian behavior. This deviation can be thought of as
occurring in two ways. First, the solubility of polycrystal-
line Pt (Wang-pc in Fig. 13) and Pt nanoparticles (Wang-
np in Fig. 13) has been shown to first increase in the
voltage range from 0.85 to 1.0 V vs. RHE, and decrease or
reach a plateau at voltages greater than about 1.1 and 1.0 V
vs. RHE, respectively [47, 58]. This observation is con-
sistent with the proposed surface oxidation mechanism of
Pt, where the growth and place-exchange PtO atomic layers
can passivate the Pt surface and reduce Pt dissolution [61,
62] (see further discussion of the oxidation process below).
In addition, Darling and Meyers have used a kinetic model
to show that complete coverage of PtO on Pt leads to sharp
reduction in the solubility of Pt nanoparticles at voltages
greater than 1.1 V vs. SHE at 50 �C and 176 �C [42].
Second, the solubility of Pt in acid has been found to
increase considerably with increasing temperature and
voltage, which is in general agreement with the Nernstian
principle. However, with the exception of the data reported
by Bindra and Yeager [46], which show the Nernstian
potential dependence (one decade increase in the Pt2+
concentration for every 46.5 mV increase in voltage at
196 �C in Fig. 13), all other reported data of Pt solubility
show a much weaker voltage dependence than that
expected from the Nernstian behavior. This discrepancy
can be seen clearly by comparing the experimental data of
Wang et al., [47, 58], Ferreira et al. [15], and Honji et al.
[20] to the Nernstian potential-dependent solubility values
(the Pourbaix lines at 25 �C, 80 �C and 196 �C in Fig. 13)
as predicted from Eq. 2 at voltages lower than 1.1 V vs.
RHE. The results of Pt nanoparticles reported by Ferreira
et al. and that of Pt polycrystalline wire reported by Wang
et al. (Wang-pc) show an approximately n = ½ Nernstian
behavior in regions between 0.85 and 1.1 V, where n
represents the number of electrons involved in the
Table 1 Summary of characteristics of studies of dissolved Pt
concentration in acid. Temperature column lists the temperature at
which the dissolution equilibrates, acid is the liquid into which the Pt
is dissolved, Pt morphology is the structure of the solid phase Pt
source, max. dissolved monolayers gives the equivalent number of Pt
monolayers from the surface needed to yield the maximum measured
dissolved Pt, and atmosphere gives the gas environment in which the
experiment is performed
Name Temperature (�C) Acid Pt morphology Max. dissolved monolayers Atmosphere
Ferreira 80 0.5 M sulfuric Nanoparticle 2 9 10-2 N2
Wang-pc 23 0.57 M perchloric Polycrystalline 2 9 10-1 Ar
Wang-np 23 0.57 M perchloric Nanoparticle 1 9 10-2 Ar
Ota-a 23 1 M sulfuric Pt black 5 9 10-2 O2/Air
Ota-b 51 1 M sulfuric Pt black 1 9 10-1 O2
Ota-c 76 1 M sulfuric Pt black 3 9 10-2 Air
Honji 206 19 M phosphoric Nanoparticle 5 9 10-1 N2
Bindra 196 18.6 M phosphoric Foil \6-1440 N2
Komanicky 25 0.6 M perchloric Single crystal surfaces 5 9 10-1 Ar
The names refer the first authors in the following references: Ferreira [15], Wang-pc [47], Wang-np [58], Ota-a,b,c [48], Honji [20], Bindra[46],
Komanicky [60]. Wang-pc and Wang-np refer to polycrystalline and nanoparticle samples, respectively. In all data sets potential is controlled by
an electrode except for Ota-a,b,c, where the potential is set by equilibration with an oxygen containing atmosphere
Top Catal
123

electrochemical dissolution reaction and affects the
Nernstian potential dependence by 2.303RT/(nF). This
n = 1/2 behavior cannot be explained by the reaction
model in Eq. 1 from the Nernstian point of view. In
addition, Wang et al. [58] have shown that Pt nanoparticles
exhibit even lower potential dependence (n = *0.2) and
similar concentrations of soluble Pt species in comparison
to the Pt polycrystalline sample in the voltage range from
0.85 to 1 V at 23 �C. Moreover, it should be mentioned
that Komanicky et al. [60] have recently studied the solu-
bility of Pt single crystal surfaces at 25 �C in 0.6 M
perchloric acid and have found that the solubility is not
monotonically dependent on potential in the voltage range
from 0.7 and 1.1 V vs. RHE (see Supporting Information—
Fig. S2). As their concentrations of soluble Pt species in
acid were measured after only 24 h, which, under room
temperatures conditions, was found by Wang et al. [47] to
be too short to reach steady-state Pt concentrations, the
results of Komanicky et al. are not included in Fig. 13 and
are not discussed in the context of the Nernstian principle.
Lastly, considerably higher concentrations of soluble Pt
species than those predicted by Pourbaix are noted at
voltages lower than 0.95 V vs. RHE for a given tempera-
ture, which is particularly pronounced for the solubility
data of Pt nanoparticles reported by Wang et al. [47, 58],
Ferreira et al.[15], and Honji et al. [20], as shown in
Fig. 13.
The discrepancy between reported Pt solubility data and
predicted values of the Pourbaix model is not presently
understood. Provided that impurity effects and analytical
measurement errors can be excluded from our experiments,
the deviation from the Nernstian behavior may be attrib-
uted to: (i) multiple chemical or electrochemical processes
governing the concentration of soluble Pt species; (ii)
surface morphologies of Pt samples that influence the
thermodynamics and the kinetics of Pt dissolution if less
than one monolayer of Pt is dissolved; (iii) particle size
effects on the solubility as the surface energy of nanopar-
ticles can influence the thermodynamics and kinetics of Pt
dissolution. (i) If Pt dissolution were controlled by the
reaction in Eq. 1a alone, the concentration of soluble Pt
species should be independent of pH, as shown in Eq. 2.
However, Ota et al. [48] have shown that the solubility of
Pt nanoparticles at 1.03 and 1.08 V vs. RHE decreases with
increasing pH, which suggests that chemical reactions such
as dissolution of PtO in acid and/or other electrochemical
reactions similar to the reaction in Eq. 1b play an important
role in Pt dissolution. Further experimental and theoretical
studies are required to elucidate the process of Pt dissolu-
tion in acid at the atomic scale; (ii) surface morphologies of
Pt samples that influence the thermodynamics and the
kinetics of Pt dissolution if less than one monolayer of Pt is
dissolved. We will examine and discuss the amount of Pt
dissolved in the previous studies listed in Table 1 [15, 20,
46–48, 58, 60] with respect to the observed potential
dependence; (iii) particle size affects on the solubility as
the surface energy of nanoparticles can influence the
thermodynamics and kinetics of Pt dissolution. For exam-
ple, the experimental data reported by Pourbaix [45] and by
Bindra et al. [46] were conducted with polycrystalline Pt
foils while those of Ferreira et al. [15] were conducted on
Pt nanoparticles, and differences between these might
therefore be expected. We will discuss the influence of the
Gibbs–Thomson term on the stability and dissolution rate
of Pt as a function of particle size below.
4.1.3 Surface Morphological Effects
We examine the amounts of Pt being dissolved in these
previous studies [15, 20, 46–48, 58, 60] in order to
understand the cause of the non-Nernstian behavior of
reported Pt solubility. Methods to detect Pt dissolution in
the literature include weight loss of Pt [46, 63], inductive
coupled plasma (ICP) [15, 47, 60], dithizone—benzene
method [48], and atomic absorption spectrophotometry
[64]. Based on the measured Pt concentrations and elec-
trolyte volumes it is straightforward to estimate the total
Pt dissolved from the samples. This can be combined with
measured sample areas and a density of Pt atoms on the
surface (estimated to be 1.50 9 1015 atoms/cm2 for the
{111}Pt surfaces based on a lattice parameter of 3.92 A
for bulk Pt) to assess how many monolayers (on average)
of Pt are dissolved during the experiment. These values
are given in Table 1 and are discussed in detail below. It
is interesting to note that the solubility data of Bindra and
Yeager are associated with dissolution of multiple mon-
olayers of Pt from a polycrystalline Pt sample while less
than one monolayer of Pt is dissolved in the experiments
of the other studies [15, 20, 47, 48, 58, 60]. Although the
true electrochemical surface area was not measured in the
study of Bindra and Yeager, we can estimate an upper
bound on the number of monolayers dissolved from the
nominal surface area of the electrode. Dissolution of 6,
14, 144, and 1,440 monolayers can be found at 0.8, 0.85,
0.9, and 0.95 V, respectively. In general, these are quite
large numbers, showing that a significant amount of the Pt
is accessed and dissolved. When a large number of Pt
monolayers are involved, it is reasonable to expect that
surface morphology, surface defects, surface impurities
and impurities in solution have negligible effects on
overall equilibrium properties, which is in good agree-
ment with the fact that the measured Pt solubility of
Bindra and Yeager [46] follows the Pourbaix model
(Fig. 13). On the other hand, dissolution of Pt in the top
one monolayer or less could be strongly influenced by
Top Catal
123

surface structure and chemistry of Pt samples, and is not
well described by the bulk equilibrium thermodynamic
analysis—the Nernstian principle formulated in Eq. 2.
The onset of non-Nernstian behavior for sub-monolayer
Pt dissolution is supported by the observation that the
concentration of soluble Pt species at 0.8 V reported by
Bindra and Yeager [46] slightly deviates from the
Nernstian behavior. At 0.8 V only the top *2 monolayers
were dissolved (this was determined by assuming a
roughness factor, the true surface area of Pt over the
nominal electrode surface area, of *3 [65] for the Pt
polycrystalline foil sample). Less stable surface Pt sites
near step edges, grain boundaries, dislocations, and
impurities may be dissolved preferentially to Pt sites
located on low-index facets such as {111}Pt and {100}Pt.
Analysis of the experiments of Ferreira et al. [15], Wang
et al. [47, 58], and Honji et al. [20] shows that only a
maximum of 0.02, 0.2 (polycrystalline) and 0.0004
(nanoparticles), and 0.5 monolayers are dissolved,
respectively. Therefore, we propose that the weak
potential dependence and the deviation from the Nernstian
behavior found in these studies (shown in Fig. 13) results
from the fact that these experiments are within the sub-
monolayer dissolution limit, where Pt dissolution is
strongly influenced by surface structure and chemistry of
Pt. Although the steady-state condition is not reached,
Komanicky et al. [60] have shown that Pt dissolution and
passivation are strongly influenced by surface structure
upon dissolution of less than 0.5 monolayer. The {111}pt
surface showed the lowest Pt solubility at 0.95 V versus
RHE relative to the {100}Pt, {110}Pt and the {111}Pt—
{100}Pt nanofacets, as shown in Fig. S2. The proposed
importance of non-equilibrium Pt dissolution is consistent
with the theory that accelerated Pt dissolution rates upon
voltage cycling compared to extended holds at constant
potentials [40, 47, 66] are due to the difference in the
surface structure of Pt developed between the transient
and steady-state operation. Voltage cycling may continu-
ously create high-energy Pt surface sites, which might be
associated with the relatively high dissolution rates. While
it is likely that the non-Nernstian behavior of previous
solubility studies [15, 20, 47, 48, 58, 60] is connected to
the non-equilibrium nature of the submonolayer dissolu-
tion process, it is still an open challenge to create a
realistic model of the surface thermodynamics that can
quantitatively explain the dissolved concentrations.
4.1.4 Proposed Surface Oxidation Processes of Pt
Any realistic surface model that explains Pt solubility will
have to take into account oxidation, which changes the
chemistry, stability, and kinetics of the surface. We here
give a brief overview of surface species formed upon
electrochemical oxidation of bulk Pt surfaces as reported
in the literature. Conway et al. [67] have proposed the
following process upon electrochemical oxidation of Pt
from a quantitative potentiodynamic cyclic voltammetry
(CV) study of polycrystalline Pt in 0.5 M H2SO4 at
25 �C:
4Pt + H2O! Pt4OH + Hþ þ e�(� 0.89 V vs. RHE)
Pt4OH + H2O! 2Pt2OH + Hþ + e�(� 0.95 V vs. RHE)
Pt2OH + H2O! 2PtOH + Hþ + e�(� 1.05 V vs. RHE)
Place - exchange: PtOH ! OHPt;
OHPt ! PtO + Hþ + e�(� 1.05 V vs. RHE)
Oxide formation : PtO! PtOnð[ 1:1 V vs:RHEÞ
These proposed intermediate species and processes have
been investigated extensively in subsequent studies. Allen
et al. [68] and Winograd et al. [69] have both confirmed
the presence of PtO species from their X-ray photoemission
spectroscopy measurements by electrochemical oxidizing
smooth Pt foil in acid at constant voltages above 2 V vs.
RHE at room temperature. In addition, You et al. [70] have
confirmed the place-exchange step by surface X-ray scat-
tering and proposed two possible mechanisms of the place-
exchange step: (i) PtOH ? HOPt, as proposed by Conway
et al. [67]; (ii) PtO ? OPt. Jerkiewicz et al. [61] have
recently performed combined studies of CV, electro-
chemical quartz-crystal nanobalance, and Auger electron
spectroscopy on sputtered Pt samples, which significantly
improve our understanding of Pt electro-oxidation and
refine the mechanism proposed by Conway et al. [67].
These authors have revealed that (i) the Pt surface is not
fully passivated (the monolayer coverage of chemisorbed
oxygen is less than unity) at *1.2 V vs. RHE; (ii) the
place-exchange step does not happen with PtOH, but
occurs with PtO (PtO ? OPt) on the unpassivated surface
of sputtered Pt samples at *1.2 V vs. RHE. We speculate
that these oxidized surface species formed between *0.9
and 1.2 V can dissolve chemically, and one or multiple
oxidation processes proposed above can govern the sub-
monolayer dissolution thermodynamics and kinetics of Pt
nanoparticles. In addition, surface defects of Pt nanoparti-
cles could shift the onset voltages of these processes
relative to polycrystalline Pt. Therefore, understanding the
nature of surface species at different voltages is key to
explain the reported submonolayer Pt solubility data sum-
marized in Fig. 13 and improve the stability of Pt
nanoparticles.
Top Catal
123

4.2 Particle Size Effects on Pt Dissolution
Thermodynamics and Kinetics
The dissolution thermodynamics and kinetics of Pt nano-
particles can be significantly different from that of bulk Pt
as Pt nanoparticles have more surface per unit volume,
which creates an effective pressure and drives up the
activity of the solid phase. The change in the chemical
potential, EGT, of a particle as a function of diameter, d, can
be described using the Gibbs–Thomson formula (see, e.g.
[71]):
EGT ¼ lðdÞ � lð1Þ ¼ 4cX=d ð8Þ
where c is the surface energy and X is the volume per atom.
EGT is plotted as a function of particle diameter in Fig. 14,
where cPt = 0.148 eV/A2 and XPt = 15.4 A3/atom [42] are
used. We here estimate and discuss the effect of EGT on the
dissolution thermodynamics and kinetics of Pt nanoparti-
cles as a function of particle diameter.
4.2.1 Effects on Dissolution Thermodynamics
From a theoretical perspective, the impact of EGT on the
dissolution thermodynamics should be quite significant in
the particle size range of supported Pt nanoparticles in low-
temperature fuel cell catalysts. The Gibbs–Thomson effect
can be included in Eq. 2 by modifying E0 to yield
cPt2þ ¼ exp2F E � EoðTÞ þ EGT=2ð Þ
RT
� �
¼ exp2F E � EoðTÞ þ 2cX=dð Þ
RT
� �ð9Þ
where EGT is measured in eV/atom and the two comes from
the number of electrons in the Pt dissolution reaction. It can
be seen from Eq. 9 that EGT/2 enters into the Nernst equation
for Pt concentration as an effective voltage—the energy
change per electron. Within this simple framework solubility
for a nanoparticle is formally equivalent to solubility of a
macro-scale particles at a higher potential. Based on Eq. 9
and Fig. 14, it is clear that the Gibbs–Thomson energy
should have a large impact on solubility at small diameters.
In particular, the dependence is such that EGT changes most
dramatically in the relevant energy scales below 5 nm.
Between d = ? and 5 nm EGT increases by only 0.18 eV
while between d = 5 nm and 1 nm it increases by 0.73 eV.
Therefore, the potential that a particle feels driving disso-
lution to Pt2+ (2 electrons involved) effectively increases by
0.37 V from 5 to 1 nm, which should create a strong
dependence of the equilibrium concentration of dissolved Pt
on the particle size. However, there is little experimental
evidence indicating that the Gibbs–Thomson effect is play-
ing a major role in the solubility data as summarized in
Fig. 13. The most direct test for the influence of Gibbs–
Thomson energetics is to compare the two data sets of Wang-
pc and Wang-np [47, 58]. Assuming the Pt wire used in the
Wang-pc study can be treated as having infinite diameter
particles and assuming an average particle size of 2.5 nm for
the Wang-np study, Eq. 9 implies that the Wang-np data
should behave as if effectively destabilized by 0.18 V
compared to Wang-pc. However, there does not seem to be
any clear enhancement of dissolution from the Gibbs–
Thomson effect in the Wang-np compared to Wang-pc data,
as shown in Fig. 13. It should be noted that a much smaller
fraction of a monolayer was dissolved in the solubility
measurement of Pt nanoparticles relative to that of Pt poly-
crystalline wires. The absence of discernable solubility
enhancement associated with small nanoparticles as a result
of Gibbs–Thomson effect is consistent with our hypothesis
that the solubility of Pt nanoparticles is largely dominated by
defect energetics on the particle surface when less than one
monolayer of Pt is being dissolved in the solubility
measurement.
4.2.2 Effects on Dissolution Kinetics
The Gibbs–Thomson energetics would not only increase Pt
solubility but also enhance the dissolution rates of Pt
nanoparticles. We explore this effect using simulation
techniques. The simulation follows the model of Darling
and Meyers [42] although some parameters have been refit
and the effect of Pt precipitation through hydrogen cross-
over from the anode has been included (details of this
model will be published in a forthcoming paper [72]). The
Fig. 14 The Gibbs–Thomson energy as a function of a spherical
nanoparticle diameter calculated from Eq. 8 with parameters for Pt.
The surface energy and the atomic volume of Pt are taken to be
cPt = 0.148 eV/A2 and XPt = 15.4 A3/atom [42], respectively
Top Catal
123

result of the simulation is shown in Fig. 15, where a con-
stant potential of 0.95 V, 0.4 mg/cm2 Pt loading, and
10 lm of electrolyte adjacent to the cathode are assumed.
Figure 15 shows the simulated particle dissolution rate as a
function of particle diameter, where a very strong depen-
dence of dissolution rates on size is noted with an
enormous enhancement for smaller particles (\5 nm). The
dissolution rates can be related to a lifetime of the particle
if we assume the dissolution rate continues at a fixed flux of
Pt per unit area until the particle dissolves completely. It is
clear that from 4 to 2 nm a critical crossover occurs
between lifetimes on the scale of many thousands of hours
to ones on the scale of tens to hundreds of hours. It should
be noted that these ‘‘lifetimes’’ are the time to complete
dissolution assuming the particle keeps a constant disso-
lution flux per unit area equal to the one calculated
instantaneously at a given diameter. This lifetime will
therefore overestimate the true lifetime of the particle,
since the flux will increase due to increased Gibbs–
Thomson energy during dissolution. The lifetimes should
be understood as a convenient way to think about the
magnitude of the flux per unit area coming off the particle
at each diameter. The calculated flux values are not very
accurate, since the exponential dependencies in the disso-
lution process are sensitive to small errors in parameter
values, but the qualitative picture is quite clear. Near 5 nm
particles have the stability to survive (at relatively high
constant potential holds) for the thousands of hours
required in PEM fuel cell automotive applications [3], but
for sizes near 1–2 nm the particles dissolve almost
instantly compared to PEM fuel cell lifetime goals. The
size dependence shown in these simulations strongly sug-
gests that even relatively small increases in particle sizes
from the approximately 2–3 nm usually used today could
greatly enhance stability.
Similar to dissolution thermodynamics, there is no clear
experimental verification of the Gibbs–Thomson effect on
dissolution rates in the literature. Under constant voltage
hold at 0.9 V vs. RHE, Wang et al. [47] have reported that
dissolution rates for Pt polycrystalline wire and Pt nano-
particles are nearly identical (1.7 9 10-14 and 1.4 9 10-
14 g/cm2 s, respectively). It is likely that dissolution rates
for submonolayer dissolution would be driven by non-
equilibrium properties quite distinct from those described
by Gibbs–Thomson and the theoretical model based on
Nernstian behavior.
4.2.3 Gibbs–Thomson and the Stability of Heat-Treated Pt
Nanoparticles upon Voltage Cycling
Given the stability implications of the Gibbs–Thomson
equation, one expects that increasing Pt particle sizes and
decreasing the number of particles smaller than 2 nm
would significantly enhance stability. Recently Makharia
et al. [50] have reported that the stability of Pt nanopar-
ticles upon potential cycling in PEM fuel cells can be
improved by heat-treatments at high-temperatures [50].
However, neither the mechanism by which the stability
was obtained nor the detailed heat-treatment condition
was reported. Heat-treatments at high temperatures can
increase particle sizes and decrease the number of small
Pt nanoparticles by crystal migration, as reported previ-
ously [21, 49, 53]. Here we describe a recent experiment
that demonstrates the connection between changes in Pt
particle size through heat treatments and reduced Pt sur-
face area loss and enhanced Pt stability during potential
cycling in acid.
We here examine three Pt/C samples: pristine TKK
28 wt%, and two heat-treated samples at 900 �C in argon
atmosphere for 1 min (HT–1) and 15 min (HT-2). The
histograms of these three samples are compared in Fig. 16,
where Pt particle sizes increase upon heat-treatments. It is
interesting to note that the fraction of Pt particles in the
range of 1–2 nm is reduced considerably upon heat-treat-
ments, which can be seen clearly in Fig. 16 and in the high-
resolution TEM images in Fig. 17a–b. Small Pt particles
presumably migrate on the carbon support, join with other
particles and coalesce into large particles during the heat-
treatment, as reported previously [21, 49, 53]. These three
samples were then cycled from 0.6 to 1.0 V vs. RHE in
0.5 M H2SO4 at a scanning rate of 20 mV/s at 23 �C. Heat-
treated samples show greatly reduced Pt surface area loss
and improved stability upon potential cycling, as shown in
Fig. 18a. It is hypothesized that heat-treated samples hav-
ing lower fractions of Pt nanoparticles smaller than 2 nm
relative to the pristine sample have reduced Pt solubility,
which reduces Pt loss and surface area loss upon voltage
Fig. 15 Predicted dissolution properties as a function of Pt particle
diameter. The simulation is based on an extension of the model of
Darling and Meyers [42] to include particle size distributions and
hydrogen crossover [72]. The simulation is based on a uniform
particle size with a constant potential of 0.95 V, 0.4 mg/cm2 Pt
loading, and 10 lm of electrolyte adjacent to the cathode
Top Catal
123

cycling. As no significant change in the Pt particle size
before and after voltage cycling was noted in the HT-2
sample, it is believed that the surface area loss shown in
Fig. 18a largely result from Pt dissolution. In addition, the
rate of surface loss in the first 400 cycles is markedly
reduced in the heat-treated samples. We propose that the
rapid surface area loss of Pt nanoparticles in the pristine
sample upon initial potential cycling largely results from
rapid dissolution of small Pt nanoparticles of 1–2 nm into
the acid solution. This is in good agreement with experi-
mental TEM observations that most small Pt particles
disappeared in the pristine Pt/C sample after potential
cycling, as shown in the histograms of Pt particles before
and after voltage cycling in Fig. 18b. These experimental
observations support the theoretical picture developed
above of the dramatically decreased stability of particles in
the 1–2 nm region associated with the Gibbs–Thomson
effect.
5 Concluding Remarks
Key findings from previous studies of electrochemical
surface area loss of supported Pt electrocatalysts in low-
temperature fuel cells, and the current status in the
understanding of fundamental molecular scale mechanisms
that drive Pt degradation can be summarized:
1. Electrochemically active surface area is degraded
through Pt loss from fuel cell electrodes and coarsen-
ing of Pt nanoparticles.
2. The underlying mechanism of Pt loss is likely through
dissolution of Pt at relatively high potentials (greater
than *0.8 V).
3. The underlying mechanism of coarsening of Pt nano-
particles likely occurs by Pt dissolution and
redeposition, which is analogous to Ostwald ripening.
4. The role of particle migration and coalescence in the Pt
surface area loss at low-temperature fuel cells is still
uncertain. Although there is no unique experiment
evidence in support of crystal migration and coalescence,
they cannot be ruled out from a theoretical standpoint.
5. The nature of Pt dissolution is still poorly understood.
It is proposed that equilibrium thermodynamic con-
siderations do not apply to the submonolayer
dissolution processes often relevant for fuel cells,
and that Nernstian behavior cannot be expected for
submonolayer dissolution of Pt nanoparticles. How-
ever, not even a qualitative theory that can explain
trends in submonolayer Pt solubility with temperature
and potential has been put forward.
It is clear that Pt dissolution, leading either to coarsening
through Ostwald ripening or loss of Pt through precipita-
tion in the ion-conducting phase, is a major source of
degradation of the Pt electrocatalysts in low-temperature
fuel cells. The non-Nernstian behavior of measured Pt
dissolution, coupled with the observation that dissolution
typically involves only a fraction of a monolayer, suggests
Fig. 16 (a): Histograms of Pt nanoparticle size distribution of
28 wt% Pt supported on high surface area carbon (TKK). Black:
pristine; grey shaded: a sample (HT-1) heat-treated at 900 �C under
argon for 1 min; light grey: a sample (HT-2) heat-treated at 900 �C
under argon for 15 min
Fig. 17 High resolution TEM
images of (a) pristine 28 wt% Pt
nanoparticles supported on
surface area carbon (TKK) and
(b) a sample (HT-1) heat-treated
at 900 �C in argon atmosphere
for 1 min. Note that the number
of Pt nanoparticles smaller than
2 nm is decreased considerably
after the heat-treatment
Top Catal
123

that non-equilibrium processes may dominate. The reali-
zation of the importance of submonolayer Pt dissolution
suggests that controlling Pt surface structure and chemistry
could be a very powerful tool to reduce degradation of Pt
electrocatalysts. For a 2 nm diameter particle about half the
atoms are in the first monolayer, which implies that very
significant amounts of Pt and Pt surface area can be lost
through dissolving only the first monolayer. There is
already some evidence that manipulating surface structure
and chemistry could increase durability. Komanicky et al.
[60] have shown that dissolution rates can vary by factors
of 5 between different types of surfaces at different
potentials, and that the sites of the dissolved Pt on the
surface can vary widely (e.g., from pits vs. step edges).
Perhaps most compelling, Zhang et al. [73] have recently
shown that Au clusters on Pt nanoparticles could greatly
enhance Pt stability, which has been attributed to the
alteration of the oxidation characteristics of the Pt surface.
It is believed that Au atoms are deposited electrochemi-
cally on high-energy surface sites of Pt particles, which
might reduce dissolution of the least stable sites on Pt
nanoparticles. The success of Zhang et al.’s approach
demonstrates how enhancing stability of Pt nanoparticles
from the perspective of modifying the surface structure and
chemistry might be particularly fruitful.
Acknowledgments Some Pt/C and aged MEA samples used in this
study were obtained from GM Fuel Cell Activities. The authors thank
P. Strasser for providing the TKK Pt/C 28 wt% sample used in this
study, and H.A. Gasteiger, R. Makharia, S. Kocha, F. Wagner, D.
Myers, J.P. Meyers, R. Darling, and D. Rolison for stimulating dis-
cussion. This work is supported by the DOE Hydrogen Initiative
program under award number DE-FG02-05ER15728, and made use
of the Shared Experimental Facilities supported by the MRSEC
Program of the National Science Foundation under award number
DMR 02-13282. Y.S.H. acknowledges financial support from GM
Fuel Cell Activities and an Air Products Faculty Excellence grant and
D.M. gratefully acknowledges a 3M Nontenured Faculty Award.
References
1. Gasteiger HA, Kocha SS, Sompalli B, Wagner FT (2005) Appl
Catal B 56:9
2. Gasteiger H, Gu W, Makharia R, Mathias MF, Sompalli B (2003)
In: Vielstich W, Lamm A, Gasteiger H (eds) Handbook of fuel
cells—fundamentals, technology and applications, vol. 3. John
Wiley & Sons, Chichester, UK, pp 593
3. Matthias M, Gasteiger H, Makharia R, Kocha S, Fuller T, Pisco
(2004) J Prepr Pap-Am Chem Soc Div Fuel Chem 49:471
4. Antolini E (2003) J Mater Sci 38:2995
5. Mukerjee S, Srinivasan S (2003) In: Vielstich W, Lamm A,
Gasteiger H (eds) Handbook of fuel cells—fundamentals, tech-
nology and applications, vol 3. John Wiley & Sons, Chichester,
UK pp 503
6. Auer E, Freund A, Pietsch J, Tacke T (1998) Appl Catal A
173:259
7. Skriver HL, Rosengaard NM (1992) Phys Rev B 46:7157
8. Foiles SM, Baskes MI, Daw MS (1986) Phys Rev B 33:7983
9. Frenken JWM, Stoltze P (1999) Phys Rev Lett 82:3500
10. Sattler ML, Ross PN (1986) Ultramicroscopy 20:21
11. Ferreira PJ, Shao-Horn Y (2007) Electrochem Solid-State Lett
10:B60
12. Kinoshita K (1990) J Electrochem Soc 137:845
13. Antolini E, Giorgi L, Cardellini F, Passalacqua E (2001) J Solid
State Electrochem 5:131
Fig. 18 (a) Degradation of electrochemical surface area of Pt
nanoparticles of the three samples in Fig. 16 along with the number
of cycles. The loading of Pt on glassy carbon electrode (GCE) for the
three samples is 10 lg/cm2, by depositing 20 lL of 0.215 mg/mL of
Pt/C water suspension, followed by 10 lL of 0.03 wt% of Nafion
solution after catalysts dried on GCE. After slow drying of the
electrodes, they were cycled in 0.5 M H2SO4, between 600 and
1,000 mV (vs. RHE) for 1,200 scans at 80 �C. CV measurements
were taken each 200 cycles at room temperature at 50 mV/s. The
surface area was calculated by integrating the hydrogen–Pt desorption
area. (b): the histograms of the pristine sample before and after
voltage cycling. TEM images of Pt nanoparticles were taken on JEOL
2010F TEM, operating at 200 kV. The average diameter and size
distribution were measured from 200 Pt particles
Top Catal
123

14. Markovic NM, Radmilovic V, Ross PN (2003) In: Wieckowski
A, Savinova ER, Vayenas CG (eds) Physical and electrochemical
characterization of bimetallic nanoparticles electrocatalysts,
catalysis and electrocatalysis at nanoparticles surfaces. Marcel
Dekker, New York and Basel, pp 311
15. Ferreira PJ, la O’ GJ, Shao-Horn Y, Morgan D, Makharia R,
Kocha S, Gasteiger H (2005) J Electrochem Soc 152:A2256
16. Shao-Horn Y, Ferreira P, la O GJ, Morgan D, Gasteiger HA,
Makharia R (2006) ECS Trans 1:185
17. Merzougui B, Swathirajan S (2006) J Electrochem Soc
153:A2220
18. Landsman DA, Luczak FJ (2003) In: Vielstich W, Lamm A,
Gasteiger H (eds) Handbook of fuel cells—fundamentals, tech-
nology and applications, vol 4. John Wiley & Sons, Chichester,
UK, pp 811
19. Aragane J, Murahashi T, Odaka T (1988) J Electrochem Soc
135:844
20. Honji A, Mori T, Tamura K, Hishinuma Y (1988) J Electrochem
Soc 135:355
21. Blurton KF, Kunz HR, Rutt DR (1978) Electrochim Acta 23:183
22. Fowler MW, Mann RF, Amphlett JC, Peppley BA, Roberge PR
(2002) J Power Sources 106:274
23. Knights SD, Colbow KM, St-Pierre J, Wilkinson DP (2004) J
Power Sources 127:127
24. Wilson MS, Garzon FH, Sickafus KE, Gottesfeld S (1993) J
Electrochem Soc 140:2872
25. Tada T, Kikinzoku T (2003) In: Vielstich W, Gasteiger H, Lamm
A (eds) Handbook of fuel cells—fundamentals, technology and
applications, vol 3. John Wiley and Sons, p 481
26. Xie J, Wood DL, Wayne DM, Zawodzinski TA, Atanassov P,
Borup RL (2005) J Electrochem Soc 152:A104
27. Xie J, Wood DL, More KL, Atanassov P, Borup RL (2005) J
Electrochem Soc 152:A1011
28. Akita T, Taniguchi A, Maekawa J, Sirorna Z, Tanaka K, Kohy-
ama M, Yasuda K (2006) J Power Sources 159:461
29. Bett JAS, Kinoshita K, Stonehart P (1976) J Catal 41:124
30. Gruver GA, Pascoe RF, Kunz HR (1980) J Electrochem Soc
127:1219
31. Ruckenstein E, Pulvermacher B (1973) J Catal 29:224
32. Granqvist CC, Buhrman RA (1976) J Catal 42:477
33. Tseung ACC, Vassie PR (1976) Electrochimica Acta 21:315
34. Lifshitz IM, Slyozov VV (1961) J Phys Chem Solids 19:35
35. Wagner C (1961) Z Elektrochem 65:581
36. Voorhees PW (1985) J Stat Phys 38:231
37. Ross PN Jr (1987) In: Petersen EE, Bell AT (eds) Catalyst
deactivation. Marcel Dekker, New York, p 165
38. Aragane J, Urushibata H, Murahashi T (1996) J Appl Electro-
chem 26:147
39. Yasuda K, Taniguchi A, Akita T, Ioroi T, Siroma Z (2006) J
Electrochem Soc 153:A1599
40. Kinoshita K, Lundquis JT, Stonehar P (1973) J Electroanal Chem
48:157
41. Patternson T (2002) In: Igwe GJ, Mah D (eds) Fuel cell tech-
nology topical conference proceedings, 2002 AIChE Spring
National Meeting (March 10–14), New York, p 313
42. Darling RM, Meyers JP (2003) J Electrochem Soc 150:A1523
43. Darling RM, Meyers JP (2005) J Electrochem Soc 152:A242
44. Yasuda K, Taniguchi A, Akita T, Ioroi T, Siroma Z (2006) Phys
Chem Chem Phys 8:746
45. Pourbaix M (1966) Atlas of electrochemical equilibria in aqueous
solutions. Pergamon Press, Oxford
46. Bindra P, Clouser SJ, Yeager E (1979) J Electrochem Soc
126:1631
47. Wang XP, Kumar R, Myers DJ (2006) Electrochem Solid-State
Lett 9:A225
48. Ota K-i, Koizumi Y, Mitsushima S, Kamiya N (2006) ECS Trans
3:619
49. Bett JA, Kinoshita K, Stonehart P (1974) J Catal 35:307
50. Makharia R, Kocha SS, Yu PT, Sweikart MA, Gu W, Wagner FT,
Gasteiger HA (2006) ECS Trans 1:3
51. Stevens DA, Hicks MT, Haugen GM, Dahn JR (2005) J Elect-
rochem Soc 152:A2309
52. Wynblatt P, Gjostein NA (1975) In: McCaldin JO, Somorjai G
(eds) Progress in solid state chemistry, vol 9. Pergamon, New
York pp 21
53. Ehrburger P, Lahaye J (1984) Abstr Paper Am Chem Soc 187:28
54. Guilminot E, Corcella A, Charlot F, Maillard F, Chatenet M
(2007) J Electrochem Soc 154:B96
55. Chen J, Chan KY (2005) Mol Simul 31:527
56. Phillips WB, Desloge EA, Skofronick JG (1968) J Appl Phys
39:3210
57. Jensen P, Blase X (2004) Phys Rev B 70:165402
58. Wang XP, Kumar R, Kariuki N, Myers DJ (2007) J Electrochem
Soc (unpublished)
59. Anderson GM, Crerar DA (1993) Thermodynamics in geo-
chemistry. Oxford University Press, New York
60. Komanicky V, Chang KC, Menzel A, Markovic NM, You H,
Wang X, Myers D (2006) J Electrochem Soc 153:B446
61. Jerkiewicz G, Vatankhah G, Lessard J, Soriaga MP, Park YS
(2004) Electrochimica Acta 49:1451
62. Alsabet M, Grden M, Jerkiewicz G (2006) J Electroanal Chem
589:120
63. Ota KI, Nishigori S, Kamiya N (1988) J Electroanal Chem
257:205
64. Rand DAJ, Woods R (1972) J Electroanal Chem 35:209
65. Rose TL, Robblee LS (1990) IEEE Trans Biomed Eng 37:1118
66. Woods R (1976) In: Bard AJ (eds) Electroanalytical chemistry,
vol 9. Marcel Dekker, New York pp 1
67. Angerste H, Conway BE, Sharp WBA (1973) J Electroanal Chem
43:9
68. Allen GC, Tucker PM, Capon A, Parsons R (1974) J Electroanal
Chem 50:335
69. Hammond JS, Winograd N (1977) J Electroanal Chem 78:55
70. Nagy Z, You H (2002) Electrochim Acta 47:3037
71. Lupis CHP (1983) Chemical thermodynamics of materials. North
Holland, New York
72. Holby E, Morgan D, Shao-Horn Y (2007) (unpublished)
73. Zhang J, Sasaki K, Sutter E, Adzic RR (2007) Science 315:220
Top Catal
123


![Sensors and Actuators B: Chemical · 198 K. Dhara et al. / Sensors and Actuators B 195 (2014) 197–205 such as platinum and gold [42], and alloy nanoparticles like nickel-platinum](https://img.pdfslide.us/doc/110x75/5f079ef97e708231d41de5de/sensors-and-actuators-b-chemical-198-k-dhara-et-al-sensors-and-actuators-b.jpg)