Embed Size (px)
Citation preview
. IN BOXINSIGHTS and INNOVATIONS
Continuous Lidar Monitoring of PolarStratospheric Clouds at the South Pole
BY JAMES R. CAMPBELL, ELLSWORTH J. WELTON, AND JAMES D . SPINHIRNE
P olar stratospheric clouds (PSC) play a primaryrole in the formation oí annual "ozone holes" overAntarctica during the austral sunrise. Meridional
temperature gradients in the lower stratosphere andupper troposphere, caused by strong radiative cool-ing, induce a broad dynamic vortex centered near theSouth Pole that decouples and insulates the winterpolar airmass. PSC nucleate and grow as vortex tem-peratures gradually fall below equilibrium saturationand frost points for ambient sulfate, nitrate, andwater vapor concentrations (generally below 197 K).Cloud surfaces promote heterogeneous reactions thatconvert stable chlorine and bromine-based moleculesinto photochemically active ones. As spring nears,and the sun reappears and rises, photolysis decom-poses these partitioned compounds into individualhalogen atoms that react with and catalytically de-stroy thousands of ozone molecules before they arestochastically neutralized.
Nitrates are most efficient at inhibiting catalyticozone destroying cycles. However, their vapor uptakeduring PSC growth and subsequent particle sedimen-tation, arising from accompanying increases in fallvelocity, cause molecular redistribution to lower levels(i.e., denitrification of the lower stratosphere). Satellitelimb-sounder measurements indicate that nitric acid(HNO,), for example, maybe completely removed near
AFFILIATIONS: CAMPBELL—Universicy Corporation forAtmospheric Research. Visiting Scientist Programs, Naval
Research Laboratory, Monterey, California: WELTON—NASA
Goddard Space Flight Center. Greenbek, Maryland: SPINHIRNE
—Department of Electrical and Computer Engineering, Universityof Arizona, Tucson, Arizona
CORRESPONDING AUTHOR: James R. Campbell, c/o NavalResearch Laboratory. 7 Grace Hopper Ave,, Stop 2, Monterey,CA 93943E-mail: jamesc@ucaredu
DOI:IO.II75/2008BAMS27S4.I
©2009 American Meteorological Society
18.0 km above mean sea level (MSL) in air surroundingthe South Pole by mid-June each season. In the absenceof nitrates, it is only with the overturning of the polarvortex in spring that catalytic processes cease andozone concentrations are replenished through airmassexchange with the lower latitudes.
Despite a generic understanding of the "ozonehole" paradigm, many key components of the system,such as cloud occurrence, phase, and composition;particle growth mechanisms; and denitrification ofthe lower stratosphere have yet to be fully resolved.Satellite based observations have dramatically im-proved the ability to detect PSC and quantify seasonalpolar chemical partitioning. However, coverage di-rectly over the Antarctic plateau is limited by polar-orbiting tracks that rarely exceed 80°S.
Ground-based measurements of PSC can supple-ment gaps in satellite coverage. Such data are funda-mental given that lower-stratospheric temperaturesare climatologically coldest there relative to sur-rounding regions. PSC properties at the South Polerepresent those at one end of a longitudinal cross-section of the polar vortex where cloud microphysicaland denitrification processes likely vary as a functionof thermal and dynamic structure. Furthermore,the meridional mixing of air across the polar vor-tex boundary from baroclinic disturbances andplanetary-scale wave breaking—which incrementallyreplenishes necessary cloud components during win-ter diminished by particle growth and fallout (i.e.,nitric acid and water vapor)—is negligible nearestthe pole. Unfortunately, the deployment of suitableinstrumentation atop the Antarctic plateau is limitedby accessible infrastructure.
CONTINUOUS PSC MONITORING ATTHE SOUTH POLE. A NASA Micropulse LidarNetwork' instrument (NASA MPLNET; 0.527 ^nn incurrent instruments) was first deployed in December
' http://mplnet.gsfc.nasa.gov
AMERICAN METEOROLOGICAL SOCIETY MAY 2009 BAflS- 613

Report Documentation Page Form ApprovedOMB No. 0704-0188
Public reporting burden for the collection of information is estimated to average 1 hour per response, including the time for reviewing instructions, searching existing data sources, gathering andmaintaining the data needed, and completing and reviewing the collection of information. Send comments regarding this burden estimate or any other aspect of this collection of information,including suggestions for reducing this burden, to Washington Headquarters Services, Directorate for Information Operations and Reports, 1215 Jefferson Davis Highway, Suite 1204, ArlingtonVA 22202-4302. Respondents should be aware that notwithstanding any other provision of law, no person shall be subject to a penalty for failing to comply with a collection of information if itdoes not display a currently valid OMB control number.
1. REPORT DATE MAY 2009 2. REPORT TYPE
3. DATES COVERED 00-00-2009 to 00-00-2009
4. TITLE AND SUBTITLE Continuous Lidar Monitoring of Polar Stratospheric Clouds at the South Pole
5a. CONTRACT NUMBER
5b. GRANT NUMBER
5c. PROGRAM ELEMENT NUMBER
6. AUTHOR(S) 5d. PROJECT NUMBER
5e. TASK NUMBER
5f. WORK UNIT NUMBER
7. PERFORMING ORGANIZATION NAME(S) AND ADDRESS(ES) Universicy Corporation for Atmospheric Research. Visiting ScientistPrograms,Naval Research Laboratory,Monterey,CA
8. PERFORMING ORGANIZATIONREPORT NUMBER
9. SPONSORING/MONITORING AGENCY NAME(S) AND ADDRESS(ES) 10. SPONSOR/MONITOR’S ACRONYM(S)
11. SPONSOR/MONITOR’S REPORT NUMBER(S)
12. DISTRIBUTION/AVAILABILITY STATEMENT Approved for public release; distribution unlimited
13. SUPPLEMENTARY NOTES
14. ABSTRACT
15. SUBJECT TERMS
16. SECURITY CLASSIFICATION OF: 17. LIMITATION OF ABSTRACT Same as
Report (SAR)
18. NUMBEROF PAGES
6
19a. NAME OFRESPONSIBLE PERSON
a. REPORT unclassified
b. ABSTRACT unclassified
c. THIS PAGE unclassified
Standard Form 298 (Rev. 8-98) Prescribed by ANSI Std Z39-18

MAY JUNE JULY A. ^0V DEC JAN
FIG. I. (top) For May to October 2007, from 5.0 to 28.0 km MSL, compositeprofiles of smoothed (see text) PSC attenuated scattering ratio (color baron right), theoretical NAT equilibrium formation isopleths for lO.O-ppbvHNOj/4.0-ppmv H^O concentration (green), and theoretical ice frost-pointisopleths for 6.0-, 4.0-, and 2.0-ppmv water vapor concentrations (red). ForMay to December 2007, ozone partial pressure isobars are shown for 4.0, 2.0,and 1.0 mPa (blue dashed), (bottom) For May to December 2007, DobsonUnit measurements from 2.85 km MSL, with the dotted line representing220 DU, or the colloquial threshold for "ozone hole" conditions.
1999 to the NOAA Earth Systems Research Labora-tory (NOAA ESRL) Atmospheric Research Ohserva-tory (ARO; 89.98°S. 24.80''W, 2.835 km MSL) at theAmundsen-Scott South Pole Station for continuouscloud and aerosol profiling. MPLNET instrumentsare eye-safe, capable of full-time autonomous opera-tion, and suitably rugged and compact to withstandlong-term remote deployment, With only brief inter-ruptions during the winters of 2001 and 2002. a nearlycontinuous data archive exists to the present.
Shown in Fig. 1 are MPLNET attenuated scatteringratios (ASR; i.e., the relation between attenuated lidarcloud signal and that of the molecular atmosphere,derived as a function of air density) measured fromMay to October 2007 at the South Pole at 5.0 to 28.0km MSL. These data were derived using an algorithmoptimized for MPLNET retrievals, which relies onthe uncertainties of the Level 1.0 processed signalproduct to detect clouds in low signal-to-noise pro-files. PSC are apparent in these data from late Maythrough September above roughly 12.0 km MSL. Be-low this height, differentiation between stratosphericevents and those influenced by upper troposphericdisturbances, which are apparent throughout the
entire Ó-month period atlower levels, is consideredambiguous.
Raw ASR retrievals havebeen smoothed here to 0.5-day and 0.250-km resolu-tions using a Hanning func-tion (commonly referred toas the "Von Hann" window)with 5.0-day and 0.750-kmtemporal and spatial half-width settings. This stepremoves nearly all of the finestructure typically exhibitedwith ASR in experimentalmeasurements at standardresolutions. However, it alsofills in some gaps where in-strument sensitivity mayhave been briefly limited (i.e.,attenuation effects of low-level transmissive clouds).We present these results herefor qualitative analysis.
Overlaid on these ASRdata in Eig. 1 are corre-sponding mean equilibrium
saturation isopleths for nitric acid trihydrate (NAT;green) and ice (red) based on ozonesonde tem-perature profiles collected by NOAA staff scientistsonsite (compared with regular daily meteorologicalballoonsondes, ozonesondes regularly reach 28.0km MSL in winter before bursting). These data havebeen smoothed to 1.0-day and 0.050-km resolutionsusing the Hanning function at 14.0-day and 2.0-kmtemporal and spatial half-widths. Isopleths depictsaturation with respect to theoretical backgroundconcentrations of 10.0 ppbv HNO3 and 4.0 ppmvwater vapor for NAT (green) and 6.0, 4.0, and 2.0ppmv water vapor for ice (red), respectively.
Eor this work, saturation with respect to NATmay be considered a proxy for the presence of theso-called type-I PSCs. The composition and phaseof type I PSCs vary as relatively large (r > 1.0 /¿m)frozen nitric acid hydrate solutions (type la), small(r ~ 0.5 \im) metastable HNO/H^O or ternary(HNO,/Hp/H,S0,) solution droplets (type lb). orsmall nonspherical particles consisting of metastableHNO,/H,O solid phases (type lc). The presence ofwater ice, at temperatures below the H^O frost point,is referred to as type-II PSC. Since temperature is
614 BAflf MAY 2009
proportional to saturationvapor pressure, these datamay be considered as gen-eralized thermal profilesof the lower stratosphere.Though not direct proxies,these isopleths still reflectthe extent and depth oftheseasonal cooling.
When considered rela-tive to previous years inthe MPLNET PSC data-base, cloud macrophysi-cal characteristics seen in2007 match well with meanobservations. Clouds werefirst recorded near 25.0 kmMSL in late May and re-mained persistent throughJune. This is a very commonscenario. Clouds were thenepisodic near and above15.0 km MSL in July andAugust. It is typically duringthis time period when vari-ability in cloud frequencyand their vertical extent isgreatest between seasons. Midseason conditions in2007 deviated only slightly from tbe mean, as cloudtops approached 25.0 km MSL (an unusually highlevel beyond June) on a few occasions in July andearly August. This result led to relatively high valuesof seasonally integrated ASR being derived above20.0 km MSL. This finding was offset, however, byrelatively low totals of seasonally integrated ASRcalculated between 12.0 and 20.0 km MSL, whichwe attribute to relatively few cloud episodes beingobserved in August and September.
The effects of denitrification and dehumidificationin the polar airmass can be seen most clearly in Au-gust. At that time, saturation with respect to each ofthe theoretical vapor concentrations considered wascalculated between 15.0 and 20.0 km MSL, amidst thecoldest seasonal air. However, few PSC were observedat this time, which indicates low incident nitrate andwater vapor concentrations that would otherwisesupport cloud presence.
Isobars for mean 4.0-, 2.0-, and 1.0-mPa ozonepartial pressures are overlaid on the ASR data inFig. 1 (blue dashed). Column ozone concentrations(in Dobson Units; DU), from ozonesonde datasets
1.00
0.75
5 0.50
S 0 25
0.00
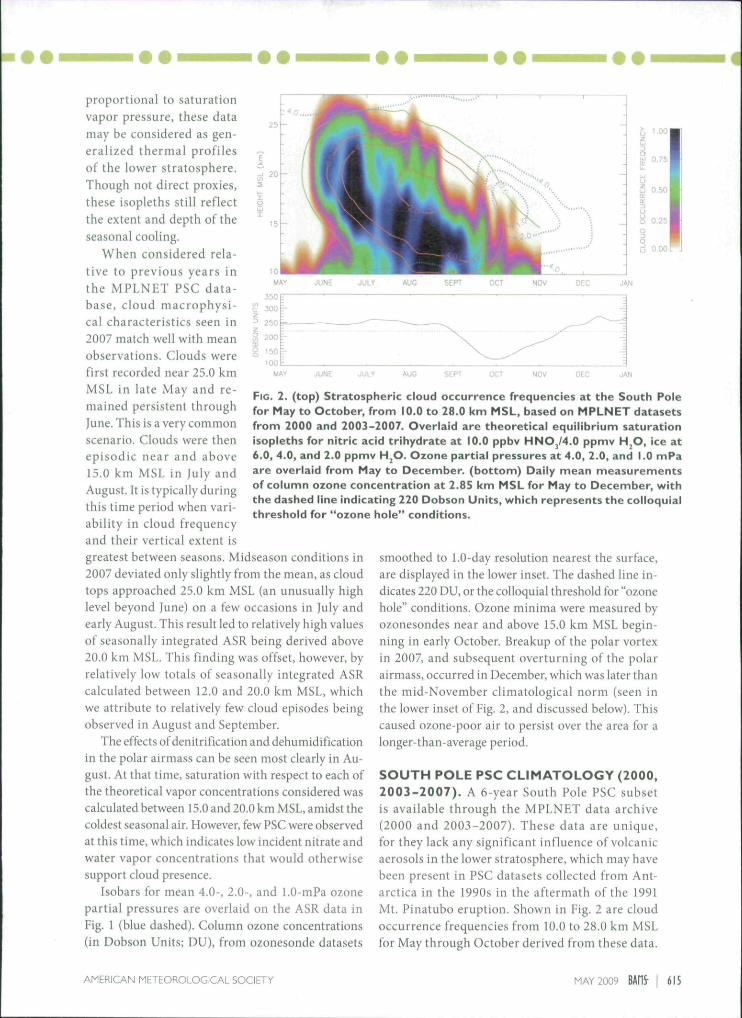
FIG. 2. (top) Stratospheric cloud occurrence frequencies at the South Polefor May to October, from 10.0 to 28.0 km MSL, based on MPLNET datasetsfrom 2000 and 2003-2007. Overlaid are theoretical equilibrium saturationisopleths for nitric acid trihydrate at 10.0 ppbv HNO^/4.0 ppmv H^O, ice at6.0, 4.0, and 2.0 ppmv H^O. Ozone partial pressures at 4.0, 2.0, and 1.0 mPaare overlaid from May to December, (bottom) Daily mean measurementsof column ozone concentration at 2.85 km MSL for May to December, withthe dashed line indicating 220 Dobson Units, which represents the colloquialthreshold for "ozone hole" conditions.
smoothed to LO-day resolution nearest the surface,are displayed in the lower inset. The dashed line in-dicates 220 DU, or the colloquial threshold for "ozonehole" conditions. Ozone minima were measured byozonesondes near and above 15.0 km MSL begin-ning in early October. Breakup ofthe polar vortexin 2007, and subsequent overturning ofthe polarairmass, occurred in December, which was later thanthe mid-November climatological norm (seen inthe lower inset of Fig. 2, and discussed below). Thiscaused ozone-poor air to persist over the area for alonger-1 ban-ave rage period.
SOUTH POLE PSC CLIMATOLOGY (2000,2003-2007) . A 6-year South Pole PSC subsetis available through the MPLNET data archive(2000 and 2003-2007). These data are unique,for they lack any significant influence of volcanicaerosols in the lower stratosphere, which may havebeen present in PSC datasets collected from Ant-arctica in the 1990s in the aftermath ofthe 1991Mt. Pinatubo eruption. Shown in Fig. 2 are cloudoccurrence frequencies from 10.0 to 28.0 km MSLfor May through October derived from these data.
AMERICAN METEOROLOGICAL SOCIETY M A Y 2009 BADS- 6 IS
Once again, we overlay mean equilibrium satura-tion isopleths for NAT at 10.0 ppbv HNO, and 4,0ppmv water vapor (green) and ice at 6.0,4.0, and 2.0ppmv water vapor (red) to approximate saturationstates for type-I and type-II PSC in an unperturbedairmass, respectively. Mean ozone partial pres-sures are again overlaid for 4.0, 2.0, and 1.0 mPafrom May through December (blue dashed). Daily2.85-km MSL measurements of column ozoneconcentration are shown in the lower inset for Maythrough December, with the 220-DU "ozone hole"threshold denoted.
PSC may be present at the South Pole at any timefrom late May through early October above 12.0 kmMSL. Higher frequencies are observed along a slop-ing axis centered above 20,0 km MSL in early Juneand reaching below 15.0 km MSL in mid-August.This closely follows a subsiding core of coldest meantemperatures in the lower stratosphere observedlocally each season. Interestingly, the potential forPSC occurring above the 10.0-ppmv NAT saturationisopleth is apparent early in the season. We specu-late that, aside from an underestimation of HNO,concentration in our calculations, this representsthe influence of inertial gravity waves that break inthe presence of increased static stability above 25.0km MSL during the brief period where temperaturesare sufficiently cold and HNO^ concentrations arestill relatively unperturbed by the influence of PSCnucieation and settling.
As described above, satellite measurements ofdenitrification in the airmass surrounding theSouth Pole indicate a nearly completed processnear 18.0 km MSL by mid-June each year. Anear-ubiquitous PSC layer is present each seasonbetween 18.0 and 25.0 km MSL through lune. Theredistribution of nitrogen and water vapor, throughsublimation and/or evaporation of falling particles,likely enhances the potential for PSC formationbelow 18.0 km MSL as temperatures gradually be-come favorable at lower levels over the pole throughAugust. This process may influence the magnitudeand spatial depth of eventual ozone losses that areat a maximum locally near and above 15.0 km MSLin October.
Despite extremely cold temperatures, whichsupport saturation for a brief period in late July andearly August even at the 2.0-ppmv water vapor frostpoint, clouds are only episodic from July throughSeptember above 15.0 km. These data indicatethat cloud occurrence from midseason forward
is likely a function of mixing within the vortex ofunperturbed (i.e., nitrate and water vapor-rich)air poleward. In this scenario, isentropic liftingand cooling along poleward trajectories, seen asprimary mechanisms for broad-scale cloud forma-tion in recent satellite lidar measurements, wouldinduce PSC that advect over the Antarctic plateauand South Pole.
If confirmed, and our work continues to inves-tigate these data, this process would be expectedto convert a greater percentage of available reactivechlorine and bromine within the polar vortex whilesimultaneously redistributing more nitrogen and wa-ter vapor downward. This would lead to greater pre-conditioning of the polar airmass to catalytic ozonedestruction come sunrise. We have, however, foundconflicting evidence in our database suggesting thatin seasons where circumpolar vortex flow approachesbeing geostrophic in late July and August (a responseto extremely low geopotential heights directly overthe pole), meridional transport is inhibited, and thespatial extent of ozone losses outward from the poleactually becomes limited despite unusually cold coretemperatures nearest the pole.
CONCLUSIONS AND FUTURE OBJEC-TIVES. PSC at the South Pole may be considered,in one sense, tracers for the physical and dynamicprocesses influencing the conditioning of the polarairmass to photolytic/catalytic ozone loss duringand after sunrise. Their occurrence near and above20.0 km MSL in late May and June characterizesan emerging cold core growing radially outwardfrom the dark winter pole. The redistribution ofnitrogen and water vapor downward in the lowerstratosphere is believed to influence the formationof clouds there in later months as temperaturescool gradually near 15.0 km MSL through August.Episodic clouds observed from July through earlyOctober may reflect ageostrophic distortion of thevortex that mixes unperturbed air poleward, whereisentropic cooling induces PSC that are then ob-served over the South Pole. Such a process wouldintroduce a greater component of the polar airmassto heterogeneous chemistry, denitrification, and,eventually, ozone loss.
The colloidal stability of liquid-phase type-I PSC,which form at relatively warm temperatures andlow supersaturations, erodes in the presence of solidparticle nucieation. Freezing of liquid-phase particles,or the preferential growth of solid particles at the
616 BAfiS-
expense of solution droplets in mixed-phase layers,generate increases to relative fall-velocities in PSClayers. By distinguishing where and when liquid andsolid PSC are present, as well as where and whenthis effective conversion may take place seasonally(given that we know temperatures continue to coolthrough August at nearly all levels), we would bebetter positioned to correlate cloud measurementswith denitrification and dehumidification processesat the South Pole.
We will seek to expand the MPLNET South Poleexperiment for coming years by integrating a depo-larization channel into the optical receiver system.This measurement considers the polarization planeof scattered light relative to the linearly polarizedtransmitted laser source. Spherical particles (i.e.,liquid-phase type-I PSC) generate negligible de-polarization in contrast to nonspherical ones (i.e.,solid-phase type-I and all type-II PSC). Elasticbackscatter lidar measurements are not sufficientlyrobust to accurately characterize composition inthese highly complex clouds. Therefore, linear de-polarization data would enhance the experiment toits fullest potential for sustained PSC and "ozonehole" climatological studies.
ACKNOWLEDGMENTS. The MPLNET project Isfunded through the NASA Earth Observing System andthe NASA Atmospheric Radiation Sciences program. Theauthors thank E. G. Dutton and B. Vasel at NOAA ESRLand J. S. Reid at NRL for their continuing support of thiswork. We also thank E. Hyer, P. Xian at NRL, and the twoanonymous reviewers assigned to the manuscript for theircomments and insights. Einally, we gratefully acknowledgethe work of the many onsite NOAA scientists and techni-cians at the South Pole who have assisted with both theMPLNET lidar and ozonesonde measurements over thenow nine year experiment.
FOR FURTHER READINGCampbell. J. R., and K. Sassen, 2008: Polar stratospheric
clouds at the South Pole from 5 years of continuouslidar data: Macrophysical, optical and thermody-namic properties. /. Geophys. Res., 113, D20204,doi:10.1029/2007JD() 09680.
, D. L. Hlavka, E. L Welton, C. J. Flynn, D. D.Turner, I. D. Spinhirne, V. S. Scott, and I. H. Hwang,
2002: Full-time, eye-safe cloud and aerosol lidarobservation at Atmospheric Radiation Measurementprogram sites: Instruments and data processing. /.Atmos. Oceanic TechnoL, 32,439-452.
—, K. Sassen, and H. |. Welton, 2008: Elevated cloud andaerosol layer retrievals trom micropulse lidar signalprofiles. /. Atmos. Oceanic TechnoL, 25,685-700.
Gobbi, G. P., G. Di Donfrancesco, and A. Adriani, 1998:Physical properties of stratospheric clouds duringthe Antarctic winter of 1995. /. Geophys. Res., 103,10,859-10,873.
Palm, S. P., M. Fromm, and J. Spinhirne, 2005:Observations of antarctic polar stratosphericclouds by tbe Geoscience Laser Altimeter Sys*tem (GLAS). Geophys. Res. Lett., 32, L22S04,doi:I0.i029/2005GL023524.
Pfenninger, M., A. Z. Liu, G. C. Papen, and C. S. Gard-ner, 1999: Gravity wave characteristics in the loweratmosphere at the South Pole. /. Geophys. Res., 104,5693-5984, doi:10.1029/98ID02705.
Shibata, T., K. Sato, H. Kobayashi, M. Yabuki, and M.Shiobara, 2003: Antarctic polar stratospheric cloudsunder temperature perturbation by nonorographicinertia gravity waves observed by micropulse li-dar at Syowa Station. /. Geophys. Res.. 108, 4105,doi:l0.l029/2002JD002713.
Solomon, S., 1999: Stratospheric ozone depletion: Areview of concepts and history. Rev. Geophys., 37,275-316.
Tabazadeh, A., M. L. Santee, M. Y. Danilin, H. C. Pum-phrey, P. A. Newman, P. L Hamill, and ]. L. Mergen-thaler, 2000: Quantifying dentrification and its effecton ozone recovery. Science, 288,1407-1411., E. L Jensen, O. B. Toon, K. Drdla, and M. R. Scboe-
berl, 2001: Role of the stratospheric freezing belt indenitrification. Science, 291, 2591-2594,
Toon, O. B., A. Tabazadeb, E. V. Browell, and J.Jordan, 2000: Analysis of lidar observations ofArctic polar stratospberic clouds during Janu-ary 1989. /. Geophys. Res.. 105, 20,589-20,615,doi:10.1029/2000JD900144.
Waters, J. W., and Coauthors, 2006: The Earth Observ-ing System microwave limb sounder on the Aurasatellite. IEEE Trans. Geosci. Remote Sens., '44,1075-1092.
Welton, E. J., J. R. Campbell, J. D. Spinhrine, and V. S.Scott, 2001: Global monitoring of clouds and aerosolsusing a network of micro-pulse lidar systems. Proc.hit. Soc. Opt. Eng.. 4153, 151-158.
AMERICAN METEOROLOGICAL SOCIETY MAY 2009 BAfiS' 617