Embed Size (px)
Citation preview
Copyright © 2004 Accenture All Rights Reserved.
Draft - for discussion purposes only
Inserting the Consumer into the Trade Promotion Process
Steve Baumberger & Jim Coleman2004 FMI Conference
2Copyright © 2004 Accenture All Rights Reserved.
Draft - for discussion purposes only
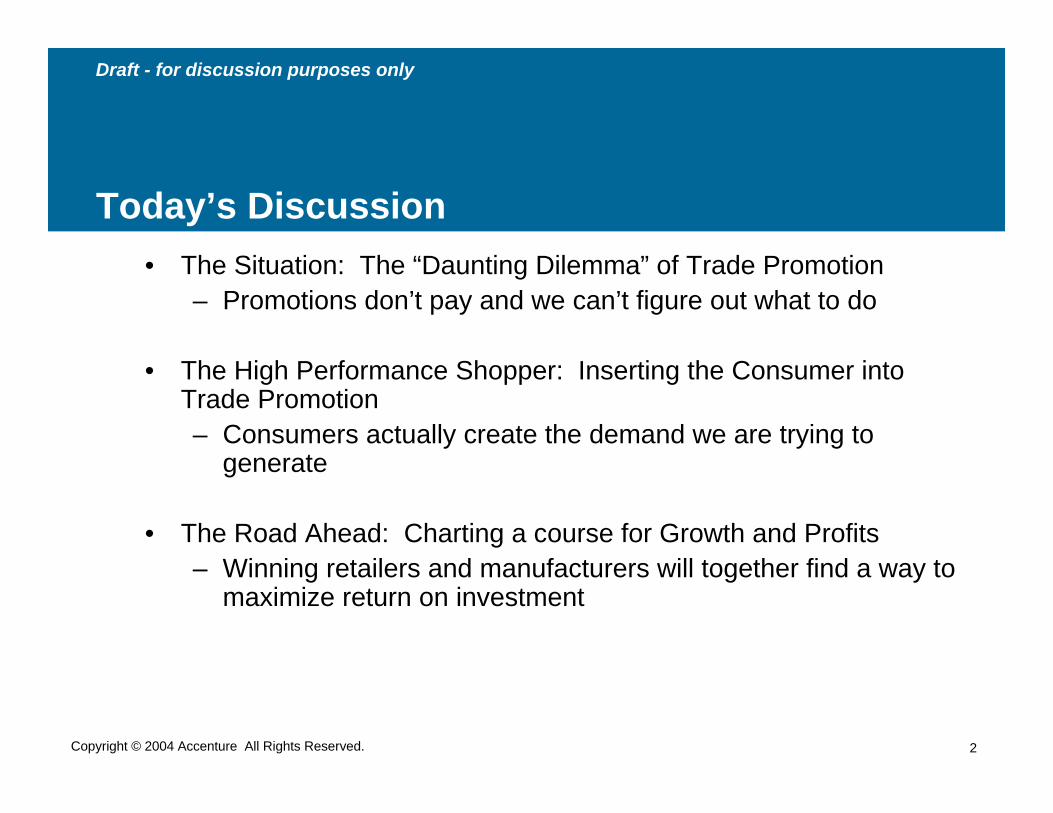
Today’s Discussion• The Situation: The “Daunting Dilemma” of Trade Promotion
– Promotions don’t pay and we can’t figure out what to do
• The High Performance Shopper: Inserting the Consumer into Trade Promotion– Consumers actually create the demand we are trying to
generate
• The Road Ahead: Charting a course for Growth and Profits– Winning retailers and manufacturers will together find a way to
maximize return on investment
3Copyright © 2004 Accenture All Rights Reserved.
Draft - for discussion purposes only
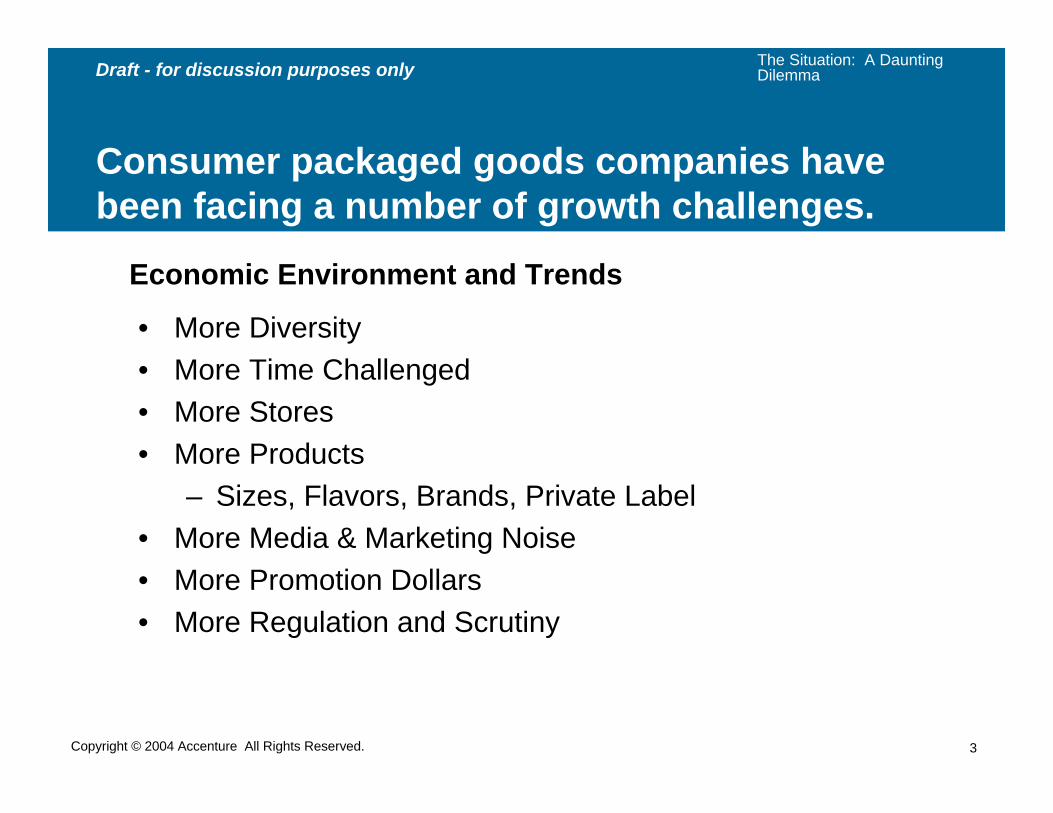
• More Diversity• More Time Challenged• More Stores• More Products
– Sizes, Flavors, Brands, Private Label• More Media & Marketing Noise• More Promotion Dollars• More Regulation and Scrutiny
Consumer packaged goods companies have been facing a number of growth challenges.
Economic Environment and Trends
The Situation: A Daunting Dilemma
4Copyright © 2004 Accenture All Rights Reserved.
Draft - for discussion purposes only
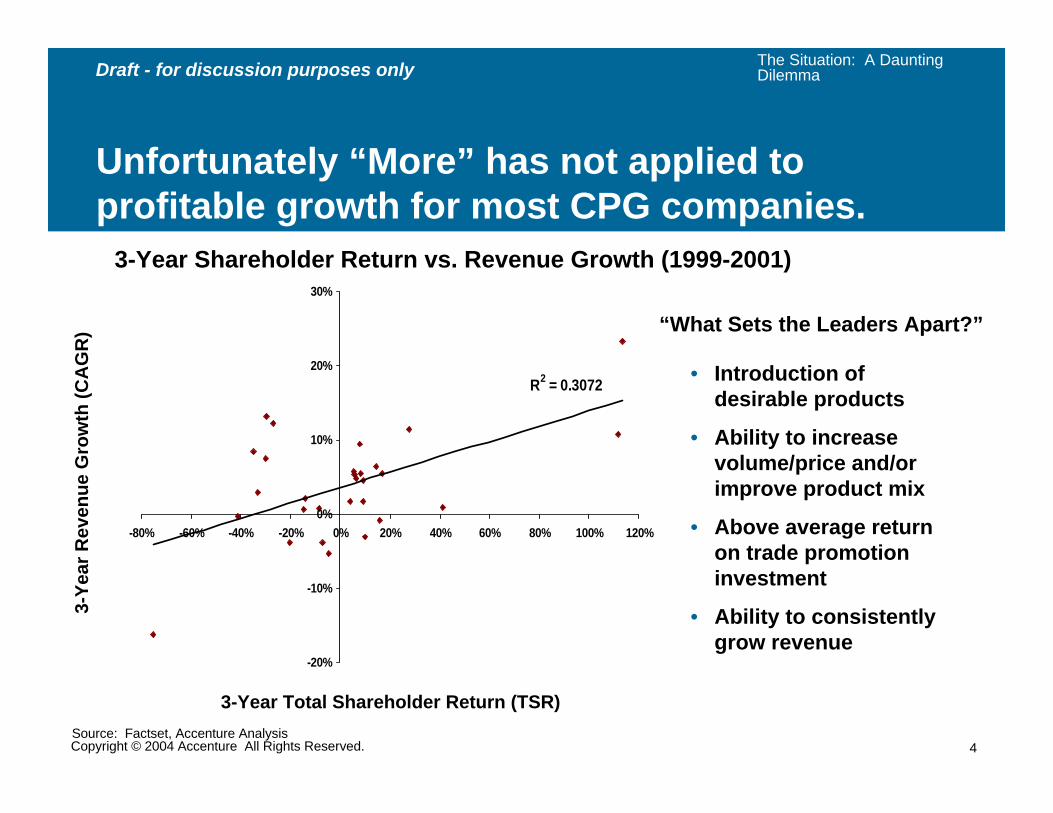
Unfortunately “More” has not applied to profitable growth for most CPG companies.
R2 = 0.3072
-20%
-10%
0%
10%
20%
30%
-80% -60% -40% -20% 0% 20% 40% 60% 80% 100% 120%
3-Year Total Shareholder Return (TSR)
3-Ye
ar R
even
ue G
row
th (C
AG
R)
Source: Factset, Accenture Analysis
• Introduction of desirable products
• Ability to increase volume/price and/or improve product mix
• Above average return on trade promotion investment
• Ability to consistently grow revenue
“What Sets the Leaders Apart?”
3-Year Shareholder Return vs. Revenue Growth (1999-2001)
The Situation: A Daunting Dilemma
5Copyright © 2004 Accenture All Rights Reserved.
Draft - for discussion purposes only
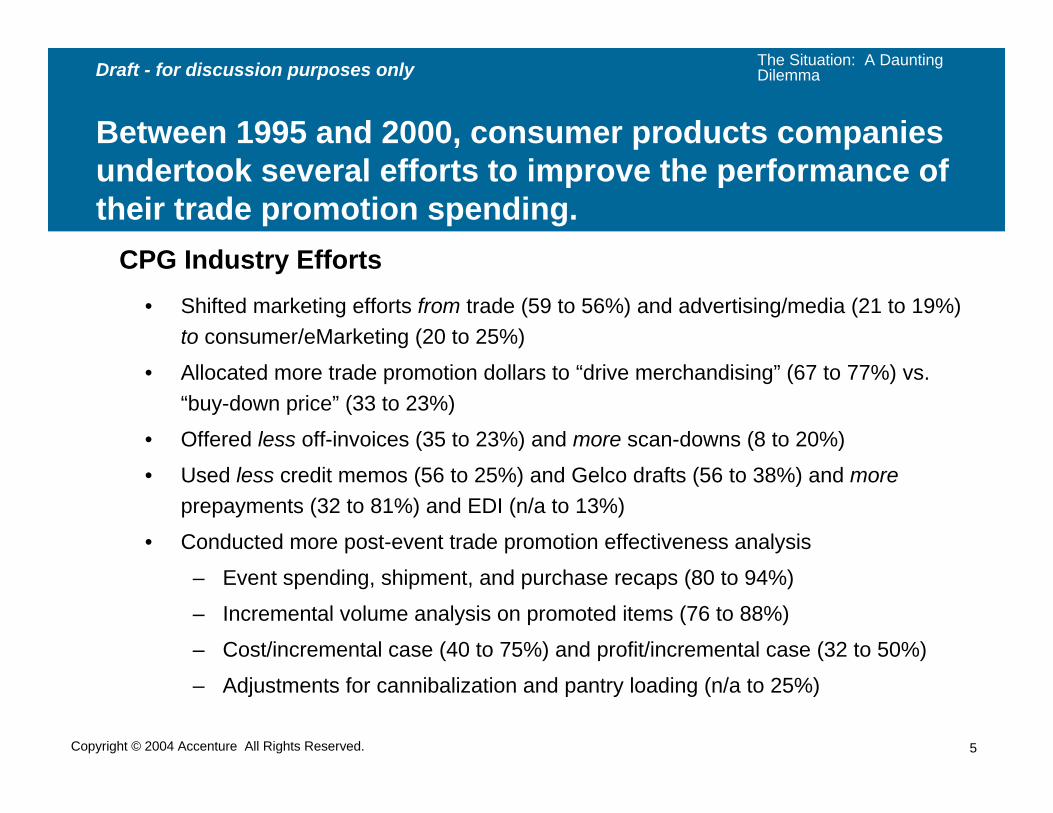
Between 1995 and 2000, consumer products companies undertook several efforts to improve the performance of their trade promotion spending.
• Shifted marketing efforts from trade (59 to 56%) and advertising/media (21 to 19%) to consumer/eMarketing (20 to 25%)
• Allocated more trade promotion dollars to “drive merchandising” (67 to 77%) vs. “buy-down price” (33 to 23%)
• Offered less off-invoices (35 to 23%) and more scan-downs (8 to 20%)
• Used less credit memos (56 to 25%) and Gelco drafts (56 to 38%) and moreprepayments (32 to 81%) and EDI (n/a to 13%)
• Conducted more post-event trade promotion effectiveness analysis
– Event spending, shipment, and purchase recaps (80 to 94%)
– Incremental volume analysis on promoted items (76 to 88%)
– Cost/incremental case (40 to 75%) and profit/incremental case (32 to 50%)
– Adjustments for cannibalization and pantry loading (n/a to 25%)
CPG Industry Efforts
The Situation: A Daunting Dilemma
6Copyright © 2004 Accenture All Rights Reserved.
Draft - for discussion purposes only
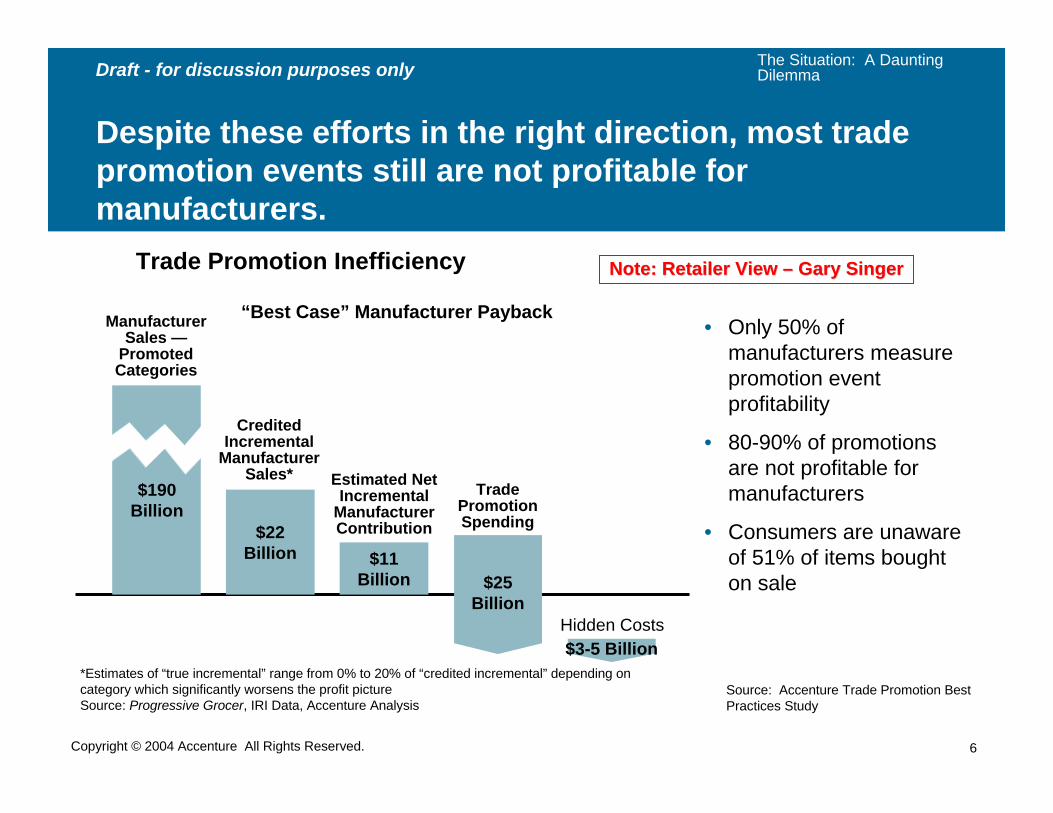
Despite these efforts in the right direction, most trade promotion events still are not profitable for manufacturers.
“Best Case” Manufacturer Payback• Only 50% of
manufacturers measure promotion event profitability
• 80-90% of promotions are not profitable for manufacturers
• Consumers are unaware of 51% of items bought on sale
$22 Billion $11
Billion $25 Billion
$3-5 BillionHidden Costs
Trade Promotion Spending
Estimated Net Incremental
Manufacturer Contribution
Credited Incremental
Manufacturer Sales*
$190Billion
Manufacturer Sales —
Promoted Categories
*Estimates of “true incremental” range from 0% to 20% of “credited incremental” depending on category which significantly worsens the profit pictureSource: Progressive Grocer, IRI Data, Accenture Analysis
Source: Accenture Trade Promotion Best Practices Study
Trade Promotion Inefficiency Note: Retailer View Note: Retailer View –– Gary SingerGary Singer
The Situation: A Daunting Dilemma
7Copyright © 2004 Accenture All Rights Reserved.
Draft - for discussion purposes only
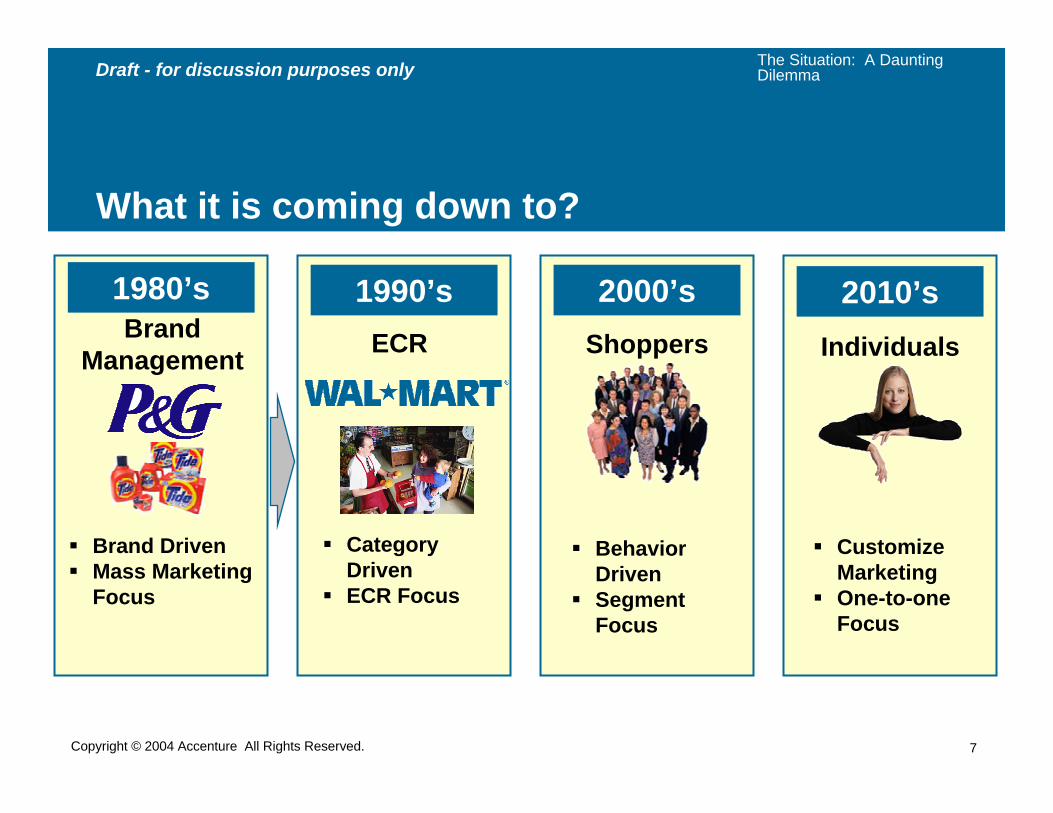
What it is coming down to?
1980’s
Brand DrivenMass Marketing Focus
1990’s
Category Driven ECR Focus
2000’sShoppers
Behavior DrivenSegment Focus
Individuals
2010’s
Customize Marketing One-to-one Focus
ECRBrand Management
The Situation: A Daunting Dilemma
8Copyright © 2004 Accenture All Rights Reserved.
Draft - for discussion purposes only
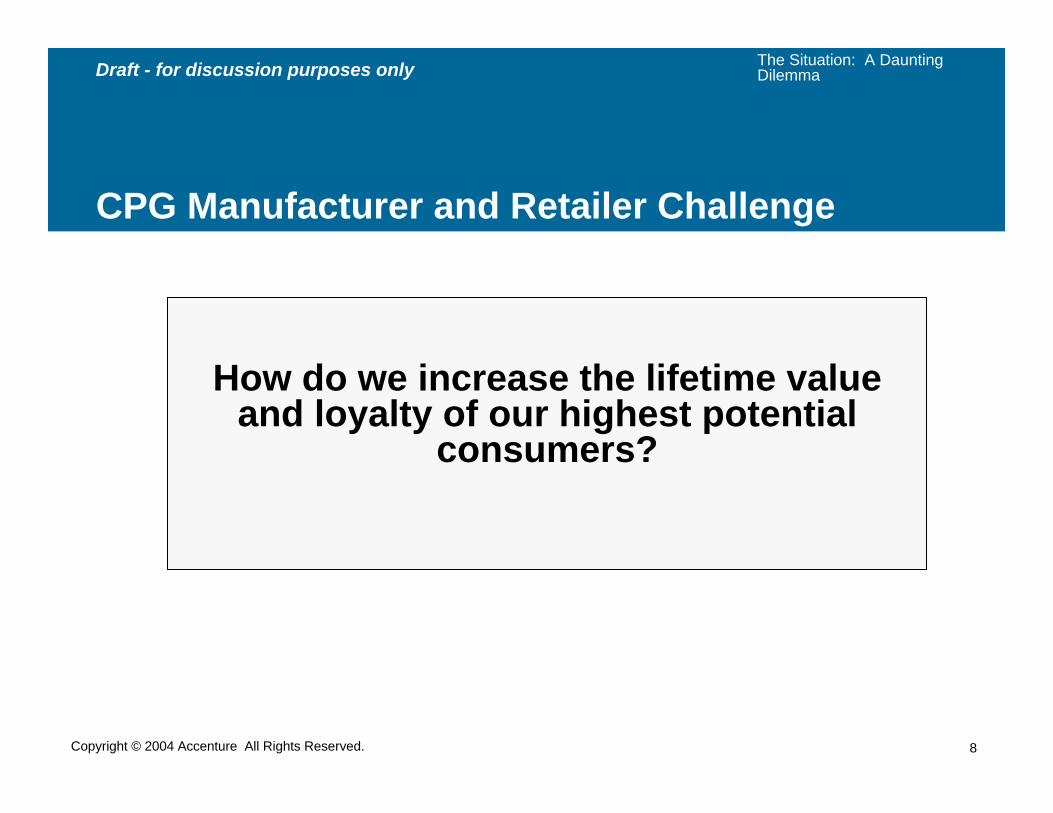
CPG Manufacturer and Retailer Challenge
How do we increase the lifetime value and loyalty of our highest potential
consumers?
The Situation: A Daunting Dilemma
9Copyright © 2004 Accenture All Rights Reserved.
Draft - for discussion purposes only
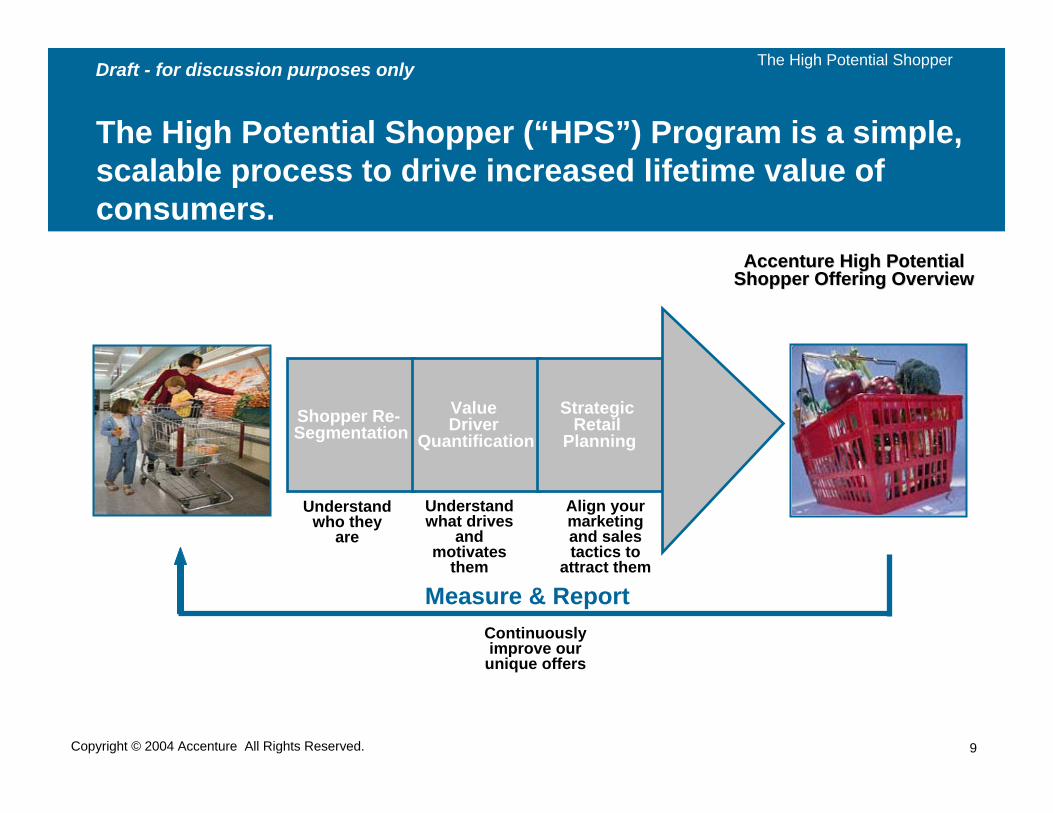
The High Potential Shopper (“HPS”) Program is a simple, scalable process to drive increased lifetime value of consumers.
Shopper Re-Segmentation
Value Driver
Quantification
Strategic Retail
Planning
Measure & Report
Understand who they
are
Understand what drives
and motivates
them
Align your marketing and sales tactics to
attract them
Continuously improve our
unique offers
Accenture High Potential Accenture High Potential Shopper Offering OverviewShopper Offering Overview
The High Potential Shopper
10Copyright © 2004 Accenture All Rights Reserved.
Draft - for discussion purposes only
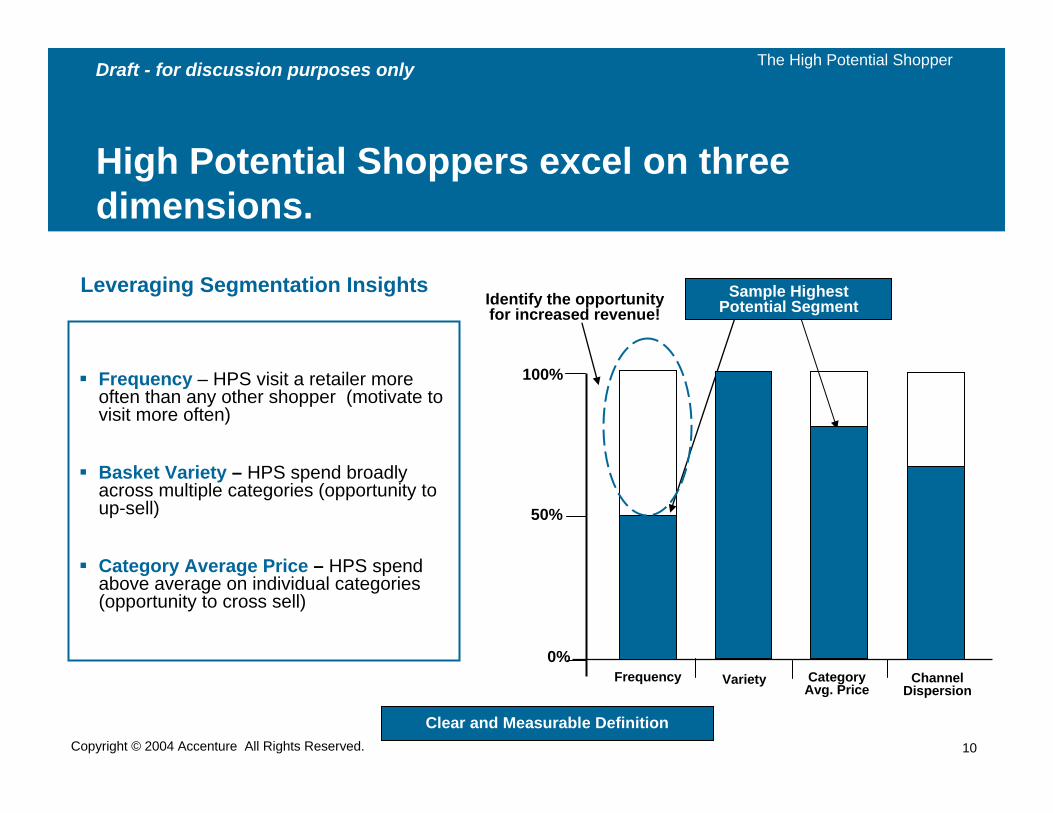
High Potential Shoppers excel on three dimensions.
Frequency – HPS visit a retailer more often than any other shopper (motivate to visit more often)
Basket Variety – HPS spend broadly across multiple categories (opportunity to up-sell)
Category Average Price – HPS spend above average on individual categories (opportunity to cross sell)
Clear and Measurable Definition
Leveraging Segmentation Insights
100%
50%
0%Frequency Variety Category
Avg. PriceChannel
Dispersion
Identify the opportunity for increased revenue!
Sample HighestPotential Segment
The High Potential Shopper
11Copyright © 2004 Accenture All Rights Reserved.
Draft - for discussion purposes only
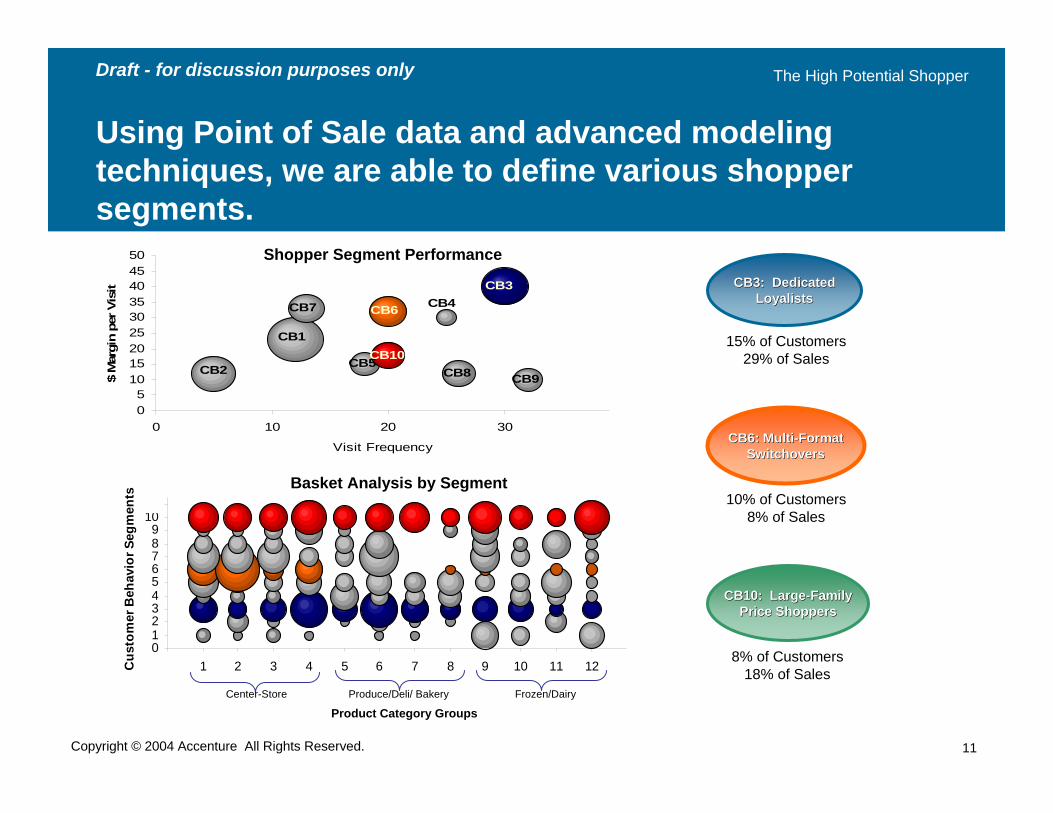
Using Point of Sale data and advanced modeling techniques, we are able to define various shopper segments.
CB3: DedicatedCB3: DedicatedLoyalistsLoyalists
15% of Customers29% of Sales
CB6: MultiCB6: Multi--FormatFormatSwitchoversSwitchovers
CB10: LargeCB10: Large--FamilyFamilyPrice ShoppersPrice Shoppers
10% of Customers8% of Sales
8% of Customers18% of Sales
CB10
CB7 CB6
CB1
CB2
CB3CB4
CB5CB8 CB9
05
101520253035404550
0 10 20 30
Visit Frequency
$ M
argi
n pe
r Vis
it
Shopper Segment Performance
0123456789
1011
0 1 2 3 4 5 6 7 8 9 10 11 12Cus
tom
er B
ehav
ior S
egm
ents
Center-Store Produce/Deli/ Bakery Frozen/Dairy
Basket Analysis by Segment
Product Category Groups
The High Potential Shopper
12Copyright © 2004 Accenture All Rights Reserved.
Draft - for discussion purposes only
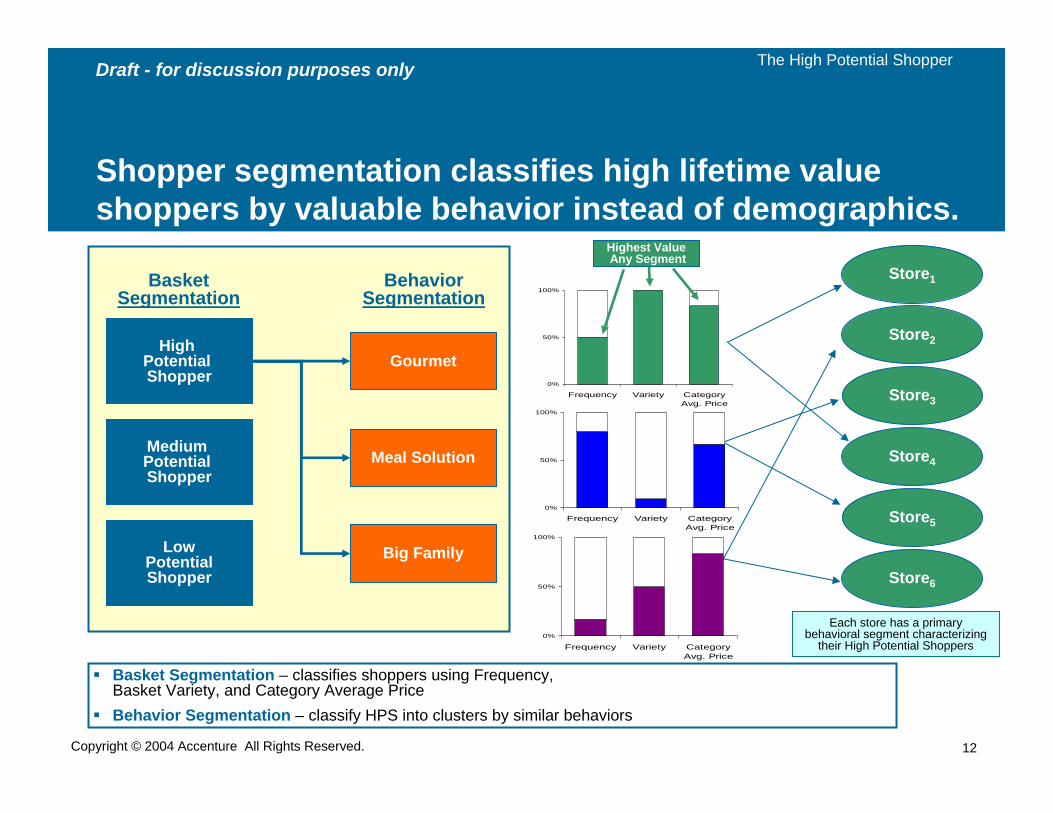
Shopper segmentation classifies high lifetime value shoppers by valuable behavior instead of demographics.
Basket Segmentation – classifies shoppers using Frequency, Basket Variety, and Category Average PriceBehavior Segmentation – classify HPS into clusters by similar behaviors
Each store has a primary behavioral segment characterizing
their High Potential Shoppers
High Potential Shopper
Medium Potential Shopper
LowPotentialShopper
Gourmet
Meal Solution
Big Family
Basket Segmentation
Behavior Segmentation
Store1
Store2
Store3
Store4
Store5
Store6
0%
50%
100%
Frequency Variety CategoryAvg. Price
0%
50%
100%
Frequency Variety CategoryAvg. Price
0%
50%
100%
Frequency Variety CategoryAvg. Price
Highest ValueAny Segment
The High Potential Shopper
13Copyright © 2004 Accenture All Rights Reserved.
Draft - for discussion purposes only
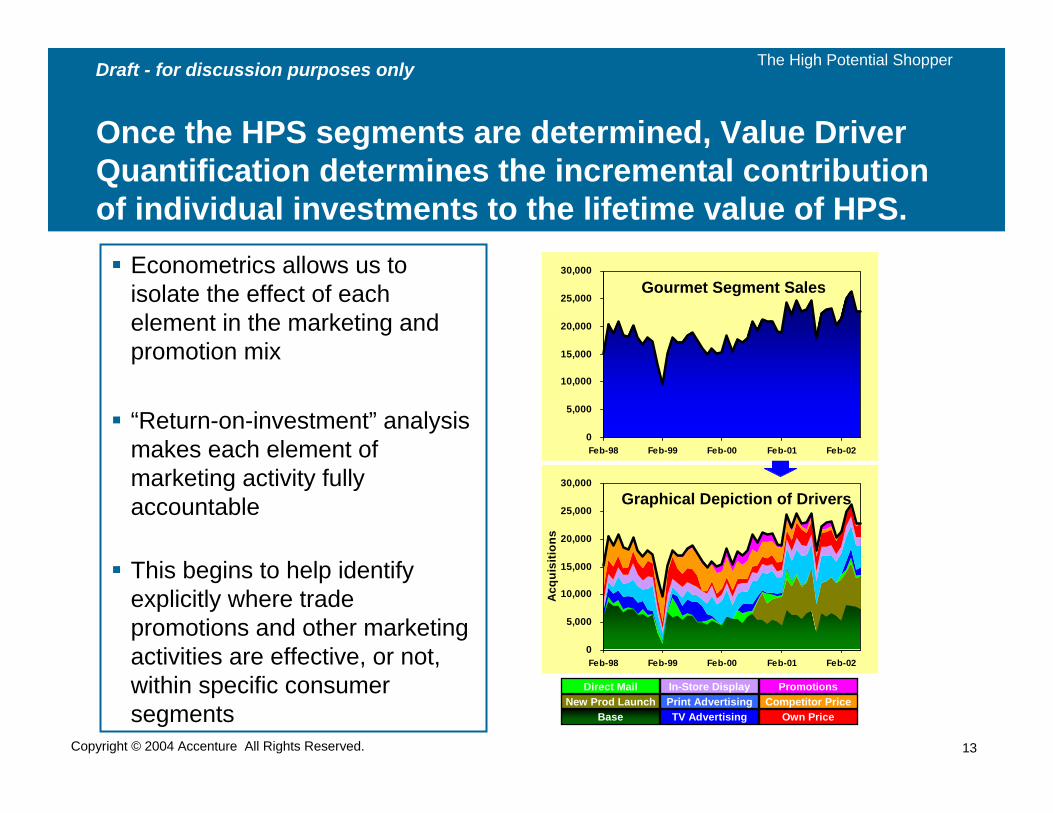
Once the HPS segments are determined, Value Driver Quantification determines the incremental contribution of individual investments to the lifetime value of HPS.
Econometrics allows us to isolate the effect of each element in the marketing and promotion mix
“Return-on-investment” analysis makes each element of marketing activity fully accountable
This begins to help identify explicitly where trade promotions and other marketing activities are effective, or not, within specific consumer segments
0
5,000
10,000
15,000
20,000
25,000
30,000
Feb-98 Feb-99 Feb-00 Feb-01 Feb-02
Acq
uisi
tions
Graphical Depiction of Drivers
BaseNew Prod Launch
Direct Mail
TV AdvertisingPrint AdvertisingIn-Store Display
Own PriceCompetitor Price
Promotions
0
5,000
10,000
15,000
20,000
25,000
30,000
Feb-98 Feb-99 Feb-00 Feb-01 Feb-02
Acq
uisi
tions
Gourmet Segment Sales
The High Potential Shopper
14Copyright © 2004 Accenture All Rights Reserved.
Draft - for discussion purposes only
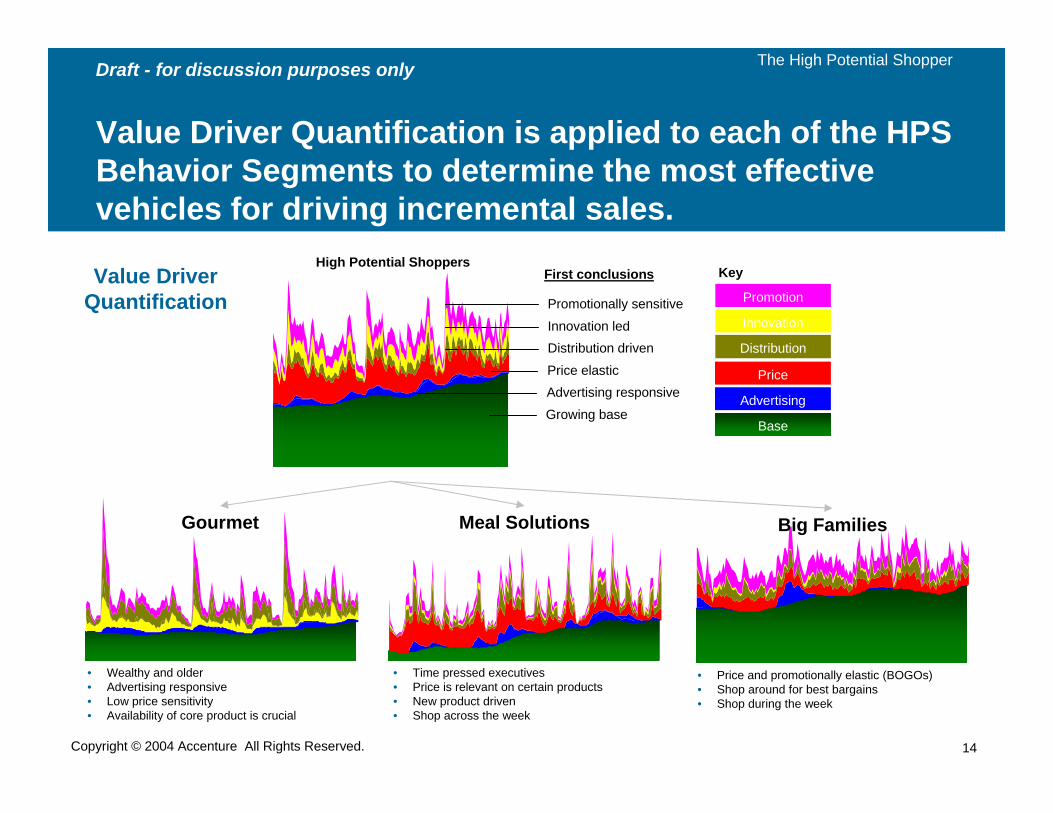
Value Driver Quantification is applied to each of the HPS Behavior Segments to determine the most effective vehicles for driving incremental sales.
Gourmet
• Wealthy and older• Advertising responsive• Low price sensitivity• Availability of core product is crucial
Meal Solutions
• Time pressed executives• Price is relevant on certain products• New product driven• Shop across the week
Big Families
• Price and promotionally elastic (BOGOs)• Shop around for best bargains• Shop during the week
High Potential Shoppers
Growing base
Price elastic
Innovation led
Promotionally sensitive
Distribution driven
First conclusions
Advertising responsive
Promotion
Innovation
Distribution
Price
Advertising
Base
KeyValue Driver Quantification
The High Potential Shopper
15Copyright © 2004 Accenture All Rights Reserved.
Draft - for discussion purposes only
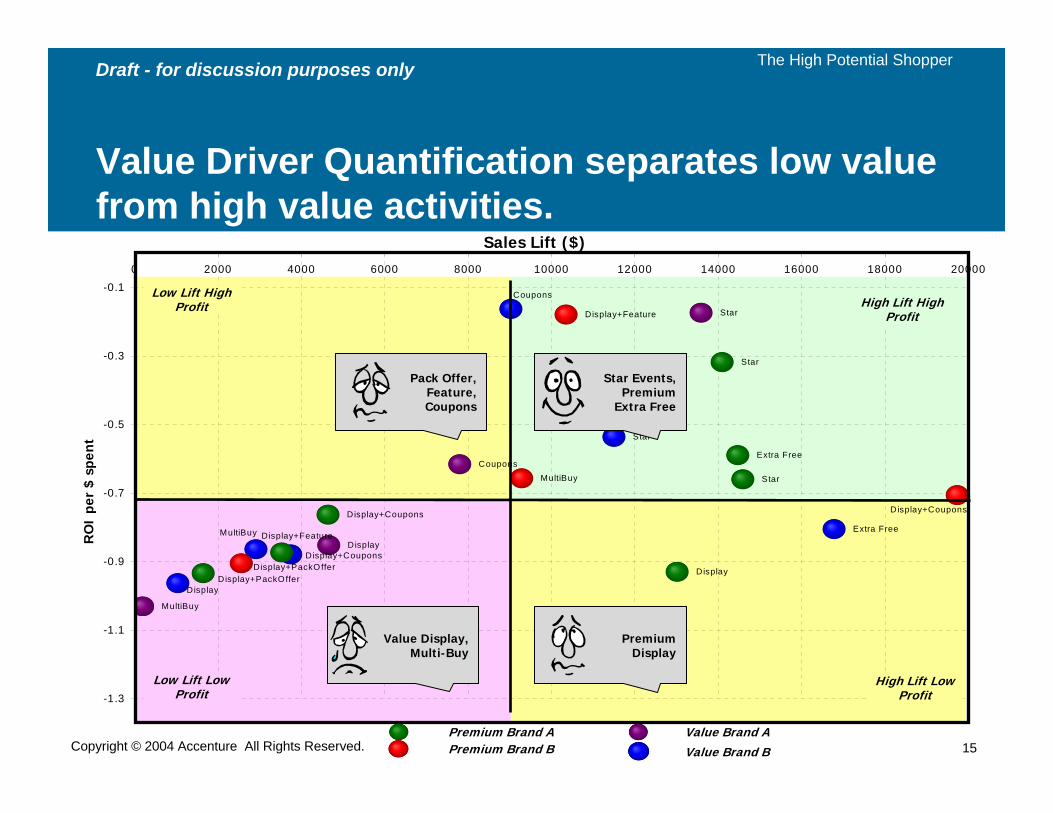
Value Driver Quantification separates low value from high value activities.
Star
Star
Extra Free
Display+PackOffer
Display+Feature
Display+Coupons
Display
MultiBuy
Display+PackOffer
Display+Feature
Display+Coupons
Star
MultiBuy
Display
Coupons
Star
MultiBuy Extra Free
Display+Coupons
Display
Coupons
-1.3
-1.1
-0.9
-0.7
-0.5
-0.3
-0.10 2000 4000 6000 8000 10000 12000 14000 16000 18000 20000
RO
I pe
r $
spe
nt
Sales Lift ($)
Pack Offer,Feature,Coupons
Star Events,Premium
Extra Free
Premium Display
Value Display,Multi-Buy
Premium Brand APremium Brand B
Value Brand AValue Brand B
Low Lift High Profit
Low Lift Low Profit
High Lift High Profit
High Lift Low Profit
The High Potential Shopper
16Copyright © 2004 Accenture All Rights Reserved.
Draft - for discussion purposes only
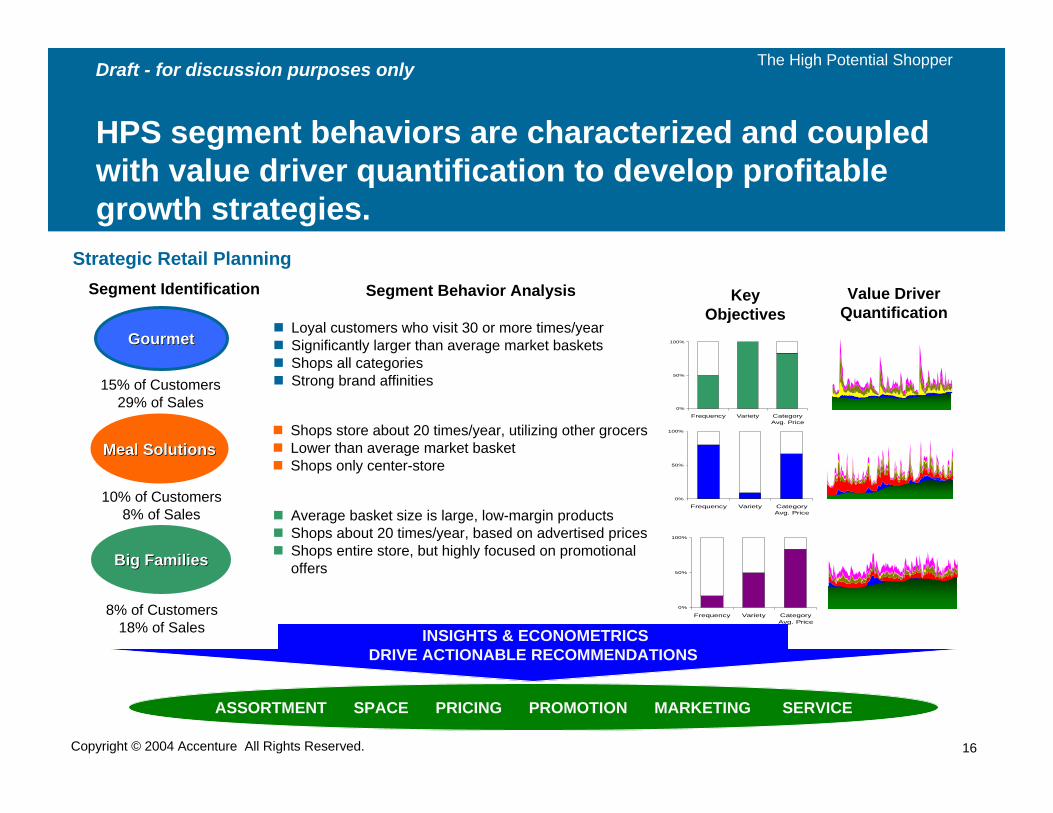
HPS segment behaviors are characterized and coupled with value driver quantification to develop profitable growth strategies.
GourmetGourmet
15% of Customers29% of Sales
Meal SolutionsMeal Solutions
Big FamiliesBig Families
10% of Customers8% of Sales
8% of Customers18% of Sales
Loyal customers who visit 30 or more times/yearSignificantly larger than average market basketsShops all categoriesStrong brand affinities
Shops store about 20 times/year, utilizing other grocersLower than average market basketShops only center-store
Average basket size is large, low-margin productsShops about 20 times/year, based on advertised pricesShops entire store, but highly focused on promotional offers
INSIGHTS & ECONOMETRICSDRIVE ACTIONABLE RECOMMENDATIONS
ASSORTMENT SPACE PRICING PROMOTION MARKETING SERVICE
Value Driver Quantification
Segment Behavior AnalysisSegment Identification Key Objectives
0%
50%
100%
Frequency Variety CategoryAvg. Price
0%
50%
100%
Frequency Variety CategoryAvg. Price
0%
50%
100%
Frequency Variety CategoryAvg. Price
Strategic Retail Planning
The High Potential Shopper
17Copyright © 2004 Accenture All Rights Reserved.
Draft - for discussion purposes only
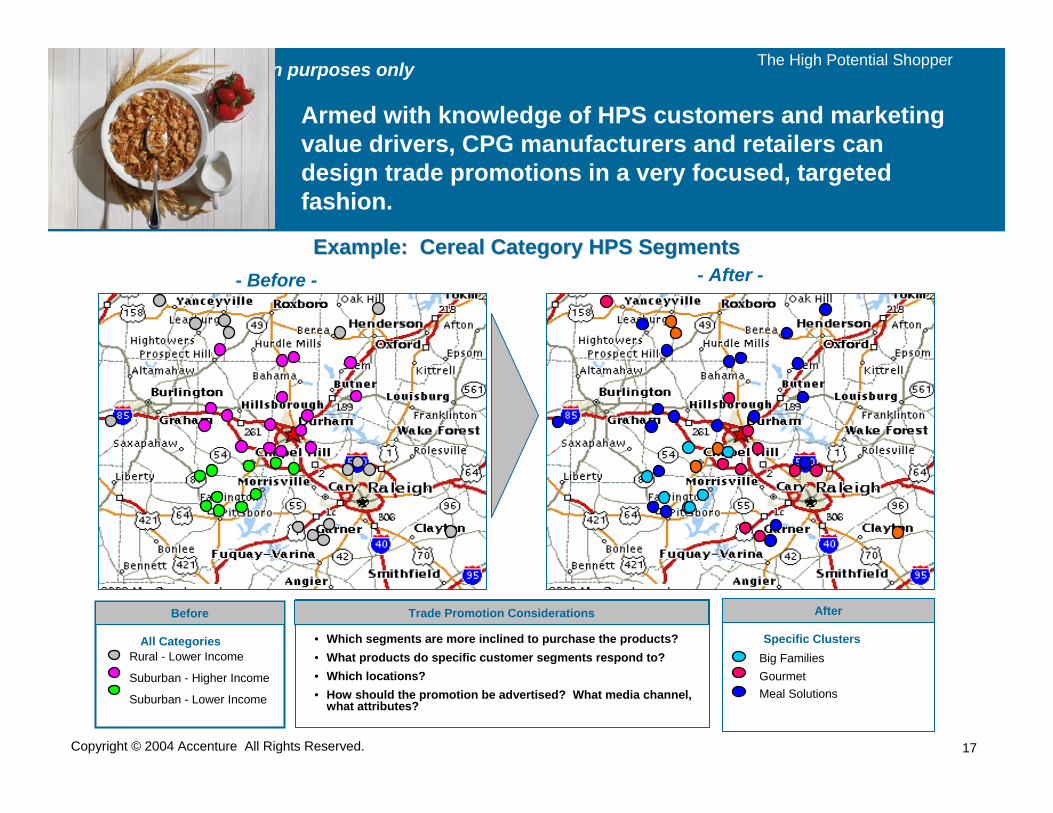
Armed with knowledge of HPS customers and marketing value drivers, CPG manufacturers and retailers can design trade promotions in a very focused, targeted fashion.
Before
Rural - Lower Income
Suburban - Higher Income
Suburban - Lower Income
All Categories
- Before - - After -
Specific Clusters
After
Meal Solutions
Big FamiliesGourmet
The High Potential Shopper
Example: Cereal Category HPS SegmentsExample: Cereal Category HPS Segments
• Which segments are more inclined to purchase the products?• What products do specific customer segments respond to?• Which locations?• How should the promotion be advertised? What media channel,
what attributes?
Trade Promotion Considerations
18Copyright © 2004 Accenture All Rights Reserved.
Draft - for discussion purposes only
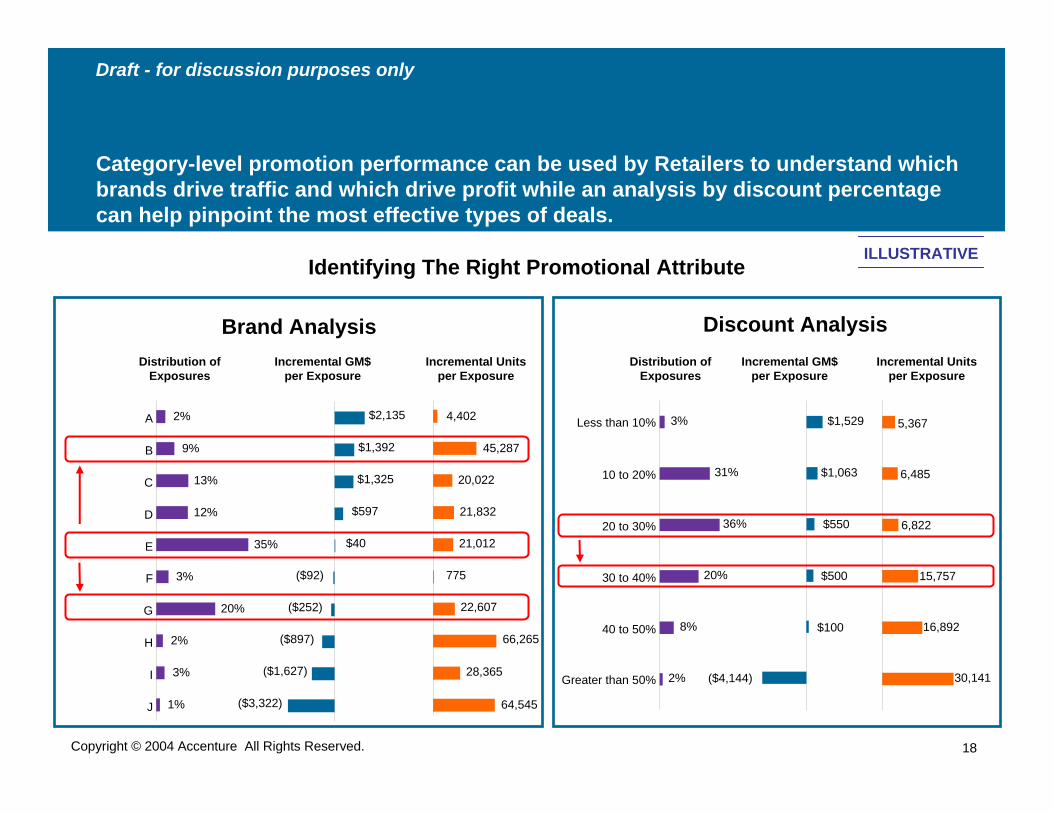
Incremental Units per Exposure
4,402
45,287
20,022
21,832
21,012
775
22,607
66,265
28,365
64,545
2%
9%
13%
12%
35%
3%
20%
2%
3%
1%
Distribution ofExposures
A
B
C
D
E
F
G
H
I
J
Incremental GM$ per Exposure
($92)
($252)
($897)
($1,627)
($3,322)
$2,135
$1,392
$1,325
$597
$40
3%
31%
36%
20%
8%
2%
Less than 10%
10 to 20%
20 to 30%
30 to 40%
40 to 50%
Greater than 50%
Distribution ofExposures
$1,529
$1,063
$550
$500
$100
($4,144)
Incremental GM$ per Exposure
5,367
6,485
6,822
15,757
16,892
30,141
Incremental Units per Exposure
Discount AnalysisBrand Analysis
Category-level promotion performance can be used by Retailers to understand which brands drive traffic and which drive profit while an analysis by discount percentage can help pinpoint the most effective types of deals.
Identifying The Right Promotional AttributeILLUSTRATIVE
19Copyright © 2004 Accenture All Rights Reserved.
Draft - for discussion purposes only
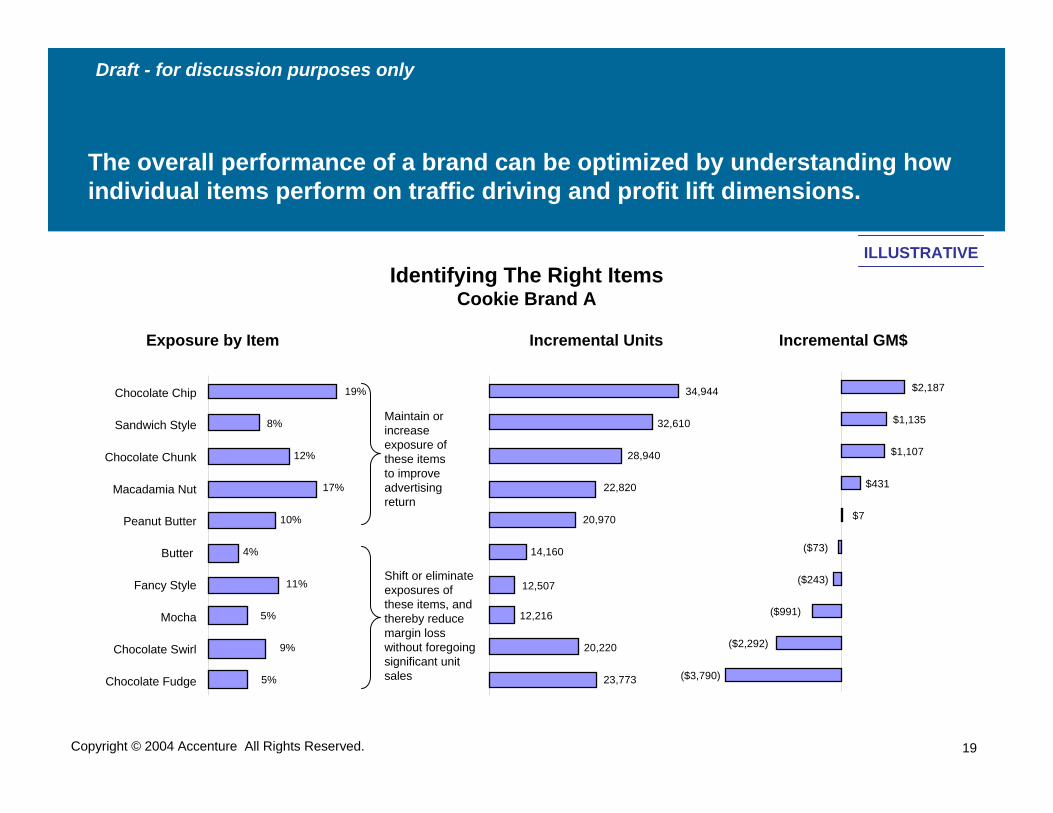
The overall performance of a brand can be optimized by understanding how individual items perform on traffic driving and profit lift dimensions.
Identifying The Right Items Cookie Brand A
Incremental Units Incremental GM$
$2,187
$1,135
$1,107
$431
$7
($73)
($243)
($991)
($2,292)
($3,790)
34,944
32,610
28,940
22,820
20,970
14,160
12,507
12,216
20,220
23,773
19%
8%
12%
17%
10%
4%
11%
5%
9%
5%
Chocolate Chip
Sandwich Style
Chocolate Chunk
Macadamia Nut
Peanut Butter
Butter
Fancy Style
Mocha
Chocolate Swirl
Chocolate Fudge
Exposure by Item
Shift or eliminate exposures of these items, and thereby reduce margin loss without foregoing significant unit sales
Maintain or increase exposure of these items to improve advertising return
ILLUSTRATIVE
20Copyright © 2004 Accenture All Rights Reserved.
Draft - for discussion purposes only
Conclusions• The Daunting Dilemma continues, and it’s only getting more
complicated and more competitive • Successful ROI on Trade Promotions and other investments lies in
achieving a true understanding of customer segments and their behaviors.
• Value Driver Quantification must be used to understand the responsiveness of marketing activities, including promotions.
• Merchandising and Marketing strategies must be realigned to build off of the customer insight.
• Collaboration, including the sharing of data, insight and results will become ever more important in achieving positive ROI on trade promotions profitable growth overall.
21Copyright © 2004 Accenture All Rights Reserved.
Draft - for discussion purposes only
Call to Action• Understand who the High Potential Shoppers are• Understand what drives and motivates them• Align marketing and sales tactics to attract them• Collaborate between CPG Manufacturer/Retailer –
share data, insight, learnings openly• Create joint accountability for success• Measure, assess, learn and continuously improve