Embed Size (px)
Citation preview
Pric
e:IN
R 1
50 /
US
$ 15
S
ubsc
riber
’s c
opy.
Not
for S
ale
R.N
.I N
o -
UP
EN
G/2
01
0/3
41
53
R
eg
istr
ati
on
no
: U
P/G
BD
-13
6/2
011
-13
Pu
bli
ca
tio
n:
10
tho
f e
very
mo
nth
I
Po
sti
ng
: 1
5th
/ 2
0th
of
eve
ry m
on
th
R.N
.I N
o -
UP
EN
G/2
01
0/3
41
53
R
eg
istr
ati
on
no
: U
P/G
BD
-13
6/2
011
-13
Pu
bli
ca
tio
n:
10
tho
f e
very
mo
nth
I
Po
sti
ng
: 1
5th
/ 2
0th
of
eve
ry m
on
th
ISSN 2277 - 3134
AUGUST 2012 VOL 03 ISSUE 01
www.geospatialworld.netYOUR GEOSPATIAL INDUSTRY MAGAZINE
For more information visithttp://di.leica-geosystems.com
www.leica-geosystems.com
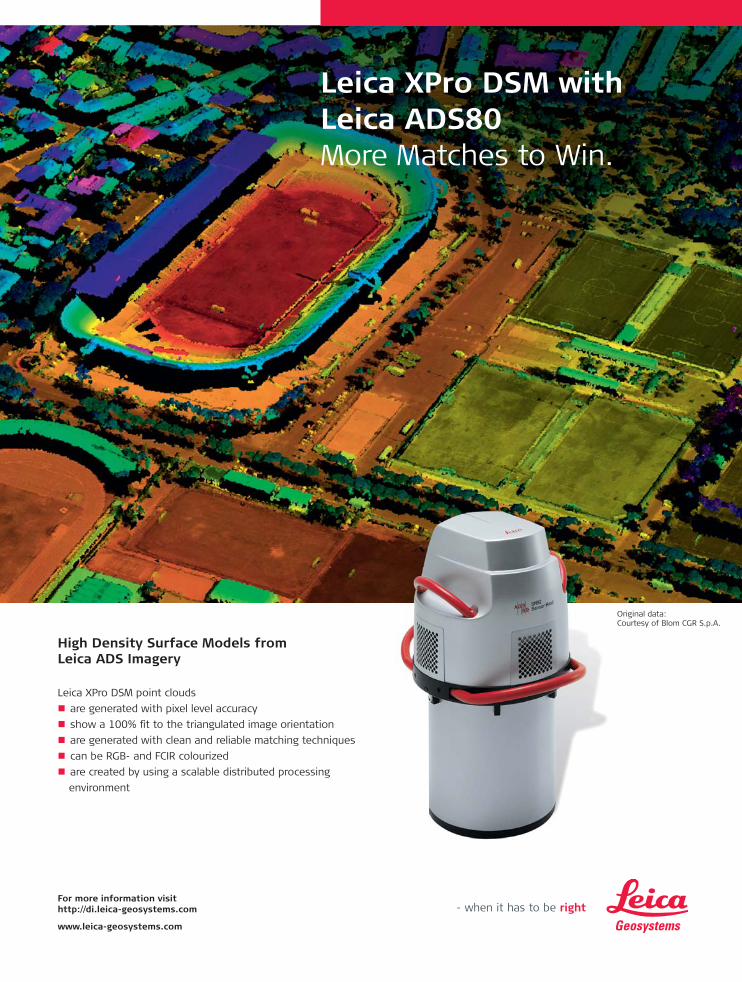
Leica XPro DSM with Leica ADS80More Matches to Win.
Original data: Courtesy of Blom CGR S.p.A.
High Density Surface Models from Leica ADS Imagery
Leica XPro DSM point clouds
are generated with pixel level accuracy
show a 100% fi t to the triangulated image orientation
are generated with clean and reliable matching techniques
can be RGB- and FCIR colourized
are created by using a scalable distributed processing
environment
Leica_XPro_DSM_Ad_7_75x10_25inch.indd 1 20.4.2011 12:01:34 Uhr
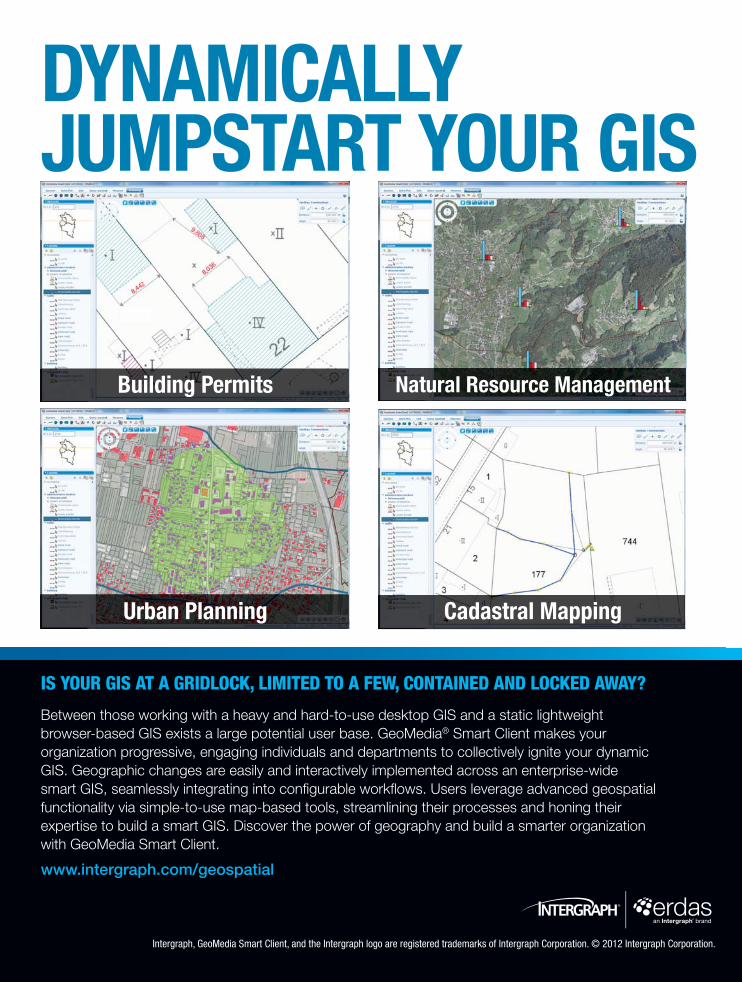
IS YOUR GIS AT A GRIDLOCK, LIMITED TO A FEW, CONTAINED AND LOCKED AWAY?
Between those working with a heavy and hard-to-use desktop GIS and a static lightweight browser-based GIS exists a large potential user base. GeoMedia® Smart Client makes your organization progressive, engaging individuals and departments to collectively ignite your dynamic GIS. Geographic changes are easily and interactively implemented across an enterprise-wide smart GIS, seamlessly integrating into configurable workflows. Users leverage advanced geospatial functionality via simple-to-use map-based tools, streamlining their processes and honing their expertise to build a smart GIS. Discover the power of geography and build a smarter organization with GeoMedia Smart Client.
www.intergraph.com/geospatial
Intergraph, GeoMedia Smart Client, and the Intergraph logo are registered trademarks of Intergraph Corporation. © 2012 Intergraph Corporation.
DYNAMICALLY JUMPSTART YOUR GIS
Building Permits
Urban Planning
Natural Resource Management
Cadastral Mapping

Geospatial World I August 2012
Geospatial WorldGeospatial Media and Communications Pvt. Ltd.(formerly GIS Development Pvt. Ltd.)A - 145, Sector - 63, Noida, India Tel + 91-120-4612500 Fax +91-120-4612555 / 666
Inside...
Inside...
PRICE: INR 150/US$ 1507 Editorial 08 News
ARTICLES
3D street level imagery:
Securing the missing perspective
Mark Taris and Bart Beers
3D terrestrial laser scanning:
A whole new world
Geoff Jacobs
3D building models:
An 'alternative' route with energy efficiency
Geoff Zeiss
CASE STUDIES
Helsinki, Finland:
Improving efficiency with the third dimension
Tainan, Taiwan:
Towards improved decision making
Gothenburg, Sweden:
Public at the forefront
Graz, Austria:
City planning gets a boost
Jeddah, Saudi Arabia:
Assessing flood risk
20
31
34
48
38
40
42
43
44
5
Abbas Rajabifard President,GSDI Association
Jack DangermondPresident, Esri
Shailesh Nayak SecretaryMinistry of Earth SciencesGovernment of India
Mark ReichardtPresident and CEOOpen Geospatial Consortium, Inc.
Aida Opoku Mensah Director - ICT DivisionUN Economic Commission for Africa
Josef StroblDirector, Centre for Geoinformatics,University of Salzburg, Austria
Vanessa Lawrence CBDirector General and CEO,Ordnance Survey, UK
Matthew M O'ConnellPresident and CEO GeoEye
Bryn FosburghVice PresidentTrimble
Juergen DoldPresident, Hexagon Geosystems
Preetha PulusaniChief Strategy Officer,Rolta Group
Derek Clarke Chief Director-Survey and Mapping & National Geospatial InformationDepartment of Rural Development & Land Reform, South Africa
Kamal K SinghChairman and CEORolta Group
Greg BentleyCEO, Benltey Systems
Prof Ian DowmanFirst Vice PresidentISPRS
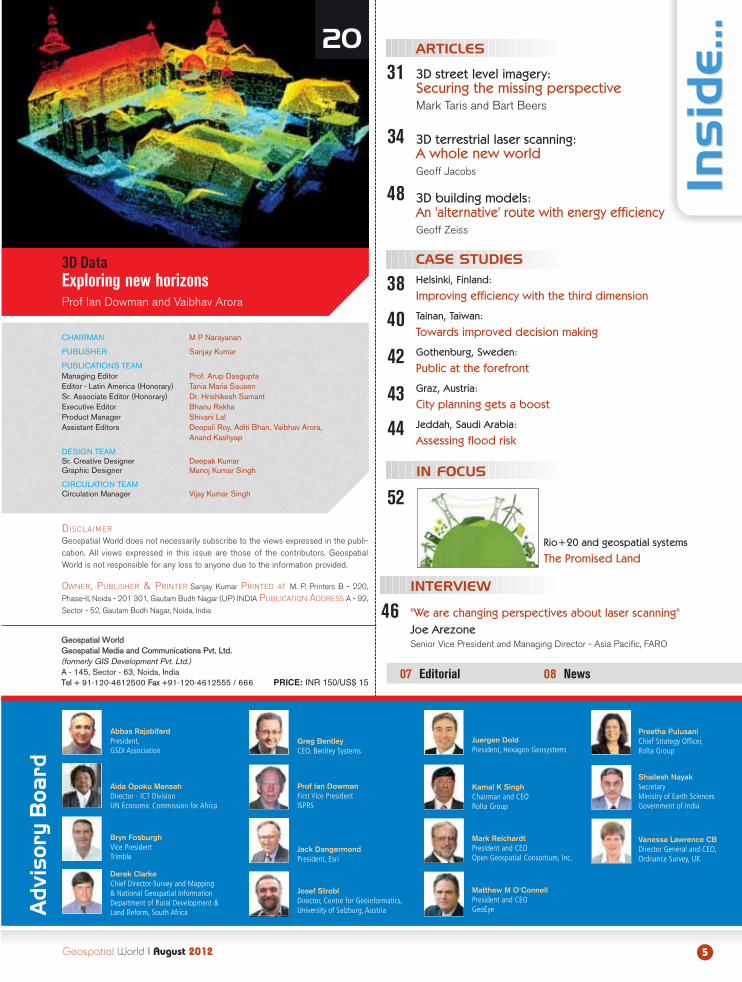
3D Data Exploring new horizons Prof Ian Dowman and Vaibhav Arora
DISCLAIMER
Geospatial World does not necessarily subscribe to the views expressed in the publi-cation. All views expressed in this issue are those of the contributors. GeospatialWorld is not responsible for any loss to anyone due to the information provided.
OWNER, PUBLISHER & PRINTER Sanjay Kumar PRINTED AT M. P. Printers B - 220,
Phase-II, Noida - 201 301, Gautam Budh Nagar (UP) INDIA PUBLICATION ADDRESS A - 92,
Sector - 52, Gautam Budh Nagar, Noida, India
CHAIRMAN M P Narayanan
PUBLISHER Sanjay Kumar
PUBLICATIONS TEAMManaging Editor Prof. Arup DasguptaEditor - Latin America (Honorary) Tania Maria SausenSr. Associate Editor (Honorary) Dr. Hrishikesh SamantExecutive Editor Bhanu RekhaProduct Manager Shivani LalAssistant Editors Deepali Roy, Aditi Bhan, Vaibhav Arora,
Anand Kashyap
DESIGN TEAMSr. Creative Designer Deepak Kumar Graphic Designer Manoj Kumar Singh
CIRCULATION TEAMCirculation Manager Vijay Kumar Singh
Ad
vis
ory
B
oa
rd
Rio+20 and geospatial systems
The Promised Land
52IN FOCUS
"We are changing perspectives about laser scanning"
Joe Arezone
Senior Vice President and Managing Director - Asia Pacific, FARO
46INTERVIEW

Trimble_237_Ad-1_7.75x10.25.indd 1 18.07.12 09:21
oday, an applicant for a driving licence is made to practise on a simu-lator which presents a virtual world full of traffic hazards. 'Accidents'can easily be reversed, unlike in the real world where an accident canmean unplanned expenses and a break in the learning process. In
fact, one of the most important uses of 3D models which show both terrainand structures is in simulators for training pilots, navigators and drivers.This electronic terrain with buildings and other structures has emergedfrom the union of two different computer graphics applications. With theadvent of computer graphics, 3D terrain representation could be easilyachieved in GIS. In the same way, engineers found that computer graphicscould easily be used to render true representations ofstructures like buildings and bridges in CAD. It was but amatter of time before these two graphic models coalescedinto one.
Advances in data acquisition like digital stereo cameras,interferometric SAR and LiDAR provide the necessary datafor the software. However, the ingenuity of using this dataand software is illustrated in applications which extendfrom professional applications like building informationmodelling (BIM) to 3D role-playing games. LiDAR and digi-tal stereo imagery are also being used at the ground levelto create 3D models of structures which are useful inmunicipal management and even restoration of historicalicons like the Bamian Buddhas. The opportunities forapplications of 3D models extend beyond just engineering.Disaster management requires such models to, for exam-ple, evaluate flood risk and plan evacuation routes. 3Dmodels are serving as a means of conveying and discussingurban plans with citizens. 3D models are also finding appli-cations in developing smart and green cities.
Many of these applications have great relevance for some of the goals of therecently concluded Rio+20 conference. The final document of the conferencementions the importance of geospatial systems. The major goals are therealisation of sustainable development with equity keeping in mind theneeds of the underprivileged citizens. Poverty alleviation and freedom fromhunger are guiding goals. It is up to the geospatial community to rise to thechallenge of helping to realise 'The World We Want'.
EditorSpeak
7Geospatial World I August 2012
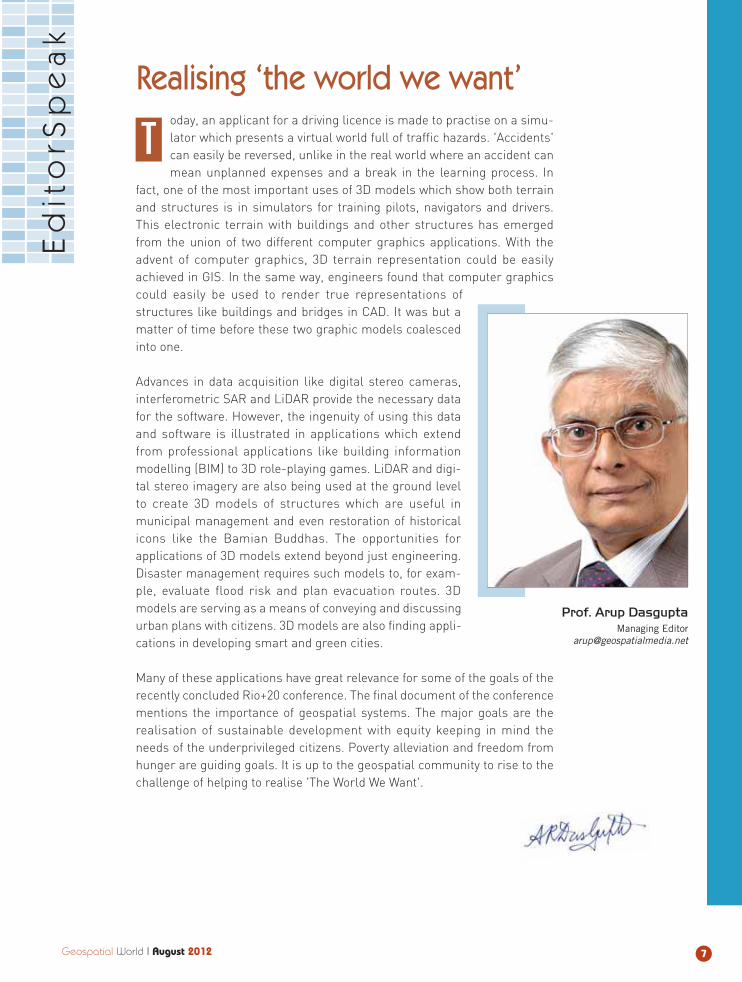
Prof. Arup Dasgupta
Managing [email protected]
TRealising ‘the world we want’
Geospatial World I August 2012
SOUTH AFRICA
Google expands livetraffic coverageGoogle expanded its live traffic cover-age to South Africa, with the servicenow available in Cape Town, Johan-nesburg and Pretoria. The trafficoverlay on Google Maps shows cur-rent traffic conditions and also pro-vides estimated travel times basedon traffic conditions. The serviceuses crowd-sourcing technology.
Satellite navigationproject launched
SBAS Awareness and Training forSouth Africa (SATSA) project hasbeen launched. GMV, a Spain-basedfirm is leading the satellite navigationproject in collaboration with theSouth African National Space Agency(SANSA). The project aims toincrease the technological navigationcapacity in the region. SATSA is aneighteen-month project during which
GMV will install testing platforms inSouth Africa for conducting practicaltests.
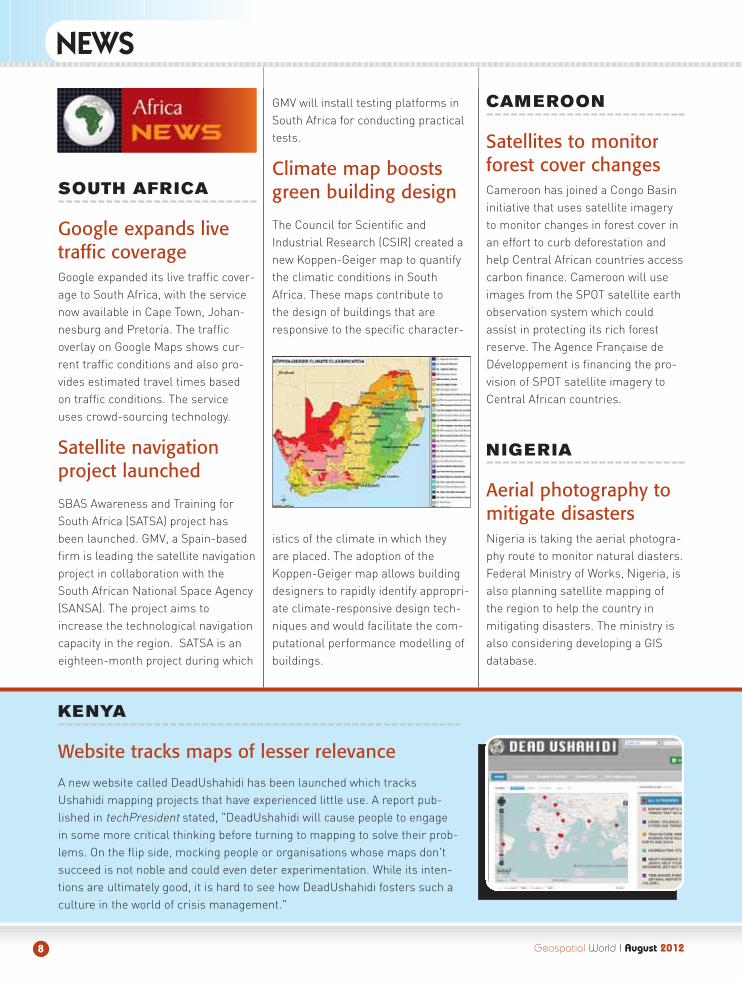
Climate map boostsgreen building design
The Council for Scientific and Industrial Research (CSIR) created anew Koppen-Geiger map to quantifythe climatic conditions in SouthAfrica. These maps contribute to the design of buildings that areresponsive to the specific character-
istics of the climate in which they are placed. The adoption of the Koppen-Geiger map allows buildingdesigners to rapidly identify appropri-ate climate-responsive design tech-niques and would facilitate the com-putational performance modelling ofbuildings.
CAMEROON
Satellites to monitorforest cover changesCameroon has joined a Congo Basininitiative that uses satellite imageryto monitor changes in forest cover inan effort to curb deforestation andhelp Central African countries accesscarbon finance. Cameroon will useimages from the SPOT satellite earthobservation system which couldassist in protecting its rich forestreserve. The Agence Française deDéveloppement is financing the pro-vision of SPOT satellite imagery toCentral African countries.
NIGERIA
Aerial photography tomitigate disastersNigeria is taking the aerial photogra-phy route to monitor natural diasters.Federal Ministry of Works, Nigeria, isalso planning satellite mapping ofthe region to help the country in mitigating disasters. The ministry isalso considering developing a GISdatabase.
NEWS
8
KENYA
Website tracks maps of lesser relevance
A new website called DeadUshahidi has been launched which tracksUshahidi mapping projects that have experienced little use. A report pub-lished in techPresident stated, "DeadUshahidi will cause people to engagein some more critical thinking before turning to mapping to solve their prob-lems. On the flip side, mocking people or organisations whose maps don'tsucceed is not noble and could even deter experimentation. While its inten-tions are ultimately good, it is hard to see how DeadUshahidi fosters such aculture in the world of crisis management."
INDIA
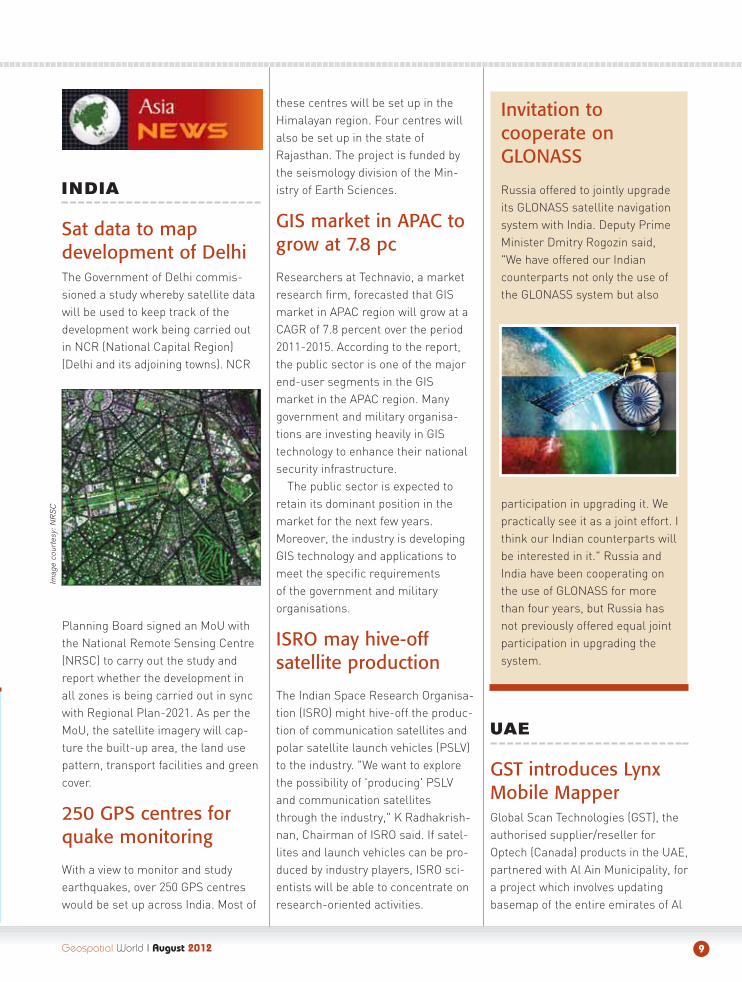
Sat data to mapdevelopment of DelhiThe Government of Delhi commis-sioned a study whereby satellite datawill be used to keep track of thedevelopment work being carried outin NCR (National Capital Region)(Delhi and its adjoining towns). NCR
Planning Board signed an MoU withthe National Remote Sensing Centre(NRSC) to carry out the study andreport whether the development inall zones is being carried out in syncwith Regional Plan-2021. As per theMoU, the satellite imagery will cap-ture the built-up area, the land usepattern, transport facilities and greencover.
250 GPS centres forquake monitoring
With a view to monitor and studyearthquakes, over 250 GPS centreswould be set up across India. Most of
these centres will be set up in theHimalayan region. Four centres willalso be set up in the state ofRajasthan. The project is funded bythe seismology division of the Min-istry of Earth Sciences.
GIS market in APAC togrow at 7.8 pc
Researchers at Technavio, a marketresearch firm, forecasted that GISmarket in APAC region will grow at aCAGR of 7.8 percent over the period2011-2015. According to the report,the public sector is one of the majorend-user segments in the GIS market in the APAC region. Manygovernment and military organisa-tions are investing heavily in GIStechnology to enhance their nationalsecurity infrastructure.
The public sector is expected toretain its dominant position in themarket for the next few years. Moreover, the industry is developingGIS technology and applications tomeet the specific requirements of the government and militaryorganisations.
ISRO may hive-offsatellite production
The Indian Space Research Organisa-tion (ISRO) might hive-off the produc-tion of communication satellites andpolar satellite launch vehicles (PSLV)to the industry. "We want to explorethe possibility of 'producing' PSLVand communication satellitesthrough the industry," K Radhakrish-nan, Chairman of ISRO said. If satel-lites and launch vehicles can be pro-duced by industry players, ISRO sci-entists will be able to concentrate onresearch-oriented activities.
UAE
GST introduces LynxMobile MapperGlobal Scan Technologies (GST), theauthorised supplier/reseller forOptech (Canada) products in the UAE,partnered with Al Ain Municipality, fora project which involves updatingbasemap of the entire emirates of Al
Geospatial World I August 2012
Invitation tocooperate onGLONASS
Russia offered to jointly upgradeits GLONASS satellite navigationsystem with India. Deputy PrimeMinister Dmitry Rogozin said,"We have offered our Indiancounterparts not only the use ofthe GLONASS system but also
participation in upgrading it. Wepractically see it as a joint effort. Ithink our Indian counterparts willbe interested in it." Russia andIndia have been cooperating onthe use of GLONASS for morethan four years, but Russia hasnot previously offered equal jointparticipation in upgrading thesystem.
9
Imag
e co
urte
sy: N
RS
C
Ain and Abu Dhabi. As part of theproject, GST has sold the innovativeLynx Mobile Mapper to the munici-pality. The mobile mapper can beeasily fixed on top of a car and usedto collect various features on theroad as the vehicle drives through athigh speed. The data collected withthe help of this device will be used toupdate the basemap. This is the firsttime ever that the system is beingimplemented anywhere in the UAE.
DT establishes networkRTK system
Dutco Tennant LLC (DT), LeicaGeosystems distributor in the UAE,established a Network RTK (Real-time Kinematic) system for the entireemirate of Ras Al Khaimah. The proj-ect would be executed in five phases.The first phase of the project is cur-rently underway and is expected to becompleted in the next three to four
months. The project will make Ras AlKhaimah the sixth emirate in the UAEto implement the Leica ReferenceStation Network.
CHINA
China to invest ingeodetic networkChina will invest CNY 517 million(USD 81.24 million) to build a modernnational network to monitor move-ments in earth's crust. The nationalgeodetic network aims to build 360GPS reference stations, and a satel-lite-geodesy control network consist-ing of 4,500 control points. Li Weisen,Deputy Director, National Adminis-tration of Surveying, Mapping andGeoinformation said the network willensure people can get timely geodet-ic information.
KAZAKHSTAN
Augmented navigationsystem soonKazakhstan's National Space Agencyis developing GPS/Glonass augmented
navigation satellite system. "We willbe able to accurately determine thelocation of cars, planes and trains. Weintend to launch the first 60 differen-tial stations by late 2013 - early 2014,"Talgat Mussabayev, Chairman ofKazakhstan's National Space Agencysaid. The differential regional stationswill be able to issue correcting andcontrolling data on locations for satel-lite navigation receivers using GPSsignals, as well as Glonass signals.
MALAYSIA
Soil mapping tool tohelp farmersUniversiti Putra Malaysia (UPM)developed ‘Soil Properties MappingSystem (SOILPROP)’ which enableslocal farmers to manage their paddyfields in terms of optimising fertiliserinput and rice yield. “What is uniqueabout this system is that it is the onlyknown variable rate technology avail-able for paddy farmers here inMalaysia,” said Ir Dr Mohd AminMohd Soom, professor of soil andwater engineering at UPM’s Depart-ment of Biological and AgriculturalEngineering.
Geospatial World I August 2012
AFGHANISTAN
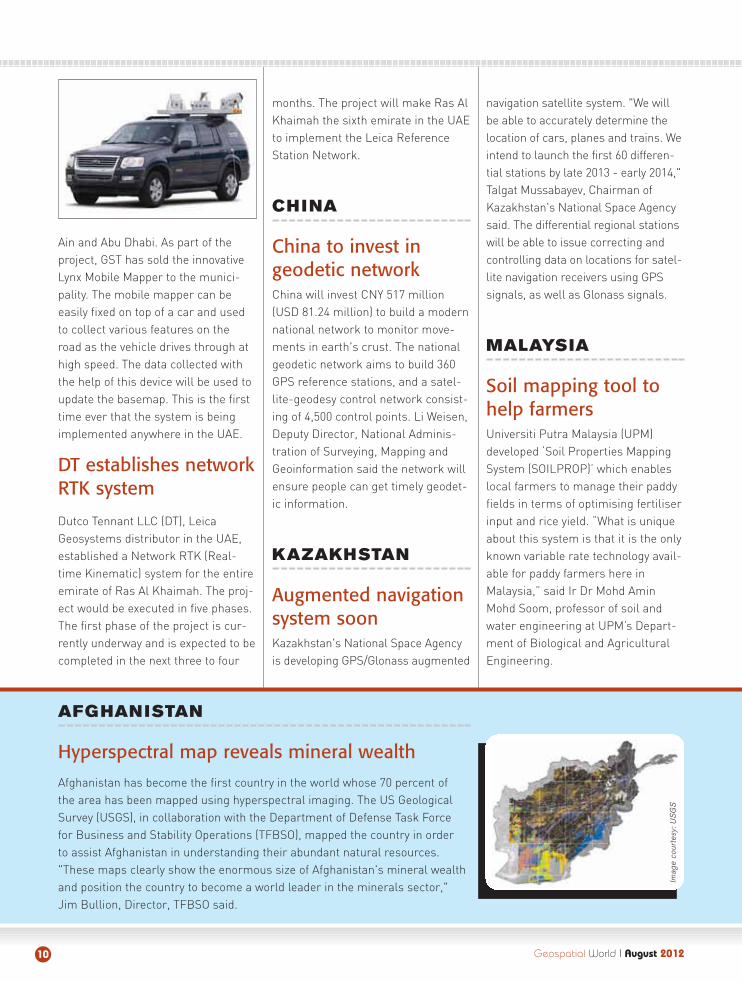
Hyperspectral map reveals mineral wealth
Afghanistan has become the first country in the world whose 70 percent ofthe area has been mapped using hyperspectral imaging. The US GeologicalSurvey (USGS), in collaboration with the Department of Defense Task Forcefor Business and Stability Operations (TFBSO), mapped the country in orderto assist Afghanistan in understanding their abundant natural resources."These maps clearly show the enormous size of Afghanistan's mineral wealthand position the country to become a world leader in the minerals sector,"Jim Bullion, Director, TFBSO said.
10
Imag
e co
urte
sy: U
SG
S
GIS
www.UltraCamEagle.com
APAC Sales:
Singapore:
Beijing:
Xiang Yu,
Peace Map Co., Ltd.
Visit iFlyUltraCam.com
to see the PMC video.
Or scan tag and watch on
your mobile phone.
Download the free tag reader app at http://gettag.mobi.
UK
UN launches digitalhumanitarian networkUnited Nations, in collaboration withMapAction, CrisisMappers and GIS-Corps, launched 'Digital Humanitari-an Network'. The network is aimed atproviding better access to priorityinformation for aid agencies. JonnyDouch of MapAction said, "We arehoping this new system will help tounlock the potential of technologyexpertise worldwide to contribute topositive humanitarian outcomes indisasters. Our team will play a vitalrole in the network by being a bridgebetween the innovative communitiesin the 'cloud and crowd', and theemergency responders on the frontline."
Google brings indoormapping to UK
Google launched its indoor mappingservice in the UK, after launching it inthe US last November. The service is
available on android smartphones.More than 40 venues in the UK cur-rently have their floor plans available,ranging from places like the BritishMuseum and National Theatre to theO2 Arena and Paddington Station.
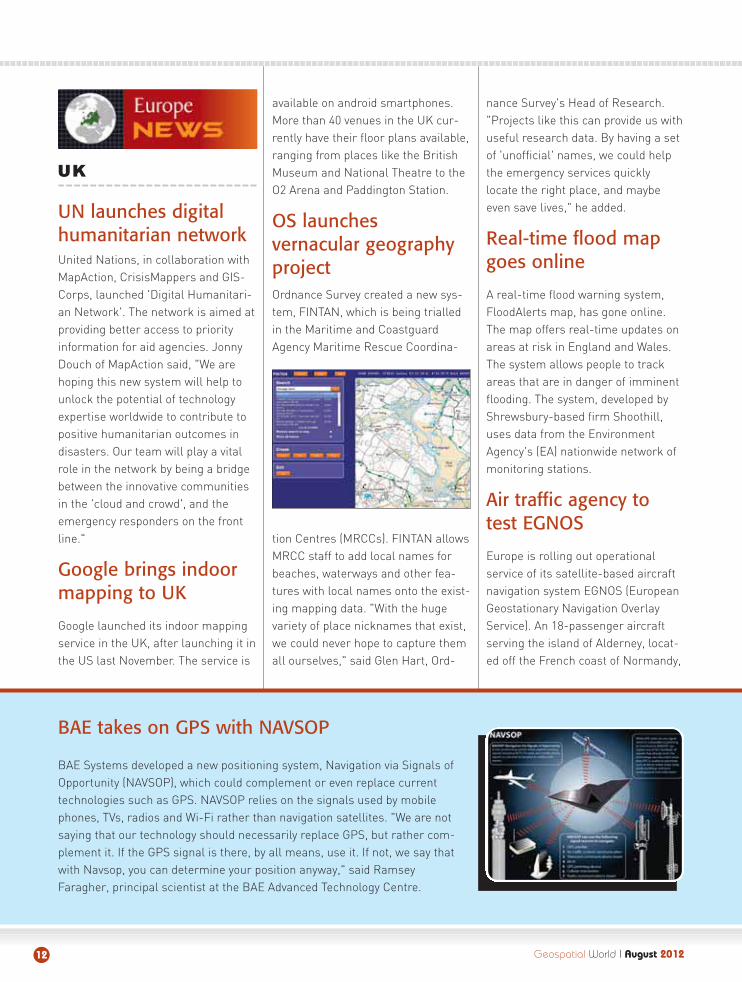
OS launchesvernacular geographyprojectOrdnance Survey created a new sys-tem, FINTAN, which is being trialledin the Maritime and CoastguardAgency Maritime Rescue Coordina-
tion Centres (MRCCs). FINTAN allowsMRCC staff to add local names forbeaches, waterways and other fea-tures with local names onto the exist-ing mapping data. "With the hugevariety of place nicknames that exist,we could never hope to capture themall ourselves," said Glen Hart, Ord-
nance Survey's Head of Research."Projects like this can provide us withuseful research data. By having a setof 'unofficial' names, we could helpthe emergency services quicklylocate the right place, and maybeeven save lives," he added.
Real-time flood mapgoes online
A real-time flood warning system,FloodAlerts map, has gone online.The map offers real-time updates onareas at risk in England and Wales.The system allows people to trackareas that are in danger of imminentflooding. The system, developed byShrewsbury-based firm Shoothill,uses data from the EnvironmentAgency's (EA) nationwide network ofmonitoring stations.
Air traffic agency totest EGNOS
Europe is rolling out operationalservice of its satellite-based aircraftnavigation system EGNOS (EuropeanGeostationary Navigation OverlayService). An 18-passenger aircraftserving the island of Alderney, locat-ed off the French coast of Normandy,
BAE takes on GPS with NAVSOP
BAE Systems developed a new positioning system, Navigation via Signals ofOpportunity (NAVSOP), which could complement or even replace currenttechnologies such as GPS. NAVSOP relies on the signals used by mobilephones, TVs, radios and Wi-Fi rather than navigation satellites. "We are notsaying that our technology should necessarily replace GPS, but rather com-plement it. If the GPS signal is there, by all means, use it. If not, we say thatwith Navsop, you can determine your position anyway," said RamseyFaragher, principal scientist at the BAE Advanced Technology Centre.
Geospatial World I August 201212
will be the first to use EGNOS. "We'renow at the point where we're begin-ning to land aircraft from spacethrough satellite navigation," saidKen Ashton, head of navigation archi-tecture at NATS. "This is the first cer-tified operation in Europe for satellitenavigation approaches to land," Ash-ton added.
Smartphones topredict future location
UK researchers developed an algo-rithm that can predict a person'sfuture geographic location using datagathered from their friends' smart-phones. In a study, the algorithmpredicted the location of some users24 hours later to be within 100metres, others as close as 20 metres.The algorithm predicted users move-ments by comparing their data withpeople in their social group.
ESA to expand GlobeNet
The European Space Agency (ESA) isconsidering launching a third data-relay satellite to expand data-relayservice GlobeNet. GlobeNet wouldprovide a third platform in geosta-
tionary orbit to speed the flow of datafrom unmanned aerial vehicles andearth observation satellites to users.ESA is looking for an industrial part-ner for the satellite launch. Thesatellite would likely be owned byAstrium Services of Europe.
ROMANIA
Street nomenclature tobe standardisedThe National Agency for Cadastreand Land Registration (ANCPI), incollaboration with the Association ofCommunas of Romania (ACoR) andNational Association of PublicAdministration Information Systems(ANIAP), launched the National Elec-tronic Register of Streets Nomencla-ture (RENNS) project in Romania.The project aims to standardise andmake available the allocation ofstreet names and administrativenumbers to simplify administrationactivities and reduce costs.
Satellite positioning forrailways launched
The EU-funded Satloc project
demonstrated satellite-based traincontrol for low-traffic railways on theBrasov-Zarnesti line in Romania. TheSatloc project is aimed at developinga reliable and competitive satellite-based rail transport operation andmanagement system. "We will showthat GNSS-based train positioningand speed determination usingEGNOS is compliant with currentapplications for train control andtraffic management," project coordi-nator George Barbu said.
BELGIUM
EC opens tender forGIO-EMS serviceThe European Commission (EC)opened tenders for a framework contract on GMES Initial Operations:Emergency Mapping Validation
14 Geospatial World I August 2012
GERMANY
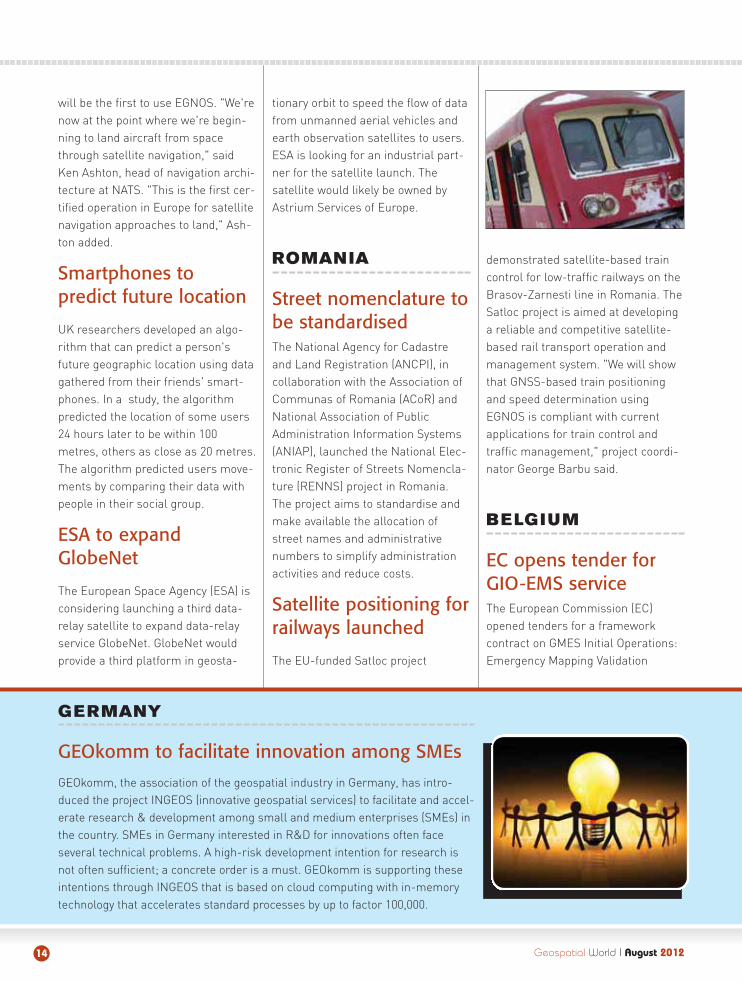
GEOkomm to facilitate innovation among SMEs
GEOkomm, the association of the geospatial industry in Germany, has intro-duced the project INGEOS (innovative geospatial services) to facilitate and accel-erate research & development among small and medium enterprises (SMEs) inthe country. SMEs in Germany interested in R&D for innovations often face several technical problems. A high-risk development intention for research isnot often sufficient; a concrete order is a must. GEOkomm is supporting theseintentions through INGEOS that is based on cloud computing with in-memorytechnology that accelerates standard processes by up to factor 100,000.
Service (GIO-EMS). The core charac-ter of the GIO-EMS service lies in theprovision of timely and accurateinformation derived from satelliteimaging sensor data in all phases ofthe emergency management cycle.The information generated by theservice can be used as supplied bythe contractor (e.g. as digital orprinted map outputs) or further com-bined with other data sources (e.g. asdigital feature sets in a GIS) to sup-port analysis and decision-makingprocesses of emergency managers.
SPAIN
EuroGEOSS integratesenvironmental dataEuroGEOSS (European EnvironmentEarth Observation System) developeda tool which integrates all informa-tion on forestry, drought and biodi-versity produced by different Euro-pean systems of earth observation.Explaining the relevance of this inter-operability, Professor of ComputerLanguages and Systems at the Uni-versitat Jaume I de Castellón (Spain)Joaquín Huerta Guijarro said, "If weintegrate systems related to weather,soil quality and water, we may devel-op an efficient agriculture or refor-estation project. The tool aims tooffer relevant multi-disciplinary datathat will improve environmental mon-itoring."
ITALY
Military buys spysatellite from IsraelThe Italian Defense Ministry bought a
high-resolution optical reconnais-sance satellite from Israel for USD100 million. The satellite purchasedby Italy has a ground sampling dis-tance sharper than 1 metre. Its per-formance could approach that ofIsrael's Ofeq 9 optical reconnais-sance satellite, which was launchedin 2009. The satellite would use theIMPS 2 platform built by Israel Aero-space Industries, Israel's principalsatellite builder.
CGS to design earthobservation satellite
CGS SpA Compagnia Generale per loSpazio, satellite manufacturer, andthe Italian Space Agency (ASI) signeda contract to design an Italian-builthigh-resolution optical earth obser-vation (EO) satellite that the Italiangovernment would operate for mili-tary and civil applications. CGS willperform an 18-month Phase Bdesign of Italy’s OpSis system undercontract with the ASI valued at EUR13.5 million (USD 17 million).
FRANCE
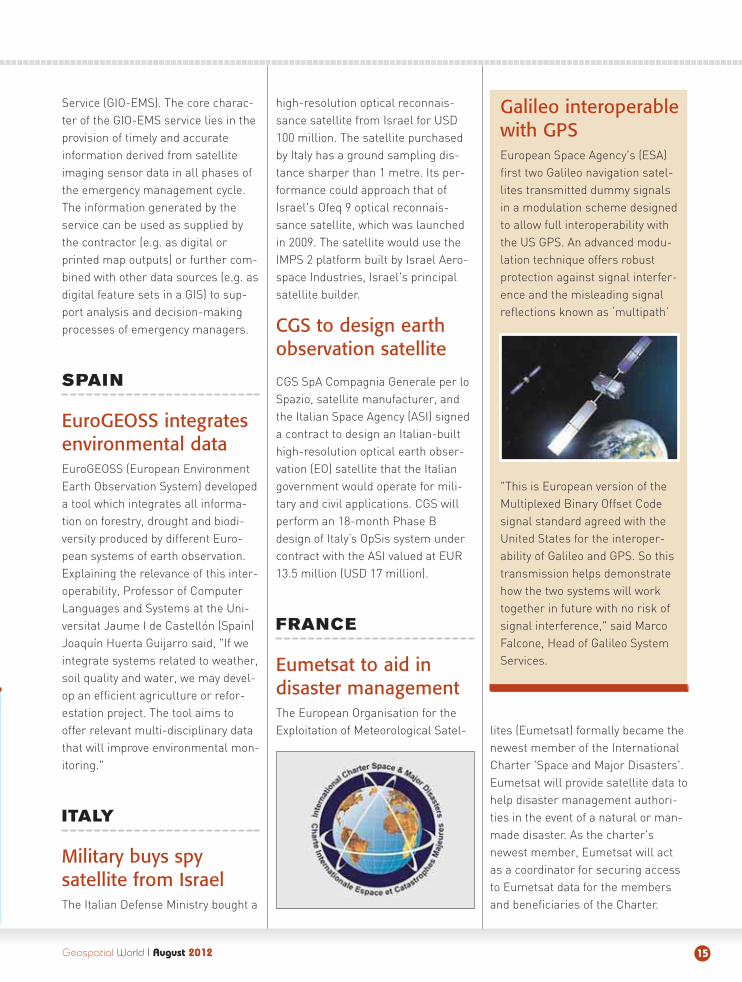
Eumetsat to aid indisaster managementThe European Organisation for theExploitation of Meteorological Satel- lites (Eumetsat) formally became the
newest member of the InternationalCharter 'Space and Major Disasters'.Eumetsat will provide satellite data tohelp disaster management authori-ties in the event of a natural or man-made disaster. As the charter'snewest member, Eumetsat will actas a coordinator for securing accessto Eumetsat data for the membersand beneficiaries of the Charter.
Geospatial World I August 2012 15
Galileo interoperablewith GPSEuropean Space Agency's (ESA)first two Galileo navigation satel-lites transmitted dummy signalsin a modulation scheme designedto allow full interoperability withthe US GPS. An advanced modu-lation technique offers robustprotection against signal interfer-ence and the misleading signalreflections known as ‘multipath’
"This is European version of theMultiplexed Binary Offset Codesignal standard agreed with theUnited States for the interoper-ability of Galileo and GPS. So thistransmission helps demonstratehow the two systems will worktogether in future with no risk ofsignal interference," said MarcoFalcone, Head of Galileo SystemServices.
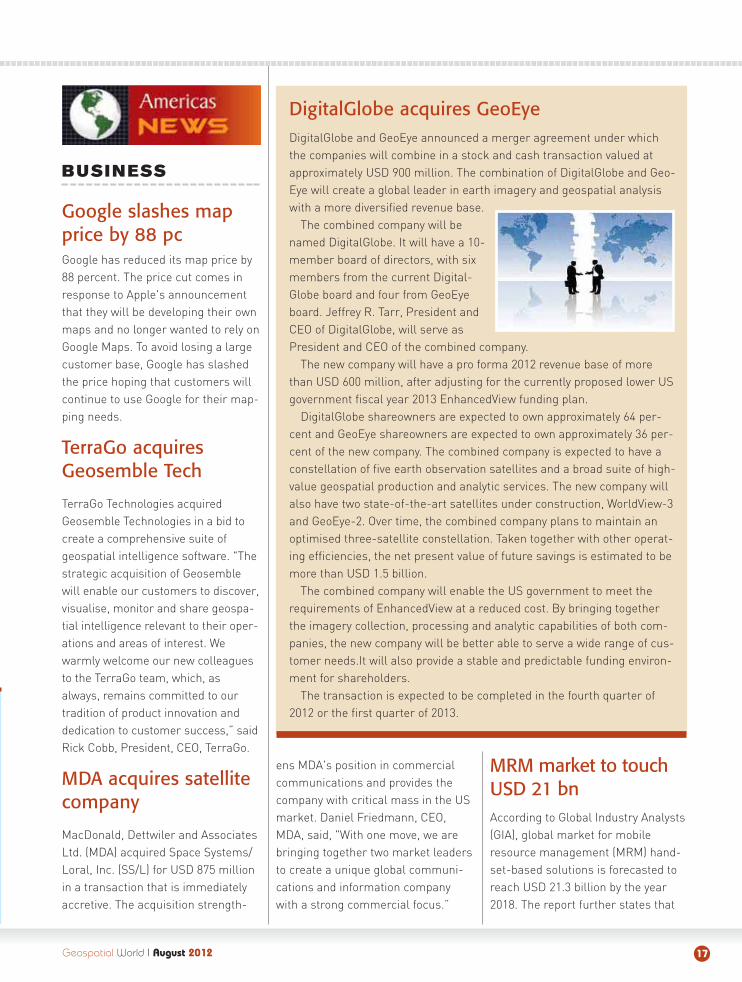
Australia to get access to Landsat 8 data Geoscience Australia signed an MoU with the United States GeologicalSurvey (USGS), that makes Australia a partner in the operation of the newLandsat 8 satellite. "When launched, the satellite will provide Australiawith immediate and direct access to the highest quality satellite data,replacing its current reliance on the ageing Landsat 5 and 7 satellites,"Martin Ferguson, Minister for Resources and Energy said. The agreementwill further ensure that Australia receives priority of satellite image delivery in times of national need such as assisting in emergency management.
Geospatial World I August 201216
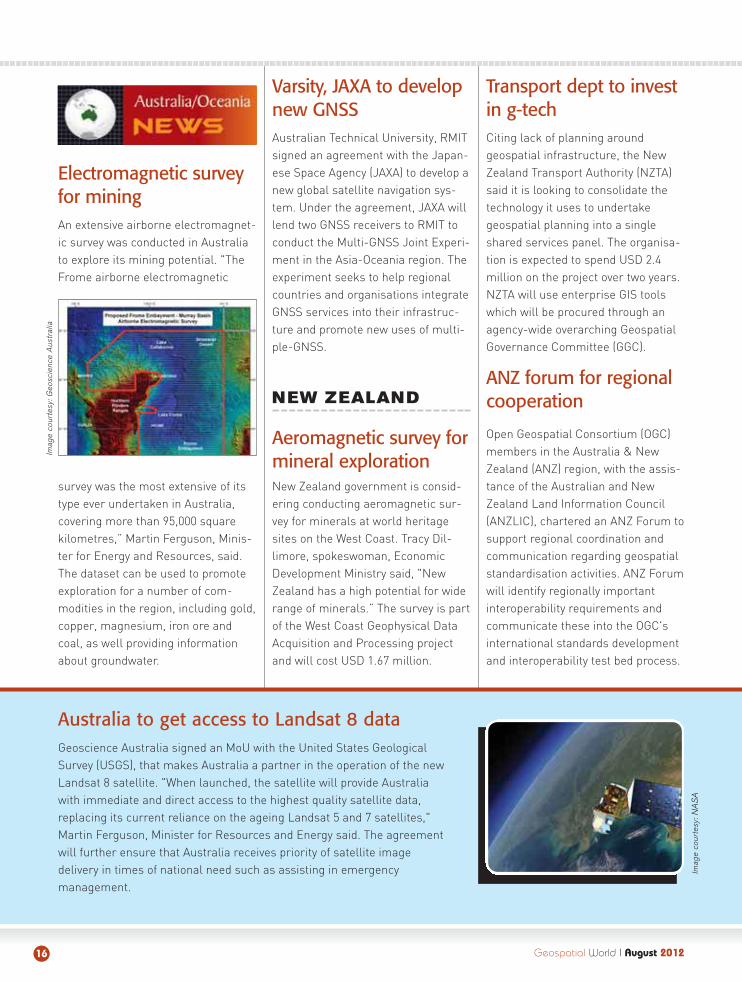
Electromagnetic surveyfor mining An extensive airborne electromagnet-ic survey was conducted in Australiato explore its mining potential. "TheFrome airborne electromagnetic
survey was the most extensive of itstype ever undertaken in Australia,covering more than 95,000 squarekilometres,” Martin Ferguson, Minis-ter for Energy and Resources, said.The dataset can be used to promoteexploration for a number of com-modities in the region, including gold,copper, magnesium, iron ore andcoal, as well providing informationabout groundwater.
Varsity, JAXA to developnew GNSS Australian Technical University, RMITsigned an agreement with the Japan-ese Space Agency (JAXA) to develop anew global satellite navigation sys-tem. Under the agreement, JAXA willlend two GNSS receivers to RMIT toconduct the Multi-GNSS Joint Experi-ment in the Asia-Oceania region. Theexperiment seeks to help regionalcountries and organisations integrateGNSS services into their infrastruc-ture and promote new uses of multi-ple-GNSS.
NEW ZEALAND
Aeromagnetic survey formineral explorationNew Zealand government is consid-ering conducting aeromagnetic sur-vey for minerals at world heritagesites on the West Coast. Tracy Dil-limore, spokeswoman, EconomicDevelopment Ministry said, "NewZealand has a high potential for widerange of minerals.” The survey is partof the West Coast Geophysical DataAcquisition and Processing projectand will cost USD 1.67 million.
Transport dept to investin g-tech Citing lack of planning aroundgeospatial infrastructure, the NewZealand Transport Authority (NZTA)said it is looking to consolidate thetechnology it uses to undertakegeospatial planning into a singleshared services panel. The organisa-tion is expected to spend USD 2.4million on the project over two years.NZTA will use enterprise GIS toolswhich will be procured through anagency-wide overarching GeospatialGovernance Committee (GGC).
ANZ forum for regionalcooperation
Open Geospatial Consortium (OGC)members in the Australia & NewZealand (ANZ) region, with the assis-tance of the Australian and NewZealand Land Information Council(ANZLIC), chartered an ANZ Forum tosupport regional coordination andcommunication regarding geospatialstandardisation activities. ANZ Forumwill identify regionally importantinteroperability requirements andcommunicate these into the OGC'sinternational standards developmentand interoperability test bed process.
Imag
e co
urte
sy: N
AS
A
Imag
e co
urte
sy: G
eosc
ienc
e A
ustr
alia
BUSINESS
Google slashes mapprice by 88 pc Google has reduced its map price by88 percent. The price cut comes inresponse to Apple's announcementthat they will be developing their ownmaps and no longer wanted to rely onGoogle Maps. To avoid losing a largecustomer base, Google has slashedthe price hoping that customers willcontinue to use Google for their map-ping needs.
TerraGo acquiresGeosemble Tech
TerraGo Technologies acquiredGeosemble Technologies in a bid tocreate a comprehensive suite ofgeospatial intelligence software. "Thestrategic acquisition of Geosemblewill enable our customers to discover,visualise, monitor and share geospa-tial intelligence relevant to their oper-ations and areas of interest. Wewarmly welcome our new colleaguesto the TerraGo team, which, asalways, remains committed to ourtradition of product innovation anddedication to customer success,” saidRick Cobb, President, CEO, TerraGo.
MDA acquires satellitecompany
MacDonald, Dettwiler and AssociatesLtd. (MDA) acquired Space Systems/Loral, Inc. (SS/L) for USD 875 millionin a transaction that is immediatelyaccretive. The acquisition strength-
ens MDA's position in commercialcommunications and provides thecompany with critical mass in the USmarket. Daniel Friedmann, CEO,MDA, said, "With one move, we arebringing together two market leadersto create a unique global communi-cations and information companywith a strong commercial focus.”
MRM market to touchUSD 21 bnAccording to Global Industry Analysts(GIA), global market for mobileresource management (MRM) hand-set-based solutions is forecasted toreach USD 21.3 billion by the year2018. The report further states that
DigitalGlobe acquires GeoEyeDigitalGlobe and GeoEye announced a merger agreement under whichthe companies will combine in a stock and cash transaction valued atapproximately USD 900 million. The combination of DigitalGlobe and Geo-Eye will create a global leader in earth imagery and geospatial analysiswith a more diversified revenue base.
The combined company will benamed DigitalGlobe. It will have a 10-member board of directors, with sixmembers from the current Digital-Globe board and four from GeoEyeboard. Jeffrey R. Tarr, President andCEO of DigitalGlobe, will serve asPresident and CEO of the combined company.
The new company will have a pro forma 2012 revenue base of morethan USD 600 million, after adjusting for the currently proposed lower USgovernment fiscal year 2013 EnhancedView funding plan.
DigitalGlobe shareowners are expected to own approximately 64 per-cent and GeoEye shareowners are expected to own approximately 36 per-cent of the new company. The combined company is expected to have aconstellation of five earth observation satellites and a broad suite of high-value geospatial production and analytic services. The new company willalso have two state-of-the-art satellites under construction, WorldView-3and GeoEye-2. Over time, the combined company plans to maintain anoptimised three-satellite constellation. Taken together with other operat-ing efficiencies, the net present value of future savings is estimated to bemore than USD 1.5 billion.
The combined company will enable the US government to meet therequirements of EnhancedView at a reduced cost. By bringing togetherthe imagery collection, processing and analytic capabilities of both com-panies, the new company will be better able to serve a wide range of cus-tomer needs.It will also provide a stable and predictable funding environ-ment for shareholders.
The transaction is expected to be completed in the fourth quarter of2012 or the first quarter of 2013.
Geospatial World I August 2012 17
‘Future digital earth more local than global’
Michael Goodchild, Professor of Geography, University of California, envisioned the next-generation of digital Earth as being more "local insteadof global". "There's more of a social perspective now, and less emphasis onpermanent objects," Goodchild wrote in a paper titled, 'Next-generation Digital Earth'. Despite the move away from ultra-high precision in mapping,there continues to be an overarching need for the next generation digitalearth to be scientifically accurate and it's the scientific community's job toensure that accuracy, Goodchild observed.
the easy adaptability and affordabilityof GPS devices, as well as improvednetwork connectivity has opened upnewer verticals for the MRM industry.
‘GIS mkt in NorthAmerica to grow at 11 pc’Technavio, a market research firm,forecasted the GIS market in NorthAmerica to grow at a CAGR of 11 per-cent over the period 2011-2015. Thereport further states that one of thekey factors contributing to this mar-ket growth is the increasing need forknowledge infrastructure. The GISmarket in North America has alsobeen witnessing the increasing needfor automated content extractiontechniques. However, the high cost ofGIS solutions could pose a challengeto the growth of this market.
MISCELLANEOUS
NGS improves NationalSpatial Reference SysThe National Oceanic and Atmos-pheric Administration’s (NOAA)National Geodetic Survey (NGS)
released the results of three majorimprovements to the National SpatialReference System (NSRS). The threeimprovements to the NSRS are: newrealisation of the North AmericanDatum of 1983 (NAD 83), new gravi-metric and hybrid geoid models anddetermination of updated elevationsin the Gulf Coast Height Modernisa-tion Project. These improvementswill provide users with positions andelevations that are both spatially andtemporally consistent.
DARPA’s data analysisinnovation
The Defense Advanced ResearchProjects Agency (DARPA) launchedthe Innovation House Study pro-gramme to bring in "trailblazers" towork on new ways to improve visualand geospatial analysis. The projectis being conducted in partnershipwith George Mason University inArlington, and is an eight-weekintensive programme for "radicalinnovation." Eight teams will be givenaccess to a "residential researchenvironment" to figure out how toidentify people, places and evenactivities from both stills and videosmade available via either open source
or the Defense Department.
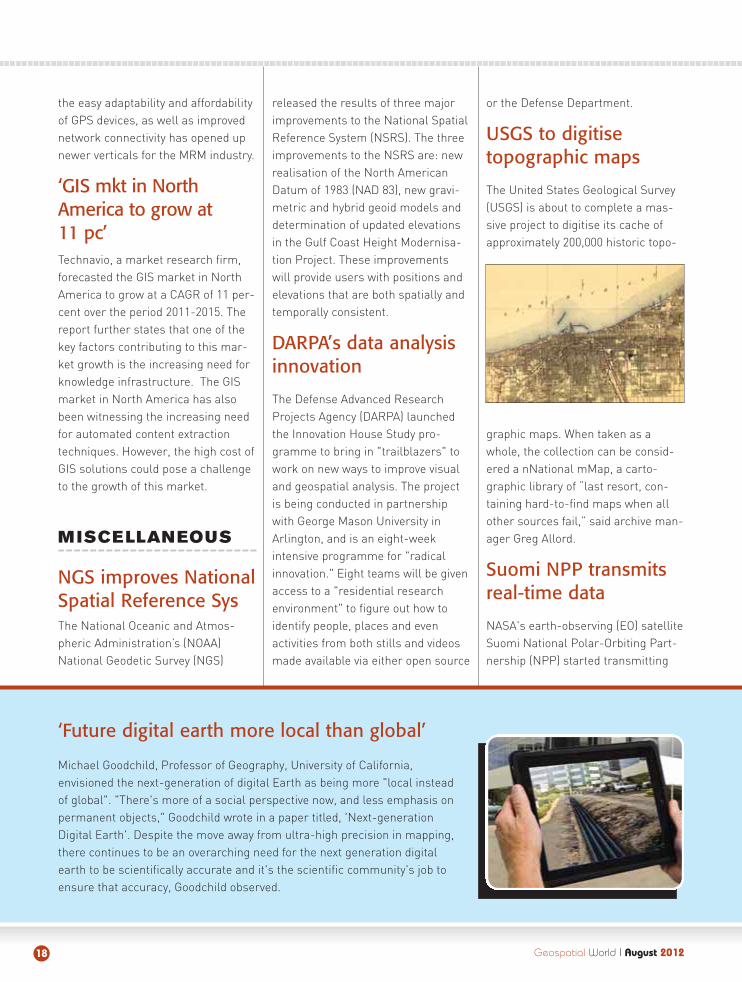
USGS to digitisetopographic maps
The United States Geological Survey(USGS) is about to complete a mas-sive project to digitise its cache ofapproximately 200,000 historic topo-
graphic maps. When taken as awhole, the collection can be consid-ered a nNational mMap, a carto-graphic library of “last resort, con-taining hard-to-find maps when allother sources fail,” said archive man-ager Greg Allord.
Suomi NPP transmitsreal-time data
NASA's earth-observing (EO) satelliteSuomi National Polar-Orbiting Part-nership (NPP) started transmitting
Geospatial World I August 201218
Geospatial World I August 2012 19
real-time data that will be used ineverything from weather forecasts todisaster response. The High RateData (HRD) link is an antenna aboardthe Suomi NPP satellite that provides'direct broadcast' data to users inreal-time. In general, a satellitestores data on-board until it passesover a ground station where it down-loads or 'dumps' the data. In SuomiNPP's case, data is dumped everytime it passes over the ground stationin Svalbard, Norway, about 14 timesevery 24 hours.
COLOMBIA
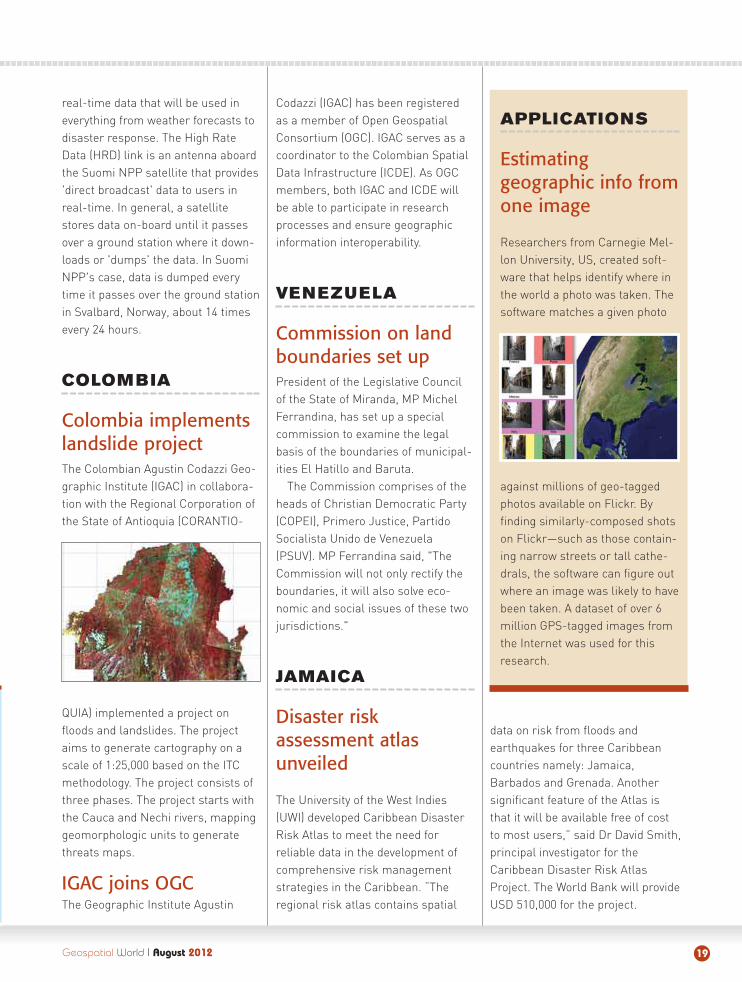
Colombia implementslandslide projectThe Colombian Agustin Codazzi Geo-graphic Institute (IGAC) in collabora-tion with the Regional Corporation ofthe State of Antioquia (CORANTIO-
QUIA) implemented a project onfloods and landslides. The projectaims to generate cartography on ascale of 1:25,000 based on the ITCmethodology. The project consists ofthree phases. The project starts withthe Cauca and Nechi rivers, mappinggeomorphologic units to generatethreats maps.
IGAC joins OGCThe Geographic Institute Agustin
Codazzi (IGAC) has been registeredas a member of Open GeospatialConsortium (OGC). IGAC serves as acoordinator to the Colombian SpatialData Infrastructure (ICDE). As OGCmembers, both IGAC and ICDE willbe able to participate in researchprocesses and ensure geographicinformation interoperability.
VENEZUELA
Commission on landboundaries set upPresident of the Legislative Councilof the State of Miranda, MP MichelFerrandina, has set up a specialcommission to examine the legalbasis of the boundaries of municipal-ities El Hatillo and Baruta.
The Commission comprises of theheads of Christian Democratic Party(COPEI), Primero Justice, PartidoSocialista Unido de Venezuela(PSUV). MP Ferrandina said, "TheCommission will not only rectify theboundaries, it will also solve eco-nomic and social issues of these twojurisdictions."
JAMAICA
Disaster riskassessment atlasunveiled
The University of the West Indies(UWI) developed Caribbean DisasterRisk Atlas to meet the need for reliable data in the development ofcomprehensive risk managementstrategies in the Caribbean. “Theregional risk atlas contains spatial
data on risk from floods and earthquakes for three Caribbeancountries namely: Jamaica, Barbados and Grenada. Another significant feature of the Atlas is that it will be available free of cost to most users,” said Dr David Smith,principal investigator for theCaribbean Disaster Risk Atlas Project. The World Bank will provideUSD 510,000 for the project.
APPLICATIONS
Estimatinggeographic info fromone image
Researchers from Carnegie Mel-lon University, US, created soft-ware that helps identify where inthe world a photo was taken. Thesoftware matches a given photo
against millions of geo-taggedphotos available on Flickr. Byfinding similarly-composed shotson Flickr—such as those contain-ing narrow streets or tall cathe-drals, the software can figure outwhere an image was likely to havebeen taken. A dataset of over 6million GPS-tagged images fromthe Internet was used for thisresearch.
Geospatial World I August 201220
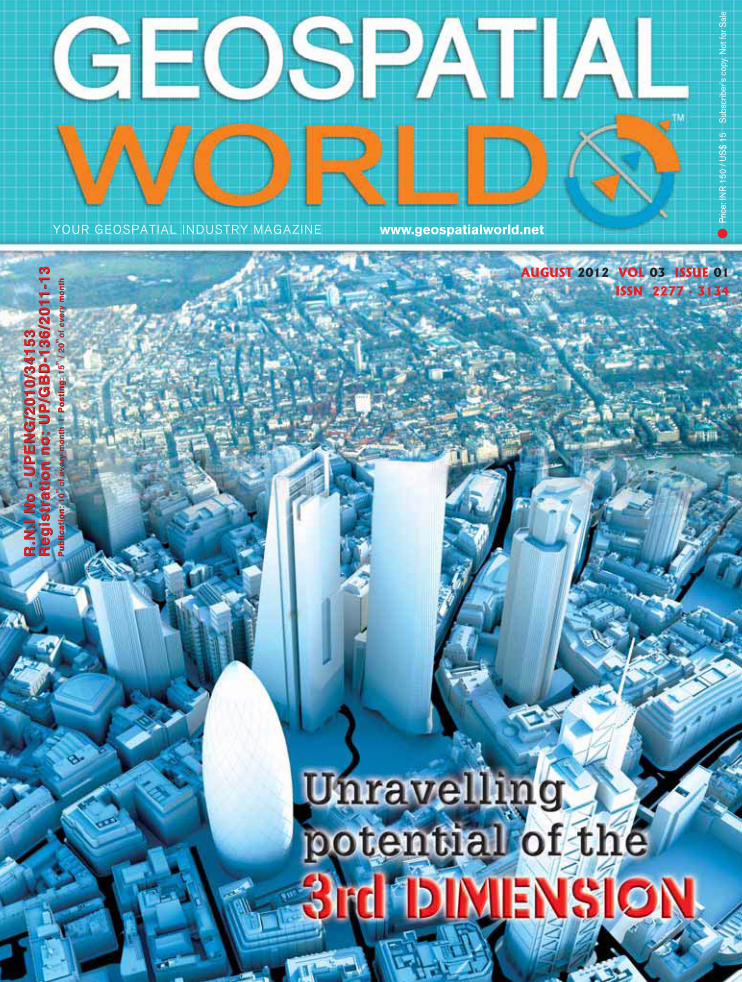
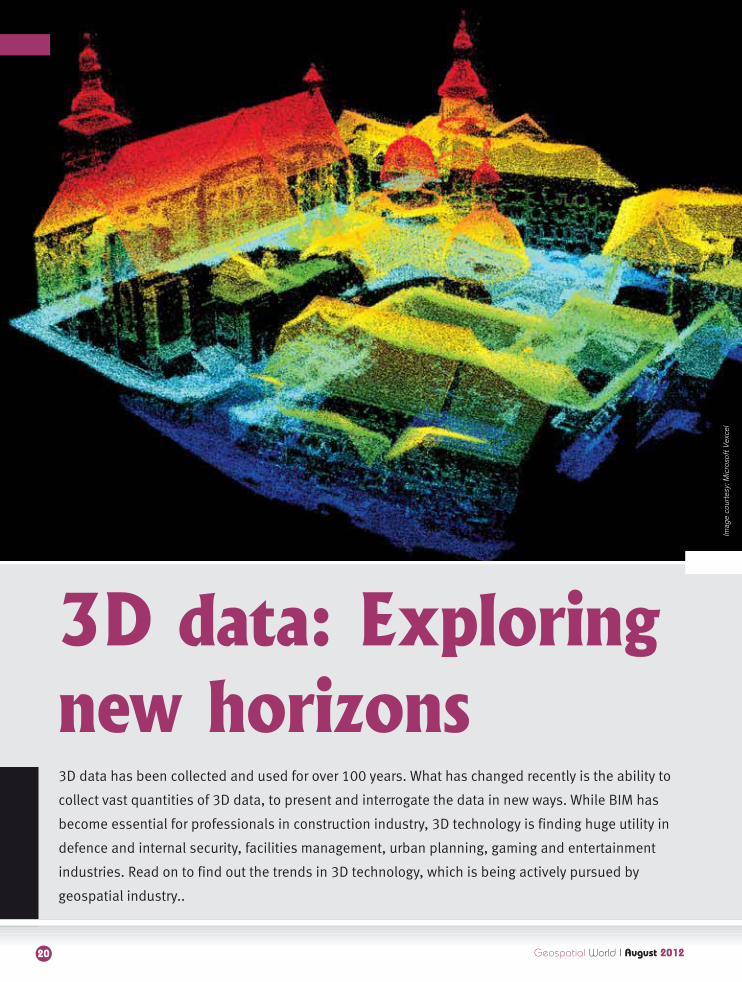
3D data has been collected and used for over 100 years. What has changed recently is the ability to
collect vast quantities of 3D data, to present and interrogate the data in new ways. While BIM has
become essential for professionals in construction industry, 3D technology is finding huge utility in
defence and internal security, facilities management, urban planning, gaming and entertainment
industries. Read on to find out the trends in 3D technology, which is being actively pursued by
geospatial industry..
Imag
e co
urte
sy: M
icro
soft
Vex
cel
3D data: Exploring
new horizons
Geospatial information is three dimensional. How-ever, it is often presented in 2D, 3D or even 4D.Instrumentation and software to collect 3D data
have changed significantly over the past 10 years. Laserscanning from the air and the ground is the biggestdevelopment, but the development of digital cameras andthe software to carry out stereo matching has allowed theuse of images to compete with laser scanning. Laserscanning and imagery is combined in mobile mappingsystems. In addition, the collection of 3D data for data-base updating, often covering small areas, has beengreatly enhanced by the use of GNSS, allowing accurate,rapid collection of data on tablets. Today, 3D informationcan be visualised dynamically on large computer screens,but users also want information on their tablets andphones, which is not easy.
The introduction of building information models (BIM)in the construction industry is certainly a growing profes-sional application. 3D visualisations have found an impor-tant niche in navigation, where the emphasis is on thedata being up-to-date rather than being accurate at cen-timetre scale. A more professional application is mappingof public facilities for inventory and facility management.Today, the use of 3D data is not confined to large scaleapplications. There is a growing interest in 'digital globes'showing information on both natural and man-made fea-tures worldwide. In this case, visualisation is oftendynamic and the question of scalability becomes impor-tant. Let us explore the trends and look at the direction inwhich the collection and use of 3D data is moving.
DATA ACQUISITION
Geospatial data has been collected for centuries, initiallyonly in two dimensions. But since the 18th century, prin-cipally starting in France and India, elevation data hasbeen collected and shown in various ways. Elevation hasbeen shown as contours, giving an accurate model ofrelief and through various forms of texturing. The data forthese 2D maps has been collected by traditional surveymethods: plane tables, tacheometry and later from aerialsurvey. With the advent of computers, the concept of adigital elevation model (DEM) has been introduced. Thisallowed computation for earthworks, for example, to bedone and even basic visualisation. By the 1960s, DEMshas become commonplace and excellent visualisationswere available. The main source of elevation data was
then aerial survey, contours were initially drawn manual-ly, or spot heights measured manually, but the develop-ment of stereo matching software in the 1980s allowedthis to be done automatically. At first, the DEMs generat-ed had errors and gaps but now they are much more reli-able, though manual editing is still required. Imagescome from aerial cameras and satellite sensors. Thereare several global DEMs available as shown in Table 1:
In the past decade, laser scanning has become an
alternative technique of collecting 3D data, both from theair and ground. Images can be taken with the laser datafrom the air to generate photorealistic orthoimages andmobile mapping systems from the ground combineimages with laser scanning. Laser data and DEMs gener-ated from images can be collected separately and com-bined.
Fully automated generation of very dense 3D pointclouds and digital surface models (DSM) from stereo aer-ial images (nadir and oblique) is rapidly gaining ground.The most efficient method is to use Semi Global Matching(SGM) algorithms. There are a number of software pack-ages which produce accurate point clouds for 3D analysisas well as textured DMSs from imagery collected in flightmissions by aeroplanes, helicopters, UAVs, satelliteimagery or terrestrial photography collected by mobilemapping vehicles (Table 2).
A new development in mobile mapping systems isTrimble's Indoor Mobile Mapping System (TIMMS). It is amanually operated push-cart designed to accuratelymodel interior spaces without accessing GPS. It consistsof three core elements: LiDAR and camera systems engi-neered to work indoors in mobile mode, computers andelectronics for completing data acquisition and data pro-cessing workflow for producing final 2D/3D maps and
Geospatial World I August 2012 21
Cover StorCover Stor yy
Table 1: Global DEMs available
DEM Spacing Vertical Accuracy Source
ETOPO30 30" 25m Mainly DTED
SRTM 30/90m 10-15m Interferometric SAR
AstriumSPOT HRS 1" 7mSPOT HRS Stereoimagery
ASTER GDEM 30m 7-14mASTER stereoimagery
AstriumTanDEM-X 2m (relative) / 10m(absolute)
12m x 12m raster Interferometric SAR
NEXTMap World30 30m Best accuracy 5mASTER, SRTM,GTOPO
Imag
e co
urte
sy: M
icro
soft
Vex
cel
Geospatial World I August 201222
models. The models are geolocated, meaning that thereal-world position of each area is known. Refer to April2012 edition of Geospatial World for a more detailedexplanation of mobile mapping systems and airborneLiDAR.
PRESENTATION OF 3D DATA
Three dimensional solid models date back to the 18thcentury and what is claimed to be the oldest large scale
mountain relief in the world, created between 1762 and1786 by F. L. Pfyffer von Wyher can be seen, along withother examples in the exhibition room of the LucerneGlacier Garden. These models were expensive and onlyused for special purposes and were essentially for displaypurposes rather than to provide accurate dimensions. Raw data can be processed by a user with a range oftools. These are improving today but for a long while,there were limitations to the processing possible withlaser scanned data. The presentation of 3D data used tobe constrained by the media available. Until the 1970s,the medium was paper. The advent of the electronic com-puter allowed 3D displays of the data; the big break-through was the concept of the DTM or DEM, at MIT inCambridge, Massachusetts in 1956. Originally developedfor the terrain, the DEM has now progressed for the rep-resentation of anything from surfaces of oil paintings tothe surface of the earth and other planets. Not only hasthe range of scale expanded, but so has the detail shown.
3D visualisations are now widely available for displayon a wide range of devices. These range from 3D streetviews, such as those available from Google and Bing, toview on phones, tablets or large computer screensthrough to massive scientific models such as used by theJapanese supercomputer centre for environmental modelling.
For simulations to present an accurate picture of thereal world, the accuracy of the geodata used is extremelyimportant. Besides, it should be based on the latest avail-able imagery. 3D city and terrain models form the basisof simulations across a plethora of applications andindustries.
There are a range of 3D city models available
Table 2: Methods of collecting 3D data with user examples.
Equipment Method Examples Comment
GroundSurvey, GNSS
Accurate survey byNMAs to update nation-al data bases
OrdnanceSurvey, GB
Efficient and accurate
Aerial Survey Stereo imagery usingrobust matching algorithms to generatedense 3D models
Traditionalmethod used by many organisations
Well establishedbut needs manualediting; good forrural areas
Satelliteimagery
Stereo imagery andinterferometric radar
SRTM, TerraSAR(radar), Stereosatellites likeCARTOSAT andSPOT HRS
Extremely efficientfor global models
Airborne laserscanning
Dense point cloud fromrange and azimuth measurement from theaircraft
Now availablefrom many companies
Very accurate,dense point clouds,butrelatively expensive
Terrestriallaser scanning
Dense point cloud fromrange and azimuth measurement from theground
Now availablefrom many companies
Very accurate,dense point clouds,ideal for BIM
Mobile map-ping systems
Combination of theabove two.
A range of sys-tems developedfor particularapplications.
Popular for facilitymanagement andstreet mapping
VGI Multiple images collected on consumercameras to generate 3Dmodels using softwaresuch as Photosynth.
See http://photosynth.net/
Mainly used by specialists
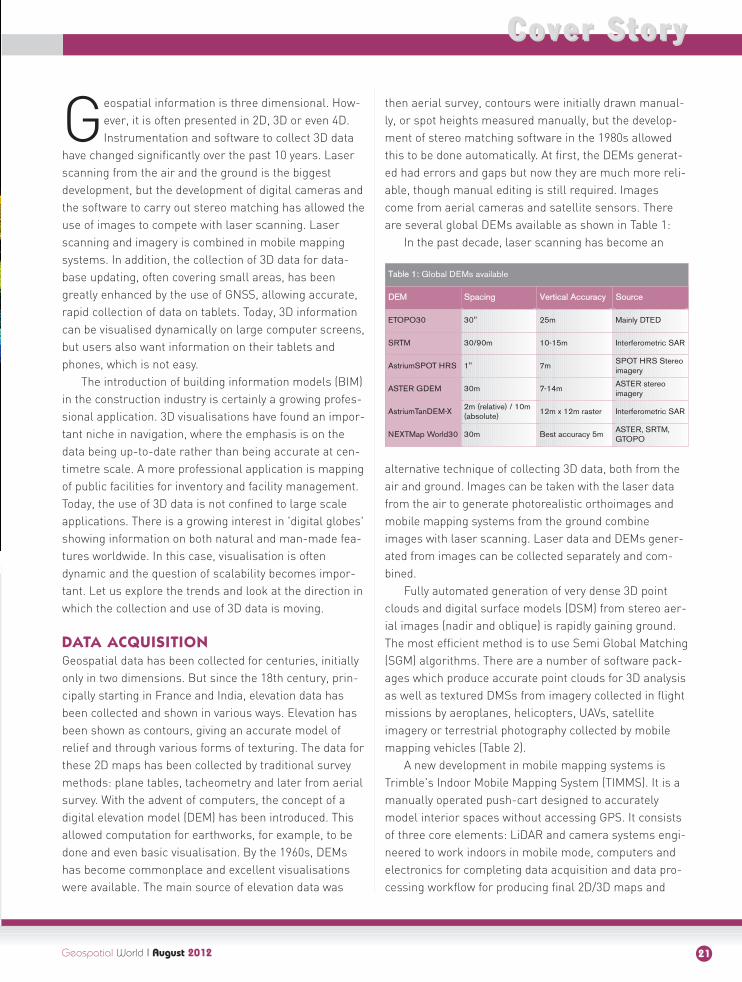
1 m DEM of Sahara Desert extractedfrom Stereo IKONOS satellite image
data at 0.8 m resolution
Imag
e co
urte
sy: S
pace
Imag
ing
Geospatial World I August 2012 23
today. ComputaMaps, France, has recently introduced itsDxM digital elevation product line, which covers over 275metropolitan areas worldwide. DEMs serve as the baselayer for mapping across a broad range of applicationssuch as urban planning, environmental monitoring,defence and security. LandSIM3D allows the creation of3D virtual models of entire cities and landscapes by com-bining geospatial data with 3D or CAD objects in a real-time 3D georeferenced environment. This allowsimproved decision making related to planning, manage-ment and development of sites and territories.
Esri's CityEngine is a standalone software that offersprofessional users in urban planning, architecture, GIS,entertainment and general 3D content production with aconceptual design and modelling solution for creating 3Dcities, buildings and streetscapes.
Bentley Map V8i offers the capability to visualisesmart 3D models; create thematic maps; capture smart3D features of buildings, roads and other infrastructure;integrate 3D data from different sources; and thus createrealistic renderings and animations.
CityGML is a common information model for the rep-resentation, storage and exchange of 3D urban objectsand landscape models. It is an OGC standard for present-ing real-world features in 3D with different levels of detail.It offers a mechanism for describing 3D objects withrespect to their geometry, topology, semantics andappearance. This makes it possible to employ virtual 3D
city models for sophisticated analysis tasks in differentapplication domains like simulations, urban data mining,facility management and thematic inquiries.
PLETHORA OF APPLICATIONS
3D digital data is being used in building information mod-elling (BIM). BIM is an innovative approach to the design-ing and documentation of building projects. BIM offersthe ability to model and manage not just graphics, butalso information, which in turn allows the automatic gen-eration of drawings and reports, design analysis, sched-ule simulation and facilities management. All this gives
Table 3: Examples of online 3D visualisation tools
Visualisation Tool Capabilities, comments
Google Earth Good in terms of ease of use, user base, earth imagery. Supported platforms include Windows, Linux and Macintosh
World Wind,NASA
Not as easy to use as Google Earth. Elevation database is supe-rior, but baseline imagery isn't as good. Supports many sourcesof data and good for science applications
MSN Virtual Earth Runs as a plug-in in Internet Explorer for now, and not as easy touse as Google Earth
ArcGIS Explorer An easy way to explore, visualise and share GIS information
SkyLine Globe Some interesting capabilities (built-in real-time GPS tracking,TrafficCam layer, custom weather, terrain tools, etc.); can plotshapefiles directly. Image quality is variable.
Eye on Earth Created for sharing of environmentally relevant data and informa-tion online through interactive map-based visualisations.
Earth Browser 3D virtual globe offers real-time weather conditions, earth-quakes, volcanoes, hurricanes etc. Supported platforms includeWindows, Macintosh
Bing Maps Easy to use; good collection of street maps, satellite photos andaerial maps
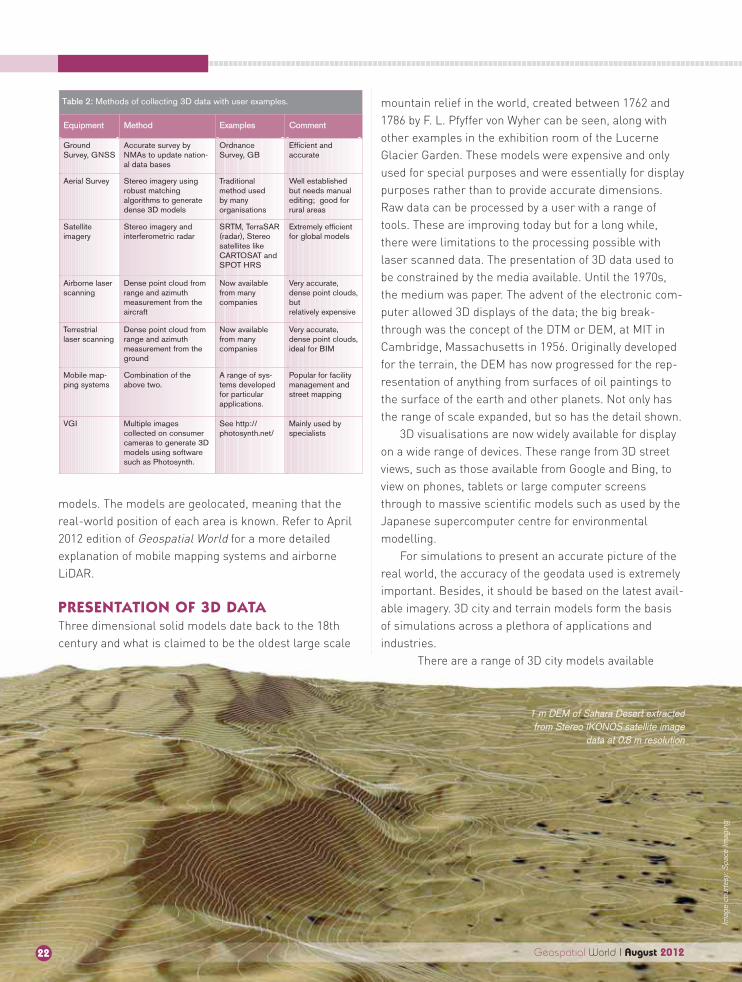
3D image of London by Google Earth
Imag
e co
urte
sy: S
pace
Imag
ing
the building team the ability to make more informed deci-sions. Besides, BIM supports a distributed team whichallows effective sharing of information throughout thelifecycle of the building and eliminates any possibility ofdata redundancy, data re-entry, data loss, miscommuni-cation and translation errors. An example of the use ofBIM is with Crossrail in UK (discussed in GeospatialWorld in March 2011). In MASDAR City (Geospatial WorldJuly 2011), 3D models have been used to estimate tem-perature rise due to solar heating and structural shapesand to look at the contribution of cities and suburbs toheat dissipation. It appears that tall buildings and urbancanyons actually are cooler than open residential areas.The use of 3D models to look at how sound travels isanother planning application.
Defence and homeland security: Governments aroundthe world are today faced with monumental challengestackling the threats to national security. Technologybreakthroughs are offering the advantage of low-cost,easy-to-use and realistic visualisation capability for plan-ning, training and decision making. 3D technology is usedfor diverse purposes in the defence sector including haz-ardous material safety training, emergency responsetraining, maritime security training, crisis managementand war training.
A three-dimensional virtual model of the ene-
my territory or actual mission place can be created usingsatellite imagery and emergency procedures can be prac-ticed for various scenarios in advance. Real-time 3D visu-alisation is a fundamental tool in any situation related todefence and homeland security. Developed by BohemiaInteractive Australia, Virtual Battlespace is a militarysimulator which uses 3D gaming technology to offer real-time scenario management facilities. The combination ofmilitary simulator functionality and modern gaming tech-nology has led to a broad military customer base fromaround the world including the United States MarineCorps (USMC) and the Australian Defence Force (ADF).
Entertainment industry: Geospatial technology hastoday become an integral part of the 3D entertainmentindustry. The use of satellite imagery has gained popular-ity in the video games. The availability of high-resolutionstereo satellite imagery allows users to experience videogames in a realistic 3D simulated world.
High-resolution stereo satellite images, together witha terrain elevation model, helps game developers to cre-ate a simulation model and visualise the landscape inthree dimensions. 3D terrain models are used for mapupdating and in the creation of 3D city models, which area prerequisite for generating virtual reality environments.
While these were earlier used to simply
24
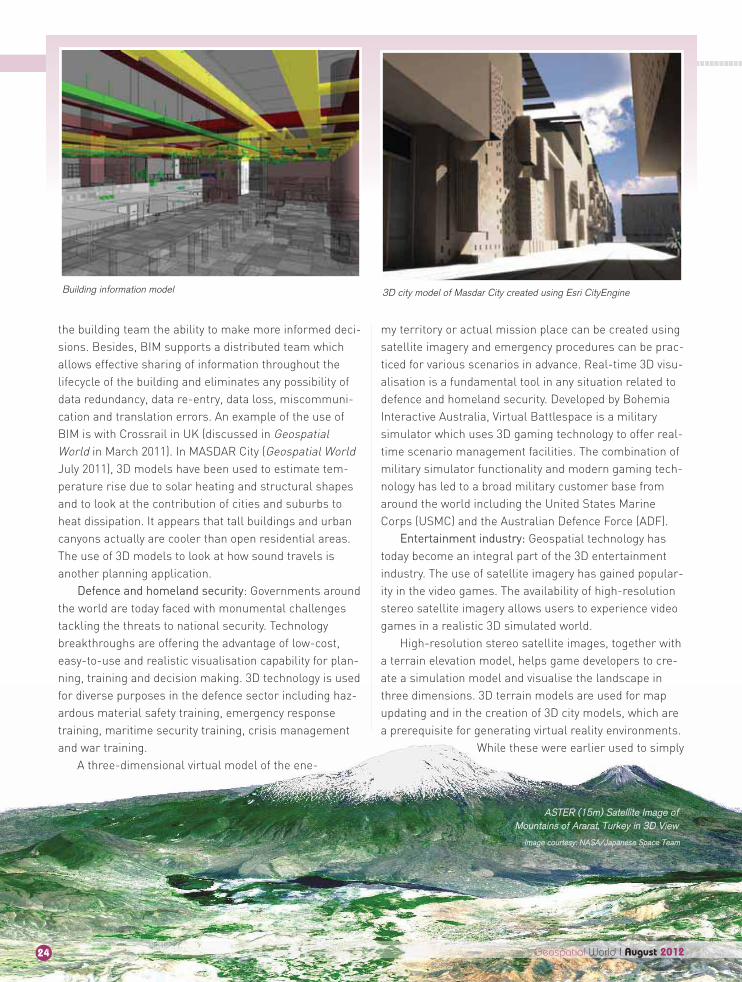
Building information model 3D city model of Masdar City created using Esri CityEngine
ASTER (15m) Satellite Image ofMountains of Ararat, Turkey in 3D View
Image courtesy: NASA/Japanese Space Team
Geospatial World I August 2012

26 Geospatial World I August 2012
visualise the built environment, they are used nowadaysas 3D interfaces for refined simulation modelling.
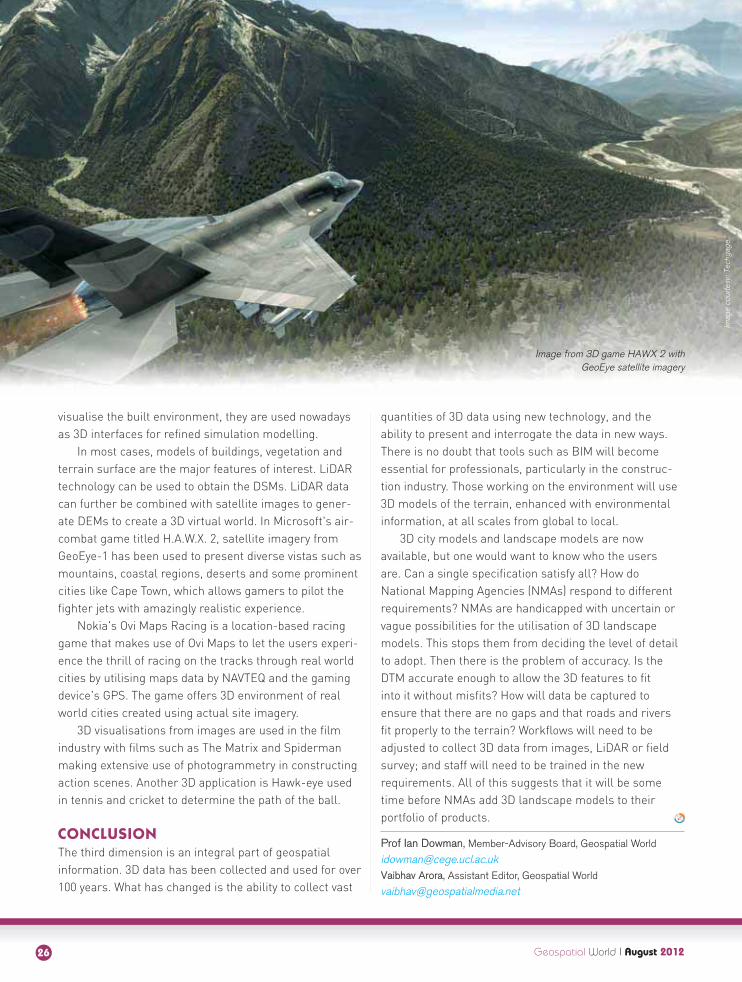
In most cases, models of buildings, vegetation andterrain surface are the major features of interest. LiDARtechnology can be used to obtain the DSMs. LiDAR datacan further be combined with satellite images to gener-ate DEMs to create a 3D virtual world. In Microsoft's air-combat game titled H.A.W.X. 2, satellite imagery fromGeoEye-1 has been used to present diverse vistas such asmountains, coastal regions, deserts and some prominentcities like Cape Town, which allows gamers to pilot thefighter jets with amazingly realistic experience.
Nokia's Ovi Maps Racing is a location-based racinggame that makes use of Ovi Maps to let the users experi-ence the thrill of racing on the tracks through real worldcities by utilising maps data by NAVTEQ and the gamingdevice's GPS. The game offers 3D environment of realworld cities created using actual site imagery.
3D visualisations from images are used in the filmindustry with films such as The Matrix and Spidermanmaking extensive use of photogrammetry in constructingaction scenes. Another 3D application is Hawk-eye usedin tennis and cricket to determine the path of the ball.
CONCLUSION
The third dimension is an integral part of geospatialinformation. 3D data has been collected and used for over100 years. What has changed is the ability to collect vast
quantities of 3D data using new technology, and the ability to present and interrogate the data in new ways.There is no doubt that tools such as BIM will becomeessential for professionals, particularly in the construc-tion industry. Those working on the environment will use3D models of the terrain, enhanced with environmentalinformation, at all scales from global to local.
3D city models and landscape models are now available, but one would want to know who the users are. Can a single specification satisfy all? How do National Mapping Agencies (NMAs) respond to differentrequirements? NMAs are handicapped with uncertain orvague possibilities for the utilisation of 3D landscapemodels. This stops them from deciding the level of detailto adopt. Then there is the problem of accuracy. Is theDTM accurate enough to allow the 3D features to fit into it without misfits? How will data be captured toensure that there are no gaps and that roads and riversfit properly to the terrain? Workflows will need to beadjusted to collect 3D data from images, LiDAR or fieldsurvey; and staff will need to be trained in the newrequirements. All of this suggests that it will be sometime before NMAs add 3D landscape models to theirportfolio of products.
Prof Ian Dowman, Member-Advisory Board, Geospatial World
[email protected] Arora, Assistant Editor, Geospatial World
Image from 3D game HAWX 2 withGeoEye satellite imagery
Imag
e co
urte
sy: T
echg
age
31Geospatial World I August 2012
Securing the missing
perspective
3D STREET LEVEL IMAGERY
Geospatial information is
increasingly being displayed in
three dimensions. Global players
like Gooogle, Nokia, Microsoft
and Apple have recently made
announcements showing realistic
looking 3D maps from a bird's eye
view. But what has been announced
so far lacks detail where it matters
most: at sttreet level.
THIRD DIMENSION IN CITY MAPS
Geospatial information is traditionally collected and dis-played in two dimensions. However, to successfully man-age growth, our increasingly complex society and infra-structures require more detailed spatial information.Here the need for a third dimension comes into place.
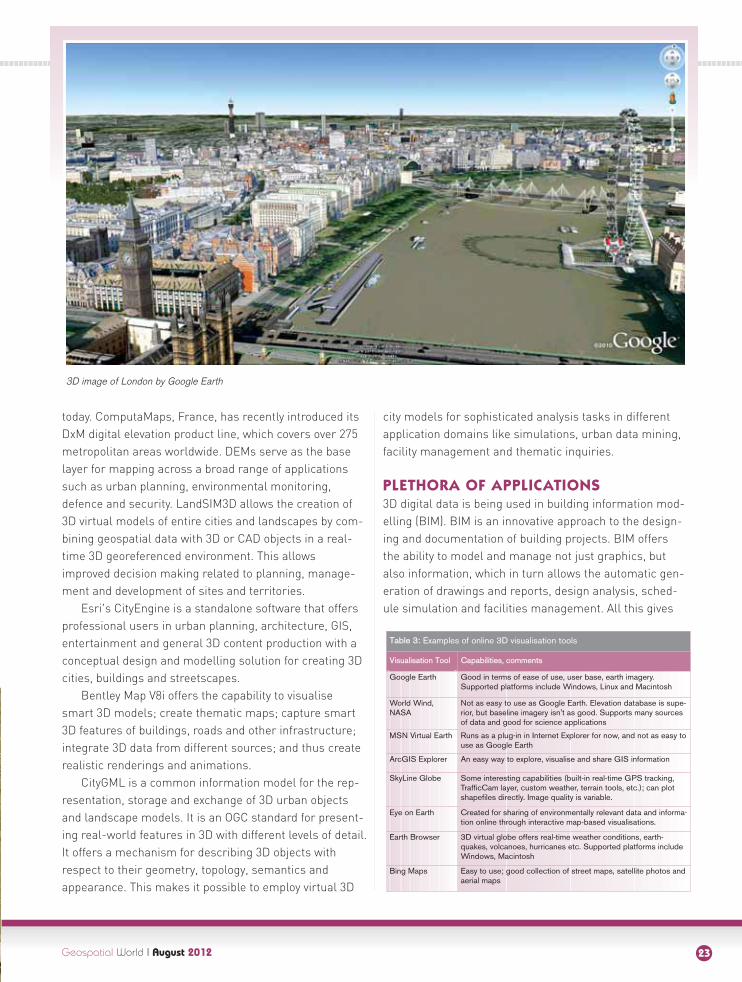
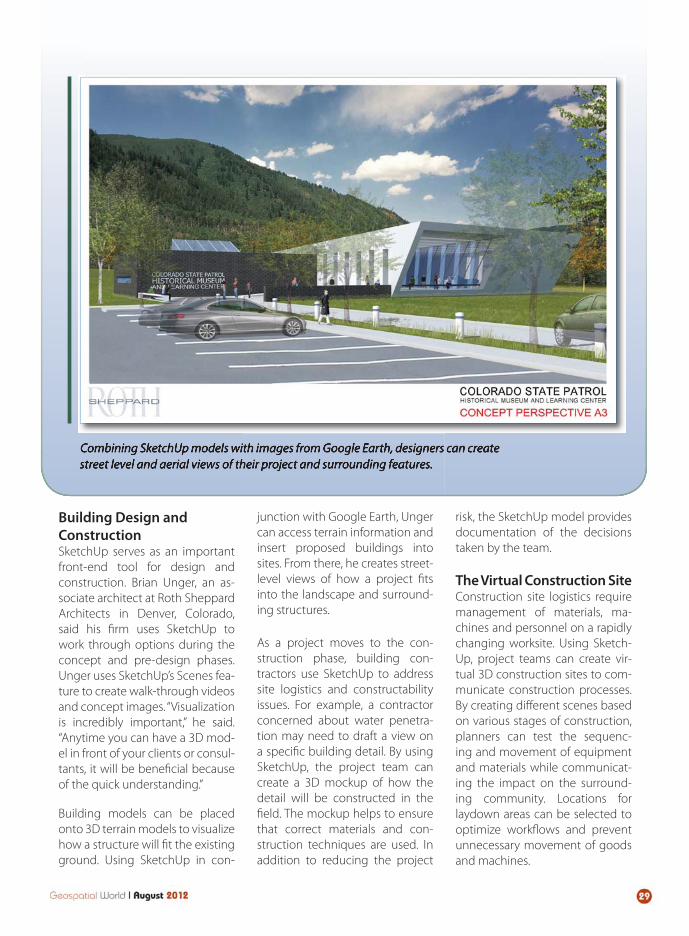
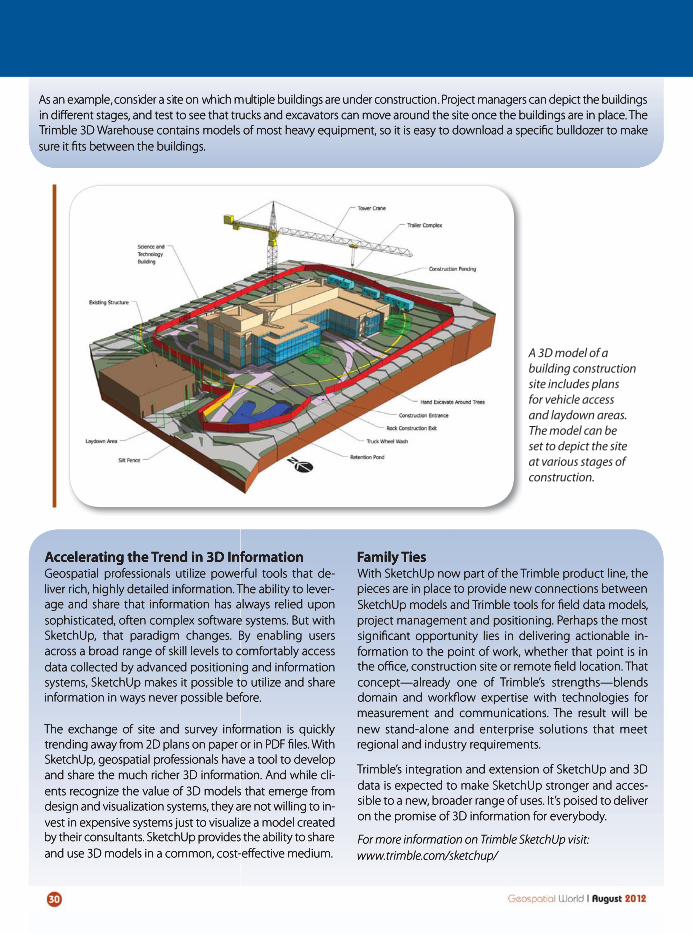
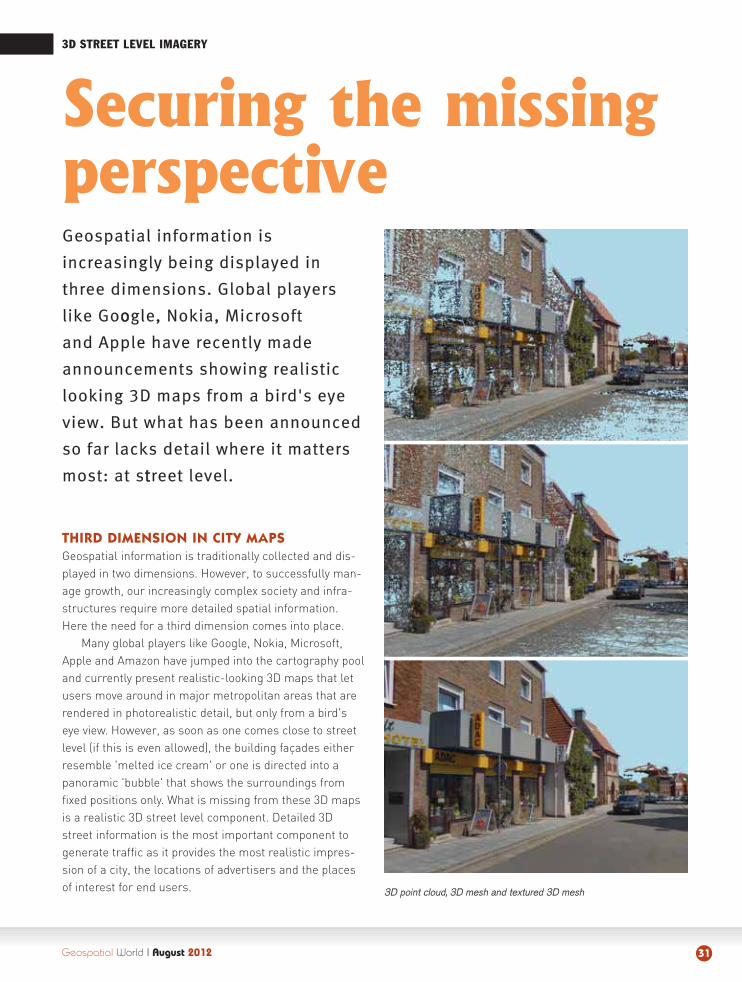
Many global players like Google, Nokia, Microsoft,Apple and Amazon have jumped into the cartography pooland currently present realistic-looking 3D maps that letusers move around in major metropolitan areas that arerendered in photorealistic detail, but only from a bird'seye view. However, as soon as one comes close to streetlevel (if this is even allowed), the building façades eitherresemble 'melted ice cream' or one is directed into apanoramic 'bubble' that shows the surroundings fromfixed positions only. What is missing from these 3D mapsis a realistic 3D street level component. Detailed 3Dstreet information is the most important component togenerate traffic as it provides the most realistic impres-sion of a city, the locations of advertisers and the placesof interest for end users. 3D point cloud, 3D mesh and textured 3D mesh
DCR TECHNOLOGY
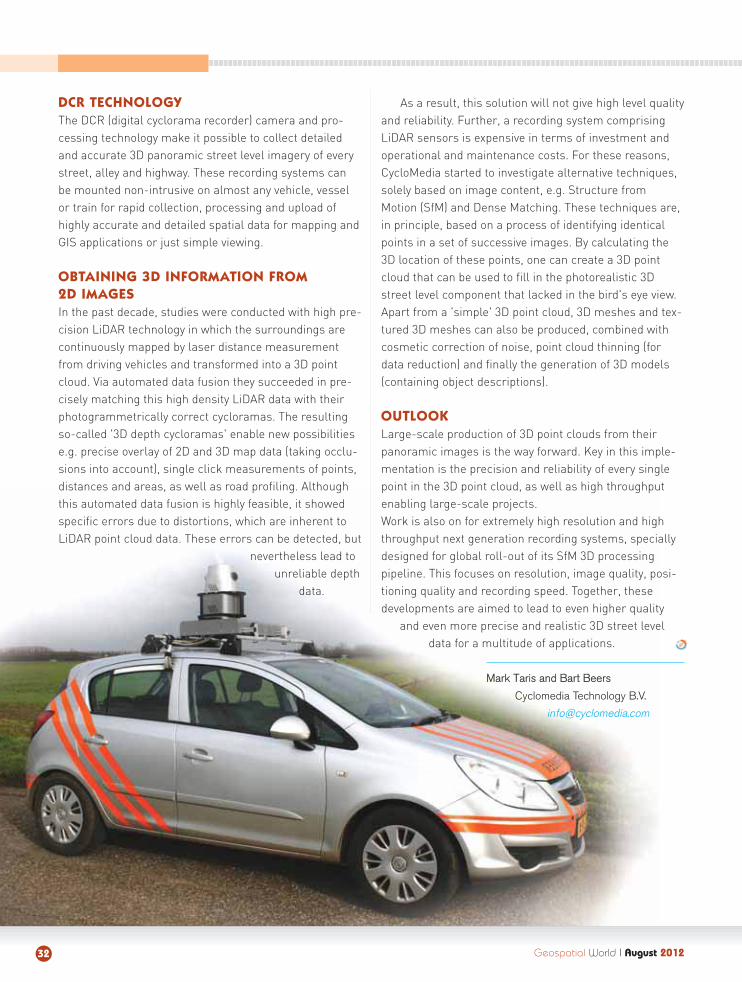
The DCR (digital cyclorama recorder) camera and pro-cessing technology make it possible to collect detailedand accurate 3D panoramic street level imagery of everystreet, alley and highway. These recording systems canbe mounted non-intrusive on almost any vehicle, vesselor train for rapid collection, processing and upload ofhighly accurate and detailed spatial data for mapping andGIS applications or just simple viewing.
OBTAINING 3D INFORMATION FROM
2D IMAGES
In the past decade, studies were conducted with high pre-cision LiDAR technology in which the surroundings arecontinuously mapped by laser distance measurementfrom driving vehicles and transformed into a 3D pointcloud. Via automated data fusion they succeeded in pre-cisely matching this high density LiDAR data with theirphotogrammetrically correct cycloramas. The resultingso-called '3D depth cycloramas' enable new possibilitiese.g. precise overlay of 2D and 3D map data (taking occlu-sions into account), single click measurements of points,distances and areas, as well as road profiling. Althoughthis automated data fusion is highly feasible, it showedspecific errors due to distortions, which are inherent toLiDAR point cloud data. These errors can be detected, but
nevertheless lead tounreliable depth
data.
As a result, this solution will not give high level qualityand reliability. Further, a recording system comprisingLiDAR sensors is expensive in terms of investment andoperational and maintenance costs. For these reasons,CycloMedia started to investigate alternative techniques,solely based on image content, e.g. Structure fromMotion (SfM) and Dense Matching. These techniques are,in principle, based on a process of identifying identicalpoints in a set of successive images. By calculating the3D location of these points, one can create a 3D pointcloud that can be used to fill in the photorealistic 3Dstreet level component that lacked in the bird's eye view.Apart from a 'simple' 3D point cloud, 3D meshes and tex-tured 3D meshes can also be produced, combined withcosmetic correction of noise, point cloud thinning (fordata reduction) and finally the generation of 3D models(containing object descriptions).
OUTLOOK
Large-scale production of 3D point clouds from theirpanoramic images is the way forward. Key in this imple-mentation is the precision and reliability of every singlepoint in the 3D point cloud, as well as high throughputenabling large-scale projects.Work is also on for extremely high resolution and highthroughput next generation recording systems, speciallydesigned for global roll-out of its SfM 3D processingpipeline. This focuses on resolution, image quality, posi-tioning quality and recording speed. Together, thesedevelopments are aimed to lead to even higher quality
and even more precise and realistic 3D street leveldata for a multitude of applications.
Mark Taris and Bart Beers
Cyclomedia Technology B.V.
Geospatial World I August 201232
Geospatial World I August 201234
3D TERRESTRIAL LASER SCANNING
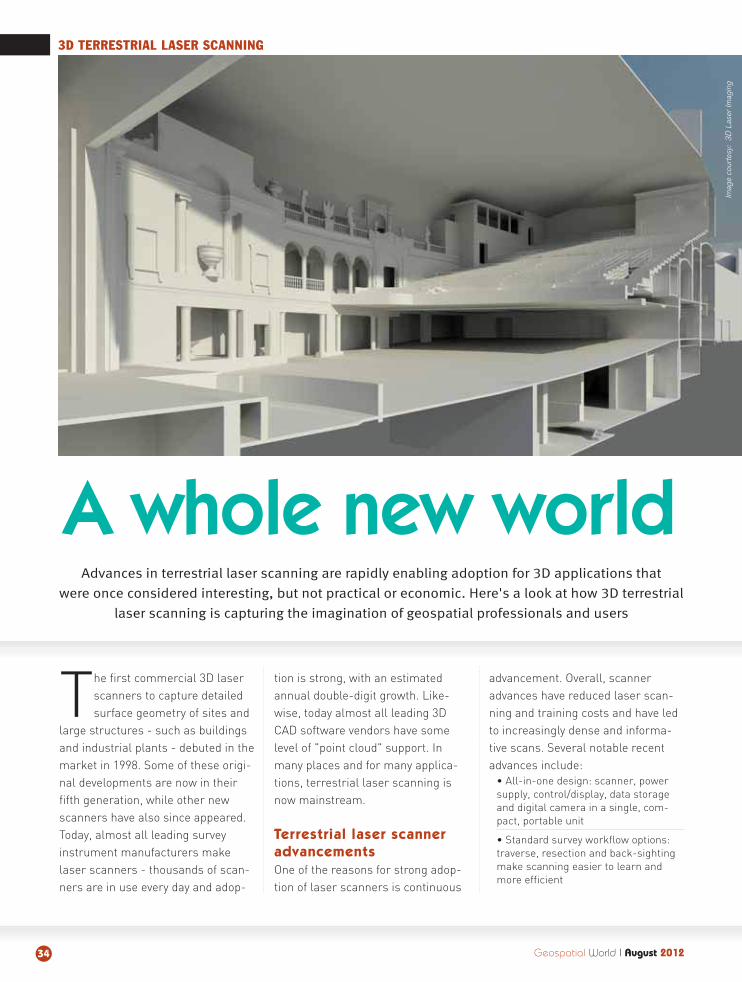
The first commercial 3D laserscanners to capture detailedsurface geometry of sites and
large structures - such as buildingsand industrial plants - debuted in themarket in 1998. Some of these origi-nal developments are now in theirfifth generation, while other newscanners have also since appeared.Today, almost all leading surveyinstrument manufacturers makelaser scanners - thousands of scan-ners are in use every day and adop-
tion is strong, with an estimatedannual double-digit growth. Like-wise, today almost all leading 3DCAD software vendors have somelevel of "point cloud" support. Inmany places and for many applica-tions, terrestrial laser scanning isnow mainstream.
Terrestrial laser scanner
advancements
One of the reasons for strong adop-tion of laser scanners is continuous
advancement. Overall, scanneradvances have reduced laser scan-ning and training costs and have ledto increasingly dense and informa-tive scans. Several notable recentadvances include:
• All-in-one design: scanner, powersupply, control/display, data storageand digital camera in a single, com-pact, portable unit
• Standard survey workflow options:traverse, resection and back-sightingmake scanning easier to learn andmore efficient
Advances in terrestrial laser scanning are rapidly enabling adoption for 3D applications that
were once considered interesting, but not practical or economic. Here's a look at how 3D terrestrial
laser scanning is capturing the imagination of geospatial professionals and users
A whole new world
Imag
e co
urte
sy:
3D L
aser
Imag
ing
• Reduced power consumption
• Faster scanning: Scanning now oftentakes just a few minutes per scan andhas shorter set-up times
• Increasing "accuracy at range" andbetter ability to capture dark andoblique surfaces
• Reductions in scanner size, weightand price
• Improved accompanying digitalimagery
• Many scanner accessories are nowcommon items - survey controllers,total station batteries, tribrachs,iPADs, etc.
Point cloud software for
terrestrial scanning
While terrestrial laser scanners havenoticeably improved, most users feelthat the field side of scanning wasalready relatively simple and veryfast. Rather, most users consideredthe main technology adoption barrierto be software and the office side.Large file sizes (easily into the GBs),plus the foreign nature of "workingin 3D," have long represented inher-ent challenges for transformingpoint cloud data into useful, action-able information.
Fortunately, recent advances onthe software and workflow side havealso reduced office processing costsand training costs - in many casesdramatically:
• Emergence of "panoramic scanimages" as valuable, low-cost, scan-based client deliverables
• Quick-to-create ortho-images madeof scan points
• Clients' increasing, direct use ofpoint clouds
• Increased automation
• 64-bit versions of point cloud soft-ware
• New scan data formats that speedworking with large scan data files
• More point cloud plug-ins for CAD,
such as for Revit
• Point cloud capabilities embeddeddirectly within CAD applications
Also, not be underestimated, areincreased office efficiencies that agrowing army of laser scanner usersgain over time.
Tipping point
At a conference in April 2012, I spokewith an owner of a small survey firmin the US. The conversation capturedthe essence of what today's scannerand software advances mean tomany geospatial professionals.
The owner first explained that hehad gotten into laser scanning in2005 with what were then a state-of-the art, survey-grade scanner (intro-duced in 2003) and point cloud soft-ware. Over time, he used scanningon several projects where it wasvaluable. However, these were notcommon applications for his firm, sohis scanner spent far more time instorage than originally hoped.
The owner then explained that ata laser scanning user conference inJune 2011, he interacted with severalsuccessful scanner owners who hadthe latest generation (released in2009) of the scanner he used andlatest version of software. He decid-ed to try out these latest tools. Histrial went very well and he soontraded in his old scanner for the newversion and updated his software.
When I spoke with the owner thisApril, he was glowing in excitementabout his scanning tools and howthey were benefiting his business. Ina span of just a few months, the utili-sation of his new scanner wasalready well over 50% - a veryhealthy sign - and he was attract-ing new clients. He explained that
his new scanner and office work-flows for creating even standard sur-vey deliverables were now so effi-cient that it simply cost less to domany of his common survey projectswith scanning than to conduct themconventionally. The new scanner andsoftware were also much easier forhis staff to learn.
Accelerating market pull
The above discussion focuses onhow costs have come down signifi-cantly for those who provide theservice. Recent developments on theother side of the coin - the marketpull for laser scanning -also paint a brightpicture.
One big"pull" factor isthe over-all
Geospatial World I August 2012 35
Imag
e co
urte
sy:
Dyn
asty
Gro
up
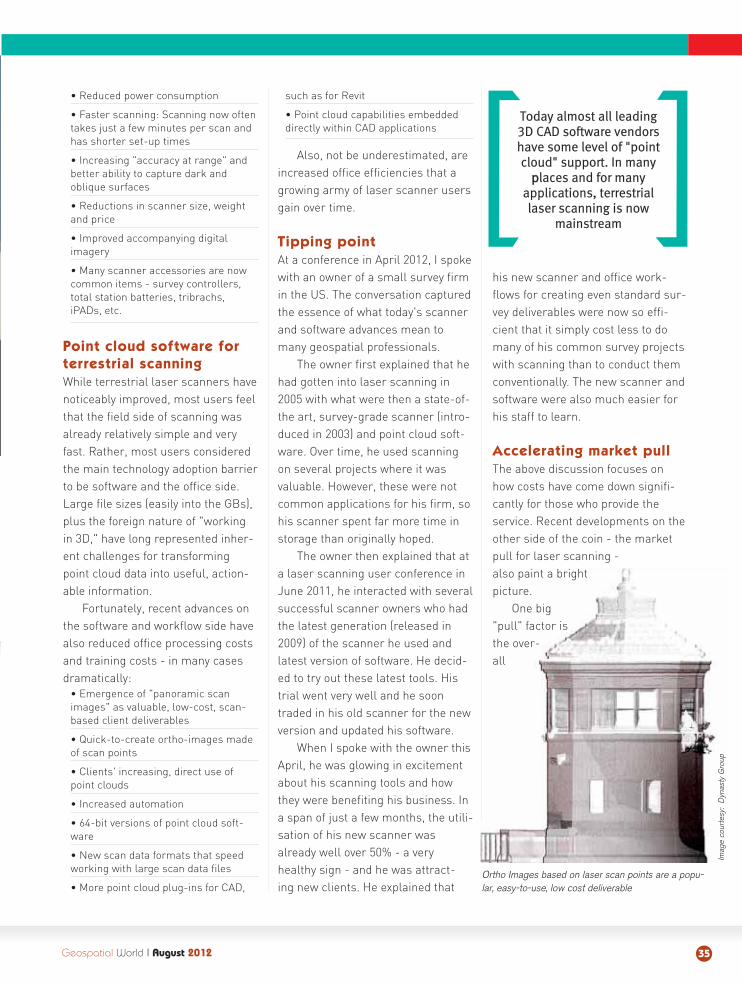
Ortho Images based on laser scan points are a popu-lar, easy-to-use, low cost deliverable
Today almost all leading3D CAD software vendorshave some level of "pointcloud" support. In many
pplaces and for manyapplications, terrestriallaser scanning is now
mainstream
Imag
e co
urte
sy:
3D L
aser
Imag
ing
industry trend toward 3D - fordesign, visualisation, communica-tions and even marketing. As leadingCAD vendors heavily promote 3D,their customers listen intently. Twouser presentations at the Hexagon2012 conference in June reallybrought home this point. One was bya civil engineering firm that spe-cialises in airport infrastructuredesign; the other was a civil engi-neering firm that specialises in sep-tic system design.
Both presenters explained thattheir small companies had recentlyswitched to 3D design and this, inturn, also prompted them to switchto laser scanning for their topo-graphic and site survey needs. Onereason was that 3D scans fit veryeffectively with their 3D designapproach. In one case, the firm out-sourced scanning services receivingregistered 3D point clouds from theirprovider. In the other case, the firmacquired a 3D laser scanner, as theydo more than 150 septic system proj-ects each year. The firm also usedtheir scanner - a versatile model - todevelop new clients outside the sep-tic business. This is a common sce-nario today: a company acquires a
scanner to plug into their existingprojects (doing them more efficiently)and then uses this same tool to helpdiversify their business.
Clients "get it"
The client base of laser scanningservice providers - typically design-ers, contractors, architects, fabrica-tors, and asset owner/operators - israpidly expanding. For these clients,the rich, digital, 3D aspects of laserscanning and scanning's fast, remotecapture capability provide many val-ue-added benefits over traditionalsurveying:
• Safety: Less exposure to hazardouslocations and situations (e.g. busyroads, industrial plants, unstable ter-rain) when collecting data
• For designers: Better as-built infor-mation leads to better retrofit designs
• For contractors: Better retrofitdesigns, in turn, lead to smoother,lower cost construction projects; also,better project QA reduces projectsrisks
• For owner/operators: Smoother con-struction and fast, remote data collec-tion mean less down-time for theirinfrastructure, building, site, and plantassets.
There are many symptoms ofhow the client community has
strongly embraced the benefits ofterrestrial laser scanning. Onesymptom is that clients are nowrequiring scanning for various typesof projects and applications. Manytransportation agencies, plant engi-neering firms, tunnelling contractorsand car manufacturers have stan-dardised on scanning for theirrequirements.
Another symptom of acceleratingclient demand is the rapid prolifera-tion of portal services that feedpanoramic scan images/data intomultiple disciplines for a single proj-ect. Piping, structural, HVAC (heat-ing, ventilation and air conditioning),mechanical, civil, equipment, electri-cal design and even safety and main-tenance staff can all use the samerich scan data to extract informationfor their specific tasks. Portalsquench this multi-discipline thirst forthe same data by giving all staffready access to laser scans (andassociated imagery) via the internetand panoramic scan/image datasets.
Rapidly emerging
applications
When scanning was first introduced,
Geospatial World II August 201236
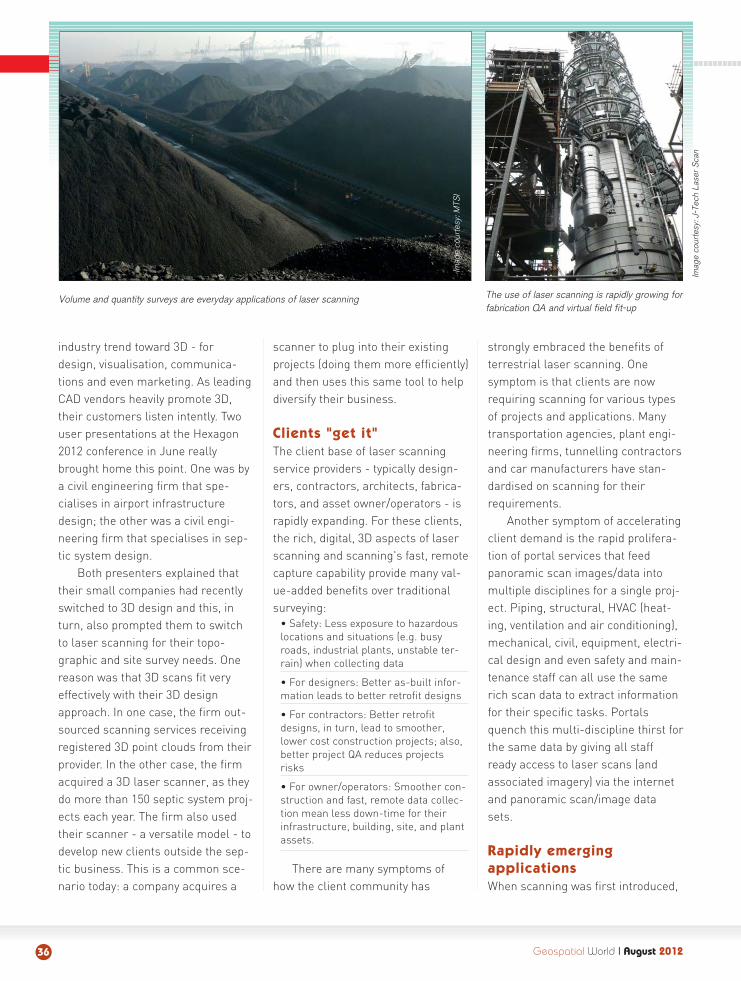
The use of laser scanning is rapidly growing forfabrication QA and virtual field fit-up
Volume and quantity surveys are everyday applications of laser scanning
Imag
e co
urte
sy: J
-Tec
h La
ser S
can
Imag
e co
urte
sy: M
TSI
vendors touted many interesting"potential applications." Today, manyof these are surging into their nextlevel of adoption. Here are a few:
Forensics - Aided by today's efficient,accurate tools and quick, easy-to-use deliverables, laser scan data hasproven a big winner in the courts.Both prosecutors and defendants arerapidly switching to scanning as theultimate truth of what a scene waslike at the time of the incident - ascene they can view in 3D. Govern-ment agencies are buying scannersfor multiple offices.
For example, UK agenciesrecently acquired more than 30scanners for road incident manage-ment, timed around the 2012Olympics. The California HighwayPatrol has seven scanners for acci-dent investigations.
Heritage - Recent growth in this seg-ment is dramatic. In addition torestoration and refurbishment proj-ects, scanning is now also beingused for archive, education and sitemanagement. Entire organisations,like CyArk, have sprung up in thisarea and have already captured largenumbers of important heritage sitesaround the world.
BIM - Building informa-tion modeling (BIM) is avery high growth appli-cation for scanning. Here,laser scans of existingbuildings - interiors and exte-riors - are used to helpcreate 3D intelligentmodels. This approach israpidly catching on withcontractors and pulling lots of
laser scanning with it, as scanning isoften the best way to quickly capturebuildings with sufficient 3D detail.
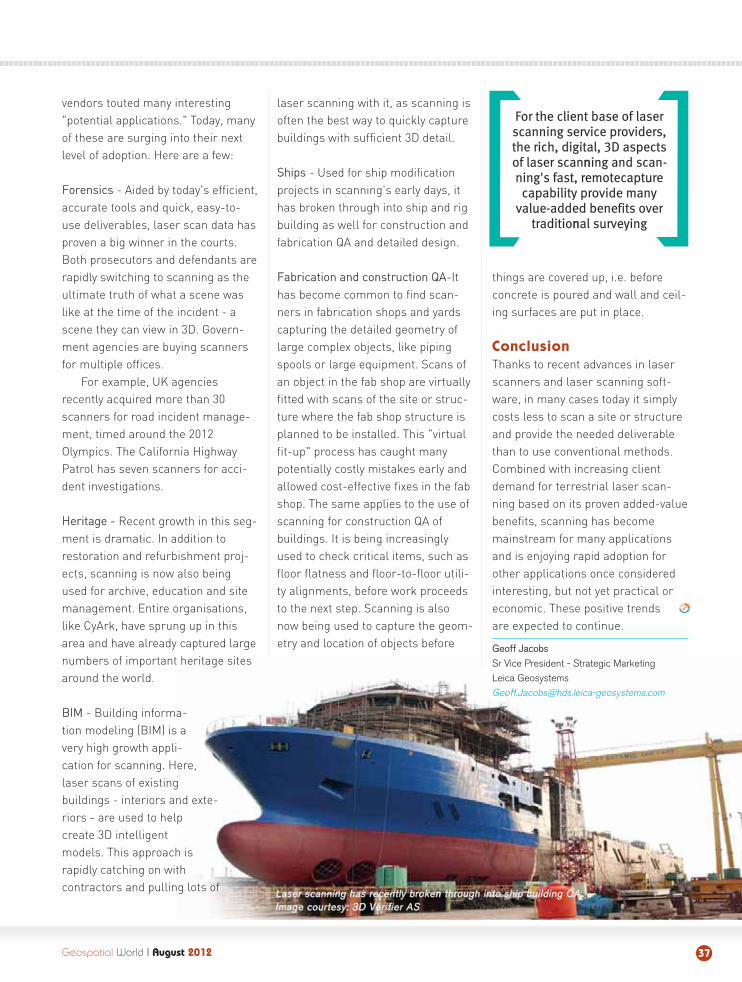
Ships - Used for ship modificationprojects in scanning's early days, ithas broken through into ship and rigbuilding as well for construction andfabrication QA and detailed design.
Fabrication and construction QA-Ithas become common to find scan-ners in fabrication shops and yardscapturing the detailed geometry oflarge complex objects, like pipingspools or large equipment. Scans ofan object in the fab shop are virtuallyfitted with scans of the site or struc-ture where the fab shop structure isplanned to be installed. This "virtualfit-up" process has caught manypotentially costly mistakes early andallowed cost-effective fixes in the fabshop. The same applies to the use ofscanning for construction QA ofbuildings. It is being increasinglyused to check critical items, such asfloor flatness and floor-to-floor utili-ty alignments, before work proceedsto the next step. Scanning is alsonow being used to capture the geom-etry and location of objects before
things are covered up, i.e. beforeconcrete is poured and wall and ceil-ing surfaces are put in place.
Conclusion
Thanks to recent advances in laserscanners and laser scanning soft-ware, in many cases today it simplycosts less to scan a site or structureand provide the needed deliverablethan to use conventional methods.Combined with increasing clientdemand for terrestrial laser scan-ning based on its proven added-valuebenefits, scanning has becomemainstream for many applicationsand is enjoying rapid adoption forother applications once consideredinteresting, but not yet practical oreconomic. These positive trendsare expected to continue.
Geoff Jacobs
Sr Vice President - Strategic Marketing
Leica Geosystems
Geospatial World I August 2012 37
Laser scanning has recently broken through into ship building QALaser scanning has recently brokenn through into ship building QAImage courtesy: 3D Verifier ASImage courtesy: 3D Verifier AS
For the client base of laserscanning service providers,the rich, digital, 3D aspectsof laser scannning and scan-ning's fast, remotecapture
capability provide manyvalue-added benefits over
traditionnal surveying
HELSINKI, FINLAND
Geospatial World I August 201238
Improving efficiency
with the third dimension
Digital mapping ofthe City of Helsin-ki began in 1982,
while the first 3D digitalmodel of an area of thecity was created as partof an architectural com-petition in 1987. The cityis on target to realise afully detailed 3D modelby 2013.
CITYWIDE MAPPING
The coastline and numer-ous islands that lie withinthe city boundary pose aparticular challenge, and
the complicated nature ofthe local terrain hasresulted in a modellingproject that is both exten-sive and comprehensive.Laser scanning now cov-ers one-third of the cityeach year, so the raw datais never more than 3 yearsold.
The city surveyingdepartment gathers dataand creates basic mapsand models, which arepassed to the city planningdepartment. Sections ofthe model begin as outline
2D sketches, and thenblocks are placed over themap. According to JarmoSuomisto, IT manager in-charge of workflows withinthe department, the use ofMicroStation throughoutthe organisation hashelped to revise and refinethe department's myriadprocesses to implementstreamlined workflows.
INTELLIGENT
PLANNING
The system has made itpossible to model a signifi-
cant development areawithin just half a day. Thisprovides an almost instantopportunity to visualiseindividual urban spacesand how they might con-nect with each other. TheOracle planning databaseis so large that it is brokendown into separate entitiesand managed using Pro-jectWise, Bentley's projectteam collaboration soft-ware, which the city usesacross several depart-ments.
ACCURATE SPATIAL
ANALYSIS
Precision is vital if theimpact of new buildings is to be assessed. WithBentley products, userscan achieve accuracies ofless than one metre, with error margins of 10-15 cm in detailed modelling. This enablesprofessionals in other disciplines to understandthe possible consequencesof proposed developmentssuch as the threat of rising water levels in low-lying areas or critical
Case Study
3D modelling of the city is facilitating citywide mapping, improved communication and faster
decision making
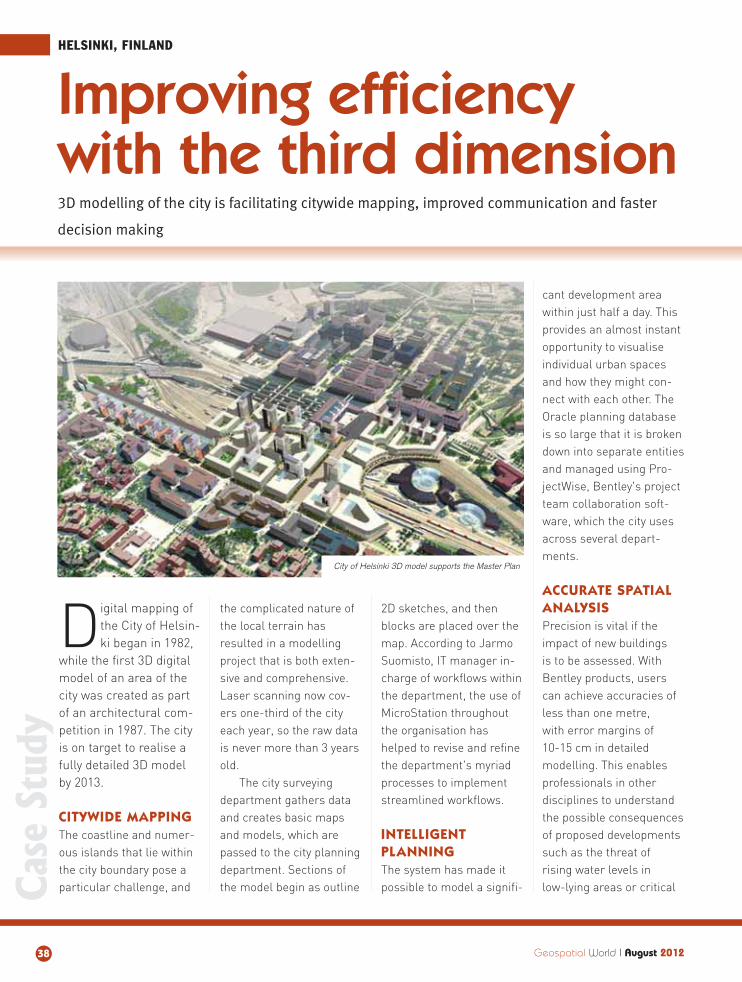
City of Helsinki 3D model supports the Master Plan
Geospatial World I August 2012 39
vistas and visual corridors.
EFFICIENT REGULA-
TORY PROCESSES
In Helsinki, all buildingconstruction requires apermit and each permitrequest has to be support-ed by a detailed plan of thecity, based on the 3D mod-el. It is clear thus that the3D city model will have afuture role in the regulato-ry review process.
Helsinki Energy, whichis responsible for districtheating infrastructure,now references the 3D citymodel data while planningits networks. In addition,communications serviceproviders in Helsinki also
refer-ence the3D citymodelwhenplan-ningupgrades andextensions to theirnetworks.
CLEAR PUBLIC
COMMUNICATION
During public consulta-tions, all communicationwith residents features the
city mod-el. For city plan-
ners, this means thatapprovals can be grantedmuch more quickly thanbefore. For example, aprocess that earlier took2.5 years may now becompleted within 1.5years. That representshuge cost savings,because an office or retail
developmentwould generate
income and local taxes upto one year earlier.
The 3D city model isalso improving trans-parency as the basic mod-els and renderings for allproposed and approveddevelopments are avail-able on the City of Helsinkiwebsite. The 3D modelshave been plotted out forpresentation to the public,both in Helsinki and over-seas.
Case Study
3D project model of the Kalasatamanranta area
of the city of Helsinki
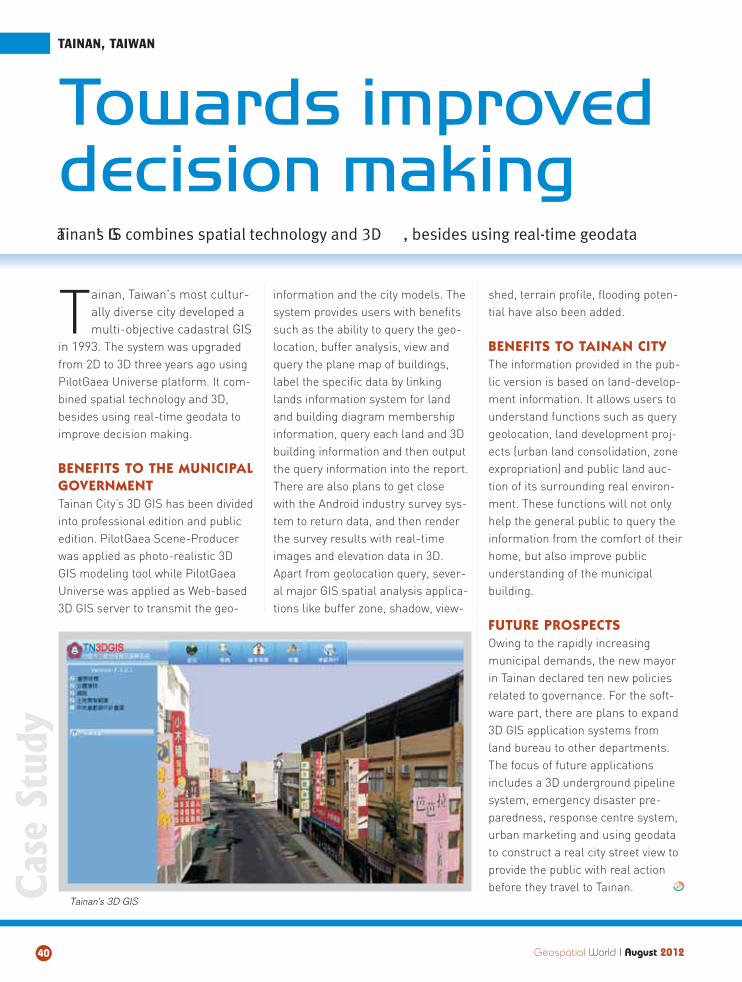
Tainan, Taiwan's most cultur-ally diverse city developed amulti-objective cadastral GIS
in 1993. The system was upgradedfrom 2D to 3D three years ago usingPilotGaea Universe platform. It com-bined spatial technology and 3D,besides using real-time geodata toimprove decision making.
BENEFITS TO THE MUNICIPAL
GOVERNMENT
Tainan City’s 3D GIS has been dividedinto professional edition and publicedition. PilotGaea Scene-Producerwas applied as photo-realistic 3DGIS modeling tool while PilotGaeaUniverse was applied as Web-based3D GIS server to transmit the geo-
information and the city models. Thesystem provides users with benefitssuch as the ability to query the geo-location, buffer analysis, view andquery the plane map of buildings,label the specific data by linkinglands information system for landand building diagram membershipinformation, query each land and 3Dbuilding information and then outputthe query information into the report.There are also plans to get closewith the Android industry survey sys-tem to return data, and then renderthe survey results with real-timeimages and elevation data in 3D.Apart from geolocation query, sever-al major GIS spatial analysis applica-tions like buffer zone, shadow, view-
shed, terrain profile, flooding poten-tial have also been added.
BENEFITS TO TAINAN CITY
The information provided in the pub-lic version is based on land-develop-ment information. It allows users tounderstand functions such as querygeolocation, land development proj-ects (urban land consolidation, zoneexpropriation) and public land auc-tion of its surrounding real environ-ment. These functions will not onlyhelp the general public to query theinformation from the comfort of theirhome, but also improve publicunderstanding of the municipalbuilding.
FUTURE PROSPECTS
Owing to the rapidly increasingmunicipal demands, the new mayorin Tainan declared ten new policiesrelated to governance. For the soft-ware part, there are plans to expand3D GIS application systems fromland bureau to other departments.The focus of future applicationsincludes a 3D underground pipelinesystem, emergency disaster pre-paredness, response centre system,urban marketing and using geodatato construct a real city street view toprovide the public with real actionbefore they travel to Tainan.
Geospatial World I August 201240
TAINAN, TAIWAN
Tainan’s GIS combines spatial technology and 3D , besides using real-time geodata
Towards improved
decision making
Tainan’s 3D GISCase Study

October 8-11, 2012 . Orlando, FloridaGaylord Palms Resort & Convention Center
www.geoint2012.com
Four days of comprehensive agenda featuring keynotes, panels, breakouts, and workshops
Topics related to ISR, Modeling and Simulation, Big Data, Mission Planning and Rehearsal, Homeland Security needs, and much more
Focus on U.S. and Allied partner issues and needs
An exhibit hall with over 100,000 square feet
More than 250 government and industry exhibitors
Outdoor displays and demonstrations
Invaluable networking opportunities with almost 4,500 attendees
An amazing return on investment for limited travel budgets
!"#$%&"’
()*+,-
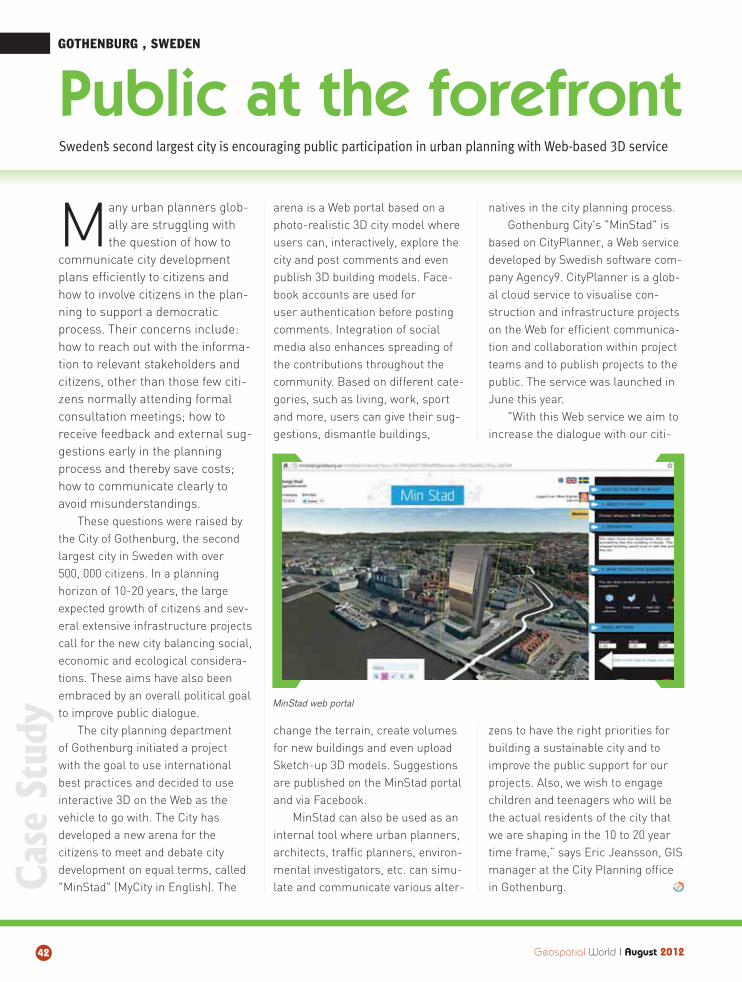
Geospatial World I August 201242
Many urban planners glob-ally are struggling withthe question of how to
communicate city developmentplans efficiently to citizens andhow to involve citizens in the plan-ning to support a democraticprocess. Their concerns include:how to reach out with the informa-tion to relevant stakeholders andcitizens, other than those few citi-zens normally attending formalconsultation meetings; how toreceive feedback and external sug-gestions early in the planningprocess and thereby save costs;how to communicate clearly toavoid misunderstandings.
These questions were raised bythe City of Gothenburg, the secondlargest city in Sweden with over 500, 000 citizens. In a planning horizon of 10-20 years, the largeexpected growth of citizens and sev-eral extensive infrastructure projectscall for the new city balancing social,economic and ecological considera-tions. These aims have also beenembraced by an overall political goalto improve public dialogue.
The city planning department of Gothenburg initiated a project with the goal to use internationalbest practices and decided to useinteractive 3D on the Web as thevehicle to go with. The City hasdeveloped a new arena for the citizens to meet and debate citydevelopment on equal terms, called"MinStad" (MyCity in English). The
arena is a Web portal based on aphoto-realistic 3D city model whereusers can, interactively, explore thecity and post comments and evenpublish 3D building models. Face-book accounts are used for user authentication before postingcomments. Integration of socialmedia also enhances spreading ofthe contributions throughout thecommunity. Based on different cate-gories, such as living, work, sportand more, users can give their sug-gestions, dismantle buildings,
change the terrain, create volumesfor new buildings and even uploadSketch-up 3D models. Suggestionsare published on the MinStad portaland via Facebook.
MinStad can also be used as aninternal tool where urban planners,architects, traffic planners, environ-mental investigators, etc. can simu-late and communicate various alter-
natives in the city planning process.Gothenburg City's "MinStad" is
based on CityPlanner, a Web servicedeveloped by Swedish software com-pany Agency9. CityPlanner is a glob-al cloud service to visualise con-struction and infrastructure projects on the Web for efficient communica-tion and collaboration within projectteams and to publish projects to thepublic. The service was launched inJune this year.
"With this Web service we aim toincrease the dialogue with our citi-
zens to have the right priorities forbuilding a sustainable city and toimprove the public support for ourprojects. Also, we wish to engagechildren and teenagers who will bethe actual residents of the city thatwe are shaping in the 10 to 20 yeartime frame,” says Eric Jeansson, GISmanager at the City Planning officein Gothenburg.
GOTHENBURG , SWEDENCase Study
Sweden’s second largest city is encouraging public participation in urban planning with Web-based 3D service
Public at the forefront
MinStad web portal
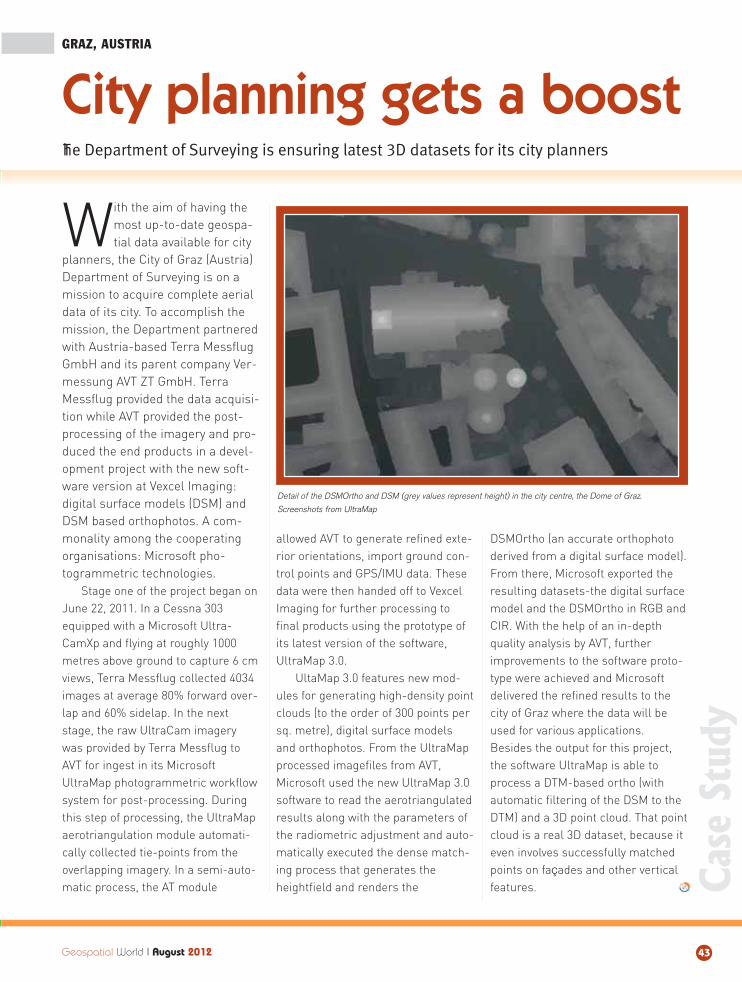
Geospatial World I August 2012 43
With the aim of having themost up-to-date geospa-tial data available for city
planners, the City of Graz (Austria)Department of Surveying is on amission to acquire complete aerialdata of its city. To accomplish themission, the Department partneredwith Austria-based Terra MessflugGmbH and its parent company Ver-messung AVT ZT GmbH. TerraMessflug provided the data acquisi-tion while AVT provided the post-processing of the imagery and pro-duced the end products in a devel-opment project with the new soft-ware version at Vexcel Imaging:digital surface models (DSM) andDSM based orthophotos. A com-monality among the cooperatingorganisations: Microsoft pho-togrammetric technologies.
Stage one of the project began onJune 22, 2011. In a Cessna 303equipped with a Microsoft Ultra-CamXp and flying at roughly 1000metres above ground to capture 6 cmviews, Terra Messflug collected 4034images at average 80% forward over-lap and 60% sidelap. In the nextstage, the raw UltraCam imagerywas provided by Terra Messflug toAVT for ingest in its MicrosoftUltraMap photogrammetric workflowsystem for post-processing. Duringthis step of processing, the UltraMapaerotriangulation module automati-cally collected tie-points from theoverlapping imagery. In a semi-auto-matic process, the AT module
allowed AVT to generate refined exte-rior orientations, import ground con-trol points and GPS/IMU data. Thesedata were then handed off to VexcelImaging for further processing tofinal products using the prototype ofits latest version of the software,UltraMap 3.0.
UltaMap 3.0 features new mod-ules for generating high-density pointclouds (to the order of 300 points persq. metre), digital surface modelsand orthophotos. From the UltraMapprocessed imagefiles from AVT,Microsoft used the new UltraMap 3.0software to read the aerotriangulatedresults along with the parameters ofthe radiometric adjustment and auto-matically executed the dense match-ing process that generates theheightfield and renders the
DSMOrtho (an accurate orthophotoderived from a digital surface model).From there, Microsoft exported theresulting datasets-the digital surfacemodel and the DSMOrtho in RGB andCIR. With the help of an in-depthquality analysis by AVT, furtherimprovements to the software proto-type were achieved and Microsoftdelivered the refined results to thecity of Graz where the data will beused for various applications.Besides the output for this project,the software UltraMap is able toprocess a DTM-based ortho (withautomatic filtering of the DSM to theDTM) and a 3D point cloud. That pointcloud is a real 3D dataset, because iteven involves successfully matchedpoints on façades and other verticalfeatures.
GRAZ, AUSTRIA
The Department of Surveying is ensuring latest 3D datasets for its city planners
City planning gets a boost
Detail of the DSMOrtho and DSM (grey values represent height) in the city centre, the Dome of Graz.
Screenshots from UltraMap
Case Study
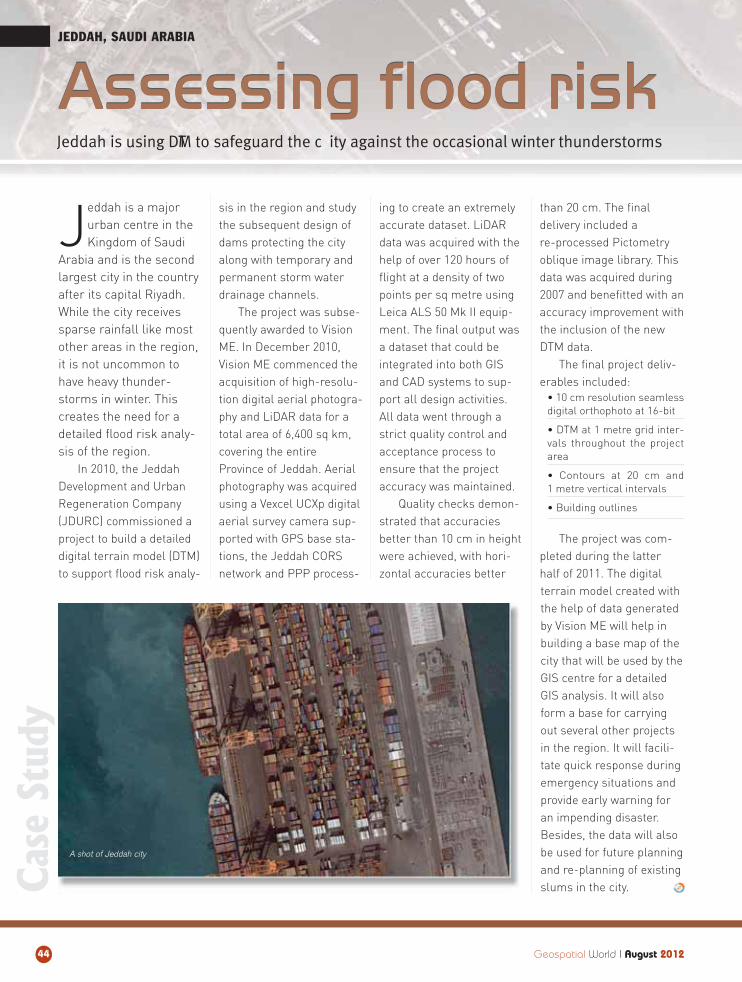
Geospatial World I August 20124444
JEDDAH, SAUDI ARABIA
Assessing flood risk
Jeddah is a majorurban centre in theKingdom of Saudi
Arabia and is the secondlargest city in the countryafter its capital Riyadh.While the city receivessparse rainfall like mostother areas in the region,it is not uncommon tohave heavy thunder-storms in winter. Thiscreates the need for adetailed flood risk analy-sis of the region.
In 2010, the JeddahDevelopment and UrbanRegeneration Company(JDURC) commissioned aproject to build a detaileddigital terrain model (DTM)to support flood risk analy-
sis in the region and studythe subsequent design ofdams protecting the cityalong with temporary andpermanent storm waterdrainage channels.
The project was subse-quently awarded to VisionME. In December 2010,Vision ME commenced theacquisition of high-resolu-tion digital aerial photogra-phy and LiDAR data for atotal area of 6,400 sq km,covering the entireProvince of Jeddah. Aerialphotography was acquiredusing a Vexcel UCXp digitalaerial survey camera sup-ported with GPS base sta-tions, the Jeddah CORSnetwork and PPP process-
ing to create an extremelyaccurate dataset. LiDARdata was acquired with thehelp of over 120 hours offlight at a density of twopoints per sq metre usingLeica ALS 50 Mk II equip-ment. The final output wasa dataset that could beintegrated into both GISand CAD systems to sup-port all design activities.All data went through astrict quality control andacceptance process toensure that the projectaccuracy was maintained.
Quality checks demon-strated that accuraciesbetter than 10 cm in heightwere achieved, with hori-zontal accuracies better
than 20 cm. The final delivery included a re-processed Pictometryoblique image library. Thisdata was acquired during2007 and benefitted with anaccuracy improvement withthe inclusion of the newDTM data.
The final project deliv-erables included:
• 10 cm resolution seamlessdigital orthophoto at 16-bit
• DTM at 1 metre grid inter-vals throughout the projectarea
• Contours at 20 cm and 1 metre vertical intervals
• Building outlines
The project was com-pleted during the latterhalf of 2011. The digitalterrain model created withthe help of data generatedby Vision ME will help inbuilding a base map of thecity that will be used by theGIS centre for a detailedGIS analysis. It will alsoform a base for carryingout several other projectsin the region. It will facili-tate quick response duringemergency situations andprovide early warning foran impending disaster.Besides, the data will alsobe used for future planningand re-planning of existingslums in the city.
Jeddah is using DTM to safeguard the c ity against the occasional winter thunderstorms
Assessing flood risk
A shot of Jeddah city
Case Study
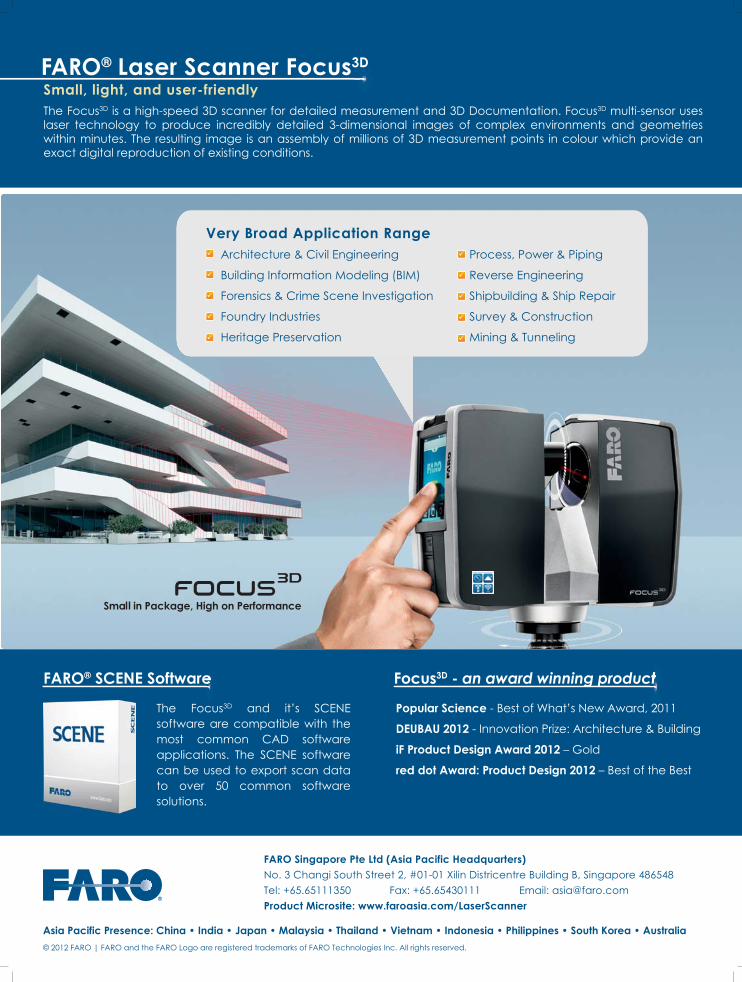
FFaarroo hhaass aa rraannggee ooff 33DD pprroodduuccttssaanndd ssoolluuttiioonnss.. HHooww ddoo yyoouu ppoossii--ttiioonn FFAARROO''ss 33DD llaasseerr ssccaannnneerrss vviiss--aa--vviiss ootthheerr 33DD tteecchhnniiqquueess??
FARO's Laser Scanner Focus3Dadopts the 'phase shift' method ofmeasurement, which has relativelyhigh scanning speeds of 976,000points/second and an accuracy of ±2mm. The covered range of 120mis ideal for medium range scanningin applications that require a moreaccurate and precise measurement.
The other common 3D techniqueis the 'time of flight' (TOF) method.TOF scanners generally have alonger range capability, up to 2 km.TOF scanners, though, operate at amuch reduced scanning rate andaccuracy as compared to thoseusing the phase shift method.
With its dimensions of 24cm x20cm x 10cm and a weight of 5.0 kg,Focus3D is so compact and mobilethat users can easily take it withthem, wherever they go. Easy inte-gration with a mobile laser scannersystem has become a realitybecause of the compact size, lightweight and low cost of the Focus3D.In essence, the user has the flexibil-ity of using Focus3D for both staticand mobile scanning.
WWhhaatt iiss FFAARROO''ss nneexxtt tteecchhnnoollooggyyiinnnnoovvaattiioonn iinn tteerrmmss ooff 33DD ssoolluu--ttiioonnss?? AArree yyoouu mmoovviinngg ttoo mmoobbiilleeppllaattffoorrmmss aanndd ttoo pprroovviiddiinngg rreeaall--ttiimmee iinnffoorrmmaattiioonn??
R&D has always been an integralpart of FARO culture and FARO con-tinuously invests in innovation, evenin downturn years. This enablesFARO to emerge much strongerimmediately after any economicdownturn. Part of the innovationprocess includes FARO involving itsend users to collect feedback onproduct development so that the endproduct will meet and often exceedmarket expectations. To that end, weare constantly exploring new innova-tions, including observed industrytrends such as mobile and real-timeplatforms for 3D laser scanning.
When FARO introduced Focus3Din October 2010, it 'disrupted' the 3Dlaser scanning market with its com-bination of increased portability,ease of use, high accuracy, speed ofmeasurement and relatively lowcosts. This attracted many users toadopt 3D laser scanning technology,replacing traditional or older meth-ods and processes.
At present, Focus3D can be easi-ly integrated into a mobile scanning
system as a vital unit to acquireinformation, e.g. for a GIS. As men-tioned earlier, users have the flexi-bility to deploy the Focus3D for bothstatic and mobile scanning projects.To top it off, this flexibility does notcome at a higher price. In fact, it ismuch more cost-effective thanmobile scanning systems currentlyavailable in the market.
DDoo yyoouu tthhiinnkk tthheerree iiss llaacckk ooffaawwaarreenneessss aabboouutt tthhee uussee ooff llaasseerrssccaannnneerrss iinn tthhee AAssiiaann mmaarrkkeett??WWhhaatt iiss FFAARROO''ss ssttrraatteeggyy ttoo ccrreeaatteemmoorree aawwaarreenneessss??
There are a multitude of applica-tions for laser scanners, some morewidely known than others. Currently,the more common ones includearchitecture, building informationmodelling (BIM), civil engineering,forensic science, heritage preserva-tion and surveying. However, thereare still many unexplored areas inwhich a laser scanner can be veryuseful.
Other than that, we find thatthere is a lack of laser scanningservice providers in Asia. Filling thisgap can potentially help more com-panies achieve desirable outcomesthat were previously unattainable,
“
INTERVIEW
Geospatial World II August 201246
WWee aarree cchhaannggiinngg ppeerrcceeppttiioonnss aabboouutt llaasseerrssccaannnniinngg
”
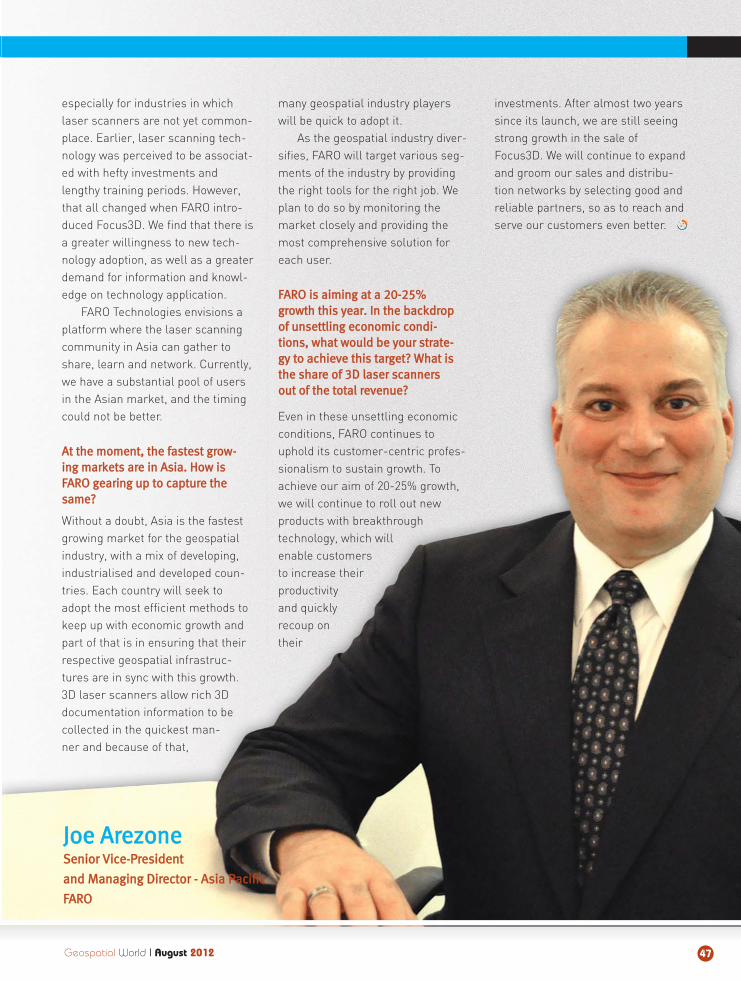
especially for industries in whichlaser scanners are not yet common-place. Earlier, laser scanning tech-nology was perceived to be associat-ed with hefty investments andlengthy training periods. However,that all changed when FARO intro-duced Focus3D. We find that there isa greater willingness to new tech-nology adoption, as well as a greaterdemand for information and knowl-edge on technology application.
FARO Technologies envisions aplatform where the laser scanningcommunity in Asia can gather toshare, learn and network. Currently,we have a substantial pool of usersin the Asian market, and the timingcould not be better.
AAtt tthhee mmoommeenntt,, tthhee ffaasstteesstt ggrrooww--iinngg mmaarrkkeettss aarree iinn AAssiiaa.. HHooww iissFFAARROO ggeeaarriinngg uupp ttoo ccaappttuurree tthheessaammee??
Without a doubt, Asia is the fastestgrowing market for the geospatialindustry, with a mix of developing,industrialised and developed coun-tries. Each country will seek toadopt the most efficient methods tokeep up with economic growth andpart of that is in ensuring that theirrespective geospatial infrastruc-tures are in sync with this growth.3D laser scanners allow rich 3Ddocumentation information to becollected in the quickest man-ner and because of that,
many geospatial industry playerswill be quick to adopt it.
As the geospatial industry diver-sifies, FARO will target various seg-ments of the industry by providingthe right tools for the right job. Weplan to do so by monitoring themarket closely and providing themost comprehensive solution foreach user.
FFAARROO iiss aaiimmiinngg aatt aa 2200--2255%%ggrroowwtthh tthhiiss yyeeaarr.. IInn tthhee bbaacckkddrrooppooff uunnsseettttlliinngg eeccoonnoommiicc ccoonnddii--ttiioonnss,, wwhhaatt wwoouulldd bbee yyoouurr ssttrraattee--ggyy ttoo aacchhiieevvee tthhiiss ttaarrggeett?? WWhhaatt iisstthhee sshhaarree ooff 33DD llaasseerr ssccaannnneerrssoouutt ooff tthhee ttoottaall rreevveennuuee??
Even in these unsettling economicconditions, FARO continues touphold its customer-centric profes-sionalism to sustain growth. Toachieve our aim of 20-25% growth,we will continue to roll out newproducts with breakthroughtechnology, which willenable customersto increase theirproductivityand quicklyrecoup ontheir
investments. After almost two yearssince its launch, we are still seeingstrong growth in the sale ofFocus3D. We will continue to expandand groom our sales and distribu-tion networks by selecting good andreliable partners, so as to reach andserve our customers even better.
Geospatial World II August 2012 47
rr
JJooee AArreezzoonneeSSeenniioorr VViiccee--PPrreessiiddeenntt
aanndd MMaannaaggiinngg DDiirreeccttoorr -- AAssiiaa PPaacciiffiicc
FFAARROO
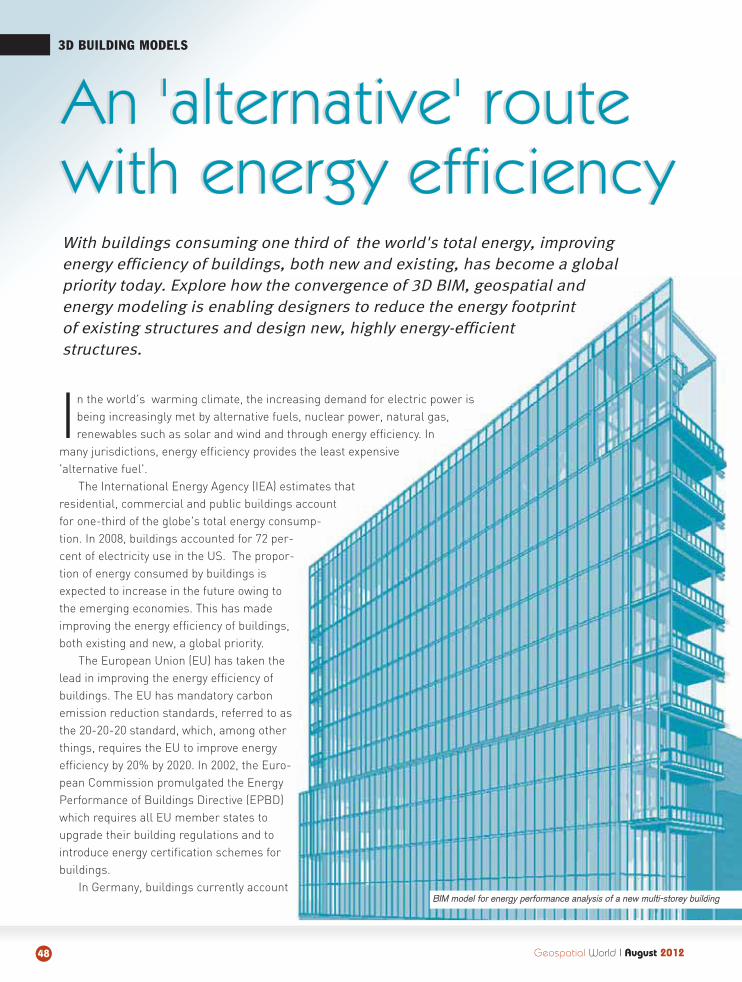
3D BUILDING MODELS
With buildings consuming one third of the world's total energy, improving energy efficiency of buildings, both new and existing, has become a global priority today. Explore how the convergence of 3D BIM, geospatial and energy modeling is enabling designers to reduce the energy footprint of existing structures and design new, highly energy-efficient structures.
An 'alternative' route
with energy efficiency
An 'alternative' route
with energy efficiency
In the world's warming climate, the increasing demand for electric power isbeing increasingly met by alternative fuels, nuclear power, natural gas,renewables such as solar and wind and through energy efficiency. In
many jurisdictions, energy efficiency provides the least expensive'alternative fuel'.
The International Energy Agency (IEA) estimates thatresidential, commercial and public buildings accountfor one-third of the globe's total energy consump-tion. In 2008, buildings accounted for 72 per-cent of electricity use in the US. The propor-tion of energy consumed by buildings isexpected to increase in the future owing tothe emerging economies. This has madeimproving the energy efficiency of buildings,both existing and new, a global priority.
The European Union (EU) has taken thelead in improving the energy efficiency ofbuildings. The EU has mandatory carbonemission reduction standards, referred to asthe 20-20-20 standard, which, among otherthings, requires the EU to improve energyefficiency by 20% by 2020. In 2002, the Euro-pean Commission promulgated the EnergyPerformance of Buildings Directive (EPBD)which requires all EU member states toupgrade their building regulations and tointroduce energy certification schemes forbuildings.
In Germany, buildings currently account
48 Geospatial World I August 2012
BIM model for energy performance analysis of a new multi-storey building
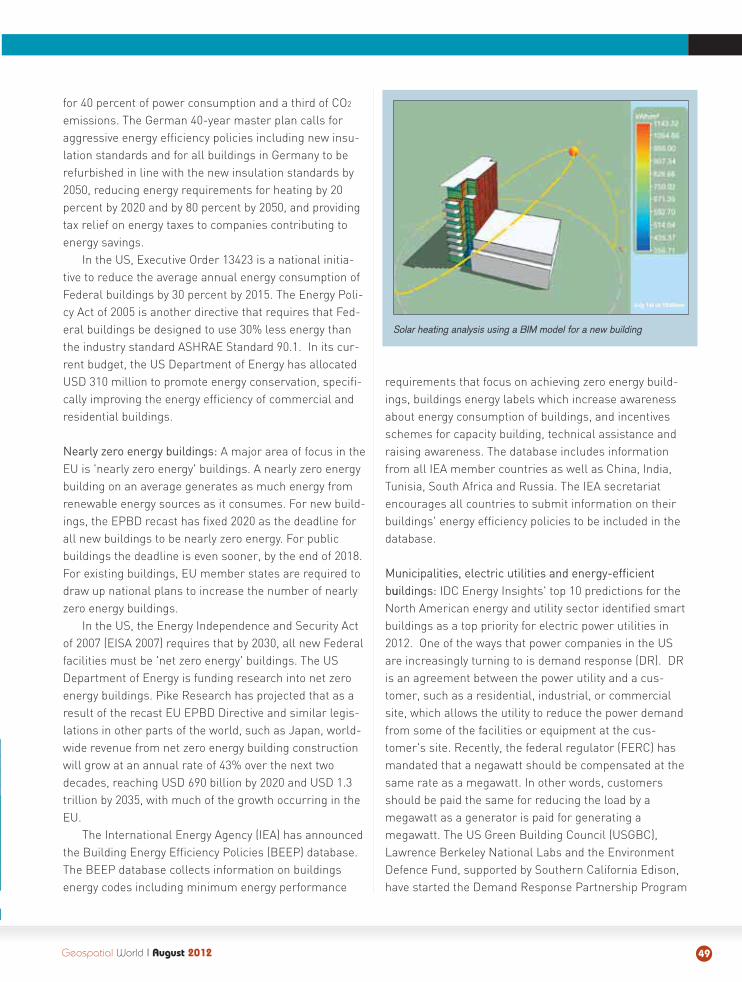
for 40 percent of power consumption and a third of CO2
emissions. The German 40-year master plan calls foraggressive energy efficiency policies including new insu-lation standards and for all buildings in Germany to berefurbished in line with the new insulation standards by2050, reducing energy requirements for heating by 20percent by 2020 and by 80 percent by 2050, and providingtax relief on energy taxes to companies contributing toenergy savings.
In the US, Executive Order 13423 is a national initia-tive to reduce the average annual energy consumption ofFederal buildings by 30 percent by 2015. The Energy Poli-cy Act of 2005 is another directive that requires that Fed-eral buildings be designed to use 30% less energy thanthe industry standard ASHRAE Standard 90.1. In its cur-rent budget, the US Department of Energy has allocatedUSD 310 million to promote energy conservation, specifi-cally improving the energy efficiency of commercial andresidential buildings.
Nearly zero energy buildings: A major area of focus in theEU is 'nearly zero energy' buildings. A nearly zero energybuilding on an average generates as much energy fromrenewable energy sources as it consumes. For new build-ings, the EPBD recast has fixed 2020 as the deadline forall new buildings to be nearly zero energy. For publicbuildings the deadline is even sooner, by the end of 2018.For existing buildings, EU member states are required todraw up national plans to increase the number of nearlyzero energy buildings.
In the US, the Energy Independence and Security Actof 2007 (EISA 2007) requires that by 2030, all new Federalfacilities must be 'net zero energy' buildings. The USDepartment of Energy is funding research into net zeroenergy buildings. Pike Research has projected that as aresult of the recast EU EPBD Directive and similar legis-lations in other parts of the world, such as Japan, world-wide revenue from net zero energy building constructionwill grow at an annual rate of 43% over the next twodecades, reaching USD 690 billion by 2020 and USD 1.3trillion by 2035, with much of the growth occurring in theEU.
The International Energy Agency (IEA) has announcedthe Building Energy Efficiency Policies (BEEP) database.The BEEP database collects information on buildingsenergy codes including minimum energy performance
requirements that focus on achieving zero energy build-ings, buildings energy labels which increase awarenessabout energy consumption of buildings, and incentivesschemes for capacity building, technical assistance andraising awareness. The database includes informationfrom all IEA member countries as well as China, India,Tunisia, South Africa and Russia. The IEA secretariatencourages all countries to submit information on theirbuildings' energy efficiency policies to be included in thedatabase.
Municipalities, electric utilities and energy-efficientbuuildings: IDC Energy Insights' top 10 predictions for theNorth American energy and utility sector identified smartbuildings as a top priority for electric power utilities in2012. One of the ways that power companies in the USare increasingly turning to is demand response (DR). DRis an agreement between the power utility and a cus-tomer, such as a residential, industrial, or commercialsite, which allows the utility to reduce the power demandfrom some of the facilities or equipment at the cus-tomer's site. Recently, the federal regulator (FERC) hasmandated that a negawatt should be compensated at thesame rate as a megawatt. In other words, customersshould be paid the same for reducing the load by amegawatt as a generator is paid for generating amegawatt. The US Green Building Council (USGBC),Lawrence Berkeley National Labs and the EnvironmentDefence Fund, supported by Southern California Edison,have started the Demand Response Partnership Program
Geospatial World I August 2012 49
Solar heating analysis using a BIM model for a new building
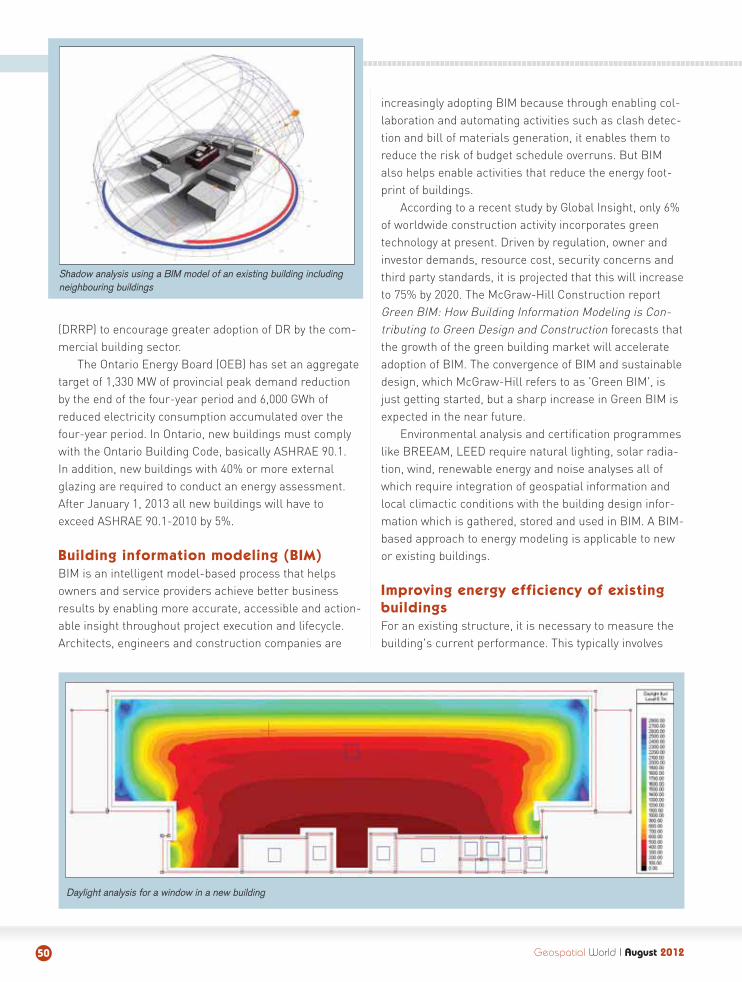
(DRRP) to encourage greater adoption of DR by the com-mercial building sector.
The Ontario Energy Board (OEB) has set an aggregatetarget of 1,330 MW of provincial peak demand reductionby the end of the four-year period and 6,000 GWh ofreduced electricity consumption accumulated over thefour-year period. In Ontario, new buildings must complywith the Ontario Building Code, basically ASHRAE 90.1.In addition, new buildings with 40% or more externalglazing are required to conduct an energy assessment.After January 1, 2013 all new buildings will have toexceed ASHRAE 90.1-2010 by 5%.
Building information modeling (BIM)
BIM is an intelligent model-based process that helpsowners and service providers achieve better businessresults by enabling more accurate, accessible and action-able insight throughout project execution and lifecycle.Architects, engineers and construction companies are
increasingly adopting BIM because through enabling col-laboration and automating activities such as clash detec-tion and bill of materials generation, it enables them toreduce the risk of budget schedule overruns. But BIMalso helps enable activities that reduce the energy foot-print of buildings.
According to a recent study by Global Insight, only 6%of worldwide construction activity incorporates greentechnology at present. Driven by regulation, owner andinvestor demands, resource cost, security concerns andthird party standards, it is projected that this will increaseto 75% by 2020. The McGraw-Hill Construction reportGreen BIM: How Building Information Modeling is Con-tributing to Green Design and Construction forecasts thatthe growth of the green building market will accelerateadoption of BIM. The convergence of BIM and sustainabledesign, which McGraw-Hill refers to as 'Green BIM', isjust getting started, but a sharp increase in Green BIM isexpected in the near future.
Environmental analysis and certification programmeslike BREEAM, LEED require natural lighting, solar radia-tion, wind, renewable energy and noise analyses all ofwhich require integration of geospatial information andlocal climactic conditions with the building design infor-mation which is gathered, stored and used in BIM. A BIM-based approach to energy modeling is applicable to newor existing buildings.
Improving energy efficiency of existing
buildings
For an existing structure, it is necessary to measure thebuilding's current performance. This typically involves
Geospatial World I August 201250
Shadow analysis using a BIM model of an existing building includingneighbouring buildings
Daylight analysis for a window in a new building
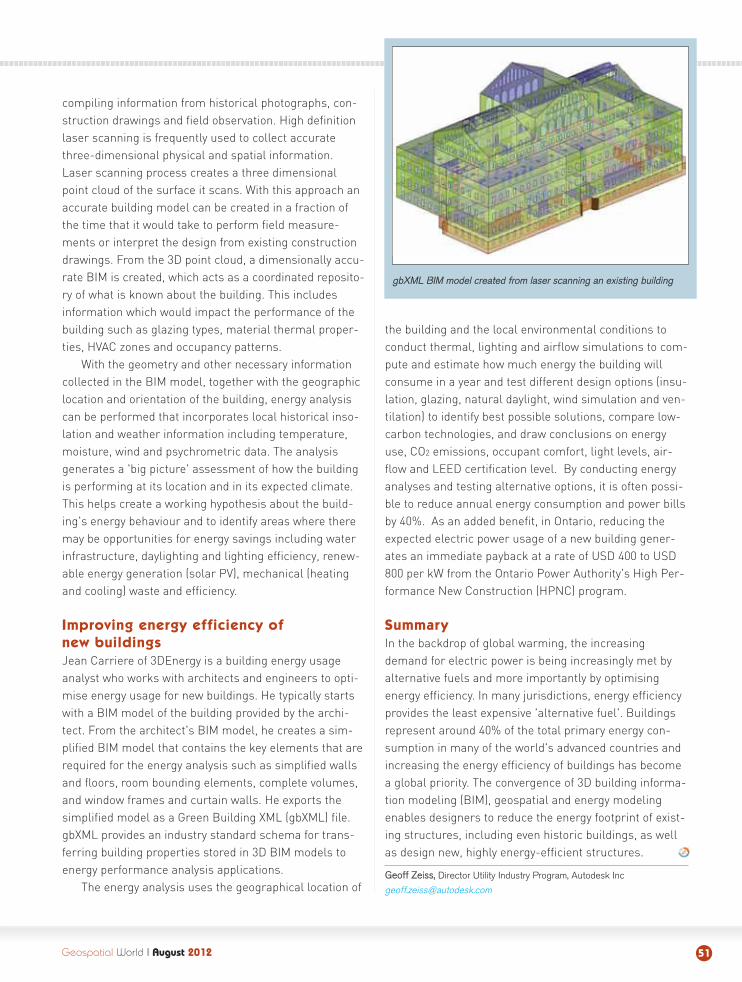
compiling information from historical photographs, con-struction drawings and field observation. High definitionlaser scanning is frequently used to collect accuratethree-dimensional physical and spatial information.Laser scanning process creates a three dimensionalpoint cloud of the surface it scans. With this approach anaccurate building model can be created in a fraction ofthe time that it would take to perform field measure-ments or interpret the design from existing constructiondrawings. From the 3D point cloud, a dimensionally accu-rate BIM is created, which acts as a coordinated reposito-ry of what is known about the building. This includesinformation which would impact the performance of thebuilding such as glazing types, material thermal proper-ties, HVAC zones and occupancy patterns.
With the geometry and other necessary informationcollected in the BIM model, together with the geographiclocation and orientation of the building, energy analysiscan be performed that incorporates local historical inso-lation and weather information including temperature,moisture, wind and psychrometric data. The analysisgenerates a 'big picture' assessment of how the buildingis performing at its location and in its expected climate.This helps create a working hypothesis about the build-ing's energy behaviour and to identify areas where theremay be opportunities for energy savings including waterinfrastructure, daylighting and lighting efficiency, renew-able energy generation (solar PV), mechanical (heatingand cooling) waste and efficiency.
Improving energy efficiency of
new buildings
Jean Carriere of 3DEnergy is a building energy usageanalyst who works with architects and engineers to opti-mise energy usage for new buildings. He typically startswith a BIM model of the building provided by the archi-tect. From the architect's BIM model, he creates a sim-plified BIM model that contains the key elements that arerequired for the energy analysis such as simplified wallsand floors, room bounding elements, complete volumes,and window frames and curtain walls. He exports thesimplified model as a Green Building XML (gbXML) file.gbXML provides an industry standard schema for trans-ferring building properties stored in 3D BIM models toenergy performance analysis applications.
The energy analysis uses the geographical location of
the building and the local environmental conditions toconduct thermal, lighting and airflow simulations to com-pute and estimate how much energy the building willconsume in a year and test different design options (insu-lation, glazing, natural daylight, wind simulation and ven-tilation) to identify best possible solutions, compare low-carbon technologies, and draw conclusions on energyuse, CO2 emissions, occupant comfort, light levels, air-flow and LEED certification level. By conducting energyanalyses and testing alternative options, it is often possi-ble to reduce annual energy consumption and power billsby 40%. As an added benefit, in Ontario, reducing theexpected electric power usage of a new building gener-ates an immediate payback at a rate of USD 400 to USD800 per kW from the Ontario Power Authority's High Per-formance New Construction (HPNC) program.
Summary
In the backdrop of global warming, the increasingdemand for electric power is being increasingly met byalternative fuels and more importantly by optimisingenergy efficiency. In many jurisdictions, energy efficiencyprovides the least expensive 'alternative fuel'. Buildingsrepresent around 40% of the total primary energy con-sumption in many of the world's advanced countries andincreasing the energy efficiency of buildings has becomea global priority. The convergence of 3D building informa-tion modeling (BIM), geospatial and energy modelingenables designers to reduce the energy footprint of exist-ing structures, including even historic buildings, as wellas design new, highly energy-efficient structures.
Geoff Zeiss, Director Utility Industry Program, Autodesk Inc
Geospatial World I August 2012 51
gbXML BIM model created from laser scanning an existing building
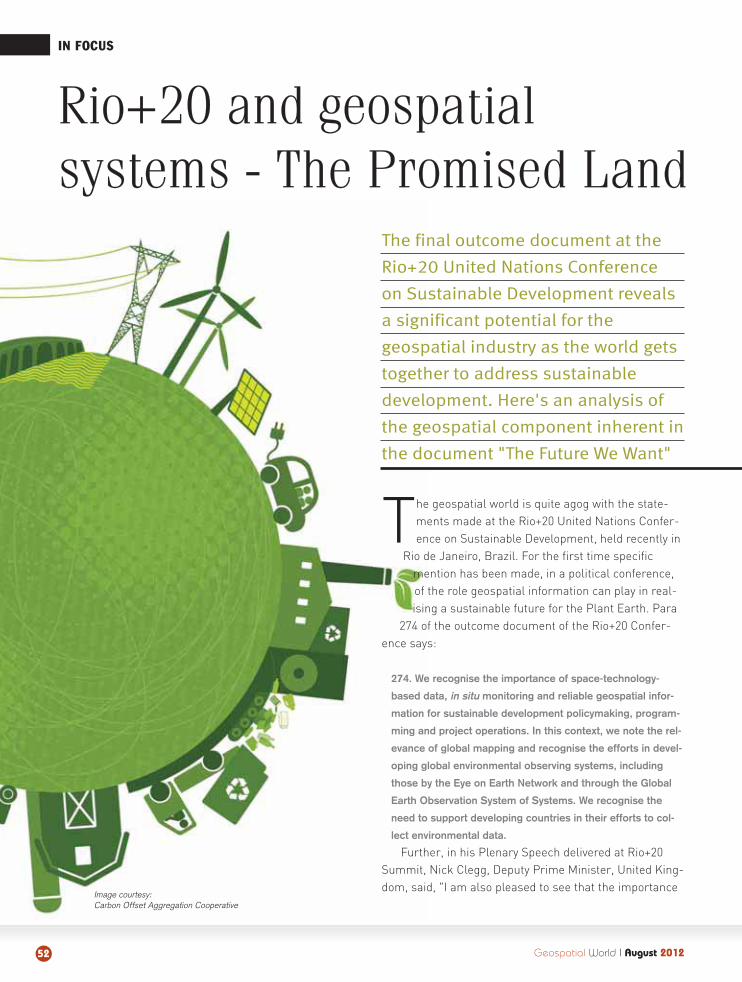
Geospatial World I August 201252
IN FOCUS
The final outcome document at the
Rio+20 United Nations Conference
on Sustainable Development reveals
a significant potential for the
geospatial industry as the world gets
together to address sustainable
development. Here's an analysis of
the geospatial component inherent in
the document "The Future We Want"
Rio+20 and geospatialsystems - The Promised Land
The geospatial world is quite agog with the state-ments made at the Rio+20 United Nations Confer-ence on Sustainable Development, held recently in
Rio de Janeiro, Brazil. For the first time specificmention has been made, in a political conference,of the role geospatial information can play in real-ising a sustainable future for the Plant Earth. Para
274 of the outcome document of the Rio+20 Confer-ence says:
274. We recognise the importance of space-technology-
based data, in situ monitoring and reliable geospatial infor-
mation for sustainable development policymaking, program-
ming and project operations. In this context, we note the rel-
evance of global mapping and recognise the efforts in devel-
oping global environmental observing systems, including
those by the Eye on Earth Network and through the Global
Earth Observation System of Systems. We recognise the
need to support developing countries in their efforts to col-
lect environmental data.
Further, in his Plenary Speech delivered at Rio+20Summit, Nick Clegg, Deputy Prime Minister, United King-dom, said, "I am also pleased to see that the importance
Image courtesy: Carbon Offset Aggregation Cooperative
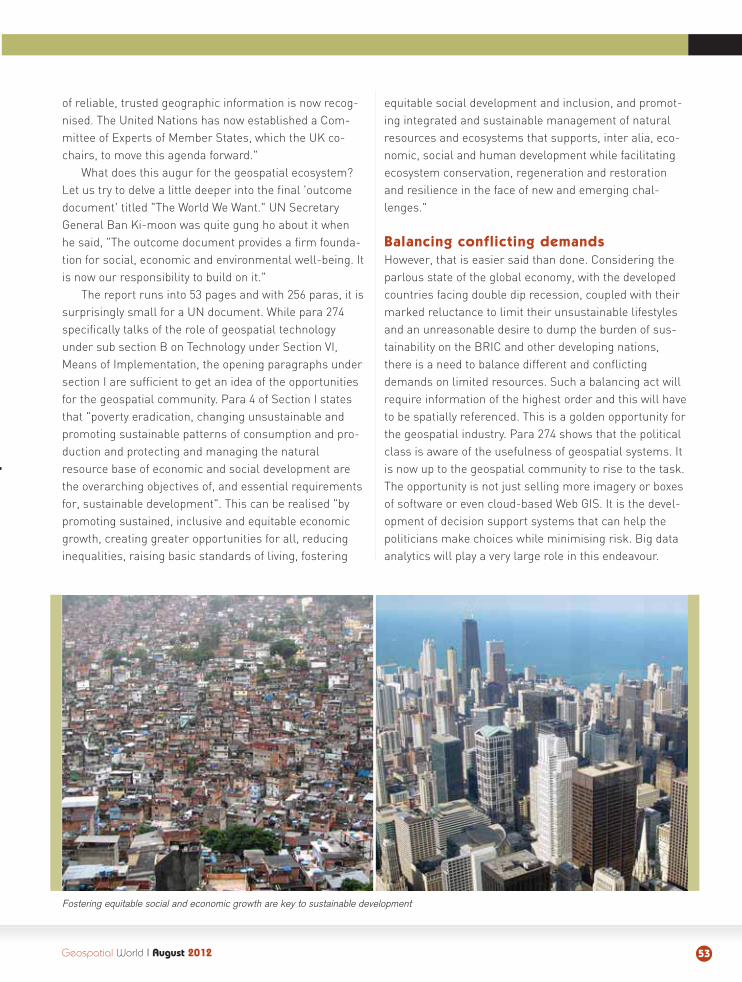
of reliable, trusted geographic information is now recog-nised. The United Nations has now established a Com-mittee of Experts of Member States, which the UK co-chairs, to move this agenda forward."
What does this augur for the geospatial ecosystem?Let us try to delve a little deeper into the final 'outcomedocument' titled "The World We Want." UN SecretaryGeneral Ban Ki-moon was quite gung ho about it whenhe said, "The outcome document provides a firm founda-tion for social, economic and environmental well-being. Itis now our responsibility to build on it."
The report runs into 53 pages and with 256 paras, it issurprisingly small for a UN document. While para 274specifically talks of the role of geospatial technologyunder sub section B on Technology under Section VI,Means of Implementation, the opening paragraphs undersection I are sufficient to get an idea of the opportunitiesfor the geospatial community. Para 4 of Section I statesthat "poverty eradication, changing unsustainable andpromoting sustainable patterns of consumption and pro-duction and protecting and managing the naturalresource base of economic and social development arethe overarching objectives of, and essential requirementsfor, sustainable development". This can be realised "bypromoting sustained, inclusive and equitable economicgrowth, creating greater opportunities for all, reducinginequalities, raising basic standards of living, fostering
equitable social development and inclusion, and promot-ing integrated and sustainable management of naturalresources and ecosystems that supports, inter alia, eco-nomic, social and human development while facilitatingecosystem conservation, regeneration and restorationand resilience in the face of new and emerging chal-lenges."
Balancing conflicting demands
However, that is easier said than done. Considering theparlous state of the global economy, with the developedcountries facing double dip recession, coupled with theirmarked reluctance to limit their unsustainable lifestylesand an unreasonable desire to dump the burden of sus-tainability on the BRIC and other developing nations,there is a need to balance different and conflictingdemands on limited resources. Such a balancing act willrequire information of the highest order and this will haveto be spatially referenced. This is a golden opportunity forthe geospatial industry. Para 274 shows that the politicalclass is aware of the usefulness of geospatial systems. Itis now up to the geospatial community to rise to the task.The opportunity is not just selling more imagery or boxesof software or even cloud-based Web GIS. It is the devel-opment of decision support systems that can help thepoliticians make choices while minimising risk. Big dataanalytics will play a very large role in this endeavour.
Geospatial World I August 2012 53
Fostering equitable social and economic growth are key to sustainable development
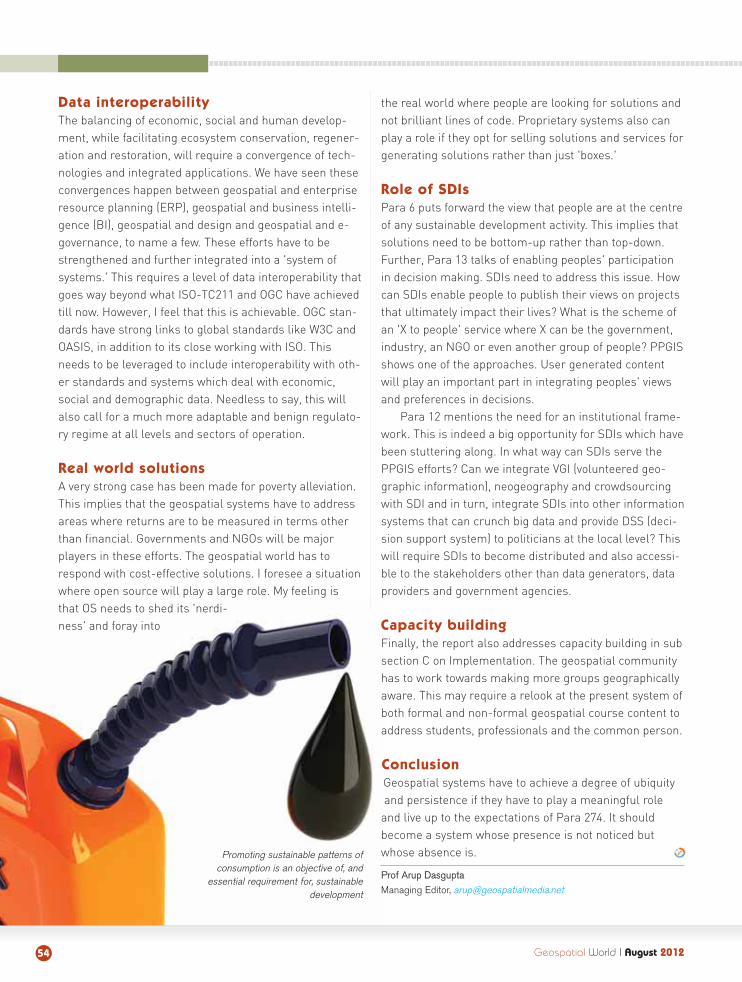
Data interoperability
The balancing of economic, social and human develop-ment, while facilitating ecosystem conservation, regener-ation and restoration, will require a convergence of tech-nologies and integrated applications. We have seen theseconvergences happen between geospatial and enterpriseresource planning (ERP), geospatial and business intelli-gence (BI), geospatial and design and geospatial and e-governance, to name a few. These efforts have to bestrengthened and further integrated into a 'system ofsystems.' This requires a level of data interoperability thatgoes way beyond what ISO-TC211 and OGC have achievedtill now. However, I feel that this is achievable. OGC stan-dards have strong links to global standards like W3C andOASIS, in addition to its close working with ISO. Thisneeds to be leveraged to include interoperability with oth-er standards and systems which deal with economic,social and demographic data. Needless to say, this willalso call for a much more adaptable and benign regulato-ry regime at all levels and sectors of operation.
Real world solutions
A very strong case has been made for poverty alleviation.This implies that the geospatial systems have to addressareas where returns are to be measured in terms otherthan financial. Governments and NGOs will be majorplayers in these efforts. The geospatial world has torespond with cost-effective solutions. I foresee a situationwhere open source will play a large role. My feeling isthat OS needs to shed its 'nerdi-ness' and foray into
the real world where people are looking for solutions andnot brilliant lines of code. Proprietary systems also canplay a role if they opt for selling solutions and services forgenerating solutions rather than just 'boxes.'
Role of SDIs
Para 6 puts forward the view that people are at the centreof any sustainable development activity. This implies thatsolutions need to be bottom-up rather than top-down.Further, Para 13 talks of enabling peoples' participationin decision making. SDIs need to address this issue. Howcan SDIs enable people to publish their views on projectsthat ultimately impact their lives? What is the scheme ofan 'X to people' service where X can be the government,industry, an NGO or even another group of people? PPGISshows one of the approaches. User generated contentwill play an important part in integrating peoples' viewsand preferences in decisions.
Para 12 mentions the need for an institutional frame-work. This is indeed a big opportunity for SDIs which havebeen stuttering along. In what way can SDIs serve thePPGIS efforts? Can we integrate VGI (volunteered geo-graphic information), neogeography and crowdsourcingwith SDI and in turn, integrate SDIs into other informationsystems that can crunch big data and provide DSS (deci-sion support system) to politicians at the local level? Thiswill require SDIs to become distributed and also accessi-ble to the stakeholders other than data generators, dataproviders and government agencies.
Capacity building
Finally, the report also addresses capacity building in subsection C on Implementation. The geospatial communityhas to work towards making more groups geographicallyaware. This may require a relook at the present system ofboth formal and non-formal geospatial course content toaddress students, professionals and the common person.
Conclusion
Geospatial systems have to achieve a degree of ubiquityand persistence if they have to play a meaningful role
and live up to the expectations of Para 274. It shouldbecome a system whose presence is not noticed butwhose absence is.
Prof Arup Dasgupta
Managing Editor, [email protected]
Geospatial World I August 201254
Promoting sustainable patterns of consumption is an objective of, and
essential requirement for, sustainabledevelopment
THE 3D GIS FOR INFRASTRUCTURE – EXPERIENCE THE POWER OF BENTLEY MAPGIS is going 3D and the benefits are enormous. With Bentley Map, you’ll gain the additional advantage of a GIS that’s both intrinsically 3D and optimized for the rigorous demands of sustain-ing infrastructure. Bentley Map supports 3D objects in Oracle Spatial natively, has smart 3D object editing tools, and executes advanced 3D spatial analyses as well as standard 2D routines.
Bentley Map is the choice of infrastructure professionals around the globe. It has all the power of MicroStation to make workflows efficient, and includes innovative and comprehensive map finish-ing functions as well as advanced parcel management functionality.
Featuring an extended API, the latest version of Bentley Map is optimized for developers and enterprise deployments alike. It comes in three editions to meet a range of user needs – from light editing and review, to 2D and 3D spatial information creation and analysis, to advanced raster image management and long transactions using Oracle Spatial.
To find out how Bentley Map is advancing GIS for infrastructure, visit www.Bentley.com/Map/GW or call +91-11-4902 1100.
© 2011 Bentley Systems, Incorporated. Bentley, the “B” Bentley logo, Bentley Map, and MicroStation are either registered or unregistered trademarks or service marks of Bentley Systems, Incorporated or one of its direct or indirect wholly owned subsidiaries. Other brands and product names are trademarks of their respective owners.
www.Bentley.com/Map/GW
ADVANCING GIS FOR INFRASTRUCTURE
CHECK OUT THE NEWBENTLEY MAP EDITIONS
Data courtesy City of Quebec
11 11
Submit Abstracts before 15TH OCT 2012
GEOSPATIALPLATFORM
If is your passion, then this is your
SHARE LEARN NETWORK
THEME
Monetising Geospatial Value and Practices
www.geospatialworldforum.org
13-16 MAY, 2013
Beurs-World Trade CenterRotterdam, The Netherlands