Embed Size (px)
Citation preview
Inputs of Phosphorus to Aquatic Systems from Machine
Dishwashing Detergents: An Analysis of Measured and
Potential Loading
Inputs of Phosphorus to Aquatic Systems from Machine Dishwashing Detergents: An Analysis of Measured and Potential
Loading
Prepared for the Soap and Detergent Association
1500 K Street NW, Suite 300 Washington, DC 20005
Prepared by
Water Resources Group 11 Phelps Way
P O Box 506 Willington CT 06279-0506
August 2003
CONTENTS
EXECUTIVE SUMMARY ..................................................................................................................... i
1.0 INTRODUCTION........................................................................................................................ 1-1
2.0 RELATIVE IMPORTANCE OF DETERGENT SOURCES TO ASSABET RIVER AND HOP BROOK................................................................................................................................... 2-1
2.1 Hop Brook......................................................................................................................... 2-1 2.1.1 Methodology .......................................................................................................... 2-1 2.1.2 Results................................................................................................................... 2-3 2.1.3 Discussion ............................................................................................................. 2-6
2.2 Assabet River ................................................................................................................... 2-7
3.0 RELATIVE IMPORTANCE OF DETERGENT SOURCES TO LAKE CHAMPLAIN.................. 3-1
4.0 OVERALL IMPORTANCE OF DETERGENT SOURCES TO MASSACHUSETTS LAKES............................................................................................................................................. 4-1
4.1 Measurement of Ground Water and Septic System Influence .......................................... 4-1
4.2 Effect of Laundry Detergent Phosphorus Ban and Implications for Dish Detergent.......... 4-3
5.0 IMPLICATIONS OF CHANGES IN PHOSPHORUS INPUTS FROM WASTEWATER TREATMENT FACILITIES AFTER PROHIBITION OF PHOSPHORUS IN LAUNDRY DETERGENT................................................................................................................................... 5-1
5.1 Background....................................................................................................................... 5-1
5.2 Massachusetts .................................................................................................................. 5-3
5.3 Implications for Dishwasher Detergent Bans .................................................................... 5-9
6.0 CONCLUSION........................................................................................................................... 6-1
7.0 REFERENCES........................................................................................................................... 7-1
LIST OF TABLES
Table 1. Total Estimated Phosphorus Load to each Impoundment of Hop Brook............................ 2-4
Table 2. Phosphorus Removal Assumptions Applied to Hop Brook................................................. 2-4
Table 3. Estimated Machine Dishwashing Detergent Phosphorus Load to Hop Brook Impoundments Applying Minimum Removal Parameters from Table 2. ..................... 2-5
Table 4. Estimated Machine Dishwashing Detergent Phosphorus Load to Hop Brook Impoundments Applying Maximum Removal Parameters from Table 2. .................... 2-5
Table 5. Total Phosphorus Load in the Assabet River Watershed. .................................................. 2-9
Table 6. Phosphorus Removal Assumptions Applied to the Assabet River. .................................... 2-9
Table 7. Phosphorus Concentrations in Discharges to the Assabet River ....................................... 2-9
Table 8. Detergent Phosphorus Load in the Assabet River Watershed. ........................................ 2-10
Table 9. Total Phosphorus Load to Lake Champlain (1991 Hydrologic Year), based on VT DEC and NY DEC (1997). .......................................................................................... 3-3
Table 10. Detergent Phosphorus Load to Lake Champlain with Minimum and Maximum Removal Assumptions from Table 2........................................................................... 3-4
Table 11. Phosphorus Contribution from Ground Water from Direct Measurements. ...................... 4-2
Table 12. Comparison of Pre- and Post-Ban (Laundry Detergent) Phosphorus Levels in Lakes for which Predictions were Made Before the Ban. ........................................... 4-5
Table 13. Comparison of Pre- and Post-Ban (Laundry Detergent) Phosphorus Levels in Lakes with Multiple Data Points Before and After the Ban. ........................................ 4-6
Table 14. Sources of Data for Comparisons in Table 13.................................................................. 4-7
Table 15. Reduction in Effluent Phosphorus for WWTFs Discharging in the Lake Champlain Basin, VT, Following Laundry Detergent P Ban and Treatment Upgrade................... 5-2
Table 16. Phosphorus Concentrations in Effluents of MA Wastewater Treatment Facilities during Months in which Phosphorus was Not Actively Being Removed. .................... 5-4
Table 17. Phosphorus Concentrations in Effluents of Massachusetts Wastewater Treatment ........ 5-5
Table 18. Phosphorus Loads in Effluents of Belchertown and Hudson Wastewater Treatment Facilities. ....................................................................................................................5-7
Table 29. Phosphorus Concentrations and Loads in Effluents of Massachusetts Wastewater Treatment Facilities with Active Phosphorus Removal, 1993-94 vs. 1996-1997. ....... 5-7
Table 20. Phosphorus Concentrations in Effluents of Massachusetts Wastewater Treatment Facilities with Active Phosphorus Removal, 1990-94 vs. 1996-2001.......................... 5-7
Table 21. Summary of Machine Dishwashing Detergent Phosphorus Contributions to Total Phosphorus Loads in Aquatic Environments and Potential for Reduction .................. 6-1
Page i August, 2003 Review of Potential Reduction in P Loading from Machine Dishwashing Detergents
EXECUTIVE SUMMARY
Four lines of investigation appear to converge on the same conclusion: Phosphorus inputs to lakes and streams in Massachusetts and Vermont from machine dishwashing detergent comprise a very small portion of the total load to those systems. Analysis of stream data from two intensive studies in Massachusetts, a phosphorus loading analysis for Lake Champlain in Vermont, assessment of the itemized loads to multiple New England lakes, and extrapolation of wastewater treatment facility responses to the reduction of phosphorus in laundry detergents all indicate that there are very limited contributions of phosphorus from dishwashing detergent sources and minimal potential to realize any significant reduction in loading from a ban on P in machine dishwashing detergent.
Overall, reductions in phosphorus achievable through restrictions in the amount of P in machine dishwashing detergents will not meaningfully reduce P concentrations and associated algal levels in Massachusetts or Vermont waters. The greatest reduction in P loading through restriction of P content of machine dishwashing detergent is associated with aquatic systems that are strongly influenced by WWTF discharges subjected to no active P removal. Such systems are rare in New England, and even with such restrictions these heavily impacted waters will fall far short of achieving water quality goals.
The range of P contribution from machine detergent for the cases analyzed in this report was 0.2 to 10% of total P load, with an estimated possible maximum of 17% for systems dominated by WWTFs practicing only primary treatment with no addition of chemicals for P removal. The potential for reducing the P load through restriction of P content of machine dishwashing detergent is limited to 0 to 7% in the cases studied, with estimates >2% associated with high loading from WWTFs applying no active P removal. Again, such systems are rare in New England and would not be detectably improved by reductions in machine dishwashing detergent P content. Load reductions of <2% that might be achieved by a machine dishwashing detergent P ban in areas served by septic systems or WWTFs with active P removal would also not result in any significant reduction in P load or concentration in the associated aquatic system.
Page 1-1 August, 2003 Review of Potential Reduction in P Loading from Machine Dishwashing Detergents
1.0 INTRODUCTION
The overall objective of this project is to assess the portion of phosphorus (P) loading to water resources that can be attributed to machine dishwashing detergent origin, both in terms of resulting concentrations and magnitude of inputs relative to other sources. In this context, use of the term “detergent” should be taken to mean machine dishwashing detergents and related cleaning agents unless otherwise specified. Handwashing dish detergents do not contain phosphorus additives. Laundry detergents are no longer a significant factor in phosphorus loading to natural waters, as phosphorus was removed industry-wide in the 1990’s. This investigation was prompted by recent suggestions that a ban on phosphorus in all dish detergents would translate into a substantial reduction in phosphorus loading to streams and lakes. Although quantification of any such reduction is expected to be difficult, claims of any measurable reduction should be backed up by a rational analysis in which assumptions and calculations are clearly laid out. This effort is intended to provide such a rational analysis. Although this work has been sponsored by The Soap and Detergent Association, a trade organization for soap and detergent manufacturers, ENSR has been given free reign to evaluate the issue in any appropriate manner. Assumptions and calculations are intended to represent reality to the greatest extent possible and are intended to reflect maximum objectivity.
This project is divided into four avenues of investigation:
1. Use data from the Hop Brook and Assabet River studies (ENSR 2000 and 2001, respectively) to evaluate the actual and relative contribution of P from detergent sources. Detailed studies of these river systems in Massachusetts, each of which receives inputs from wastewater treatment facilities (WWTF) and on-site wastewater disposal (septic) systems (SS), have recently been completed and provide data that allow a fairly thorough analysis.
2. Use data from the Lake Champlain basin in Vermont to evaluate the actual and relative contribution of P from detergent sources. Extensive EPA-sponsored work in the Lake Champlain basin by environmental agencies and academic institutions in Vermont and New York over the last 10-15 years has generated a substantial database. Combined with data from Canada (Quebec), enough information is available to repeat the analysis performed under Task #1 for this large lake.
3. Use data from past diagnostic/feasibility studies performed in Massachusetts under MA Department of Environmental Protection (DEP) and/or MA Department of Environmental Management (DEM) sponsorship to evaluate the overall potential contribution of detergent P to lakes in Massachusetts. Some of these studies itemize loads to a degree that allows estimation of detergent P sources. Additionally, for
Page 1-2 August, 2003 Review of Potential Reduction in P Loading from Machine Dishwashing Detergents
lakes that have data for the time period both before and after phosphorus was drastically reduced in laundry detergent, it may be possible to estimate the load reduction achieved as a result and extrapolate it to machine dishwashing detergent.
4. Evaluate the potential impact of machine dishwashing detergent P reduction based on laundry detergent P reduction effects on the quality of effluent from WWTFs. The reduction in effluent P for WWTFs with and without targeted P removal has been evaluated in several states including MD, MI and VT. Additionally, WWTF discharge monitoring reports (DMR) provide data that can be used to compare effluent concentrations before and after 1994 reduction in P content in laundry detergents in MA. Estimation of the reduction in effluent P resulting from the laundry detergent P ban may be insightful, both in terms of evaluating the effectiveness of past alteration of detergent and the potential for future modifications to realize a measurable benefit.
Ultimately, these investigations are intended to facilitate a rational analysis of the potential benefit of modifying machine dishwashing detergents to include less P, as was done with laundry detergents previously.
Page 2-1 August, 2003 Review of Potential Reduction in P Loading from Machine Dishwashing Detergents
2.0 RELATIVE IMPORTANCE OF DETERGENT SOURCES TO ASSABET RIVER AND HOP BROOK
The potential contribution of dishwasher detergents to total phosphorus loads to two watersheds in Massachusetts was evaluated. ENSR has performed extensive field investigations and developed watershed models of Hop Brook and Assabet River, both located in the SuAsCo watershed, in eastern Massachusetts. Both watersheds consist of forested land, low to high density residential development, and some commercial/industrial development and agriculture. Land use in these watersheds is expected to be typical of that found in suburban New England.
Field data and model results were employed to estimate phosphorus loads in each basin. Detergent use was estimated based on population data and per capita detergent “consumption”. A population estimate for the USA was derived from 2000 census data, which provides a range of 281 to 288 million people. Per capita detergent phosphorus use was based on a published projection (SRI International 1999) of the quantity of phosphorus used to make machine dishwashing detergent annually (56,300 tons of P2O5, or 22,347,000 kg of P) in 2000. These estimates yield per capita consumption rates of 0.078 to 0.079 kg P/yr. A value of 0.078 kg P/capita/yr was applied in this evaluation. The relative magnitude of the total phosphorus load and the detergent phosphorus load were compared to assess the contribution of detergent to the overall load in each watershed. Methodology and results are presented below.
2.1 Hop Brook
The relative importance of detergent phosphorus load was assessed as a percentage of the total phosphorus load to the Hop Brook watershed system. Phosphorus data from the extensive Hop Brook Watershed Study (ENSR 2000) were used to estimate the total phosphorus load. Detergent phosphorus loading was estimated and the loads were compared. Where reliable data were not available to support a specific calculation, a range of rational values was applied in the calculation to provide a range of estimates.
2.1.1 Methodology
The Hop Brook watershed is divided into four sub-basins, each one draining into one of the four impoundments in the watershed. Each impoundment receives the load from the corresponding watershed, plus that from the impoundment located upstream of it. Based on extensive field efforts, ENSR had previously developed and calibrated a watershed model of estimated nutrient loads and in-stream concentrations for each of the four impoundments. Total estimated annual point source and non-point source P loads were extracted from the model and applied in the present estimate of P loading from the watershed (Table 1, based on ENSR 2000). The total load experienced by each impoundment reflects inputs from its
Page 2-2 August, 2003 Review of Potential Reduction in P Loading from Machine Dishwashing Detergents
entire watershed, including all upstream impoundments, and attenuation within the pond (incorporation into sediment). Note that the only point source, the Marlborough East WWTF, is just upstream of Hagar Pond and is therefore reflected as “upstream watershed” load in impoundments downstream of Hagar Pond.
Prior to estimating the detergent load in each basin, the population of each basin was estimated. Recent (2000) census data was obtained from MassGIS to obtain the population of each town in the watershed. The area of each town falling within each sub-basin was estimated from GIS maps, assuming an even spatial distribution of the population. Residential development is spread relatively evenly in these communities, making this assumption reasonable for the purposes of the present analysis. These population estimates were used to generate estimates of septic system inputs.
The Marlborough East WWTF, which discharges slightly upstream of Hagar Pond, receives inputs from about half of Marlborough, or about 18,000 people. All residences in the Hagar Pond sub-basin could be served by a sewer system, but it is assumed that 10% of those residences are served by septic systems, as there are some homes not hooked up in any given area. As some of the 18,000 people believed to be contributing to the sewer system may actually be served by septic systems, some inputs may be double counted in this analysis, causing an overestimate of detergent phosphorus inputs. The entire population of the other three sub-basins is assumed to be served by septic systems.
The total detergent use and load to the impoundments was then calculated. The total use was based on a per capita consumption of 0.078 kg/person/year of phosphorus, derived from Stanford Research Institute (1999). Not all homes will have dishwashers, but as the machine dishwashing detergent use estimate is on an average per capita basis, that will not affect this analysis. Removal before entry into the aquatic environment includes treatment processes at the WWTF, collection in septic tanks, and adsorption onto soil particles between leachfields and the receiving water. Phosphorus removal parameters are presented in Table 2. WWTF removal values are based on the average effluent concentration of about 440 ug/L (from monthly averages during 1996-2002, obtained from discharge monitoring reports filed with the USEPA) and an influent level that varies between 3000 and 6000 ug/L (3-6 mg/L).
Note that this WWTF practices chemical addition for coagulation/precipitation during primary and/or secondary treatment, controlling P in the effluent to meet the NPDES discharge permit. Consequently, elimination of P from machine dishwashing detergent may not actually reduce the P level in the effluent, since wastewater is treated to meet a set concentration, not to remove a percentage of the inputs. The current rate of removal was maintained for this initial analysis, however, then the analysis was repeated assuming no change in effluent concentration with elimination of detergent P in the WWTF influent.
Page 2-3 August, 2003 Review of Potential Reduction in P Loading from Machine Dishwashing Detergents
Septic system removal rates are based on approximations from a variety of MA DEP studies of septic systems and loading to lakes, and is a rather wide range to account for considerable uncertainty. Average distance of septic systems from receiving surface waters is based on the distribution of residences and streams or lakes in the watershed, and is also a wide range as a function of the failure of maps to show septic system locations and all surface drainage systems. Applying the range of values generated by these assumptions generates a set of estimated values that represents the range of possible phosphorus loading from dish detergent sources.
2.1.2 Results
The estimated detergent phosphorus loads, assuming a constant minimum phosphorus removal according to Table 2, are presented in Table 3. The corresponding detergent P load represents 8-10% of the total P load to the impoundments. The percentage of the total load comprised of detergent sources declines in the downstream direction because the WWTF load is dominant, enters upstream of Hagar Pond, and is attenuated in the downstream direction.
It would be incorrect, however, to assume that a ban on P in automatic dishwashing detergent would result in a P load reduction of 8-10% in this case. Treatment by the WWTF is adjusted to maintain the same effluent P level (no reduction of P from the WWTF with reduced influent P level). That is, treatment at the WWTF is simply adjusted to meet the permit limit and a lower removal percentage can be tolerated with a reduced influent concentration. Consequently, a reduction in the WWTF influent P level will not translate into a reduction in effluent P level; the detergent P input of 211 kg/yr might be eliminated, but no commensurate decrease in output from the WWTF would be expected.
Elimination of detergent P passing through septic systems might be reduced, but the reduction in the P load to these impoundments will be only 0-2% (Table 3), an amount equal to the septic system contribution. Septic system inputs are a minor component of the load, even assuming minimum treatment, which is why the reduction in detergent P load results in a much smaller decrease in total P load than if the WWTF contribution could actually be reduced.
If the maximum treatment parameters in Table 2 are assumed for the WWTF and septic systems, the detergent P load represents 2-5% of the total P load with WWTF removal percentage maintained (Table 4). This set of estimates is lower than the first estimate by at least 50%. Septic system inputs are negligible in this scenario. If there is no reduction in P concentration leaving the WWTF, as lesser treatment by the WWTF would be needed to meet effluent standards, there would be no measurable reduction in total P loading to the lakes despite the elimination of machine dishwashing detergent P under this scenario (Table 4). That is, despite eliminating a small source, there would be 0% reduction in the total load to Hop Brook.
Page 2-4 August, 2003 Review of Potential Reduction in P Loading from Machine Dishwashing Detergents
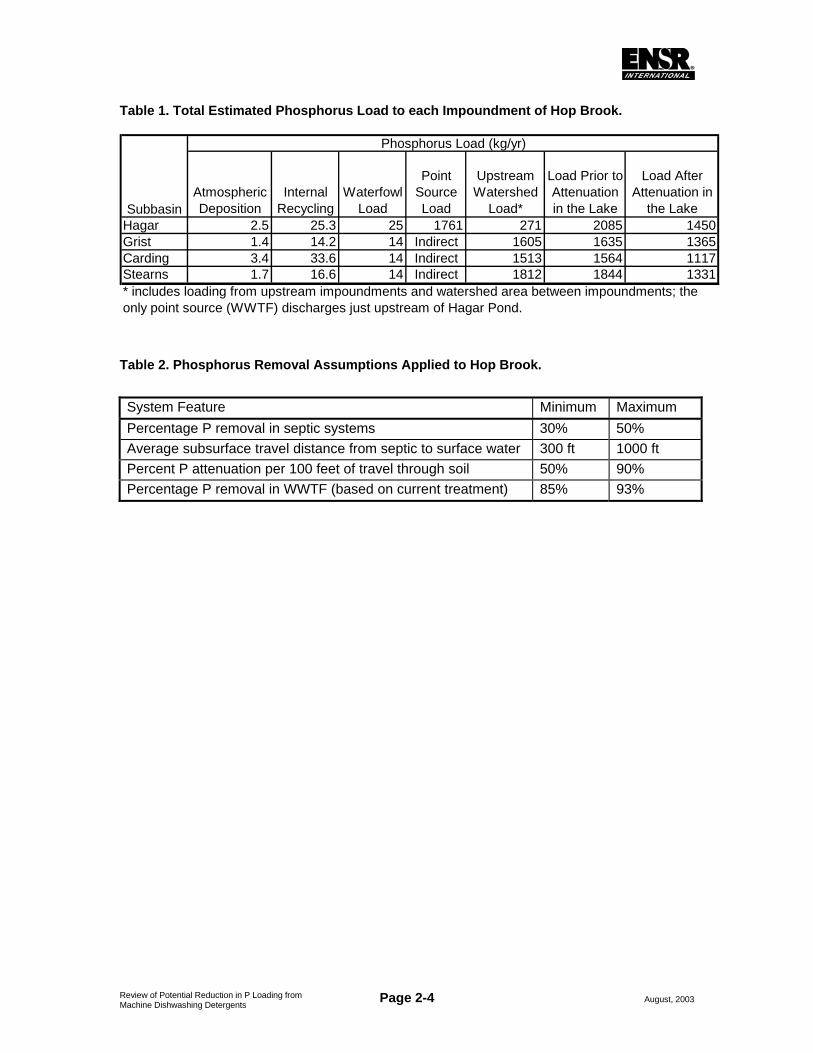
Table 1. Total Estimated Phosphorus Load to each Impoundment of Hop Brook.
Atmospheric Deposition
Internal Recycling
Waterfowl Load
Point Source Load
Upstream Watershed
Load*
Load Prior to Attenuation in the Lake
Load After Attenuation in
the LakeHagar 2.5 25.3 25 1761 271 2085 1450Grist 1.4 14.2 14 Indirect 1605 1635 1365Carding 3.4 33.6 14 Indirect 1513 1564 1117Stearns 1.7 16.6 14 Indirect 1812 1844 1331* includes loading from upstream impoundments and watershed area between impoundments; the only point source (WWTF) discharges just upstream of Hagar Pond.
Phosphorus Load (kg/yr)
Subbasin
Table 2. Phosphorus Removal Assumptions Applied to Hop Brook.
System Feature Minimum Maximum Percentage P removal in septic systems 30% 50% Average subsurface travel distance from septic to surface water 300 ft 1000 ft Percent P attenuation per 100 feet of travel through soil 50% 90% Percentage P removal in WWTF (based on current treatment) 85% 93%
Page 2-5 August, 2003 Review of Potential Reduction in P Loading from Machine Dishwashing Detergents
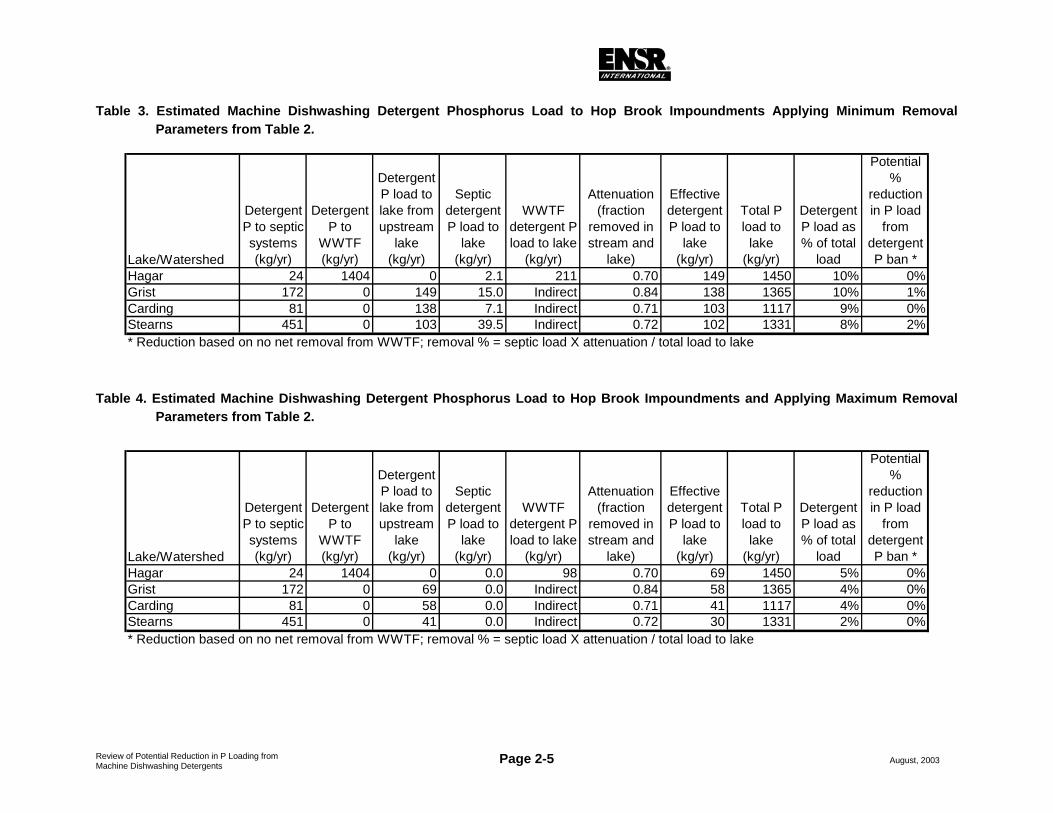
Table 3. Estimated Machine Dishwashing Detergent Phosphorus Load to Hop Brook Impoundments Applying Minimum Removal Parameters from Table 2.
Table 4. Estimated Machine Dishwashing Detergent Phosphorus Load to Hop Brook Impoundments and Applying Maximum Removal Parameters from Table 2.
Lake/Watershed
Detergent P to septic systems (kg/yr)
Detergent P to
WWTF (kg/yr)
Detergent P load to lake from upstream
lake (kg/yr)
Septic detergent P load to
lake (kg/yr)
WWTF detergent P load to lake
(kg/yr)
Attenuation (fraction
removed in stream and
lake)
Effective detergent P load to
lake (kg/yr)
Total P load to
lake (kg/yr)
Detergent P load as % of total
load
Potential %
reduction in P load
from detergent P ban *
Hagar 24 1404 0 2.1 211 0.70 149 1450 10% 0%Grist 172 0 149 15.0 Indirect 0.84 138 1365 10% 1%Carding 81 0 138 7.1 Indirect 0.71 103 1117 9% 0%Stearns 451 0 103 39.5 Indirect 0.72 102 1331 8% 2%* Reduction based on no net removal from WWTF; removal % = septic load X attenuation / total load to lake
Lake/Watershed
Detergent P to septic systems (kg/yr)
Detergent P to
WWTF (kg/yr)
Detergent P load to lake from upstream
lake (kg/yr)
Septic detergent P load to
lake (kg/yr)
WWTF detergent P load to lake
(kg/yr)
Attenuation (fraction
removed in stream and
lake)
Effective detergent P load to
lake (kg/yr)
Total P load to
lake (kg/yr)
Detergent P load as % of total
load
Potential %
reduction in P load
from detergent P ban *
Hagar 24 1404 0 0.0 98 0.70 69 1450 5% 0%Grist 172 0 69 0.0 Indirect 0.84 58 1365 4% 0%Carding 81 0 58 0.0 Indirect 0.71 41 1117 4% 0%Stearns 451 0 41 0.0 Indirect 0.72 30 1331 2% 0%* Reduction based on no net removal from WWTF; removal % = septic load X attenuation / total load to lake
Page 2-6 August, 2003 Review of Potential Reduction in P Loading from Machine Dishwashing Detergents
2.1.3 Discussion
The contribution of detergent P to the total P load in Hop Brook and its impoundments is small, ranging from 8-10% at minimum treatment and 2-5% at maximum treatment by the WWTF and septic systems. The methodology presented in this analysis provides an estimate of detergent P loading based on a range of possible assumptions about population, detergent usage and treatment of wastewater in the WWTF or septic systems. The results indicate that changing the values of the key variables over the plausible range of those values changes the estimated percent contribution substantially, but has little effect on the overall conclusion that automatic dishwashing detergent P constitutes a small part of the total P load to Hop Brook.
While a ban on P in automatic dishwashing detergents could eliminate this source, it will not reduce the total P load to Hop Brook significantly, as there is a P limit on the WWTF discharge that sets the targeted removal efficiency. The detergent P load entering these types of WWTFs will be reduced to the target P concentration, independent of incoming P level. Consequently, no significant reduction in P loading from the WWTF would be expected. The overall reduction in P loading to Hop Brook from an automatic dishwashing detergent P ban is expected to be a function of only any reduction in septic system inputs, at 0-2% of the total load to Hop Brook.
Current P loading to Hop Brook results in P concentrations of 101 to 244 ug/L in the four impoundments (ENSR 2000b). The desirable range for P in those impoundments is 10 to 24 ug/L, based on regional nutrient criteria currently in draft form (ENSR 2000e) and intended to prevent eutrophication. Assays performed as part of an ENSR (2000b) study suggested that a P concentration of 30 ug/L might be tolerated in these highly flushed impoundments, but that higher P levels will support dense algal growths. Consequently, a loading decrease of 0-2% is virtually meaningless in terms of improving algal conditions in this system. Even the entire automatic dishwashing detergent load, if it could be removed, would be of no consequence. Certainly every reduction is a step in the desirable direction, but it will take a major change in treatment technology or diversion of the WWTF effluent to approach the desirable level. Even removing all P from the WWTF effluent results in predicted P levels of 35 to 61 ug/L in the impoundments (ENSR 2000b), still well above the desirable range. A more reasonable but still difficult target range of 100 to 200 ug/L for the WWTF effluent yields downstream P levels of 71 to 134 ug/L (ENSR 2000b).
Approaching the desirable level of P in the Hop Brook system requires both a major change in WWTF technology (or diversion) and a large effort to control non-point source inputs from the watershed (additional to septic system inputs). The largest potential reduction by far will come from improved wastewater treatment at the WWTF, and a small reduction in P concentration or load in the influent to the WWTF is not expected to have a significant effect on treatment performance or effluent quality.
Page 2-7 August, 2003 Review of Potential Reduction in P Loading from Machine Dishwashing Detergents
2.2 Assabet River
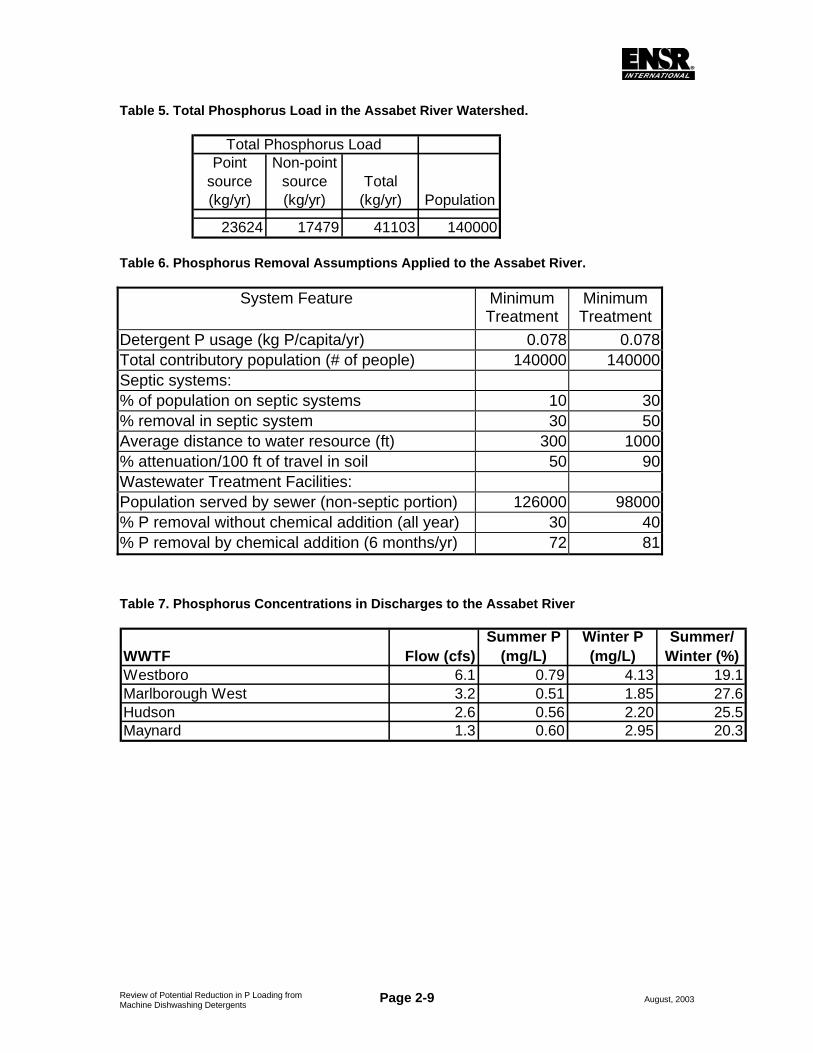
The impact of detergent P on the total P load from the Assabet River watershed was assessed. ENSR has conducted extensive field studies and developed and calibrated a detailed hydrologic and water quality model of the Assabet River watershed (ENSR 2001a, ENSR 2002). Based on this information, the total P load in the Assabet River system was estimated (Table 5). The overall load of P to the five studied impoundments of the Assabet River system is 41,103 kg/yr, of which 57% is from WWTFs (Table 5). The remaining 43% of the load comes from non-point sources, including urban runoff and septic systems.
This system is considerably more complex than Hop Brook, with multiple WWTFs. For this analysis, the river system was assessed as one watershed, as opposed to dividing the basin into several smaller sub-basins. Although P loads and concentrations may vary somewhat throughout the basin, this analysis provides a general overview of average P loads and the potential importance of machine dishwashing detergent load in the basin.
Detergent P use was estimated by the methodology described above for Hop Brook, with a few system-specific modifications (Table 8). The total population of the basin was estimated to be 140,000 (http://www.assabetriver.org/issues.html). There are four municipal WWTFs serving much of the population, but septic systems are still present in the watershed. A range of 10-30% of the population served by septic systems was applied. The four WWTFs that discharge to the study area have less effective treatment than the Marlborough East facility that discharges to Hop Brook, but currently all apply some level of chemical P removal during the April-October period (Table 9). This complicates calculation of phosphorus loading changes, as during 5 months of the year any change in influent features could affect effluent concentrations. During 7 months of the year there would be no expected change, as a result of treatment to a target P concentration rather than treatment for a target removal percentage. The average winter (November-March) P concentration in WWTF effluent ranges from 1.85 to 4.13 mg/L, reduced from expected influent levels of 3 to 6 mg/L by sedimentation in primary and secondary treatment systems without chemical addition. This suggests a P removal rate of 30-40%, typical of such treatment systems. The average summer (April-October) P concentration in WWTF effluent ranges from 0.51 to 0.79 mg/L as a function of chemical additions to precipitate and settle P before discharge. The proportion of summer to winter P levels is similar for each treatment plant, resulting in incrementally greater removal (due to chemical addition) of 72 to 81% (Tables 6 and 7) during April through October.
Table 8 provides a summary of the results of this analysis. Working toward the most accurate possible estimate for potential load reduction through a ban on P in automatic dishwashing detergents, it was assumed that a reduction in winter influent P level would result in a lower effluent concentration (% removal held constant), while a reduction in
Page 2-8 August, 2003 Review of Potential Reduction in P Loading from Machine Dishwashing Detergents
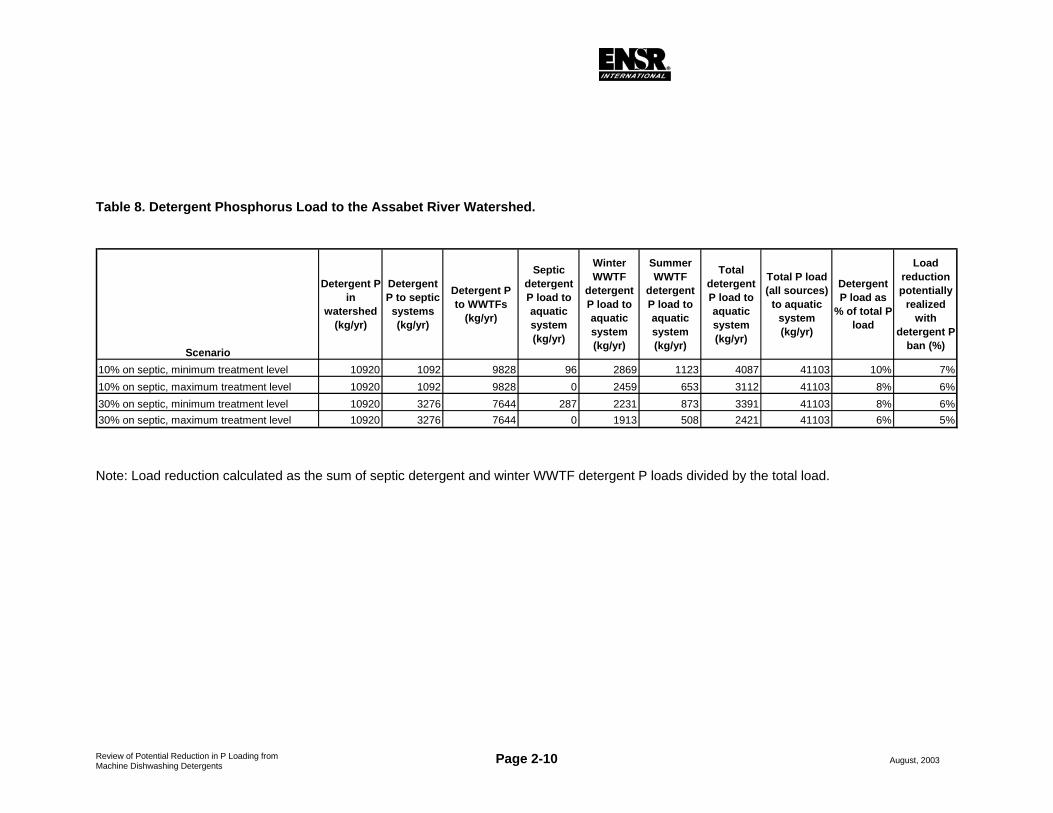
summer influent P concentration would have no effect on effluent concentration (discharge limit held constant). The range of estimates of the contribution of detergent P to the total P load to the Assabet River is 6 to 10%. However, as removing the input of detergent P from the influent during April through October will not change the effluent concentration during that time, the maximum load reduction that can be realized through such a ban would be 5 to 7%.
Nearly all of that reduction would occur in winter, while the algal problems targeted for control occur in summer. The impact of regulations that control the quality of influent to a WWTF is a function of both the timing of those inputs and the level of treatment performed by the WWTF.
This analysis also indicates that greater use of septic systems reduces detergent P loading. Removal of P by septic tanks, septic leachfields, and soil between the point of discharge and the point of entry to the river or an impoundment is fairly efficient for well sited, designed and constructed systems. Loading of detergent P to aquatic systems from WWTFs can be much greater than from septic systems, but total load will be more a function of treatment processes than the sources of P to the WWTF. The Assabet River represents one of the most wastewater dominated systems in Massachusetts, yet the potential reduction realized from a ban on P in automatic dishwashing detergent is no greater than 7%. For most watersheds the benefit would appear to be negligible.
Results are consistent with those obtained from the Hop Brook study. Detergent P is a small source for the Assabet River system, and is mostly delivered through the WWTFs. The greater potential reduction in P load that could be associated with a ban on P in automatic dishwashing detergent is a function of the lack of winter treatment of the effluent from the WWTFs discharging to the Assabet River. Phosphorus leaving WWTFs is largely determined by the level of treatment, not influent quality. Phosphorus levels in the Assabet River are very high, even higher than in Hop Brook, necessitating an even greater reduction in loading to reach a desirable level. Improvement of conditions in the river or its impoundments will require a major improvement in treatment effectiveness that is unlikely to be enhanced by the removal of such a small source.
Page 2-9 August, 2003 Review of Potential Reduction in P Loading from Machine Dishwashing Detergents
Table 5. Total Phosphorus Load in the Assabet River Watershed.
Point source (kg/yr)
Non-point source (kg/yr)
Total (kg/yr) Population
23624 17479 41103 140000
Total Phosphorus Load
Table 6. Phosphorus Removal Assumptions Applied to the Assabet River.
System Feature Minimum Treatment
Minimum Treatment
Detergent P usage (kg P/capita/yr) 0.078 0.078Total contributory population (# of people) 140000 140000Septic systems: % of population on septic systems 10 30% removal in septic system 30 50Average distance to water resource (ft) 300 1000% attenuation/100 ft of travel in soil 50 90Wastewater Treatment Facilities: Population served by sewer (non-septic portion) 126000 98000% P removal without chemical addition (all year) 30 40% P removal by chemical addition (6 months/yr) 72 81
Table 7. Phosphorus Concentrations in Discharges to the Assabet River
WWTF Flow (cfs)Summer P
(mg/L)Winter P (mg/L)
Summer/ Winter (%)
Westboro 6.1 0.79 4.13 19.1Marlborough West 3.2 0.51 1.85 27.6Hudson 2.6 0.56 2.20 25.5Maynard 1.3 0.60 2.95 20.3
Page 2-10 August, 2003 Review of Potential Reduction in P Loading from Machine Dishwashing Detergents
Table 8. Detergent Phosphorus Load to the Assabet River Watershed.
Note: Load reduction calculated as the sum of septic detergent and winter WWTF detergent P loads divided by the total load.
Scenario
Detergent P in
watershed (kg/yr)
Detergent P to septic systems (kg/yr)
Detergent P to WWTFs
(kg/yr)
Septic detergent P load to aquatic system (kg/yr)
Winter WWTF
detergent P load to aquatic system (kg/yr)
Summer WWTF
detergent P load to aquatic system (kg/yr)
Total detergent P load to aquatic system (kg/yr)
Total P load (all sources)
to aquatic system (kg/yr)
Detergent P load as
% of total P load
Load reduction potentially
realized with
detergent P ban (%)
10% on septic, minimum treatment level 10920 1092 9828 96 2869 1123 4087 41103 10% 7%10% on septic, maximum treatment level 10920 1092 9828 0 2459 653 3112 41103 8% 6%30% on septic, minimum treatment level 10920 3276 7644 287 2231 873 3391 41103 8% 6%30% on septic, maximum treatment level 10920 3276 7644 0 1913 508 2421 41103 6% 5%
Page 3-1 August, 2003 Review of Potential Reduction in P Loading from Machine Dishwashing Detergents
3.0 RELATIVE IMPORTANCE OF DETERGENT SOURCES TO LAKE CHAMPLAIN
The relative importance of P from machine dishwashing detergent in the overall P load to Lake Champlain was evaluated. The analysis was done on a basinwide scale, assuming that the lake is fully mixed, and that land use and associated P loads can be treated as relatively uniform around the lake. Field data collected in 1990-91 (VT DEC and NY DEC, 1997) indicate that total P concentrations are relatively constant throughout the lake, except for some small reaches where concentrations are higher in the extreme northern and southern ends. Based on existing data, it is not expected that the overall results of a more fine-scale analysis would differ significantly from those presented here.
Phosphorus data from the Lake Champlain Diagnostic-Feasibility Study were utilized to estimate the total P load into Lake Champlain (VT DEC and NY DEC, 1997). In that report, field data and a model application were employed to estimate point source, non-point source and direct loads to the lake for the 1991 hydrologic year. These data were the most recent available data at the time of the VT/NY DEC assessment.
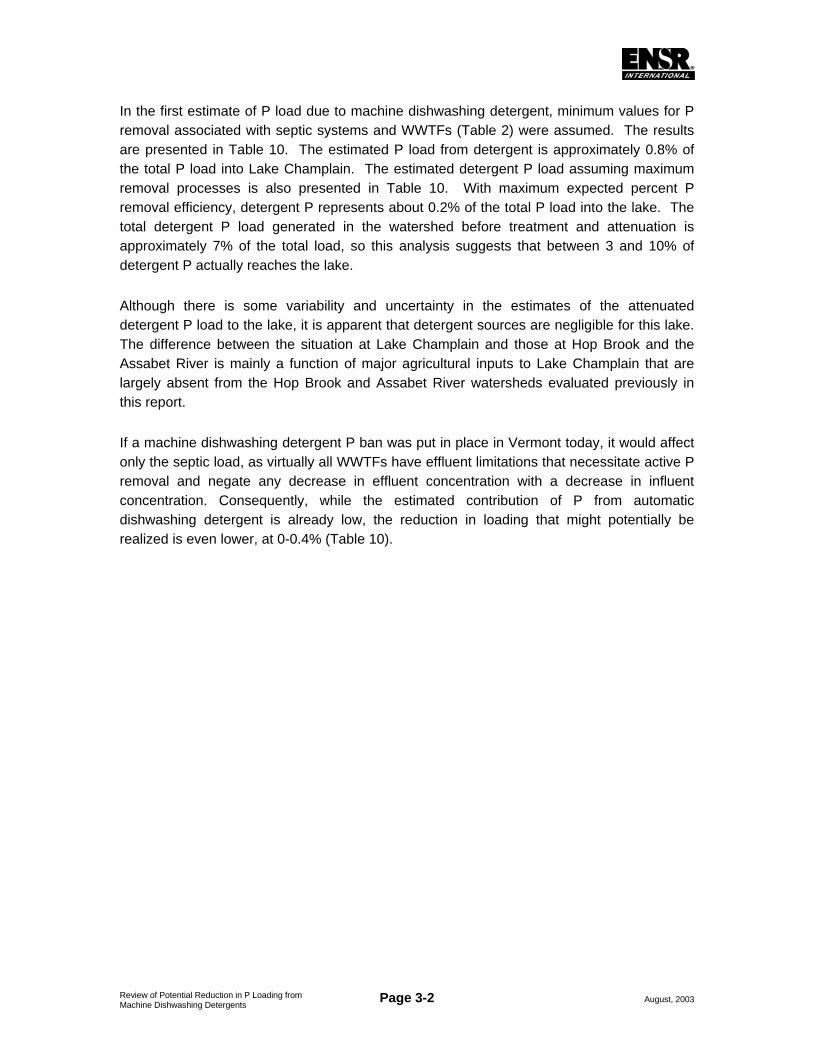
A summary of the P load is presented in Table 9. Loads are presented for the New York side and the Vermont/Quebec side of the lake. Also included in Table 9 is the area and 1990 population, which were the most recent data available at the time of the VT/NY DEC analysis (from http://www.lcbp.org/lakefax.htm, the Lake Champlain Basin Program) of the two areas. These data indicate that the loads are fairly evenly distributed over the basin; the non-point source load is higher in Vermont/Quebec than New York, but so are the area of watershed and human population from which that load is derived. In total, the Vermont/Quebec side of the lake receives 74% of the total P load from 63% of the watershed area and 65% of the watershed population. This suggests a slightly greater output per unit area or per capita on the Vermont/Quebec side.
The estimated per capita use of machine dishwashing detergent is 0.078 kg/capita/year (SRI International 1999 and census data). Data from the Lake Champlain Basin Program (http://www.lcbp.org/lakefax.htm) indicate that approximately 55% of the basin’s population use septic systems and the remainder is on public sewer systems. Using this information and making reasonable assumptions about treatment efficiency (Table 2), the automatic dishwashing detergent P load to the lake can be estimated. Discharge monitoring reports for five WWTFs that discharge to tributaries of Lake Champlain indicate a range of average effluent P concentrations of 0.37 to 0.79 mg/L over the period of 1997 through 2000, with a grand average of 0.52 mg/L. This is similar to that observed for the Marlborough East WWTF that discharges to Hop Brook, so the P removal parameters presented in Table 2 appear applicable. Note that all of these facilities have effluent limitations for P and use chemical additions to control P concentration in their discharges. Consequently, the issue of whether or not a change in influent P level will translate into any change in effluent P level is again raised.
Page 3-2 August, 2003 Review of Potential Reduction in P Loading from Machine Dishwashing Detergents
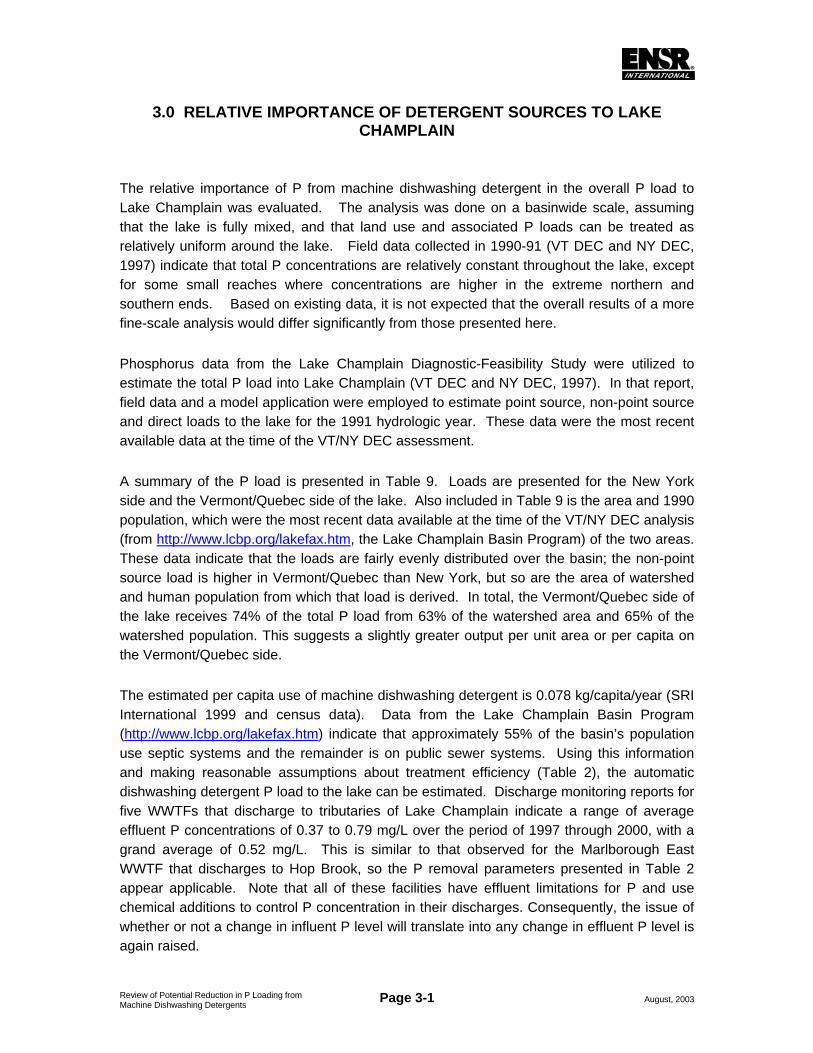
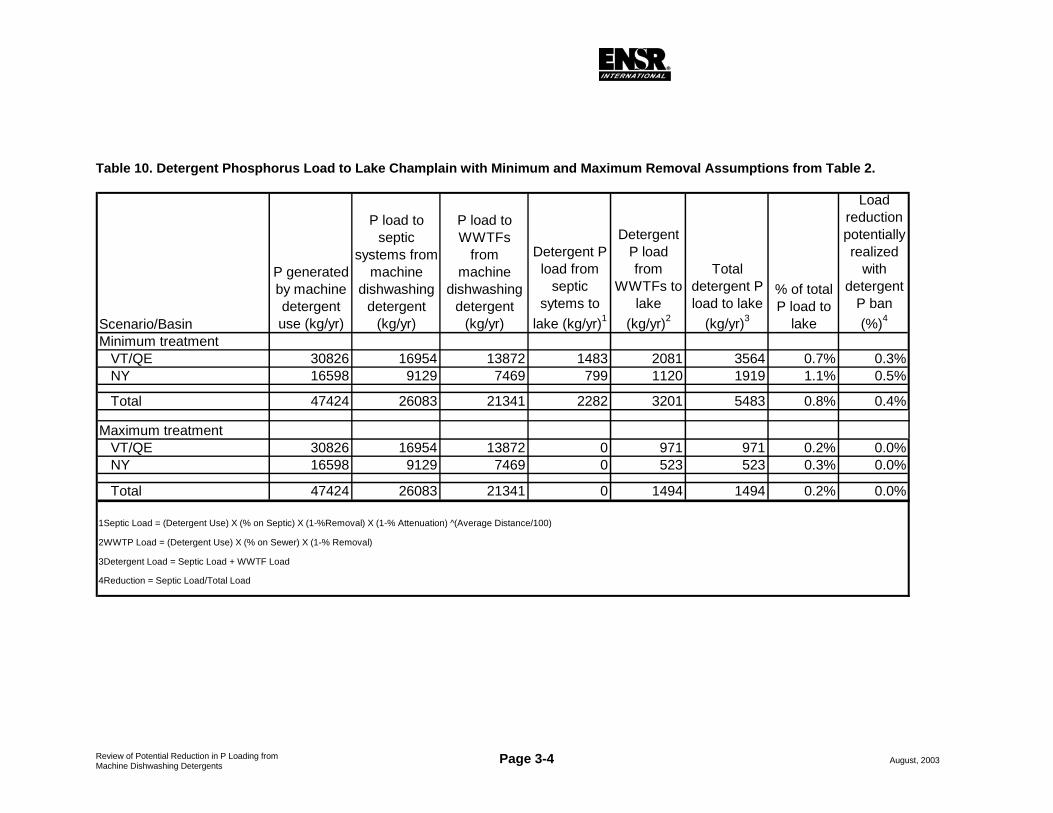
In the first estimate of P load due to machine dishwashing detergent, minimum values for P removal associated with septic systems and WWTFs (Table 2) were assumed. The results are presented in Table 10. The estimated P load from detergent is approximately 0.8% of the total P load into Lake Champlain. The estimated detergent P load assuming maximum removal processes is also presented in Table 10. With maximum expected percent P removal efficiency, detergent P represents about 0.2% of the total P load into the lake. The total detergent P load generated in the watershed before treatment and attenuation is approximately 7% of the total load, so this analysis suggests that between 3 and 10% of detergent P actually reaches the lake.
Although there is some variability and uncertainty in the estimates of the attenuated detergent P load to the lake, it is apparent that detergent sources are negligible for this lake. The difference between the situation at Lake Champlain and those at Hop Brook and the Assabet River is mainly a function of major agricultural inputs to Lake Champlain that are largely absent from the Hop Brook and Assabet River watersheds evaluated previously in this report.
If a machine dishwashing detergent P ban was put in place in Vermont today, it would affect only the septic load, as virtually all WWTFs have effluent limitations that necessitate active P removal and negate any decrease in effluent concentration with a decrease in influent concentration. Consequently, while the estimated contribution of P from automatic dishwashing detergent is already low, the reduction in loading that might potentially be realized is even lower, at 0-0.4% (Table 10).
Page 3-3 August, 2003 Review of Potential Reduction in P Loading from Machine Dishwashing Detergents
Table 9. Total Phosphorus Load to Lake Champlain (1991 Hydrologic Year), based on VT DEC and NY DEC (1997).
VT/QE NY Total
Point source (kg/yr) 129300 59200 188500
Percent of Total 69 31
Non-point source (kg/yr) 340600 102200 442800
Percent of Total 77 23
Direct (kg/yr) 9702 5698 15400
Percent of Total 63 37
Total Load (kg/yr) 479602 167098 646700
Percent of Total 74 26
1990 Population 395200 212800 608000
Percent of Total 65 35
Area (km2) 13435 7891 21326 Percent of Total 63 37
Page 3-4 August, 2003 Review of Potential Reduction in P Loading from Machine Dishwashing Detergents
Table 10. Detergent Phosphorus Load to Lake Champlain with Minimum and Maximum Removal Assumptions from Table 2.
Scenario/Basin
P generated by machine detergent use (kg/yr)
P load to septic
systems from machine
dishwashing detergent
(kg/yr)
P load to WWTFs
from machine
dishwashing detergent
(kg/yr)
Detergent P load from
septic sytems to
lake (kg/yr)1
Detergent P load from
WWTFs to lake
(kg/yr)2
Total detergent P load to lake
(kg/yr)3
% of total P load to
lake
Load reduction potentially realized
with detergent
P ban (%)4
Minimum treatment VT/QE 30826 16954 13872 1483 2081 3564 0.7% 0.3% NY 16598 9129 7469 799 1120 1919 1.1% 0.5%
Total 47424 26083 21341 2282 3201 5483 0.8% 0.4%
Maximum treatment VT/QE 30826 16954 13872 0 971 971 0.2% 0.0% NY 16598 9129 7469 0 523 523 0.3% 0.0%
Total 47424 26083 21341 0 1494 1494 0.2% 0.0%
1Septic Load = (Detergent Use) X (% on Septic) X (1-%Removal) X (1-% Attenuation) ^(Average Distance/100)
2WWTP Load = (Detergent Use) X (% on Sewer) X (1-% Removal)
3Detergent Load = Septic Load + WWTF Load
4Reduction = Septic Load/Total Load
Page 4-1 August, 2003 Review of Potential Reduction in P Loading from Machine Dishwashing Detergents
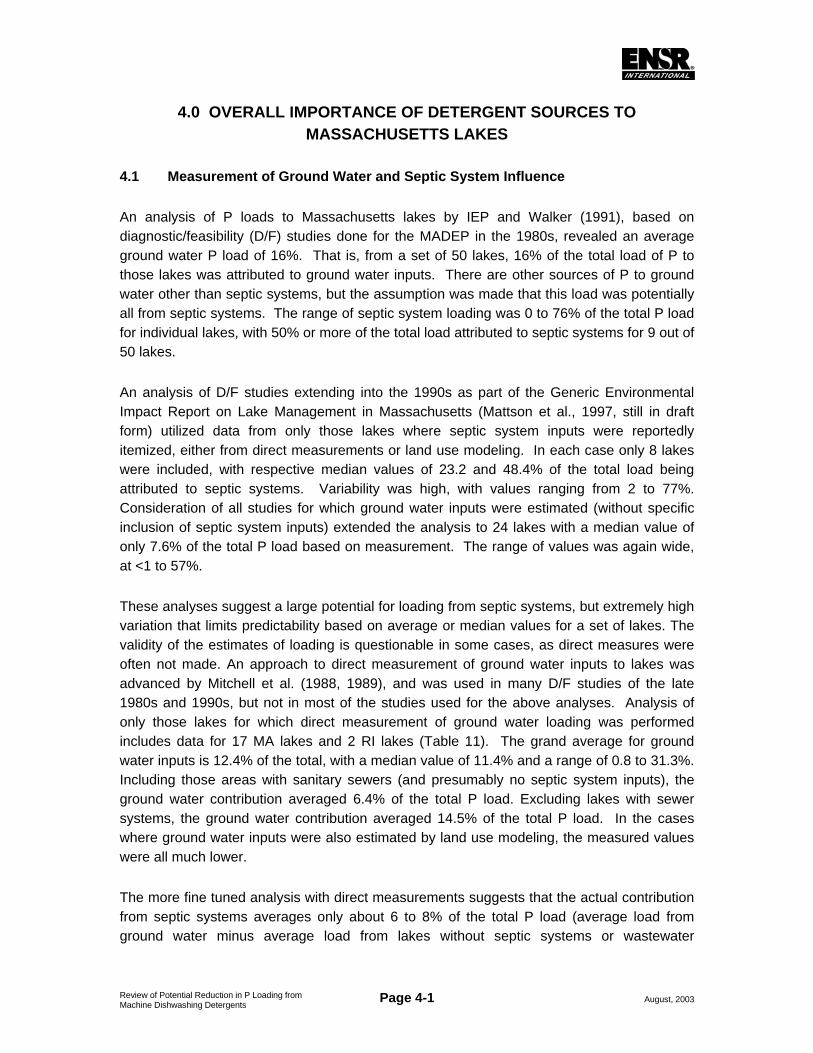
4.0 OVERALL IMPORTANCE OF DETERGENT SOURCES TO MASSACHUSETTS LAKES
4.1 Measurement of Ground Water and Septic System Influence
An analysis of P loads to Massachusetts lakes by IEP and Walker (1991), based on diagnostic/feasibility (D/F) studies done for the MADEP in the 1980s, revealed an average ground water P load of 16%. That is, from a set of 50 lakes, 16% of the total load of P to those lakes was attributed to ground water inputs. There are other sources of P to ground water other than septic systems, but the assumption was made that this load was potentially all from septic systems. The range of septic system loading was 0 to 76% of the total P load for individual lakes, with 50% or more of the total load attributed to septic systems for 9 out of 50 lakes.
An analysis of D/F studies extending into the 1990s as part of the Generic Environmental Impact Report on Lake Management in Massachusetts (Mattson et al., 1997, still in draft form) utilized data from only those lakes where septic system inputs were reportedly itemized, either from direct measurements or land use modeling. In each case only 8 lakes were included, with respective median values of 23.2 and 48.4% of the total load being attributed to septic systems. Variability was high, with values ranging from 2 to 77%. Consideration of all studies for which ground water inputs were estimated (without specific inclusion of septic system inputs) extended the analysis to 24 lakes with a median value of only 7.6% of the total P load based on measurement. The range of values was again wide, at <1 to 57%.
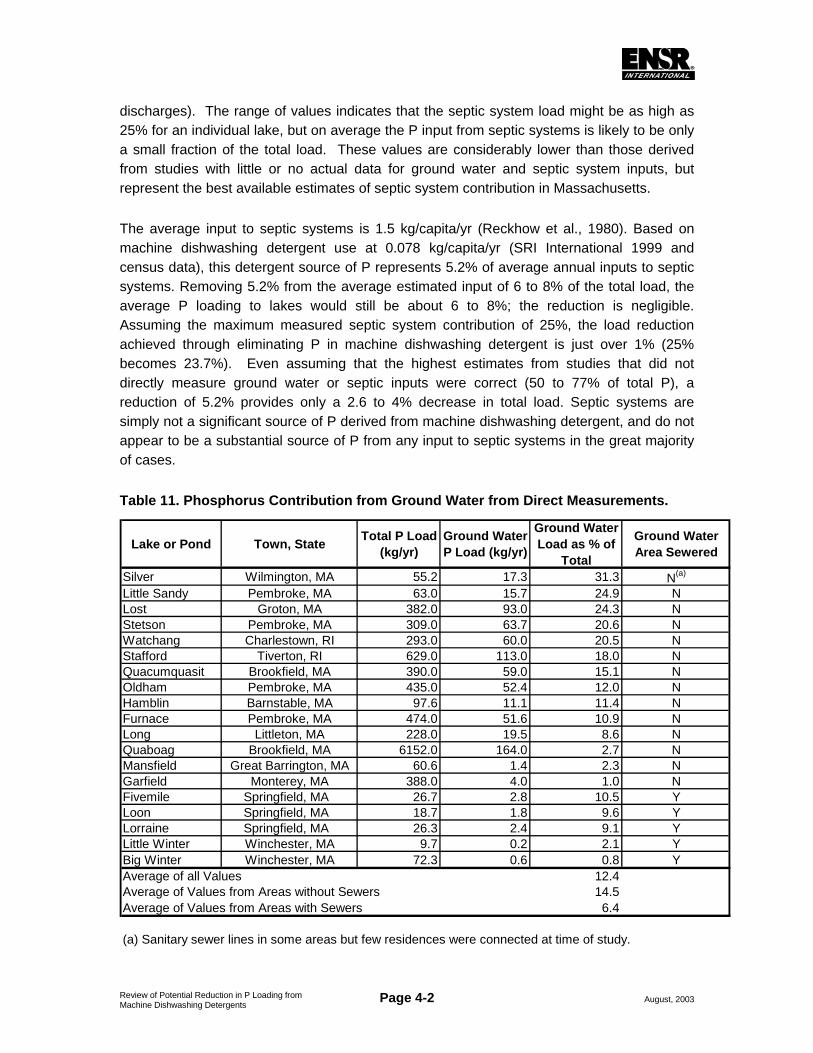
These analyses suggest a large potential for loading from septic systems, but extremely high variation that limits predictability based on average or median values for a set of lakes. The validity of the estimates of loading is questionable in some cases, as direct measures were often not made. An approach to direct measurement of ground water inputs to lakes was advanced by Mitchell et al. (1988, 1989), and was used in many D/F studies of the late 1980s and 1990s, but not in most of the studies used for the above analyses. Analysis of only those lakes for which direct measurement of ground water loading was performed includes data for 17 MA lakes and 2 RI lakes (Table 11). The grand average for ground water inputs is 12.4% of the total, with a median value of 11.4% and a range of 0.8 to 31.3%. Including those areas with sanitary sewers (and presumably no septic system inputs), the ground water contribution averaged 6.4% of the total P load. Excluding lakes with sewer systems, the ground water contribution averaged 14.5% of the total P load. In the cases where ground water inputs were also estimated by land use modeling, the measured values were all much lower.
The more fine tuned analysis with direct measurements suggests that the actual contribution from septic systems averages only about 6 to 8% of the total P load (average load from ground water minus average load from lakes without septic systems or wastewater
Page 4-2 August, 2003 Review of Potential Reduction in P Loading from Machine Dishwashing Detergents
discharges). The range of values indicates that the septic system load might be as high as 25% for an individual lake, but on average the P input from septic systems is likely to be only a small fraction of the total load. These values are considerably lower than those derived from studies with little or no actual data for ground water and septic system inputs, but represent the best available estimates of septic system contribution in Massachusetts.
The average input to septic systems is 1.5 kg/capita/yr (Reckhow et al., 1980). Based on machine dishwashing detergent use at 0.078 kg/capita/yr (SRI International 1999 and census data), this detergent source of P represents 5.2% of average annual inputs to septic systems. Removing 5.2% from the average estimated input of 6 to 8% of the total load, the average P loading to lakes would still be about 6 to 8%; the reduction is negligible. Assuming the maximum measured septic system contribution of 25%, the load reduction achieved through eliminating P in machine dishwashing detergent is just over 1% (25% becomes 23.7%). Even assuming that the highest estimates from studies that did not directly measure ground water or septic inputs were correct (50 to 77% of total P), a reduction of 5.2% provides only a 2.6 to 4% decrease in total load. Septic systems are simply not a significant source of P derived from machine dishwashing detergent, and do not appear to be a substantial source of P from any input to septic systems in the great majority of cases.
Table 11. Phosphorus Contribution from Ground Water from Direct Measurements.
Lake or Pond Town, State Total P Load (kg/yr)
Ground Water P Load (kg/yr)
Ground Water Load as % of
Total
Ground Water Area Sewered
Silver Wilmington, MA 55.2 17.3 31.3 N(a)
Little Sandy Pembroke, MA 63.0 15.7 24.9 NLost Groton, MA 382.0 93.0 24.3 NStetson Pembroke, MA 309.0 63.7 20.6 NWatchang Charlestown, RI 293.0 60.0 20.5 NStafford Tiverton, RI 629.0 113.0 18.0 NQuacumquasit Brookfield, MA 390.0 59.0 15.1 NOldham Pembroke, MA 435.0 52.4 12.0 NHamblin Barnstable, MA 97.6 11.1 11.4 NFurnace Pembroke, MA 474.0 51.6 10.9 NLong Littleton, MA 228.0 19.5 8.6 NQuaboag Brookfield, MA 6152.0 164.0 2.7 NMansfield Great Barrington, MA 60.6 1.4 2.3 NGarfield Monterey, MA 388.0 4.0 1.0 NFivemile Springfield, MA 26.7 2.8 10.5 YLoon Springfield, MA 18.7 1.8 9.6 YLorraine Springfield, MA 26.3 2.4 9.1 YLittle Winter Winchester, MA 9.7 0.2 2.1 YBig Winter Winchester, MA 72.3 0.6 0.8 YAverage of all Values 12.4Average of Values from Areas without Sewers 14.5Average of Values from Areas with Sewers 6.4
(a) Sanitary sewer lines in some areas but few residences were connected at time of study.
Page 4-3 August, 2003 Review of Potential Reduction in P Loading from Machine Dishwashing Detergents
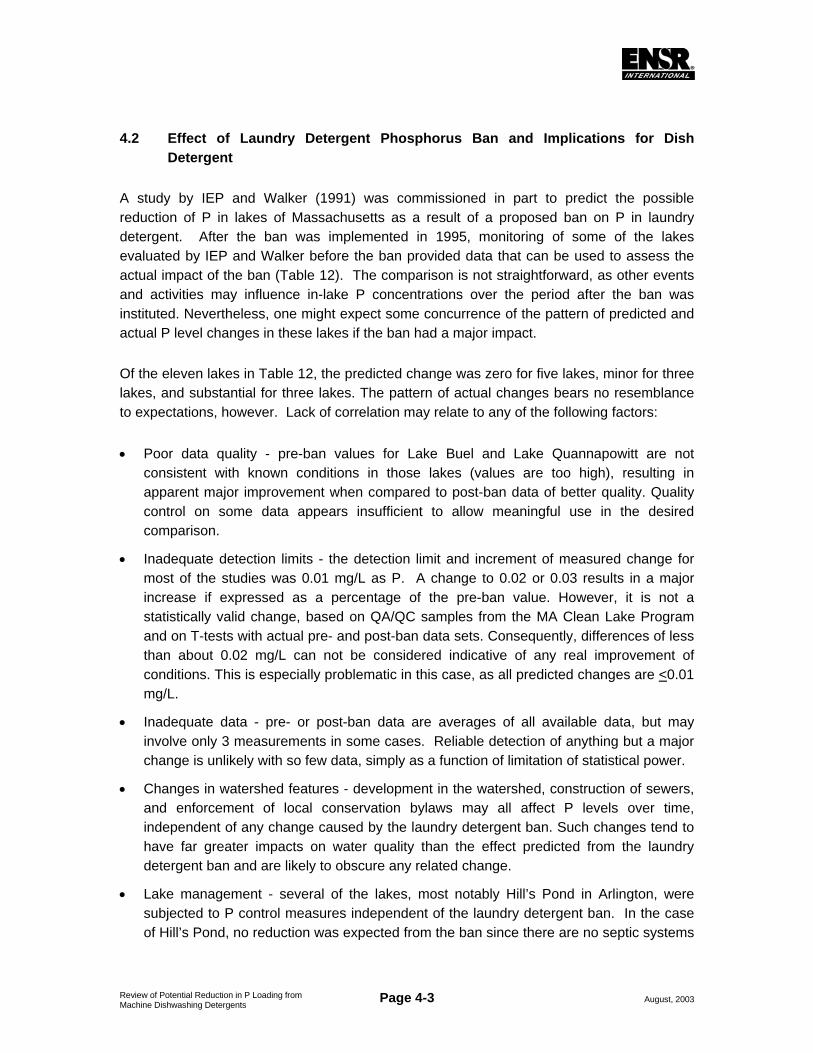
4.2 Effect of Laundry Detergent Phosphorus Ban and Implications for Dish Detergent
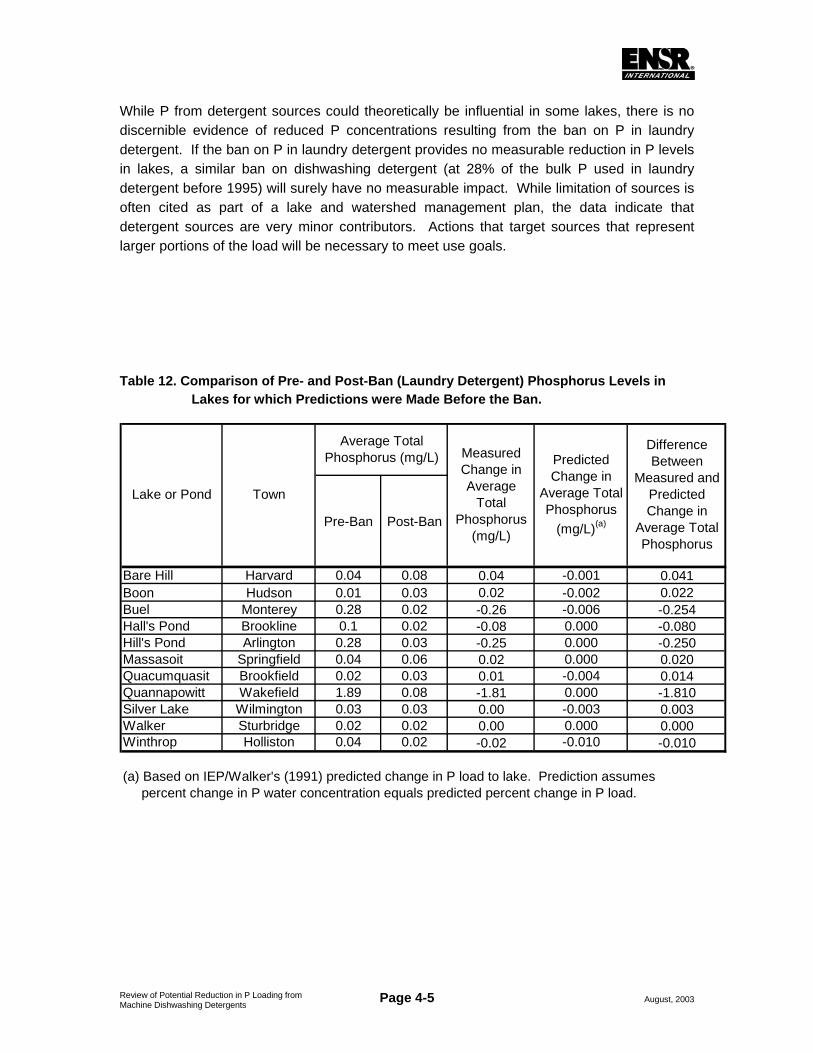
A study by IEP and Walker (1991) was commissioned in part to predict the possible reduction of P in lakes of Massachusetts as a result of a proposed ban on P in laundry detergent. After the ban was implemented in 1995, monitoring of some of the lakes evaluated by IEP and Walker before the ban provided data that can be used to assess the actual impact of the ban (Table 12). The comparison is not straightforward, as other events and activities may influence in-lake P concentrations over the period after the ban was instituted. Nevertheless, one might expect some concurrence of the pattern of predicted and actual P level changes in these lakes if the ban had a major impact.
Of the eleven lakes in Table 12, the predicted change was zero for five lakes, minor for three lakes, and substantial for three lakes. The pattern of actual changes bears no resemblance to expectations, however. Lack of correlation may relate to any of the following factors:
• Poor data quality - pre-ban values for Lake Buel and Lake Quannapowitt are not consistent with known conditions in those lakes (values are too high), resulting in apparent major improvement when compared to post-ban data of better quality. Quality control on some data appears insufficient to allow meaningful use in the desired comparison.
• Inadequate detection limits - the detection limit and increment of measured change for most of the studies was 0.01 mg/L as P. A change to 0.02 or 0.03 results in a major increase if expressed as a percentage of the pre-ban value. However, it is not a statistically valid change, based on QA/QC samples from the MA Clean Lake Program and on T-tests with actual pre- and post-ban data sets. Consequently, differences of less than about 0.02 mg/L can not be considered indicative of any real improvement of conditions. This is especially problematic in this case, as all predicted changes are <0.01 mg/L.
• Inadequate data - pre- or post-ban data are averages of all available data, but may involve only 3 measurements in some cases. Reliable detection of anything but a major change is unlikely with so few data, simply as a function of limitation of statistical power.
• Changes in watershed features - development in the watershed, construction of sewers, and enforcement of local conservation bylaws may all affect P levels over time, independent of any change caused by the laundry detergent ban. Such changes tend to have far greater impacts on water quality than the effect predicted from the laundry detergent ban and are likely to obscure any related change.
• Lake management - several of the lakes, most notably Hill’s Pond in Arlington, were subjected to P control measures independent of the laundry detergent ban. In the case of Hill’s Pond, no reduction was expected from the ban since there are no septic systems
Page 4-4 August, 2003 Review of Potential Reduction in P Loading from Machine Dishwashing Detergents
affecting the pond and the sanitary sewer discharges outside the watershed. The rather major decrease in P in the pond was the result of dredging and storm water management. As with changes in the watershed, in-lake management actions have the potential to produce much larger changes in P concentration than the predicted detergent ban.
• Minimal input of detergent P - some lakes are served by sewer systems that discharge outside the watershed, and properly constructed and maintained septic systems remove much of the P before it reaches the lake. Analyses in Section 2.0 of this report indicate that the input of P from septic systems is minimal for Hop Brook and the Assabet River in MA and Lake Champlain in VT/NY. The predicted changes from the laundry detergent P ban are rather small, limiting detectability.
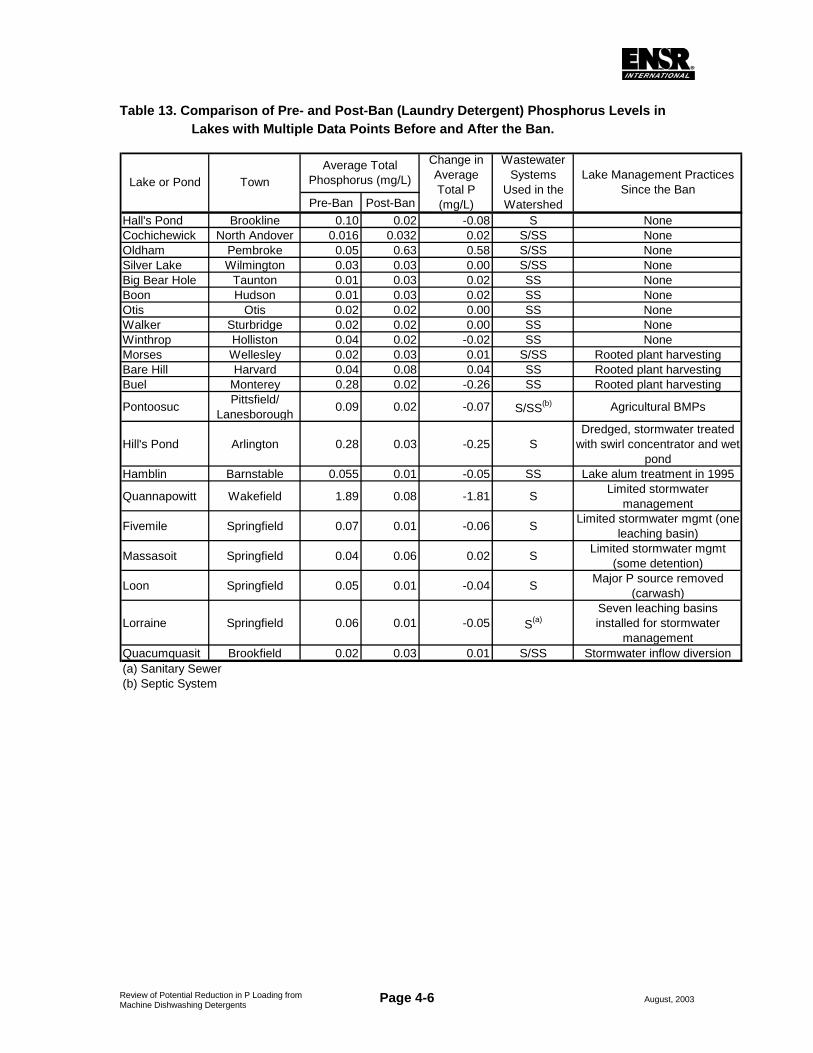
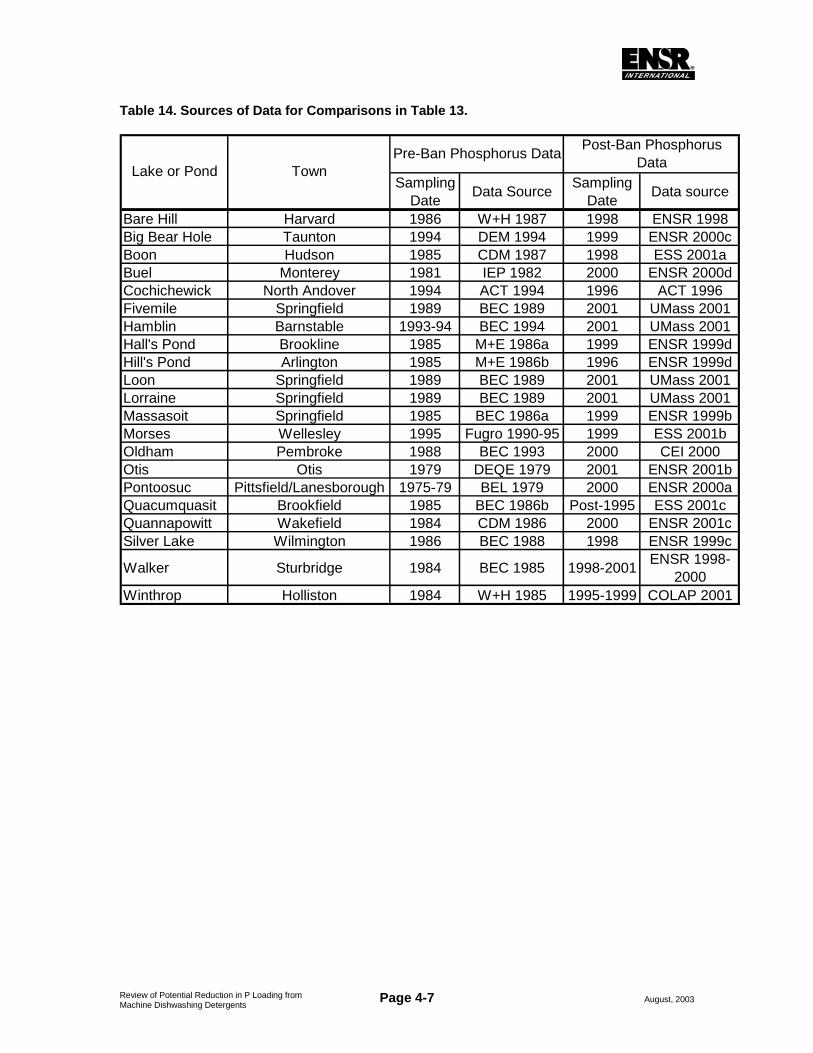
These factors combine to minimize the likelihood of a meaningful post-ban evaluation, but in an effort to improve the database, data were acquired for as many lakes as possible where multiple data points existed both before and after the ban. Pre-1995 and post-1995 data were applied; 1995 data were deleted, as this was the transition year of the ban. The augmented database (Table 13), based on data from Diagnostic/Feasibility studies and follow-up assessments sponsored by state agencies (Table 14), increases the database from 11 to 21 lakes and involves more data and more information on the target lakes. However, it does not demonstrate any more of a trend than did the comparison with the original IEP and Walker (1991) data.
Many of the same influences noted for the IEP/Walker data set affect the lakes added in Table 13. The post-ban Oldham Pond P data are entirely inconsistent with the condition of that lake. The marked improvement of Hamblin Pond has clearly been related to the alum treatment performed in spring of 1995, coincident with the P ban for laundry detergent. Overall, P increased in 8 lakes, decreased in 10 lakes, and stayed the same in 3 lakes. There are more decreases associated with lakes that have sanitary sewers in their watersheds (with discharge outside the watershed) than for lakes with septic systems surrounding them (where greater influence would be expected).
If lakes with changes in watershed or lake management since the ban are excluded from consideration, the first nine lakes in Table 13 remain for consideration. As rooted plant harvesting has never been demonstrated to have a significant impact on P concentrations in lakes, the next three lakes in Table 13 could be considered as well. Of this set of 12 lakes, Hall’s Pond receives no wastewater (sewered watershed with discharge outside the basin) and Oldham Pond and Lake Buel have questionable data. This leaves nine lakes, three with sanitary sewers and septic systems in their watersheds and six lakes with only septic systems in their watersheds. For the lakes with both sanitary sewers and septic systems, the change in P concentration ranged from 0.00 to 0.02 mg/L, no change to a slight increase in P level. For the lakes with only septic systems, the change in P concentration ranged from -0.02 to 0.04 mg/L, with only one negative value (decrease in P level).
Page 4-5 August, 2003 Review of Potential Reduction in P Loading from Machine Dishwashing Detergents
While P from detergent sources could theoretically be influential in some lakes, there is no discernible evidence of reduced P concentrations resulting from the ban on P in laundry detergent. If the ban on P in laundry detergent provides no measurable reduction in P levels in lakes, a similar ban on dishwashing detergent (at 28% of the bulk P used in laundry detergent before 1995) will surely have no measurable impact. While limitation of sources is often cited as part of a lake and watershed management plan, the data indicate that detergent sources are very minor contributors. Actions that target sources that represent larger portions of the load will be necessary to meet use goals.
Table 12. Comparison of Pre- and Post-Ban (Laundry Detergent) Phosphorus Levels in Lakes for which Predictions were Made Before the Ban.
Pre-Ban Post-Ban
Bare Hill Harvard 0.04 0.08 0.04 -0.001 0.041Boon Hudson 0.01 0.03 0.02 -0.002 0.022Buel Monterey 0.28 0.02 -0.26 -0.006 -0.254Hall's Pond Brookline 0.1 0.02 -0.08 0.000 -0.080Hill's Pond Arlington 0.28 0.03 -0.25 0.000 -0.250Massasoit Springfield 0.04 0.06 0.02 0.000 0.020Quacumquasit Brookfield 0.02 0.03 0.01 -0.004 0.014Quannapowitt Wakefield 1.89 0.08 -1.81 0.000 -1.810Silver Lake Wilmington 0.03 0.03 0.00 -0.003 0.003Walker Sturbridge 0.02 0.02 0.00 0.000 0.000Winthrop Holliston 0.04 0.02 -0.02 -0.010 -0.010
(a) Based on IEP/Walker's (1991) predicted change in P load to lake. Prediction assumes percent change in P water concentration equals predicted percent change in P load.
Difference Between
Measured and Predicted Change in
Average Total Phosphorus
Lake or Pond Town
Average Total Phosphorus (mg/L) Predicted
Change in Average Total Phosphorus
(mg/L)(a)
Measured Change in Average
Total Phosphorus
(mg/L)
Page 4-6 August, 2003 Review of Potential Reduction in P Loading from Machine Dishwashing Detergents
Table 13. Comparison of Pre- and Post-Ban (Laundry Detergent) Phosphorus Levels in Lakes with Multiple Data Points Before and After the Ban.
Pre-Ban Post-BanHall's Pond Brookline 0.10 0.02 -0.08 S NoneCochichewick North Andover 0.016 0.032 0.02 S/SS NoneOldham Pembroke 0.05 0.63 0.58 S/SS NoneSilver Lake Wilmington 0.03 0.03 0.00 S/SS NoneBig Bear Hole Taunton 0.01 0.03 0.02 SS NoneBoon Hudson 0.01 0.03 0.02 SS NoneOtis Otis 0.02 0.02 0.00 SS NoneWalker Sturbridge 0.02 0.02 0.00 SS NoneWinthrop Holliston 0.04 0.02 -0.02 SS NoneMorses Wellesley 0.02 0.03 0.01 S/SS Rooted plant harvestingBare Hill Harvard 0.04 0.08 0.04 SS Rooted plant harvestingBuel Monterey 0.28 0.02 -0.26 SS Rooted plant harvesting
Pontoosuc Pittsfield/ Lanesborough 0.09 0.02 -0.07 S/SS(b) Agricultural BMPs
Hill's Pond Arlington 0.28 0.03 -0.25 SDredged, stormwater treated
with swirl concentrator and wet pond
Hamblin Barnstable 0.055 0.01 -0.05 SS Lake alum treatment in 1995
Quannapowitt Wakefield 1.89 0.08 -1.81 S Limited stormwater management
Fivemile Springfield 0.07 0.01 -0.06 S Limited stormwater mgmt (one leaching basin)
Massasoit Springfield 0.04 0.06 0.02 S Limited stormwater mgmt (some detention)
Loon Springfield 0.05 0.01 -0.04 S Major P source removed (carwash)
Lorraine Springfield 0.06 0.01 -0.05 S(a)Seven leaching basins installed for stormwater
managementQuacumquasit Brookfield 0.02 0.03 0.01 S/SS Stormwater inflow diversion(a) Sanitary Sewer(b) Septic System
Lake Management Practices Since the Ban
Average Total Phosphorus (mg/L)Lake or Pond Town
Change in Average Total P (mg/L)
Wastewater Systems
Used in the Watershed
Page 4-7 August, 2003 Review of Potential Reduction in P Loading from Machine Dishwashing Detergents
Table 14. Sources of Data for Comparisons in Table 13.
Sampling Date Data Source Sampling
Date Data source
Bare Hill Harvard 1986 W+H 1987 1998 ENSR 1998Big Bear Hole Taunton 1994 DEM 1994 1999 ENSR 2000cBoon Hudson 1985 CDM 1987 1998 ESS 2001aBuel Monterey 1981 IEP 1982 2000 ENSR 2000dCochichewick North Andover 1994 ACT 1994 1996 ACT 1996Fivemile Springfield 1989 BEC 1989 2001 UMass 2001Hamblin Barnstable 1993-94 BEC 1994 2001 UMass 2001Hall's Pond Brookline 1985 M+E 1986a 1999 ENSR 1999dHill's Pond Arlington 1985 M+E 1986b 1996 ENSR 1999dLoon Springfield 1989 BEC 1989 2001 UMass 2001Lorraine Springfield 1989 BEC 1989 2001 UMass 2001Massasoit Springfield 1985 BEC 1986a 1999 ENSR 1999bMorses Wellesley 1995 Fugro 1990-95 1999 ESS 2001bOldham Pembroke 1988 BEC 1993 2000 CEI 2000Otis Otis 1979 DEQE 1979 2001 ENSR 2001bPontoosuc Pittsfield/Lanesborough 1975-79 BEL 1979 2000 ENSR 2000aQuacumquasit Brookfield 1985 BEC 1986b Post-1995 ESS 2001cQuannapowitt Wakefield 1984 CDM 1986 2000 ENSR 2001cSilver Lake Wilmington 1986 BEC 1988 1998 ENSR 1999c
Walker Sturbridge 1984 BEC 1985 1998-2001 ENSR 1998-2000
Winthrop Holliston 1984 W+H 1985 1995-1999 COLAP 2001
Lake or Pond TownPre-Ban Phosphorus Data Post-Ban Phosphorus
Data
Page 5-1 August, 2003 Review of Potential Reduction in P Loading from Machine Dishwashing Detergents
5.0 IMPLICATIONS OF CHANGES IN PHOSPHORUS INPUTS FROM WASTEWATER TREATMENT FACILITIES AFTER PROHIBITION OF
PHOSPHORUS IN LAUNDRY DETERGENT
5.1 Background
Between 1972 and 1995, multiple states enacted legislation and regulations requiring major reductions in the P content of laundry detergent. Predictions for changes in the P content of WWTF effluent and possible output from septic systems varied widely, with estimates based on seemingly little data and many assumptions, some of which were insufficiently justified. Actual post-ban assessment of P concentrations in WWTF effluent were made in several states, however, providing a more factual basis for predicting load and concentration reductions. This is of distinct interest for any machine dishwashing detergent P ban being contemplated, as the relationship between the P content of machine dishwasher detergent and that of laundry detergent prior to 1995 can be used to estimate the reduction potentially gained by any restriction on dishwasher detergent P content.
In Maryland, Walker (cited in IEP and Walker, 1991) found an average 33% decrease in P content of WWTF effluent as a result of a ban on laundry detergent P in that state. The WWTFs that were included in this analysis were not actively removing P with chemical additions or other specialized treatment. Analyses discussed by Booman and Sedlak (1986) indicate reductions in influent P level in Michigan and Wisconsin WWTFs that range from 7 to 31%. However, there was no statistically significant reduction in effluent concentration, as the WWTFs were practicing some level of P removal by chemical addition. This phenomenon has been attributed to the interaction of water chemistry and treatment processes to confound any straightforward relationship between influent and effluent P levels. Removal rates may actually be higher for treatment processes handling higher starting concentrations, such that the effluent concentration may be similar for wastewater with differing influent P levels.
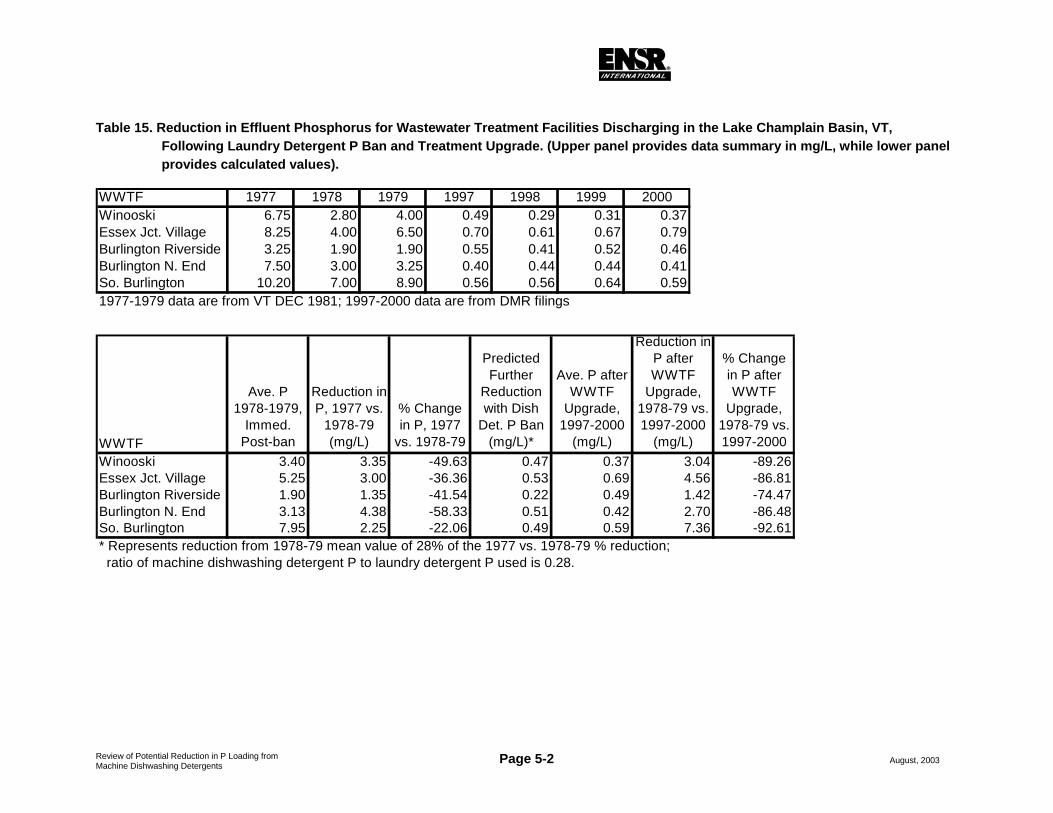
The VTDEC (1981) found a range of reduction of 22 to 58% for five WWTFs in the Lake Champlain basin when comparing effluent values immediately before and after the 1978 ban on laundry detergent P in Vermont, with an average reduction of 42% (Table 15). None of these WWTFs were targeting P for removal around the time of the ban, but all subsequently upgraded treatment to allow for phosphorus removal by chemical addition. This resulted in much greater decreases in P concentration, yielding effluent levels that average 0.37 to 0.69 mg/L for the 1997-2000 period. Note that the reduction in P level achieved through WWTF upgrade is not enhanced by lower influent P concentration; the highest percentage reduction from 1978-79 P levels is associated with the highest P concentration after the laundry detergent ban was implemented. Likewise, the lowest percentage reduction corresponds to the lowest post-ban P level. Treatment targets an effluent concentration set by the facility’s permit; greater percentage reductions will be achieved if the influent P level is higher or the target concentration is lower.
Page 5-2 August, 2003 Review of Potential Reduction in P Loading from Machine Dishwashing Detergents
Table 15. Reduction in Effluent Phosphorus for Wastewater Treatment Facilities Discharging in the Lake Champlain Basin, VT, Following Laundry Detergent P Ban and Treatment Upgrade. (Upper panel provides data summary in mg/L, while lower panel provides calculated values).
WWTF 1977 1978 1979 1997 1998 1999 2000Winooski 6.75 2.80 4.00 0.49 0.29 0.31 0.37Essex Jct. Village 8.25 4.00 6.50 0.70 0.61 0.67 0.79Burlington Riverside 3.25 1.90 1.90 0.55 0.41 0.52 0.46Burlington N. End 7.50 3.00 3.25 0.40 0.44 0.44 0.41So. Burlington 10.20 7.00 8.90 0.56 0.56 0.64 0.591977-1979 data are from VT DEC 1981; 1997-2000 data are from DMR filings
WWTF
Ave. P 1978-1979,
Immed. Post-ban
Reduction in P, 1977 vs.
1978-79 (mg/L)
% Change in P, 1977
vs. 1978-79
Predicted Further
Reduction with Dish
Det. P Ban (mg/L)*
Ave. P after WWTF
Upgrade, 1997-2000
(mg/L)
Reduction in P after WWTF
Upgrade, 1978-79 vs. 1997-2000
(mg/L)
% Change in P after WWTF
Upgrade, 1978-79 vs. 1997-2000
Winooski 3.40 3.35 -49.63 0.47 0.37 3.04 -89.26Essex Jct. Village 5.25 3.00 -36.36 0.53 0.69 4.56 -86.81Burlington Riverside 1.90 1.35 -41.54 0.22 0.49 1.42 -74.47Burlington N. End 3.13 4.38 -58.33 0.51 0.42 2.70 -86.48So. Burlington 7.95 2.25 -22.06 0.49 0.59 7.36 -92.61* Represents reduction from 1978-79 mean value of 28% of the 1977 vs. 1978-79 % reduction; ratio of machine dishwashing detergent P to laundry detergent P used is 0.28.
Page 5-3 August, 2003 Review of Potential Reduction in P Loading from Machine Dishwashing Detergents
5.2 Massachusetts
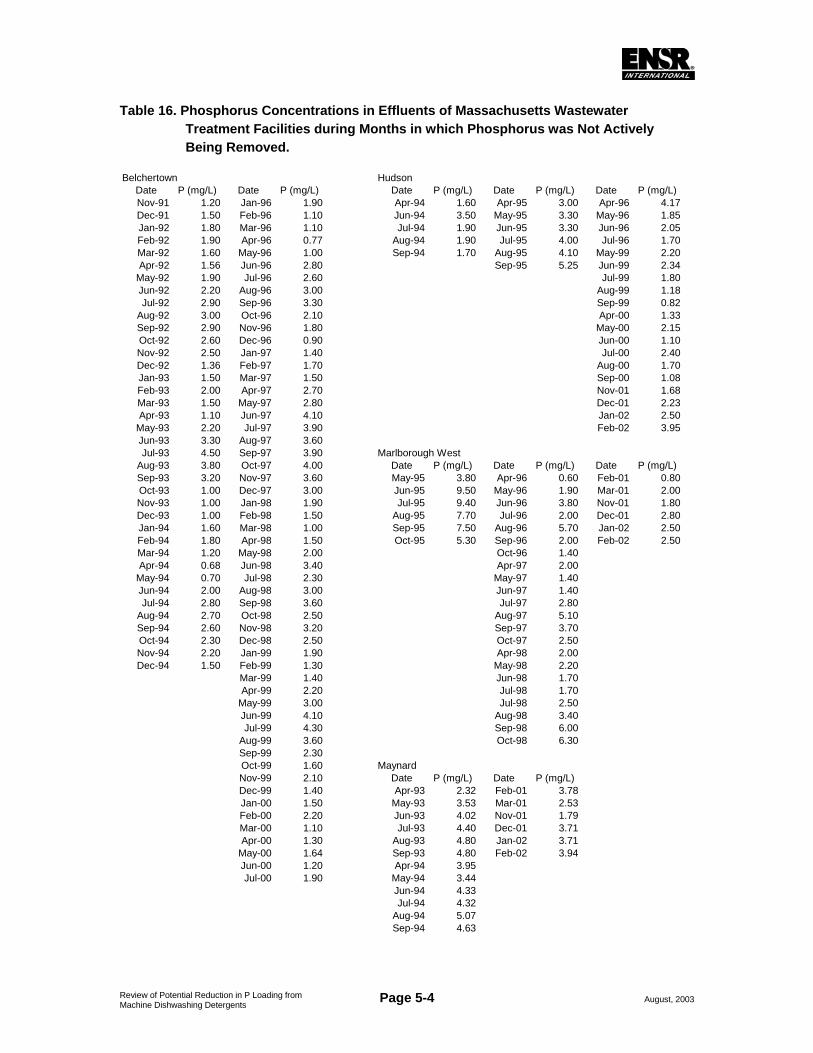
No analysis of ban-induced changes in P concentrations had been conducted for WWTFs in Massachusetts, where the P content of laundry detergent was restricted in 1995. To evaluate the effect the 1995 phosphate detergent ban on point source inputs into natural waters, monitoring data were gathered from Wastewater Treatment Facilities (WWTFs) in Massachusetts. Discharge Monitoring Reports (DMRs) were obtained from EPA for 24 WWTFs. Data contained in these reports included monthly average, weekly average and daily maximum total P concentrations. Average monthly values were applied in this analysis.
Data were generally available for 6-7 months (April/May to September/October) each year, from 1990 to 2001. Data from other times of the year are available for only three WWTFs from before 2000 (Milford since 1990, Belchertown since 1991, and Spencer since 1993). Winter data have been required since late 2000 for seven additional WWTFs. There are no P data from before 1995 for two WWTFs (Marlborough West and Westboro). However, the largest impediment to a valid analysis of the laundry detergent P ban is that 16 of the 24 WWTFs have applied chemical additions for P removal since well before the ban; potential changes from the ban are likely to be obscured by treatment effects. Furthermore, P removal capacity was added to five WWTFs in 1995, coincident with the laundry detergent P ban, and the Hudson WWTF was modified to facilitate additional P removal in August of 1996.
Belchertown provides the only WWTF without treatment for P removal for a substantial period of time before and after the ban; it did not begin more active P removal until August 2000. However, not all WWTFs have practiced chemical P removal at all times since gaining that capacity. Permit limits for P have often been applied from April to October only, but the lack of winter data for most facilities prior to 2001 limits available data to make a statistically valid comparison.
With all of the above considerations in mind, the DMRs for these 24 WWTFs were reviewed and data potentially useful for comparing phosphorus output of WWTFs without chemical phosphorus removal before and after the laundry detergent P ban are summarized in Table 16. Since 1995 was a transition year (the ban on sale of high P laundry detergent went into effect in June 1995), it seems desirable to exclude 1995 data from comparisons. However, where 1995 data are the only possible pre-ban data available for P in WWTF effluents, those data were applied. Likewise, where adequate data are available for 1996 and 1997, it seemed preferable to apply only these data to represent the post-ban period, as other changes in WWTF operation might be expected over a more extended period. However, where 1996-97 data are minimal, later data were applied when no specific P removal was being practiced.
Statistical comparisons are provided in Table 17. For the Belchertown WWTF, with the best pre- and post-ban data record and an absence of targeted P removal until mid-2000, the P
Page 5-4 August, 2003 Review of Potential Reduction in P Loading from Machine Dishwashing Detergents
Table 16. Phosphorus Concentrations in Effluents of Massachusetts Wastewater Treatment Facilities during Months in which Phosphorus was Not Actively Being Removed.
Belchertown HudsonDate P (mg/L) Date P (mg/L) Date P (mg/L) Date P (mg/L) Date P (mg/L)Nov-91 1.20 Jan-96 1.90 Apr-94 1.60 Apr-95 3.00 Apr-96 4.17Dec-91 1.50 Feb-96 1.10 Jun-94 3.50 May-95 3.30 May-96 1.85Jan-92 1.80 Mar-96 1.10 Jul-94 1.90 Jun-95 3.30 Jun-96 2.05Feb-92 1.90 Apr-96 0.77 Aug-94 1.90 Jul-95 4.00 Jul-96 1.70Mar-92 1.60 May-96 1.00 Sep-94 1.70 Aug-95 4.10 May-99 2.20Apr-92 1.56 Jun-96 2.80 Sep-95 5.25 Jun-99 2.34
May-92 1.90 Jul-96 2.60 Jul-99 1.80Jun-92 2.20 Aug-96 3.00 Aug-99 1.18Jul-92 2.90 Sep-96 3.30 Sep-99 0.82
Aug-92 3.00 Oct-96 2.10 Apr-00 1.33Sep-92 2.90 Nov-96 1.80 May-00 2.15Oct-92 2.60 Dec-96 0.90 Jun-00 1.10Nov-92 2.50 Jan-97 1.40 Jul-00 2.40Dec-92 1.36 Feb-97 1.70 Aug-00 1.70Jan-93 1.50 Mar-97 1.50 Sep-00 1.08Feb-93 2.00 Apr-97 2.70 Nov-01 1.68Mar-93 1.50 May-97 2.80 Dec-01 2.23Apr-93 1.10 Jun-97 4.10 Jan-02 2.50
May-93 2.20 Jul-97 3.90 Feb-02 3.95Jun-93 3.30 Aug-97 3.60Jul-93 4.50 Sep-97 3.90 Marlborough West
Aug-93 3.80 Oct-97 4.00 Date P (mg/L) Date P (mg/L) Date P (mg/L)Sep-93 3.20 Nov-97 3.60 May-95 3.80 Apr-96 0.60 Feb-01 0.80Oct-93 1.00 Dec-97 3.00 Jun-95 9.50 May-96 1.90 Mar-01 2.00Nov-93 1.00 Jan-98 1.90 Jul-95 9.40 Jun-96 3.80 Nov-01 1.80Dec-93 1.00 Feb-98 1.50 Aug-95 7.70 Jul-96 2.00 Dec-01 2.80Jan-94 1.60 Mar-98 1.00 Sep-95 7.50 Aug-96 5.70 Jan-02 2.50Feb-94 1.80 Apr-98 1.50 Oct-95 5.30 Sep-96 2.00 Feb-02 2.50Mar-94 1.20 May-98 2.00 Oct-96 1.40Apr-94 0.68 Jun-98 3.40 Apr-97 2.00
May-94 0.70 Jul-98 2.30 May-97 1.40Jun-94 2.00 Aug-98 3.00 Jun-97 1.40Jul-94 2.80 Sep-98 3.60 Jul-97 2.80
Aug-94 2.70 Oct-98 2.50 Aug-97 5.10Sep-94 2.60 Nov-98 3.20 Sep-97 3.70Oct-94 2.30 Dec-98 2.50 Oct-97 2.50Nov-94 2.20 Jan-99 1.90 Apr-98 2.00Dec-94 1.50 Feb-99 1.30 May-98 2.20
Mar-99 1.40 Jun-98 1.70Apr-99 2.20 Jul-98 1.70
May-99 3.00 Jul-98 2.50Jun-99 4.10 Aug-98 3.40Jul-99 4.30 Sep-98 6.00
Aug-99 3.60 Oct-98 6.30Sep-99 2.30Oct-99 1.60 MaynardNov-99 2.10 Date P (mg/L) Date P (mg/L)Dec-99 1.40 Apr-93 2.32 Feb-01 3.78Jan-00 1.50 May-93 3.53 Mar-01 2.53Feb-00 2.20 Jun-93 4.02 Nov-01 1.79Mar-00 1.10 Jul-93 4.40 Dec-01 3.71Apr-00 1.30 Aug-93 4.80 Jan-02 3.71
May-00 1.64 Sep-93 4.80 Feb-02 3.94Jun-00 1.20 Apr-94 3.95Jul-00 1.90 May-94 3.44
Jun-94 4.33Jul-94 4.32
Aug-94 5.07Sep-94 4.63
Page 5-5 August, 2003 Review of Potential Reduction in P Loading from Machine Dishwashing Detergents
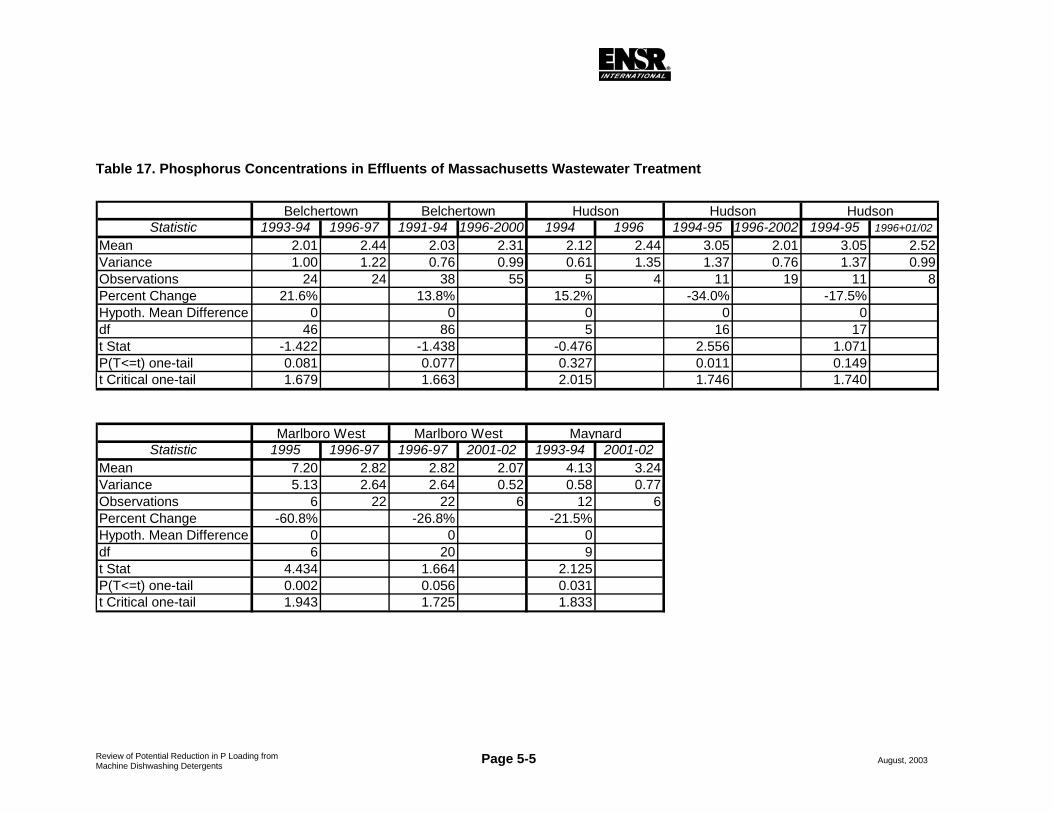
Table 17. Phosphorus Concentrations in Effluents of Massachusetts Wastewater Treatment
Statistic 1993-94 1996-97 1991-94 1996-2000 1994 1996 1994-95 1996-2002 1994-95 1996+01/02
Mean 2.01 2.44 2.03 2.31 2.12 2.44 3.05 2.01 3.05 2.52Variance 1.00 1.22 0.76 0.99 0.61 1.35 1.37 0.76 1.37 0.99Observations 24 24 38 55 5 4 11 19 11 8Percent Change 21.6% 13.8% 15.2% -34.0% -17.5%Hypoth. Mean Difference 0 0 0 0 0df 46 86 5 16 17t Stat -1.422 -1.438 -0.476 2.556 1.071P(T<=t) one-tail 0.081 0.077 0.327 0.011 0.149t Critical one-tail 1.679 1.663 2.015 1.746 1.740
Statistic 1995 1996-97 1996-97 2001-02 1993-94 2001-02Mean 7.20 2.82 2.82 2.07 4.13 3.24Variance 5.13 2.64 2.64 0.52 0.58 0.77Observations 6 22 22 6 12 6Percent Change -60.8% -26.8% -21.5%Hypoth. Mean Difference 0 0 0df 6 20 9t Stat 4.434 1.664 2.125P(T<=t) one-tail 0.002 0.056 0.031t Critical one-tail 1.943 1.725 1.833
Hudson
Marlboro West Marlboro West Maynard
Belchertown Belchertown Hudson Hudson
Page 5-6 August, 2003 Review of Potential Reduction in P Loading from Machine Dishwashing Detergents
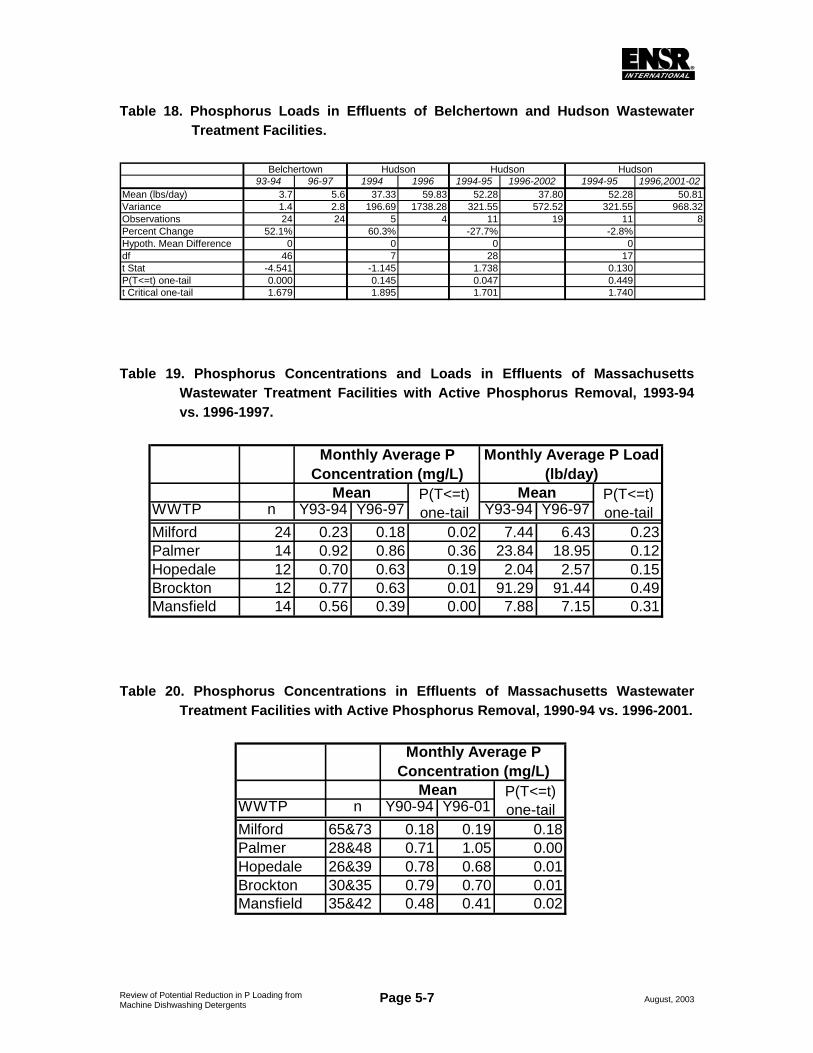
concentration in the effluent actually increased after the ban on sale of high P laundry detergent. The change was not significant at the 0.05 probability level (required threshold of 95% chance of being truly different), but the important point is that the P concentration did not decline. This relationship holds true whether the comparison is for 1993-94 vs. 1996-97 or for 1991-94 vs. 1996-2000 data from Table 16. Applying the same analysis to the load of P (concentration X flow), there was a statistically significant increase of 52% (Table 18). The combination of increased P concentration and increased flow since the ban result in this rather striking increase; factors other than laundry detergent are apparently much more influential in this system.
The Hudson WWTF proved more complicated to assess. There are limited applicable data for 1994-96, after which treatment for P removal was applied on and off from mid-1996 through 2000. Treatment was not applied for P removal in the winter, but winter data are available only for 2001-2002. Comparison of only 1994 and 1996 data indicates an increase in P concentration, although it is not statistically significant at the 0.05 level (Table 18). Lumping the 1995 values with the 1994 values as pre-ban data, and comparing these with applicable 1996-2002 data for the post-ban period, a statistically significant 34% decrease in P concentration is obtained. However, comparing the 1994-95 data with only the winter 2001-2002 data, a statistically insignificant decrease of 17.5% is obtained. While the winter 2001-2002 values are known to reflect no active P removal, it is difficult to be certain that all 1996-2000 values are from periods with no chemical coagulation of P.
Repetition of this analysis with P loads (as performed with Belchertown data above) yields a similar pattern (Table 18). Apparent changes based on comparisons of 1994 and 1996 data or 1994-95 and 1996 + 2001-002 data are not statistically significant. Inclusion of all potentially applicable 1996-2002 data provides a statistically significant decrease in P load of slightly less than 28%. While it is uncertain that this decrease is related to the laundry detergent P ban, it is consistent with decreases measured after similar bans in other states (e.g., Walker as cited in IEP and Walker, 1991).
Data for effluent P from the Marlborough West WWTF were not available prior to 1995. Comparison of 1995 data to those from 1996-97 (Table 17) yielded a major decline in P level (60.8%). This WWTF had very little P removal from expected influent levels in 1993-94, and did not institute strong P removal until 1999, after which removal was practiced in April through October only. An additional apparent decrease in P concentration between 1996-97 and winter of 2001-2002 was not significant, but adding the winter data to the 1996-97 data did strengthen the comparison of pre- and post-ban effluent P levels. Where wastewater treatment is limited, it does appear that changes in the influent can alter the effluent, but such cases are rare or absent in Massachusetts today.
Page 5-7 August, 2003 Review of Potential Reduction in P Loading from Machine Dishwashing Detergents
Table 18. Phosphorus Loads in Effluents of Belchertown and Hudson Wastewater Treatment Facilities.
93-94 96-97 1994 1996 1994-95 1996-2002 1994-95 1996,2001-02Mean (lbs/day) 3.7 5.6 37.33 59.83 52.28 37.80 52.28 50.81Variance 1.4 2.8 196.69 1738.28 321.55 572.52 321.55 968.32Observations 24 24 5 4 11 19 11 8Percent Change 52.1% 60.3% -27.7% -2.8%Hypoth. Mean Difference 0 0 0 0df 46 7 28 17t Stat -4.541 -1.145 1.738 0.130P(T<=t) one-tail 0.000 0.145 0.047 0.449t Critical one-tail 1.679 1.895 1.701 1.740
Hudson Hudson HudsonBelchertown
Table 19. Phosphorus Concentrations and Loads in Effluents of Massachusetts Wastewater Treatment Facilities with Active Phosphorus Removal, 1993-94 vs. 1996-1997.
WWTP n Y93-94 Y96-97 Y93-94 Y96-97Milford 24 0.23 0.18 0.02 7.44 6.43 0.23Palmer 14 0.92 0.86 0.36 23.84 18.95 0.12Hopedale 12 0.70 0.63 0.19 2.04 2.57 0.15Brockton 12 0.77 0.63 0.01 91.29 91.44 0.49Mansfield 14 0.56 0.39 0.00 7.88 7.15 0.31
Mean Mean
Monthly Average P Load (lb/day)
Monthly Average P Concentration (mg/L)
P(T<=t) one-tail
P(T<=t) one-tail
Table 20. Phosphorus Concentrations in Effluents of Massachusetts Wastewater Treatment Facilities with Active Phosphorus Removal, 1990-94 vs. 1996-2001.
WWTP n Y90-94 Y96-01Milford 65&73 0.18 0.19 0.18Palmer 28&48 0.71 1.05 0.00Hopedale 26&39 0.78 0.68 0.01Brockton 30&35 0.79 0.70 0.01Mansfield 35&42 0.48 0.41 0.02
Monthly Average P Concentration (mg/L)
Mean P(T<=t) one-tail
Page 5-8 August, 2003 Review of Potential Reduction in P Loading from Machine Dishwashing Detergents
Finally, the Maynard WWTF initiated chemical P removal in 1995, but does not apply this treatment during the winter. However, as no winter P values were available until 2001-2002, the only comparison that could be made was between 1993-94 data and winter 2001-2002 values. This comparison indicated a statistically significant 21.5% decrease in effluent P. Changes in many inputs over that 8-year period could be responsible, but this reduction is consistent with that observed for some other facilities in other states as noted previously.
It is not possible to unequivocally conclude from the available, applicable data that the ban on sale of high P laundry detergent had a consistent and significant effect on effluent P concentrations for WWTFs with no processes focused on removal of P. However, the data upon which the analysis was based are not ideal for this use. Depending upon what assumptions an analyst is willing to make, the laundry detergent P ban resulted in effluent P decreases of 0 to 61%.
Evaluation of a few selected WWTFs that do remove P by chemical addition during primary or secondary processes suggests that they all exhibited a decrease in effluent P concentration after 1995, and that three out of five decreases were statistically significant at the 0.05 probability level (Table 19). However, comparison of effluent P loads for the same periods revealed only three decreases, and none were significant. Inclusion of all values from 1990-94 as pre-ban data and all values from 1996-2001 as post-ban data, the pattern changes somewhat (Table 20). Two WWTFs exhibit increases in effluent P (one significant, one not), while three exhibit small but statistically significant decreases in effluent P. Observed small fluctuations in P concentration from facilities actively removing P, whether significant or not, are driven by factors other than the change in laundry detergent formulation and are unimportant to environmental impacts of WWTF discharge.
Comparing these results to those for VT, MD and MI, it appears that where WWTF processes are rudimentary (primary treatment), the potential for input controls to translate into output concentration changes could be substantial. Primary treatment typically removes about 10% of the phosphorus, and then only particulate forms, so actions that reduce the input of P, especially dissolved P, can alter effluent concentration (Metcalf and Eddy 1979). With typical primary WWTF effluent values around 6-8 mg/L, the removal of P from laundry detergent could result in effluent P concentrations of around 3-5 mg/L. For WWTFs with secondary treatment, much more P (40-60%) is removed by typical processes, and only small additional reductions should be expected from removal of laundry detergent P from the inflow. Concentrations of 3-6 mg/L might be lowered to 2-5 mg/L, not enough to be statistically detectable with the data collected at many facilities. Where a WWTF practices active P removal through chemical additions in primary or secondary treatment processes, effluent P levels <1 mg/L can be routinely obtained, and reductions in input concentrations become inconsequential.
Page 5-9 August, 2003 Review of Potential Reduction in P Loading from Machine Dishwashing Detergents
5.3 Implications for Dishwasher Detergent Bans
The per capita use of automatic dishwashing detergent (0.078 kg/capita/yr) is about 28% of the pre-ban per capita use of laundry detergent (0.28 kg/capita/yr). It could therefore be reasonably expected that a dishwashing detergent P ban might yield a reduction in effluent P level equivalent to 28% of that achieved by the laundry detergent P ban.
The assessment of the results of the laundry detergent P ban has revealed highly variable changes in WWTF effluent concentrations. Variability appears to be mainly related to the level of treatment provided by the WWTF. For Massachusetts, the overall decrease that can be expected is minimal, as 21 of the 24 WWTFs evaluated had P removal capability at the time of the ban, and all have this capacity now. Some WWTFs do not practice P removal during the winter, but this is a function of regulatory determination of a lack of impact from winter discharges, so reduced inputs would appear to have limited value.
Based on the lack of any measurable P decrease from the laundry detergent P ban for WWTFs practicing P removal, no decrease from a ban on P in machine dishwashing detergent can be expected. For facilities not practicing P removal, there could be a decrease on the order of 6-17% for primary treatment facilities (28% of 20-60%) and 0-6% for secondary treatment facilities (28% of 0-20%) based on the scenarios presented previously. However, virtually all WWTFs in MA and VT (and all of USEPA Region I) that discharge to freshwater now practice some form of P removal. Consequently, no detectable decrease in effluent P is expected for WWTFs in these states with any decrease in inputs, including any reduction that could occur as a result in elimination of phosphorus from machine dishwashing detergents.
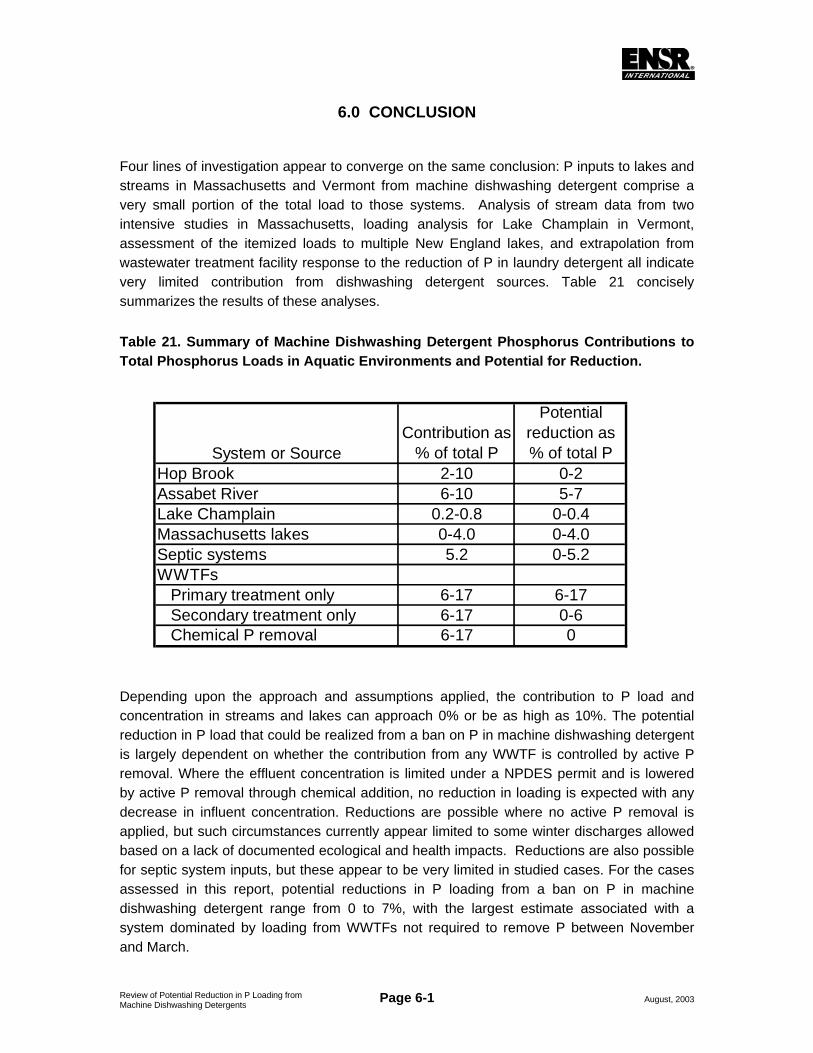
Page 6-1 August, 2003 Review of Potential Reduction in P Loading from Machine Dishwashing Detergents
6.0 CONCLUSION
Four lines of investigation appear to converge on the same conclusion: P inputs to lakes and streams in Massachusetts and Vermont from machine dishwashing detergent comprise a very small portion of the total load to those systems. Analysis of stream data from two intensive studies in Massachusetts, loading analysis for Lake Champlain in Vermont, assessment of the itemized loads to multiple New England lakes, and extrapolation from wastewater treatment facility response to the reduction of P in laundry detergent all indicate very limited contribution from dishwashing detergent sources. Table 21 concisely summarizes the results of these analyses.
Table 21. Summary of Machine Dishwashing Detergent Phosphorus Contributions to Total Phosphorus Loads in Aquatic Environments and Potential for Reduction.
Depending upon the approach and assumptions applied, the contribution to P load and concentration in streams and lakes can approach 0% or be as high as 10%. The potential reduction in P load that could be realized from a ban on P in machine dishwashing detergent is largely dependent on whether the contribution from any WWTF is controlled by active P removal. Where the effluent concentration is limited under a NPDES permit and is lowered by active P removal through chemical addition, no reduction in loading is expected with any decrease in influent concentration. Reductions are possible where no active P removal is applied, but such circumstances currently appear limited to some winter discharges allowed based on a lack of documented ecological and health impacts. Reductions are also possible for septic system inputs, but these appear to be very limited in studied cases. For the cases assessed in this report, potential reductions in P loading from a ban on P in machine dishwashing detergent range from 0 to 7%, with the largest estimate associated with a system dominated by loading from WWTFs not required to remove P between November and March.
System or SourceContribution as
% of total P
Potential reduction as % of total P
Hop Brook 2-10 0-2Assabet River 6-10 5-7Lake Champlain 0.2-0.8 0-0.4Massachusetts lakes 0-4.0 0-4.0Septic systems 5.2 0-5.2WWTFs Primary treatment only 6-17 6-17 Secondary treatment only 6-17 0-6 Chemical P removal 6-17 0
Page 6-2 August, 2003 Review of Potential Reduction in P Loading from Machine Dishwashing Detergents
Potential inputs from septic tanks appear to be lower than possible loading from wastewater treatment facilities, mainly as a function of high removal of P by soils. Even assuming minimum treatment levels based on actual measurements, septic systems do not appear to contribute enough P to cause problems in the vast majority of cases. Cases where septic systems do affect P levels to a significant degree are most likely a function of poor system design, construction and/or maintenance. Such deficiencies should be corrected independent of any P impacts, as there are health and ecological risks associated with other contaminants leaching from septic systems. Properly sited and operated septic systems are not expected to provide excessive P loading except in rare cases, and the fraction of this load attributable to dishwashing detergent is <5% and likely to be close to 0% for many water bodies.
Phosphorus removal rates and loading from most wastewater treatment facilities is a function of treatment processes. Secondary treatment is most common, and results in P levels in excess of 1 mg/L in nearly all cases in the absence of chemical addition for P removal. Where chemical additions are made during primary or secondary processes, effluent levels are typically between 0.3 and 1.0 mg/L, independent of influent P concentration. Unless dilution is extreme, these levels will still be excessive in lakes. The fraction of the total P load contributed by machine dishwashing detergent is estimated at no more than 10% (for systems like the Assabet River that are dominated by WWTF effluent with limited P removal). Such impacted systems are becoming rare as greater P removal is required through the NPDES permit renewal process. Systems with WWTFs that apply active P removal all year or where septic systems are the primary form of wastewater treatment tend to have lower contributions by machine dishwashing detergents, on the order of 5% or less of the loads received by the aquatic environment.
Reductions achieved by limiting P in dishwashing detergent will still result in excessive P loading from wastewater treatment facilities unless active P removal is practiced. Improved P removal in wastewater treatment facilities and lower loading to aquatic habitats will be a function of improved treatment, not reduced influent concentrations.
August, 2003 Review of Potential Reduction in P Loading from Machine Dishwashing Detergents
7.0 REFERENCES
ACT. 1994. Monitoring Report for Lake Cochichewick, Andover, MA. Aquatic Control Technology, Sutton, MA.
ACT. 1996. Monitoring Report for Lake Cochichewick, Andover, MA. Aquatic Control Technology, Sutton, MA.
BEC. 1985. Diagnostic/Feasibility Study of Walker Pond, Sturbridge, Massachusetts. Baystate Environmental Consultants, Inc. East Longmeadow, MA.
BEC. 1986a. Diagnostic/Feasibility Study of Lake Massasoit. BEC, East Longmeadow, MA.
BEC. 1986b. Diagnostic/Feasibility Study for the Management of Quaboag and Quacumquasit Lakes. BEC, E. Longmeadow, MA.
BEC. 1988. Diagnostic/Feasibility Study for the Management of Silver Lake, Wilmington, Massachusetts. Baystate Environmental Consultants, Inc. East Longmeadow, MA.
BEC. 1989. Diagnostic/Feasibility Study for the Management of the Kettlehole Ponds, Springfield, Massachusetts. Baystate Environmental Consultants, Inc. East Longmeadow, MA.
BEC. 1993a. Diagnostic/Feasibility Study of Hamblin Pond, Barnstable, Massachusetts. Baystate Environmental Consultants, Inc. East Longmeadow, MA.
BEC. 1993b. Diagnostic/Feasibility Study for the Management of the Pembroke Ponds, Oldham, Furnace, Little Sandy Bottom, and Stetson, Pembroke, Massachusetts. Baystate Environmental Consultants, Inc. East Longmeadow, MA.
Berkshire Enviro-Labs. 1979. Aquatic Vegetation Control Application for Pontoosuc Lake, Pittsfield, MA. BEL, Inc., Lee, MA
Booman, K.A. and R.I. Sedlak. 1986. Phosphate detergents - a closer look. JWPCF 58:1091-1101.
CDM. 1986. Final Report Diagnostic/Feasibility Study Lake Quannapowitt, Town of Wakefield, MA. Camp Dresser & McKee Inc., Wakefield, MA.
CDM. 1987. Final Report Diagnostic/Feasibility Study Lake Boon, Towns of Hudson/Stow, MA. Camp Dresser & McKee Inc., Wakefield, MA.
August, 2003 Review of Potential Reduction in P Loading from Machine Dishwashing Detergents
CEI. 2000. Study of Oldham Pond. CEI, Tyngsboro, MA.
COLAP. 2001. Montoring Report for Lake Winthrop, Holliston, MA. COLAP, Holliston, MA.
DEM. 1994. Investigation of Big Bear Hole Pond, Massasoit State Forest, Taunton, MA. DEM, Boston, MA.
DEQE. 1979. Study of Otis Reservoir, Farmington River Basin. DEQE, Westborough, MA.
ENSR. 1997. Limnological Investigation of Stafford Pond, Tiverton, RI. ENSR, Northborough, MA.
ENSR. 1998. Bare Hill Pond Water Quality and Aquatic Plant Evaluation. ENSR, Northborough, MA.
ENSR. 1998-2001. Monitoring Data for Walker Pond and the Sturbridge Shopping Center. ENSR, Willington, CT.
ENSR. 1999a. Post-Implementation Study of Hills Pond, Arlington, MA. ENSR, Northborough, MA.
ENSR. 1999b. Review of Monitoring Data for the Mill River and Lake Massasoit. ENSR, Northborough, MA.
ENSR. 1999c. Evaluation of Silver Lake, Wilmington, MA. ENSR, Northborough, MA.
ENSR. 1999d. Monitoring Report for Halls Pond, Brookline, MA. ENSR, Northborough, MA.
ENSR. 2000a. Post-Implementation Study of Pontoosuc Lake. ENSR, Northborough, MA.
ENSR. 2000b. A Nutrient Impact Evaluation of Hop Brook in Marlborough and Sudbury, MA. ENSR, Acton, MA.
ENSR. 2000c. Diagnostic/Feasibility Study of Big Bear Hole Pond, Massasoit State Park, Taunton, Massachusetts. ENSR, Northborough, MA.
ENSR. 2000d. Lake Buel Plant Replacement Program: Final Report to DEM. ENSR, Northborough, MA.
ENSR. 2000e. Collection and Evaluation of Ambient Nutrient Data for Lakes, Ponds, and Reservoirs in New England. ENSR, Acton, MA.
August, 2003 Review of Potential Reduction in P Loading from Machine Dishwashing Detergents
ENSR. 2001a. SuAsCo Watershed Assabet River TMDL Study Phase One Final Report. Prepared for MA DEP, November 2001. ENSR, Westford, MA.
ENSR. 2001b. Diagnostic/Feasibility Study of Otis Reservoir, Otis and Tolland, Massachusetts. ENSR, Willington, CT.
ENSR. 2001c. Review of Monitoring Data, Quannapowitt Lake, Wakefield, Massachusetts. ENSR, Westford, MA.
ENSR. 2002. Assabet River Nutrient TMDL Model Application - Model Calibration. Technical Memorandum. ENSR, Westford, MA.
ESS. 2001a. Limnological Survey of Lake Boon, Hudson and Stow, MA. ESS, Wellesley, MA.
ESS. 2001b. Annual Monitoring Report for Morses Pond, Wellesley, MA. ESS, Wellesley, MA.
ESS. 2001c. Limnological Survey of Quacumquasit Pond, E. Brookfield, MA. ESS, Wellesley, MA.
Fugro. 1990-95. Annual Report of the Monitoring of Morses Pond, Wellesley, MA. Fugro, Inc.
IEP. 1982. Diagnostic/Feasibility Study of Lake Buel. IEP, Inc., Northborough, MA.
IEP and W. W. Walker. 1991. Phosphorus in Massachusetts Waters. Soap and Detergent Association, New York, NY.
Mattson, M., P. Godfrey, R. Barletta and A. Aiello. 1997. Eutrophication and Aquatic Plant Management in Massachusetts. Draft GEIR. MADEM/MADEP, Boston, MA.
M&E, 1979. Watewater Treatment Engineering. Metcalf and Eddy, Pasadena, CA.
M&E, 1986a. Final Report to the Town of Brookline on the Diagnostic/Feasibility Study of Halls Pond, Brookline, Massachusetts. Metcalf & Eddy, Inc.
M&E, 1986b. Final Report to the Town of Arlington on the Diagnostic/Feasibility Study of Hills Pond, Arlington, Massachusetts. Metcalf & Eddy, Inc.
August, 2003 Review of Potential Reduction in P Loading from Machine Dishwashing Detergents
Reckhow, K., M. Beaulac and J. Simpson. 1980. Modeling Phosphorus Loading and Lake Response Under Uncertainty: A Manual and Compilation of Export Coefficients. EPA 440/5-80-011.
SRI International. 1999. "Industrial Phosphate", Chemical Economics Handbook Marketing Research Report, 760.2500A, Stanford Research Institute International, CA.
UMASS. 2001. Data from the Watershed Watch Program. UMASS, Amherst, MA.
Vermont Department of Environmental Conservation. 1981. Special Report to the Vermont General Assembly on the Effectiveness of the Phosphorus Detergent Prohibition in Household Cleansing Products and Compliance with a 1.0 mg/L Discharge Limitation. VT DEC, Montpelier, VT.
Vermont Department of Environmental Conservation and New York State Department of Envrionmental Conservation. 1997. A Phosphorus Budget, Model and Load Reduction Strategy for Lake Champlain; Lake Champlain Diagnostic-Feasibility Study, Final Report. Submitted to USEPA, Region I and Region II, January, 1997.
Whitman and Howard. 1985. Final Report on the Diagnostic/Feasibility Study of Lake Winthrop, Holliston, Massachusetts. Whitman and Howard, Inc.
Whitman and Howard. 1987. Final Report on the Diagnostic/Feasibility Study of Bare Hill Pond, Harvard, Massachusetts. Whitman and Howard, Inc.


![Aquatic Ecosystems s [Read-Only] - Oregon State Universityoregonstate.edu/instruction/fw556/lecture/pdf/aquatic_ecosystems.pdf · Aquatic Ecosystems. Organic Inputs! Allochthonous](https://img.pdfslide.us/doc/110x75/5e522e616d98f111335a4f38/aquatic-ecosystems-s-read-only-oregon-state-u-aquatic-ecosystems-organic-inputs.jpg)