Embed Size (px)
Citation preview
In/Out Traffic Proportion Based In/Out Traffic Proportion Based Analyses for Network Anomaly Analyses for Network Anomaly DetectionDetection
By By Zhang FengXiangZhang FengXiang2006-07-172006-07-17
2
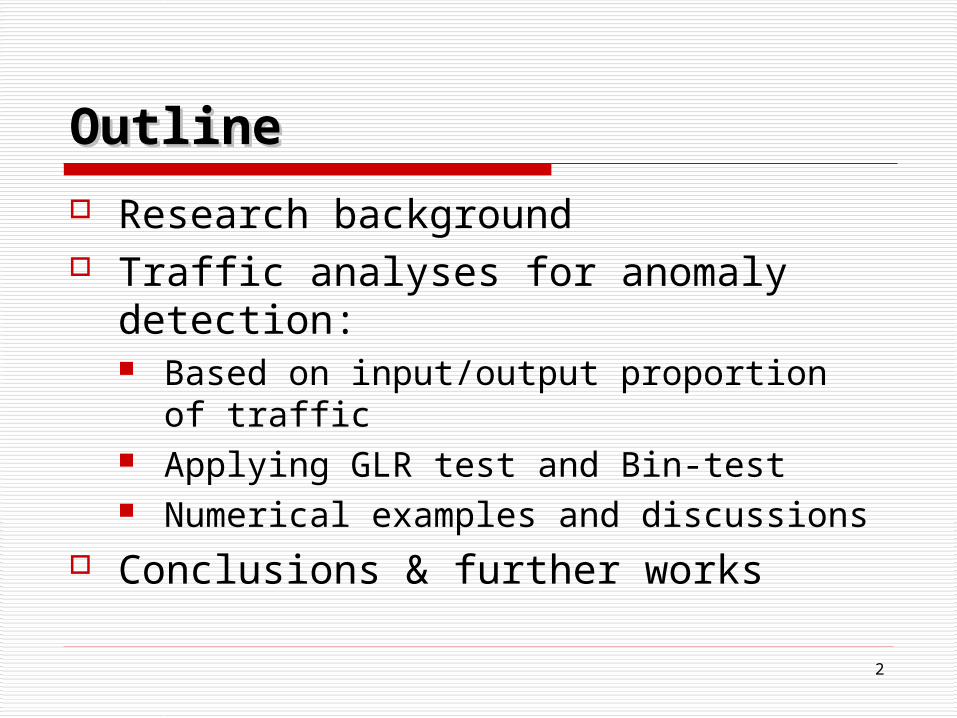
OutlineOutline
Research background Traffic analyses for anomaly
detection: Based on input/output proportion of
traffic Applying GLR test and Bin-test Numerical examples and discussions
Conclusions & further works
3
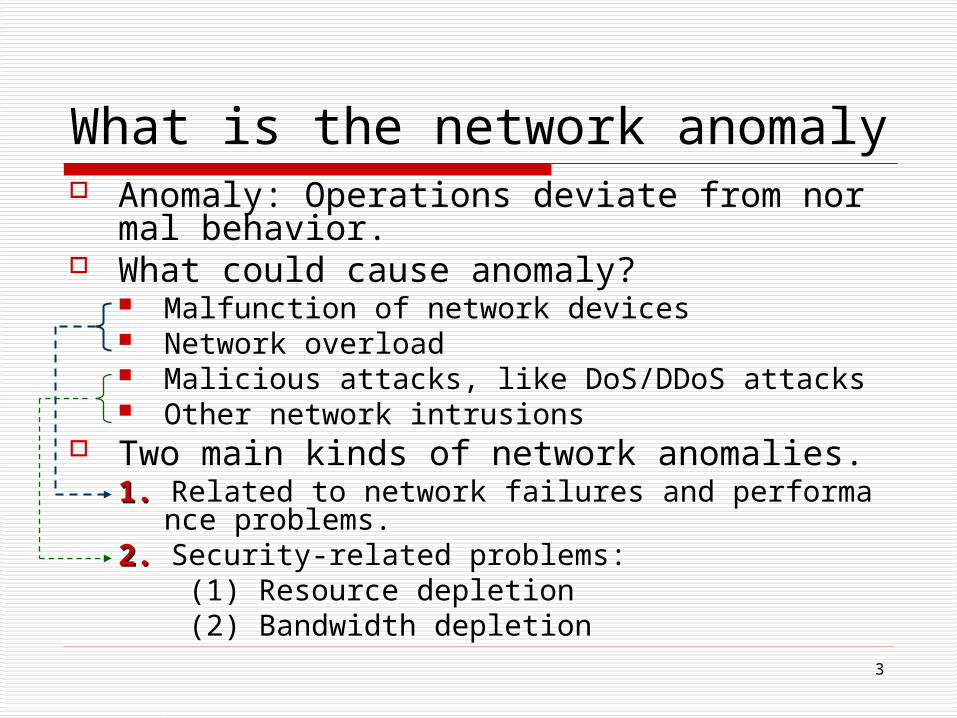
What is the network anomaly Anomaly: Operations deviate from normal beh
avior. What could cause anomaly?
Malfunction of network devices Network overload Malicious attacks, like DoS/DDoS attacks Other network intrusions
Two main kinds of network anomalies.1.1. Related to network failures and performance proble
ms.2.2. Security-related problems: (1) Resource depletion (2) Bandwidth depletion
4
Anomaly detection meets troubles
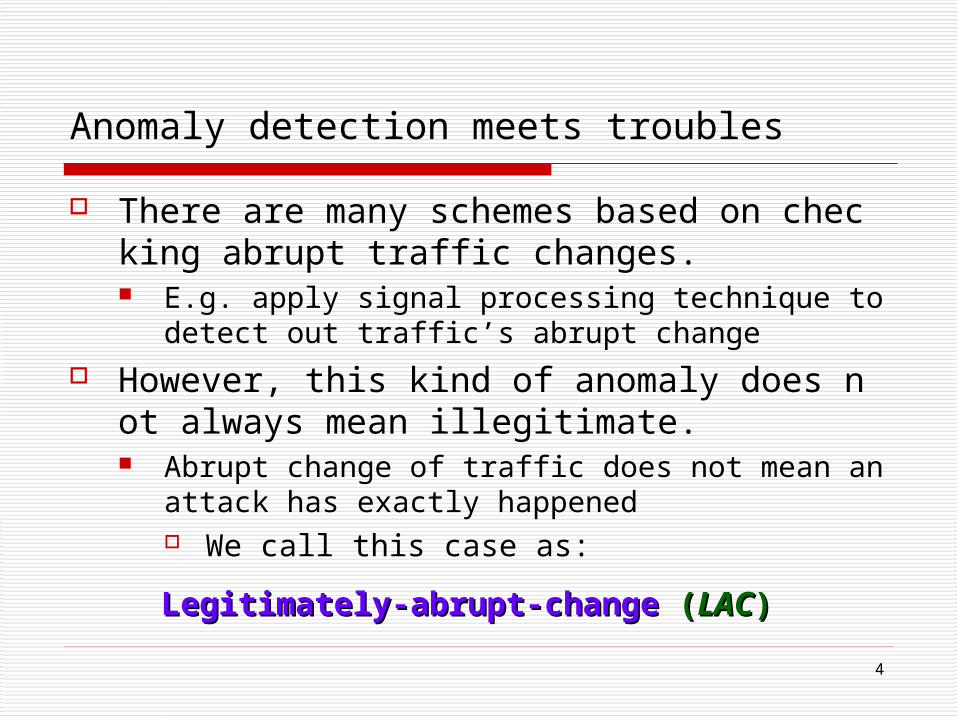
There are many schemes based on checking abrupt traffic changes. E.g. apply signal processing technique to detect ou
t traffic’s abrupt change However, this kind of anomaly does not always
mean illegitimate. Abrupt change of traffic does not mean an attack has
exactly happened We call this case as:
LLegitimately-egitimately-aabrupt-changebrupt-change ((LACLAC))
5
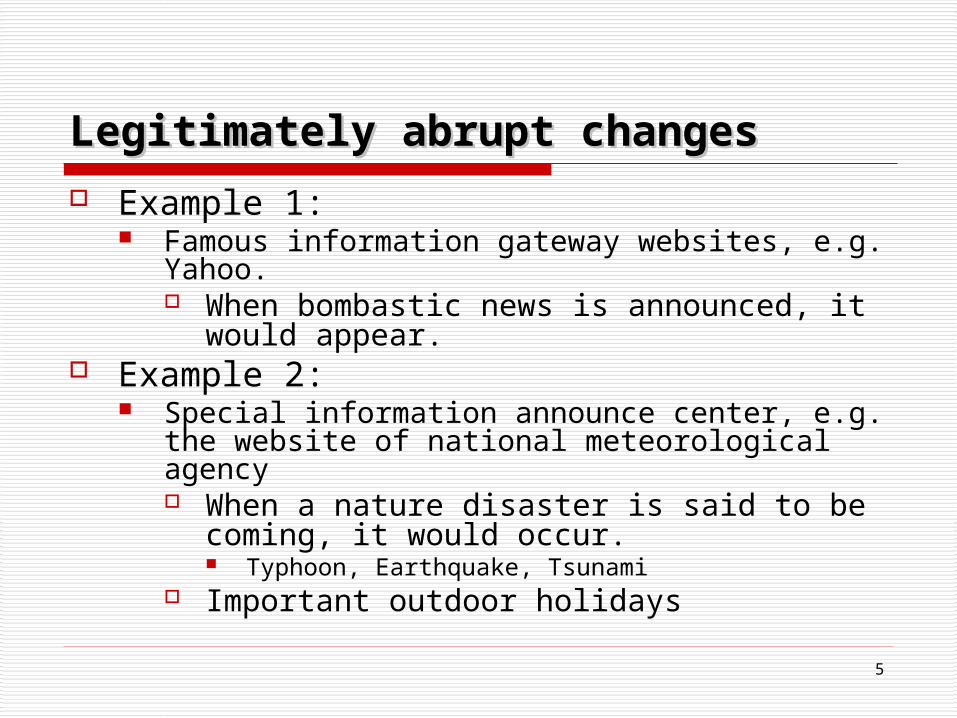
LLegitimatelyegitimately a abruptbrupt changechangess Example 1:
Famous information gateway websites, e.g. Yahoo. When bombastic news is announced, it would
appear. Example 2:
Special information announce center, e.g. the website of national meteorological agency When a nature disaster is said to be coming, i
t would occur. Typhoon, Earthquake, Tsunami
Important outdoor holidays
6
Existing anomaly detection schemes’ troubleExisting anomaly detection schemes’ trouble
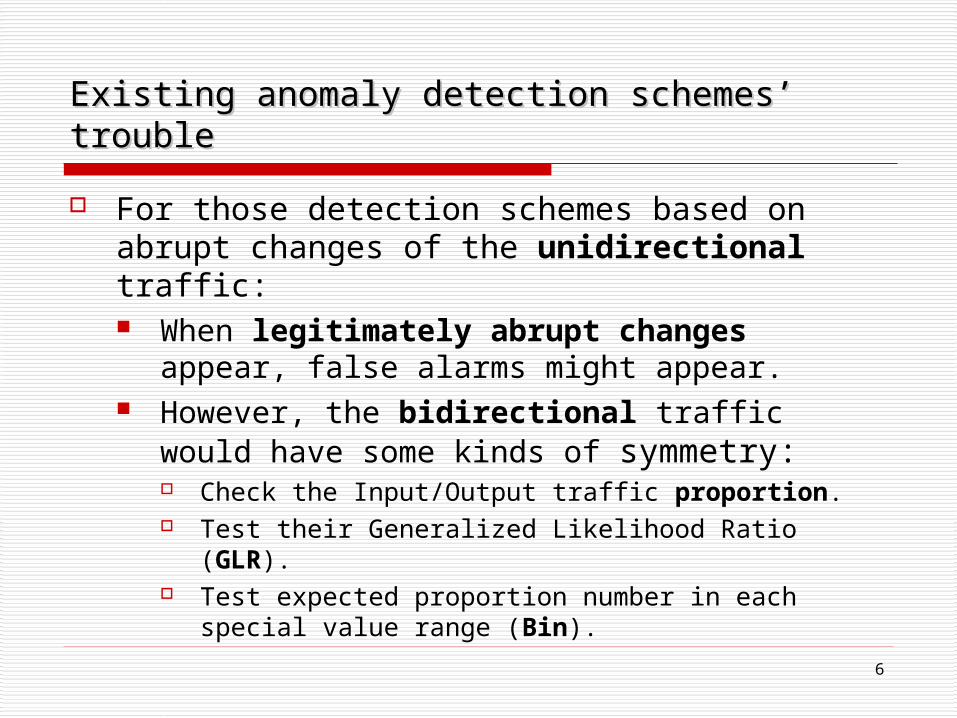
For those detection schemes based on abrupt changes of the unidirectional traffic: When legitimately abrupt changes
appear, false alarms might appear. However, the bidirectional traffic would
have some kinds of symmetry: Check the Input/Output traffic proportion. Test their Generalized Likelihood Ratio (GLR). Test expected proportion number in each
special value range (Bin).
7
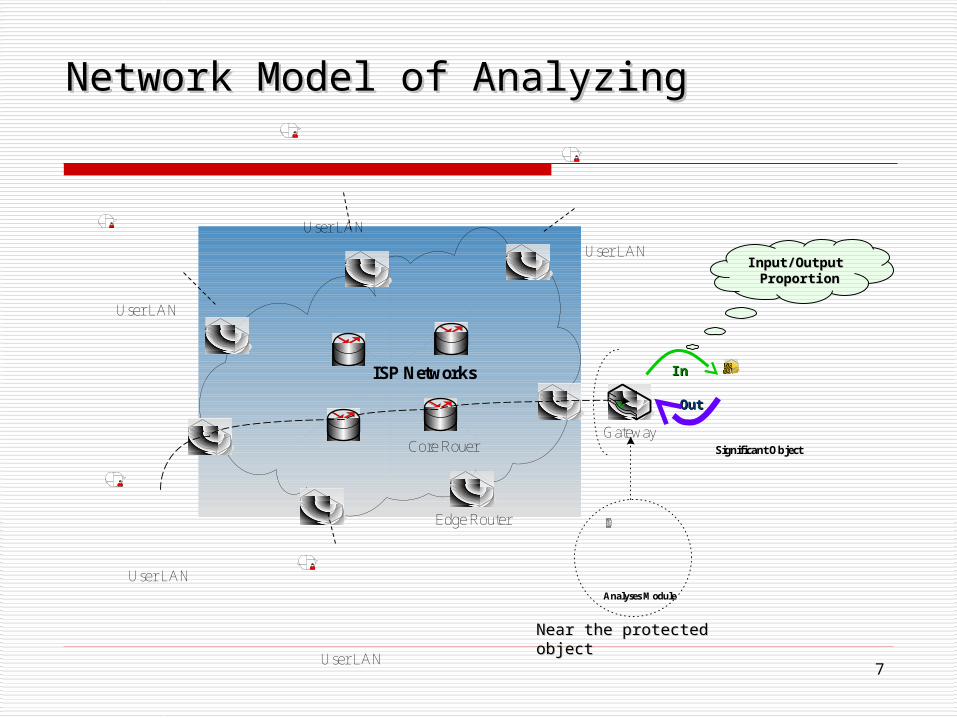
Network Model of AnalyzingNetwork Model of Analyzing
Core Rouer
ISP Networks
Edge Router
Analyses Module
User LAN
User LAN
User LAN
User LAN
User LAN
Significant Object
Gateway
InIn
OutOut
Input/Output Input/Output Proportion Proportion
Near the protected objectNear the protected object
In/Out Traffic Proportion Based In/Out Traffic Proportion Based AnalysesAnalyses
In/Out proportion, GLR and Bin test……
9
Detect abnormal changes of proportion
For existing LACs, we consider bidirectional traffics. For this case, the Input/Output proportion would not
change abruptly as well It seems be in a relatively narrow range.
Due to the nature of the TCP protocol there is a loose symmetry on the In/Out packet rates.
In the legitimate use of networks, more are the request packets, more are the response packets. Almost all bandwidth attacks destroy this attribute.
10
Generalized Likelihood Ratio test In statistical analysis, network anomalies
are modeled as correlated abrupt changes in time series of network data.
GLR shows the likelihood of the residuals in two adjacent windows. Abrupt changes are detected by comparing the
variance in two windows. When GLR is closer to 1, the data
distribution in test window is more likely to happen after the learn window It is more likely to be anomaly when GLR is
smaller then a preset threshold.
11
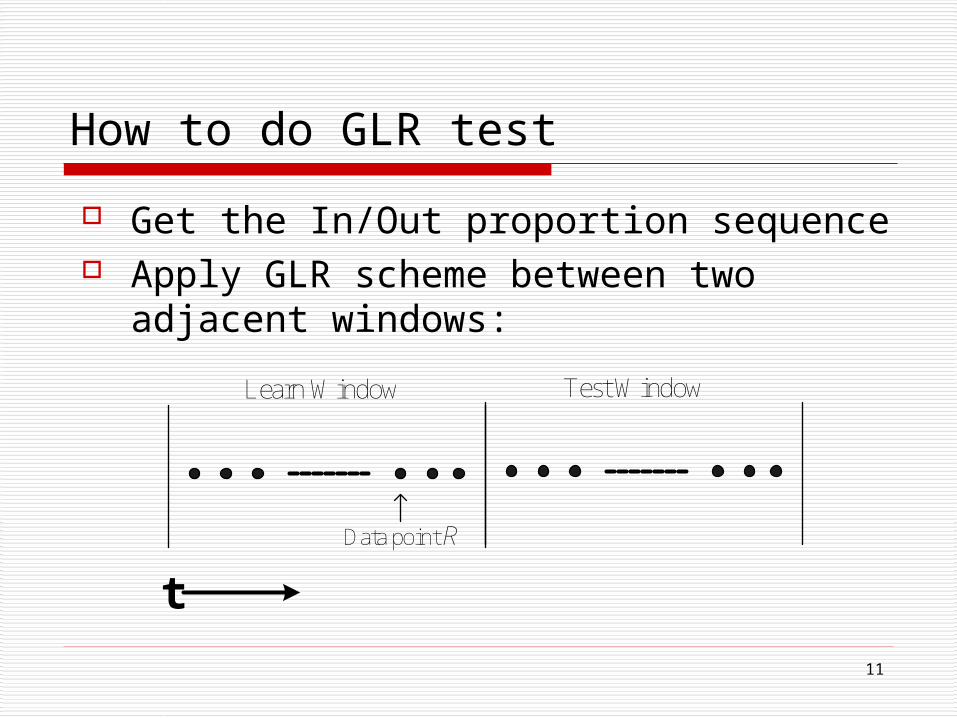
How to do GLR test
Get the In/Out proportion sequence Apply GLR scheme between two
adjacent windows:
t
Data point R
Learn Window Test Window
12
Calculation of GLR
Abrupt changes in time series data can be modeled using an auto-regressive (AR) process. Abrupt changes are correlated in time,
yet are short-range dependent. As some other detection schemes, we
use an AR process of order 1 here to model the data in a 80-sec window.
13
t
Data point R
Learn Window Test Window
2 2
1
1( )
1
W
LL Lii
S R RW
=
2 2
1
1( )
1
W
SS Sii
S R RW
=
22 2
1
1( )
2 1
W
PP Pii
S R RW
( 1)
( 1) 2( 1)
( )
( )
WL S
W WL S P
S S
S S S
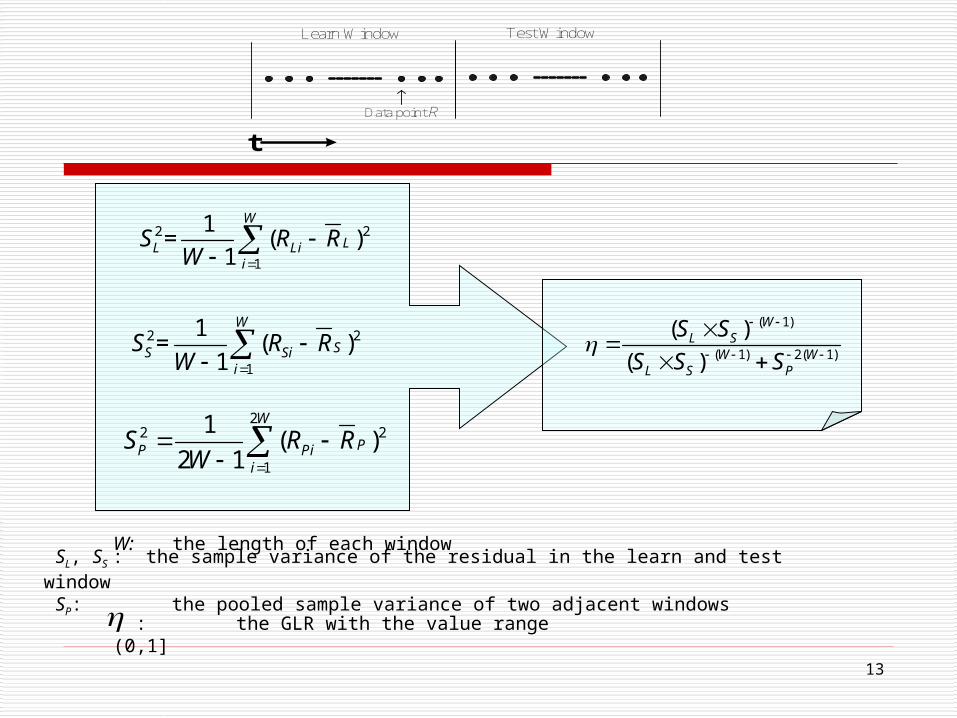
SL, SS : the sample variance of the residual in the learn and test window
SP: the pooled sample variance of two adjacent windows : the GLR with the value range (0,1]
W: the length of each window
14
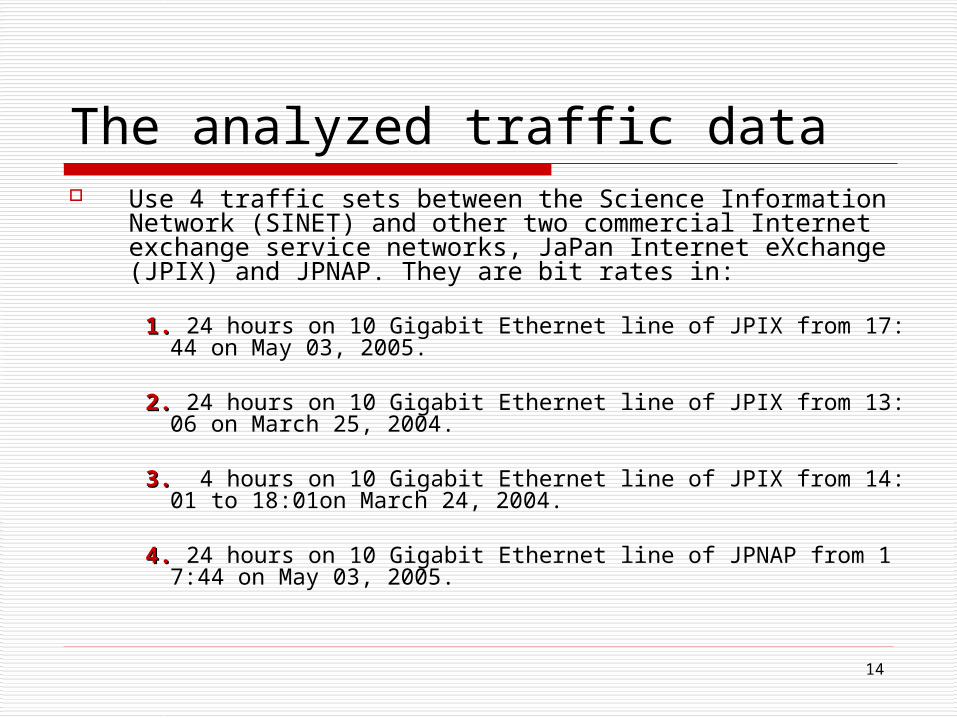
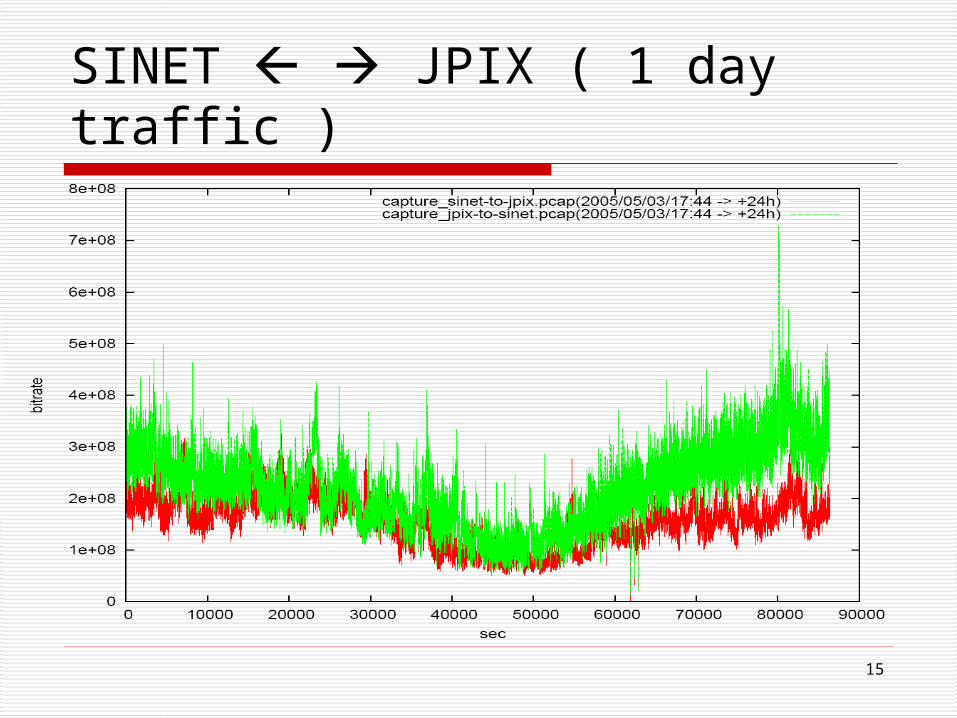
The analyzed traffic data Use 4 traffic sets between the Science Information Network
(SINET) and other two commercial Internet exchange service networks, JaPan Internet eXchange (JPIX) and JPNAP. They are bit rates in:
1.1. 24 hours on 10 Gigabit Ethernet line of JPIX from 17:44 on May 03, 2005.
2.2. 24 hours on 10 Gigabit Ethernet line of JPIX from 13:06 on March 25, 2
004.
3.3. 4 hours on 10 Gigabit Ethernet line of JPIX from 14:01 to 18:01on March 24, 2004.
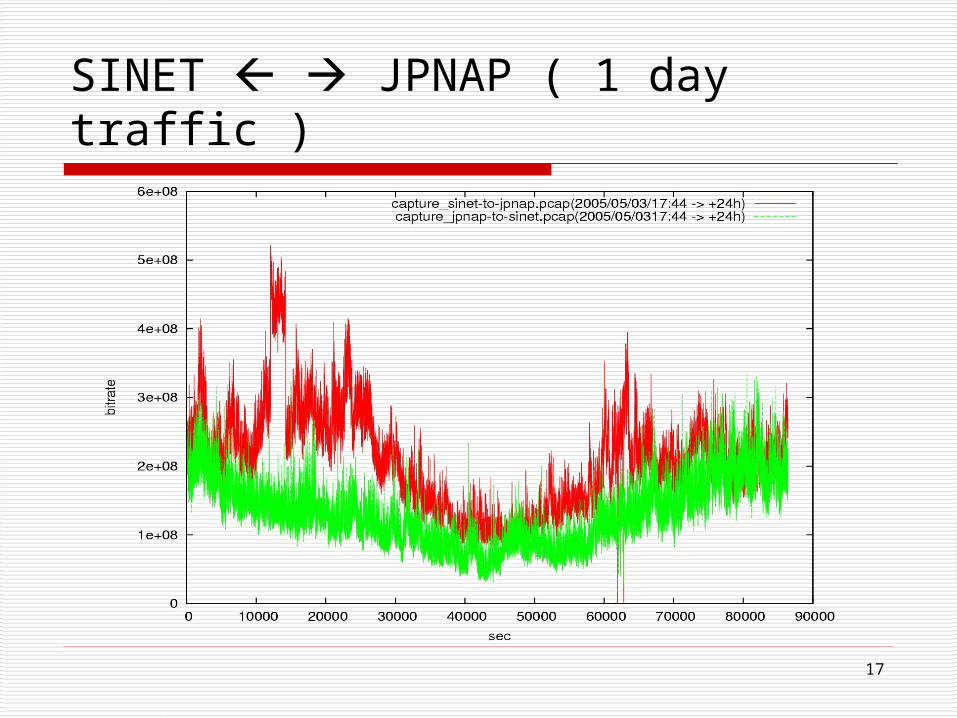
4.4. 24 hours on 10 Gigabit Ethernet line of JPNAP from 17:44 on May 03, 2005.
15
SINET JPIX ( 1 day traffic )
16
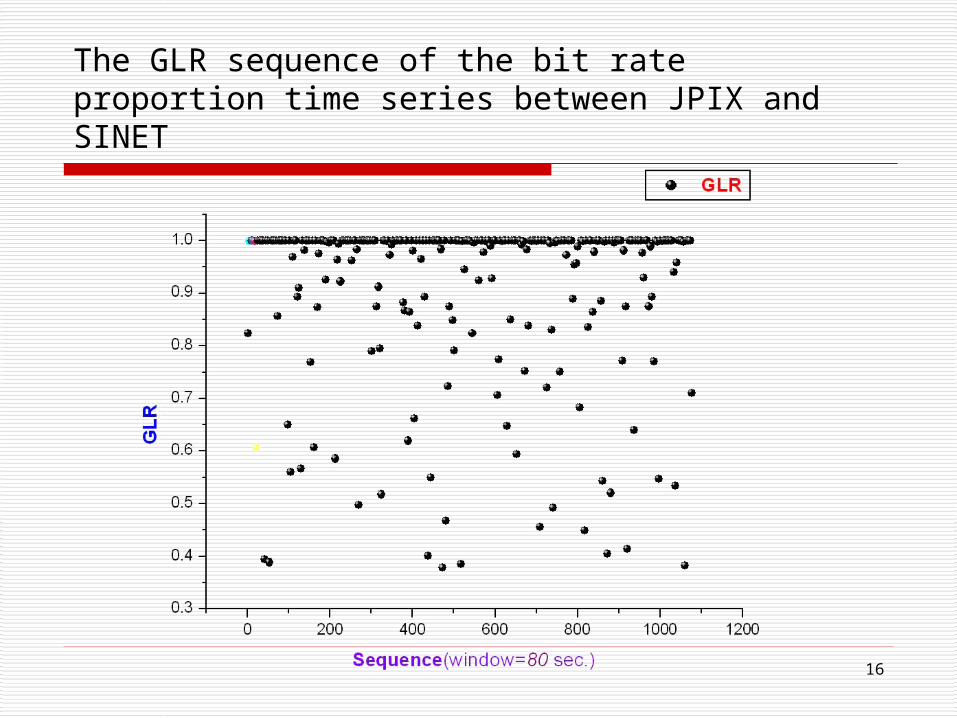
The GLR sequence of the bit rate proportion time series between JPIX and SINET
17
SINET JPNAP ( 1 day traffic )
18
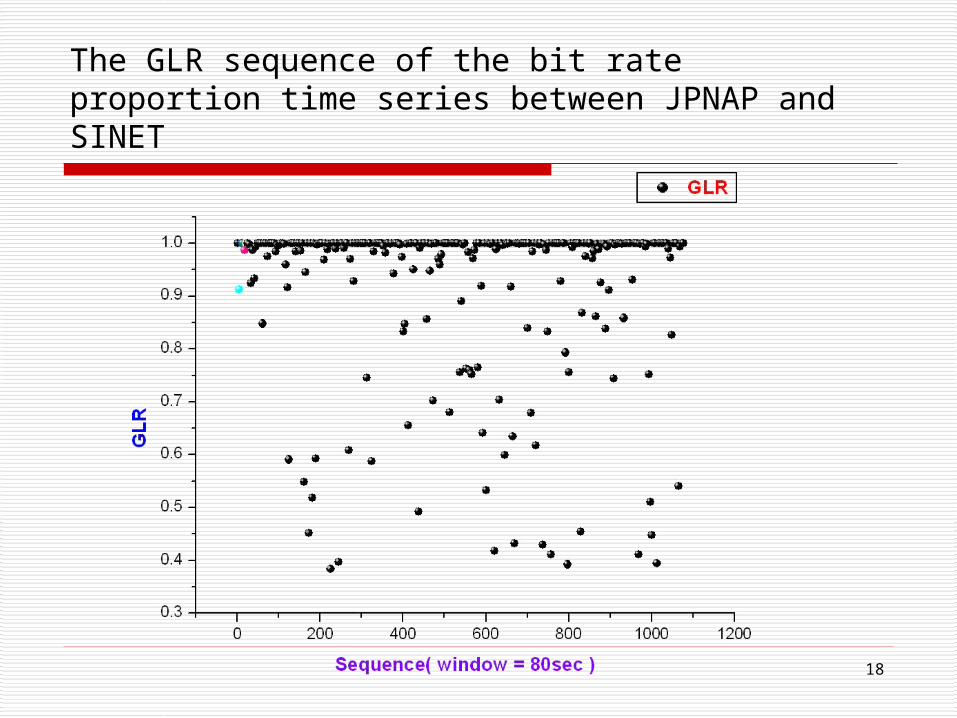
The GLR sequence of the bit rate proportion time series between JPNAP and SINET
19
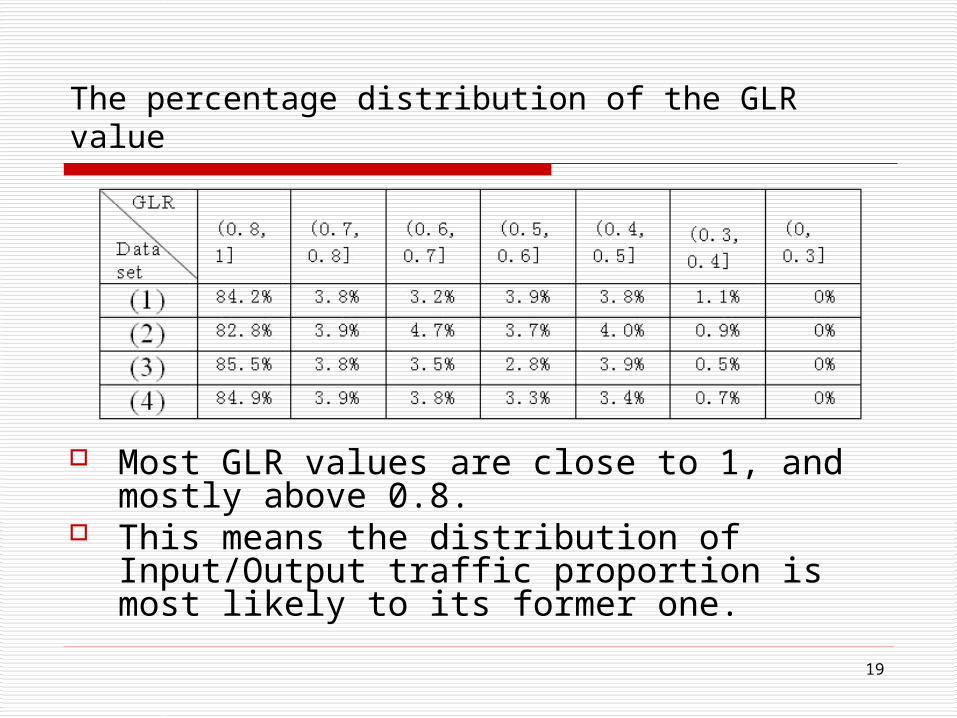
The percentage distribution of the GLR value
Most GLR values are close to 1, and mostly above 0.8.
This means the distribution of Input/Output traffic proportion is most likely to its former one.
20
Bin-test scheme According to proportion data, we can decide
several value ranges (bins). From most frequently appearing value range to
the seldom appearing value range Give the expected number of proportions in
each bin under the normal and legitimate case.
Test the data points in the observing window If not match the expected distribution of the bins,
alert.
21
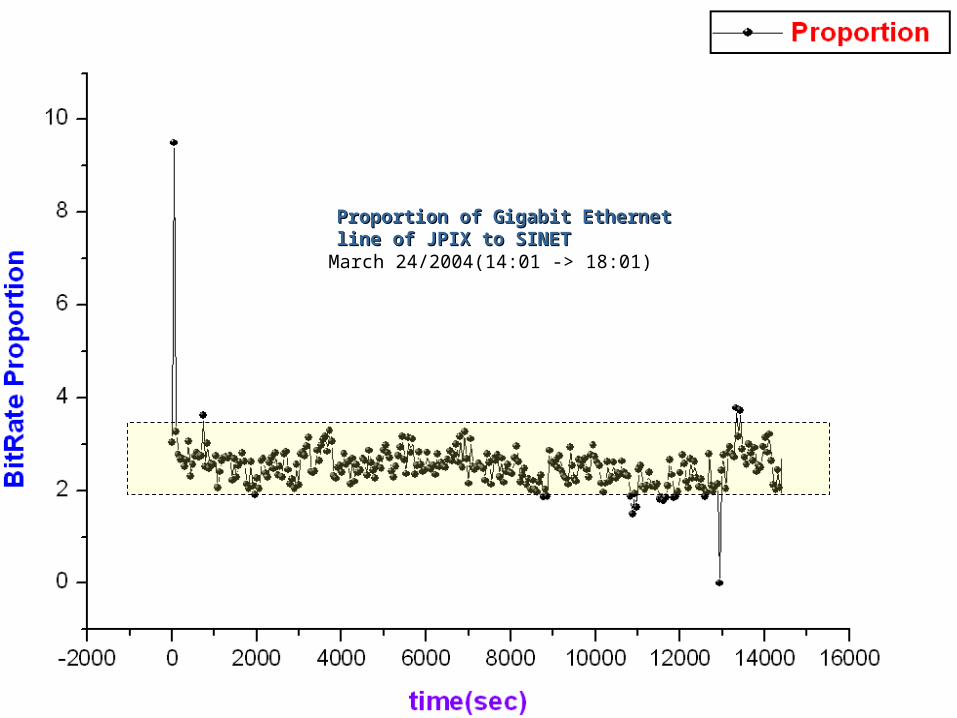
Proportion of Gigabit Ethernet Proportion of Gigabit Ethernet line of JPIX to SINETline of JPIX to SINETMarch 24/2004(14:01 -> 18:01)
22
An illustration of Bin-test
1:others
2
3
4
51st Most common
2nd Most common
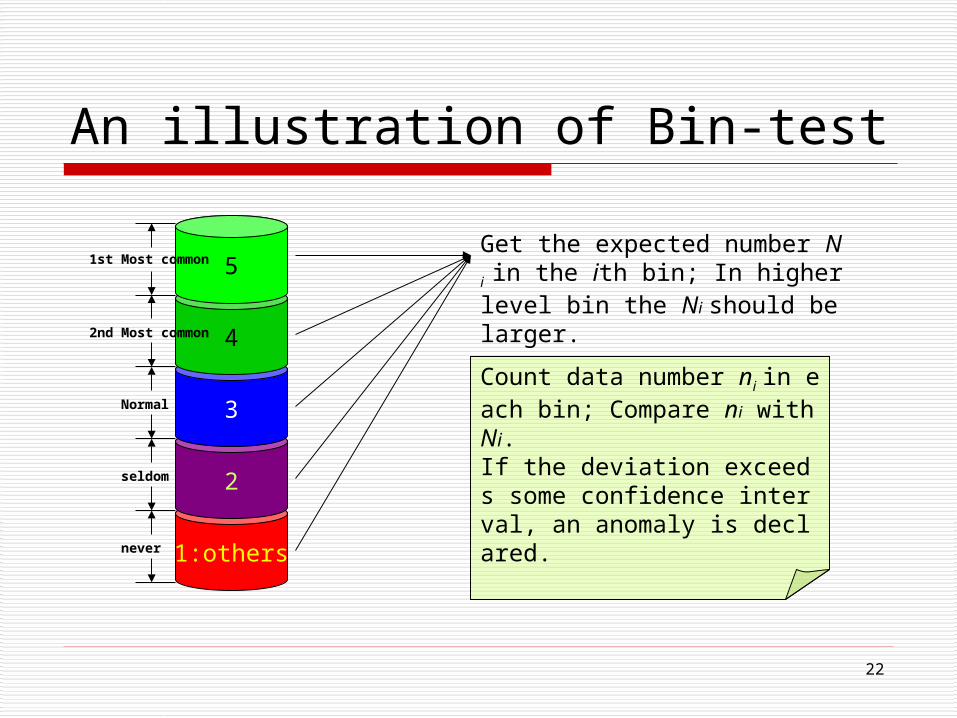
Get the expected number Ni in the ith bin; In higher level bin the Ni should be larger.
Normal
seldom
never
Count data number ni in each bin; Compare ni with Ni. If the deviation exceeds some confidence interval, an anomaly is declared.
23
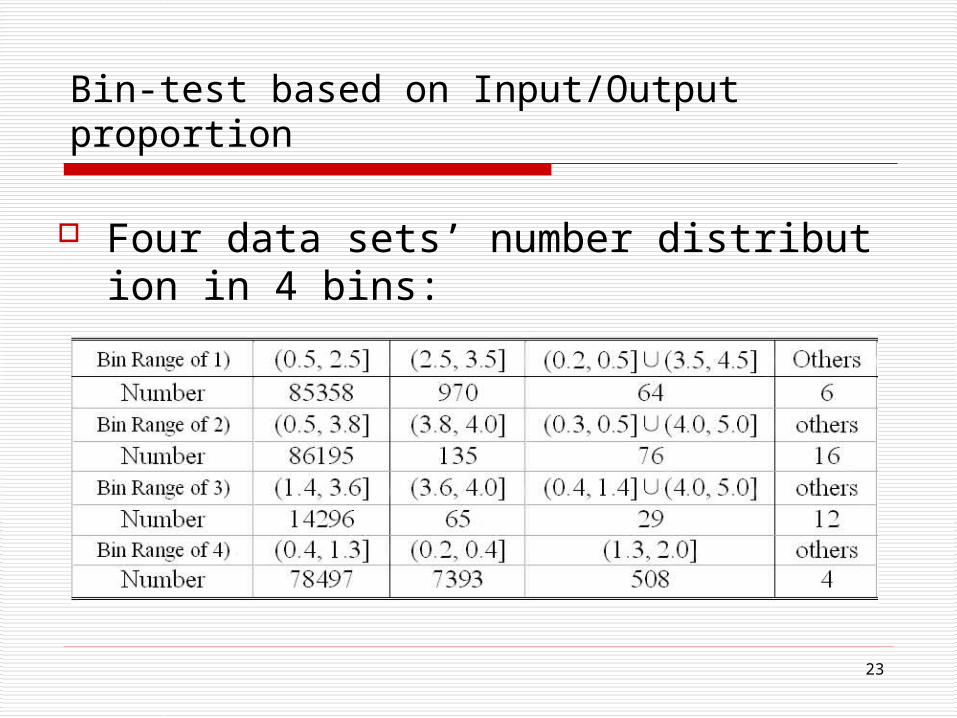
Bin-test based on Input/Output proportion
Four data sets’ number distribution in 4 bins:
24
Conclusions and future works
We’ve noticed the effects of the legitimately abrupt changes for anomaly detections.
Showed the bidirectional In/Out traffic monitored for the same networks is close to a constant. A valuable reference for reduction of false positive alar
ms in the detection of bandwidth attacks. Proposed a Bin-test detection method based on traffic an
alysis. In the future,
Further study the In/Out traffic proportion constancy. Simulate DoS/DDoS attacks and apply the detection schem
e.

Thank Thank You!You!
AdvicesAdvices??

![Deep Anomaly Detection - AiFrenzAI Friends]Deep Anomaly... · Deep Anomaly Detection Kang, Min-Guk Mingukkang1994@gmail.com Jan. 16, 2019 1/47](https://img.pdfslide.us/doc/110x75/5fb2a9a0b51b275c5a47b39a/deep-anomaly-detection-aifrenz-ai-friendsdeep-anomaly-deep-anomaly-detection.jpg)