Embed Size (px)
Citation preview

INFORMAL SETTLEMENTS IN THE FREE STATE - AUGUST 2013 RESEARCH REPORT
RESEARCH SERIES PUBLISHED BY THE HOUSING DEVELOPMENT AGENCY
RESEARCH REPORTS
Free State: Informal settlements Status (2013)

PAGE 2INFORMAL SETTLEMENTS IN THE FREE STATE - AUGUST 2013 RESEARCH REPORT
DISCLAIMERReasonable care has been taken in the preparation of this report. The information contained herein has been derived from sources believed to be accurate and reliable. The Housing Development Agency does not assume responsibility for any error, omission or opinion contained herein, including but not limited to any decisions made based on the content of this report.
The Housing Development Agency (HDA)Block A, Riviera Office Park,
6 – 10 Riviera Road,
Killarney, Johannesburg
PO Box 3209, Houghton,
South Africa 2041
Tel: +27 11 544 1000
Fax: +27 11 544 1006/7
Acknowledgements
• Eighty 20
© The Housing Development Agency 2013

PAGE 1INFORMAL SETTLEMENTS IN THE FREE STATE - AUGUST 2013 RESEARCH REPORT
Contents1 Introduction 3
2 Overview of census and survey data 4
2.1 Limitations of the Statistics South Africa data 4
2.2 Definition of informal settlements 5
3 A context for the findings: Broad housing trends 2001 to 2011
in the Free State 8
4 Number of households living in informal settlements in the
Free State 13
5 Profiling informal settlements in the Free State 16
5.1 Access to services 16
5.2 Household characteristics 20
5.3 Children in informal settlements 21
5.4 Migration 22
5.5 Employment and income 22
5.6 Housing waiting lists and subsidy housing 26
6 Profiling informal settlements in Mangaung 27
6.1 Number of households 27
6.2 Access to services 28
6.3 Household characteristics 29
7 Other non-survey data sources 31
7.1 Land and Property Spatial Information System (LaPsis) 31
7.2 Eskom’s Spot Building Count (also known as the Eskom Dwelling Layer) 31
7.3 Municipal data: Mangaung 31
7.4 Summary of estimates 32
8 Appendix: Municipal data on children and employment 33
9 Appendix: Statistics South Africa Surveys 34
9.1 Censuses 2011 and 2001 34
9.2 Census 2011: Derived household income 35
9.3 General Household Survey 2011 35
9.4 Income and Expenditure Survey 2010/11 36

PAGE 2INFORMAL SETTLEMENTS IN THE FREE STATE - AUGUST 2013 RESEARCH REPORT
List of abbreviationsEA Enumeration Area
GHS General Household Survey
HDA Housing Development Agency
IES Income and Expenditure Survey
LaPsis Land and Property Spatial Information System
NDHS National Department of Human Settlements
PSU Primary Sampling Unit
Stats SA Statistics South Africa

PAGE 3INFORMAL SETTLEMENTS IN THE FREE STATE - AUGUST 2013 RESEARCH REPORT
In terms of the HDA Act No. 23, 20081, the Housing Development Agency (“HDA”), is mandated
to assist organs of State with the upgrading of informal settlements. As part of the informal
settlements upgrading programme, the HDA commissioned this report to update existing analysis
on the profile of informal settlements in South Africa, nationally and provincially as well as for
some of the larger municipalities. The analysis draws heavily on newly released Census 2011 data
and also explores other data sources available at a national, provincial and municipal level to
characterise conditions in informal settlements and to identify key trends. This report summarises
available data for the Free State province.
PART 1
Introduction
1 The HDA Act No.23, 2008, Section 7 (1) k

PAGE 4INFORMAL SETTLEMENTS IN THE FREE STATE - AUGUST 2013 RESEARCH REPORT
PART 2
Overview of census and survey data
2 Angela Ngyende of Statistics South Africa provided on-going assistance in this regard
This chapter describes the key data sources used in this study and outlines relevant limitations
of the data as a precursor to exploring the data in more detail. As noted in the introduction, a
primary objective of the study is to explore findings of the recently released 2011 Census with
respect to informal settlements in South Africa, and to use that data to assess trends in terms
of the number of households that live in informal settlements, their characteristics and access to
basic services. The 2011 Census is thus the core data set explored in this review.
Aside from census data, the analysis is supplemented by other survey data sources including the
2010/11 Income and Expenditure Survey as well as the 2011 General Household Survey.
2.1 Limitations of the Statistics South Africa dataCurrently the 2011 Census data is available for analysis using Statistics South Africa’s SuperWEB
or SuperCROSS software. This system is not fully interactive; not all variables can be cross
tabulated. By way of example, education and employment data cannot be analysed by type of
main dwelling people live in. There are also variables that appear in the questionnaire that are
not available at all for analysis. Most pertinent to this analysis, these include construction material
of main dwelling, age of the dwelling and relationship to the head of the household. The 2011
Census 10% sample which will allow for a full interactive analysis will only be available towards
the end of 2013.
As noted a key objective is to identify trends. Because of provincial and municipal boundary
changes since 2001 the comparison of the Census 2011 with previous censuses requires
alignment of that data to 2011 municipal boundaries. Statistics South Africa has not yet publicly
re-released Census 2001 data in line with these adjusted boundaries. Tables were produced with
the assistance of Statistics South Africa2.

PAGE 5INFORMAL SETTLEMENTS IN THE FREE STATE - AUGUST 2013 RESEARCH REPORT
C H A R T 1 PROVINCIAL AND MUNICIPAL BOUNDARY CHANGES SINCE 2001
Source: Map sourced from Stats SA’s “Census 2011 Methodology and highlights of key results”; Data sourced from MDB (Municipal Demarcation Board) 2011
Aside from census data, as mentioned previously the analysis is supplemented by other survey
data sources including the 2010/11 Income and Expenditure Survey as well as the 2011 General
Household Survey. These data sources may contain a bias, with older, better established informal
settlements over-represented as the underlying sample frames may not include newer settlements.
2.2 Definition of informal settlementsAs a starting point it is critical to have a working definition of “informal settlements” that can be
used to identify an appropriate proxy variable across the census and survey data sets. There are
a number of definitions, some of which are summarised in the table below. While there is some
variance across definitions, in most cases definitions emphasise the dwelling type; with temporary
structures or dwellings that are built out of rudimentary materials as a dominant feature of
informal settlements. In addition, several definitions refer to ownership of the land, the nature of
land tenure and formal demarcation.

PAGE 6INFORMAL SETTLEMENTS IN THE FREE STATE - AUGUST 2013 RESEARCH REPORT
Data source Definition of an informal settlement
Statistics South Africa
“An unplanned settlement on land which has not been surveyed or proclaimed as
residential, consisting mainly of informal dwellings (shacks).”
Definition of an informal dwelling :“A makeshift structure not approved by a local
authority and not intended as a permanent dwelling”
National Department of
Human Settlements
The 2009 National Housing Code’s Informal Settlement Upgrading Programme identifies
informal settlements on the basis of the following characteristics:
• Illegality and informality;
• Inappropriate locations;
• Restricted public and private sector investment;
• Poverty and vulnerability; and
• Social stress
Mangaung Metropolitan
Municipality*
“Informal settlements refer to areas that are not formally planned but nevertheless are
occupied illegally by the dwellers.”
T A B L E 1
DEFINITIONS OF INFORMAL SETTLEMENTS
Source:* Mangaung Metropolitan Integrated Development Plan, Review 2013/14
A further challenge relates to the boundaries of the settlement itself. Unlike suburbs which are
formally proclaimed and demarcated, the boundaries of an informal settlement can be fluid
particularly as the settlement grows. In some cases large areas are divided into a number of
settlements, although it is not always clear on what basis the boundaries between settlements
have been determined.
Census and survey data is not typically gathered and reported for settlements as such. Rather
the data is collected from households that are located within a given Enumeration Area (“EA”).
An EA is specific area allocated to one fieldworker to gather survey or census data in an allotted
period of time. EAs typically contain between 100 and 250 households. EAs form the basis of
sub-places which can be aggregated into larger areas known as main places, then into local
municipalities, districts and provinces.
In some cases an informal settlement will coincide with a sub-place while in others a settlement
might coincide with an EA. More commonly, however, there is no direct match between a
settlement as defined by a community or municipality and a sub-place or an EA. Stats SA survey
and census data therefore cannot enable us to explore individual informal settlements as a
defined unit of analysis.
An analysis of informal settlements based on Stats SA survey and census data requires researchers
to use a proxy variable. In the census there are two candidates. The first is based on the
enumeration area while the second is based on the nature of the dwelling.

PAGE 7INFORMAL SETTLEMENTS IN THE FREE STATE - AUGUST 2013 RESEARCH REPORT
With regard to EAs Stats SA classifies each of the 103,576 EAs into one of ten EA Types in
line with the status of the majority of visible dwellings at the time of demarcation. These are
summarised in the table below.
2011 EA types EA land-use/zoning
Formal residential Single house; Town house; High rise buildings
Informal residential Unplanned squatting
Traditional residential Homesteads
Farms
Parks and recreation Forest; Military training ground; Holiday resort; Nature reserves;
National parks
Collective living
quarters
School hostels; Tertiary education hostel; Workers’ hostel; Military
barrack; Prison; Hospital; Hotel; Old age home; Orphanage;
Monastery
Industrial Factories; Large warehouses; Mining; Saw Mill; Railway station and
shunting area
Smallholdings Smallholdings/Agricultural holdings
Vacant Open space/ stand
Commercial Mixed shops; Offices; Office park; Shopping mall; CBD
T A B L E 22011 ENUMERATION AREA TYPES
Source: Statistics South Africa
While some informal settlements are located in areas demarcated as urban informal areas, many
are not. A further disadvantage of this proxy is that it is not available in other Stats SA surveys.
The second option is to use shacks not in a backyard as a proxy variable. This too is an imprecise
proxy; some dwellings located in informal settlements are formal dwellings, or backyard shacks.
There are clearly weaknesses in both proxies. In the interests of aligning with other analysis and
the common practice within municipalities, we will predominantly, although not exclusively, rely
on shacks not in a backyard as a proxy for households living in informal settlements. As noted
in the introductory comments, not all analysis can be undertaken by dwelling type given the
limitations relating to the format of available Census 2011 data.

PAGE 8INFORMAL SETTLEMENTS IN THE FREE STATE - AUGUST 2013 RESEARCH REPORT
Before reviewing data for informal settlement specifically it is useful to explore key trends with
regard to the growth in the number of households, as well as the primary dwellings they occupy
for the province as a whole.
As noted by many researchers, any analysis of households must be prefaced by a comment on the
nature of households and the interdependency between housing opportunities and household
formation. A household is not an exogenous variable. In forming households, individuals respond
to various factors, including economic and housing opportunities.
According to census data the number of households in the Free State has increased from 733,302
in 2001 to 823,316 in 2011. At the same time the total population has increased only slightly
from 2,706,775 in 2001 to 2,745,590 in 2011. Households have grown faster than the individual
population (1.2% CAGR3 for households compared to 0.1% for individuals) and household sizes
have continued to decline from 4.2 in 1996, to 3.7 in 2001, and 3.3 in 20114. Driving the growth
in the trend towards smaller average household sizes is the noticeable increase in the proportion
of one-person households. In 2001 17% of all households were comprised of one person living
alone while in 2011 24% of all households were comprised of one person.
One-person households are not more common in urban areas than in tribal or traditional areas.
In 2011 in the Free State 23% of households living in areas demarcated as urban areas were
one-person households whereas in areas demarcated as tribal or traditional 22% of households
were one-person households. These one-person households are in many cases attached to other
households living elsewhere. According to the IES 36% of one person households in the Free State
either send or receive remittances5 indicating financial interdependency across dwelling-based
households. How many of these households would reconstitute as multiple member households
(including families) if suitable accommodation became available is a matter of conjecture.
Migration, presumably for economic reasons, has played a significant part in shaping the
population distribution across the province. According to Statistics South Africa’s 2011 mid-year
population estimates, the Free State will have seen net out-migration between 2006 and 2011 of
just under 26 000 individuals. The majority of out-migrants (46%) have gone to Gauteng.
PART 3
A context for the findings: Broad housing trends 2001 to 2011 in the Free State
3 Compound annual growth rate4 Census 2011 Statistical release – P0301.4 (revised)5 For one person households in the country as a whole, this proportion is 40%
PAGE 9INFORMAL SETTLEMENTS IN THE FREE STATE - AUGUST 2013 RESEARCH REPORT
Out-migration In-migration
Province in 2011
PercentageProvince in
2006Percentage
Gauteng 54 098 46% 32 325 35%
North West 22 541 19% 15 623 17%
Limpopo 9 230 8% 5 295 6%
Western Cape 9 098 8% 5 923 6%
Eastern Cape 7 178 6% 14 178 15%
Mpumalanga 6 021 5% 3 931 4%
KwaZulu-Natal 5 574 5% 8 678 9%
Northern Cape 4 900 4% 6 795 7%
Total 118 640 100% 92 748 100%
T A B L E 3ESTIMATED PROVINCIAL MIGRATION STREAMS OF PEOPLE IN THE FREE STATE: 2006 – 2011
Net migration: -25 892Ratio of in-migration to out-migration 0.8
Source: Stats SA mid-year population estimates 2011Note: These estimates do not incorporate foreign migrants
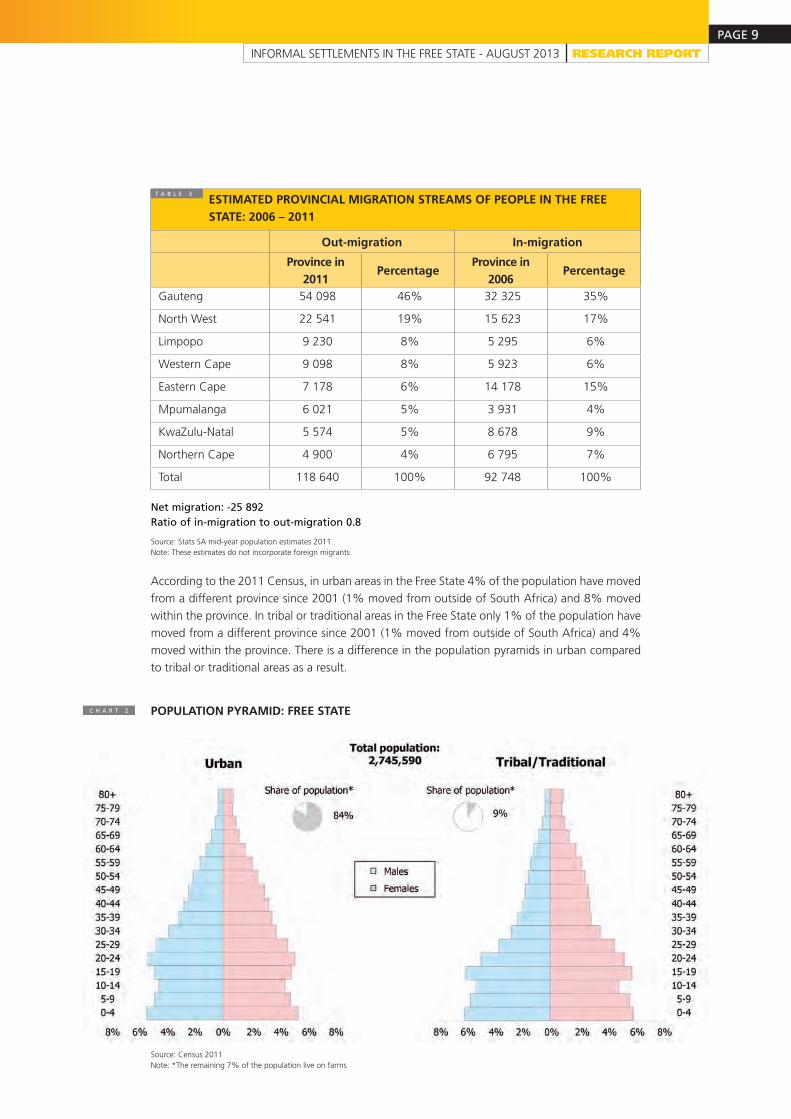
According to the 2011 Census, in urban areas in the Free State 4% of the population have moved
from a different province since 2001 (1% moved from outside of South Africa) and 8% moved
within the province. In tribal or traditional areas in the Free State only 1% of the population have
moved from a different province since 2001 (1% moved from outside of South Africa) and 4%
moved within the province. There is a difference in the population pyramids in urban compared
to tribal or traditional areas as a result.
C H A R T 2 POPULATION PYRAMID: FREE STATE
Source: Census 2011Note: *The remaining 7% of the population live on farms

PAGE 10INFORMAL SETTLEMENTS IN THE FREE STATE - AUGUST 2013 RESEARCH REPORT
There has been a significant increase in the number of households living in formal dwellings6
since 2001 in the Free State. The number living in shacks not in backyards over the ten year
period has declined from 147,081 in 2001 to 80,355 in 2011. The number of households living
in traditional dwellings has declined at a faster rate, albeit off a low base.
In 2001 67% of households lived in formal dwellings. By 2011 this had increased noticeably to
81%. The proportion of households living in shacks not in backyards has declined from 20% in
2001 to 10% in 2011, while the proportion of households living in traditional dwellings has fallen
from 7% to 2% over the same period.
C H A R T 3 TYPE OF MAIN DWELLING IN THE FREE STATE
Source: Census 2001, Census 2011Note: Formal housing contains: House or brick/concrete structure on a separate stand or yard, Town / cluster / semi-detached house, Flat or apartment. Formal other contains: House/flat/room in backyard, Room/flatlet on a property or larger dwelling/servants quarters/granny flat
The additional number of households living in formal housing is a useful proxy for the growth in
the housing stock. Between 2001 and 2011 Stats SA reports that formal private sector residential
new build amounted to approximately 31 000 housing units. The balance, namely 158 000 units,
are either units that are not registered with Stats SA or are units that have been built by the State
as part of its extensive RDP housing delivery programme.
It appears that the number of households living in informal settlements, as proxied either by dwelling
type (shack not in backyard) or EA (informal residential) has declined dramatically in the Free State.
In 2001 there were 147,081 households living in shacks not in backyards compared to 80,355 in
2011. With regard to EAs, 102,754 households lived in areas demarcated by Stats SA as informal
settlements in 2001 compared to 33,768 in 2011 in areas demarcated as informal residential7.
6 Formal dwelling contains: House or brick/concrete structure on a separate stand or yard, Town / cluster / semi-detached house, Flat or apartment, House/flat/room in backyard, Room/flatlet on a property or larger dwelling/servants quarters/granny flat
7 The name changes in some EA types (including ‘Informal settlement EA’ changing to ‘Informal residential EA’) are due to a change in terminology and not a change in methodology

PAGE 11INFORMAL SETTLEMENTS IN THE FREE STATE - AUGUST 2013 RESEARCH REPORT
C H A R T 4 HOUSEHOLDS LIVING IN INFORMAL SETTLEMENTS IN THE FREE STATE
Source: Census 2001, Census 2011
Across the province, the proportion of households who had access to refuse removal services
increased from 59% in 2001 to 71% in 2011, while access to sanitation and piped water also
improved noticeably. Likewise, access to electricity increased from 74% of all households in 2001
to 90% in 2011.
C H A R T 5 ACCESS TO SERVICES IN THE FREE STATE 2001 VS. 2011: ALL HOUSEHOLDS
Source: Census 2001, Census 2011Note: There is no indication as to the location of the toilet (in the dwelling, in the yard, and so on)

PAGE 12INFORMAL SETTLEMENTS IN THE FREE STATE - AUGUST 2013 RESEARCH REPORT
Census 2001 Census 2011
Western Cape Owned RentedOccupied rent-free
Owned RentedOccupied rent-free
Other
Formal dwelling 62% 18% 19% 63% 21% 14% 2%
Traditional dwelling 43% 6% 51% 57% 6% 32% 5%
Shack in backyard 48% 30% 23% 45% 29% 22% 4%
Shack not in
backyard45% 12% 43% 55% 8% 32% 5%
Other 42% 20% 37% 43% 22% 26% 8%
Total 57% 17% 27% 61% 20% 17% 3%
Although census data indicates a shift towards rental accommodation for South Africa as a whole, this
trend is not apparent in the Free State. In 2001 roughly 17% of households in the Free State rented
their primary dwellings. This had increased slightly to 20% in 2011. The proportion of households
living in shacks not in backyards who rent has declined from 12% in 2001 to 8% in 2011.
HOUSEHOLDS LIVING IN THE FREE STATE: TENURE STATUS BY TYPE OF MAIN DWELLINGT A B L E 4
Source: Census 2001, Census 2011
The balance of the document will explore some of the key trends highlighted in this overview in
more detail specifically with regard to informal settlements.

PAGE 13INFORMAL SETTLEMENTS IN THE FREE STATE - AUGUST 2013 RESEARCH REPORT
The data indicates that there are a total of 80,355 households, containing 241,767 individuals who
live in shacks not in backyards in 2011. As noted in the previous chapter, census data indicates that
the number of households living in shacks not in backyards has decreased in the Free State.
Provincial statistics mask very different housing conditions, and significant shifts at a district and
local municipality level. The data indicates that shacks not in backyards tend to be concentrated
in key municipalities. The largest number of households living in shacks not in backyards can be
found in the Free State’s only metropolitan area, namely Mangaung. Thirty per cent of all shacks
not in backyards in the province can be found in Mangaung which is roughly in line with the
proportion of households who live in Mangaung8. Fifty one per cent of the province’s households
living in shacks not in backyards can be found in Mangaung and Matjhabeng.
PART 4
Number of households living in informal settlements in the Free State
C H A R T 6 HOUSEHOLDS LIVING IN SHACKS NOT IN BACKYARDS BY LOCAL MUNICIPALITY IN THE FREE STATE
Source: Census 2011
8 An estimated 28% of all households in the Free State can be found in Mangaung

PAGE 14INFORMAL SETTLEMENTS IN THE FREE STATE - AUGUST 2013 RESEARCH REPORT
Lejweleputswa district municipality has the highest proportion of households who live in shacks
not in backyards (13%) across the municipalities in the province, followed by Mangaung (11%).
The number and proportion of households living in shacks not in backyards by district municipality
is summarised below. Together, shacks in backyards and shacks not in backyards accommodate
16% of all households in the province.
Municipality Shack not in a backyard Shack in a backyard
Number of HHPercentage of HH
that live in SNIBYNumber of HH
Percentage of HH that
live in SIB
Mangaung 24 481 11% 8 266 4%
Lejweleputswa 23 313 13% 11 969 7%
Thabo Mofutsanyane 18 809 9% 14 449 7%
Fezile Dabi 10 915 8% 11 340 8%
Xhariep 2 837 6% 2 609 6%
Free State 80 355 10% 48 633 6%
T A B L E 5 HOUSEHOLDS LIVING IN SHACKS IN THE FREE STATE BY DISTRICT MUNICIPALITY
Source: Census 2011
Across all district municipalities the number of households living in shacks in backyards has increased
faster than the number of households living in shacks not in backyards, with the exception of
Lejweleputswa which saw negative growth in shacks in backyards. All district municipalities saw
a decline in the number of households living in shacks not in backyards between 2001 and 2011.
C H A R T 7 HOUSEHOLDS LIVING IN SHACKS BY DISTRICT MUNICIPALITY: GROWTH RATES
Source: Census 2001, Census 2011Note: Bubble size represents total households 2011 in SNIBY or SIB. Labels in brackets (x%, y%) : x% refers to CAGR*, y% refers to households in SNIBY or SIB as a proportion of total householdsNote: *Compound Annual Growth RateNote: ** Read as: Manguang district municipality had 24 481 households living in shacks not in backyards in 2011. This has declined by a rate of 4% compounded annually between 2001 and 2011. 11% of households in Manguang live in shacks not in backyards
PAGE 15INFORMAL SETTLEMENTS IN THE FREE STATE - AUGUST 2013 RESEARCH REPORT
According to the 2011 Census9, roughly 55% of households living in shacks not in backyards in
the Free State regard themselves as owners (the highest proportion of all provinces), with 32%
who say they occupy the dwelling for free. There is no data to determine whether self-assessed
ownership reflects formal status and if not, through what mechanisms the household has come
to own the dwelling. Eight per cent of households say they rent their dwellings10.
9 In the questionnaire, the following statement is included with the question: “Refers to the main dwelling structure only and not to the land that it is situated on”
10 Five per cent responded ‘other’ – there is no indication as to what this entails

PAGE 16INFORMAL SETTLEMENTS IN THE FREE STATE - AUGUST 2013 RESEARCH REPORT
5.1 Access to servicesAccess to water and sanitation services have been categorised into higher and basic levels of
service. Current and historic levels of access are summarised below for households living in shacks
not in backyards.
PART 5
Profiling informal settlements in the Free State
C H A R T 8 ACCESS TO SERVICES IN THE FREE STATE 2001 VS. 2011: HOUSEHOLDS LIVING IN SHACKS NOT IN BACKYARDS
Source: Census 2001, Census 2011Note: There is no indication as to the location of the toilet (in the dwelling, in the yard, and so on)

PAGE 17INFORMAL SETTLEMENTS IN THE FREE STATE - AUGUST 2013 RESEARCH REPORT
C H A R T 9 ACCESS TO SERVICES IN THE FREE STATE: HOUSEHOLDS LIVING IN SHACKS NOT IN BACKYARDS
Source: Census 2001, Census 2011* In the Census 2011 these include refuse removed by private company
There are noticeable differences across the province in terms of levels of access and rates of
change with regard to municipal services. Measured in terms of the proportion of households,
access to refuse removal for those living in shacks not in backyards has declined in all district
municipalities across the province.
On average households living in shacks not in backyards in the Free State appear to live under
better conditions than in 2001. By far the most significant improvements have been in access to
piped water and access to flush toilets. More detailed data on the nature of services is summarised
in the charts below.
PAGE 18INFORMAL SETTLEMENTS IN THE FREE STATE - AUGUST 2013 RESEARCH REPORT
C H A R T 1 0
C H A R T 1 1
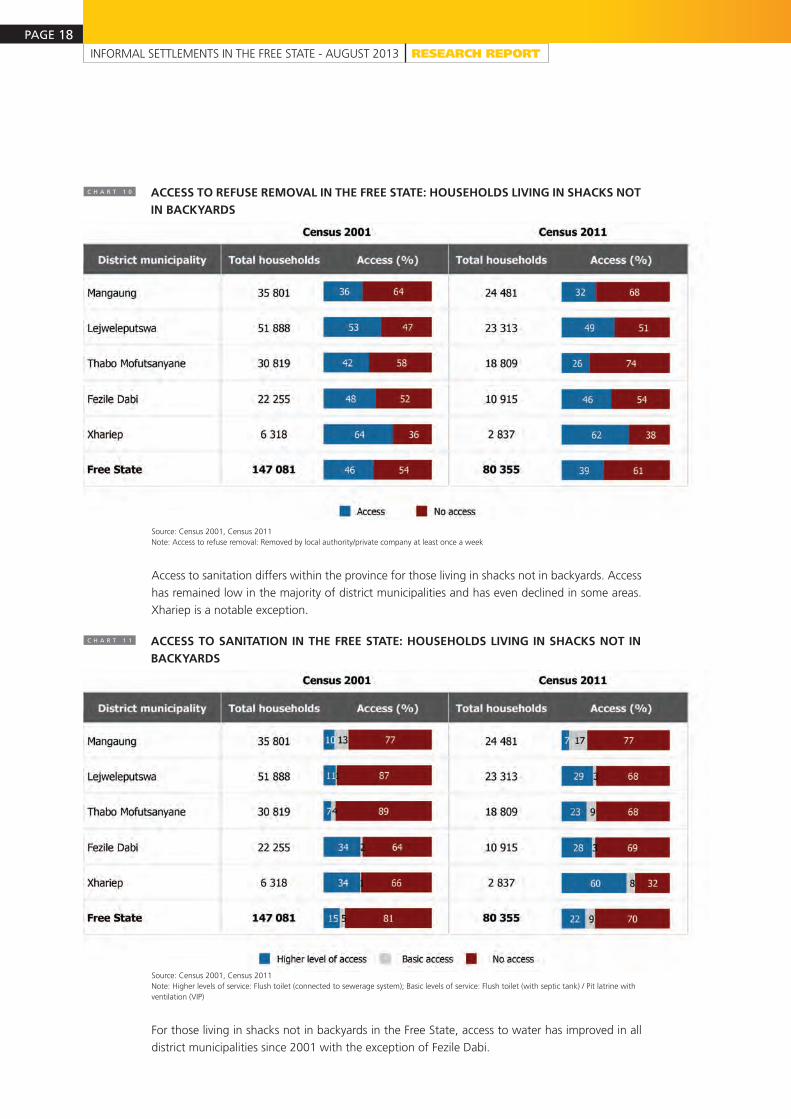
ACCESS TO REFUSE REMOVAL IN THE FREE STATE: HOUSEHOLDS LIVING IN SHACKS NOT IN BACKYARDS
ACCESS TO SANITATION IN THE FREE STATE: HOUSEHOLDS LIVING IN SHACKS NOT IN BACKYARDS
Source: Census 2001, Census 2011Note: Access to refuse removal: Removed by local authority/private company at least once a week
Access to sanitation differs within the province for those living in shacks not in backyards. Access
has remained low in the majority of district municipalities and has even declined in some areas.
Xhariep is a notable exception.
Source: Census 2001, Census 2011Note: Higher levels of service: Flush toilet (connected to sewerage system); Basic levels of service: Flush toilet (with septic tank) / Pit latrine with ventilation (VIP)
For those living in shacks not in backyards in the Free State, access to water has improved in all
district municipalities since 2001 with the exception of Fezile Dabi.

PAGE 19INFORMAL SETTLEMENTS IN THE FREE STATE - AUGUST 2013 RESEARCH REPORT
C H A R T 1 2 ACCESS TO WATER IN THE FREE STATE: HOUSEHOLDS LIVING IN SHACKS NOT IN BACKYARDS
Source: Census 2001, Census 2011Note: Higher levels of service: Piped (tap) water inside dwelling; Basic levels of service: Piped (tap) water inside yard / Piped (tap) water on community stand: distance less than 200m from dwelling
Access to electricity differs across the province for those living in shacks not in backyards. In Fezile
Dabi and Mangaung access has declined.
C H A R T 1 3 ACCESS TO ELECTRICITY IN THE FREE STATE: HOUSEHOLDS LIVING IN SHACKS NOT IN BACKYARDS
Source: Census 2001, Census 2011Note: Access to electricity: Use electricity for lighting

PAGE 20INFORMAL SETTLEMENTS IN THE FREE STATE - AUGUST 2013 RESEARCH REPORT
5.2 Household characteristicsThe average household size for households who live in shacks not in backyards at 3.0 is slightly
lower than the provincial average of 3.2. This reflects the slightly high proportion of one-person
households who live in shacks not in backyards. Census 2011 indicates that roughly 27% of
households who live in shacks not in backyards in the Free State are one-person households; for
households in the province as a whole this proportion is 24%.
The size distribution of households living in shacks not in backyards from the census together
with data on the gender of the head of the household is summarised below. Sixty per cent are
male-headed.
C H A R T 1 4 HOUSEHOLDS LIVING IN SHACKS NOT IN BACKYARDS IN THE FREE STATE: SIZE OF HOUSEHOLD, BY GENDER OF HOUSEHOLD HEAD
Source: Census 2011
Data on number of rooms in the dwelling together with data on the number of people who live in
the household can be used to assess over-crowding. Assuming that dwellings that contain more
than two individuals per room are over-crowded, 24% of all multi-person households who live in
shacks not in backyards in the Free State live in over-crowded conditions.

PAGE 21INFORMAL SETTLEMENTS IN THE FREE STATE - AUGUST 2013 RESEARCH REPORT
5.3 Children in informal settlementsCensus 2011 data on children has only been released for EAs, and not by dwelling type. The
analysis of children therefore focuses on informal residential EAs. Census data indicates that there
are 36,646 children under the age of 18 who live in informal residential EAs accounting for 4%
of all children in the Free State. There is a slight skew towards very young children in informal
residential areas; 34% of all children are under the age of five, compared to 31% for the province
as a whole.
Age group of children
Children in Informal
residential EAsPercentage All children Percentage
0 - 4 12 634 34% 295 896 31%
5 - 6 4 540 12% 112 618 12%
7 - 10 7 789 21% 198 999 21%
11 - 14 6 691 18% 191 402 20%
15 - 17 4 992 14% 154 470 16%
Total 36 646 100% 953 384 100%
T A B L E 6 NUMBER AND PERCENTAGE OF CHILDREN BY AGE GROUP IN THE FREE STATE
Source: Census 2011
According to the census, 79% of children under the age of 15 in informal residential EAs in the
Free State have both parents still living11 (the corresponding proportion for the province as a
whole is 77%12).
School attendance for those aged 7 to 17 living in informal residential EAs is high, and is not
significantly different than for the province as a whole. Ninety two per cent of children aged 7 to
17 living in informal residential EAs in the Free State currently attend an educational institution.
11 For children in the country as whole living in informal residential EAs this proportion is 81%12 For children in the country as a whole this proportion is 80%
Children 7 - 17 Informal residential EA All children
7 - 10 95% 95%
11 - 14 95% 95%
15 - 17 84% 87%
Total* 92% 93%
T A B L E 7 CHILDREN AGED 7 - 17 YEARS IN THE FREE STATE: ATTENDANCE OF CHILDREN AT AN EDUCATIONAL INSTITUTION
Source: Census 2011Note: * Total school attendance aged 7 - 17. Census reports this for children aged 5 and up

PAGE 22INFORMAL SETTLEMENTS IN THE FREE STATE - AUGUST 2013 RESEARCH REPORT
Total number of people who moved between 2001 and 2011 365 774
Number of people who moved between 2001 and 2011 who live in
informal EAs19 145
Proportion of those who live in informal EAs who moved between 2001
and 201119%
Proportion of total who moved between 2001 and 2011 who live in
informal EAs5%
Provinces most moved from (informal EAs)Free State (70%)
Outside of SA (16%)
T A B L E 8
MIGRATION IN THE FREE STATE
5.4 MigrationCensus 2011 contains data on how long individuals have lived in their current dwellings but
analysis using the current variables available make this difficult to interpret. Nevertheless we can
look at those individuals who moved into their current dwelling after 2001 and who currently
reside in informal residential EAs (data on migration by type of dwelling is not available). Roughly
19% of all individuals who live in informal residential EAs moved between 2001 and 2011. Of
these, 16% corresponding to 2,997 individuals have moved from outside South Africa. The table
below summarises findings in this regard.
Source: Census 2011
5.5 Employment and income5.5.1 EmploymentCensus 2011 data on employment has only been released for EAs, and not by dwelling type. The
analysis of employment therefore focuses on informal residential EAs. According to Census 2011,
labour force participation rates are higher in informal residential EAs than in formal residential
EAs as are unemployment rates. This is consistent with informal settlements acting as ‘arrival
cities’ accommodating those seeking an entry point into the labour market.

PAGE 23INFORMAL SETTLEMENTS IN THE FREE STATE - AUGUST 2013 RESEARCH REPORT
C H A R T 1 5 ADULTS AGED 15+ IN THE FREE STATE: LABOUR FORCE PARTICIPATION RATES AND UNEMPLOYMENT RATES BY TYPE OF ENUMERATION AREA
Source: Census 2011Note: * Total FS also includes: Collective living quarters (2%), Vacant (1%), Commercial (1%), Industrial (1%), Small holdings (1%), Parks and recreation (0%). Brackets show proportion of adults 15+ living in EA type
On the whole, a lower proportion of employed adults living in informal residential EAs are
employed in the formal sector compared to all employed adults.
Formal
Sector
Informal
Sector
Private
householdDon‘t know
Informal residential EA 57% 20% 21% 2%
All employed adults in province 69% 14% 15% 2%
T A B L E 9
SECTOR OF WORK IN THE FREE STATE: PERCENTAGE OF EMPLOYED ADULTS 15+
Source: Census 2011
There is no data on the specific industries of employment.
Education levels are noticeably lower for adults aged 15 or older who live in informal residential
EAs than for adults in the province as a whole. Seventy one per cent of employed adults living in
informal EAs in the Free State do not have a matric, compared to 51% of employed adults in the
province as a whole.

PAGE 24INFORMAL SETTLEMENTS IN THE FREE STATE - AUGUST 2013 RESEARCH REPORT
Informal residential EA All adults
No
scho
olin
g
Less
tha
n M
atric
Mat
ric
Tech
niko
n, U
nive
rsity
or o
ther
pos
t m
atric
Oth
er
No
scho
olin
g
Less
tha
n M
atric
Mat
ric
Tech
niko
n, U
nive
rsity
or o
ther
pos
t m
atric
Oth
er
Employed 4% 67% 24% 4% 0% 4% 47% 31% 17% 1%
Unemployed 4% 72% 21% 3% 0% 3% 62% 30% 5% 0%
Discouraged work-seeker 4% 77% 16% 2% 0% 3% 67% 26% 3% 0%
Other not economically active 7% 77% 13% 2% 1% 6% 65% 17% 4% 8%
Total adults 15+ 6% 72% 18% 3% 1% 6% 58% 24% 9% 4%
T A B L E 1 0
ADULTS 15+ IN THE FREE STATE: EDUCATION LEVEL BY EMPLOYMENT STATUS
Source: Census 2011
5.5.2 IncomeAccording to the 2011 Census 42% of households living in shacks not in backyards earn less than
R800 per month. However the quality of census data on household income is relatively poor. Each
respondent is asked to report their individual income in one of twelve fairly wide bands13. Household
income as reported by the Census is a derived variable, calculated by adding together the individual
incomes of all members of the household14. A far more detailed source of data on incomes is the
IES15. That data source indicates that 29% of households living in shacks not in backyards earned
less than R800 in 2011. However, a limitation of the IES is its sample frame, which is drawn from
the Census 2001. The data source may well contain a bias towards older more established informal
settlements, which may contain a higher earning sample of households.
13 “What is the income category that best describes the gross monthly or annual income of (name) before deductions and including all sources of income? (e.g. Social grants, UIF, remittances, rentals, investments, sales or products, services, etc.)”
14 As individual incomes were recorded in intervals rather than exact amounts, a fixed amount was allocated to each range in order to calculate household income. This is summarised in the appendix
15 Analysis of income in the IES excludes imputed rentals for housing
PAGE 25INFORMAL SETTLEMENTS IN THE FREE STATE - AUGUST 2013 RESEARCH REPORT
C H A R T 1 6
C H A R T 1 7
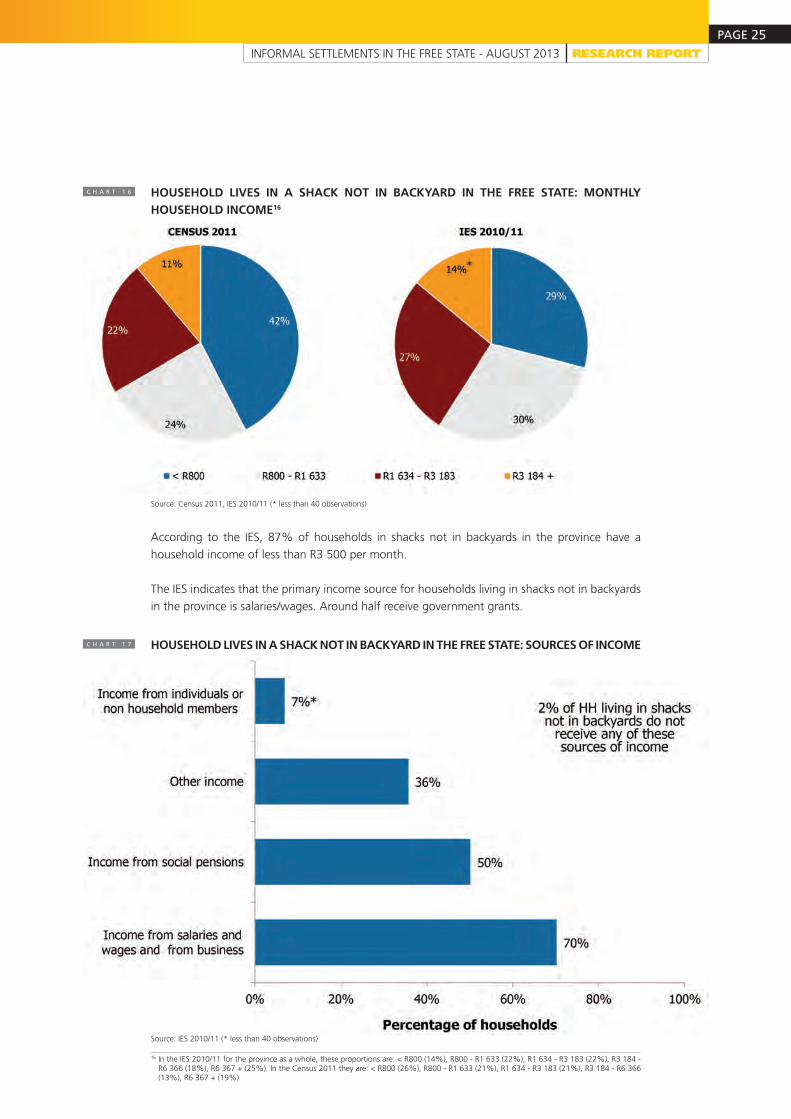
HOUSEHOLD LIVES IN A SHACK NOT IN BACKYARD IN THE FREE STATE: MONTHLY HOUSEHOLD INCOME16
HOUSEHOLD LIVES IN A SHACK NOT IN BACKYARD IN THE FREE STATE: SOURCES OF INCOME
16 In the IES 2010/11 for the province as a whole, these proportions are: < R800 (14%), R800 - R1 633 (22%), R1 634 - R3 183 (22%), R3 184 - R6 366 (18%), R6 367 + (25%). In the Census 2011 they are: < R800 (26%), R800 - R1 633 (21%), R1 634 - R3 183 (21%), R3 184 - R6 366 (13%), R6 367 + (19%)
Source: Census 2011, IES 2010/11 (* less than 40 observations)
According to the IES, 87% of households in shacks not in backyards in the province have a
household income of less than R3 500 per month.
The IES indicates that the primary income source for households living in shacks not in backyards
in the province is salaries/wages. Around half receive government grants.
Source: IES 2010/11 (* less than 40 observations)

PAGE 26INFORMAL SETTLEMENTS IN THE FREE STATE - AUGUST 2013 RESEARCH REPORT
5.6 Housing waiting lists and subsidy housingThere is no data available in the census on housing waiting lists and subsidy housing. According
to the 2011 GHS, 47% of households in shacks not in backyards in the Free State have at least
one member on the waiting list for an RDP or state subsidised house. Data from the same survey
can be used to quantify the number of households who live in shacks not in backyards that might
be eligible to obtain a subsidised house. Criteria include a household income of less than R3
500 per month, a household size of more than one individual, not having another dwelling, and
no previous housing subsidy received. Using these criteria, around 55% of households living in
shacks not in backyards in the province appear to qualify for subsidy housing.

PAGE 27INFORMAL SETTLEMENTS IN THE FREE STATE - AUGUST 2013 RESEARCH REPORT
Data summarised for Mangaung focuses mainly on household level data. Data for individuals in
the municipality has been included in the appendix.
6.1 Number of householdsAccording to the Census there has been a significant increase in the number of households living
in formal dwellings in Mangaung since 2001; 61,459 more households currently live in a formal
dwelling than in 200117. The number of households living in shacks in backyards has stabilised
while the number of households living in shacks not in backyards has declined by 11,320 over
the ten year period.
In 2001 71% lived in formal dwellings. By 2011 this had increased to 83%. The proportion of
households living in shacks not in backyards has declined noticeably from 19% in 2001 to 11%
in 2011.
PART 6
Profiling informal settlements in Mangaung
C H A R T 1 8 TYPE OF MAIN DWELLING IN MANGAUNG
17 Formal dwelling contains: House or brick/concrete structure on a separate stand or yard, Town / cluster / semi-detached house, Flat or apartment, House/flat/room in backyard, Room/flatlet on a property or larger dwelling/servants quarters/granny flat
Source: Census 2001, Census 2011Note: Formal housing contains: House or brick/concrete structure on a separate stand or yard, Town / cluster / semi-detached house, Flat or apartment. Formal other contains: House/flat/room in backyard, Room/flatlet on a property or larger dwelling/servants quarters/granny flat

PAGE 28INFORMAL SETTLEMENTS IN THE FREE STATE - AUGUST 2013 RESEARCH REPORT
According to the 2011 Census, roughly 61% of households living in shacks not in backyards in
Mangaung regard themselves as owners, with 30% who say they occupy the dwelling for free.
Four per cent of households say they rent their dwellings18. Stated ownership levels for those
living in shacks not in backyards in Mangaung has increased noticeably, from 35% of households
in 2001 to 61% in 2011. The rental market appears to have remained small. In 2001 2% of
households rented their dwellings compared to 4% in 2011.
6.2 Access to servicesAccess to water and sanitation services have been categorised into higher and basic levels of
service. Current levels of access are summarised below for households living in shacks not in
backyards in Mangaung.
C H A R T 1 9 ACCESS TO SERVICES IN MANGAUNG 2001 VS. 2011: HOUSEHOLDS LIVING IN SHACKS NOT IN BACKYARDS
Source: Census 2011Note: There is no indication as to the location of the toilet (in the dwelling, in the yard, and so on)
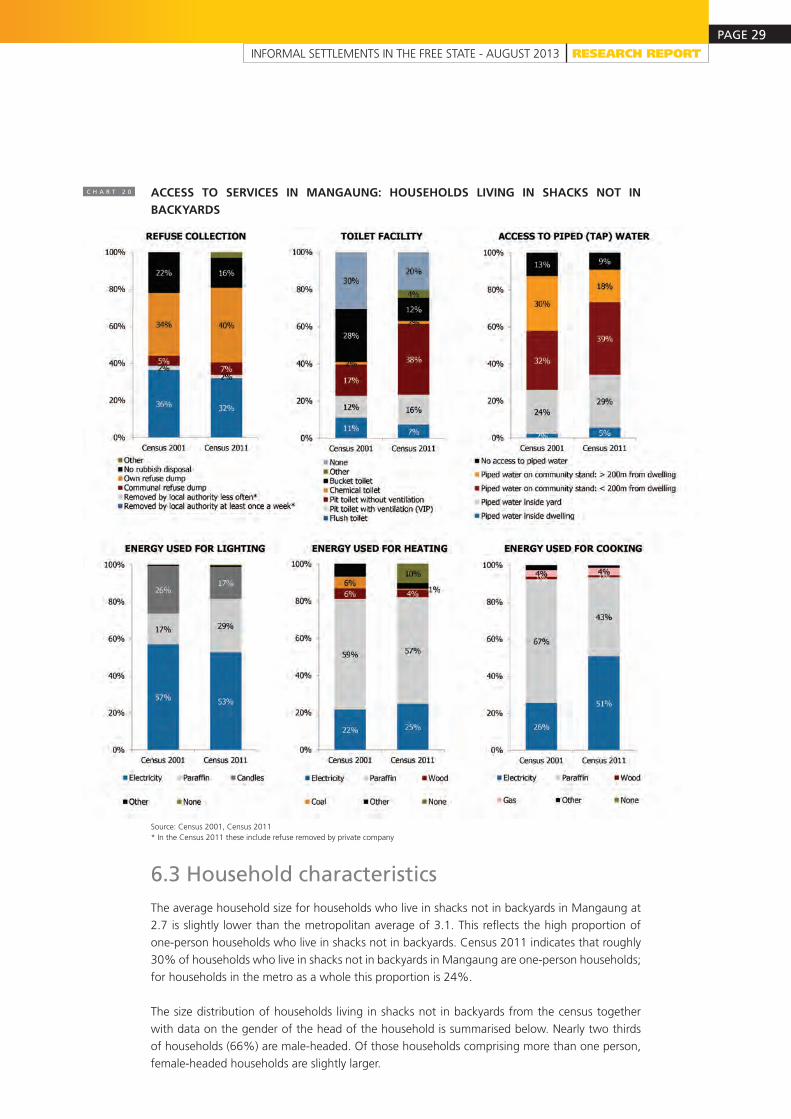
On average households living in shacks not in backyards in Mangaung do not appear to live under
better conditions than in 2001. There has been a noticeable improvement in access to piped
water for those who live in shacks not in backyards. However, access to refuse removal, flush
toilets and electricity for lighting has declined over the ten year period. More detailed data on the
nature of services is summarised in the charts below. It is interesting that while use of electricity
for lighting declined slightly, use of electricity for cooking increased significantly.
18 Six per cent responded ‘other’
PAGE 29INFORMAL SETTLEMENTS IN THE FREE STATE - AUGUST 2013 RESEARCH REPORT
C H A R T 2 0 ACCESS TO SERVICES IN MANGAUNG: HOUSEHOLDS LIVING IN SHACKS NOT IN BACKYARDS
Source: Census 2001, Census 2011* In the Census 2011 these include refuse removed by private company
6.3 Household characteristicsThe average household size for households who live in shacks not in backyards in Mangaung at
2.7 is slightly lower than the metropolitan average of 3.1. This reflects the high proportion of
one-person households who live in shacks not in backyards. Census 2011 indicates that roughly
30% of households who live in shacks not in backyards in Mangaung are one-person households;
for households in the metro as a whole this proportion is 24%.
The size distribution of households living in shacks not in backyards from the census together
with data on the gender of the head of the household is summarised below. Nearly two thirds
of households (66%) are male-headed. Of those households comprising more than one person,
female-headed households are slightly larger.

PAGE 30INFORMAL SETTLEMENTS IN THE FREE STATE - AUGUST 2013 RESEARCH REPORT
C H A R T 2 1 HOUSEHOLDS LIVING IN SHACKS NOT IN BACKYARDS IN MANGUANG: SIZE OF HOUSEHOLD, BY GENDER OF HOUSEHOLD HEAD
Source: Census 2011

PAGE 31INFORMAL SETTLEMENTS IN THE FREE STATE - AUGUST 2013 RESEARCH REPORT
Other non-survey data sources have been explored, including the Housing Development Agency
and Eskom. Additionally, data is available from the Mangaung municipality.
7.1 Land and Property Spatial Information System (LaPsis)LaPsis, an online system developed by the HDA, builds on data gathered by the NDHS and
overlays onto it land and property data including cadastre, ownership, title documents and deeds
(from the Deeds Office), administrative boundaries (from the Demarcation Board) and points of
interest from service providers such as AfriGIS19. The informal settlements layer was last updated
in November 2011. The data indicates there are 204 informal settlements in the Free State; none
of these have a household or shack count.
7.2 Eskom’s Spot Building Count (also known as the Eskom Dwelling Layer)Eskom has mapped and classified structures in South Africa using image interpretation and manual
digitisation of high resolution satellite imagery. Where settlements are too dense to determine
the number of structures given the resolution of the satellite imagery the area is categorised as a
‘Dense Informal’ area. These areas are often informal settlements although Eskom does not have
a specific definition in that regard. Identifiable dwellings and building structures are mapped by
points while dense informal settlements are mapped by polygons. The dataset was last updated
in November 2011.
Data provided by Eskom revealed 59 polygons categorised as Dense Informal in the Free State,
covering a total area of 12.1 square kilometres.
7.3 Municipal data: MangaungMangaung defines informal settlements as: “Areas that are not formally planned but nevertheless
are occupied illegally by the dwellers.”20
According to municipality estimates, there are 28 informal settlements in Mangaung. All have
communal taps, seven have electricity connection and none have access to sanitation21. No
estimate is provided for number of structures or households.
PART 7
Other non-survey data sources
19 AfriGIS was given informal settlements data by the provincial departments of housing to create the map layers 20 Mangaung Metropolitan Integrated Development Plan, Review 2013/14 21 Mangaung Municipality, ‘2013-2014 BEPP: Portfolio Committee on Human Settlements 12 June 2013’

PAGE 32INFORMAL SETTLEMENTS IN THE FREE STATE - AUGUST 2013 RESEARCH REPORT
7.4 Summary of estimatesEstimates of the total number of informal settlements from LaPsis cannot be directly compared
to municipal estimates due to the change in nature of Manguang; prior to 2011 it was a local
municipality, after which it became an autonomous metropolitan municipality.
Number of informal settlements
LaPsis 2011: Informal
settlements atlas
Municipal estimates
2013
Fezile Dabi 59
Lejweleputswa 44
Mangaung Incorporated in Motheo 28
Motheo** 43
Thabo Mofutsanyane 52
Xhariep 6
Free State 204
T A B L E 1 1
NUMBER OF INFORMAL SETTLEMENTS
** Motheo District was disestablished at the time of the 2011 municipal elections. Of its three constituent local municipalities, Mangaung was upgraded to become an autonomous metropolitan municipality, Naledi became part of Xhariep, and Mantsopa became part of Thabo MofutsanyaneNote: According to Eskom’s Spot Building Count last updated in November 2011, there are 59 polygons in the Free State classified as “Dense Informal“

PAGE 33INFORMAL SETTLEMENTS IN THE FREE STATE - AUGUST 2013 RESEARCH REPORT
Formal Sector Informal Sector Private household Don‘t know
Informal residential EA 55% 20% 23% 2%
All employed adults in province 69% 13% 16% 2%
Children in informal settlements:
PART 8
Appendix: Municipal data on children and employment
Age group of childrenChildren in Informal
residential EAsPercentage All children Percentage
0 - 4 7 298 36% 75 348 31%
5 - 6 2 580 13% 28 180 12%
7 - 10 4 234 21% 49 654 21%
11 - 14 3 517 17% 47 639 20%
15 - 17 2 583 13% 39 696 17%
Total 20 213 100% 240 517 100%
T A B L E 1 2 NUMBER AND PERCENTAGE OF CHILDREN BY AGE GROUP IN MANGAUNG
Source: Census 2011
Source: Census 2011Note: * Total school attendance aged 7 - 17. Census reports this for children aged 5 and up
Children 7 - 17 Informal residential EA All children
7 - 10 94% 95%
11 - 14 94% 94%
15 - 17 85% 87%
Total* 92% 92%
CHILDREN AGED 7 - 17 YEARS IN MANGAUNG: ATTENDANCE OF CHILDREN AT AN EDUCATIONAL INSTITUTION
T A B L E 1 3
Labour force participation rate Unemployment rate
Informal residential EA 59% 35%
All adults in province 54% 28%
Employment:
Source: Census 2011
T A B L E 1 4
T A B L E 1 5
EMPLOYMENT STATISTICS IN MANGAUNG: LABOUR FORCE PARTICIPATION RATE AND UNEMPLOYMENT RATE FOR ADULTS AGED 15+
SECTOR OF WORK IN MANGAUNG: PERCENTAGE OF EMPLOYED ADULTS 15+
Source: Census 2011

PAGE 34INFORMAL SETTLEMENTS IN THE FREE STATE - AUGUST 2013 RESEARCH REPORT
9.1 Censuses 2011 and 2001Census 2011• Demarcation > Classification > Listing (Dwelling Unit, Business, Park, and so on)• Demarcation for the 2011 Census involved subdividing the country into Place Names and
Enumeration Areas based on specifications of administrative boundaries, size and population density
• Data used in the demarcation process included Dwelling Frame data from Stats SA and various external data sources, including: Aerial photography, satellite imagery Addresses (Place Names) Cadastral data Administrative boundaries
• Demarcation produced a total of 103,576 EAs which were classified into ten EA Types in line with the status of the majority of visible dwellings at the time of demarcation: Formal residential Informal residential Traditional residential Farms Smallholdings Industrial Parks and Recreation Vacant Collective living quarters Commercial
• The EAs were demarcated according to specific rules and guidelines per EA Type. Where the data was incomplete or missing, Spot 5 satellite images were used resulting in some larger EAs being split further during the verification and listing fieldwork
Census 2001• Demarcation for the Census in 2001 resulted in ten EA Types based on its geographic location
as well as the land use and type of dominant dwellings within each EA• Ten EA Types were categorised in 2001:
Urban settlement Informal settlement Tribal settlement Farms Smallholdings Industrial Recreational Vacant Institution + Hostel
• The name changes in some EA Types is due to a change in terminology and not a change in methodology
PART 9
Appendix: Statistics South Africa Surveys
PAGE 35INFORMAL SETTLEMENTS IN THE FREE STATE - AUGUST 2013 RESEARCH REPORT
Censuses 2001 & 2011• Enumerator Area Summary Books were printed, containing a map and/or aerial photographs
of each EA, an orientation map for each EA (route from the nearest town), a list of all dwellings
in the EA with their addresses where applicable, or some type of identifying description
• The EA Summary Book is used during the listing phase to record each residential and non-
residential structure found in the EA as well as vacant stands
• In the instance of collective living quarters, each room / ward / cell / dormitory / section was
listed
• Extra dwellings found not on the list were to be added and enumerated
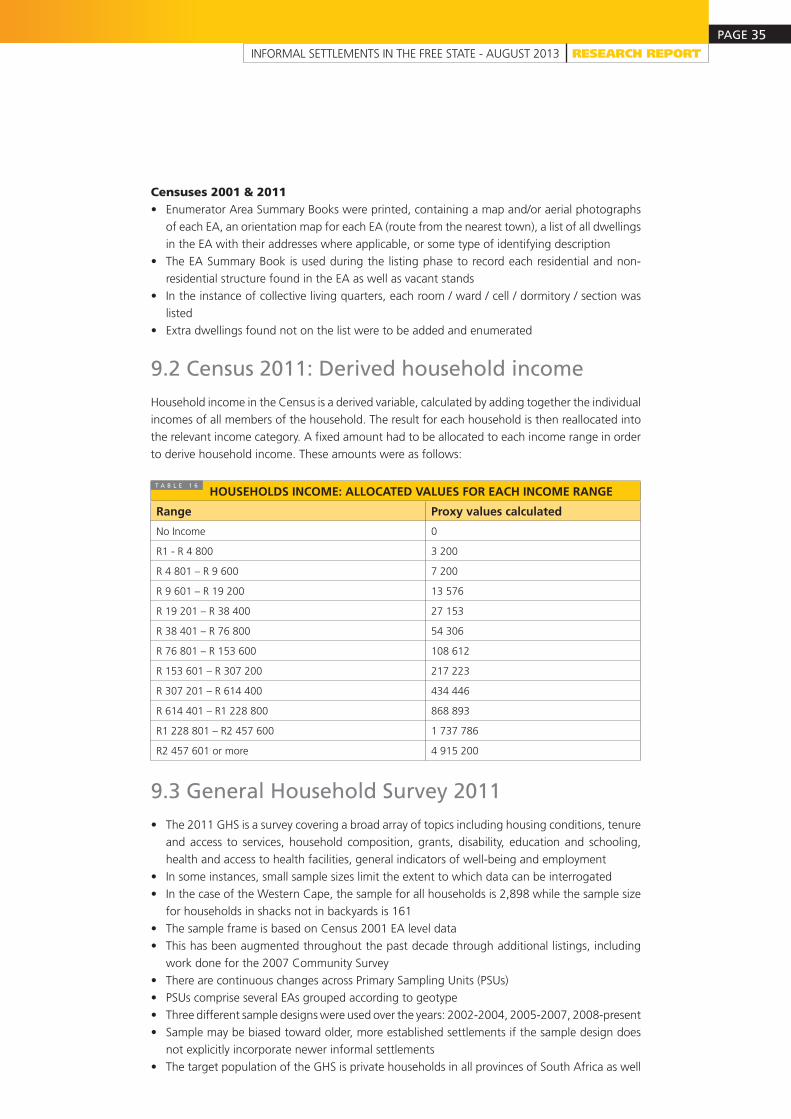
9.2 Census 2011: Derived household incomeHousehold income in the Census is a derived variable, calculated by adding together the individual
incomes of all members of the household. The result for each household is then reallocated into
the relevant income category. A fixed amount had to be allocated to each income range in order
to derive household income. These amounts were as follows:
Range Proxy values calculated
No Income 0
R1 - R 4 800 3 200
R 4 801 – R 9 600 7 200
R 9 601 – R 19 200 13 576
R 19 201 – R 38 400 27 153
R 38 401 – R 76 800 54 306
R 76 801 – R 153 600 108 612
R 153 601 – R 307 200 217 223
R 307 201 – R 614 400 434 446
R 614 401 – R1 228 800 868 893
R1 228 801 – R2 457 600 1 737 786
R2 457 601 or more 4 915 200
9.3 General Household Survey 2011• The 2011 GHS is a survey covering a broad array of topics including housing conditions, tenure
and access to services, household composition, grants, disability, education and schooling,
health and access to health facilities, general indicators of well-being and employment
• In some instances, small sample sizes limit the extent to which data can be interrogated
• In the case of the Western Cape, the sample for all households is 2,898 while the sample size
for households in shacks not in backyards is 161
• The sample frame is based on Census 2001 EA level data
• This has been augmented throughout the past decade through additional listings, including
work done for the 2007 Community Survey
• There are continuous changes across Primary Sampling Units (PSUs)
• PSUs comprise several EAs grouped according to geotype
• Three different sample designs were used over the years: 2002-2004, 2005-2007, 2008-present
• Sample may be biased toward older, more established settlements if the sample design does
not explicitly incorporate newer informal settlements
• The target population of the GHS is private households in all provinces of South Africa as well
HOUSEHOLDS INCOME: ALLOCATED VALUES FOR EACH INCOME RANGET A B L E 1 6

PAGE 36INFORMAL SETTLEMENTS IN THE FREE STATE - AUGUST 2013 RESEARCH REPORT
as residents in workers’ hostels. The survey does not cover other collective living quarters such
as students’ hostels, old age homes, hospitals, prisons and military barracks
9.4 Income and Expenditure Survey 2010/11• The 2010/11 IES is a survey of income and expenditure patterns
• It is based on a combination of the diary and recall methods of capture
• In some instances, small sample sizes limit the extent to which data can be interrogated
• In the case of the Free State, the sample for all households is 2,172 while the sample size for
households in shacks not in backyards is 172
• This survey was conducted between September 2010 and August 2011
• The sampling frame for the IES 2010/11 was obtained from Stats SA’s Master Sample based
on the 2001 Census Enumeration Areas (EAs). The Master Sample is designed to cover all
households living in private dwelling units and workers living in workers’ quarters in South Africa
• The IES 2010/11 sample is based on an extended sample of 3,254 PSUs which consist of the
3,080 PSUs in the Master Sample and an additional 174 urban PSUs selected from the PSU frame
• The estimates in the IES have not been weighted to Census 2011; rather the survey has been
weighted to mid-March 2011 population estimates
• The IES uses an integrated weighting system not tailored to estimate households; therefore it
is advisable to use proportions and averages rather than actual population numbers
• Stats SA is confident that estimates are representative of the sample on the ground and that
shacks are covered well in the IES (as well as the Census)

INFORMAL SETTLEMENTS IN THE FREE STATE - AUGUST 2013 RESEARCH REPORT
The Housing Development Agency (HDA)Block A, Riviera Office Park,
6 – 10 Riviera Road,
Killarney, Johannesburg
PO Box 3209, Houghton,
South Africa 2041
Tel: +27 11 544 1000
Fax: +27 11 544 1006/7
www.thehda.co.za