Embed Size (px)
Citation preview

Western Kentucky UniversityTopSCHOLAR®
Masters Theses & Specialist Projects Graduate School
5-2011
Innovative Purification Protocol for HeparinBinding Proteins: Relevance in Biopharmaceuticaland Biomedical ApplicationsSumit BatraWestern Kentucky University, [email protected]
Follow this and additional works at: http://digitalcommons.wku.edu/thesesPart of the Chemistry Commons, and the Medicinal and Pharmaceutical Chemistry Commons
This Thesis is brought to you for free and open access by TopSCHOLAR®. It has been accepted for inclusion in Masters Theses & Specialist Projects byan authorized administrator of TopSCHOLAR®. For more information, please contact [email protected].
Recommended CitationBatra, Sumit, "Innovative Purification Protocol for Heparin Binding Proteins: Relevance in Biopharmaceutical and BiomedicalApplications" (2011). Masters Theses & Specialist Projects. Paper 1062.http://digitalcommons.wku.edu/theses/1062


INNOVATIVE PURIFICATION PROTOCOL FOR HEPARIN BINDING PROTEINS: RELEVANCE IN BIOPHARMACEUTICAL AND BIOMEDICAL APPLICATIONS
A Thesis
Presented to The Faculty of the Department of Chemistry
Western Kentucky University Bowling Green, Kentucky
In Partial Fulfillment Of the Requirements for the Degree
Master of Science
By Sumit Batra
May 2011


iii
ACKNOWLEDGEMENT
IN THE NAME OF GOD THE MOST GRACIOUS AND THE MOST MERCIFUL
I am grateful to God the Almighty, for gracing me with strength to complete this thesis. I
would like to take this opportunity to record my appreciation for those who had been so
significantly influential and responsible for my achievement in order to complete this
thesis. First and foremost, I would like to express my sincerest gratitude to my research
supervisor Dr. Rajalingam Dakshinamurthy for his guidance, knowledge, constant
support and detailed and constructive comments in assisting for the completion of my
research. I attribute the level of my master's degree to his encouragement and effort, and
without him this thesis, too, would not have been completed or written.
I would also like to thank Dr. Eric Conte our collaborator for his support and
encouragement.
I would also like to thank Dr. Cathleen Webb, Department Head, Department of
Chemistry, and my committee member Dr. Chad Snyder. They have been constantly
helpful and I sincerely appreciate it. Also, I would like to thank the faculty and staff of
the Department of Chemistry for their support in my graduate career at Western
Kentucky University.
I wish to thank all my colleagues for their support.
Finally, I dedicate my thesis to my family Mr. Subhash Chander Batra, Mr.
Ramesh Chand Batra, Mrs. Madhu Batra, Ms. Tanu Batra, Ms. Nitika Batra, Mr. Ashish
Sareen and Ms. Pooja Patel who supported me the most during my challenging times here
at Western Kentucky University.

iv
TABLE OF CONTENTS
1. Introduction…………………………………………………………………………...1
2. Materials and Methods……………………………………………………………….18
3. Results and Discussion………………………………………………………………25
4. Conclusion…………………………………………………………………………...47
5. Future Studies……………………………………………………………..................48
6. References……………………………………………………………………………49

v
LIST OF FIGURES
1. Protein Biosynthesis…………………………………………………………………..4
2. Peptide Bond…………………………………………………………………..............5
3. Structure of Protein……………………………………………………………………6
4. Biopharmaceutical Market Overview…………………………………………………9
5. Heparan Sulfate………………………………………………………………............11
6. Signaling Mechanism of FGF………………………………………………..............12
7. Three Dimensional Structure of FGF and D2 Domain of FGF……………………...13
8. Affinity Chromatography…………………………………………………………….15
9. Cation Exchange Chromatography……………………………………………..........17
10. Flowchart of FGF Purification by Affinity Chromatography………………...……...19
11. Flowchart of FGFR Purification by Affinity Chromatography……………...............21
12. SDS-PAGE of Overexpression of FGF and D2 Domain……………………….........26
13. SDS-PAGE of Purification of FGF Using On-Column Heparin Affinity
Chromatography..........................................................................................................28
14. SDS-PAGE of Purification of the D2 Domain Using On-Column Ni-NTA and
Heparin Affinity Chromatography……………………………………......................30
15. Flowchart of Purification of FGF Using IRC 50……………………….………........33
16. SDS-PAGE of Purification of FGF Using IRC 50……………………………..........34
17. Flowchart of Purification of D2 Domain Using IRC50……….…………….............36
18. SDS-PAGE of Purification of D2 Domain Using IRC50……………………............37
19. SDS-PAGE and Mass Spectrograph of the Protein Purified by IRC 50 …….………39
20. SDS-PAGE of the Biological Activity of Purified Proteins…………………………42

vi
21. Fluorescence Emission Spectra of FGF-1…………………………………..….........44
22. Fluorescence Emission Spectra of D2 domain………………………………............45
23. Schematics Off-Column Purification Method…………………………………........48

vii
LIST OF TABLES
1. Comparison of Amberlite IRC 50 and Column Affinity Chromatography………….46

viii
INNOVATIVE PURIFICATION PROTOCOL FOR HEPARIN BINDING PROTEINS: RELEVANCE IN BIOPHARMACEUTICAL AND BIOMEDICAL APPLICATIONS
Sumit Batra May 2011 61 Pages
Directed by: Dr. Rajalingam Dakshinamurthy
Department of Chemistry Western Kentucky University
Heparin binding (HB) proteins mediates a wide range of important cellular processes,
which makes this class of proteins biopharmaceutically important. Engineering HB
proteins could bring many advantages, but it necessitates cost effective and efficient
purification methodologies compared to the currently available methods. One of the most
important classes of heparin binding protein is the fibroblast growth factors (FGFs) and
its receptors (FGFRs). In this study, we report an efficient off-column purification of
FGF-1 from soluble fractions and purification of the D2 domain of FGFR from insoluble
inclusion bodies, using a weak amberlite cation (IRC) exchanger. This approach is an
alternative to conventional affinity column chromatography, which exhibit several
disadvantages, including time-consuming experimental procedures and regeneration and
results in high cost for production of recombinant proteins. Authenticity of the purified
proteins was verified by SDS-PAGE and MALDI mass spectrum analysis. Results of the
heparin binding chromatography and steady state fluorescence experiments showed that
the FGF-1 and the D2 are in a native biologically active conformation. The findings of
this study will not only aid an in-depth investigation of this class of proteins but will also
provide avenues for inexpensive and efficient purification of other important biological
macromolecules.
1
INTRODUCTION
Proteins
Proteins, from the Greek word proteios, meaning, the class of organic compound that are
present in and vital to every living cell. In the form of skin, hair, callus, cartilage,
muscles, tendons and ligaments, proteins hold together, protect, and provide structure to
the body of a multi-celled organism [1]. In the form of enzymes, hormones, antibodies,
and globulins, they catalyze, regulate, and protect the body chemistry [2-6]. The word
protein was first mentioned in a letter sent by the Swedish chemist Jöns Jakob Berzelius
to Gerhardus Johannes Mulder on July 10, 1838. In the eighteenth century Antoine
Fourcroy and others then recognized proteins as a distinct class of biological molecules.
Proteins were distinguished by the molecules ability to coagulate or flocculate under
treatments with heat or acid. During that time, examples of protein included albumin
from egg whites, blood, serum albumin, fibrin, and wheat gluten. Dutch chemist
Gerhardus Johannes Mulder carried out elemental analysis of common proteins and
found that nearly all proteins had the same empirical formula. Mulder went on to identify
the products of protein degradation such as the amino acid leucine for which he found a
molecular weight of 131 Da [7-8].
Proteins are then discovered to be the large biological molecules with molecular
weight upto few million Daltons [9]. Proteins consist of one or more polypeptides
typically folded into a globular or fibrous form in a biologically functional way [10]. A
polypeptide is a single linear polymer chain of amino acids bonded together by peptide
bonds between the carboxyl and amino groups of adjacent amino acid residues [11]. The
sequence of amino acids in a protein is defined by the sequence of a gene, which is

2
encoded in the genetic code [12]. There are only 20 standard amino acids that exist in
living organism. Sometimes these amino acids are chemically modified in the protein
after protein synthesis [11]. In total the number of different proteins, which it is possible
to produce from 20 amino acids is enormous. For example for 10 amino acid sequence it
is possible to have 20 different sequences, which is approximately equal to 10 trillions of
different structures [9]. The study of proteins and their function is central to
understanding both cells and organisms. There are a few reasons why proteins are
important in biology which are; protein serve as a catalyst that maintain metabolic
processes in the cell and also they serve as structural elements both within and outside the
cell [7, 10-11].
A distinguishing property of protein is their ability to fold, which determines the
active conformation of a protein [10]. Some proteins fold into highly rigid structure or
called as “single structure”, and some proteins undergo large rearrangements in
conformations [13]. This conformational change is often associated with “signaling
event” which means when the protein comes in contact with other required molecule it
changes into active conformation to carry out necessary biological functions [7, 14-16].
Active biological conformation is essential for proteins to carry out their function. For
example, enzymes are proteins that catalyze biochemical reactions. The function of an
enzyme relies on the structure of its active site, a cavity in the protein with a shape and
size that enable it to fit the intended substrate very snugly [17]. It also has the correct
chemical properties to bind the substrate efficiently. The active site also contains certain
amino acids that are involved in the chemical reaction catalyzed by the enzyme [18].
Although not all proteins are enzymes, but still, all in some way rely on molecular
3
recognition in order to perform their functions. Transport proteins such as hemoglobin
must recognize the molecules they carry, receptors on the cell surface must recognize
particular signaling molecules, and transcription factors must recognize particular DNA
sequences and antibodies must recognize specific antigens [5-6, 19-20]. The functional
integrity of the cell depends critically on protein-protein interactions, particularly on the
formation of multi-protein complexes [21-22].
Protein Biosynthesis
Protein biosynthesis sometimes referred to, as translation is a very complex multistep
process that involves firstly synthesis of amino acids and transcription, which are then
used for translation [7, 23]. Protein biosynthesis differs in prokaryotes and eukaryotes
[13]. The processes by which proteins are synthesized biologically have become one of
the central themes of molecular biology.
The sequence of amino acid residues in a protein is controlled by the sequence of
the DNA as expressed in messenger RNA at ribosome [23, 11, 13]. Protein synthesis is
the creation of proteins using DNA and RNA. In short the RNA is transcribed in the
nucleus and after completion of this process is transported to cytoplasm and translated by
the ribosomes [10-11, 13]. Proteins can often be synthesized directly from genes by
translating mRNA. When a protein is harmful and needs to be available on short notice or
in large quantities, a protein precursor is produced. A pro-protein is an inactive protein
containing one or more inhibitory peptides that can be activated when the inhibitory
sequence is removed by proteolysis during posttranslational modification [25-26]. Figure
1 represents the series of events occur during protein synthesis.

4
Figure 1: Protein biosynthesis
(Source: Wikipedia)
Structure of Protein
Generally, proteins contain from a range of 50 to 1000 amino acid residues per
polypeptide chain. A peptide bond is an amide bond formed by the reaction of a α-amino
group (NH2) of one amino acid with the carboxyl group (COOH) of another, as shown
below in Figure 2 [11].

5
Figure 2: Peptide bond
(Source: Birkbeck College 1995)
Proteins are not an entirely rigid structure [14]. The shape into which a protein
naturally folds is known as its native conformation [11]. Many proteins can fold
unassisted; simply through the chemical properties of their amino acids, others require
the aid of molecular chaperones to fold into their native states [27]. Proteins may shift
between several related structures while they perform their biological function, these
functional rearrangements, these tertiary and quaternary structures are referred to as
conformations and transition between them are called conformational changes [7, 14, 28].
The structure of proteins can be divided into four parts. They are primary, secondary,
tertiary and quaternary structures [11, 29-30]. The primary structure is responsible for the
function of a protein [31]. This structure is composed of various amino acids held
together by peptide bonds. Proteins may have one or more polypeptide chains. Each
polypeptide in a protein has amino acids linked with each other in a specific sequence
and it is this sequence of amino acids that is said to be the primary structure of that
protein [32]. The repeating amino acid sequences stabilized by hydrogen bonds results in
so-called secondary structures [31]. Most common e.g. are alpha helix, beta sheets and
turns. Proteins also undergo extensive folding into complex three-dimensional geometry

6
called as tertiary structure that is maintained by hydrogen bonds, disulfide bonds, ionic
bonds and hydrophobic interactions [32]. It coils and folds in such a way that the
hydrophobic side chains are held interior and the hydrophilic groups are held outside.
This arrangement gives stability to the molecule [33]. When these different protein
subunits joined together they form quaternary structure known as protein complex [32-
33]. Different protein structure has been shown below in figure 3.
Figure 3: Structure of protein
(Source: Campbell, N. 5th edition)
Protein molecules have been crystallized and examined by X-ray diffraction
crystallography, a technique that allows the visualization of the precise three-dimensional
positioning of atoms in relation to each other in a crystal [32-34]. Nuclear magnetic
resonance (NMR) technique can also be used to determine the structure of protein, only
9% of protein structure has been known by using NMR [7, 34]. Secondary structure
composition of a protein can be determined by circular dichroism [35]. Cryo-electron

7
microscopy has recently been used to determine the protein structure to high resolution
[36].
Biopharmaceuticals: The New Era
The roots of biotechnology can be traced back into antiquity when brewing, cheese
making and baking were discovered. An important step for the humanity and science of
biology was the invention of the microscope in 1670s. Antonie Van Leeuwenhoek was
the first person to see the microbes with his invention [37-38]. Edward Jenner invented
the smallpox vaccination and another scientist Louis Pasteur created a process of
controlled heating for milk, beer, etc, without affecting flavors [39-41]. The advances in
the science of biology in the 18th and 19th centuries allowed the development of microbial
bases for the brewing and baking process [42]. The post second world war period saw the
application of pharmaceutical biotechnology and increased the knowledge of the
molecular basis of biological systems [42]. This accumulation of knowledge led to the
development of new techniques with industrial applications.
Since the discovery that the human body is composed of cells and proteins that are
susceptible to but can also fight off pathogenic microbes has challenged our imagination
to develop biopharmaceuticals. The term “biopharmaceutical” was first used in 1980 and
was used to describe a class of therapeutic drugs produced by modern biotechnological
techniques, specifically via genetic engineering (1970) or by hybridoma technology
(1975) (in case of monoclonal antibodies) [43]. These mainly include proteins (including
antibodies), nucleic acids (DNA, RNA or antisense oligonucleotides) used for therapeutic
or diagnostic purposes [43-45].

8
The first biopharmaceutical substance approved for therapeutic use was
biosynthetic 'human' insulin made via recombinant DNA technology. Also “referred” to
as rHI, under the trade name Humulin [43, 45]. Since then, different biopharmaceuticals
products have been developed like blood factors used for treatment of haemophilia,
thrombolytic agents used to treat thromboembolism, hematopoietic growth factors used
in the treatment of blood related diseases, interferons used in the treatment of leukemia
and multiple sclerosis, growth hormone, colony stimulating factors, growth factors like
heparin binding proteins, interleukin based products etc. [46-55].
While most biopharmaceuticals approved are intended for human use, a number of
products developed are used for veterinary application, e.g., recombinant bovine growth
hormone used to increase milk yields from dairy cattle [56]. Till mid 2002, 120
biopharmaceutical products has been approved for marketing in USA and/or European
Union which represents global biopharmaceutical market of $15 billion [43]. Since then
the impact of biopharmaceuticals on global healthcare and the economy is substantial and
growing rapidly. Protein biopharmaceuticals are the fastest-growing category of new
drugs as they currently target over 200 human diseases, including wound healing, cancer,
heart disease, Alzheimer's disease, diabetes, multiple sclerosis, AIDS, and arthritis [57-
58]. The biopharmaceutical industry has invested $ 65.2 billion in research and
development of new medicines in the year 2008 [59]. Figure 4 gives the rise in
biopharmaceutical market.

9
Figure 4: Biopharmaceutical market overview
(Source: Business Insight 2006)
The total number of patents granted for biopharmaceuticals has risen significantly
since the 1970s. In 1978 the total patents granted was 30, which then climbed to 15,600
in 1995, and by 2001 there were 34,527 patent applications [60].
Heparin Binding Proteins
One important class of protein biopharmaceuticals are heparin binding proteins which
consist of a wide range of protein families including epidermal growth factors (EGF’s),
fibroblast growth factors (FGF’s), connective tissue growth factors (CTGF), midkines,
etc. [61]. Heparin (highly sulfated glycosoaminoglycans) and heparan sulfate
glycosaminoglycans (HSGAGs) (present on the surface of all the adherent cells) mediate
a wide variety of complex biological processes by binding to this specific class of more
10
than 200 extracellular proteins [62]. In many instances these interactions have been
demonstrated to require distinct HS chemical characteristics. As one extreme example,
the binding of antithrombin III to heparin and HS requires a specific pentasaccharide
sequence containing a unique 3-O sulfate on the central glucosamine residue [62].
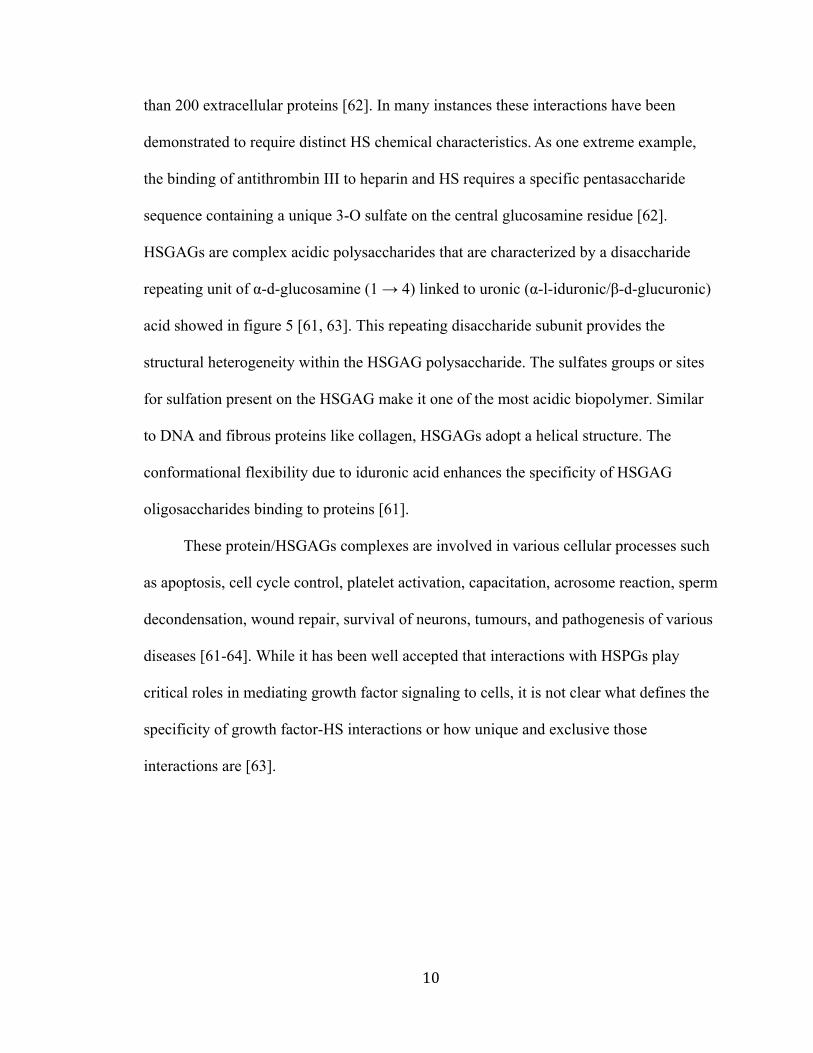
HSGAGs are complex acidic polysaccharides that are characterized by a disaccharide
repeating unit of α-d-glucosamine (1 → 4) linked to uronic (α-l-iduronic/β-d-glucuronic)
acid showed in figure 5 [61, 63]. This repeating disaccharide subunit provides the
structural heterogeneity within the HSGAG polysaccharide. The sulfates groups or sites
for sulfation present on the HSGAG make it one of the most acidic biopolymer. Similar
to DNA and fibrous proteins like collagen, HSGAGs adopt a helical structure. The
conformational flexibility due to iduronic acid enhances the specificity of HSGAG
oligosaccharides binding to proteins [61].
These protein/HSGAGs complexes are involved in various cellular processes such
as apoptosis, cell cycle control, platelet activation, capacitation, acrosome reaction, sperm
decondensation, wound repair, survival of neurons, tumours, and pathogenesis of various
diseases [61-64]. While it has been well accepted that interactions with HSPGs play
critical roles in mediating growth factor signaling to cells, it is not clear what defines the
specificity of growth factor-HS interactions or how unique and exclusive those
interactions are [63].

11
Figure 5: Heparin sulfate
(Source: Glycosan Biosystems)
Fibroblast Growth Factors and its Receptor
One of the most important classes of heparin binding proteins are fibroblast growth
factors (FGFs) which constitute a large family of structurally related proteins that are
involved in many biological processes such as angiogenesis, cell growth, embryogenesis,
differentiation, and wound healing [65-66]. FGFs are also used as biopharmaceutical
drugs to improve wound healing caused by metabolic diseases such as obesity, diabetes,
infection, chronic liver failure, malnutrition, and second-degree burns [65-66]. FGFs
exert their biological activity by binding to tyrosine kinase receptors (FGFRs) on the cell
surface in the presence of HSPGs [67]. The signaling involves ligand-induced receptor
dimerization and autophosphorylation, followed by a downstream transfer of the signal
showed in figure 6 [68]. However, in the absence of cell surface proteoglycan, heparan
sulphate results in a dramatic decrease in FGFR activity for proliferation, mitogenesis,
wound healing, and neuro-vascularization [67-69]. FGFRs contain an extracellular

12
domain, a short transmembrane domain, and a cytoplasmic tyrosine kinase domain. The
FGFR consists of extracellular immunoglobulin-type domain having three structural
subdomains named D1, D2 [Fig 7], and D3. The D2 subdomain contributes to the ligand
(FGF) binding [67-69].
Figure 6: Signaling mechanism of FGF
Fibroblast growth factor was first found in pituitary extracts by Armelin and then
was also found in a cow brain extract [Fig. 7] [70-71]. On further fractionation two
slightly different forms were extracted using acidic and basic pH and isolated that were
named "acidic fibroblast growth factor" (FGF1) and "basic fibroblast growth factor"
(FGF2). These proteins had a high degree of amino acid identity but were determined to
be distinct mitogens [72].
The involvement of these proteins in several biological processes stated above
showed their importance for biopharmaceutical and research purposes (i.e., to understand
13
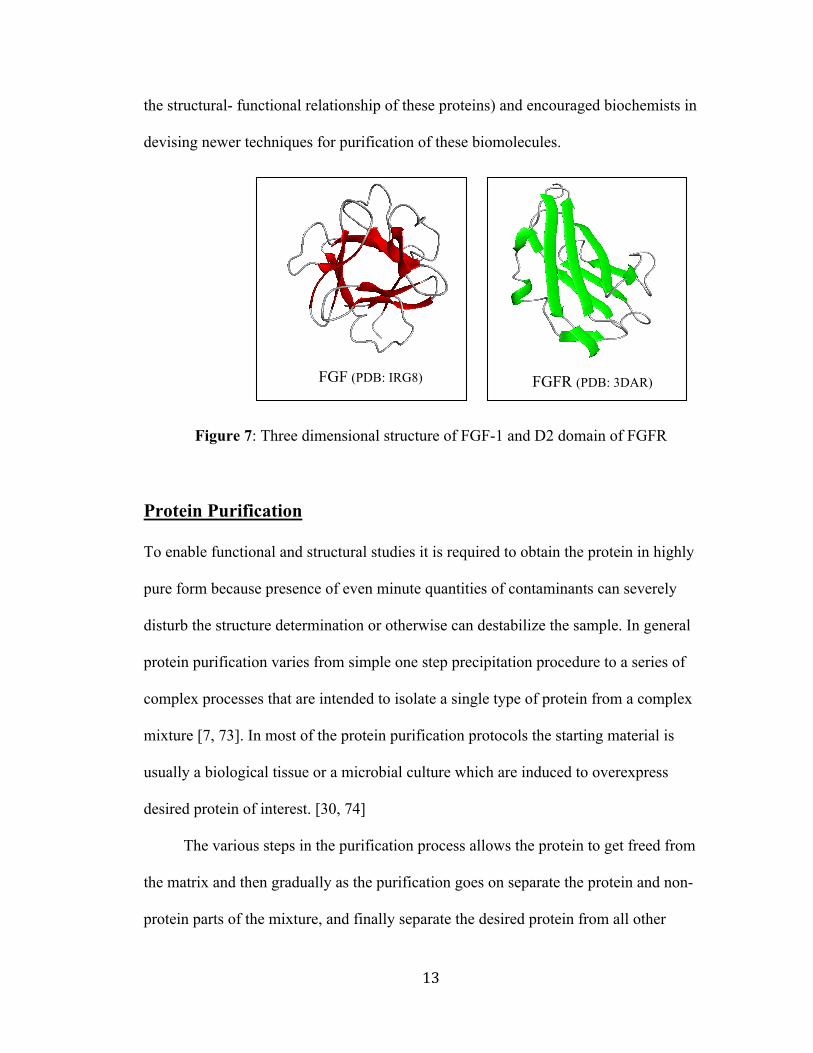
the structural- functional relationship of these proteins) and encouraged biochemists in
devising newer techniques for purification of these biomolecules.
Figure 7: Three dimensional structure of FGF-1 and D2 domain of FGFR
Protein Purification
To enable functional and structural studies it is required to obtain the protein in highly
pure form because presence of even minute quantities of contaminants can severely
disturb the structure determination or otherwise can destabilize the sample. In general
protein purification varies from simple one step precipitation procedure to a series of
complex processes that are intended to isolate a single type of protein from a complex
mixture [7, 73]. In most of the protein purification protocols the starting material is
usually a biological tissue or a microbial culture which are induced to overexpress
desired protein of interest. [30, 74]
The various steps in the purification process allows the protein to get freed from
the matrix and then gradually as the purification goes on separate the protein and non-
protein parts of the mixture, and finally separate the desired protein from all other
FGF(PDB: IRG8)
FGFR (PDB: 3DAR)

14
proteins [7]. Separation of one protein from all others is typically the most laborious
aspect of protein purification. Pure proteins are then analyzed by different techniques for
homogeneity and biological activity. Proteins are separated on the basis of differences in
their size, physico-chemical properties, binding affinity and biological activity [30, 73-
74]. Purpose of protein purification is to produce a relatively large quantity of purified
proteins for various uses. Examples include the preparation of commercial products such
as enzymes (e.g. lysozyme), nutritional proteins, and certain biopharmaceuticals (e.g.
insulin) [30, 75-76].
Today scientists are using recombinant DNA technology to produce large
quantities of desired protein if present in very less quantity in natural source.
Recombinant expression also allows the protein to be tagged, e.g. by a His-tag, to
facilitate and reduce the steps involved in purification [30, 61, 77].
Different proteins can be purified by different ways like precipitation,
ultracentrifugation, chromatographic method based on size, charge, hydrophobicity,
affinity, metal binding, HPLC [30, 73-74, 78]. Here we are going to discuss about two
important heparin binding protein human FGF-1 and D2 domain of FGFR which are
traditionally purified by using affinity chromatographic methods [Fig. 8].

15
Figure 8: Affinity chromatography
(Source: Proteincrystallography.org)
Objective of Study
The advantages associated with using pure and homogenous biomolecules like proteins,
enzymes, and nucleic acids etc. in place of small organic molecules have attracted the
attention of biochemists in devising new, economical and efficient techniques for expression,
purification and characterization of these biomedically important biomolecules [79-81].
Proteins are a novel type of compound in comparison to traditional small molecules.
They present new and significant challenges to the realization of their full potential as
therapeutic agents [79]. FGF-1 and D2 domain of FGFR are those proteins which, due to
their intrinsic property to adopt alternative conformations during protein expression,
folding, unfolding and aggregation during isolation presents numerous challenges for
their isolation/separation, as the separated proteins become essentially irrelevant from a
16
biochemical perspective, which in turn leads to the use of sophisticated methodologies
with multiple steps. These challenges result in higher cost for production of these
recombinant proteins, which currently limits their effective application [80-81].
The objective of this study was to devise a novel simple, cost effective and scalable
method for large scale recombinant protein purification. Low cost protein purification
methods are in high demand for mass production of low selling price biopharmaceuticals
that play an important role in the upcoming bio-economy.
This new technique is based on ion exchange chromatography where inexpensive
amberlite weak cation exchange resin has been used in place of a heparin/Ni-NTA resins
for purification of fibroblast growth factor and D2 domain of fibroblast growth factor to
achieve pure protein in biologically active conformation. Ion exchange chromatography has
been known to be an efficient technique for separation of proteins [82]. Ion exchange
chromatography is based on the principle of interaction between oppositely charged protein
molecules (FGF-1 and D2 domain) and solid phase molecules (IRC 50) [82-83].

17
MATERIALS AND METHODS
Materials
E. coli [BL21(DE3)] was purchased from Invitrogen. Heparin and Ni-NTA sepharose
were obtained from GE Health Science. Amberlite IRC 50 was purchased from Acros
organics. Lysozyme was purchased from Sigma-Aldrich. All other chemicals used in this
study were of American Chemical Society reagent grade.
Methods
Construction and expression of FGF-1 and D2 domain of FGFR
Human FGF-1 residues 14-154 (GenBank # X59065) and D2 domain of human FGFR,
residues 145-259 (GenBank # AK026508) from full length FGFR, cDNAs were made by
procedures essentially as previously described and cloned into a pJExpress414 vector
(DNA2.0) and transformed into BL21(DE3) E. coli cells for the overexpression [84]. The
gene sequences were optimized using DNA2.0 codon bias algorithm to maximize the
yield of the proteins, prior to cloning [85]. E. coli cells transformed with pJExpress414
containing the FGF-1 and D2 domain insert were grown in 100 mL Luria broth (LB)
medium separately. Protein induction was achieved by the addition of IPTG (0.5 mM/L)
when the absorbance of the growing culture had reached about 0.6 at 600 nm. The culture
was incubated at 37 °C for additional 6 hours and the cells were harvested and lysed by
sonication. The expression and solubility of both FGF-1 and D2 domain were analyzed
by SDS-PAGE.

18
Purification of FGF-1 using on-column heparin affinity chromatography
The protein was expressed as soluble form and the purification was achieved by heparin
sepharose affinity column [Fig. 9]. The soluble protein was loaded onto heparin
sepharose affinity column. FGF bound to heparin sepharose column was washed with 4
bed volumes each (~100 mL) of two different elution buffers 20 mM phosphate buffer
(pH 7.2) and 20 mM phosphate buffer containing 0.5 M NaCl (pH 7.2). Finally, the
protein was eluted with the elution buffer containing 1.5 M NaCl [87-90].
Figure 9: Schematic representation of FGF purification by affinity chromatography

19
Purification of D2 domain using on-colum heparin and Ni-NTA affinity
chromatography
The proteins expressed in the inclusion bodies were dissolved and extracted in 20 mM
phosphate (pH 7.5), containing 300 mM NaCl and 8 M urea at room temperature. Protein
purification was achieved in two steps [Fig. 10]. Inclusion bodies dissolved in 20 mL of 8
M urea were loaded onto Ni-NTA nickel affinity column. D2 domain bound to the
column was washed with 10 bed volumes (~100 mL) of the elution buffer [20 mM
phosphate buffer (pH 7.5) containing 300 mM NaCl, 20 mM Imidazole, and 50 mM
ammonium sulfate]. Finally, the refolded protein was eluted with an elution buffer
containing 500 mM imidazole. Further purification was achieved using heparin sepharose
affinity column. The partially pure protein obtained from Ni-NTA column was loaded on
a heparin sepharose column and washed with a 20 mM phosphate buffer (pH 7.2) to
remove the contaminating proteins. D2 domain bound to heparin sepharose was eluted
with 1.5 M NaCl [91-92].

20
Figure 10: Schematic representation of FGFR purification by affinity chromatography

21
Purification of recombinant FGF-1 using Amberlite weak cation exchange resin
Purification of FGF-1 was achieved by applying clear soluble fraction of bacterial cell
lysate onto an IRC column packed in 15 mL centrifuge tubes and allowed to stand for 45
minutes, centrifuged at 12000 rpm for 10 minutes and the supernatant collected. The
resin was then extensively washed, with 10 mM Tris buffer (pH 7.4) and thrice with 10
mM Tris buffer (pH 7.4) containing 50 mM NaCl. After each wash, samples were
centrifuged at 12000 rpm for 10 minutes the supernatant fractions were then collected
separately. FGF-1 was further eluted from 8 the resin by washings with 10 mM
phosphate buffer (pH 7.2) containing 1.5 M NaCl, incubated for 30 minutes, centrifuged
at 12000 rpm for 10 minutes, and collected as separate fractions. Throughout the
purification, the temperature was maintained at 4 °C. The protein was further desalted
and concentrated by ultrafitration in 10 mM phosphate (pH 7.2) containing 100 mM
NaCl. The concentration of the protein was estimated on the basis of the extinction
coefficient value (Σ280=17420 M-1 cm-1) calculated from the amino acid sequence of
FGF-1 [86]. The homogeneity and authenticity of the protein was assessed by using SDS-
PAGE, MALDI-TOF mass spectrum analysis, heparin binding affinity and steady state
fluorescence.
Purification of recombinant D2 domain of FGFR using Amberlite weak cation
exchange resin
Purification of the D2 domain was achieved by denaturation of the inclusion bodies
(insoluble fraction of bacterial cell lysate) using 5 mL of denaturation buffer (8 M urea,
10 mM Tris buffer) to a final concentration of 2 mg/mL protein. The suspension was then
22
centrifuged for 10 minutes at 12,000 rpm and the supernatant was loaded onto the IRC
column packed in a 15 mL centrifuge tube. Refolding of the protein was induced by
decreasing the urea concentration using 10 mM Tris buffer (pH 7.4), in a stepwise linear
gradient method from 8 to 0 M over a 2 hours period. After refolding, the protein was
allowed to stand for 60 minutes, centrifuged at 12,000 rpm for 5 minutes and collected.
The resin was then washed thrice with 10 mL of 10 mM phosphate (pH 7.4), centrifuged,
and fractions were collected separately. Further elution was done by washing the resin
twice with 10 mM phosphate (pH 7.2) containing 1.5 M NaCl, incubated for 40 minutes,
centrifuged and collected as separate fractions. The protein was further desalted and
concentrated by ultra filtration in 10 mM phosphate (pH 7.2) containing 100 mM NaCl.
The refolding and purification procedures were carried out at 4 °C. The concentration of
the protein was estimated on the basis of the extinction coefficient value (Σ280=24075
M-1 cm-1) 9 calculated from the amino acid sequence of the D2 domain [86]. Purified
D2 domain was assessed for homogeneity and authenticity by using SDS-PAGE,
MALDI-TOF mass spectrum analysis, heparin binding affinity and steady state
fluorescence.
Heparin affinity Chromatography
The purified protein (FGF-1 or D2 domain) was loaded onto heparin sepharose column
and incubated for 90 mins. The column was then washed with 10 mM phosphate buffer
(pH 7.2). The column was further washed with 10 mM phosphate buffer containing 0.5
M NaCl (pH 7.2). Finally, the protein was eluted with the elution buffer containing 1.5 M

23
NaCl. Throughout the purification the temperature was maintained at 4 °C. The
authenticity of the protein was checked by SDS-PAGE.
Steady state fluorescence
Fluorescence experiments were performed on a PerkinElmer spectrofluorimeter. The
excitation wavelength was set at 280 nm, and bandwidths for excitation and emission
were set at 2.5 nm and 10 nm, respectively. Intrinsic fluorescence measurements were
made at a protein concentration of 50 µM. For the thermal denaturation experiments, the
protein and sucrose octasulfate (SOS-a structural analog of heparin) were mixed in a 1:1
ratio in 10 mM phosphate buffer (pH 7.2) containing 100 mM NaCl. The requisite
temperature(s) in the thermal denaturation experiments was attained using a Quantum
Northwest temperature controller system. Necessary background corrections were made
in all spectra.

24
RESULTS AND DISCUSSIONS
Low cost protein purification methods are in high demand for production of low cost
biopharmaceuticals which shows the importance of biomolecules in therapeutics. The
driving force for devising new inexpensive purification and characterization techniques
for biopharmaceuticals is because of their potential to cure number of diseases with fewer
side effects because of their specificity. In therapeutics biopharmaceuticals drugs
structurally mimics a number of compounds found within the body for example,
cytokines, enzymes, hormones, clotting factors, vaccines, monoclonal antibodies,
antisense drugs, and peptides which require to produce these compounds in pure form for
research purposes, i.e to understand the structural-functional relationship of these
compounds which will be helpful in fabrication or synthesis of newer drugs which help
to cure diseases caused by inactivity or hyperactivity of these compounds [87].
Overexpression of FGF-1 and D2 domain
The FGF-1 construct used in the present study is 140 amino acids long from the full
length human FGF-1. SDS-PAGE of the bacterial cells induced by IPTG showed that
most of the protein was expressed in soluble form [Fig. 11A]. The D2 domain construct
used in the present study is 114 amino acids long from the full length human FGFR.
SDS-PAGE of the bacterial cells induced by IPTG showed that most of the expressed
protein is trapped as inclusion bodies [Fig. 11B].

25
Figure 11: A- SDS-PAGE depicting the expression and purification of FGF-1 from E.
coli. Lane M represents the molecular weight marker; lane 1, uninduced sample; lane 2,
induced sample; lane 3, lysate of induced sample soluble fraction; lane 4, lysate of
induced sample insoluble fraction. B- SDS-PAGE depicting the expression and
purification of the D2 domain of FGFR from E. coli. Lane M, represents the molecular
weight marker; lane 1, uninduced sample; lane 2, induced sample; lane 3, lysate of
induced sample soluble fraction; lane 4, lysate of induced sample insoluble fraction.
26
Purification of the FGF-1 using on-column heparin affinity
chromatography
The purification of the recombinant FGF-1 was facilitated by using heparin affinity resin.
FGF-1 was bound to heparin quite strongly and the unbound contaminating protein was
eliminated by washing the resin with 100 mL of wash buffer [10 mM phosphate buffer
(pH 7.2)]. Other impurities which nonspecifically bind to heparin resin were further
removed by washing the column with 10 mM phosphate buffer (pH 7.2) with 0.75 mM
NaCl. FGF-1 was eluted with 10 mL phosphate buffer (pH 7.2) containing 1.5 M sodium
chloride. SDS-PAGE of the purified FGF-1 sample yielded an intense single band
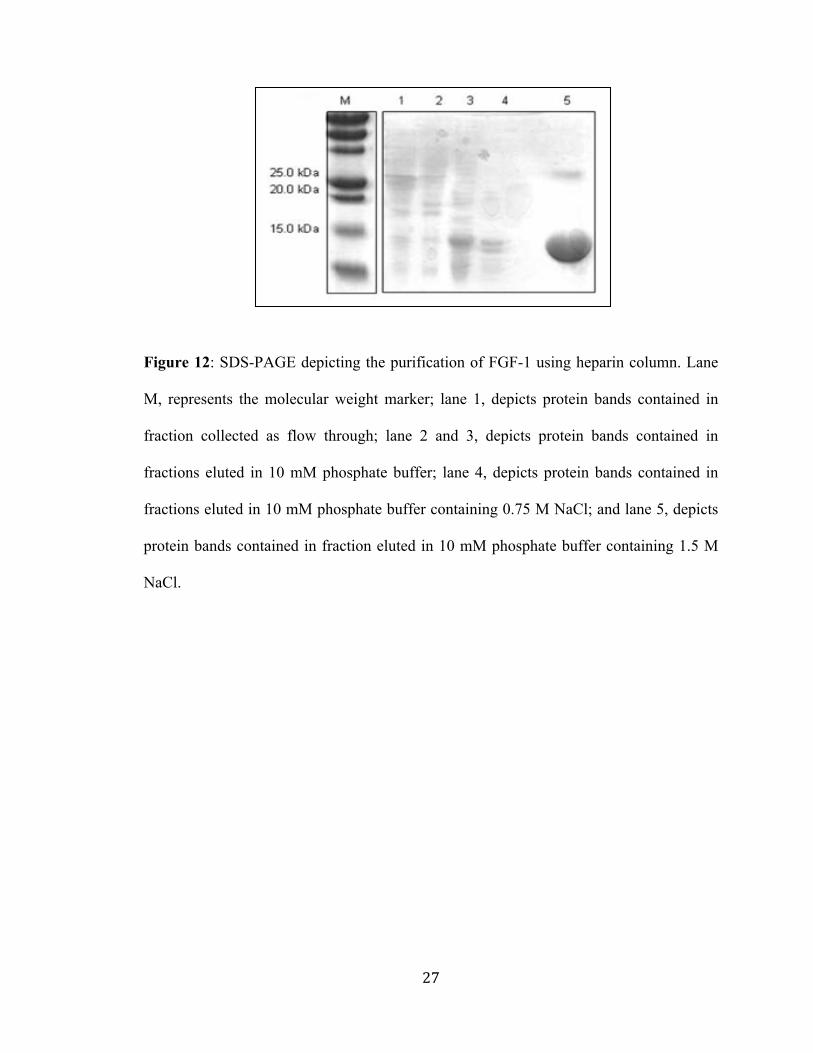
corresponding to a molecular mass of ~16 kDa with about 98% purity [Fig. 12].
27
Figure 12: SDS-PAGE depicting the purification of FGF-1 using heparin column. Lane
M, represents the molecular weight marker; lane 1, depicts protein bands contained in
fraction collected as flow through; lane 2 and 3, depicts protein bands contained in
fractions eluted in 10 mM phosphate buffer; lane 4, depicts protein bands contained in
fractions eluted in 10 mM phosphate buffer containing 0.75 M NaCl; and lane 5, depicts
protein bands contained in fraction eluted in 10 mM phosphate buffer containing 1.5 M
NaCl.

28
Purification of the D2 domain using on-column Ni-NTA and heparin
affinity chromatography
The inclusion bodies were denatured using 8 M urea. Urea basically alters the water
structure and dynamics and thereby diminishes the hydrophobic effects by encouraging
solvation of hydrophobic groups. In addition, urea also weakens the water structure
which then competes for intraprotein electrostatic interactions. Ureal also interacts
directly with polar residue and peptide backbone, thereby stabilizes the nonnative
conformation. In this ways urea denatures the protein both directly and indirectly as well
[88]. The refolding of the recombinant D2 domain was facilitated by incubating the
denatured protein fraction with Ni-NTA affinity resin and refolded using a linear gradient
(8 M to ~ 0 M) by washing with 20 mM phosphate buffer (pH 7.5) containing 20 mM, 50
mM, 50 mM, 100 mM imidazole concentration and finally the protein was eluted in 500
mM imidazole concentration. Increasing concentration of imidazole has been used for
two main purposes; firstly, to reduce the concentration of urea to get the protein in native
conformation and secondly, to elute the protein by competing for positively charged sites
on Ni-NTA column. Further purification was facilitated by incubating 500 mM imidazole
fraction onto heparin affinity resin. The impurities were eluted in 10 mM phosphate
buffer (pH 7.2) and 10 mM phosphate buffer (pH 7.2) containing 0.75 mM NaCl. The D2
domain was eluted with 10 mL phosphate buffer (pH 7.2) containing 1.5 M sodium
chloride and yielded an intense single band (purity ~ 98 %) on SDS-PAGE corresponding
to a molecular mass of ~ 13 kDa [Fig. 13].

29
Figure 13: SDS-PAGE depicting the purification of D2 domain using nickel (lanes 1-5)
and heparin affinity (lanes 6-9) columns. Lane M, represents the molecular weight
marker; lane 1-5, depict protein bands contained in fractions eluted in 20 mM, 50 mM, 50
mM, 100 mM, 500 mM Imidazole concentration, respectively from the nickel column.
Lane 6-9, depicts fractions collected from heparin column. Lane 6, depicts protein bands
contained in fraction collected as flow through; lane 7, depicts protein bands contained in
fraction eluted in 10 mM phosphate buffer; lane 8, depicts protein bands contained in
fraction eluted in 10 mM phosphate buffer containing 0.75 M NaCl concentration; and
lane 9, depicts protein bands contained in fraction eluted in 10 mM phosphate buffer
containing 1.5 M NaCl.

30
Traditional synthetic heparin affinity and Ni-NTA affinity chromatography
methods are effective with a high yield of 32 mg and 20 mg per litre of FGF-1 and D2
domain respectively, they also exhibit several disadvantages including, time-consuming
experimental procedures for purification, and regeneration, a requirement of expensive
affinity resins and difficulties in maintenance of the resins as bacterial growth causes it to
degrade [89-95]. These disadvantages associated with previously reported procedures
results in high cost of commercially available purified proteins which have many
biopharmaceuticals applications.
In order to overcome the disadvantages of affinity chromatography and to reduce
the cost of the purified protein, in the present study we have devised an inexpensive and
efficient off-column purification method to be used as an alternative to conventional
affinity chromatography methods using Amberlite cation exchange resin.
Cation exchange chromatography is based on principle of adsorption of the
molecules to the solid phase which is driven by the ionic interaction between positively
charged protein molecules and negatively charged solid phase particles [Fig. 14]. The
strength of the interaction is determined by the number and location of the charges on the
molecule and on the functional group. The protein molecules are then eluted by varying
the pH close to pI of the protein or increasing the salt concentration [82-83]. By
increasing the salt concentration and varying the pH the molecules with the weakest ionic
interactions start to elute from the column first. Molecules that have a stronger ionic
interaction require a higher salt concentration and elute later in the gradient [82-83]. The
interaction between the protein and the solid phase depends on several factors such as net
charge, charge distribution, ionic strength, pH of solvent, nature of ions, etc [83].

31
Figure 14: Cation exchange chromatography
Amberlite ion exchange resins for protein purification were first used for the
removal of pectinmethylesterase from a preparation of pectinpolygalactonurase using an
amberlite IR 100, a polystyrene cation exchanger (sulfonic acid resin) [74]. Since then
amberlite cation exchange resin IRC 50 has been used for successful chromatographies of
a number of proteins, such as growth hormones, cytochrome c, lysozymes, proteases and
other hormones and proteins etc. [96-108].
Purification of the FGF-1 using IRC 50 resin
The purification of the recombinant FGF-1 was facilitated by using an amberlite weak
cation exchange resin IRC [Fig. 15]. FGF-1 was bound to IRC resin quite strongly and
the unbound contaminating protein was eliminated by washing the resin three times with
10 mL of wash buffer [10 mM Tris buffer (pH 7.4)]. Other impurities which
nonspecifically bind to IRC resin were further removed by washing the column with 10

32
mM Tris buffer (pH 7.4) with 50 mM NaCl. FGF-1 was eluted with 10 mL phosphate
buffer (pH 7.2) containing 1.5 M sodium chloride. SDS-PAGE of the purified FGF-1
sample yielded an intense single band corresponding to a molecular mass of ~ 16 kDa
with ~ 98% purity [Fig. 16].
Figure 15: Schematic representation of FGF purification by IRC resin

33
Figure 16: SDS-PAGE of fractions collected with buffer containing varying
concentration of sodium chloride. Lane M represents molecular weight marker; lane 1,
represents flow through; lane 2, depicts protein bands contained in fraction eluted in 10
mM Tris buffer; lanes 3-5, depicts protein bands contained in fractions eluted in 10 mM
Tris buffer containing 50 mM NaCl; and lane 6 depicts protein band contained in
fractions eluted in 10 mM phosphate buffer containing 1.5 M NaCl.

34
Purification of the D2 domain of FGFR using resin
The refolding of the recombinant D2 domain was facilitated by incubating the denatured
protein fraction with affinity IRC resin and refolded using a linear gradient (8 M to ~ 0
M) by 10 mM Tris buffer (pH 7.4) containing 50 mM NaCl [Fig. 17]. Further purification
was facilitated by washing the resin with 60 mL of wash buffer, 10 mM phosphate buffer
(pH 7.2) containing 50 mM of NaCl. Repeated washing of the column with the wash
buffer also served as an effective protocol to remove any residual denaturant. The D2
domain was eluted with 10 mL phosphate buffer (pH 7.2) containing 1.5 M sodium
chloride and yielded an intense single band (purity ~ 98 %) on SDS-PAGE corresponding
to a molecular mass of ~ 13 kDa [Fig. 18].

35
Figure 17: Schematic representation of D2 domain purification by IRC resin

36
Figure 18: SDS-PAGE of fractions eluted in buffer containing varying concentration of
sodium chloride. Lane 1-3, depicts protein bands contained in fractions eluted at 10 mM
phosphate buffer; and lane 4-6, depicts protein bands contained in fractions eluted in 10
mM phosphate buffer containing 1.5 M NaCl.

37
Assessment of purity and homogeneity of the proteins purified using
IRC 50 resin
SDS-PAGE of the purified protein samples yielded an intense single band per lane
corresponding to a molecular mass of ~13 kDa and ~16 kDa for D2 domain and FGF-1
respectively, with ~ 98% purity when compared with the purity of the 98% pure
lysozyme obtained from Sigma-Aldrich [Fig. 19A]. MALDI-TOF mass spectrum
analysis of the purified recombinant FGF-1 and D2 domain showed an expected
molecular mass of ~16 kDa and ~13 kDa respectively [Fig. 19B and 19C].

38
Figure 19: A - SDS-PAGE depicting the homogeneity and purity of purified FGF-1 and
D2 domain. Lane M, represents the molecular weight marker; lane 1, represents 98%
pure lysozyme; lane 2, represents purified D2 domain of FGFR; lane 3 represents purified
FGF-1. B- MALDI-TOF mass spectrum of the purified FGF-1 sample. C- MALDI-TOF
mass spectrum of the purified D2 domain sample.

39
Amberlite weak cation exchange resin IRC 50 resin is composed of copolymerized
methacrylic acid and divinylbenzene. The resin was found to be more successful because
the methacrylic acid part alone gives 11.6 mmol of carboxylic acid per gram which is
very high in order of binding of resin with protein. The remaining groups in smaller
amounts are methyl and phenyl (crosslinkers) groups. Thus, this stationary phase contains
both hydrophilic charged sites (carboxylate) and hydrophobic sites (methyl and phenyl)
which provide both affinity and hydrophobic binding site(s) for the proteins. The
hydrophobic matrices do not bind irreversibly to the molecules and release them while
washing with buffer (suitable pH) [74]. The pH range varies from 0 to 14. IRC 50 has a
high pKa of 6.5 suited for basic proteins [74].
The efficiency of this new method was based on the less time required to perform
the whole purification, which is approximately 1/3rd of conventional heparin
chromatography (in case of proteins expressed in soluble form) also noteworthy is the
lower cost of the resin as compared to other affinity sepharose resins.
The IRC 50 resin has also been proven useful in cases where proteins are expressed
in inclusion bodies e.g. D2 domain of FGFR. In this case, the time required for refolding
the protein is reduced by 1/4th and refolding occurs on the same column which again
shows that the technique is cost effective as it does not require another column. The
maintenance and regeneration of this resin is very convenient, and could be achieved by
simply incubating the resin in 0.1 M HCl and washing it several times with distilled
water. Overall, this off-column purification strategy using IRC resin is economical,
efficient and easy to maintain.

40
Biological Activity of Recombinant FGF-1 and D2 Domain
It is important to verify whether the recombinant protein purified by the off-column method
is in its biologically active conformation after the purification. In order to test the biological
activity of the recombinant FGF-1 and D2 domain, we observed it’s binding with heparin
using heparin affinity chromatography [89-91, 94]. Both FGF-1 and D2 domain were
loaded onto the heparin column [previously washed with 10mM phosphate buffer (pH
7.2)] separately. No proteins were eluted in the washings with both 10 mM phosphate
buffer (pH 7.2) as well as with 10 mM phosphate buffer (pH 7.2) containing 0.75 M
NaCl. The proteins were eluted on separate SDS-PAGE as a single peak in 10 mM
phosphate buffer (pH 7.2) containing 1.5 M sodium chloride and yielded an intense
single band corresponding to a molecular mass of about 16 kDa and 13 kDa, respectively.
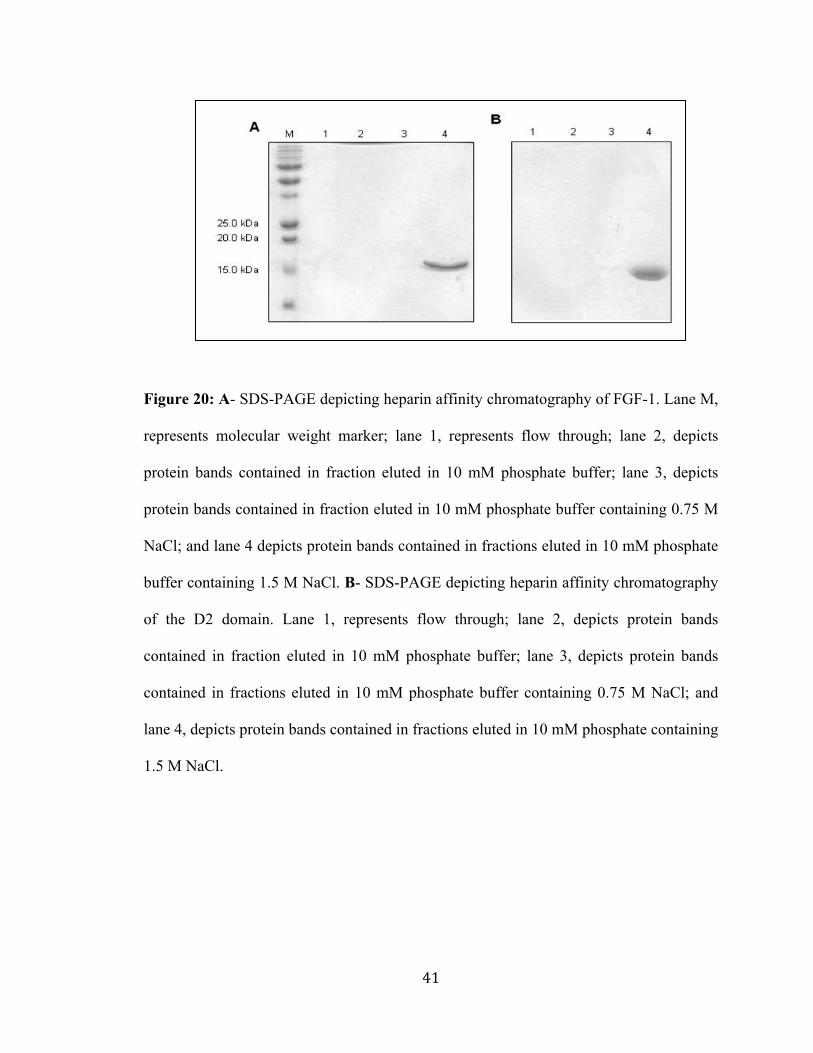
These results clearly suggest that both the recombinant FGF-1 and D2 domain purified
using the off-column strategy are in their biologically active confirmation and could bind
strongly with heparin [Fig. 20A & 20B].
41
Figure 20: A- SDS-PAGE depicting heparin affinity chromatography of FGF-1. Lane M,
represents molecular weight marker; lane 1, represents flow through; lane 2, depicts
protein bands contained in fraction eluted in 10 mM phosphate buffer; lane 3, depicts
protein bands contained in fraction eluted in 10 mM phosphate buffer containing 0.75 M
NaCl; and lane 4 depicts protein bands contained in fractions eluted in 10 mM phosphate
buffer containing 1.5 M NaCl. B- SDS-PAGE depicting heparin affinity chromatography
of the D2 domain. Lane 1, represents flow through; lane 2, depicts protein bands
contained in fraction eluted in 10 mM phosphate buffer; lane 3, depicts protein bands
contained in fractions eluted in 10 mM phosphate buffer containing 0.75 M NaCl; and
lane 4, depicts protein bands contained in fractions eluted in 10 mM phosphate containing
1.5 M NaCl.

42
Biophysical Characterization of Recombinant FGF-1 and D2 domain
The main objective of biophysical characterization of proteins in the context of structural
studies is to evaluate the suitability of the sample after the purification for structure
determination, i.e. if the protein is in a folded, partially folded or unfolded state, the
homogeneity or potentially aggregated state of the protein, the purity and the stability of
the protein.
We assessed the confirmation of the recombinant FGF-1 and D2 domain using
fluorescence spectroscopy. The fluorescence measurement serves as an excellent probe to
characterize the thermodynamic stability of proteins in the absence and presence of a
ligand by monitoring the tertiary structural changes that occur in the proteins under
different environmental conditions (i.e., solution condition) [109-110]. Tryptophan,
tyrosine and phenylalanine are the three amino acid residues responsible for inherent
fluorescence properties of proteins [Fig. 21]. These residues have different absorption
and emission wavelength in different conformations which helps in tracking the tertiary
structural changes in a protein molecule.
The emission spectrum of FGF-1 at ~ 308 nm in its native state is dominated by a
tyrosine emission peak. But in the completely unfolded state FGF-1 exhibits an emission
spectrum dominated at ~ 350 nm which is because of florescence of single well-
conserved tryptophan at position 121 in the full form of the primary sequence [Fig. 22A]
[109-110]. These spectral features are ideal to monitor the denaturant induced unfolding
of the protein. The conformational stability assessed by equilibrium thermal denaturation
showed that the Tm (the temperature at which 50% of the molecules are in the native
state) of the protein increases in the presence of the SOS by about ~ 6 °C (from ~ 44 to

43
50 °C) which suggests that thermodynamic stability of the protein is enhanced upon
binding to the SOS [Fig. 22B] [92].
Figure 21: Chemical structure of tyrosine and tryptophan
(Source: Lehninger, 5th ed)
These results clearly indicate that the recombinant FGF-1 is in a stable, folded and
in biologically active conformation.
Figure 22: A- The figure shows the emission spectra of FGF-1 in its native state (continuous
line) and in the denatured state(s) state (broken line). B- Thermal induced unfolding of FGF-
1 in the presence (closed circle) and absence (open circle) of SOS.
PhenylalanineTyrosineTryptophan

44
We also assessed the confirmation of the recombinant D2 domain using fluorescence
spectroscopy. The D2 domain contains three tryptophan residues located at positions 155,
190 and 213 in the full form of the primary sequence [93]. Therefore, measurement of the
intrinsic tryptophan fluorescence would serve as an excellent probe to monitor the tertiary
structural changes that occur in the protein under different conditions. The fluorescence
spectrum of D2 domain at ~ 338 nm in its native state suggests that the tryptophan
residues are buried in the interior of the well organized tertiary structure of the protein.
However, in the completely unfolded state D2 domain exhibits an emission spectrum
dominated by tryptophan fluorescence at ~ 350 nm [Fig. 23A]. The conformational
stability assessed by equilibrium thermal denaturation showed that the Tm (the
temperature at which 50% of the molecules are in the native state) of the protein
increases in the presence of the SOS by about ~ 5 °C (from ~ 48 to 53 °C) which suggests
that thermodynamic stability of the protein is enhanced upon binding to the SOS. These
results clearly indicate that the recombinant FGF-1 is in a stable, folded and in
biologically active conformation [Fig. 23B].

45
Figure 23: A- The figure shows the emission spectra of D2 domain of FGFR in its native
state (continuous line) and in the denatured state(s) state (broken line). B- Thermal induced
unfolding of D2 domain of FGFR in the presence (closed circle) and absence (open circle) of
SOS.

46
We have found the off column purification method to be efficient yielding 30 mg
and 24 mg per litre of FGF-1 and D2 domain respectively in the native biologically active
conformation compared to column affinity chromatography which yielded 32 mg and 20
mg per litre of FGF-1 and D2 domain respectively. It also does not involve the
disadvantages associated with conventional heparin/Ni-NTA sepharose column
chromatography [Table 1].
Table 1: Comparison of amberlite IRC 50 and column affinity chromatography
Implementation of this new protocol will in turn reduces the cost of commercially
available purified protein, when compared to pure protein obtained by conventional
method by eliminating the need for sophisticated instruments.

47
CONCLUSION
This is the first report in which amberlite cation exchange resin have been used for
purification of heparin binding proteins. We have successfully purified two heparin
binding proteins namely FGF-1 (from the soluble fraction) and the D2 domain of FGFR
(from the insoluble fraction) in a biologically active conformation using IRC resin and
thereby devised an efficient and economical method for the purification of this
biologically important class of proteins. The findings of the present study will facilitate
research towards understanding the regulation of heparin binding proteins mediated
biological activities and will also aid in the production of similar biological
macromolecules at a significantly reduced cost compared to conventional affinity column
chromatography for various biopharmaceuticals applications.

48
FUTURE STUDIES
Natural sources are often rare and expensive because of which most of the protein
biopharmaceuticals are produced recombinantly which results in higher cost of this
therapeutics. The development of biopharmaceuticals which are economical and in their
biologically active form is increasing day-by-day. Execution of this efficient and
inexpensive protocol for the purification of other heparin binding proteins or other class
of proteins having similar properties can result into isolation of proteins which are of high
importance to mankind. Fig. 24 represents the schematics of Off-Column purification.
Figure 24: Schematic representation of off-column purification

49
REFERENCES
1. Michigan State University Material
www.cem.msu.edu/~reusch/VirtTxtJml/proteins.htm
2. Dou, T.; Gu, S.; Liu, J.; Chen, F.; Zeng, L.; Guo, L.; Xie, Y.; Mao, Y. “Isolation and
characterization of ubiquitin-activating enzyme E1-domain containing 1, UBE1DC1”.
Mol Biol Rep. 2005; 32: 265-71.
3. Beato, M.; Chavez, S.; Truss, M. "Transcriptional regulation by steroid hormones".
Steroids. 1996; 61: 240–251. 4. Schroeder, H. W.; Cavacini, L. “Structure and functions of immunoglobulins”.
Journal of allergy and clinical immunology. 2010; 125: 41-52
5. Jalonen, J. “Oxygen transportation in the blood”. Ann Clin Res. 1981; 13: 39-43.
6. Fletcher, J. E. “On facilitated oxygen diffusion in muscle tissues”. Biophys J. 1980;
29: 437-58.
7. Faisal, F. B. “Protein purification using zeolite adsorbent” April 2009. Bachelor
Thesis. umpir.ump.edu.my/916/1/Farhani_Faisal.pdf
8. Mulok, F. S. A. M. “Protein Purification by using immobilized metal ion affinity
(IMA) adsorbent”. May2009.BachelorThesis.
umpir.ump.edu.my/871/1/Fidelia_Sawai_anak_Michael_Mulok.pdf
9. Protein crystallography.
www.proteincrystallography.org/protein/
10. Petsko, G. A. and Ringe, D. “Textbook of protein structure and function”. 2004. New
Science press, London.

50
11. Nelson, D. L.; Cox M. M.; Lehninger A. L. “Lehninger principles of biochemistry”.
2008. 5th edition. W.H. Freeman and Co. New York.
12. Protein synthesis: transcription and translation.
faculty.clintoncc.suny.edu/.../protein%20synthesis/protein.htm
13. Berg, J. M.; Tymoczko, J. L.; Stryer, L. “Textbook of biochemistry”. 5th edition 2002.
W. H. Freeman Inc.
14. Haspel, N.; Moll, M.; Baker, M. L.; Chiu, W.; Kavraki, L. E. “Tracing
conformational changes in proteins”. BMC structural biology. 2010; 10: 1.
15. Groban, E. S.; Narayanan, A.; Jacobson, M. P. “Conformational changes in protein
loops and helices induced by post-translational phosphorylation”. PLoS Comput Biol.
2006; 2: 32.
16. Parent, C. A.; Blacklock, B. J.; Froehlich, W. M.; Murphy, D. B.; Devreotes, P. N. “G
Protein Signaling Events Are Activated at the Leading Edge of Chemotactic Cells”.
Cell. 1998; 95: 81–91.
17. Britt, B. M. “Understanding Enzyme Structure and Function in Terms of the Shifting
Specificity Model”. J. Biochem. and Mol. Biol. 2004; 37: 394-401
18. Sigman, D. S.; Mooser, G. “Chemical Studies of Enzyme Active Sites”. Ann Rev
Biochem. 1975; 44: 889-931.
19. Utrecht university material. Vliet, P. C. V. “Roles of transcription factor in DNA
replication”. dnareplication.cshl.edu/content/free/chapters/03_van_der_vliet.pdf
20. Rini, J. M.; Schulze-Gahmen, U.; Wilson, I. A. “Structural evidence for induced fit
as a mechanism for antibody-antigen recognition”. Science. 1992; 255: 959-965.

51
21. Phizicky, E. M.; Fields, S. “Protein-Protein interactions: methods for detection and
analysis”. Microbiological reviews. 1995; 94-123.
22. Jones, S.; Thornton, J. M. “Principles of protein-protein interactions”. Proc. Natl.
Acad. Sci. USA. 1996; 93: 13-20
23. Purdue Material.
chemed.chem.purdue.edu/genchem/.../bp/.../synthesis9.html
24. Anfinsen, C. B.; Edsall, J. T.; Richards, F. M. “ Advances in protein chem. 1996; 38.
Academic press Inc.
25. Lahlil, R.; Calvo, F.; Khatib, A. M. “The Potential Anti-Tumorigenic and Anti-
Metastatic Side of the Proprotein Convertases Inhibitors”. Anti-Cancer Drug
Discovery. 2009; 4: 83-91.
26. Alouf, J. E.; Popoff, M. R. “Textbook of bacterial protein toxins”. 3rd edition 2006.
Elsevier Ltd.
27. Fink, A.L. “Chaperone-Mediated Protein Folding”. Physiol Rev. 1999; 79: 425-449.
28. Zheng,W.;Brooks,B.R.;Hummer,G.“Proteinconformationaltransitions
exploredbymixedelasticnetworkmodels”.Proteins.2007;69:43‐57.
29. Buxbaum, E. “Textbook of fundamentals of protein structure and function”. 2007.
New York: Springer.
30. Hammarstrom M. “Protein production and purification in structural genomics”. 2006.
kth.diva-portal.org/smash/get/diva2:14524/FULLTEXT01
31. Coloradostateuniversitymaterial.“Thestructureofproteins”.
www.vivo.colostate.edu/hbooks/genetics/.../prostruct.html
52
32. Campbell,M.K.;Farell,S.O.“Textbookofbiochemistry”.6thedition2009.
ThomsonBrooks/Cole.
33. Elmhurstcollegematerial.
www.elmhurst.edu/~chm/vchembook/567tertprotein.html
34. Fan, H.; Mark, A. E. “Relative Stability of Protein Structures Determined by X-ray
Crystallography or NMR Spectroscopy: A Molecular Dynamics Simulation Study”.
Proteins. 2003; 53: 111–120.
35. Sreerama, N.; Venyaminov, S. Y.; Woody, R. W. “Estimation of Protein Secondary
Structure from Circular Dichroism Spectra: Inclusion of Denatured Proteins with
Native Proteins in the Analysis”. Analytical Biochemistry. 2000; 287: 243–251.
36. Zheng, W. “Accurate flexible fitting of high-resolution protein structures into cryo-
electron microscopy maps using coarse-grained pseudo-energy minimization”.
Biophy. J. 2011; 100: 478–488.
37. Ford, B. J. “The Leeuwenhoek Legacy”. 1991. Biopress, Bristol, and Farrand Press,
London.
38. University of California Material
www.ucmp.berkeley.edu/history/leeuwenhoek.html
39. University of South Carolina Material
www.sc.edu/library/spcoll/nathist/jenner.html
40. Brig Klyce. www.panspermia.org/pasteur.htm
41. Dubos, R. J. “Louis Pasteur, free lance of science”. 1986. Da Capo Press Inc.

53
42. Juha Lemmetyinen. “Commercialization of Biopharmaceuticals”. Dec 2000. Master
thesis.
www.doria.fi/bitstream/handle/10024/34360/nbnfi-fe20011145.PDF?...1
43. Walsh, G. Textbook of “Biopharmaceuticals: Biochemistry and Biotechnology”. 2nd
edition 2003. John wiley and sons.
44. Ho, R. J. Y.; Gibaldi, M. “Biotechnology and Biopharmaceuticals: Transforming
proteins and genes into drugs”. 2003. John wiley and sons.
45. Johnson, I. S. “Human insulin from recombinant DNA technology”. Science 1983;
219: 632-637.
46. Ananyeva, N.; Khrenov, A.; Darr, F.; Summers, R.; Sarafanov, A.; Saenko, E.
“Treating haemophilia A with recombinant blood factors: a comparison.” Expert
Opin Pharmacother. 2004; 5: 1061-70.
47. Kowalski1, M.; Brown, G.; Bieniasz, M.; Oszajca, K.; Chabielska, E.; Pietras, T.;
Szemraj, Z.; Makandjou-Ola, E.; Bartkowiak, J.; Szemraj, J. “Cloning and expression
of a new recombinant thrombolytic and anthithrombotic agent — a staphylokinase
variant”. Acta Biochimica Polonica. 2008; 56: 41-53.
48. Szemraj,J.;Walkowiak,B.;Kawecka,I.;Janiszewska,G.;Buczko,W.;Bartkowiak,
J.;Chabielska,E.“Anewrecombinantthrombolyticandantithromboticagent
withhigherfibrinaffinity‐‐astaphylokinasevariant.I.Invitrostudy”.JThromb
Haemost.2005;3:2156‐65.
49. Grosh, W. W.; Quesenberry, P. J. “Recombinant human hematopoietic growth factors
in the treatment of cytopenias”. Clin Immunol Immunopathol. 1992; 62: 25-38.

54
50. Herrmann, F.; Mertelsmann, R.; Lindemann, A.; Ottmann, O. G.; Seipelt, G.; Oster,
W.; Hoelzer, D.; Ganser, A. “Clinical use of recombinant human hematopoietic
growth factors (GM-CSF, IL-3, EPO) in patients with myelodysplastic syndrome”.
Biotechnol Ther. 1991; 2: 299-311.
51. Quesada, J. R.; Alexanian, R.; Kurzrock, R.; Barlogie, B.; Saks, S.; Gutterman, J. U.
“Recombinant interferon gamma in hairy cell leukemia, multiple myeloma, and
Waldenstrom's macroglobulinemia”. Am J Hematol. 1988; 29: 1-4.
52. Weinstock-Guttman, B.; Ransohoff, R. M.; Kinkel, R. P.; Dr. Rudick, R. A. “The
interferons: Biological effects, mechanisms of action, and use in multiple sclerosis”.
Annals of neurology. 2008; 37: 7-15.
53. Robson, M. C.; Mustoe, T. A.; Hunt, T.K. “The future of recombinant growth factors
in wound healing”. American journal of surgery. 1998; 176; 80S-82S.
54. Olofsson, A. M.; Vestberg, M.; Herwald, H.; Rygaard, J.; David, G.; Arfors, K. E.;
Linde, V.; Flodgaard, H.; Dedio, J.; Müller-Esterl, W.; Lundgren-Åkerlund, E.
“Heparin-binding protein targeted to mitochondrial compartments protects
endothelial cells from apoptosis”. J. Clin. Invest. 1999; 104: 885-894
55. Rajalingam, D.; Kacer, D.; Prudovsky, I.; Kumar, T. K. “Molecular cloning,
overexpression and characterization of human interleukin 1alpha”. Biochem Biophys
Res Commun. 2007; 360: 604-8.
56. Wingfield, P. T.; Graber, P.; Buell, G.; Rose, K.; Simona, M. G.; Burleigh, B. D.
“Purification and characterization of bovine growth hormone produced in
recombinant Escherichia coli”. Biochem J. 1987; 243: 829-39.

55
57. Crommelin, D. J. A.; Storm, G.; Verrijk, R.; Leede, L.; Jiskoot, W. Hennink, W. E.
“Shifting paradigms: biopharmaceuticals versus low molecular weight drugs”. Int. J.
Pharm. 2006; 266: 3.
58. BIO. 2007. Biotechnology Industry Organization. www.bio.org.
59. BriskFox Financial. "Biopharmaceutical sector sees rising R&D despite credit crunch
finds analysis". 2009.
http://www.briskfox.com/open/years/2009_q1/do_v_c44751.php.
60. Luke Foster. "Patenting in the Biopharmaceutical Industry—comparing the US with
Europe". 2006.
http://web.archive.org/web/20060316164416/http://scientific.thomson.com/free/ipmat
ters/pii/8180019/.
61. Nagaoka, M.; Jiang, H. L.; Hoshiba, T.; Akaike, T.; Cho, C.S. “Application of
recombinant fusion proteins for tissue engineering”. Ann Biomed Eng. 2010; 68: 683.
62. Raman, R.; Venkataraman, G.; Ernst, S.; Sasisekharan, V.; Sasisekharan, R. “Structural
specificity of heparin binding in the fibroblast growth factor family of proteins”. Proc.
Nati. Acad. Sci. 2003; 100: 2357.
63. Williams, K. F.; Chu, C. L.; Fannon, M.; Thomas, J. A.B.; Nugent, M. A. “Control of
Growth Factor Networks by Heparan Sulfate Proteoglycans”. Ann Biomed Eng. 2008;
36: 2134.
64. Zakrzewska, M.; Marcinkowska, E.; Wiedlocha, A. “FGF-1: from biology through
engineering to potential medical applications”. Crit Rev Clin Lab Sci. 45 (2008) 91.

56
65. Wei, W.; Liu, Q.; Tan, Y.; Liu, L.; Li X.; Cai, L. “Oxidative stress, diabetes, and diabetic
complications”. Hemoglobin. 2009; 33: 370.
66. Barrientos, S.; Stojadinovic, O.; Golinko, M.S.; Brem, H.; Tomic-Canic, M. “Growth
factors and cytokines in wound healing”. Wound Repair Regen. 2008; 16: 585.
67. Kumar, V.; Hassan, M. D. I.; Tomah, A. K.; Kashav, T.; Nautiyal, J.; Singh, S.; Singh T.
P.; Yadav, S. “Proteomic analysis of heparin-binding proteins from human seminal
plasma: a step towards identification of molecular markers of male fertility”. J. Biosci.
2009; 34: 899.
68. Sharma, P.; Rajalingam, D.; Kumar T. K.; Singh, S. “A light scattering study of the
interaction of fibroblast growth factor (FGF) with its receptor” Biophys J. 2008; 94: 71.
69. Xie, B.; Tassi, E.; Swift, M.R.; McDonnell,K.; Bowden, E.T.; Wang, S.;Ueda, Y.;
Tomita, Y.; Riegel, A.T; and Wellstein, A. “Identification of the Fibroblast Growth
Factor (FGF)-interacting Domain in a Secreted FGF-binding Protein by Phage Display”.
J Biol Chem. 2006; 281: 1137.
70. Armelin H. A. "Pituitary extracts and steroid hormones in the control of 3T3 cell
growth". Proc. Natl. Acad. Sci. U.S.A. 1973; 70: 2702–6.
71. Gospodarowicz D. "Localisation of a fibroblast growth factor and its effect alone and
with hydrocortisone on 3T3 cell growth". Nature. 1974; 249: 123–7.
72. Arese, M.; Chen, Y. "Nuclear activities of basic fibroblast growth factor: potentiation
of low-serum growth mediated by natural or chimeric nuclear localization signals".
Mol. Biol. Cell. 1999; 10: 1429–44.
73. Biotech/Biomedical Material
biotech.about.com/od/protocols/a/ProteinPurify.htm

57
74. Janson, J.; Ryden, L. “Textbook of Protein Purification”. 1997. 2nd edition. John
wiley & sons.
75. Bhatia, S. C. “Textbook of biotechnology”. 2005. Atlantic publishers and distributors.
76. Cornell Material. www-users.med.cornell.edu/.../proteins_&_purification.html
77. Nilsson, J.; Stahl, S.; Lundeberg, J.; Uhlen, M.; Nygren, P. “Affinity Fusion
Strategies for Detection, Purification, and Immobilization of Recombinant Proteins”.
Protein expression and purification. 1997; 11: 1–16.
78. Scopes, R. K. “Protein purification: principles and practice”. 3rd edition 1994.
Springer Science and Business Media, LLC.
79. Frokjaer, S.; Otzen, D. E. “Protein drug stability: a formulation challenge”. Nat. Rev.
2003; 4: 298.
80. Krishnamurthy, R.; Manning, M. C. “The stability factor: importance in formulation
development”. Curr. Pharm. Biotechnol. 2002; 3: 361.
81. Hermeling, S.; Crommelin, D. J. A.; Schellekens, H.; Jiskoot, W. “Structure–
immunogenicity relationships of therapeutic proteins”. Pharm. Res. 2004; 21: 897.
82. Yamamoto, S.; Nakanishi, K.; Matsuno, R. “Textbook of Ion exchange
chromatography of proteins”. 1988. Marcel Dekker Inc. New York.
83. Sivasankar, B. “Textbook of Bioseperations: principles and techniques”. 2005.
Prentice-Hall of India. New Delhi.
84. Dillon, P. J.; Rosen, C. A. “A rapid method for the construction of synthetic genes
using the polymerase chain reaction. Biotechniques. 1990; 9: 298.

58
85. Welch, M.; Govindarajan, S.; Ness, J. E.; Villalobos, A.; Gurney, A.; Minshull, A.;
Gustafsson, C. “Design parameters to control synthetic gene expression in
Escherichia coli”. PLosOne. 2009; 4: 7002.
86. Gill, S. C.; Hippel, P. H. V. “Calculation of protein extinction coefficients from
amino acid sequence data”. Anal. Biochem. 1989; 182: 319.
87. Sekhon, B. S. “Biopharmaceutical an overview”. Thai. J. Pharm. Sci. 2010; 34: 1-19.
88. Bennion, B. J.; Dagett, V. “The molecular basis for the chemical denaturation of
proteins by urea”. PNAS. 2003; 100: 5142-5147
89. Loo, B. M.; Salmivirta, M. “Heparin/Heparan sulfate domains in binding and
signaling of fibroblast growth factor 8b”. J Biol Chem. 2002; 277: 32616.
90. McKeehan, W. L.; Wu, X.; Kan, M. “Requirement for anticoagulant heparan sulfate
in the fibroblast growth factor receptor complex”. J Biol Chem. 1999; 274: 21511.
91. Li, X.; Tu, C.; Peng, H.; Yuan, s.; Wu, F. “High-level expression of human acidic
fibroblast growth factor in E. coli and its purification”. Hua Xi Yi Ke Da Xue Xue
Bao. 1999; 30: 249.
92. Gasparian, M. E.; Elistratov, P. A.; Drize, N. I.; Nifontova, I. N.; Dolgikh, D. A.;
Kirpichnikov, M. P.; “Overexpression in Escherichia coli and purification of human
fibroblast growth factor (FGF-2)”. Biochem. (Mosc). 2009; 74: 221.
93. Hung, K. W.; Kumar, T. K. S.; Chi, Y. H.; Chiu, I. M.; Yu, C. “Molecular
overexpression and characterization of the ligand-binding D2 domain of fibroblast
growth factor receptor”. Biochem and Biophy Res Comm.2004; 317: 253.

59
94. Ryu, E. K.; Cho, K. J.; Kim, J. K.; Harmer, N. J.; Blundell, T. L.; Kim, K. H.
“Expression and purification of recombinant human fibroblast growth factor receptor
in Escherichia coli”. Protein Expression and Purification. 2006; 49: 15.
95. Loo, B. M.; Kreuger, J.; Jalkanen, M.; Lindhal, U.; Salmivitra, M. “Binding of
Heparin/Heparin sulfate to fibroblast growth factor receptor 4”. J Biol Chem. 2001;
276: 16868.
96. Jutisz, M.; Theoleyre, M.; Colonge, A.; Courrier, R. “Purification of human urinary
gonadotropin (HMG) of the menopause by amberlite IRC-50 and
diethylaminocellulose chromatography”. C R Hebd Seances Acad Sci. 1963; 257:
991-5.
97. González-Cadavid, N. F.; Campbell, P. N. “Subcellular distribution of cytochrome c
in rat liver. Methods for its extraction and purification”. Biochem J. 1967; 105: 427-
42.
98. Troitskiĭ, A. V.; Lysenko, A. M. “Purification, heterogeneity and some properties of
T2 bacteriophage lysozyme”. Biokhimiia. 1975; 40: 1282-91.
99. Etherington, D. J. “Bovine spleen cathepsin B1 and collagenolytic cathepsin. A
comparative study of the properties of the two enzymes in the degradation of native
collagen”. Biochem J. 1976; 153: 199-209.
100. Giglio, J. R.; Rossi, A.; Leone, F. A.; Chiericeto, G.; Say, J. C. “Isolation and
characterization of an active three-chain molecular species of bovine thrombin”.
Biochem J. 1976; 159: 29-33.

60
101. Oda, K.; Koyama, T.; Murao, S. “Purification and properties of a proteinaceous
metallo-proteinase inhibitor from Streptomyces nigrescens TK-23”. Biochim Biophys
Acta. 1979; 571: 147-56.
102. Hayashi, Y.; Miwa, S.; Lee, K.; Koshimura, K.; Kamel, A.; Hamahata, K.;
Fujiwara, M. “A nonisotopic method for determination of the in vivo activities of
tyrosine hydroxylase in the rat adrenal gland”. Anal Biochem. 1988; 168: 176-83.
103. Mozersky, M. S.; Straatsma, B. R.; Steffy, J. M.; McFarlin, A. “Purification of
Hyaluronidase from Bovine Testes”. Arch Ophthalmol. 1961; 66: 534-538.
104. Morrison, M.; Hamilton, H. B.; Stotz, E. “The isolation and purification of
lactoperoxidase by ion exchange chromatography”. J Biol Chem. 1957; 228: 767-76.
105. Yokoyama, S.; Obayashi, A.; Tanabe, O.; Ichishima, E. “Submerged Production,
Purification, and Crystallization of Acid Carboxypeptidase from Penicillium
janthinellum”. Applied Microbiology.1974; 28: 742-747.
106. Richter, J. W.; Ayer, D. E.; Bazemore, A. W.; Brink, N. G.; Folkers, K. “Pituitary
Hormones. V. The Purification of Corticotropin-B by Ion-exchange Techniques”. J.
Am. Chem. Soc. 1953; 75: 1952–1955.
107. Boardman, N. K.; Partridge, S. M. “Separation of neutral proteins on ion-
exchange resins”. Biochem J. 1955 Apr; 59(4):543-52.
108. Andrade, S. O.; Silva, M. R. “Purification of bradykinin by ion-exchange
chromatography”. Biochem J. 1956; 64: 701-5.
109. Rajalingam, D.; Kathir, K. M.; Ananthamurthy, K.; Adams, P. D.; Kumar, T. K.
“A method for the prevention of thrombin-induced degradation of recombinant
proteins”. Anal Biochem. 2008; 375: 361.

61
110. Rajalingam, D.; Kumar, T. K.; Soldi, R.; Graziani, I.; Prudovsky, I.; Yu, C.
“Molecular mechanism of inhibition of nonclassical FGF-1 export”. Biochemistry.
2005; 44: 15472.