Embed Size (px)
DESCRIPTION
Innovation.bg report
Citation preview
INN
OVATIO
N.B
G 2010 ��
��������
Innovation��������������������WWW.ARCFUND.NET
Applied Research and Communications Fund
5 Alexander Zhendov Street, Sofia 1113
tel.: +359 (2) 973 3000 fax: +359 (2) 973 3588
www.arcfund.net
APPLIED RESEARCH AND COMMUNICATIONS FUND
Innovation Product
Entrepreneurship
Investment and Financing
Human Capital
Information and Communication Technologies
innovation the knowledge economy
■ policies and strategies
■ research and analyses
■ public-private partnerships
■ European Innovation Centre – BulgariaEnterprise Europe Network,
■ ARC Consulting EOOD
Innovation.bgBulgarian Innovation Policy: Options for the Next Decade
EDITORS
Professor Marin Petrov, Chairman, Expert Council on Innovation, Applied Research and Communications FundProfessor Teodora Georgieva, Senior Research Fellow, Applied Research and Communications FundRuslan Stefanov, Coordinator, Innovation.bg Group, Applied Research and Communications Fund
WORKING GROUP INNOVATION.BG
Dr. Todor Galev, Senior Fellow, Applied Research and Communications FundDr. Fani Koleva, University of National and World EconomyAngel Milev, Program Director, Applied Research and Communications FundDaniela Mineva, Research Fellow, Economic Program, Center for the Study of DemocracyDr. Miglena Molhova, University of National and World EconomyLora Pavlova, Senior Expert, Research Directorate, Ministry of Education, Youth and ScienceProfessor Kostadinka Simeonova, Chair of the Academic Council, Center for Science Studies and History of Science, Bulgarian Academy of SciencesProfessor Milanka Slavova, Deputy Dean on Research, Department of International Economics and Politics, University of National and World EconomyDaniela Tchonkova, Program Coordinator, Applied Research and Communications FundTodor Yalamov, Coordinator, IT Group, Applied Research and Communications Fund
EXPERT COUNCIL ON INNOVATION AT THE APPLIED RESEARCH AND COMMUNICATIONS FUND
Professor Marin Petrov, Chairman, Expert Council on Innovation, Applied Research and Communications FundProfessor Bistra Boeva, University of National and World EconomyBoyko Denchev, Federation of the Scientific and Technical Unions in BulgariaProfessor Ivan Georgiev, University of National and World EconomyProfessor Teodora Georgieva, Senior Research Fellow, Applied Research and Communications FundMario Hristov, Secretary General, Union of Inventors in BulgariaDr. Nikola Kolev, Scientific Secretary, Agricultural AcademyProfessor Tsvetan Manchev, Sofia University, Member of the Commission for Public Oversight of Statutory AuditorsYulian Nikolov, Director, Economic Policy Directorate, Ministry of Economy, Energy and TourismDr. Liliana Pavlova, Center for Science Studies and History of Science, Bulgarian Academy of SciencesLora Pavlova, Senior Expert, Research Directorate, Transnational Program Initiatives Department, Ministry of Education, Youth and SciencePetar Petrov, Manager, Point-L Ltd.Professor Georgi Popov, Technical University of SofiaProfessor Kostadinka Simeonova, Chair of the Academic Council, Center for Science Studies and History of Science, Bulgarian Academy of SciencesDr. Ventsislav Slavkov, Chairman, Mechatronics and Automatisation Cluster Professor Milanka Slavova, Deputy Dean on Research, Department of International Economics and Politics, University of National and World EconomyHristo Traikov, Laboratory of Telematics, Bulgarian Academy of SciencesOgnian Trajanov, President, TechnoLogica Ltd.Dr. Benislav Vanev, Deputy Chairman, Automatics and Informatics Union
ISSN: 1313-1060
cubn;a; Creative Commons Licence Attribution-Noncommercial-Share Alike 2.5Applied Research and Communications Fund 2010Some rights reserved.
������������������������������������������
CENTRE FOR INNOVATIONSOF THE BULGARIAN ACADEMY OF SCIENCES
I N N OVAT I O N . B G 3
CONTENTS
Executive summary . . . . . . . . . . . . . . . . . . . . . . . . . . . . . . . . . . . . . . . . . . . . . . . . . . . . . . . . . . . . . . . . . . . . . . . . . . . . . . . . 7
Introduction . . . . . . . . . . . . . . . . . . . . . . . . . . . . . . . . . . . . . . . . . . . . . . . . . . . . . . . . . . . . . . . . . . . . . . . . . . . . . . . . . . . . 13
Gross innovation product . . . . . . . . . . . . . . . . . . . . . . . . . . . . . . . . . . . . . . . . . . . . . . . . . . . . . . . . . . . . . . . . . . . . . . . . . . 15
Innovation product . . . . . . . . . . . . . . . . . . . . . . . . . . . . . . . . . . . . . . . . . . . . . . . . . . . . . . . . . . . . . . . . . . . . . . . . . . . . . 16
Technological product . . . . . . . . . . . . . . . . . . . . . . . . . . . . . . . . . . . . . . . . . . . . . . . . . . . . . . . . . . . . . . . . . . . . . . . . . . 24
Research product . . . . . . . . . . . . . . . . . . . . . . . . . . . . . . . . . . . . . . . . . . . . . . . . . . . . . . . . . . . . . . . . . . . . . . . . . . . . . . 27
Entrepreneurship . . . . . . . . . . . . . . . . . . . . . . . . . . . . . . . . . . . . . . . . . . . . . . . . . . . . . . . . . . . . . . . . . . . . . . . . . . . . . . . . 33
Science and entrepreneurship in Europe . . . . . . . . . . . . . . . . . . . . . . . . . . . . . . . . . . . . . . . . . . . . . . . . . . . . . . . . . . . . 35
Entrepreneurship environment in Bulgaria . . . . . . . . . . . . . . . . . . . . . . . . . . . . . . . . . . . . . . . . . . . . . . . . . . . . . . . . . . 36
Investment and financing of innovation . . . . . . . . . . . . . . . . . . . . . . . . . . . . . . . . . . . . . . . . . . . . . . . . . . . . . . . . . . . . . . 41
Public financing of science and innovation . . . . . . . . . . . . . . . . . . . . . . . . . . . . . . . . . . . . . . . . . . . . . . . . . . . . . . . . . . 42
Bulgaria in the European Research Area . . . . . . . . . . . . . . . . . . . . . . . . . . . . . . . . . . . . . . . . . . . . . . . . . . . . . . . . . . . . 45
National funds and programs for R&D and innovation financing . . . . . . . . . . . . . . . . . . . . . . . . . . . . . . . . . . . . . . . . 49
Human capital for innovation . . . . . . . . . . . . . . . . . . . . . . . . . . . . . . . . . . . . . . . . . . . . . . . . . . . . . . . . . . . . . . . . . . . . . . . 53
Academic career, employment in R&D and high-tech sectors . . . . . . . . . . . . . . . . . . . . . . . . . . . . . . . . . . . . . . . . . . . . 55
Education level, quality of the education product, and lifelong learning . . . . . . . . . . . . . . . . . . . . . . . . . . . . . . . . . . 63
Information and communication technologies . . . . . . . . . . . . . . . . . . . . . . . . . . . . . . . . . . . . . . . . . . . . . . . . . . . . . . . . . 67
The information and communication technologies sector . . . . . . . . . . . . . . . . . . . . . . . . . . . . . . . . . . . . . . . . . . . . . . 68
Diffusion of information and communication technologies . . . . . . . . . . . . . . . . . . . . . . . . . . . . . . . . . . . . . . . . . . . . . 71
Impact of information and communication technologies on innovation . . . . . . . . . . . . . . . . . . . . . . . . . . . . . . . . . . . 72
Bulgarian innovation policy: options for the next decade . . . . . . . . . . . . . . . . . . . . . . . . . . . . . . . . . . . . . . . . . . . . . . . . . 75
European initiatives in support of innovation . . . . . . . . . . . . . . . . . . . . . . . . . . . . . . . . . . . . . . . . . . . . . . . . . . . . . . . . 75
European innovation policy prospects . . . . . . . . . . . . . . . . . . . . . . . . . . . . . . . . . . . . . . . . . . . . . . . . . . . . . . . . . . . . . . 77
Bulgaria’s innovation policy as EU member . . . . . . . . . . . . . . . . . . . . . . . . . . . . . . . . . . . . . . . . . . . . . . . . . . . . . . . . . . 77
Recommendations for the establishment of a working national innovation system . . . . . . . . . . . . . . . . . . . . . . . . . . 78
Appendix: Methodological notes, sources of information and definitions . . . . . . . . . . . . . . . . . . . . . . . . . . . . . . . . . . . . 83
Literature . . . . . . . . . . . . . . . . . . . . . . . . . . . . . . . . . . . . . . . . . . . . . . . . . . . . . . . . . . . . . . . . . . . . . . . . . . . . . . . . . . . . . . 89

4
LIST OF ABBREVIATIONS
AA – Agricultural Academy ADSL – Asymmetric Digital Subscriber LineAES – Adult Education SurveyARC Fund – Applied Research and Communications FundBAS – Bulgarian Academy of SciencesBPO – Bulgarian Patent Office BSMEPA – Bulgarian Small and Medium Enterprises Promotion AgencyBTC – Bulgarian Telecommunications Company COST – European Cooperation in Science and TechnologyCR – Commercial RegistryCRM – Customer Relationship ManagementDSL – Digital Subscriber LineEB – EurobarometerEC – European CommissionEEA – European Economic AreaEIIT – European Institute of Innovation and TechnologyERDF – European Regional Development FundERP – Enterprise Resource PlanningEU – European UnionFOSS – Free/Open Source SoftwareFP – Framework program FP CIP – Framework program ”Competitiveness and Innovation”FTE – Full Time EmploymentGDP – Gross Domestic ProductICT – Information and Communication Technologies INA – Survey of Innovation Activity of Bulgarian Business conducted by the Applied Research and Communications FundIP – Intellectual Property IT – Information Technologies LAN – Local Area NetworkMC – Multinational companyMEET – Ministry of Economy, Energy and Tourism MESY – Ministry of Education Science and Youth MID – Mathematics and Informatics Department NACE – National Classification of Economic Activities NGO – Non-governmental organizationNIF – National Innovation FundNSF – National Science Fund NSI – National Statistical Institute OECD – Organisation for Economic Cooperation and Development OP – Operational ProgramOPHRD – Operational Program Human Resources DevelopmentR&D – Research and Development SAITC – State Agency for Information Technologies and Communications
SCI – Science Citation IndexSITC – Standard International Trade ClassificationSMEs – Small and Medium-Sized Enterprises SMS – Short Message ServiceSU – Sofia University UCTM – University of Chemical Technology and MetallurgyUNDP – United Nations Development ProgramUSA – United States of AmericaVAT – Value Added Tax
I N N OVAT I O N . B G 5
INDEX OF TABLES
TABLE 1 Innovative clusters . . . . . . . . . . . . . . . . . . . . . . . . . . . . . . . . . . . . . . . . . . . . . . . . . . . . . . . . . . . . . . . . . . . . 18
TABLE 2 R&D Expenditures of Bulgarian enterprises, by type . . . . . . . . . . . . . . . . . . . . . . . . . . . . . . . . . . . . . . . . . 21
TABLE 3 Applications submitted to the Bulgarian Patent Office and protection
documents granted for inventions . . . . . . . . . . . . . . . . . . . . . . . . . . . . . . . . . . . . . . . . . . . . . . . . . . . . . . . . 24
TABLE 4 Share of articles by Bulgarian scientists in co-authorship
with foreign scientists (1996 – 2007) . . . . . . . . . . . . . . . . . . . . . . . . . . . . . . . . . . . . . . . . . . . . . . . . . . . . . . 28
TABLE 5 Increase of the total number of publications in SCI referenced journals for some countries
with over 9,000 publications in 2004 – 2008 as compared to 1999 – 2003, % . . . . . . . . . . . . . . . . . . . . . 28
TABLE 6 Significance of the different scientific fields for industry development . . . . . . . . . . . . . . . . . . . . . . . . . . . 30
TABLE 7 University spin-off firms (selected countries) . . . . . . . . . . . . . . . . . . . . . . . . . . . . . . . . . . . . . . . . . . . . . . . 35
TABLE 8 Indicators for assessment of the activity of the National Innovation Fund . . . . . . . . . . . . . . . . . . . . . . . . 50
TABLE 9 Sector leaders in exports, mln of euro . . . . . . . . . . . . . . . . . . . . . . . . . . . . . . . . . . . . . . . . . . . . . . . . . . . . 69
TABLE 10 Selected R&D indicators in the ICT sector . . . . . . . . . . . . . . . . . . . . . . . . . . . . . . . . . . . . . . . . . . . . . . . . . . 69
TABLE 11 Information about the telephone interviews in INA-4 . . . . . . . . . . . . . . . . . . . . . . . . . . . . . . . . . . . . . . . . 84
TABLE 12 Characteristics of the enterprises surveyed in INA-4 . . . . . . . . . . . . . . . . . . . . . . . . . . . . . . . . . . . . . . . . . . 85
INDEX OF FIGURES
FIGURE 1 Innovation activity of enterprises in Bulgaria . . . . . . . . . . . . . . . . . . . . . . . . . . . . . . . . . . . . . . . . . . . . . . . 17
FIGURE 2 Degree of enterprise innovativeness by size (2008 and 2009) . . . . . . . . . . . . . . . . . . . . . . . . . . . . . . . . . . 18
FIGURE 3 Structure of Bulgarian enterprises by innovation type . . . . . . . . . . . . . . . . . . . . . . . . . . . . . . . . . . . . . . . . 19
FIGURE 4 Innovation index of Bulgarian enterprises and leading innovations in Bulgaria . . . . . . . . . . . . . . . . . . . . 20
FIGURE 5 Enterprises engaged in international cooperation in support of innovation, % . . . . . . . . . . . . . . . . . . . . 21
FIGURE 6 Policy areas that have had a positive effect on innovation in enterprises, % . . . . . . . . . . . . . . . . . . . . . . 22
FIGURE 7 Enterprise reactions to the economic downturn, % . . . . . . . . . . . . . . . . . . . . . . . . . . . . . . . . . . . . . . . . . . 23
FIGURE 8 Licensed inventions for the period 2000 – 2009 on the territory of Bulgaria . . . . . . . . . . . . . . . . . . . . . . 25
FIGURE 9 License types . . . . . . . . . . . . . . . . . . . . . . . . . . . . . . . . . . . . . . . . . . . . . . . . . . . . . . . . . . . . . . . . . . . . . . . . 26
FIGURE 10 Technological areas of inventions licensing for 2000 – 2009 . . . . . . . . . . . . . . . . . . . . . . . . . . . . . . . . . . . 26
FIGURE 11 Number of scientific publications by Bulgarian authors in SCI referenced journals . . . . . . . . . . . . . . . . . . 27
FIGURE 12 Total number of cited documents by Bulgarian authors by year . . . . . . . . . . . . . . . . . . . . . . . . . . . . . . . . 28
FIGURE 13 Increase of the number of Bulgarian scientific articles by fields and total in SCI referenced journals
for the period 2004 – 2008 as compared to 1999 – 2003, % . . . . . . . . . . . . . . . . . . . . . . . . . . . . . . . . . . . 29
FIGURE 14 Ranking of the first ten scientific fields in Bulgaria according to the share of referenced articles
in them as compared to all Bulgarian publications (1998 – 2008) . . . . . . . . . . . . . . . . . . . . . . . . . . . . . . . 29
FIGURE 15 Distribution of the most highly cited articles from Bulgaria by scientific field . . . . . . . . . . . . . . . . . . . . . . 30
FIGURE 16 Structure of legal entities (1996 – 2008) . . . . . . . . . . . . . . . . . . . . . . . . . . . . . . . . . . . . . . . . . . . . . . . . . . . 36
FIGURE 17 Number of newly-registered and re-registered legal entities in the Central Commercial Register . . . . . . 37
FIGURE 18 Type of ownership of companies first entered in the Central Commercial Register . . . . . . . . . . . . . . . . . 38
FIGURE 19 Factors affecting entrepreneurial activity in Bulgaria . . . . . . . . . . . . . . . . . . . . . . . . . . . . . . . . . . . . . . . . . 39
FIGURE 20 R&D expenditures in Bulgaria . . . . . . . . . . . . . . . . . . . . . . . . . . . . . . . . . . . . . . . . . . . . . . . . . . . . . . . . . . . 42
FIGURE 21 R&D intensity in EU-27, % . . . . . . . . . . . . . . . . . . . . . . . . . . . . . . . . . . . . . . . . . . . . . . . . . . . . . . . . . . . . . . 42
FIGURE 22 R&D intensity in Bulgaria, % . . . . . . . . . . . . . . . . . . . . . . . . . . . . . . . . . . . . . . . . . . . . . . . . . . . . . . . . . . . . 43
6
FIGURE 23 R&D expenditures by field of science, thousands of levs . . . . . . . . . . . . . . . . . . . . . . . . . . . . . . . . . . . . . . 43
FIGURE 24 R&D expenditures by field of science and sector, thousands of levs . . . . . . . . . . . . . . . . . . . . . . . . . . . . . 44
FIGURE 25 Average R&D expenditures per person, thousand of levs per year/FTE equivalent . . . . . . . . . . . . . . . . . 44
FIGURE 26 Bulgarian Participation in FP7 by applicant organization . . . . . . . . . . . . . . . . . . . . . . . . . . . . . . . . . . . . . . 45
FIGURE 27 Distribution of Bulgarian FP7 participation by type of instrument . . . . . . . . . . . . . . . . . . . . . . . . . . . . . . . 46
FIGURE 28 Project funding by priority area . . . . . . . . . . . . . . . . . . . . . . . . . . . . . . . . . . . . . . . . . . . . . . . . . . . . . . . . . . 46
FIGURE 29 Participation of Bulgaria’s regions in FP6 and FP7 . . . . . . . . . . . . . . . . . . . . . . . . . . . . . . . . . . . . . . . . . . . 47
FIGURE 30 Budget of the National Science Fund, levs . . . . . . . . . . . . . . . . . . . . . . . . . . . . . . . . . . . . . . . . . . . . . . . . . 49
FIGURE 31 R&D Personnel, % of workforce, in FTE equivalent, 2008 . . . . . . . . . . . . . . . . . . . . . . . . . . . . . . . . . . . . . 55
FIGURE 32 R&D personnel (total and researchers) in Bulgaria in FTE equivalent . . . . . . . . . . . . . . . . . . . . . . . . . . . . 55
FIGURE 33 R&D personnel by sector in FTE equivalent, Bulgaria . . . . . . . . . . . . . . . . . . . . . . . . . . . . . . . . . . . . . . . . . 56
FIGURE 34 Persons engaged in R&D, % of workforce in the 25-64 age group, 2008 . . . . . . . . . . . . . . . . . . . . . . . . . 56
FIGURE 35 Persons engaged in R&D in Bulgaria, by age group, thousands . . . . . . . . . . . . . . . . . . . . . . . . . . . . . . . . . 57
FIGURE 36 Number of higher-education and doctoral degrees awarded, by field of science, 2008 . . . . . . . . . . . . . . 62
FIGURE 37 Doctoral graduates: increase on an annual basis and share out of total number of doctoral
students in the period 2002 – 2008, % . . . . . . . . . . . . . . . . . . . . . . . . . . . . . . . . . . . . . . . . . . . . . . . . . . . . 63
FIGURE 38 Number of newly enrolled students – Bulgarian citizens, by form of education . . . . . . . . . . . . . . . . . . . . 64
FIGURE 39 Higher education graduates in science-and-technology fields, % of all students . . . . . . . . . . . . . . . . . . . . 64
FIGURE 40 Participation in continuing education, % . . . . . . . . . . . . . . . . . . . . . . . . . . . . . . . . . . . . . . . . . . . . . . . . . . . 65
FIGURE 41 Dynamics of company number by ICT sub-sections . . . . . . . . . . . . . . . . . . . . . . . . . . . . . . . . . . . . . . . . . . 68
FIGURE 42 Use of ICT in and by enterprises in Bulgaria . . . . . . . . . . . . . . . . . . . . . . . . . . . . . . . . . . . . . . . . . . . . . . . . 71
FIGURE 43 Share of ICT-based innovations compared to the total number, by sector . . . . . . . . . . . . . . . . . . . . . . . . 73
INDEX OF BOXES
BOX 1 Significance of new technological solutions in bidding for public procurement contracts . . . . . . . . . . . . 22
BOX 2 Recommendations for an innovation and entrepreneurship promotion policy . . . . . . . . . . . . . . . . . . . . . 39
BOX 3 Best practices in EU Structural Funds absorption . . . . . . . . . . . . . . . . . . . . . . . . . . . . . . . . . . . . . . . . . . . . 49
BOX 4 New financial schemes of the National Science Fund . . . . . . . . . . . . . . . . . . . . . . . . . . . . . . . . . . . . . . . . . 50
BOX 5 Human resources in science and technology: Agricultural Academy . . . . . . . . . . . . . . . . . . . . . . . . . . . . . 58
BOX 6 Human resources in science and technology: Bulgarian Academy of Sciences . . . . . . . . . . . . . . . . . . . . . . 59
BOX 7 ICT and innovation diffusion . . . . . . . . . . . . . . . . . . . . . . . . . . . . . . . . . . . . . . . . . . . . . . . . . . . . . . . . . . . . 73
BOX 8 Components of the Innovation Index of Bulgarian Enterprises . . . . . . . . . . . . . . . . . . . . . . . . . . . . . . . . . 86
7I N N OVAT I O N . B G
EXECUTIVE SUMMARY
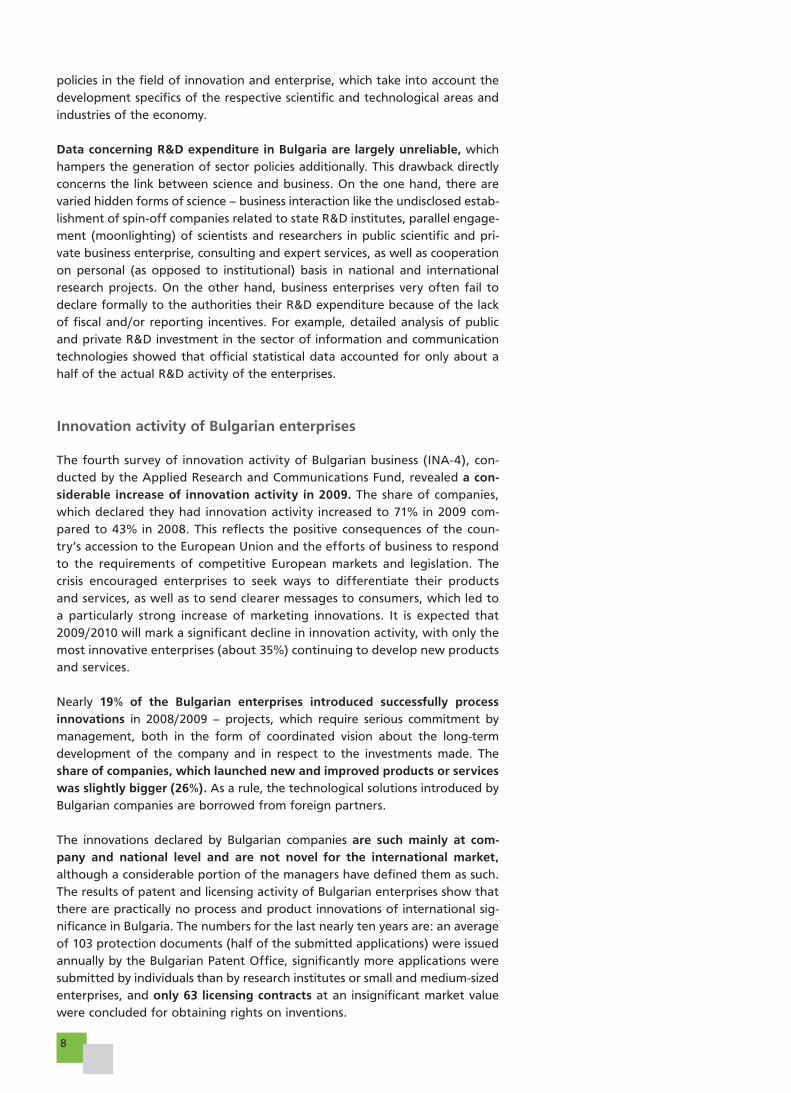
The innovation activity of Bulgarian businesses experienced the impact of the
economic crisis through the fall of public and private R&D funding, as well as
through the deterioration of the overall business and innovation environment
(higher risk aversion, personnel reductions, consumer markets stagnation, etc.).
The long delayed reforms in science and education, the lack of systematic and
institutional interaction between them and the business sector (e.g. transfers
of new technological solutions are sporadic), as well as the inefficient manage-
ment and utilization of European funds allotted for economic modernization
additionally exacerbated the problems caused by the crisis.
Entrepreneurship
The number of active businesses in Bulgaria totaled some 110,000 in 2009, of
which between 10,000 and 15,000 enterprises employed more than 10 staff
and only between 1,000 and 2,500 – more than 50. It is precisely among these
one hundred thousand enterprises where the entrepreneurs who launch inno-
vative activity through a start-up or engage in corporate entrepreneurship in
existing medium-sized and/or large enterprise are to be found. The dynamics
of the number of newly registered companies in Bulgaria amongst which
authentic innovative entrepreneurs can be sought show that after a peak of
9,000 in June 2008, it dropped more than threefold, reaching slightly over
3,000 a month after March 2009.
Highly innovative and particularly academic entrepreneurship is definitive
for the development of some industries of the national economy (for exam-
ple information and communication technologies). Combined with the global
dynamics in the development of ICT, this fact could explain differences in the
structure of R&D expenditure between the areas of natural and technological
sciences in Bulgaria – while in the case of natural sciences funding from the
state is the leading force, in the case of technological – the business provides
the larger portion of the funding. At the same time, there is a need for sector
8
policies in the field of innovation and enterprise, which take into account the
development specifics of the respective scientific and technological areas and
industries of the economy.
Data concerning R&D expenditure in Bulgaria are largely unreliable, which
hampers the generation of sector policies additionally. This drawback directly
concerns the link between science and business. On the one hand, there are
varied hidden forms of science – business interaction like the undisclosed estab-
lishment of spin-off companies related to state R&D institutes, parallel engage-
ment (moonlighting) of scientists and researchers in public scientific and pri-
vate business enterprise, consulting and expert services, as well as cooperation
on personal (as opposed to institutional) basis in national and international
research projects. On the other hand, business enterprises very often fail to
declare formally to the authorities their R&D expenditure because of the lack
of fiscal and/or reporting incentives. For example, detailed analysis of public
and private R&D investment in the sector of information and communication
technologies showed that official statistical data accounted for only about a
half of the actual R&D activity of the enterprises.
Innovation activity of Bulgarian enterprises
The fourth survey of innovation activity of Bulgarian business (INA-4), con-
ducted by the Applied Research and Communications Fund, revealed a con-siderable increase of innovation activity in 2009. The share of companies,
which declared they had innovation activity increased to 71% in 2009 com-
pared to 43% in 2008. This reflects the positive consequences of the coun-
try’s accession to the European Union and the efforts of business to respond
to the requirements of competitive European markets and legislation. The
crisis encouraged enterprises to seek ways to differentiate their products
and services, as well as to send clearer messages to consumers, which led to
a particularly strong increase of marketing innovations. It is expected that
2009/2010 will mark a significant decline in innovation activity, with only the
most innovative enterprises (about 35%) continuing to develop new products
and services.
Nearly 19% of the Bulgarian enterprises introduced successfully process innovations in 2008/2009 – projects, which require serious commitment by
management, both in the form of coordinated vision about the long-term
development of the company and in respect to the investments made. The
share of companies, which launched new and improved products or services was slightly bigger (26%). As a rule, the technological solutions introduced by
Bulgarian companies are borrowed from foreign partners.
The innovations declared by Bulgarian companies are such mainly at com-pany and national level and are not novel for the international market, although a considerable portion of the managers have defined them as such.
The results of patent and licensing activity of Bulgarian enterprises show that
there are practically no process and product innovations of international sig-
nificance in Bulgaria. The numbers for the last nearly ten years are: an average
of 103 protection documents (half of the submitted applications) were issued
annually by the Bulgarian Patent Office, significantly more applications were
submitted by individuals than by research institutes or small and medium-sized
enterprises, and only 63 licensing contracts at an insignificant market value
were concluded for obtaining rights on inventions.
9I N N OVAT I O N . B G
Self-reporting by Bulgarian managers puts the share of innovative enterprises in the country at 71% in 2009. The considerable increase compared to 2008
(65% on an annual basis) is due mainly to enterprises, which have introduced
organizational (30%) and market innovations (42%), aimed at streamlining oper-
ations in response to the influence of the economic crisis (streamlining organiza-
tional units, restructuring product portfolios, redefining relations with partners,
changing the packaging and marketing of products and so on). Although this
trend is still nascent in Bulgaria, negative external factors have less influence on innovative enterprises and they are more successful in mobilizing internal potential to resist them – new products form consumer loyalty, ensure stable
market presence, enterprise orientation and readiness to take risks.
Innovation climate in Bulgaria
The measures undertaken by the Bulgarian government to date in support-ing innovations as a major factor for overcoming the crisis and for maintain-ing sustainable economic growth are inadequate. If national policy and the
development of micro-economic programs for innovations, information tech-
nologies and scientific and technological development are not formulated, in
the long term Bulgaria will come out of the economic crisis in the same position
in which it entered it and the benefits of the stable macro-economic policy of
the last decade will remain unused.
Bulgaria remains the only EU member-state, which does not have a national target for the level of R&D intensity. Although this is not the only impor-
tant condition for the development of innovation activity in the country, it is
indicative of the government’s neglect of this aspect of the economy. In 2009, budget financing for R&D was reduced. The National Innovation Fund with
the Ministry of Economy, Energy and Tourism funded no projects and the
statute of the fund itself remains unclear. The funds for research and creative
activities of universities were also reduced within the framework of already
smaller overall budgets for 2010. In 2009, the budgets of research projects at
universities completed the year with 40% lower accounted expenditures than
the amounts approved in advance.
Like in most of the other EU-27 countries, in Bulgaria the share of the enter-prise sector in R&D expenditure increased after 2005 at the expense of the
government sector. In spite of this positive development, in absolute terms
R&D expenditure remained very low in both the state and the private sector,
with the Bulgarian state consistently reducing the intensity of its R&D spend-
ing – from 0.36% of GDP in 2000 to 0.28% for 2008. The lack of adequate instruments to trigger or complement private R&D funding through state funds remains a key problem for the country’s innovation system. The two sec-
tors, public and private, work in parallel, which leads to waste of financial and
human resources. The state continues to support activities without clear com-
mitment in respect to results, while viable R&D projects financed by the pri-
vate sector and implemented by public research institutes do not increase the
capacity of the participating state funded research organizations but remain
for the personal benefit of individual researchers. There is no system and/or instruments for productive collaboration and interaction between the state and the private R&D sector.
In 2010, the planned budget expenditure for science amounts to 221 million
levs or 1% of all budget expenditures. As in previous years, these resources will
10
be spent almost entirely (nearly 97%) for covering operational (running) costs
(mainly salaries) and only 3% are budgeted for capital costs, including for the
development of research infrastructure. At the same time, EU funds intended
for the development of innovation, science and technology are among the
least used even against the background of the overall sluggishness in the imple-
mentation of European funds. The Operational Program “Competitiveness” suffers a lack of vision and organizational capacity, which ranked its imple-
mentation among the most significantly delayed. The Operational Program „Human Resources Development” remains skewed towards traditional measures for providing subsidized (usually low skill) employment. It should
instead strive to create a market and opportunities for improving the qualifica-
tion and training of staff for the technological renovation of the economy.
On an international scale there is a considerable increase of the number of researchers and those engaged in science and technology activity. The
change for Bulgaria for the period 2000 – 2008 was a positive one, but
within less than 2%, which is evidence of a continuing lagging behind. In
2008, the sectoral distribution of staff engaged in R&D remained highly unbalanced – unlike the countries leading in terms of innovation in the EU, in
Bulgaria employment is provided mainly by the state sector. As a share of total
staff engaged in science and technology the share of individuals engaged in scientific and technological activity in the high-tech sectors of industry and knowledge-intensive services in Bulgaria in 2008 approached 6%, which is
close to the average level of the indicator for EU-27 (6,84%).
The increase of the number of persons engaged in science and technology for
the period 2000-2008 (by nearly 102,000) was accompanied by a considerably
more effective use of their potential. While in 2000 the unemployed in this
group amounted to 5.5%, in 2008 their share dropped to 2.2%. However, the declining share of young people who have chosen science and technology as a field for their career (also confirmed by the data for scientists), remains a worrying trend. The falling numbers of academic staff employed in the tech-nical fields of science (nearly 12% decrease) and in medical sciences (slightly
over 8% decrease) will be an essential obstacle for the development of these
promising high-tech fields in the country in the foreseeable future.
In 2010 R&D investment is expected to follow the general trend of decline of
investment activity, albeit to a lesser degree. One of the surprising character-
istics of the present global economic crisis is precisely the slower shrinking of investments in R&D. The survey of investment plans in industry conducted
by the National Statistical Institute forecasts a 11.2% reduction of the volume
of investments on an annual basis for 2010 compared to a decline of 37.2%
in 2009. According to the IMD Annual Competitiveness Yearbook, legislative
support for company registration in Bulgaria improved in 2009. At the same
time, the ranking showed that access to credit from the banking system and
from venture capital – a definitive factor for the success of entrepreneurs and
innovators – deteriorated.
Priorities for Bulgaria’s innovation policy until 2020
2010 is a year of great risk and opportunity. The financial and economic crisis
allowed critical decisions – the ones for which there was a lack of will or deter-
mination in the conditions of intensive growth – to be made by the political
elite and to be accepted easier by the business. After the momentum of the
11I N N OVAT I O N . B G
past few years, when external factors drove up growth in productivity and
exports, has waned, the time has come for the mobilization of internal growth
factors – enterprise and innovation activity, and intellectual capital.
In an environment of increased debate and expectations for reforms, the
government needs to show a clear will for qualitative change in the field of
innovation, science and technology in Bulgaria. Understanding the signifi-
cance of innovation as a growth machine (new products and processes, bet-
ter organization of work and approaches to marketing) is a prerequisite for
choosing economic policy priorities (economic sectors, technological fields), as
well as for implementing working mechanisms to achieve Bulgaria’s strategic
goals as a EU member. The drafting of an integrated national innovation, sci-
ence and technology strategy for the next ten years needs to rest on several
building blocks:
• Innovation policy aimed at economic recovery and sustainable growth
The European economy is facing a number of challenges – climate change, an
ageing population, lagging behind in key innovation indicators to the U.S. and
emerging markets, etc. Some of the main solutions for these challenges are to
be found at national level and within the framework of innovation policy. For
Bulgaria, this means updating of the current National Innovation Strategy, providing linkages to the development of science and the economy, and a clear commitment for the implementation of the strategy at the highest level of government.
• Instruments to achieve the priorities
Government institutions responsible for implementing innovation policy –
Ministry of Economy, Energy and Tourism and the Ministry of Education, Youth
and Science – do not put innovation at the core of the economic develop-ment agenda of the country. This necessitates the outlining – by means of a
wide public debate and analysis of the opportunities for innovative develop-
ment of priority economic sectors and leading technological fields – of a road-map for defining, commissioning and achieving strategic targets to promote national innovation and knowledge-based competitiveness.
The roadmap should aim to improve the functioning mechanisms of the inno-vation system, as well as to increase the intensity of interaction between the
units of the national innovation system as regards R&D, protection of intellec-
tual property, technological transfer, labor mobility and life-long learning.
• Investing in innovation potential
Given squeezed external funding (reduced foreign direct investment and
restricted access to commercial credit) it is important that the priorities for economic development of the country are set to correspond directly to the capacity of the national innovation system – scientific and technological fields
in which Bulgaria possesses internationally recognized experience and applica-
ble new knowledge. The mobilization of larger financial resources (through
the already functioning instruments – the National Innovation Fund and

12
the National Science Fund, as well as through effective use of the European
funds and the EU framework programs for research and for competitiveness
and innovation) is a necessary requirement for overcoming the gap between
Bulgarian and average European level of innovation activity.
Bulgaria should adopt a national target for R&D funding as a share of GDP. Increasing the amount of public funding available for R&D should be combined
with the application of several basic principles: ensuring transparency of funds’
management, prevalence of project over institutional financing, and introduc-
ing mechanisms of monitoring and control of the achieved results.
13I N N OVAT I O N . B G
INTRODUCTION
There are many reasons why 2010 could be the year of innovation in Bulgaria:
(1) the 2008-2009 crisis has significantly altered the economic map of the world,
marked the end of two decades of continuous economic growth and created
unprecedented opportunities for repositioning of the national economies;
(2) Bulgaria faced the crisis in fine general macroeconomic shape but now
needs to turn this advantage into a good macroeconomic platform by mod-
ernizing public administration and developing long-term growth policies and
priorities; (3) the European Union consolidated its institutional development
and the newly established European Commission is initiating the negotiations
on Union policy and budget for the period up to 2020. The year is bound to
be a hard one for the Bulgarian economy and the decline in national budget
revenues will continue; still, now is the time to formulate Bulgaria’s 2020 goals
and to prioritize market and social innovation as a means of attaining them.
Only in this way would Bulgaria speak the same language as the most advanced
economies in the world and would be able to improve the standard of living
and welfare of its citizens.
The annual Innovation.bg report provides a reliable assessment of the innova-
tion potential of the Bulgarian economy and the situation and development
capacity of the Bulgarian innovation system. It puts forward recommendations
for an improved public policy on innovation in Bulgaria and EU drawing on the
latest international theoretical and empirical research while taking into account
the specific economic, political, cultural, and institutional framework in which
the country’s innovation system is operating. For a sixth consecutive year the
report aims to be a part of the process of raising awareness of the importance
of innovation as a factor for national competitiveness and to serve as the basis
for development of national priorities supporting the implementation of the
new EU 2020 Strategy.
The report is intended for leaders and decision-makers in the public and private
sectors. The present edition, Innovation.bg 2010, examines the impact of the
crisis on innovation activity in the Bulgarian economy and suggests possible
14
directions for Bulgarian innovation policy over the next decade. Following the
established methodology of the four preceding editions, Innovation.bg 2010 analyzes the state and development capacity of the national innovation system
based on five groups of indicators:
• overall innovation product;
• entrepreneurship;
• investment and financing of innovation;
• human capital for innovation;
• information and communication technologies.
Innovation.bg 2010 presents an updated Innovation Index of Bulgarian enter-prises. The Index is based on findings of the annual surveys of innovation by
Bulgarian businesses conducted by the Innovation Relay Center with the Ap-
plied Research and Communications Fund (ARC Fund), panel data, and statisti-
cal analysis. The Report was reviewed and approved by the Expert Council on
Innovation with the Applied Research and Communications Fund.
Methodologically, Innovation.bg is based on several existing models in the as-
sessment and comparative analysis of innovation systems: 1. The European
Commission’s European Innovation Scoreboard. 2. The Science, Technology and Industry Scoreboard of OECD. 3. The US National Innovation Initiative; and
4. Executive Index of the Massachusetts Innovation Economy.
More extensive methodological notes and the sources of information are pre-
sented in Appendix 1. The theoretical rationale for the structure of the report
is provided in greater detail in Innovation.bg: Innovation Potential of the Bulgar-ian Economy, ARC Fund (2005).
15I N N OVAT I O N . B G
Gross Innovation Product
The gross innovation product of an economy or its innovativeness is assessed
by the new products and services introduced, the new technologies created
and the new scientific results achieved. It consists of and results from the
interaction of the innovation, technological and scientific products of the
country. It is a major benchmark for innovation policy because it allows deci-
sion-makers to compare the outcome of the innovation system in temporal
and geographical terms, as well as to estimate the needs of changes in the
organization and resources invested in the innovation process.
16
1 Innovation.bg 2009: The Bulgarian Innovation System in a Time of Global Economic Crisis, ARC Fund, 2009, pp. 25-28.2 A Bulgarian Supercomputing Center with the State Agency for Information Technology and Communications (SAITC)
was established with state funding in 2008 but does not actually work because of the lack of appropriate scientific and application-oriented research assignments.
Innovation Product
The innovation product is the result of innovation activity in the form of new and significantly improved processes,
products and services based on new and/or adapted knowledge and know-how. It is determined by the innovation ac-
tivity in the country and is the most important indicator for assessing the operation of the national innovation system.
The key features of this indicator, its market orientation and the fact that it represents the final stage of the innovation
process, determine the leading role of business in its realization.
Innovation Index
National innovation systems react
differently to external shocks, do-
mestic imbalances and crises. The
economic crisis in Bulgaria in 2009
did not bear the features of a typical
financial crisis. It resulted from the
combination of internal structural
and economic disparities whose neg-
ative effects increased additionally
as a result of the accumulation of a
number of external shocks – shrink-
ing foreign direct investments and
the principal markets for Bulgarian
production, as well as the natural
gas crisis, among others.
The influence of the crisis on busi-
ness innovation materialized in the
limitation of private funding for R&D
and technological innovation, both
because of the shortage of avail-
able financial resources (decline of
sales and rising credit prices) and as
an indirect effect of the behavior of
external partners, including the gov-
ernment (political corruption and
administrative incompetence in pub-
lic procurement and management of
the structural funds).
The Innovation.bg 2009 report1 pro-
vided arguments in support of the
positive influence of external mar-
kets on the degree of innovative
company activity. The fact that a
number of foreign strategic investors
left the country in the past year, as
well as the partial or total closure of
enterprises undoubtedly limited this
effect. At the same time, the global
crisis proved an opportunity for en-
terprises which managed to compen-
sate the limited demand on the ex-
isting markets by winning over new
clients and, as a result, to introduce
new technological solutions.
While in most countries the short-
term measures of the governments
against the crisis were related to
enormous financial bailouts for the
private sector – banks, insurance
companies and the automotive in-
dustry, in Bulgaria, particularly in the
second half of 2009, the reaction
was drastic cuts of the unrealistically
planned public expenditure in the
national budget.
In the long term, most European
countries like Germany, Portugal and
Sweden laid down education, R&D
and innovation as priorities of their
anti-crisis policies. Bulgaria, on the
other hand, continues to prefer to-
bacco production to science, as well
as the development of golf courses
over infrastructure, or as a whole
state support is directed at preserv-
ing low-technology, low-paid and
greatly detrimental to the environ-
ment activities. In the field of high-
tech, state policy in 2009 was marked
by hasty and chaotic attempts for ac-
quiring positions and the absorption
of funds without a strategic vision.2
A case in point is the establishment
of the state-owned nanotechnology
company effected as it was without
preliminary analysis and coordina-
tion with the needs of the leading
scientists and the existing enterprises
in this sector.
A strategic mistake in the prepara-
tion of the operational programs
and the management of finances
under the structural funds was made
with the decision to direct the Op-
erational Program Human Resources
Development (OPHRD) towards the
traditional active measures for creat-
ing employment, which are effective
for cushioning the effect for people
who have lost their jobs in the condi-
tions of a growing economy, but are
not adapted for the development of
human resources for restructuring
the economy after a crisis. As a re-
sult, OPHRD is directed towards the
least educated strata of the popula-
tion, with an expected low effect of
the training and a complementary
role in respect to the temporary em-
ployment programs at the expense
of using it as an effective tool to
promote the competitiveness of the
human factor in the country. The
few exceptions, when employees of
high-tech companies were trained,
created the impression of typical for
the country shortcomings like politi-
cal pressure and conflict of interests
instead of an attempt to develop
human resources based on con-
crete needs. A case in point was the
project for the development of train-
17I N N OVAT I O N . B G
3 Most frequently the stress is placed on the innovative nature of products in the sphere of cosmetics, in the case of goods with fast turnover (foods and drinks), as well as goods subject to teletrade and multilevel marketing.
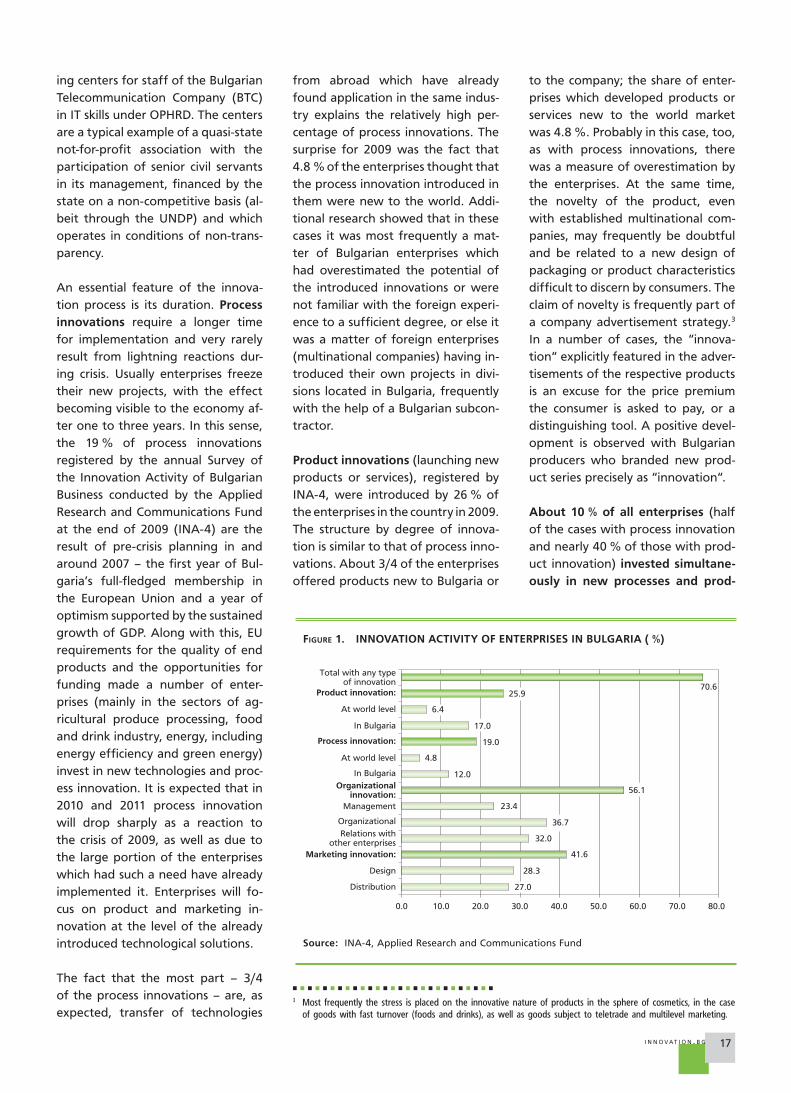
FIGURE 1. INNOVATION ACTIVITY OF ENTERPRISES IN BULGARIA ( %)
Source: INA-4, Applied Research and Communications Fund
0.0 80.070.060.050.040.030.020.0
27.0
28.3
41.6
32.0
12.0
19.0
17.0
25.9
4.8
6.4
36.7
56.1
70.6
23.4
10.0
Distribution
Total with any typeof innovation
Product innovation:
At world level
In Bulgaria
Process innovation:
At world level
In Bulgaria
Organizationalinnovation:
Management
Organizational
Relations withother enterprises
Marketing innovation:
Design
ing centers for staff of the Bulgarian
Telecommunication Company (BTC)
in IT skills under OPHRD. The centers
are a typical example of a quasi-state
not-for-profit association with the
participation of senior civil servants
in its management, financed by the
state on a non-competitive basis (al-
beit through the UNDP) and which
operates in conditions of non-trans-
parency.
An essential feature of the innova-
tion process is its duration. Process innovations require a longer time
for implementation and very rarely
result from lightning reactions dur-
ing crisis. Usually enterprises freeze
their new projects, with the effect
becoming visible to the economy af-
ter one to three years. In this sense,
the 19 % of process innovations
registered by the annual Survey of
the Innovation Activity of Bulgarian
Business conducted by the Applied
Research and Communications Fund
at the end of 2009 (INA-4) are the
result of pre-crisis planning in and
around 2007 – the first year of Bul-
garia’s full-fledged membership in
the European Union and a year of
optimism supported by the sustained
growth of GDP. Along with this, EU
requirements for the quality of end
products and the opportunities for
funding made a number of enter-
prises (mainly in the sectors of ag-
ricultural produce processing, food
and drink industry, energy, including
energy efficiency and green energy)
invest in new technologies and proc-
ess innovation. It is expected that in
2010 and 2011 process innovation
will drop sharply as a reaction to
the crisis of 2009, as well as due to
the large portion of the enterprises
which had such a need have already
implemented it. Enterprises will fo-
cus on product and marketing in-
novation at the level of the already
introduced technological solutions.
The fact that the most part – 3/4
of the process innovations – are, as
expected, transfer of technologies
from abroad which have already
found application in the same indus-
try explains the relatively high per-
centage of process innovations. The
surprise for 2009 was the fact that
4.8 % of the enterprises thought that
the process innovation introduced in
them were new to the world. Addi-
tional research showed that in these
cases it was most frequently a mat-
ter of Bulgarian enterprises which
had overestimated the potential of
the introduced innovations or were
not familiar with the foreign experi-
ence to a sufficient degree, or else it
was a matter of foreign enterprises
(multinational companies) having in-
troduced their own projects in divi-
sions located in Bulgaria, frequently
with the help of a Bulgarian subcon-
tractor.
Product innovations (launching new
products or services), registered by
INA-4, were introduced by 26 % of
the enterprises in the country in 2009.
The structure by degree of innova-
tion is similar to that of process inno-
vations. About 3/4 of the enterprises
offered products new to Bulgaria or
to the company; the share of enter-
prises which developed products or
services new to the world market
was 4.8 %. Probably in this case, too,
as with process innovations, there
was a measure of overestimation by
the enterprises. At the same time,
the novelty of the product, even
with established multinational com-
panies, may frequently be doubtful
and be related to a new design of
packaging or product characteristics
difficult to discern by consumers. The
claim of novelty is frequently part of
a company advertisement strategy.3
In a number of cases, the ”innova-
tion” explicitly featured in the adver-
tisements of the respective products
is an excuse for the price premium
the consumer is asked to pay, or a
distinguishing tool. A positive devel-
opment is observed with Bulgarian
producers who branded new prod-
uct series precisely as ”innovation”.
About 10 % of all enterprises (half
of the cases with process innovation
and nearly 40 % of those with prod-
uct innovation) invested simultane-ously in new processes and prod-
18
FIGURE 2. DEGREE OF ENTERPRISE INNOVATIVENESS BY SIZE (2008 AND 2009)
Source: INA-3 and INA-4, Applied Research and Communications Fund, 2010
0
0.5
0.45
0.4
0.35
0.3
0.25
0.2
0.15
0.1
0.05
Up to 9 from 10 to 49 from 50 to 249 250 and more
Index Product innovations
Process innovations Organizational innovations
Marketing innovations2009
2008
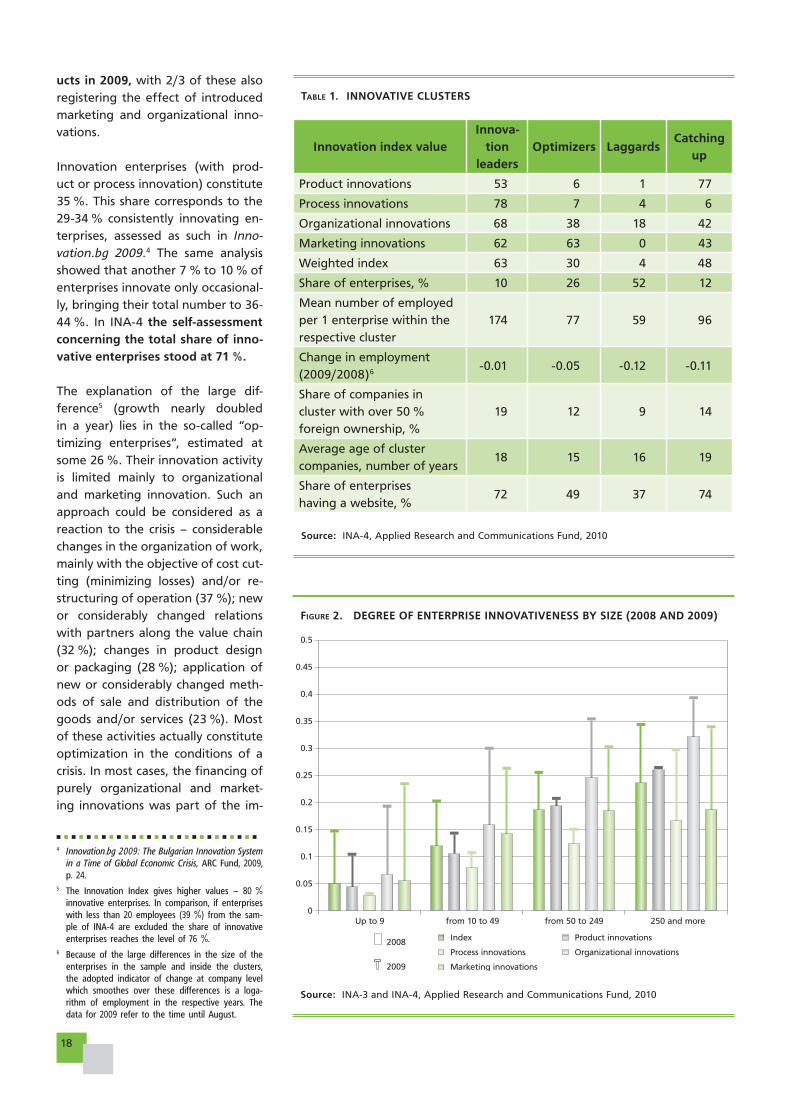
TABLE 1. INNOVATIVE CLUSTERS
Source: INA-4, Applied Research and Communications Fund, 2010
Innovation index valueInnova-
tion leaders
Optimizers LaggardsCatching
up
Product innovations 53 6 1 77
Process innovations 78 7 4 6
Organizational innovations 68 38 18 42
Marketing innovations 62 63 0 43
Weighted index 63 30 4 48
Share of enterprises, % 10 26 52 12
Mean number of employed
per 1 enterprise within the
respective cluster
174 77 59 96
Change in employment
(2009/2008)6-0.01 -0.05 -0.12 -0.11
Share of companies in
cluster with over 50 %
foreign ownership, %
19 12 9 14
Average age of cluster
companies, number of years18 15 16 19
Share of enterprises
having a website, %72 49 37 74
4 Innovation.bg 2009: The Bulgarian Innovation System in a Time of Global Economic Crisis, ARC Fund, 2009, p. 24.
5 The Innovation Index gives higher values – 80 % innovative enterprises. In comparison, if enterprises with less than 20 employees (39 %) from the sam-ple of INA-4 are excluded the share of innovative enterprises reaches the level of 76 %.
6 Because of the large differences in the size of the enterprises in the sample and inside the clusters, the adopted indicator of change at company level which smoothes over these differences is a loga-rithm of employment in the respective years. The data for 2009 refer to the time until August.
ucts in 2009, with 2/3 of these also
registering the effect of introduced
marketing and organizational inno-
vations.
Innovation enterprises (with prod-
uct or process innovation) constitute
35 %. This share corresponds to the
29-34 % consistently innovating en-
terprises, assessed as such in Inno-vation.bg 2009.4 The same analysis
showed that another 7 % to 10 % of
enterprises innovate only occasional-
ly, bringing their total number to 36-
44 %. In INA-4 the self-assessment concerning the total share of inno-vative enterprises stood at 71 %.
The explanation of the large dif-
ference5 (growth nearly doubled
in a year) lies in the so-called ”op-
timizing enterprises”, estimated at
some 26 %. Their innovation activity
is limited mainly to organizational
and marketing innovation. Such an
approach could be considered as a
reaction to the crisis – considerable
changes in the organization of work,
mainly with the objective of cost cut-
ting (minimizing losses) and/or re-
structuring of operation (37 %); new
or considerably changed relations
with partners along the value chain
(32 %); changes in product design
or packaging (28 %); application of
new or considerably changed meth-
ods of sale and distribution of the
goods and/or services (23 %). Most
of these activities actually constitute
optimization in the conditions of a
crisis. In most cases, the financing of
purely organizational and market-
ing innovations was part of the im-
19I N N OVAT I O N . B G
plementation of projects under the
Operational Programs, or else was
effected in the context of the use
of information and communication
technologies (ICT) in business (ERP,
CRM and others).
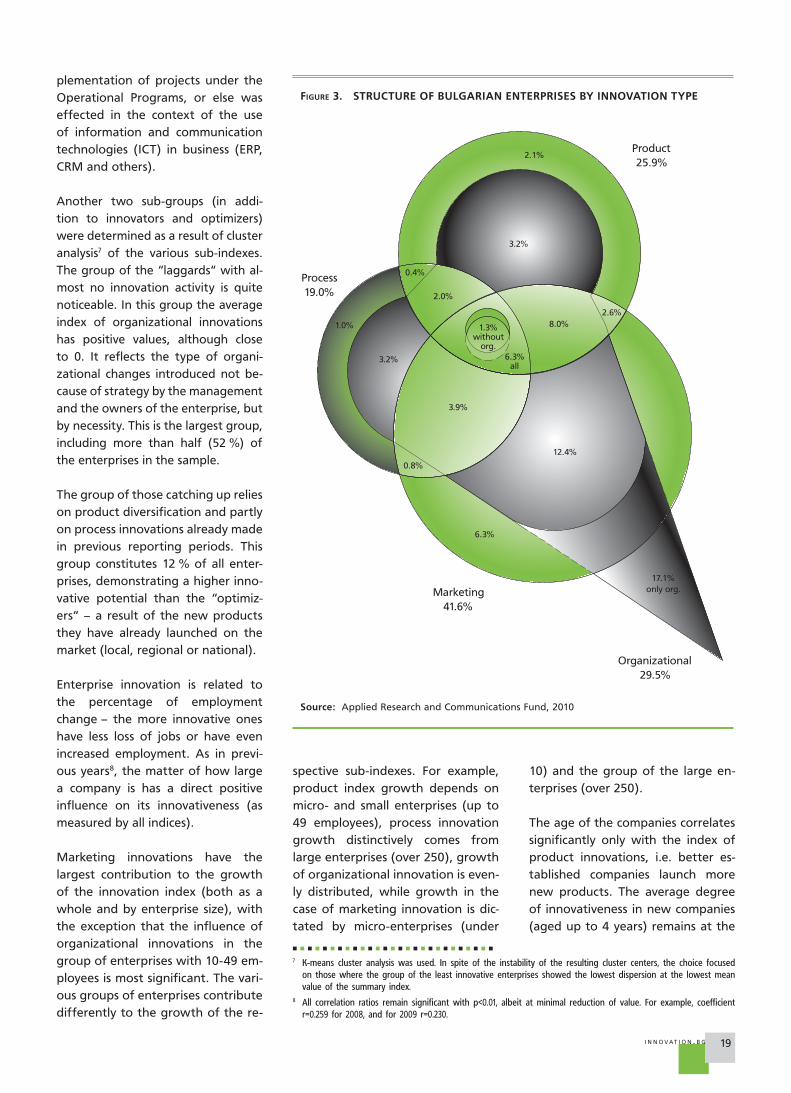
Another two sub-groups (in addi-
tion to innovators and optimizers)
were determined as a result of cluster
analysis7 of the various sub-indexes.
The group of the ”laggards” with al-
most no innovation activity is quite
noticeable. In this group the average
index of organizational innovations
has positive values, although close
to 0. It reflects the type of organi-
zational changes introduced not be-
cause of strategy by the management
and the owners of the enterprise, but
by necessity. This is the largest group,
including more than half (52 %) of
the enterprises in the sample.
The group of those catching up relies
on product diversification and partly
on process innovations already made
in previous reporting periods. This
group constitutes 12 % of all enter-
prises, demonstrating a higher inno-
vative potential than the ”optimiz-
ers” – a result of the new products
they have already launched on the
market (local, regional or national).
Enterprise innovation is related to
the percentage of employment
change – the more innovative ones
have less loss of jobs or have even
increased employment. As in previ-
ous years8, the matter of how large
a company is has a direct positive
influence on its innovativeness (as
measured by all indices).
Marketing innovations have the
largest contribution to the growth
of the innovation index (both as a
whole and by enterprise size), with
the exception that the influence of
organizational innovations in the
group of enterprises with 10-49 em-
ployees is most significant. The vari-
ous groups of enterprises contribute
differently to the growth of the re-
7 K-means cluster analysis was used. In spite of the instability of the resulting cluster centers, the choice focused on those where the group of the least innovative enterprises showed the lowest dispersion at the lowest mean value of the summary index.
8 All correlation ratios remain significant with p<0.01, albeit at minimal reduction of value. For example, coefficient r=0.259 for 2008, and for 2009 r=0.230.
FIGURE 3. STRUCTURE OF BULGARIAN ENTERPRISES BY INNOVATION TYPE
Source: Applied Research and Communications Fund, 2010
Organizational29.5%
Product25.9%
Process19.0%
Marketing41.6%
1.3%without
org.6.3%
all
8.0%2.6%
3.2%
2.1%
0.4%
2.0%
12.4%
17.1%only org.
6.3%
3.9%
0.8%
3.2%
1.0%
spective sub-indexes. For example,
product index growth depends on
micro- and small enterprises (up to
49 employees), process innovation
growth distinctively comes from
large enterprises (over 250), growth
of organizational innovation is even-
ly distributed, while growth in the
case of marketing innovation is dic-
tated by micro-enterprises (under
10) and the group of the large en-
terprises (over 250).
The age of the companies correlates
significantly only with the index of
product innovations, i.e. better es-
tablished companies launch more
new products. The average degree
of innovativeness in new companies
(aged up to 4 years) remains at the
20
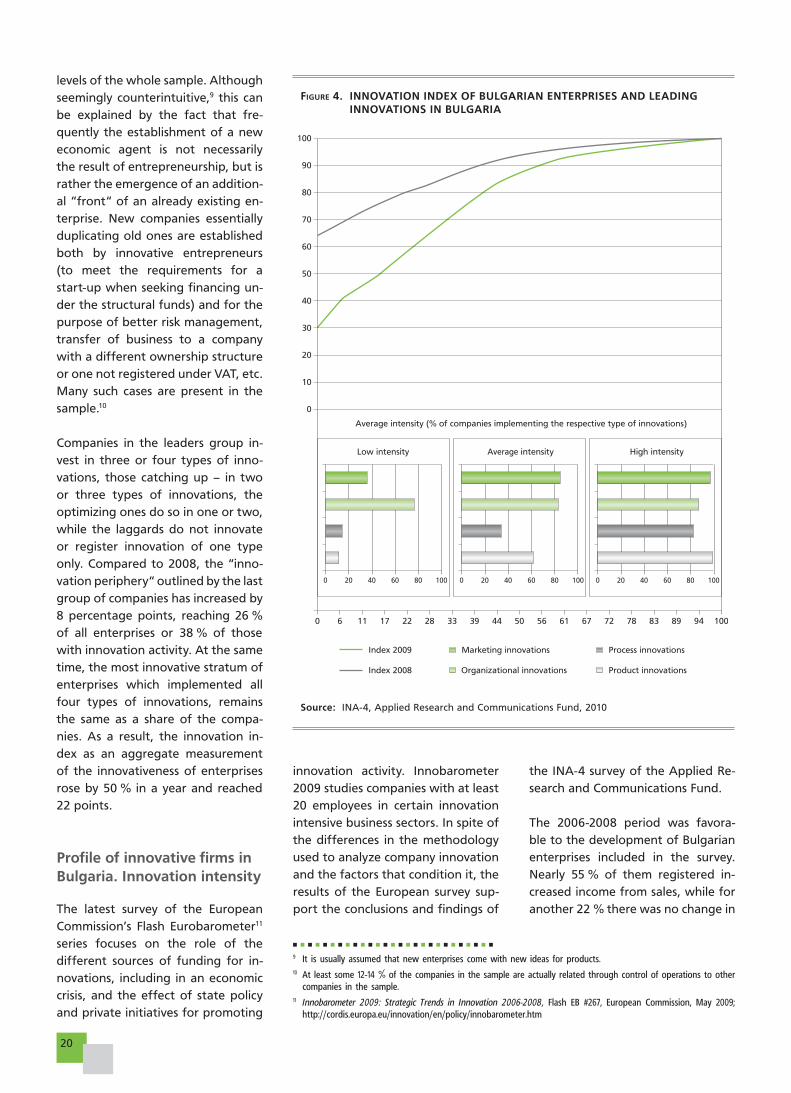
FIGURE 4. INNOVATION INDEX OF BULGARIAN ENTERPRISES AND LEADING INNOVATIONS IN BULGARIA
Source: INA-4, Applied Research and Communications Fund, 2010
levels of the whole sample. Although
seemingly counterintuitive,9 this can
be explained by the fact that fre-
quently the establishment of a new
economic agent is not necessarily
the result of entrepreneurship, but is
rather the emergence of an addition-
al ”front” of an already existing en-
terprise. New companies essentially
duplicating old ones are established
both by innovative entrepreneurs
(to meet the requirements for a
start-up when seeking financing un-
der the structural funds) and for the
purpose of better risk management,
transfer of business to a company
with a different ownership structure
or one not registered under VAT, etc.
Many such cases are present in the
sample.10
Companies in the leaders group in-
vest in three or four types of inno-
vations, those catching up – in two
or three types of innovations, the
optimizing ones do so in one or two,
while the laggards do not innovate
or register innovation of one type
only. Compared to 2008, the ”inno-
vation periphery” outlined by the last
group of companies has increased by
8 percentage points, reaching 26 %
of all enterprises or 38 % of those
with innovation activity. At the same
time, the most innovative stratum of
enterprises which implemented all
four types of innovations, remains
the same as a share of the compa-
nies. As a result, the innovation in-
dex as an aggregate measurement
of the innovativeness of enterprises
rose by 50 % in a year and reached
22 points.
Profile of innovative firms in Bulgaria. Innovation intensity
The latest survey of the European
Commission’s Flash Eurobarometer11
series focuses on the role of the
different sources of funding for in-
novations, including in an economic
crisis, and the effect of state policy
and private initiatives for promoting
9 It is usually assumed that new enterprises come with new ideas for products.10 At least some 12-14 % of the companies in the sample are actually related through control of operations to other
companies in the sample.11 Innobarometer 2009: Strategic Trends in Innovation 2006-2008, Flash EB #267, European Commission, May 2009;
http://cordis.europa.eu/innovation/en/policy/innobarometer.htm
innovation activity. Innobarometer
2009 studies companies with at least
20 employees in certain innovation
intensive business sectors. In spite of
the differences in the methodology
used to analyze company innovation
and the factors that condition it, the
results of the European survey sup-
port the conclusions and findings of
the INA-4 survey of the Applied Re-
search and Communications Fund.
The 2006-2008 period was favora-
ble to the development of Bulgarian
enterprises included in the survey.
Nearly 55 % of them registered in-
creased income from sales, while for
another 22 % there was no change in
Index 2009
Index 2008
0
100
90
80
70
60
50
40
30
20
10
10094898378726761565044392822171160
Product innovationsOrganizational innovations
Process innovationsMarketing innovations
33
0 20 40 60 10080
Low intensity
0 20 40 60 80 100
High intensity
0 20 40 60 80 100
Average intensity
Average intensity (% of companies implementing the respective type of innovations)
21I N N OVAT I O N . B G
2008 compared to 2006 – levels close
to the EU average. Traditionally, the
best financial health is demonstrated
by enterprises from the Scandina-
vian countries (Norway – 81.4 %;
Sweden – 77.7 %; Finland – 75.1 %),
which is also the reason for their
greater capacity to invest in innova-
tion. Of the new member states, the
results for Lithuania and Romania –
respectively 81.2 % and 70.2 % of the
enterprises there showed a positive
trend in their financial condition.
By the indicator of expenditure on
innovation in structural terms Bul-
garian enterprises follow the Euro-
pean pattern – 24.7 % of the enter-
prises in the sample invest less than
5 % of their turnover in innovation,
followed by those which invest up to
25 % (18.4 % of the enterprises) and
over 25 % of the turnover (3.9 % of
the enterprises). There is, however,
a substantial difference in respect to
the relative share of enterprises that
make such investments – for EU-27
85.2 % of the interviewed enter-
prises declared they invest in R&D,
while in Bulgaria a mere 47 % of the companies set aside funds for research and innovation and more than half of these limit this expend-iture to 5 % of turnover. In spite of
that, 52.6 % of the enterprises with
investments in R&D declared that
they had increased their amount
over the three-year period under
survey, and only 10.1 % were forced
to reduce that amount. With 37.3 %
of the companies there is no change
in the expenditure for research and
innovation.
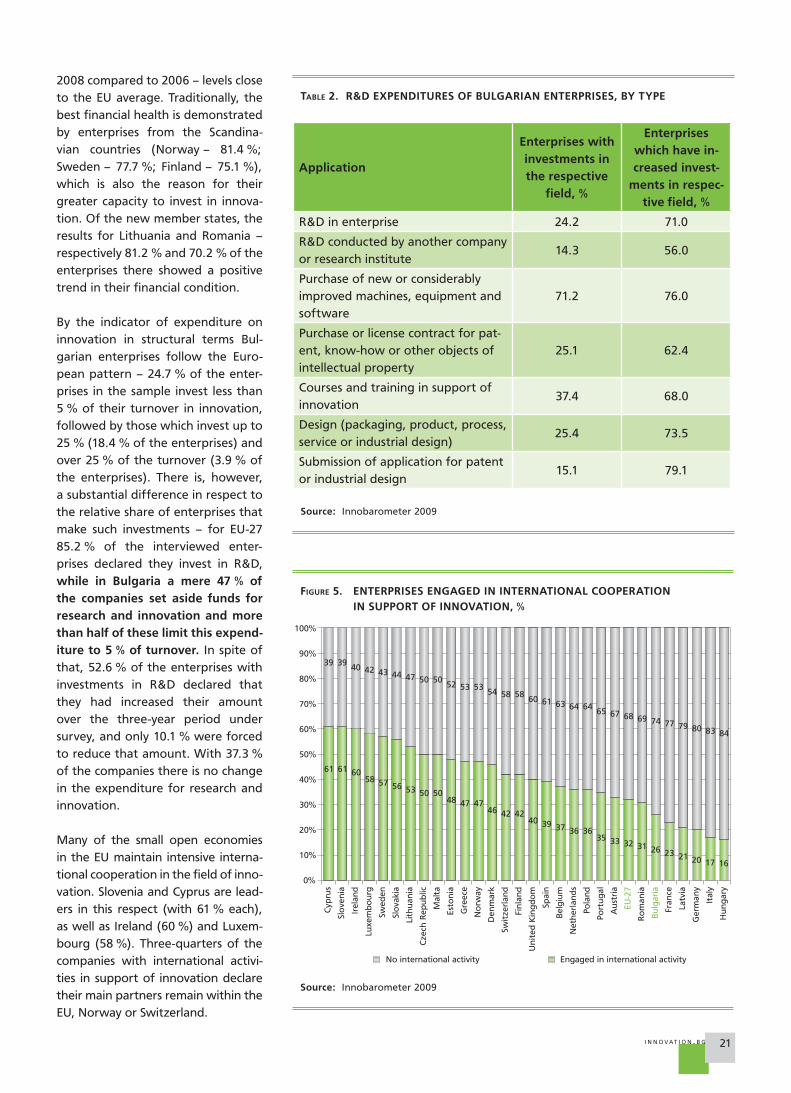
Many of the small open economies
in the EU maintain intensive interna-
tional cooperation in the field of inno-
vation. Slovenia and Cyprus are lead-
ers in this respect (with 61 % each),
as well as Ireland (60 %) and Luxem-
bourg (58 %). Three-quarters of the
companies with international activi-
ties in support of innovation declare
their main partners remain within the
EU, Norway or Switzerland.
TABLE 2. R&D EXPENDITURES OF BULGARIAN ENTERPRISES, BY TYPE
Source: Innobarometer 2009
Application
Enterprises with investments in the respective
field, %
Enterprises which have in-creased invest-
ments in respec-tive field, %
R&D in enterprise 24.2 71.0
R&D conducted by another company
or research institute14.3 56.0
Purchase of new or considerably
improved machines, equipment and
software
71.2 76.0
Purchase or license contract for pat-
ent, know-how or other objects of
intellectual property
25.1 62.4
Courses and training in support of
innovation37.4 68.0
Design (packaging, product, process,
service or industrial design)25.4 73.5
Submission of application for patent
or industrial design15.1 79.1
FIGURE 5. ENTERPRISES ENGAGED IN INTERNATIONAL COOPERATION IN SUPPORT OF INNOVATION, %
Source: Innobarometer 2009
Swed
en
Slo
vaki
a
Lith
uan
ia
Cze
ch R
epu
blic
Mal
ta
Esto
nia
Gre
ece
No
rway
Den
mar
k
Swit
zerl
and
Fin
lan
d
0%
10%
20%
30%
40%
50%
60%
70%
80%
90%
100%
Cyp
rus
Slo
ven
ia
Irel
and
Luxe
mb
ou
rg
Un
ited
Kin
gd
om
Spai
n
Bel
giu
m
Net
her
lan
ds
Po
lan
d
Po
rtu
gal
Au
stri
a
EU-2
7
Ro
man
ia
Bu
lgar
ia
Fran
ce
Latv
ia
Ger
man
y
Ital
y
Hu
ng
ary
Engaged in international activityNo international activity
61 61 6058 57 56 53 50 50
48 47
39 3940 42 43 44 47 50 50
52 53
4746 42 42
40 39 37 36
5354 58 58
60 61 63 64
3635 33 32 31 26 23 21 20 17 16
6465 67 68 69 74 77 79 80 83 84
22
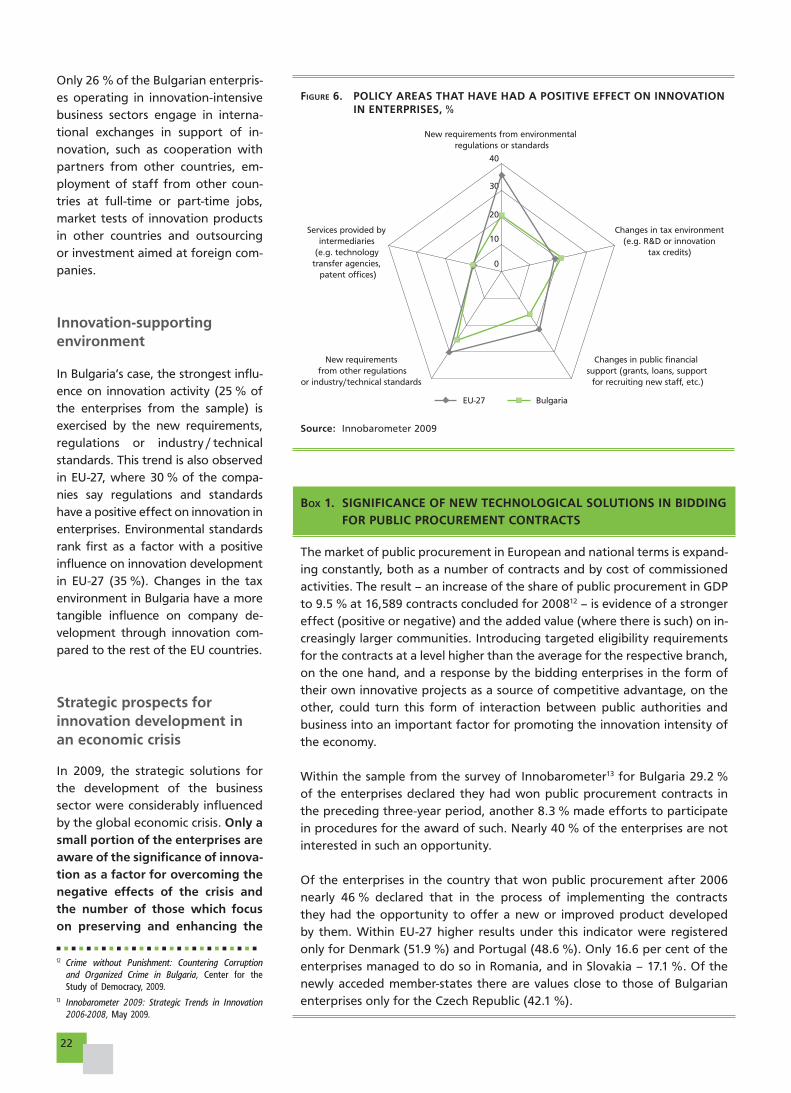
FIGURE 6. POLICY AREAS THAT HAVE HAD A POSITIVE EFFECT ON INNOVATION IN ENTERPRISES, %
Source: Innobarometer 2009
BOX 1. SIGNIFICANCE OF NEW TECHNOLOGICAL SOLUTIONS IN BIDDING FOR PUBLIC PROCUREMENT CONTRACTS
The market of public procurement in European and national terms is expand-
ing constantly, both as a number of contracts and by cost of commissioned
activities. The result – an increase of the share of public procurement in GDP
to 9.5 % at 16,589 contracts concluded for 200812 – is evidence of a stronger
effect (positive or negative) and the added value (where there is such) on in-
creasingly larger communities. Introducing targeted eligibility requirements
for the contracts at a level higher than the average for the respective branch,
on the one hand, and a response by the bidding enterprises in the form of
their own innovative projects as a source of competitive advantage, on the
other, could turn this form of interaction between public authorities and
business into an important factor for promoting the innovation intensity of
the economy.
Within the sample from the survey of Innobarometer13 for Bulgaria 29.2 %
of the enterprises declared they had won public procurement contracts in
the preceding three-year period, another 8.3 % made efforts to participate
in procedures for the award of such. Nearly 40 % of the enterprises are not
interested in such an opportunity.
Of the enterprises in the country that won public procurement after 2006
nearly 46 % declared that in the process of implementing the contracts
they had the opportunity to offer a new or improved product developed
by them. Within EU-27 higher results under this indicator were registered
only for Denmark (51.9 %) and Portugal (48.6 %). Only 16.6 per cent of the
enterprises managed to do so in Romania, and in Slovakia – 17.1 %. Of the
newly acceded member-states there are values close to those of Bulgarian
enterprises only for the Czech Republic (42.1 %).
Only 26 % of the Bulgarian enterpris-
es operating in innovation-intensive
business sectors engage in interna-
tional exchanges in support of in-
novation, such as cooperation with
partners from other countries, em-
ployment of staff from other coun-
tries at full-time or part-time jobs,
market tests of innovation products
in other countries and outsourcing
or investment aimed at foreign com-
panies.
Innovation-supporting environment
In Bulgaria’s case, the strongest influ-
ence on innovation activity (25 % of
the enterprises from the sample) is
exercised by the new requirements,
regulations or industry / technical
standards. This trend is also observed
in EU-27, where 30 % of the compa-
nies say regulations and standards
have a positive effect on innovation in
enterprises. Environmental standards
rank first as a factor with a positive
influence on innovation development
in EU-27 (35 %). Changes in the tax
environment in Bulgaria have a more
tangible influence on company de-
velopment through innovation com-
pared to the rest of the EU countries.
Strategic prospects for innovation development in an economic crisis
In 2009, the strategic solutions for
the development of the business
sector were considerably influenced
by the global economic crisis. Only a small portion of the enterprises are aware of the significance of innova-tion as a factor for overcoming the negative effects of the crisis and the number of those which focus on preserving and enhancing the
New requirements from environmental regulations or standards
Changes in tax environment(e.g. R&D or innovation
tax credits)
Services provided by intermediaries
(e.g. technology transfer agencies,
patent offices)
Changes in public financial support (grants, loans, support for recruiting new staff, etc.)
New requirements from other regulations
or industry/technical standards
EU-27 Bulgaria
0
40
30
20
10
12 Crime without Punishment: Countering Corruption and Organized Crime in Bulgaria, Center for the Study of Democracy, 2009.
13 Innobarometer 2009: Strategic Trends in Innovation 2006-2008, May 2009.
23I N N OVAT I O N . B G
new knowledge already created is even smaller.
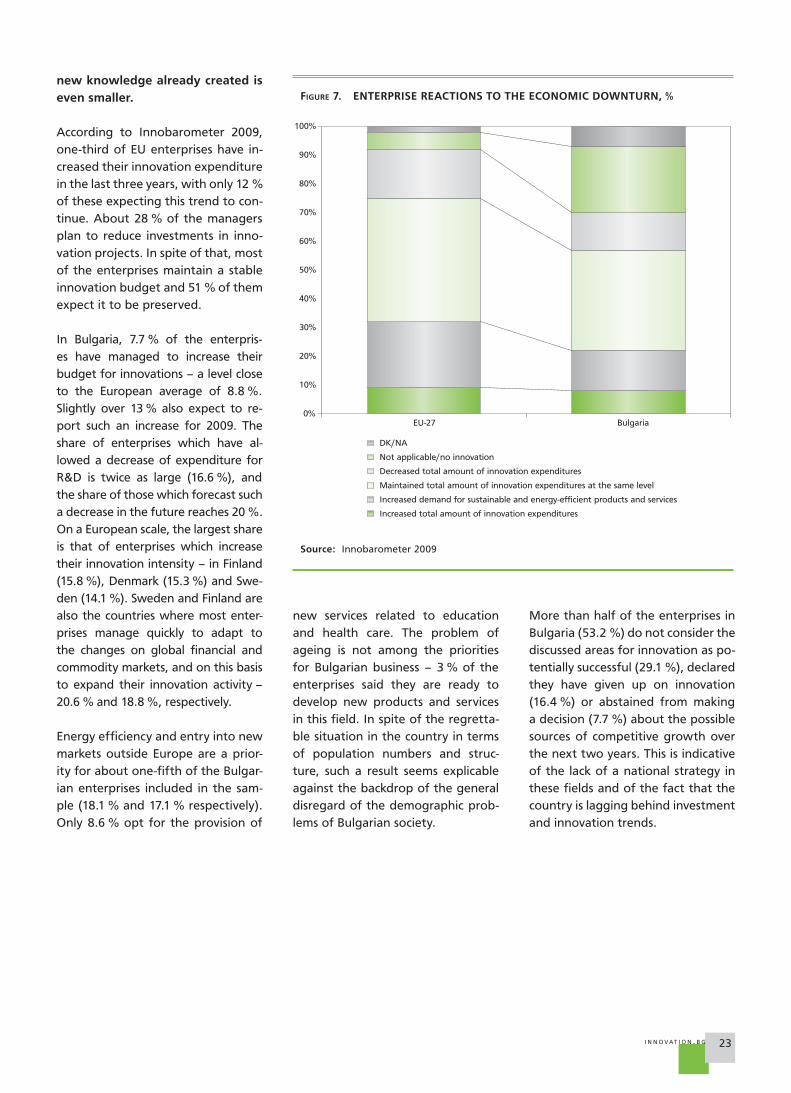
According to Innobarometer 2009,
one-third of EU enterprises have in-
creased their innovation expenditure
in the last three years, with only 12 %
of these expecting this trend to con-
tinue. About 28 % of the managers
plan to reduce investments in inno-
vation projects. In spite of that, most
of the enterprises maintain a stable
innovation budget and 51 % of them
expect it to be preserved.
In Bulgaria, 7.7 % of the enterpris-
es have managed to increase their
budget for innovations – a level close
to the European average of 8.8 %.
Slightly over 13 % also expect to re-
port such an increase for 2009. The
share of enterprises which have al-
lowed a decrease of expenditure for
R&D is twice as large (16.6 %), and
the share of those which forecast such
a decrease in the future reaches 20 %.
On a European scale, the largest share
is that of enterprises which increase
their innovation intensity – in Finland
(15.8 %), Denmark (15.3 %) and Swe-
den (14.1 %). Sweden and Finland are
also the countries where most enter-
prises manage quickly to adapt to
the changes on global financial and
commodity markets, and on this basis
to expand their innovation activity –
20.6 % and 18.8 %, respectively.
Energy efficiency and entry into new
markets outside Europe are a prior-
ity for about one-fifth of the Bulgar-
ian enterprises included in the sam-
ple (18.1 % and 17.1 % respectively).
Only 8.6 % opt for the provision of
FIGURE 7. ENTERPRISE REACTIONS TO THE ECONOMIC DOWNTURN, %
Source: Innobarometer 2009
0%
10%
20%
30%
40%
50%
60%
70%
80%
90%
100%
DK/NA
Increased total amount of innovation expenditures
Increased demand for sustainable and energy-efficient products and services
Maintained total amount of innovation expenditures at the same level
Decreased total amount of innovation expenditures
Not applicable/no innovation
EU-27 Bulgaria
new services related to education
and health care. The problem of
ageing is not among the priorities
for Bulgarian business – 3 % of the
enterprises said they are ready to
develop new products and services
in this field. In spite of the regretta-
ble situation in the country in terms
of population numbers and struc-
ture, such a result seems explicable
against the backdrop of the general
disregard of the demographic prob-
lems of Bulgarian society.
More than half of the enterprises in
Bulgaria (53.2 %) do not consider the
discussed areas for innovation as po-
tentially successful (29.1 %), declared
they have given up on innovation
(16.4 %) or abstained from making
a decision (7.7 %) about the possible
sources of competitive growth over
the next two years. This is indicative
of the lack of a national strategy in
these fields and of the fact that the
country is lagging behind investment
and innovation trends.
24
Technological Product
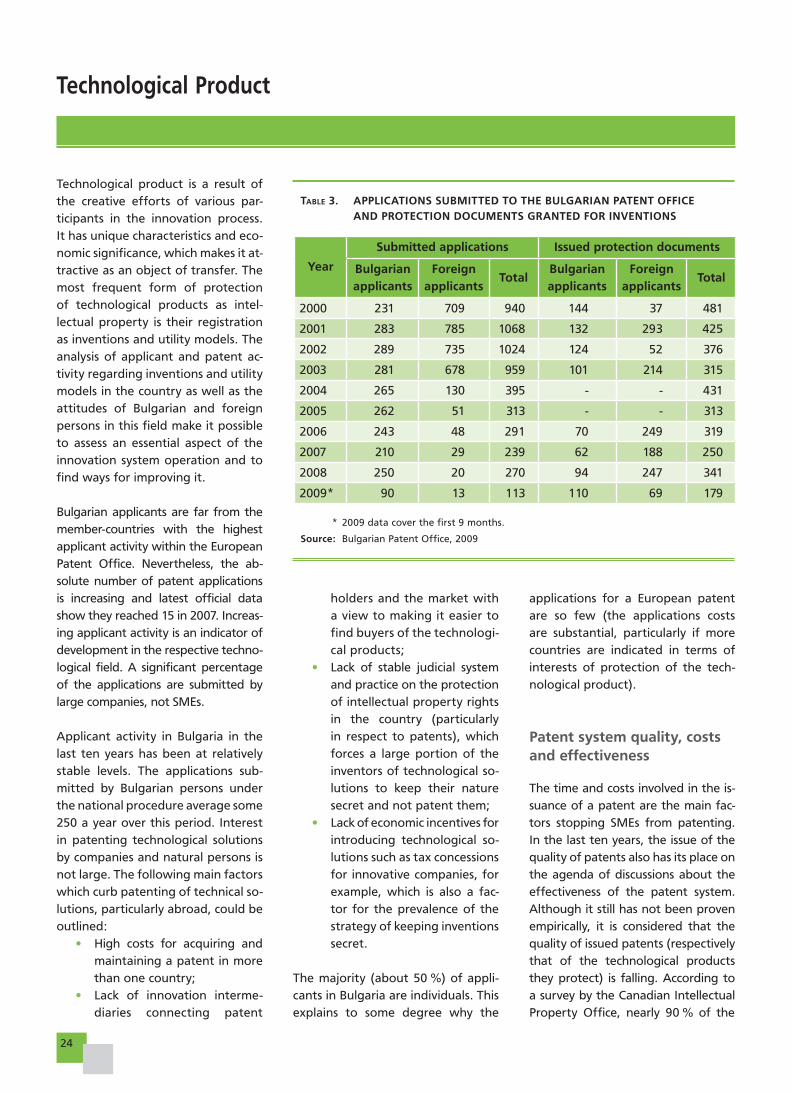
TABLE 3. APPLICATIONS SUBMITTED TO THE BULGARIAN PATENT OFFICE AND PROTECTION DOCUMENTS GRANTED FOR INVENTIONS
* 2009 data cover the first 9 months.
Source: Bulgarian Patent Office, 2009
Year
Submitted applications Issued protection documents
Bulgarian applicants
Foreign applicants
TotalBulgarian applicants
Foreign applicants
Total
2000 231 709 940 144 37 481
2001 283 785 1068 132 293 425
2002 289 735 1024 124 52 376
2003 281 678 959 101 214 315
2004 265 130 395 - - 431
2005 262 51 313 - - 313
2006 243 48 291 70 249 319
2007 210 29 239 62 188 250
2008 250 20 270 94 247 341
2009* 90 13 113 110 69 179
Technological product is a result of
the creative efforts of various par-
ticipants in the innovation process.
It has unique characteristics and eco-
nomic significance, which makes it at-
tractive as an object of transfer. The
most frequent form of protection
of technological products as intel-
lectual property is their registration
as inventions and utility models. The
analysis of applicant and patent ac-
tivity regarding inventions and utility
models in the country as well as the
attitudes of Bulgarian and foreign
persons in this field make it possible
to assess an essential aspect of the
innovation system operation and to
find ways for improving it.
Bulgarian applicants are far from the
member-countries with the highest
applicant activity within the European
Patent Office. Nevertheless, the ab-
solute number of patent applications
is increasing and latest official data
show they reached 15 in 2007. Increas-
ing applicant activity is an indicator of
development in the respective techno-
logical field. A significant percentage
of the applications are submitted by
large companies, not SMEs.
Applicant activity in Bulgaria in the
last ten years has been at relatively
stable levels. The applications sub-
mitted by Bulgarian persons under
the national procedure average some
250 a year over this period. Interest
in patenting technological solutions
by companies and natural persons is
not large. The following main factors
which curb patenting of technical so-
lutions, particularly abroad, could be
outlined:
• High costs for acquiring and
maintaining a patent in more
than one country;
• Lack of innovation interme-
diaries connecting patent
holders and the market with
a view to making it easier to
find buyers of the technologi-
cal products;
• Lack of stable judicial system
and practice on the protection
of intellectual property rights
in the country (particularly
in respect to patents), which
forces a large portion of the
inventors of technological so-
lutions to keep their nature
secret and not patent them;
• Lack of economic incentives for
introducing technological so-
lutions such as tax concessions
for innovative companies, for
example, which is also a fac-
tor for the prevalence of the
strategy of keeping inventions
secret.
The majority (about 50 %) of appli-
cants in Bulgaria are individuals. This
explains to some degree why the
applications for a European patent
are so few (the applications costs
are substantial, particularly if more
countries are indicated in terms of
interests of protection of the tech-
nological product).
Patent system quality, costs and effectiveness
The time and costs involved in the is-
suance of a patent are the main fac-
tors stopping SMEs from patenting.
In the last ten years, the issue of the
quality of patents also has its place on
the agenda of discussions about the
effectiveness of the patent system.
Although it still has not been proven
empirically, it is considered that the
quality of issued patents (respectively
that of the technological products
they protect) is falling. According to
a survey by the Canadian Intellectual
Property Office, nearly 90 % of the
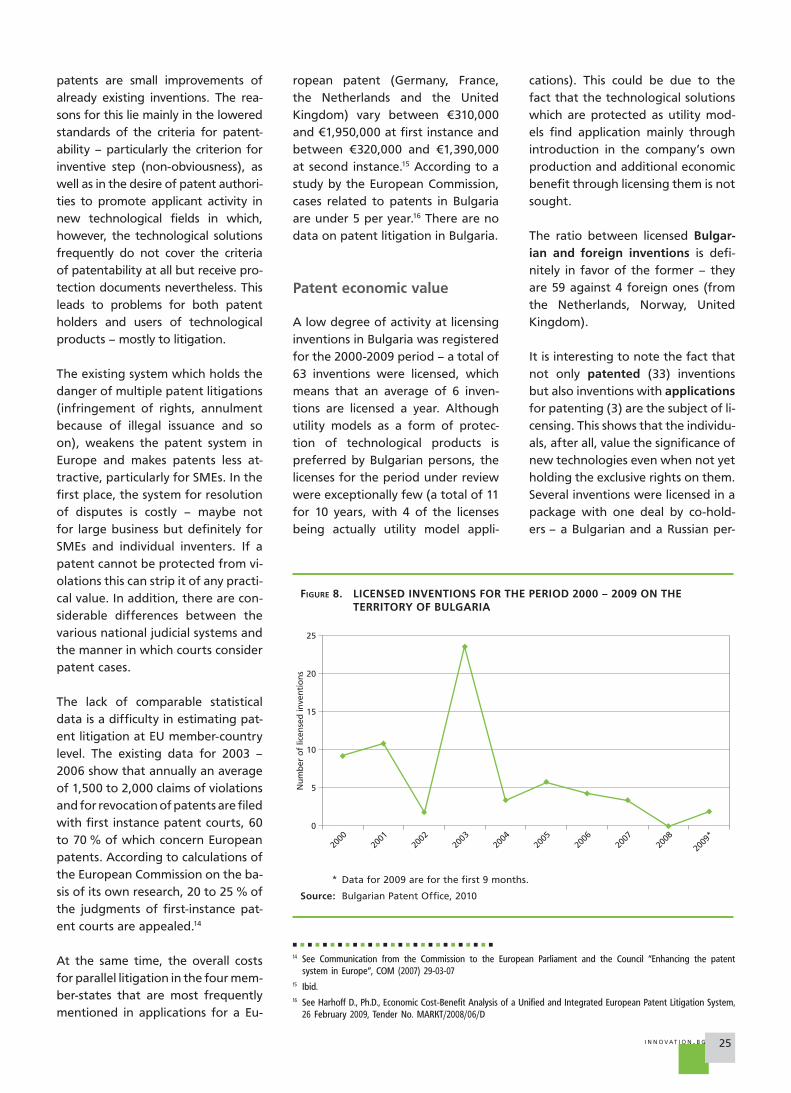
25I N N OVAT I O N . B G
patents are small improvements of
already existing inventions. The rea-
sons for this lie mainly in the lowered
standards of the criteria for patent-
ability – particularly the criterion for
inventive step (non-obviousness), as
well as in the desire of patent authori-
ties to promote applicant activity in
new technological fields in which,
however, the technological solutions
frequently do not cover the criteria
of patentability at all but receive pro-
tection documents nevertheless. This
leads to problems for both patent
holders and users of technological
products – mostly to litigation.
The existing system which holds the
danger of multiple patent litigations
(infringement of rights, annulment
because of illegal issuance and so
on), weakens the patent system in
Europe and makes patents less at-
tractive, particularly for SMEs. In the
first place, the system for resolution
of disputes is costly – maybe not
for large business but definitely for
SMEs and individual inventers. If a
patent cannot be protected from vi-
olations this can strip it of any practi-
cal value. In addition, there are con-
siderable differences between the
various national judicial systems and
the manner in which courts consider
patent cases.
The lack of comparable statistical
data is a difficulty in estimating pat-
ent litigation at EU member-country
level. The existing data for 2003 –
2006 show that annually an average
of 1,500 to 2,000 claims of violations
and for revocation of patents are filed
with first instance patent courts, 60
to 70 % of which concern European
patents. According to calculations of
the European Commission on the ba-
sis of its own research, 20 to 25 % of
the judgments of first-instance pat-
ent courts are appealed.14
At the same time, the overall costs
for parallel litigation in the four mem-
ber-states that are most frequently
mentioned in applications for a Eu-
ropean patent (Germany, France,
the Netherlands and the United
Kingdom) vary between €310,000
and €1,950,000 at first instance and
between €320,000 and €1,390,000
at second instance.15 According to a
study by the European Commission,
cases related to patents in Bulgaria
are under 5 per year.16 There are no
data on patent litigation in Bulgaria.
Patent economic value
A low degree of activity at licensing
inventions in Bulgaria was registered
for the 2000-2009 period – a total of
63 inventions were licensed, which
means that an average of 6 inven-
tions are licensed a year. Although
utility models as a form of protec-
tion of technological products is
preferred by Bulgarian persons, the
licenses for the period under review
were exceptionally few (a total of 11
for 10 years, with 4 of the licenses
being actually utility model appli-
cations). This could be due to the
fact that the technological solutions
which are protected as utility mod-
els find application mainly through
introduction in the company’s own
production and additional economic
benefit through licensing them is not
sought.
The ratio between licensed Bulgar-ian and foreign inventions is defi-
nitely in favor of the former – they
are 59 against 4 foreign ones (from
the Netherlands, Norway, United
Kingdom).
It is interesting to note the fact that
not only patented (33) inventions
but also inventions with applications
for patenting (3) are the subject of li-
censing. This shows that the individu-
als, after all, value the significance of
new technologies even when not yet
holding the exclusive rights on them.
Several inventions were licensed in a
package with one deal by co-hold-
ers – a Bulgarian and a Russian per-
14 See Communication from the Commission to the European Parliament and the Council ”Enhancing the patent system in Europe”, COM (2007) 29-03-07
15 Ibid.16 See Harhoff D., Ph.D., Economic Cost-Benefit Analysis of a Unified and Integrated European Patent Litigation System,
26 February 2009, Tender No. MARKT/2008/06/D
FIGURE 8. LICENSED INVENTIONS FOR THE PERIOD 2000 – 2009 ON THE TERRITORY OF BULGARIA
* Data for 2009 are for the first 9 months.
Source: Bulgarian Patent Office, 2010
0
Nu
mb
er o
f lic
ense
d in
ven
tio
ns
2000
2001
2002
2003
2004
2005
2006
2007
2008
2009
*
5
10
15
20
25
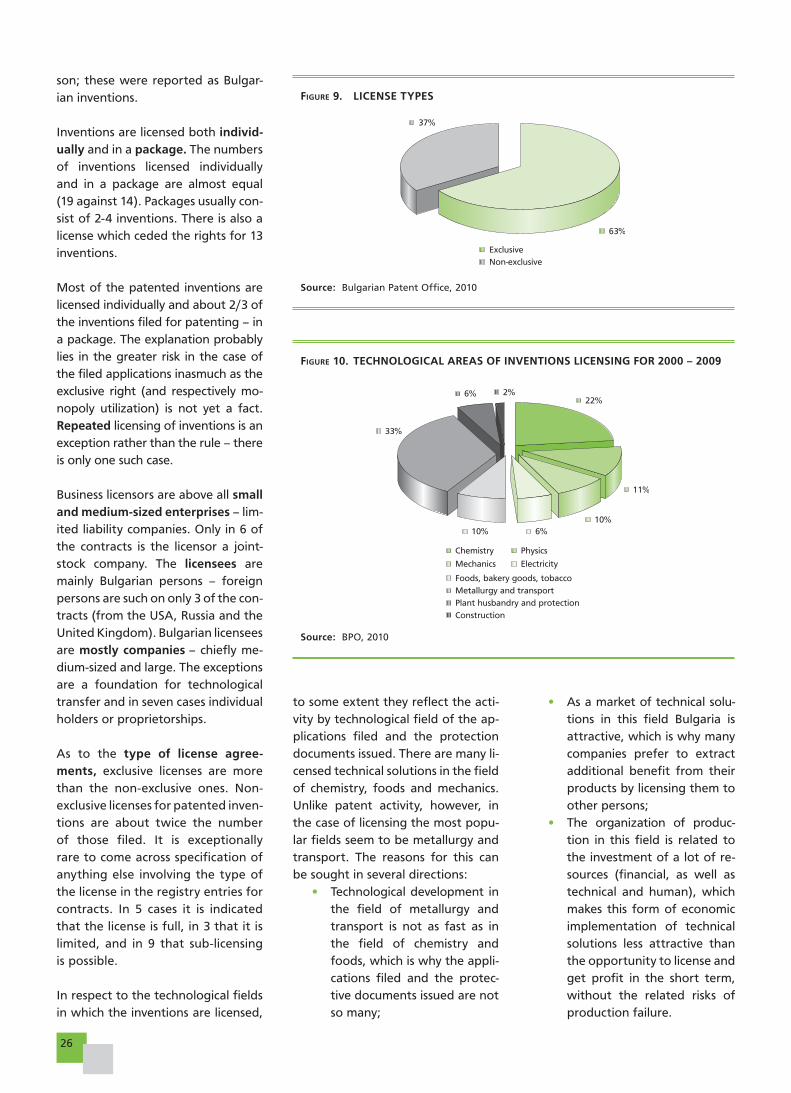
26
son; these were reported as Bulgar-
ian inventions.
Inventions are licensed both individ-ually and in a package. The numbers
of inventions licensed individually
and in a package are almost equal
(19 against 14). Packages usually con-
sist of 2-4 inventions. There is also a
license which ceded the rights for 13
inventions.
Most of the patented inventions are
licensed individually and about 2/3 of
the inventions filed for patenting – in
a package. The explanation probably
lies in the greater risk in the case of
the filed applications inasmuch as the
exclusive right (and respectively mo-
nopoly utilization) is not yet a fact.
Repeated licensing of inventions is an
exception rather than the rule – there
is only one such case.
Business licensors are above all small and medium-sized enterprises – lim-
ited liability companies. Only in 6 of
the contracts is the licensor a joint-
stock company. The licensees are
mainly Bulgarian persons – foreign
persons are such on only 3 of the con-
tracts (from the USA, Russia and the
United Kingdom). Bulgarian licensees
are mostly companies – chiefly me-
dium-sized and large. The exceptions
are a foundation for technological
transfer and in seven cases individual
holders or proprietorships.
As to the type of license agree-ments, exclusive licenses are more
than the non-exclusive ones. Non-
exclusive licenses for patented inven-
tions are about twice the number
of those filed. It is exceptionally
rare to come across specification of
anything else involving the type of
the license in the registry entries for
contracts. In 5 cases it is indicated
that the license is full, in 3 that it is
limited, and in 9 that sub-licensing
is possible.
In respect to the technological fields
in which the inventions are licensed,
FIGURE 9. LICENSE TYPES
Source: Bulgarian Patent Office, 2010
63%
Exclusive
Non-exclusive
37%
FIGURE 10. TECHNOLOGICAL AREAS OF INVENTIONS LICENSING FOR 2000 – 2009
Source: BPO, 2010
6%
Electricity
10%
Mechanics
11%
PhysicsChemistry
Foods, bakery goods, tobacco
10%
Metallurgy and transport
33%
Plant husbandry and protection
Construction
2%22%
6%
to some extent they reflect the acti-
vity by technological field of the ap-
plications filed and the protection
documents issued. There are many li-
censed technical solutions in the field
of chemistry, foods and mechanics.
Unlike patent activity, however, in
the case of licensing the most popu-
lar fields seem to be metallurgy and
transport. The reasons for this can
be sought in several directions:
• Technological development in
the field of metallurgy and
transport is not as fast as in
the field of chemistry and
foods, which is why the appli-
cations filed and the protec-
tive documents issued are not
so many;
• As a market of technical solu-
tions in this field Bulgaria is
attractive, which is why many
companies prefer to extract
additional benefit from their
products by licensing them to
other persons;
• The organization of produc-
tion in this field is related to
the investment of a lot of re-
sources (financial, as well as
technical and human), which
makes this form of economic
implementation of technical
solutions less attractive than
the opportunity to license and
get profit in the short term,
without the related risks of
production failure.
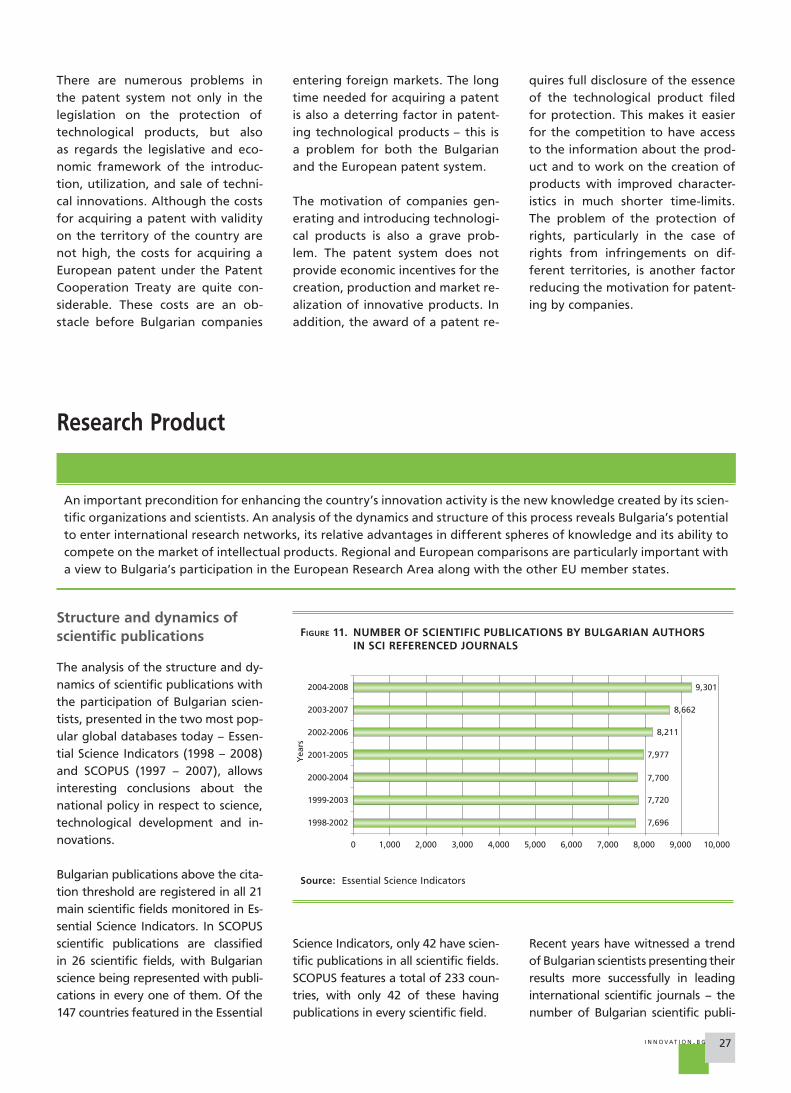
27I N N OVAT I O N . B G
There are numerous problems in
the patent system not only in the
legislation on the protection of
technological products, but also
as regards the legislative and eco-
nomic framework of the introduc-
tion, utilization, and sale of techni-
cal innovations. Although the costs
for acquiring a patent with validity
on the territory of the country are
not high, the costs for acquiring a
European patent under the Patent
Cooperation Treaty are quite con-
siderable. These costs are an ob-
stacle before Bulgarian companies
entering foreign markets. The long
time needed for acquiring a patent
is also a deterring factor in patent-
ing technological products – this is
a problem for both the Bulgarian
and the European patent system.
The motivation of companies gen-
erating and introducing technologi-
cal products is also a grave prob-
lem. The patent system does not
provide economic incentives for the
creation, production and market re-
alization of innovative products. In
addition, the award of a patent re-
quires full disclosure of the essence
of the technological product filed
for protection. This makes it easier
for the competition to have access
to the information about the prod-
uct and to work on the creation of
products with improved character-
istics in much shorter time-limits.
The problem of the protection of
rights, particularly in the case of
rights from infringements on dif-
ferent territories, is another factor
reducing the motivation for patent-
ing by companies.
Research Product
An important precondition for enhancing the country’s innovation activity is the new knowledge created by its scien-
tific organizations and scientists. An analysis of the dynamics and structure of this process reveals Bulgaria’s potential
to enter international research networks, its relative advantages in different spheres of knowledge and its ability to
compete on the market of intellectual products. Regional and European comparisons are particularly important with
a view to Bulgaria’s participation in the European Research Area along with the other EU member states.
Structure and dynamics of scientific publications
The analysis of the structure and dy-
namics of scientific publications with
the participation of Bulgarian scien-
tists, presented in the two most pop-
ular global databases today – Essen-
tial Science Indicators (1998 – 2008)
and SCOPUS (1997 – 2007), allows
interesting conclusions about the
national policy in respect to science,
technological development and in-
novations.
Bulgarian publications above the cita-
tion threshold are registered in all 21
main scientific fields monitored in Es-
sential Science Indicators. In SCOPUS
scientific publications are classified
in 26 scientific fields, with Bulgarian
science being represented with publi-
cations in every one of them. Of the
147 countries featured in the Essential
Science Indicators, only 42 have scien-
tific publications in all scientific fields.
SCOPUS features a total of 233 coun-
tries, with only 42 of these having
publications in every scientific field.
FIGURE 11. NUMBER OF SCIENTIFIC PUBLICATIONS BY BULGARIAN AUTHORS IN SCI REFERENCED JOURNALS
Source: Essential Science Indicators
Recent years have witnessed a trend
of Bulgarian scientists presenting their
results more successfully in leading
international scientific journals – the
number of Bulgarian scientific publi-
1998-2002
1999-2003
2000-2004
2001-2005
2002-2006
2003-2007
2004-2008
0 1,000
Years
2,000 3,000 4,000 5,000 6,000 7,000 8,000 9,000 10,000
9,301
8,211
7,977
7,700
8,662
7,720
7,696
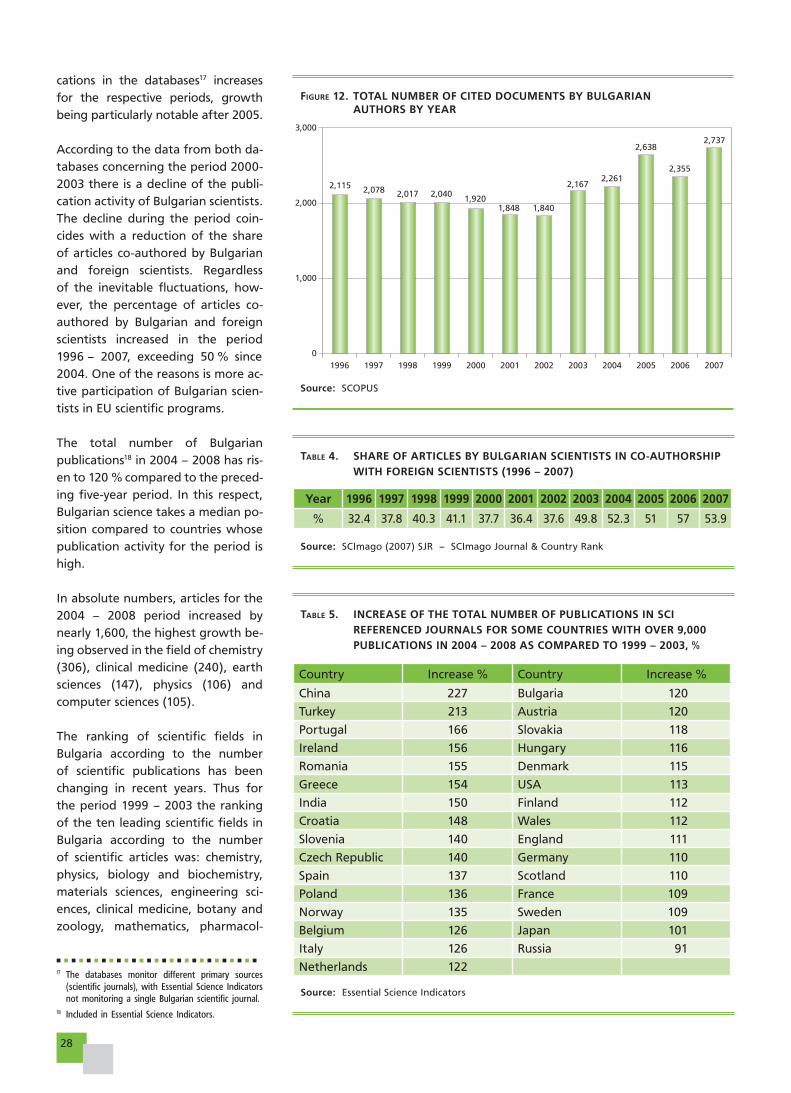
28
TABLE 4. SHARE OF ARTICLES BY BULGARIAN SCIENTISTS IN CO-AUTHORSHIP WITH FOREIGN SCIENTISTS (1996 – 2007)
Source: SCImago (2007) SJR – SCImago Journal & Country Rank
Year 1996 1997 1998 1999 2000 2001 2002 2003 2004 2005 2006 2007
% 32.4 37.8 40.3 41.1 37.7 36.4 37.6 49.8 52.3 51 57 53.9
TABLE 5. INCREASE OF THE TOTAL NUMBER OF PUBLICATIONS IN SCI REFERENCED JOURNALS FOR SOME COUNTRIES WITH OVER 9,000 PUBLICATIONS IN 2004 – 2008 AS COMPARED TO 1999 – 2003, %
Source: Essential Science Indicators
Country Increase % Country Increase %
China 227 Bulgaria 120
Turkey 213 Austria 120
Portugal 166 Slovakia 118
Ireland 156 Hungary 116
Romania 155 Denmark 115
Greece 154 USA 113
India 150 Finland 112
Croatia 148 Wales 112
Slovenia 140 England 111
Czech Republic 140 Germany 110
Spain 137 Scotland 110
Poland 136 France 109
Norway 135 Sweden 109
Belgium 126 Japan 101
Italy 126 Russia 91
Netherlands 122
cations in the databases17 increases
for the respective periods, growth
being particularly notable after 2005.
According to the data from both da-
tabases concerning the period 2000-
2003 there is a decline of the publi-
cation activity of Bulgarian scientists.
The decline during the period coin-
cides with a reduction of the share
of articles co-authored by Bulgarian
and foreign scientists. Regardless
of the inevitable fluctuations, how-
ever, the percentage of articles co-
authored by Bulgarian and foreign
scientists increased in the period
1996 – 2007, exceeding 50 % since
2004. One of the reasons is more ac-
tive participation of Bulgarian scien-
tists in EU scientific programs.
The total number of Bulgarian
publications18 in 2004 – 2008 has ris-
en to 120 % compared to the preced-
ing five-year period. In this respect,
Bulgarian science takes a median po-
sition compared to countries whose
publication activity for the period is
high.
In absolute numbers, articles for the
2004 – 2008 period increased by
nearly 1,600, the highest growth be-
ing observed in the field of chemistry
(306), clinical medicine (240), earth
sciences (147), physics (106) and
computer sciences (105).
The ranking of scientific fields in
Bulgaria according to the number
of scientific publications has been
changing in recent years. Thus for
the period 1999 – 2003 the ranking
of the ten leading scientific fields in
Bulgaria according to the number
of scientific articles was: chemistry,
physics, biology and biochemistry,
materials sciences, engineering sci-
ences, clinical medicine, botany and
zoology, mathematics, pharmacol-
FIGURE 12. TOTAL NUMBER OF CITED DOCUMENTS BY BULGARIAN AUTHORS BY YEAR
Source: SCOPUS
0
1,000
2,000
2,115 2,078 2,017 2,0401,920
1,848 1,840
2,1672,261
2,638
2,355
2,737
3,000
1996 1997 1998 1999 2000 2001 2002 2003 2004 2005 2006 2007
17 The databases monitor different primary sources (scientific journals), with Essential Science Indicators not monitoring a single Bulgarian scientific journal.
18 Included in Essential Science Indicators.
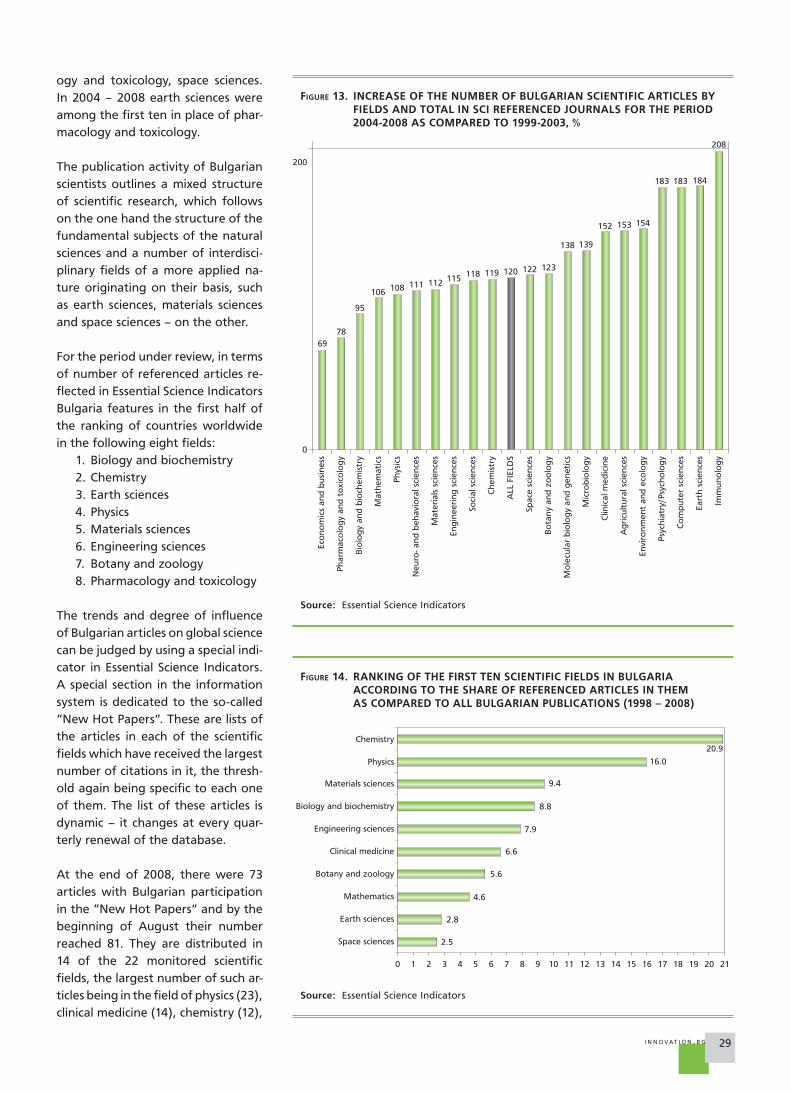
29I N N OVAT I O N . B G
ogy and toxicology, space sciences.
In 2004 – 2008 earth sciences were
among the first ten in place of phar-
macology and toxicology.
The publication activity of Bulgarian
scientists outlines a mixed structure
of scientific research, which follows
on the one hand the structure of the
fundamental subjects of the natural
sciences and a number of interdisci-
plinary fields of a more applied na-
ture originating on their basis, such
as earth sciences, materials sciences
and space sciences – on the other.
For the period under review, in terms
of number of referenced articles re-
flected in Essential Science Indicators
Bulgaria features in the first half of
the ranking of countries worldwide
in the following eight fields:
1. Biology and biochemistry
2. Chemistry
3. Earth sciences
4. Physics
5. Materials sciences
6. Engineering sciences
7. Botany and zoology
8. Pharmacology and toxicology
The trends and degree of influence
of Bulgarian articles on global science
can be judged by using a special indi-
cator in Essential Science Indicators.
A special section in the information
system is dedicated to the so-called
”New Hot Papers”. These are lists of
the articles in each of the scientific
fields which have received the largest
number of citations in it, the thresh-
old again being specific to each one
of them. The list of these articles is
dynamic – it changes at every quar-
terly renewal of the database.
At the end of 2008, there were 73
articles with Bulgarian participation
in the ”New Hot Papers” and by the
beginning of August their number
reached 81. They are distributed in
14 of the 22 monitored scientific
fields, the largest number of such ar-
ticles being in the field of physics (23),
clinical medicine (14), chemistry (12),
FIGURE 13. INCREASE OF THE NUMBER OF BULGARIAN SCIENTIFIC ARTICLES BY FIELDS AND TOTAL IN SCI REFERENCED JOURNALS FOR THE PERIOD 2004-2008 AS COMPARED TO 1999-2003, %
Source: Essential Science Indicators
FIGURE 14. RANKING OF THE FIRST TEN SCIENTIFIC FIELDS IN BULGARIA ACCORDING TO THE SHARE OF REFERENCED ARTICLES IN THEM AS COMPARED TO ALL BULGARIAN PUBLICATIONS (1998 – 2008)
Source: Essential Science Indicators
0
69
78
95
106 108 111 112 115 118 119 120 122 123
138 139
152 153 154
183 183 184
208
200
Eco
no
mic
s an
d b
usi
nes
s
Ph
arm
aco
log
y an
d t
oxi
colo
gy
Bio
log
y an
d b
ioch
emis
try
Mat
hem
atic
s
Ph
ysic
s
Neu
ro- an
d b
ehav
iora
l sci
ence
s
Mat
eria
ls s
cien
ces
Eng
inee
rin
g s
cien
ces
Soci
al s
cien
ces
Ch
emis
try
ALL
FIE
LDS
Spac
e sc
ien
ces
Bo
tan
y an
d z
oo
log
y
Mo
lecu
lar
bio
log
y an
d g
enet
ics
Mic
rob
iolo
gy
Clin
ical
med
icin
e
Ag
ricu
ltu
ral s
cien
ces
Psy
chia
try/
Psy
cho
log
y
Co
mp
ute
r sc
ien
ces
Envi
ron
men
t an
d e
colo
gy
Eart
h s
cien
ces
Imm
un
olo
gy
Space sciences
Earth sciences
Mathematics
Botany and zoology
Clinical medicine
Engineering sciences
Biology and biochemistry
Materials sciences
0 211 2 3 4 5 6 7 8 9 10 11 12 13 14 15 16 17 18 19 20
Chemistry
Physics
2.5
2.8
6.6
7.9
8.8
4.6
5.6
9.4
16.0
20.9
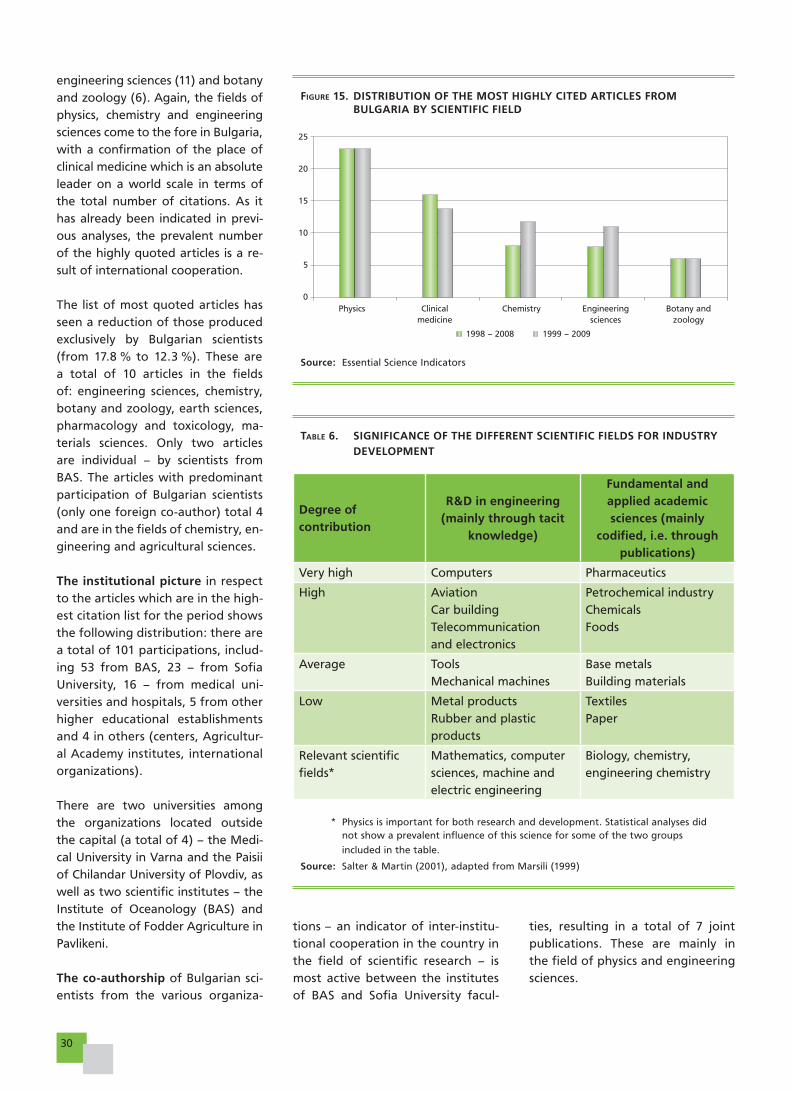
30
TABLE 6. SIGNIFICANCE OF THE DIFFERENT SCIENTIFIC FIELDS FOR INDUSTRY DEVELOPMENT
* Physics is important for both research and development. Statistical analyses did not show a prevalent influence of this science for some of the two groups
included in the table.
Source: Salter & Martin (2001), adapted from Marsili (1999)
Degree of contribution
R&D in engineering (mainly through tacit
knowledge)
Fundamental and applied academic sciences (mainly
codified, i.e. through publications)
Very high Computers Pharmaceutics
High Aviation
Car building
Telecommunication
and electronics
Petrochemical industry
Chemicals
Foods
Average Tools
Mechanical machines
Base metals
Building materials
Low Metal products
Rubber and plastic
products
Textiles
Paper
Relevant scientific
fields*
Mathematics, computer
sciences, machine and
electric engineering
Biology, chemistry,
engineering chemistry
engineering sciences (11) and botany
and zoology (6). Again, the fields of
physics, chemistry and engineering
sciences come to the fore in Bulgaria,
with a confirmation of the place of
clinical medicine which is an absolute
leader on a world scale in terms of
the total number of citations. As it
has already been indicated in previ-
ous analyses, the prevalent number
of the highly quoted articles is a re-
sult of international cooperation.
The list of most quoted articles has
seen a reduction of those produced
exclusively by Bulgarian scientists
(from 17.8 % to 12.3 %). These are
a total of 10 articles in the fields
of: engineering sciences, chemistry,
botany and zoology, earth sciences,
pharmacology and toxicology, ma-
terials sciences. Only two articles
are individual – by scientists from
BAS. The articles with predominant
participation of Bulgarian scientists
(only one foreign co-author) total 4
and are in the fields of chemistry, en-
gineering and agricultural sciences.
The institutional picture in respect
to the articles which are in the high-
est citation list for the period shows
the following distribution: there are
a total of 101 participations, includ-
ing 53 from BAS, 23 – from Sofia
University, 16 – from medical uni-
versities and hospitals, 5 from other
higher educational establishments
and 4 in others (centers, Agricultur-
al Academy institutes, international
organizations).
There are two universities among
the organizations located outside
the capital (a total of 4) – the Medi-
cal University in Varna and the Paisii
of Chilandar University of Plovdiv, as
well as two scientific institutes – the
Institute of Oceanology (BAS) and
the Institute of Fodder Agriculture in
Pavlikeni.
The co-authorship of Bulgarian sci-
entists from the various organiza-
FIGURE 15. DISTRIBUTION OF THE MOST HIGHLY CITED ARTICLES FROM BULGARIA BY SCIENTIFIC FIELD
Source: Essential Science Indicators
1998 – 2008 1999 – 2009
25
20
15
10
5
0Physics Clinical
medicineChemistry Engineering
sciencesBotany and
zoology
tions – an indicator of inter-institu-
tional cooperation in the country in
the field of scientific research – is
most active between the institutes
of BAS and Sofia University facul-
ties, resulting in a total of 7 joint
publications. These are mainly in
the field of physics and engineering
sciences.
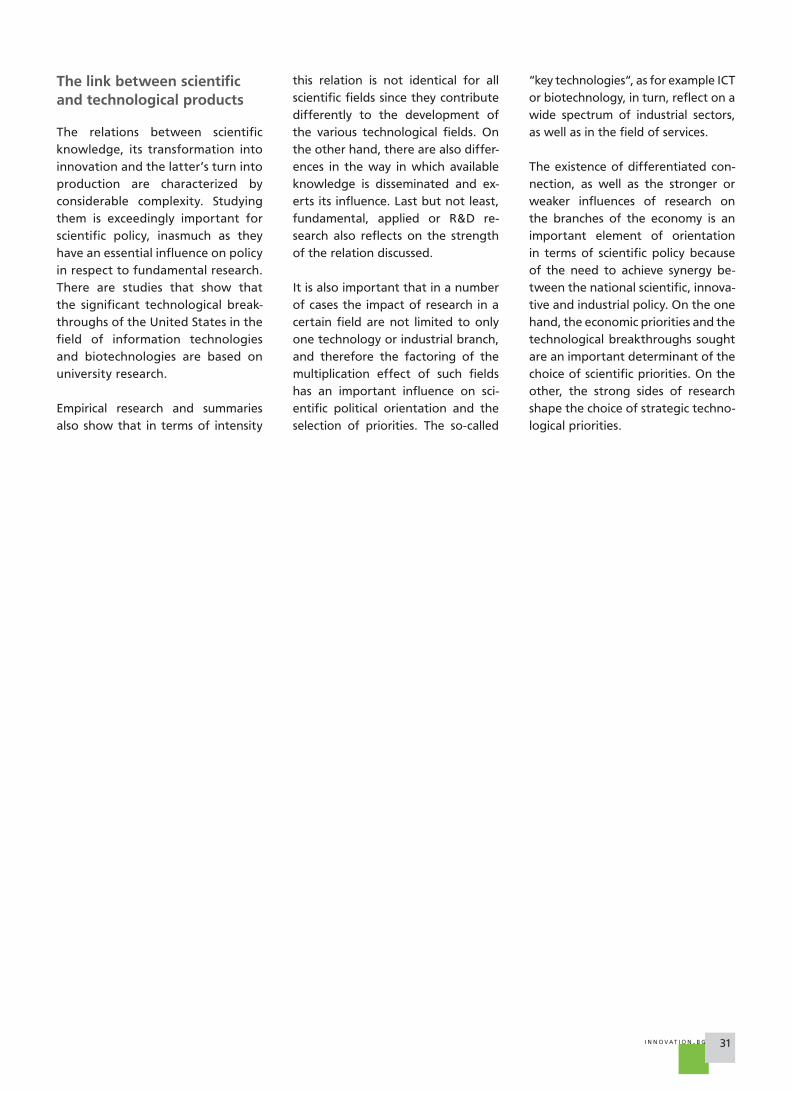
31I N N OVAT I O N . B G
The link between scientific and technological products
The relations between scientific
knowledge, its transformation into
innovation and the latter’s turn into
production are characterized by
considerable complexity. Studying
them is exceedingly important for
scientific policy, inasmuch as they
have an essential influence on policy
in respect to fundamental research.
There are studies that show that
the significant technological break-
throughs of the United States in the
field of information technologies
and biotechnologies are based on
university research.
Empirical research and summaries
also show that in terms of intensity
this relation is not identical for all
scientific fields since they contribute
differently to the development of
the various technological fields. On
the other hand, there are also differ-
ences in the way in which available
knowledge is disseminated and ex-
erts its influence. Last but not least,
fundamental, applied or R&D re-
search also reflects on the strength
of the relation discussed.
It is also important that in a number
of cases the impact of research in a
certain field are not limited to only
one technology or industrial branch,
and therefore the factoring of the
multiplication effect of such fields
has an important influence on sci-
entific political orientation and the
selection of priorities. The so-called
”key technologies”, as for example ICT
or biotechnology, in turn, reflect on a
wide spectrum of industrial sectors,
as well as in the field of services.
The existence of differentiated con-
nection, as well as the stronger or
weaker influences of research on
the branches of the economy is an
important element of orientation
in terms of scientific policy because
of the need to achieve synergy be-
tween the national scientific, innova-
tive and industrial policy. On the one
hand, the economic priorities and the
technological breakthroughs sought
are an important determinant of the
choice of scientific priorities. On the
other, the strong sides of research
shape the choice of strategic techno-
logical priorities.

32
33I N N OVAT I O N . B G
Entrepreneurship
Entrepreneurship is a key driver of innovation-based high productivity and
economic growth. Successful entrepreneurship produces results along three
main lines.19 First, it can increase a company’s productivity by adopting in-
novative technologies or organizational solutions. Second, entrepreneurship
involves the entry into, expansion and sometimes the establishment of new
market niches, which raises the company’s market share, not least by mak-
ing it a part of global value chains. Third, entrepreneurship is linked to the
elimination of old production forms due to the competition of higher pro-
ductivity start-ups that replace existing low productivity companies. In all
three cases entrepreneurship is as an endeavor based on new combinations
and uses of the means and methods of production, the financial and human
resources already present in the economy.20 Product, process, marketing and
organizational innovations are precisely such new combinations,21 while only
occasionally being the direct result of introducing a new invention which has
not existed before.
A crucial feature of the new combinations is that resources must be withdrawn
from the stationary reproduction in the economy, most often in the form of
bank credit which the entrepreneur uses to carry out the new combination.
19 Evaluation of the Finnish National Innovation System. Policy Report, Helsinki University Print, 2009.20 Schumpeter, J., The Theory of Economic Development, Transaction Publishers, New Brunswick, USA & London, UK, 2002.21 Oslo Manual. Guidelines for Collecting and Interpreting Innovation Data 2005. OECD. Schumpeter himself lists
five types of innovation: introduction of new products, introduction of new methods of production, opening of new markets, development of new sources of supply for raw materials or other inputs, creation of new market structures in an industry.

34
Most often, it is innovative start-up firms that will introduce these combina-
tions. After a certain period, some become firmly established on the market
due to their better cost–benefit ratio. This leads to other market actors copy-
ing the successful model and thus diffusing the particular innovation. In the
case of radical innovations – that is, innovations that cause major changes
in previous production methods and/or organization – diffusion can also af-
fect some of the old firms negatively, as they fail to adopt the new combina-
tions. Their market share will gradually shrink and they will be wiped out. On
the other hand, the number and market share of the start-ups and the com-
panies that do adopt the respective innovation or modify it with their own
innovations will grow. This process of ”creative destruction”, as Schumpeter
terms it, constitutes the basis of long-term economic dynamics.
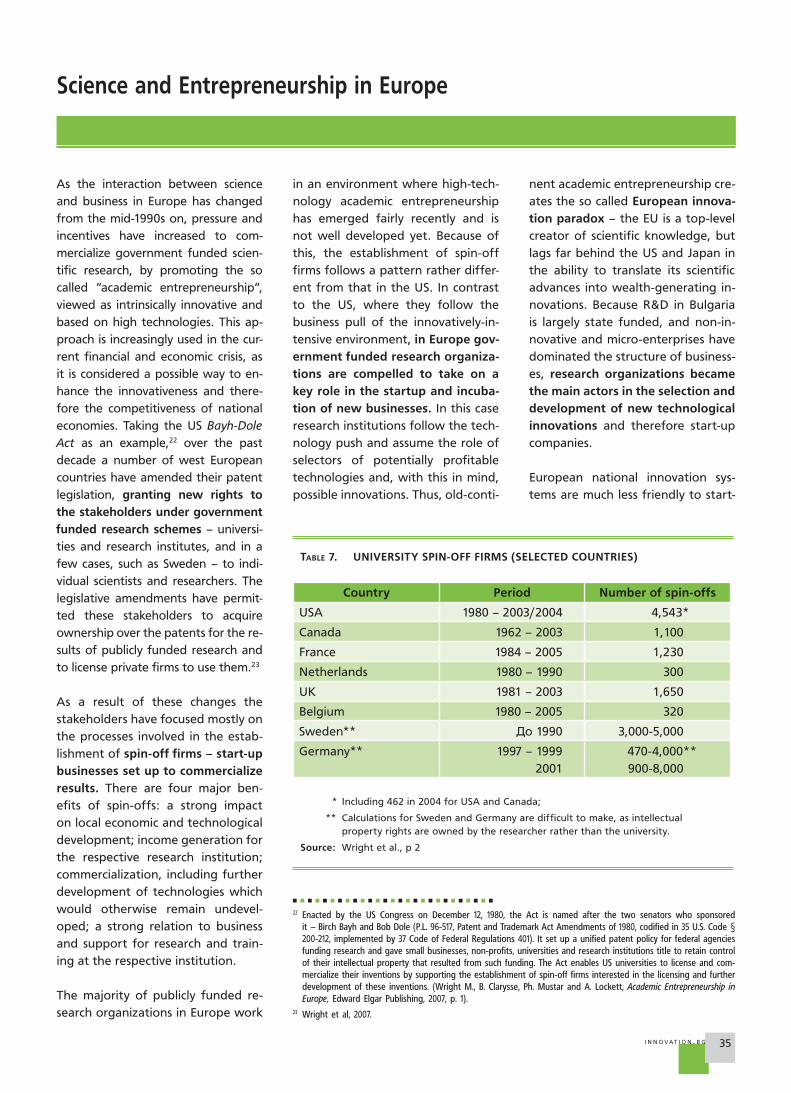
35I N N OVAT I O N . B G
Science and Entrepreneurship in Europe
TABLE 7. UNIVERSITY SPIN-OFF FIRMS (SELECTED COUNTRIES)
* Including 462 in 2004 for USA and Canada;
** Calculations for Sweden and Germany are difficult to make, as intellectual property rights are owned by the researcher rather than the university.
Source: Wright et al., p 2
Country Period Number of spin-offs
USA 1980 – 2003/2004 4,543*
Canada 1962 – 2003 1,100
France 1984 – 2005 1,230
Netherlands 1980 – 1990 300
UK 1981 – 2003 1,650
Belgium 1980 – 2005 320
Sweden** Äî 1990 3,000-5,000
Germany** 1997 – 1999
2001
470-4,000**
900-8,000
As the interaction between science
and business in Europe has changed
from the mid-1990s on, pressure and
incentives have increased to com-
mercialize government funded scien-
tific research, by promoting the so
called ”academic entrepreneurship”,
viewed as intrinsically innovative and
based on high technologies. This ap-
proach is increasingly used in the cur-
rent financial and economic crisis, as
it is considered a possible way to en-
hance the innovativeness and there-
fore the competitiveness of national
economies. Taking the US Bayh-Dole Act as an example,22 over the past
decade a number of west European
countries have amended their patent
legislation, granting new rights to the stakeholders under government funded research schemes – universi-
ties and research institutes, and in a
few cases, such as Sweden – to indi-
vidual scientists and researchers. The
legislative amendments have permit-
ted these stakeholders to acquire
ownership over the patents for the re-
sults of publicly funded research and
to license private firms to use them.23
As a result of these changes the
stakeholders have focused mostly on
the processes involved in the estab-
lishment of spin-off firms – start-up businesses set up to commercialize results. There are four major ben-
efits of spin-offs: a strong impact
on local economic and technological
development; income generation for
the respective research institution;
commercialization, including further
development of technologies which
would otherwise remain undevel-
oped; a strong relation to business
and support for research and train-
ing at the respective institution.
The majority of publicly funded re-
search organizations in Europe work
in an environment where high-tech-
nology academic entrepreneurship
has emerged fairly recently and is
not well developed yet. Because of
this, the establishment of spin-off
firms follows a pattern rather differ-
ent from that in the US. In contrast
to the US, where they follow the
business pull of the innovatively-in-
tensive environment, in Europe gov-ernment funded research organiza-tions are compelled to take on a key role in the startup and incuba-tion of new businesses. In this case
research institutions follow the tech-
nology push and assume the role of
selectors of potentially profitable
technologies and, with this in mind,
possible innovations. Thus, old-conti-
nent academic entrepreneurship cre-
ates the so called European innova-tion paradox – the EU is a top-level
creator of scientific knowledge, but
lags far behind the US and Japan in
the ability to translate its scientific
advances into wealth-generating in-
novations. Because R&D in Bulgaria
is largely state funded, and non-in-
novative and micro-enterprises have
dominated the structure of business-
es, research organizations became the main actors in the selection and development of new technological innovations and therefore start-up
companies.
European national innovation sys-
tems are much less friendly to start-
22 Enacted by the US Congress on December 12, 1980, the Act is named after the two senators who sponsored it – Birch Bayh and Bob Dole (P.L. 96-517, Patent and Trademark Act Amendments of 1980, codified in 35 U.S. Code § 200-212, implemented by 37 Code of Federal Regulations 401). It set up a unified patent policy for federal agencies funding research and gave small businesses, non-profits, universities and research institutions title to retain control of their intellectual property that resulted from such funding. The Act enables US universities to license and com-mercialize their inventions by supporting the establishment of spin-off firms interested in the licensing and further development of these inventions. (Wright M., B. Clarysse, Ph. Mustar and A. Lockett, Academic Entrepreneurship in Europe, Edward Elgar Publishing, 2007, p. 1).
23 Wright et al, 2007.
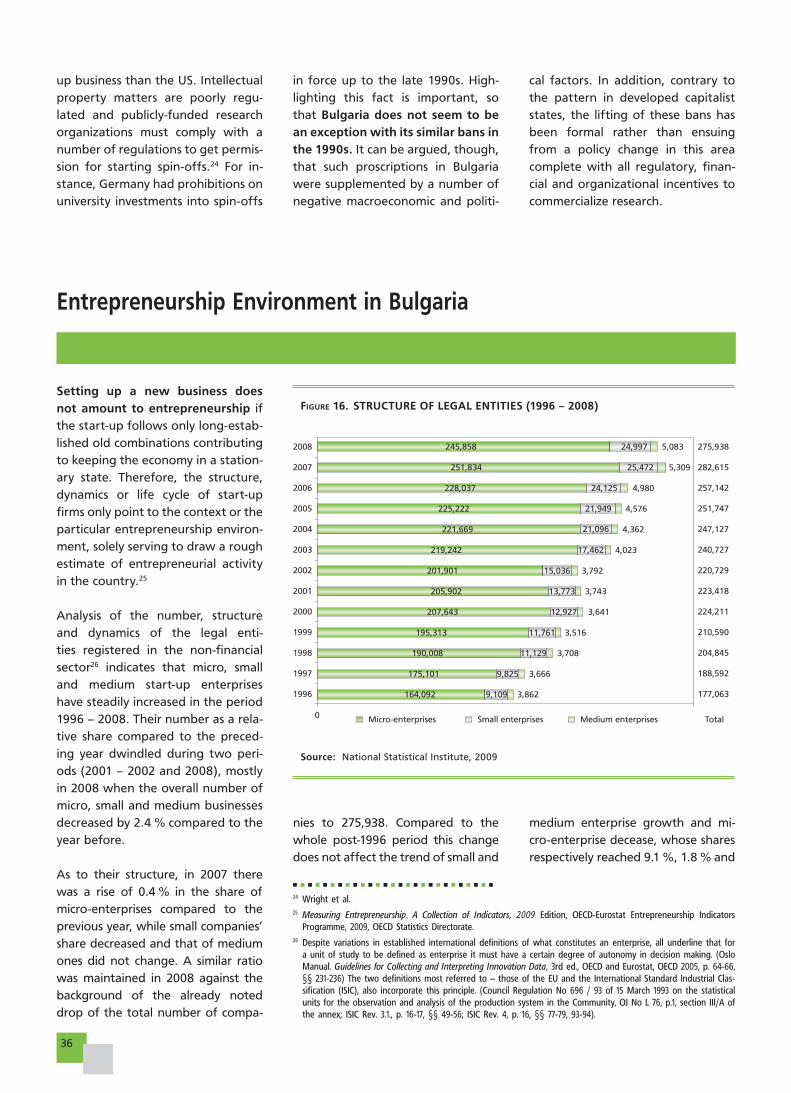
36
FIGURE 16. STRUCTURE OF LEGAL ENTITIES (1996 – 2008)
Source: National Statistical Institute, 2009
Entrepreneurship Environment in Bulgaria
up business than the US. Intellectual
property matters are poorly regu-
lated and publicly-funded research
organizations must comply with a
number of regulations to get permis-
sion for starting spin-offs.24 For in-
stance, Germany had prohibitions on
university investments into spin-offs
in force up to the late 1990s. High-
lighting this fact is important, so
that Bulgaria does not seem to be an exception with its similar bans in the 1990s. It can be argued, though,
that such proscriptions in Bulgaria
were supplemented by a number of
negative macroeconomic and politi-
cal factors. In addition, contrary to
the pattern in developed capitalist
states, the lifting of these bans has
been formal rather than ensuing
from a policy change in this area
complete with all regulatory, finan-
cial and organizational incentives to
commercialize research.
Setting up a new business does not amount to entrepreneurship if
the start-up follows only long-estab-
lished old combinations contributing
to keeping the economy in a station-
ary state. Therefore, the structure,
dynamics or life cycle of start-up
firms only point to the context or the
particular entrepreneurship environ-
ment, solely serving to draw a rough
estimate of entrepreneurial activity
in the country.25
Analysis of the number, structure
and dynamics of the legal enti-
ties registered in the non-financial
sector26 indicates that micro, small
and medium start-up enterprises
have steadily increased in the period
1996 – 2008. Their number as a rela-
tive share compared to the preced-
ing year dwindled during two peri-
ods (2001 – 2002 and 2008), mostly
in 2008 when the overall number of
micro, small and medium businesses
decreased by 2.4 % compared to the
year before.
As to their structure, in 2007 there
was a rise of 0.4 % in the share of
micro-enterprises compared to the
previous year, while small companies’
share decreased and that of medium
ones did not change. A similar ratio
was maintained in 2008 against the
background of the already noted
drop of the total number of compa-
0 Total
1996
1997
1998
1999
2000
2001
2002
2003
2004
2005
2006
2007
2008
177,063
188,592
204,845
210,590
224,211
223,418
220,729
240,727
247,127
251,747
257,142
282,6155,309
5,083 275,938
Medium enterprisesSmall enterprisesMicro-enterprises
245,858 24,997
251,834 25,472
228,037 24,125 4,980
225,222 21,949 4,576
221,669 21,096 4,362
219,242 17,462 4,023
201,901 15,036 3,792
205,902 13,773 3,743
207,643 12,927 3,641
195,313 11,761 3,516
190,008 11,129 3,708
175,101 9,825 3,666
164,092 9,109 3,862
24 Wright et al.25 Measuring Entrepreneurship. A Collection of Indicators, 2009 Edition, OECD-Eurostat Entrepreneurship Indicators
Programme, 2009, OECD Statistics Directorate.26 Despite variations in established international definitions of what constitutes an enterprise, all underline that for
a unit of study to be defined as enterprise it must have a certain degree of autonomy in decision making. (Oslo Manual. Guidelines for Collecting and Interpreting Innovation Data, 3rd ed., OECD and Eurostat, OECD 2005, p. 64-66, §§ 231-236) The two definitions most referred to – those of the EU and the International Standard Industrial Clas-sification (ISIC), also incorporate this principle. (Council Regulation No 696 / 93 of 15 March 1993 on the statistical units for the observation and analysis of the production system in the Community, OJ No L 76, p.1, section III/A of the annex; ISIC Rev. 3.1., p. 16-17, §§ 49-56; ISIC Rev. 4, p. 16, §§ 77-79, 93-94).
nies to 275,938. Compared to the
whole post-1996 period this change
does not affect the trend of small and
medium enterprise growth and mi-
cro-enterprise decease, whose shares
respectively reached 9.1 %, 1.8 % and
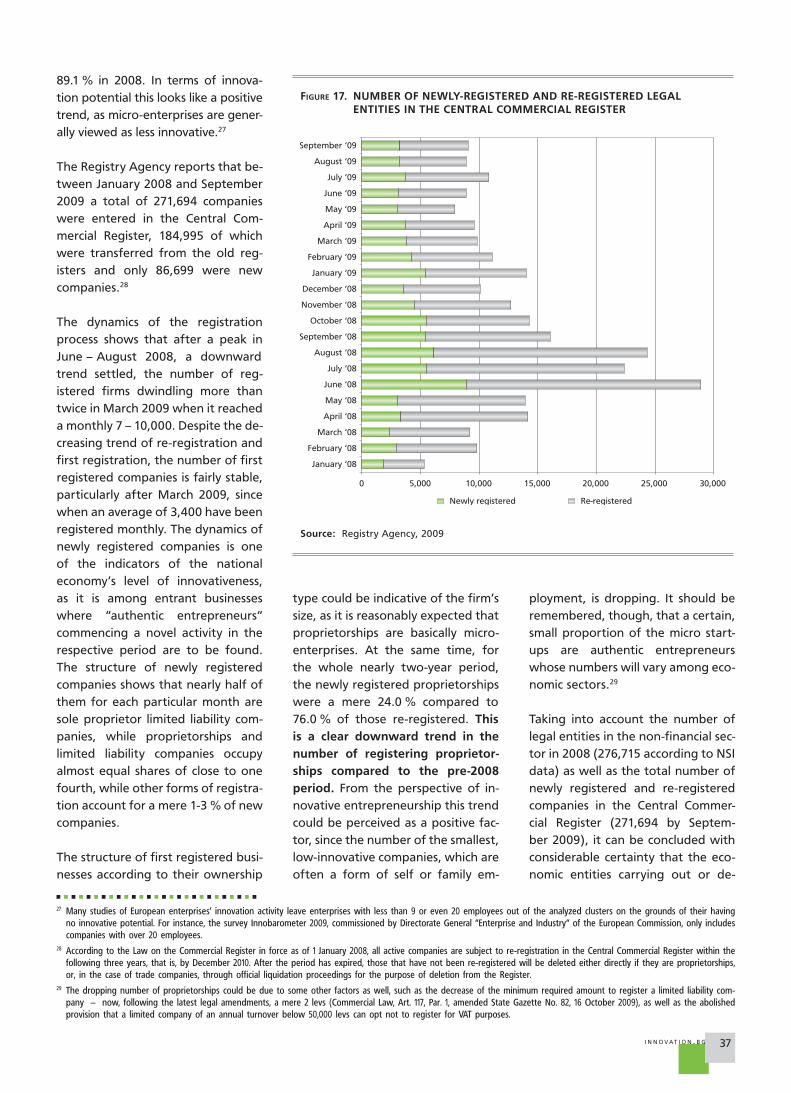
37I N N OVAT I O N . B G
FIGURE 17. NUMBER OF NEWLY-REGISTERED AND RE-REGISTERED LEGAL ENTITIES IN THE CENTRAL COMMERCIAL REGISTER
Source: Registry Agency, 2009
89.1 % in 2008. In terms of innova-
tion potential this looks like a positive
trend, as micro-enterprises are gener-
ally viewed as less innovative.27
The Registry Agency reports that be-
tween January 2008 and September
2009 a total of 271,694 companies
were entered in the Central Com-
mercial Register, 184,995 of which
were transferred from the old reg-
isters and only 86,699 were new
companies.28
The dynamics of the registration
process shows that after a peak in
June – August 2008, a downward
trend settled, the number of reg-
istered firms dwindling more than
twice in March 2009 when it reached
a monthly 7 – 10,000. Despite the de-
creasing trend of re-registration and
first registration, the number of first
registered companies is fairly stable,
particularly after March 2009, since
when an average of 3,400 have been
registered monthly. The dynamics of
newly registered companies is one
of the indicators of the national
economy’s level of innovativeness,
as it is among entrant businesses
where ”authentic entrepreneurs”
commencing a novel activity in the
respective period are to be found.
The structure of newly registered
companies shows that nearly half of
them for each particular month are
sole proprietor limited liability com-
panies, while proprietorships and
limited liability companies occupy
almost equal shares of close to one
fourth, while other forms of registra-
tion account for a mere 1-3 % of new
companies.
The structure of first registered busi-
nesses according to their ownership
0 30,00025,00020,00015,00010,0005,000
Re-registeredNewly registered
January ‘08
February ‘08
March ‘08
April ‘08
May ‘08
June ‘08
July ‘08
August ‘08
September ‘08
October ‘08
November ‘08
December ‘08
January ‘09
February ‘09
March ‘09
April ‘09
May ‘09
June ‘09
July ‘09
August ‘09
September ‘09
27 Many studies of European enterprises’ innovation activity leave enterprises with less than 9 or even 20 employees out of the analyzed clusters on the grounds of their having no innovative potential. For instance, the survey Innobarometer 2009, commissioned by Directorate General ”Enterprise and Industry” of the European Commission, only includes companies with over 20 employees.
28 According to the Law on the Commercial Register in force as of 1 January 2008, all active companies are subject to re-registration in the Central Commercial Register within the following three years, that is, by December 2010. After the period has expired, those that have not been re-registered will be deleted either directly if they are proprietorships, or, in the case of trade companies, through official liquidation proceedings for the purpose of deletion from the Register.
29 The dropping number of proprietorships could be due to some other factors as well, such as the decrease of the minimum required amount to register a limited liability com-pany – now, following the latest legal amendments, a mere 2 levs (Commercial Law, Art. 117, Par. 1, amended State Gazette No. 82, 16 October 2009), as well as the abolished provision that a limited company of an annual turnover below 50,000 levs can opt not to register for VAT purposes.
type could be indicative of the firm’s
size, as it is reasonably expected that
proprietorships are basically micro-
enterprises. At the same time, for
the whole nearly two-year period,
the newly registered proprietorships
were a mere 24.0 % compared to
76.0 % of those re-registered. This is a clear downward trend in the number of registering proprietor-ships compared to the pre-2008 period. From the perspective of in-
novative entrepreneurship this trend
could be perceived as a positive fac-
tor, since the number of the smallest,
low-innovative companies, which are
often a form of self or family em-
ployment, is dropping. It should be
remembered, though, that a certain,
small proportion of the micro start-
ups are authentic entrepreneurs
whose numbers will vary among eco-
nomic sectors.29
Taking into account the number of
legal entities in the non-financial sec-
tor in 2008 (276,715 according to NSI
data) as well as the total number of
newly registered and re-registered
companies in the Central Commer-
cial Register (271,694 by Septem-
ber 2009), it can be concluded with
considerable certainty that the eco-
nomic entities carrying out or de-
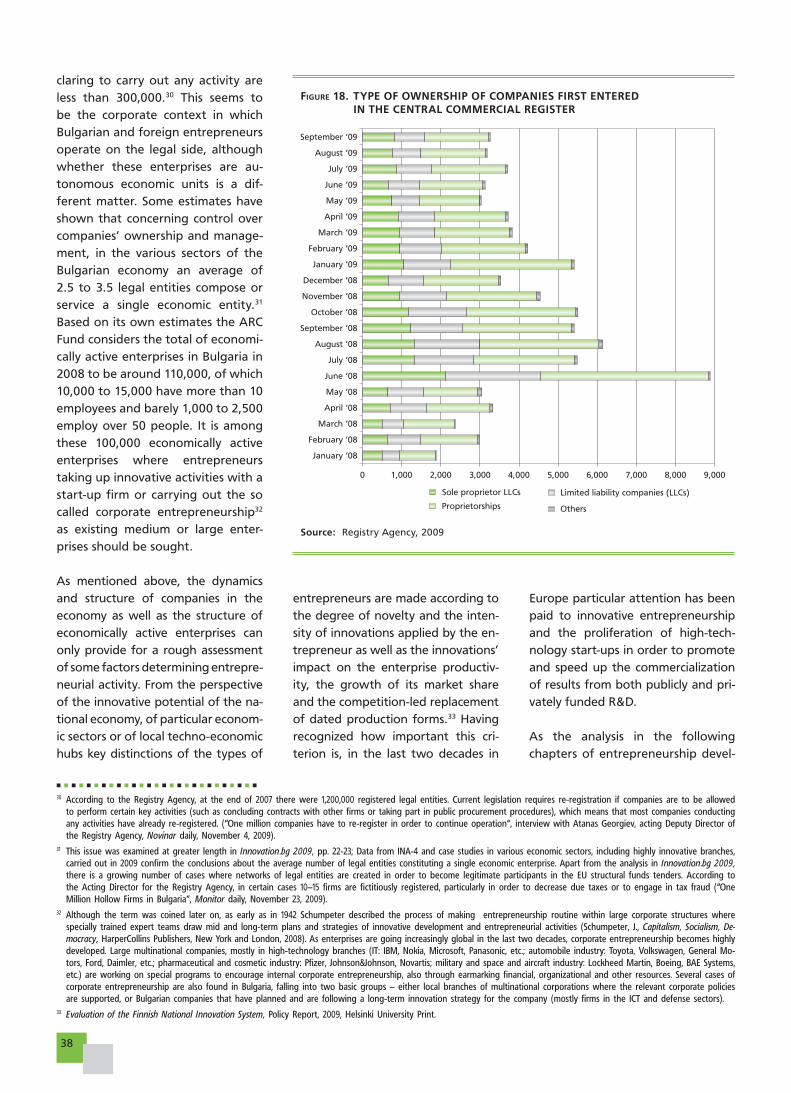
38
FIGURE 18. TYPE OF OWNERSHIP OF COMPANIES FIRST ENTERED IN THE CENTRAL COMMERCIAL REGISTER
Source: Registry Agency, 2009
0 9,0008,0007,0006,0005,0004,0003,0002,0001,000
January ‘08
February ‘08
March ‘08
April ‘08
May ‘08
June ‘08
July ‘08
August ‘08
September ‘08
October ‘08
November ‘08
December ‘08
January ‘09
February ‘09
March ‘09
April ‘09
May ‘09
June ‘09
July ‘09
August ‘09
September ‘09
OthersProprietorships
Limited liability companies (LLCs)Sole proprietor LLCs
claring to carry out any activity are
less than 300,000.30 This seems to
be the corporate context in which
Bulgarian and foreign entrepreneurs
operate on the legal side, although
whether these enterprises are au-
tonomous economic units is a dif-
ferent matter. Some estimates have
shown that concerning control over
companies’ ownership and manage-
ment, in the various sectors of the
Bulgarian economy an average of
2.5 to 3.5 legal entities compose or
service a single economic entity.31
Based on its own estimates the ARC
Fund considers the total of economi-
cally active enterprises in Bulgaria in
2008 to be around 110,000, of which
10,000 to 15,000 have more than 10
employees and barely 1,000 to 2,500
employ over 50 people. It is among
these 100,000 economically active
enterprises where entrepreneurs
taking up innovative activities with a
start-up firm or carrying out the so
called corporate entrepreneurship32
as existing medium or large enter-
prises should be sought.
As mentioned above, the dynamics
and structure of companies in the
economy as well as the structure of
economically active enterprises can
only provide for a rough assessment
of some factors determining entrepre-
neurial activity. From the perspective
of the innovative potential of the na-
tional economy, of particular econom-
ic sectors or of local techno-economic
hubs key distinctions of the types of
entrepreneurs are made according to
the degree of novelty and the inten-
sity of innovations applied by the en-
trepreneur as well as the innovations’
impact on the enterprise productiv-
ity, the growth of its market share
and the competition-led replacement
of dated production forms.33 Having
recognized how important this cri-
terion is, in the last two decades in
Europe particular attention has been
paid to innovative entrepreneurship
and the proliferation of high-tech-
nology start-ups in order to promote
and speed up the commercialization
of results from both publicly and pri-
vately funded R&D.
As the analysis in the following
chapters of entrepreneurship devel-
30 According to the Registry Agency, at the end of 2007 there were 1,200,000 registered legal entities. Current legislation requires re-registration if companies are to be allowed to perform certain key activities (such as concluding contracts with other firms or taking part in public procurement procedures), which means that most companies conducting any activities have already re-registered. (”One million companies have to re-register in order to continue operation”, interview with Atanas Georgiev, acting Deputy Director of the Registry Agency, Novinar daily, November 4, 2009).
31 This issue was examined at greater length in Innovation.bg 2009, pp. 22-23; Data from INA-4 and case studies in various economic sectors, including highly innovative branches, carried out in 2009 confirm the conclusions about the average number of legal entities constituting a single economic enterprise. Apart from the analysis in Innovation.bg 2009, there is a growing number of cases where networks of legal entities are created in order to become legitimate participants in the EU structural funds tenders. According to the Acting Director for the Registry Agency, in certain cases 10–15 firms are fictitiously registered, particularly in order to decrease due taxes or to engage in tax fraud (”One Million Hollow Firms in Bulgaria”, Monitor daily, November 23, 2009).
32 Although the term was coined later on, as early as in 1942 Schumpeter described the process of making entrepreneurship routine within large corporate structures where specially trained expert teams draw mid and long-term plans and strategies of innovative development and entrepreneurial activities (Schumpeter, J., Capitalism, Socialism, De-mocracy, HarperCollins Publishers, New York and London, 2008). As enterprises are going increasingly global in the last two decades, corporate entrepreneurship becomes highly developed. Large multinational companies, mostly in high-technology branches (IT: IBM, Nokia, Microsoft, Panasonic, etc.; automobile industry: Toyota, Volkswagen, General Mo-tors, Ford, Daimler, etc.; pharmaceutical and cosmetic industry: Pfizer, Johnson&Johnson, Novartis; military and space and aircraft industry: Lockheed Martin, Boeing, BAE Systems, etc.) are working on special programs to encourage internal corporate entrepreneurship, also through earmarking financial, organizational and other resources. Several cases of corporate entrepreneurship are also found in Bulgaria, falling into two basic groups – either local branches of multinational corporations where the relevant corporate policies are supported, or Bulgarian companies that have planned and are following a long-term innovation strategy for the company (mostly firms in the ICT and defense sectors).
33 Evaluation of the Finnish National Innovation System, Policy Report, 2009, Helsinki University Print.
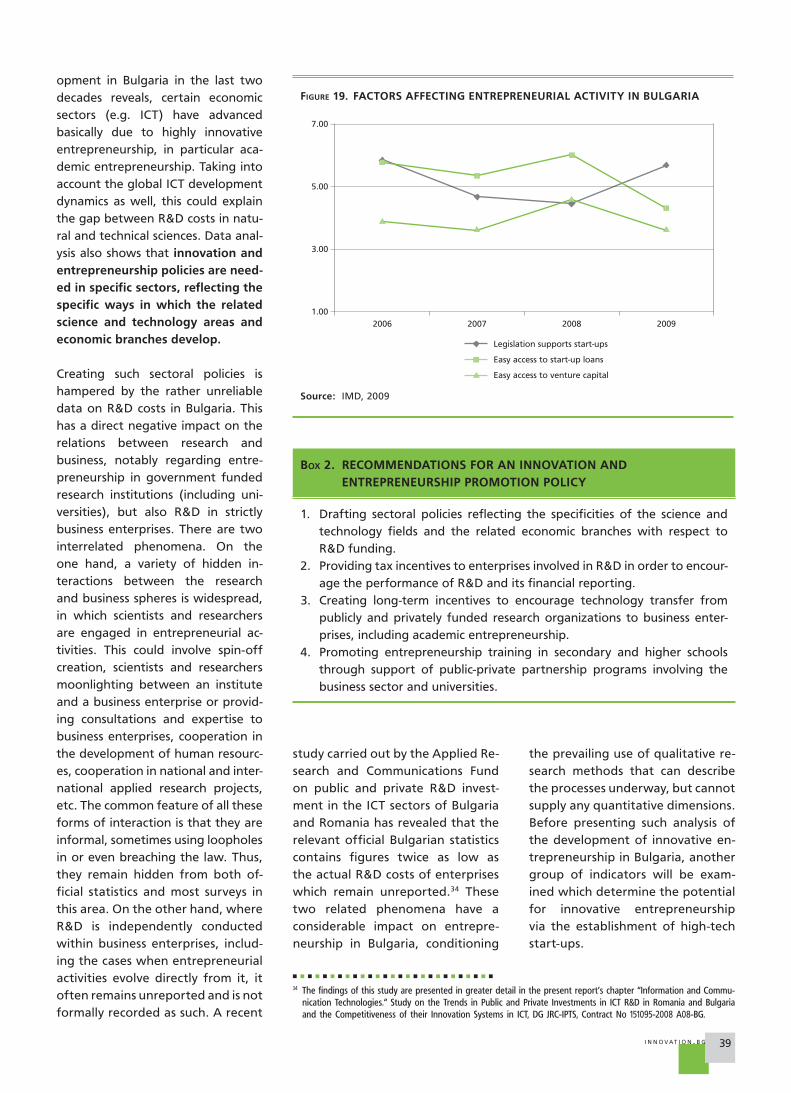
39I N N OVAT I O N . B G
opment in Bulgaria in the last two
decades reveals, certain economic
sectors (e.g. ICT) have advanced
basically due to highly innovative
entrepreneurship, in particular aca-
demic entrepreneurship. Taking into
account the global ICT development
dynamics as well, this could explain
the gap between R&D costs in natu-
ral and technical sciences. Data anal-
ysis also shows that innovation and entrepreneurship policies are need-ed in specific sectors, reflecting the specific ways in which the related science and technology areas and economic branches develop.
Creating such sectoral policies is
hampered by the rather unreliable
data on R&D costs in Bulgaria. This
has a direct negative impact on the
relations between research and
business, notably regarding entre-
preneurship in government funded
research institutions (including uni-
versities), but also R&D in strictly
business enterprises. There are two
interrelated phenomena. On the
one hand, a variety of hidden in-
teractions between the research
and business spheres is widespread,
in which scientists and researchers
are engaged in entrepreneurial ac-
tivities. This could involve spin-off
creation, scientists and researchers
moonlighting between an institute
and a business enterprise or provid-
ing consultations and expertise to
business enterprises, cooperation in
the development of human resourc-
es, cooperation in national and inter-
national applied research projects,
etc. The common feature of all these
forms of interaction is that they are
informal, sometimes using loopholes
in or even breaching the law. Thus,
they remain hidden from both of-
ficial statistics and most surveys in
this area. On the other hand, where
R&D is independently conducted
within business enterprises, includ-
ing the cases when entrepreneurial
activities evolve directly from it, it
often remains unreported and is not
formally recorded as such. A recent
FIGURE 19. FACTORS AFFECTING ENTREPRENEURIAL ACTIVITY IN BULGARIA
Source: IMD, 2009
1.00
7.00
5.00
3.00
2006 2007 2008 2009
Easy access to start-up loans
Legislation supports start-ups
Easy access to venture capital
BOX 2. RECOMMENDATIONS FOR AN INNOVATION AND ENTREPRENEURSHIP PROMOTION POLICY
1. Drafting sectoral policies reflecting the specificities of the science and
technology fields and the related economic branches with respect to
R&D funding.
2. Providing tax incentives to enterprises involved in R&D in order to encour-
age the performance of R&D and its financial reporting.
3. Creating long-term incentives to encourage technology transfer from
publicly and privately funded research organizations to business enter-
prises, including academic entrepreneurship.
4. Promoting entrepreneurship training in secondary and higher schools
through support of public-private partnership programs involving the
business sector and universities.
study carried out by the Applied Re-
search and Communications Fund
on public and private R&D invest-
ment in the ICT sectors of Bulgaria
and Romania has revealed that the
relevant official Bulgarian statistics
contains figures twice as low as
the actual R&D costs of enterprises
which remain unreported.34 These
two related phenomena have a
considerable impact on entrepre-
neurship in Bulgaria, conditioning
the prevailing use of qualitative re-
search methods that can describe
the processes underway, but cannot
supply any quantitative dimensions.
Before presenting such analysis of
the development of innovative en-
trepreneurship in Bulgaria, another
group of indicators will be exam-
ined which determine the potential
for innovative entrepreneurship
via the establishment of high-tech
start-ups.
34 The findings of this study are presented in greater detail in the present report’s chapter ”Information and Commu-nication Technologies.” Study on the Trends in Public and Private Investments in ICT R&D in Romania and Bulgaria and the Competitiveness of their Innovation Systems in ICT, DG JRC-IPTS, Contract No 151095-2008 A08-BG.
40
These are several key factors influ-
encing the environment in which in-
novative entrepreneurship develops
in Bulgaria. A nationally representa-
tive survey conducted in October
2009 by NSI, showed that the en-
terprises having 90 % of the annual
turnover in industry anticipated that
total investments in 2009 would be
37.2 % less compared to 2008.35 In
addition, it predicted an 11.2 % de-
crease of investments in industry for
2010 compared to 2009. Enterprise
managers from the sectors of indus-
try, trade and services considered
the most negative factors on their
activity to be the unstable econom-
ic environment, (over 55 % of en-
terprises), insufficient demand and
financial difficulties.36
According to IMD World Competi-
tiveness Yearbook, in 2009 legislative
support to establishing start-ups in
Bulgaria is stronger in comparison to
2008.37 The same ranking, however,
shows that access to credit – which
according to the neo-Schumpeterian
model of economic development it
is the ultimate factor determining
an entrepreneur’s success – has be-
come more difficult both regarding
bank loans and venture capital spe-
cifically targeted at high-tech entre-
preneurship.
35 Investment Activity in Industry, NSI Business Surveys, October 2009.36 Business Conjuncture, NSI Business Surveys, November 2009.37 IMD World Competitiveness Online 1995-2009 (Updated: May 2009).
41I N N OVAT I O N . B G
Investment and Financingof Innovation
The financing of science, technology and innovation in Bulgaria is an ex-
ample of being unique in an area where uniqueness is of no use. Govern-
ments in other countries have been investing vast resources in the faltering
world economy and making large investments in new research and innova-
tion projects (in the past year a number of European states, the US, Asian
states and Russia increased both public and private R&D spending). Bulgaria,
though, has chosen a different solution:
• budget cutbacks in all areas with no clear idea about the state and
development perspectives of each specific sphere and withholding of
mandatory state payments, resulting in growth of the domestic debt
and compromising of the short-term performance of business;
• investment cuts in science, technology and innovation in addition to
failure of the government to make their development a priority – an-
other way to handicap the Bulgarian economy in the long term.
Research and innovations are high-risk and costly endeavors, but they are
the definitive factor that ensures the growth and competitiveness of modern
economies. Moreover, forgoing innovations is still costlier and is bound to
deepen a country’s lag and cause a loss of valuable human resources, a de-
pendence on foreign investors and a mere low-tech survival.
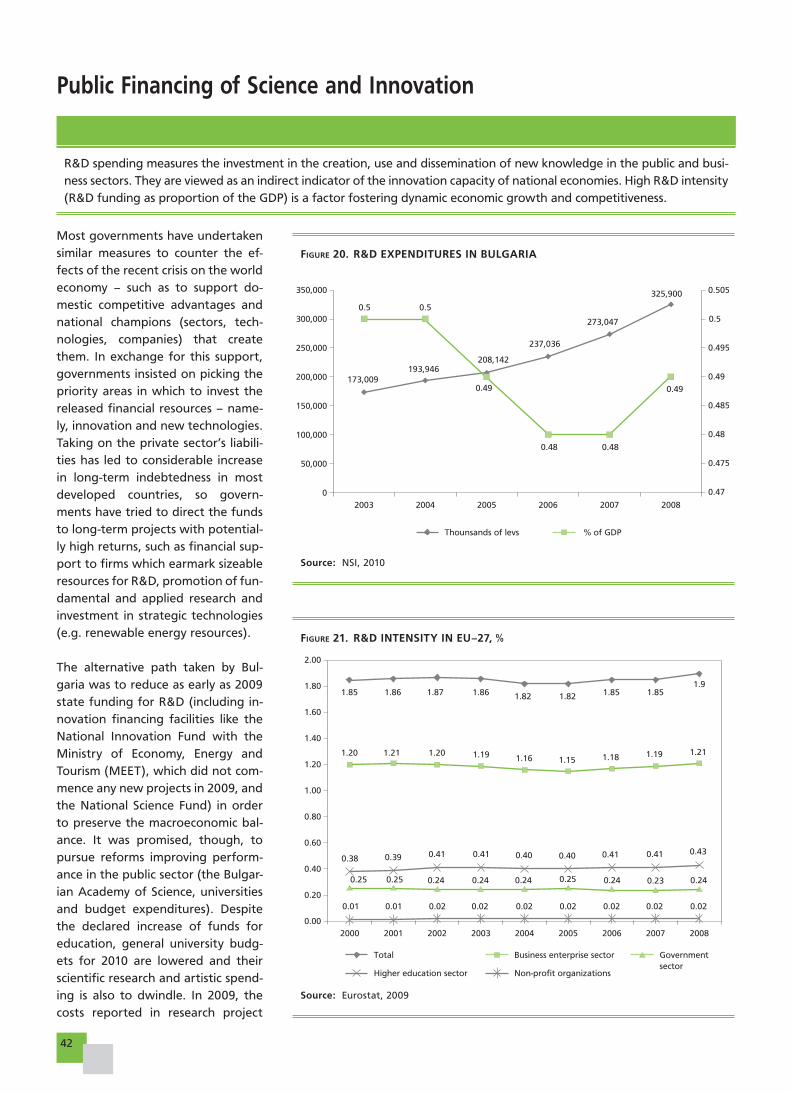
42
Public Financing of Science and Innovation
R&D spending measures the investment in the creation, use and dissemination of new knowledge in the public and busi-
ness sectors. They are viewed as an indirect indicator of the innovation capacity of national economies. High R&D intensity
(R&D funding as proportion of the GDP) is a factor fostering dynamic economic growth and competitiveness.
Most governments have undertaken
similar measures to counter the ef-
fects of the recent crisis on the world
economy – such as to support do-
mestic competitive advantages and
national champions (sectors, tech-
nologies, companies) that create
them. In exchange for this support,
governments insisted on picking the
priority areas in which to invest the
released financial resources – name-
ly, innovation and new technologies.
Taking on the private sector’s liabili-
ties has led to considerable increase
in long-term indebtedness in most
developed countries, so govern-
ments have tried to direct the funds
to long-term projects with potential-
ly high returns, such as financial sup-
port to firms which earmark sizeable
resources for R&D, promotion of fun-
damental and applied research and
investment in strategic technologies
(e.g. renewable energy resources).
The alternative path taken by Bul-
garia was to reduce as early as 2009
state funding for R&D (including in-
novation financing facilities like the
National Innovation Fund with the
Ministry of Economy, Energy and
Tourism (MEET), which did not com-
mence any new projects in 2009, and
the National Science Fund) in order
to preserve the macroeconomic bal-
ance. It was promised, though, to
pursue reforms improving perform-
ance in the public sector (the Bulgar-
ian Academy of Science, universities
and budget expenditures). Despite
the declared increase of funds for
education, general university budg-
ets for 2010 are lowered and their
scientific research and artistic spend-
ing is also to dwindle. In 2009, the
costs reported in research project
FIGURE 20. R&D EXPENDITURES IN BULGARIA
Source: NSI, 2010
0
350,000
300,000
250,000
200,000
150,000
173,009193,946
208,142
237,036
273,047
325,900
100,000
50,000
0.505
0.48
0.48 0.48
0.485
0.49
0.490.49
0.495
0.50.5 0.5
0.47
0.475
20082003 2004 2005 2006 2007
% of GDPThounsands of levs
FIGURE 21. R&D INTENSITY IN EU–27, %
Source: Eurostat, 2009
2008
0.00
2.00
1.801.85
1.20 1.201.21 1.19 1.16 1.15 1.18 1.19 1.21
1.85 1.851.9
1.86 1.86 1.82 1.821.87
1.60
1.40
1.20
1.00
0.80
0.60
0.400.38
0.25
0.01 0.01 0.02 0.02 0.02 0.02 0.02 0.02 0.02
0.25 0.25 0.230.24 0.24 0.24 0.24 0.24
0.39 0.41 0.41 0.41 0.41 0.430.40 0.40
0.20
2000 2001 2002 2003 2004 2005 2006 2007
Business enterprise sectorTotal Governmentsector
Higher education sector Non-profit organizations
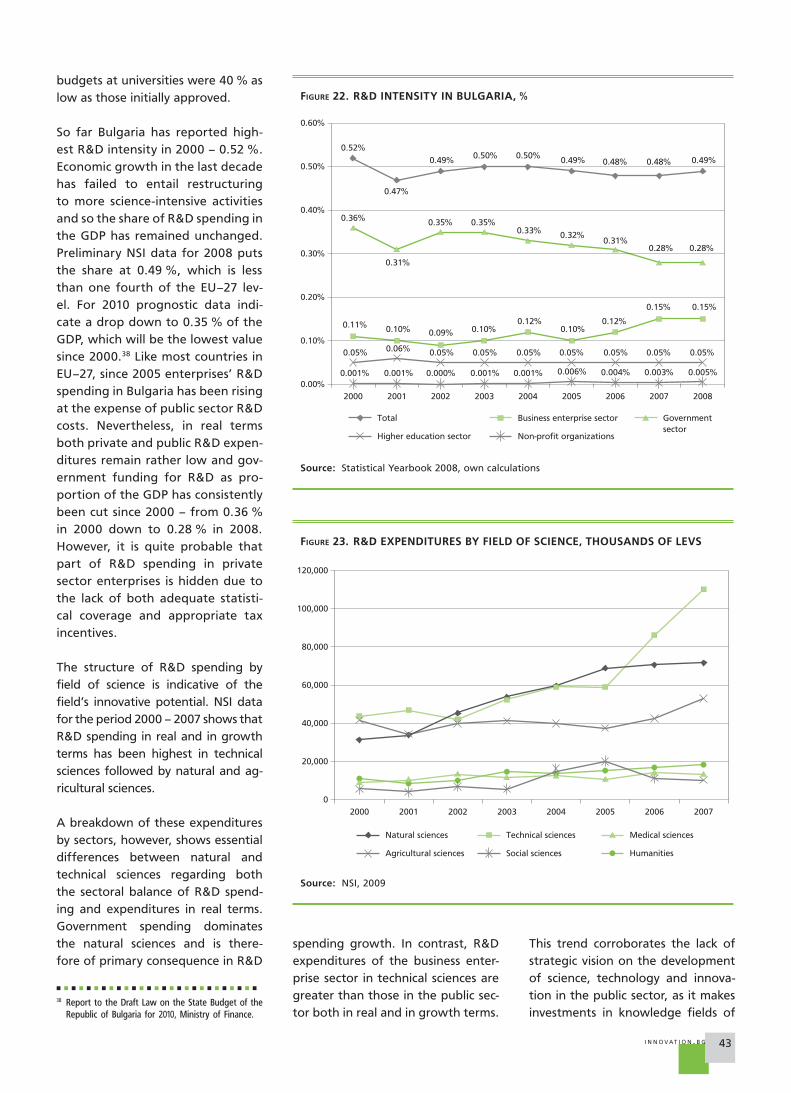
43I N N OVAT I O N . B G
FIGURE 23. R&D EXPENDITURES BY FIELD OF SCIENCE, THOUSANDS OF LEVS
Source: NSI, 2009
0
120,000
100,000
60,000
80,000
40,000
20,000
20072000 2001 2002 2003 2004 2005 2006
Technical sciencesNatural sciences Medical sciences
HumanitiesAgricultural sciences Social sciences
FIGURE 22. R&D INTENSITY IN BULGARIA, %
Source: Statistical Yearbook 2008, own calculations
2008
0.00%
0.60%
0.50%
0.52%
0.36%
0.31%
0.11%
0.05%
0.001% 0.001% 0.001% 0.001% 0.006% 0.004% 0.003% 0.005%0.000%
0.05% 0.05% 0.05% 0.05% 0.05% 0.05% 0.05%0.06%
0.10% 0.10% 0.10%0.12% 0.12%
0.15% 0.15%
0.09%
0.35% 0.35%0.33% 0.32%
0.31%0.28% 0.28%
0.50% 0.50%
0.47%
0.49% 0.49% 0.49%0.48% 0.48%
0.40%
0.30%
0.20%
0.10%
2000 2001 2002 2003 2004 2005 2006 2007
Business enterprise sectorTotal Governmentsector
Higher education sector Non-profit organizations
budgets at universities were 40 % as
low as those initially approved.
So far Bulgaria has reported high-
est R&D intensity in 2000 – 0.52 %.
Economic growth in the last decade
has failed to entail restructuring
to more science-intensive activities
and so the share of R&D spending in
the GDP has remained unchanged.
Preliminary NSI data for 2008 puts
the share at 0.49 %, which is less
than one fourth of the EU–27 lev-
el. For 2010 prognostic data indi-
cate a drop down to 0.35 % of the
GDP, which will be the lowest value
since 2000.38 Like most countries in
EU–27, since 2005 enterprises’ R&D
spending in Bulgaria has been rising
at the expense of public sector R&D
costs. Nevertheless, in real terms
both private and public R&D expen-
ditures remain rather low and gov-
ernment funding for R&D as pro-
portion of the GDP has consistently
been cut since 2000 – from 0.36 %
in 2000 down to 0.28 % in 2008.
However, it is quite probable that
part of R&D spending in private
sector enterprises is hidden due to
the lack of both adequate statisti-
cal coverage and appropriate tax
incentives.
The structure of R&D spending by
field of science is indicative of the
field’s innovative potential. NSI data
for the period 2000 – 2007 shows that
R&D spending in real and in growth
terms has been highest in technical
sciences followed by natural and ag-
ricultural sciences.
A breakdown of these expenditures
by sectors, however, shows essential
differences between natural and
technical sciences regarding both
the sectoral balance of R&D spend-
ing and expenditures in real terms.
Government spending dominates
the natural sciences and is there-
fore of primary consequence in R&D
spending growth. In contrast, R&D
expenditures of the business enter-
prise sector in technical sciences are
greater than those in the public sec-
tor both in real and in growth terms.
This trend corroborates the lack of
strategic vision on the development
of science, technology and innova-
tion in the public sector, as it makes
investments in knowledge fields of 38 Report to the Draft Law on the State Budget of the
Republic of Bulgaria for 2010, Ministry of Finance.
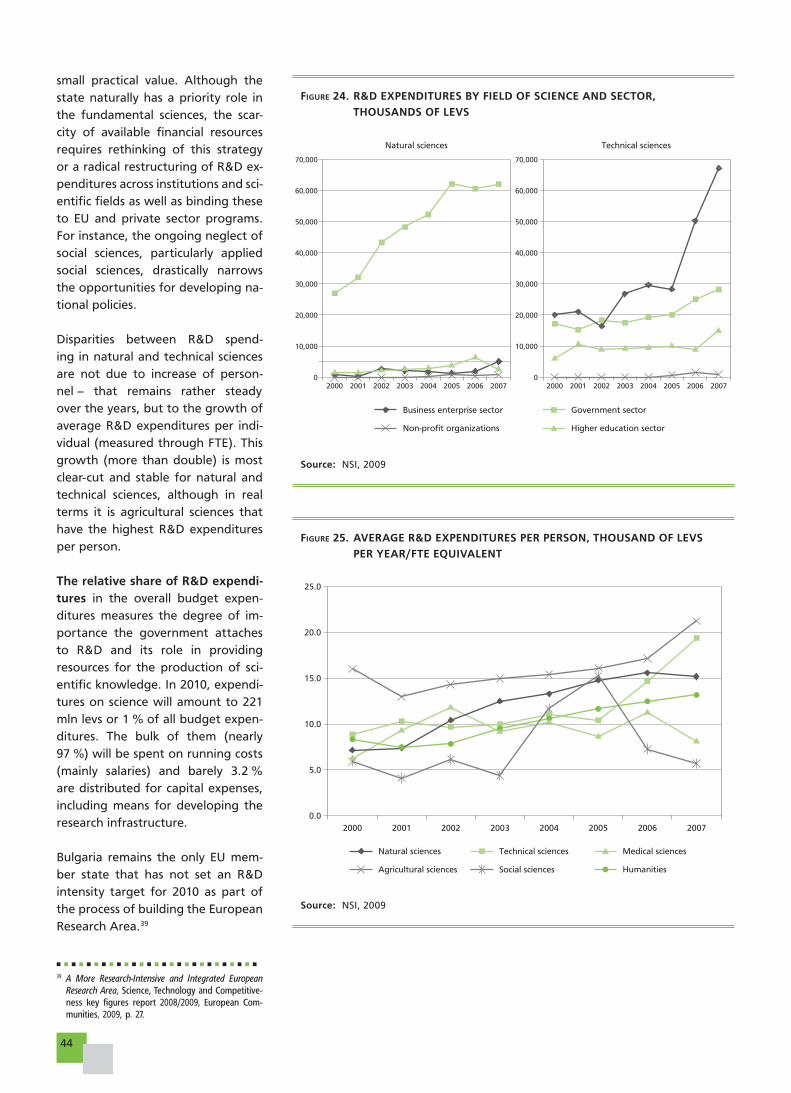
44
FIGURE 24. R&D EXPENDITURES BY FIELD OF SCIENCE AND SECTOR,
THOUSANDS OF LEVS
Source: NSI, 2009
0
70,000
60,000
50,000
40,000
30,000
20,000
10,000
20072000 2001 2002 2003 2004 2005 20060
70,000
60,000
50,000
40,000
30,000
20,000
10,000
20072000 2001 2002 2003 2004 2005 2006
Government sectorBusiness enterprise sector
Higher education sectorNon-profit organizations
Technical sciencesNatural sciences
FIGURE 25. AVERAGE R&D EXPENDITURES PER PERSON, THOUSAND OF LEVS
PER YEAR/FTE EQUIVALENT
Source: NSI, 2009
0.0
25.0
20.0
15.0
10.0
5.0
20072000 2001 2002 2003 2004 2005 2006
Technical sciencesNatural sciences Medical sciences
HumanitiesAgricultural sciences Social sciences
small practical value. Although the
state naturally has a priority role in
the fundamental sciences, the scar-
city of available financial resources
requires rethinking of this strategy
or a radical restructuring of R&D ex-
penditures across institutions and sci-
entific fields as well as binding these
to EU and private sector programs.
For instance, the ongoing neglect of
social sciences, particularly applied
social sciences, drastically narrows
the opportunities for developing na-
tional policies.
Disparities between R&D spend-
ing in natural and technical sciences
are not due to increase of person-
nel – that remains rather steady
over the years, but to the growth of
average R&D expenditures per indi-
vidual (measured through FTE). This
growth (more than double) is most
clear-cut and stable for natural and
technical sciences, although in real
terms it is agricultural sciences that
have the highest R&D expenditures
per person.
The relative share of R&D expendi-tures in the overall budget expen-
ditures measures the degree of im-
portance the government attaches
to R&D and its role in providing
resources for the production of sci-
entific knowledge. In 2010, expendi-
tures on science will amount to 221
mln levs or 1 % of all budget expen-
ditures. The bulk of them (nearly
97 %) will be spent on running costs
(mainly salaries) and barely 3.2 %
are distributed for capital expenses,
including means for developing the
research infrastructure.
Bulgaria remains the only EU mem-
ber state that has not set an R&D
intensity target for 2010 as part of
the process of building the European
Research Area.39
39 A More Research-Intensive and Integrated European Research Area, Science, Technology and Competitive-ness key figures report 2008/2009, European Com-munities, 2009, p. 27.
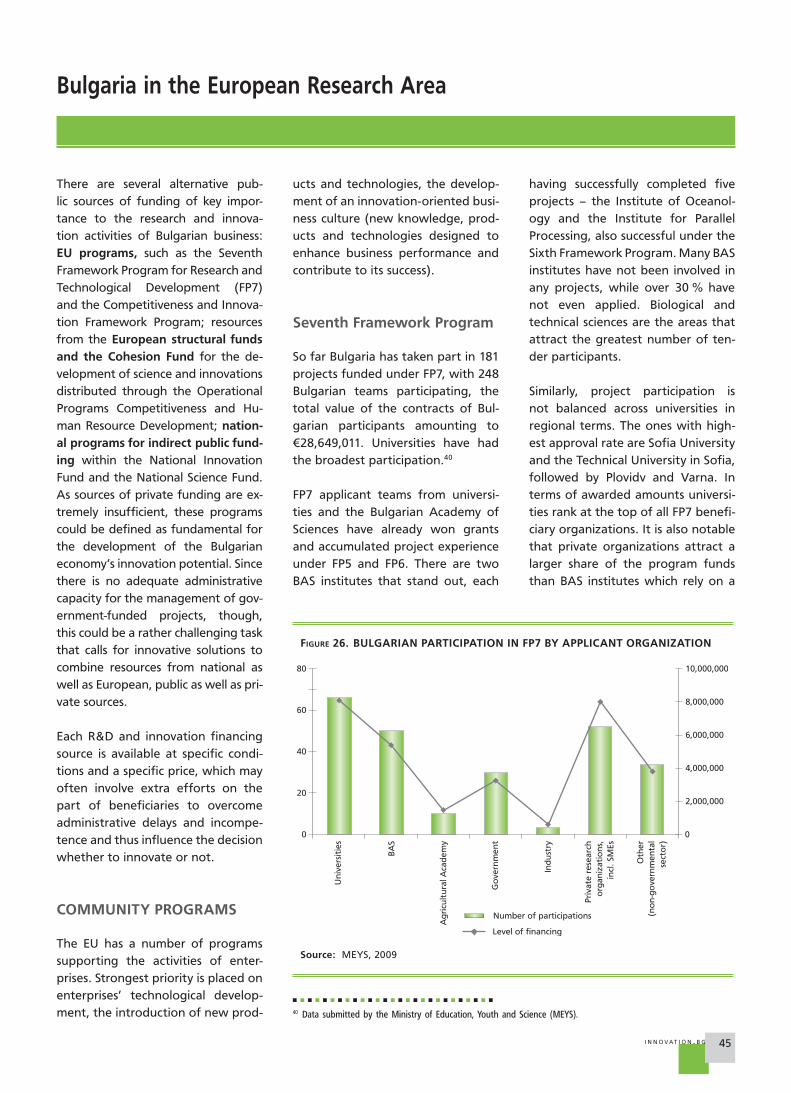
45I N N OVAT I O N . B G
Bulgaria in the European Research Area
There are several alternative pub-
lic sources of funding of key impor-
tance to the research and innova-
tion activities of Bulgarian business:
EU programs, such as the Seventh
Framework Program for Research and
Technological Development (FP7)
and the Competitiveness and Innova-
tion Framework Program; resources
from the European structural funds and the Cohesion Fund for the de-
velopment of science and innovations
distributed through the Operational
Programs Competitiveness and Hu-
man Resource Development; nation-al programs for indirect public fund-ing within the National Innovation
Fund and the National Science Fund.
As sources of private funding are ex-
tremely insufficient, these programs
could be defined as fundamental for
the development of the Bulgarian
economy’s innovation potential. Since
there is no adequate administrative
capacity for the management of gov-
ernment-funded projects, though,
this could be a rather challenging task
that calls for innovative solutions to
combine resources from national as
well as European, public as well as pri-
vate sources.
Each R&D and innovation financing
source is available at specific condi-
tions and a specific price, which may
often involve extra efforts on the
part of beneficiaries to overcome
administrative delays and incompe-
tence and thus influence the decision
whether to innovate or not.
COMMUNITY PROGRAMS
The EU has a number of programs
supporting the activities of enter-
prises. Strongest priority is placed on
enterprises’ technological develop-
ment, the introduction of new prod-
ucts and technologies, the develop-
ment of an innovation-oriented busi-
ness culture (new knowledge, prod-
ucts and technologies designed to
enhance business performance and
contribute to its success).
Seventh Framework Program
So far Bulgaria has taken part in 181
projects funded under FP7, with 248
Bulgarian teams participating, the
total value of the contracts of Bul-
garian participants amounting to
€28,649,011. Universities have had
the broadest participation.40
FP7 applicant teams from universi-
ties and the Bulgarian Academy of
Sciences have already won grants
and accumulated project experience
under FP5 and FP6. There are two
BAS institutes that stand out, each
having successfully completed five
projects – the Institute of Oceanol-
ogy and the Institute for Parallel
Processing, also successful under the
Sixth Framework Program. Many BAS
institutes have not been involved in
any projects, while over 30 % have
not even applied. Biological and
technical sciences are the areas that
attract the greatest number of ten-
der participants.
Similarly, project participation is
not balanced across universities in
regional terms. The ones with high-
est approval rate are Sofia University
and the Technical University in Sofia,
followed by Plovidv and Varna. In
terms of awarded amounts universi-
ties rank at the top of all FP7 benefi-
ciary organizations. It is also notable
that private organizations attract a
larger share of the program funds
than BAS institutes which rely on a
FIGURE 26. BULGARIAN PARTICIPATION IN FP7 BY APPLICANT ORGANIZATION
Source: MEYS, 2009
0
40
60
20
80
0
2,000,000
4,000,000
6,000,000
8,000,000
10,000,000
Un
iver
siti
es
BA
S
Ag
ricu
ltu
ral A
cad
emy
Go
vern
men
t
Ind
ust
ry
Pri
vate
res
earc
ho
rgan
izat
ion
s,in
cl. SM
Es
Oth
er(n
on
-go
vern
men
tal
sect
or)
Level of financing
Number of participations
40 Data submitted by the Ministry of Education, Youth and Science (MEYS).
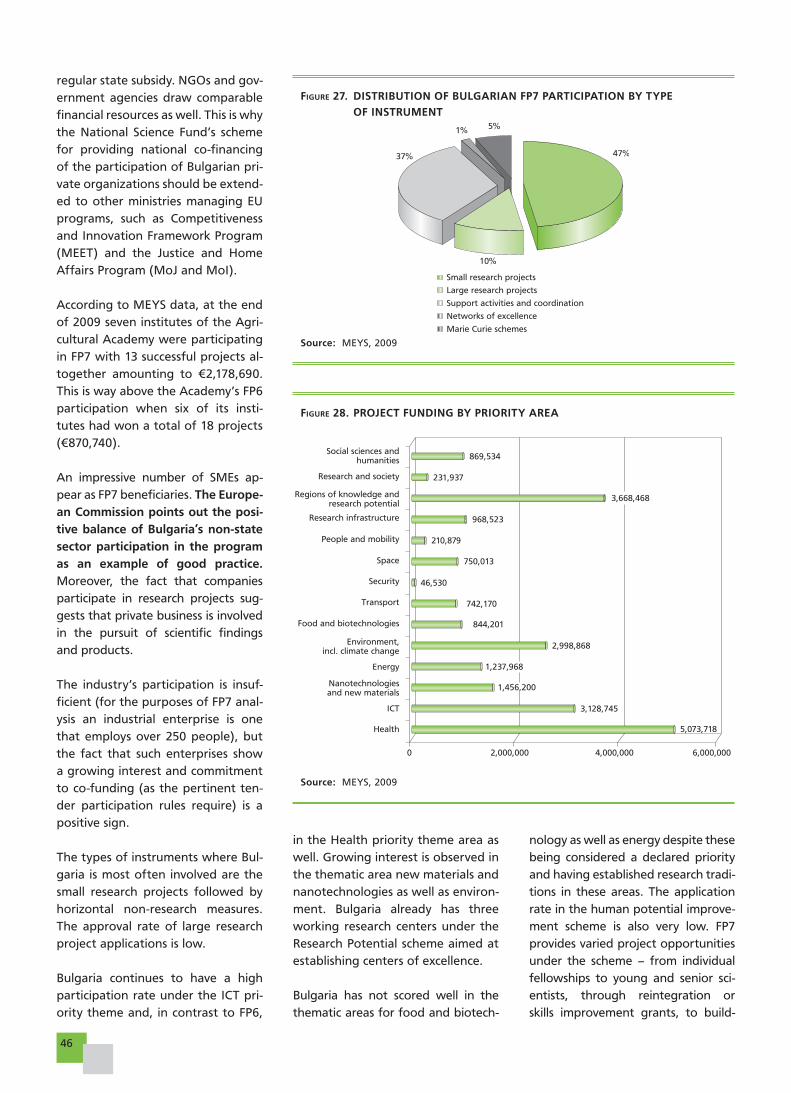
46
regular state subsidy. NGOs and gov-
ernment agencies draw comparable
financial resources as well. This is why
the National Science Fund’s scheme
for providing national co-financing
of the participation of Bulgarian pri-
vate organizations should be extend-
ed to other ministries managing EU
programs, such as Competitiveness
and Innovation Framework Program
(MEET) and the Justice and Home
Affairs Program (MoJ and MoI).
According to MEYS data, at the end
of 2009 seven institutes of the Agri-
cultural Academy were participating
in FP7 with 13 successful projects al-
together amounting to €2,178,690.
This is way above the Academy’s FP6
participation when six of its insti-
tutes had won a total of 18 projects
(€870,740).
An impressive number of SMEs ap-
pear as FP7 beneficiaries. The Europe-an Commission points out the posi-tive balance of Bulgaria’s non-state sector participation in the program as an example of good practice. Moreover, the fact that companies
participate in research projects sug-
gests that private business is involved
in the pursuit of scientific findings
and products.
The industry’s participation is insuf-
ficient (for the purposes of FP7 anal-
ysis an industrial enterprise is one
that employs over 250 people), but
the fact that such enterprises show
a growing interest and commitment
to co-funding (as the pertinent ten-
der participation rules require) is a
positive sign.
The types of instruments where Bul-
garia is most often involved are the
small research projects followed by
horizontal non-research measures.
The approval rate of large research
project applications is low.
Bulgaria continues to have a high
participation rate under the ICT pri-
ority theme and, in contrast to FP6,
FIGURE 27. DISTRIBUTION OF BULGARIAN FP7 PARTICIPATION BY TYPE
OF INSTRUMENT
Source: MEYS, 2009
FIGURE 28. PROJECT FUNDING BY PRIORITY AREA
Source: MEYS, 2009
0 2,000,000 4,000,000 6,000,000
Health
ICT
Nanotechnologiesand new materials
Energy
Environment,incl. climate change
Food and biotechnologies
Transport
Security
Space
People and mobility
Research infrastructure
Regions of knowledge andresearch potential
Research and society
Social sciences andhumanities
3,128,745
1,237,968
844,201
742,170
46,530
750,013
210,879
968,523
231,937
869,534
3,668,468
1,456,200
5,073,718
2,998,868
47%
5%1%
37%
10%
Large research projects
Small research projects
Support activities and coordination
Networks of excellence
Marie Curie schemes
in the Health priority theme area as
well. Growing interest is observed in
the thematic area new materials and
nanotechnologies as well as environ-
ment. Bulgaria already has three
working research centers under the
Research Potential scheme aimed at
establishing centers of excellence.
Bulgaria has not scored well in the
thematic areas for food and biotech-
nology as well as energy despite these
being considered a declared priority
and having established research tradi-
tions in these areas. The application
rate in the human potential improve-
ment scheme is also very low. FP7
provides varied project opportunities
under the scheme – from individual
fellowships to young and senior sci-
entists, through reintegration or
skills improvement grants, to build-
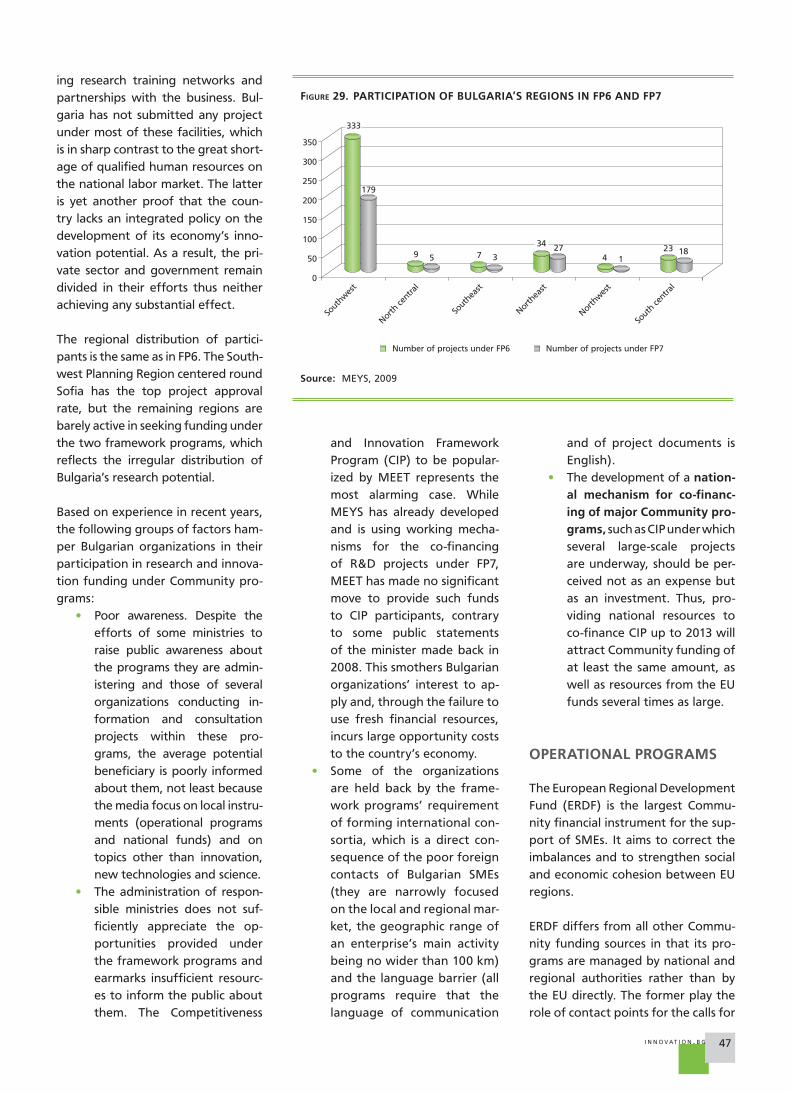
47I N N OVAT I O N . B G
FIGURE 29. PARTICIPATION OF BULGARIA’S REGIONS IN FP6 AND FP7
Source: MEYS, 2009
0
50
100
150
200
250
300
350
333
179
9 5 7 3
34 274 1
23 18
Number of projects under FP7Number of projects under FP6
Sout
hwes
t
Sout
heas
t
North
east
North
wes
t
North
cent
ral
Sout
h ce
ntra
l
ing research training networks and
partnerships with the business. Bul-
garia has not submitted any project
under most of these facilities, which
is in sharp contrast to the great short-
age of qualified human resources on
the national labor market. The latter
is yet another proof that the coun-
try lacks an integrated policy on the
development of its economy’s inno-
vation potential. As a result, the pri-
vate sector and government remain
divided in their efforts thus neither
achieving any substantial effect.
The regional distribution of partici-
pants is the same as in FP6. The South-
west Planning Region centered round
Sofia has the top project approval
rate, but the remaining regions are
barely active in seeking funding under
the two framework programs, which
reflects the irregular distribution of
Bulgaria’s research potential.
Based on experience in recent years,
the following groups of factors ham-
per Bulgarian organizations in their
participation in research and innova-
tion funding under Community pro-
grams:
• Poor awareness. Despite the
efforts of some ministries to
raise public awareness about
the programs they are admin-
istering and those of several
organizations conducting in-
formation and consultation
projects within these pro-
grams, the average potential
beneficiary is poorly informed
about them, not least because
the media focus on local instru-
ments (operational programs
and national funds) and on
topics other than innovation,
new technologies and science.
• The administration of respon-
sible ministries does not suf-
ficiently appreciate the op-
portunities provided under
the framework programs and
earmarks insufficient resourc-
es to inform the public about
them. The Competitiveness
and Innovation Framework
Program (CIP) to be popular-
ized by MEET represents the
most alarming case. While
MEYS has already developed
and is using working mecha-
nisms for the co-financing
of R&D projects under FP7,
MEET has made no significant
move to provide such funds
to CIP participants, contrary
to some public statements
of the minister made back in
2008. This smothers Bulgarian
organizations’ interest to ap-
ply and, through the failure to
use fresh financial resources,
incurs large opportunity costs
to the country’s economy.
• Some of the organizations
are held back by the frame-
work programs’ requirement
of forming international con-
sortia, which is a direct con-
sequence of the poor foreign
contacts of Bulgarian SMEs
(they are narrowly focused
on the local and regional mar-
ket, the geographic range of
an enterprise’s main activity
being no wider than 100 km)
and the language barrier (all
programs require that the
language of communication
and of project documents is
English).
• The development of a nation-al mechanism for co-financ-ing of major Community pro-grams, such as CIP under which
several large-scale projects
are underway, should be per-
ceived not as àn expense but
as an investment. Thus, pro-
viding national resources to
co-finance CIP up to 2013 will
attract Community funding of
at least the same amount, as
well as resources from the EU
funds several times as large.
OPERATIONAL PROGRAMS
The European Regional Development
Fund (ERDF) is the largest Commu-
nity financial instrument for the sup-
port of SMEs. It aims to correct the
imbalances and to strengthen social
and economic cohesion between EU
regions.
ERDF differs from all other Commu-
nity funding sources in that its pro-
grams are managed by national and
regional authorities rather than by
the EU directly. The former play the
role of contact points for the calls for
48
BOX 3. BEST PRACTICES IN EU STRUCTURAL FUNDS ABSORPTION
Accomplishing an innovation project from its initial design, through the search
of a scientific and technical solution of a specific problem, to its final use in
practice involves each of the national innovation system’s units. Whether they
interact successfully is particularly important in today’s global information-de-
pendent society. It is a mandatory condition for being able to work in EU
projects and absorb EU structural funds whose main goal it is to disseminate
best practices and multiply the effect of innovations across the Community.
Innovation projects depend for their success on the ability to formulate a prac-
tice-oriented idea as well as to create organizational and production condi-
tions to implement it. It is the so called ”hard” structures of the innovation
systems – research bodies and the business – that perform the latter function.
”Floating” structures, such as transfer centers and research foundations, how-
ever, are ultimately more important for success, as they provide everything
else – they form and coordinate the research consortia, draw up project docu-
mentation, manage finances, and store and circulate the project know-how.
This is what the PERA innovation centre, located near Leicester, UK, does.
It is registered as an applied research foundation, which is the first in-dispensable condition if an organization is to get 100 % financing for
EU projects. Among PERA’s main functions are project organization and
management under the EU operational programs, including preparation
of research themes, lobbying, team formation, completing CfP documents,
coordination of approved projects, creation of experimental models and
reporting of results. PERA has won projects for €180 mln under FP6, all of
which are run by several project managers – young engineers of manage-
rial excellence.
Point L-Bulgaria Ltd. is the Bulgarian partner in the PERA’s research consortia
in the implementation of the following FP6 and FP7 projects:
– A Novel Laser-Inkjet Hybrid Printing Technology for Additive Printed,
High Resolution, Mass Customised Conductive Copper Tracks (FLEX-
TRONIC) 2005 – 2008;
– À Novel Hybrid Regenerating Filter for Improving Air Quality by Safely
Destroying Biologically Active Airborne Particulates in AgriFood Pro-
duction Operations (VOLTAIR) 2005 – 2008;
– Innovative Design for Wind Energy Capture in Urban Environments
(ROOF-CAPTURE) 2009 – 2011.
The Foundation has formulated a concise presentation of scientific ideas and
the way these would be implemented and benefit the EU (project applicants
get more points for cutting-edge research ideas that could be widely applied
for the public benefit). Drafting such dossiers is the second indispensable condition in securing funding.
It is crucial to attract to the project team a leading research institute from
Europe or another country with top scientific achievements in the tech-
nology field to be researched (this institute could also get 100 % financ-
ing). This is the third important condition to make a successful project
and enable the transfer of breakthrough technologies to PERA (the terms
of CRAFT projects require that the research carried out becomes property of
proposal and the project selection
procedure. Programs are managed
and projects selected at the national
and/or regional level. Bulgaria carries
out ERDF funding via its operational
programs (OP).
Operational programs are replete
with cumbersome administrative
procedures and the responsible bod-
ies do not have the capacity to imple-
ment them. As a result, they barely
manage to spend a small share of
the resources allocated for Bulgaria
under the Fund. Three years after EU
accession, the payments made are
below 2 % of the total operational
programs’ value, with the Competi-
tiveness OP, designed to support
economic innovation, lagging behind
most significantly.
Interest to all OPs is growing as a
consequence of the severe economic
crisis, but so is disappointment by
its actual implementation, as pay-
ments in the first three years have
either been withheld or consider-
ably delayed. This problem should
be tackled via the introduction of
more flexible implementation and
co-financing mechanism (e.g. in-kind
contributions). While in 2007 and
2008 the Bulgarian economy was
not in need of financing under the
EU funds, in 2009 and 2010 these
financial instruments have turned in
one of the few possible sources of
new capital. Thus, due to the crisis,
EU funds – besides their intended
use in modernizing and restructur-
ing the economy – have become a
possible source of liquid assets for
implementing corporate projects.
Since national contributions (from
the state budget or private entities)
are also required but are shrinking
as the crisis goes on, the absorption
of EU funds should be prioritized as
a national strategy; their structure
should be streamlined to fit national
priorities.
As a comprehensive review of all
member states’ achievements is pen-
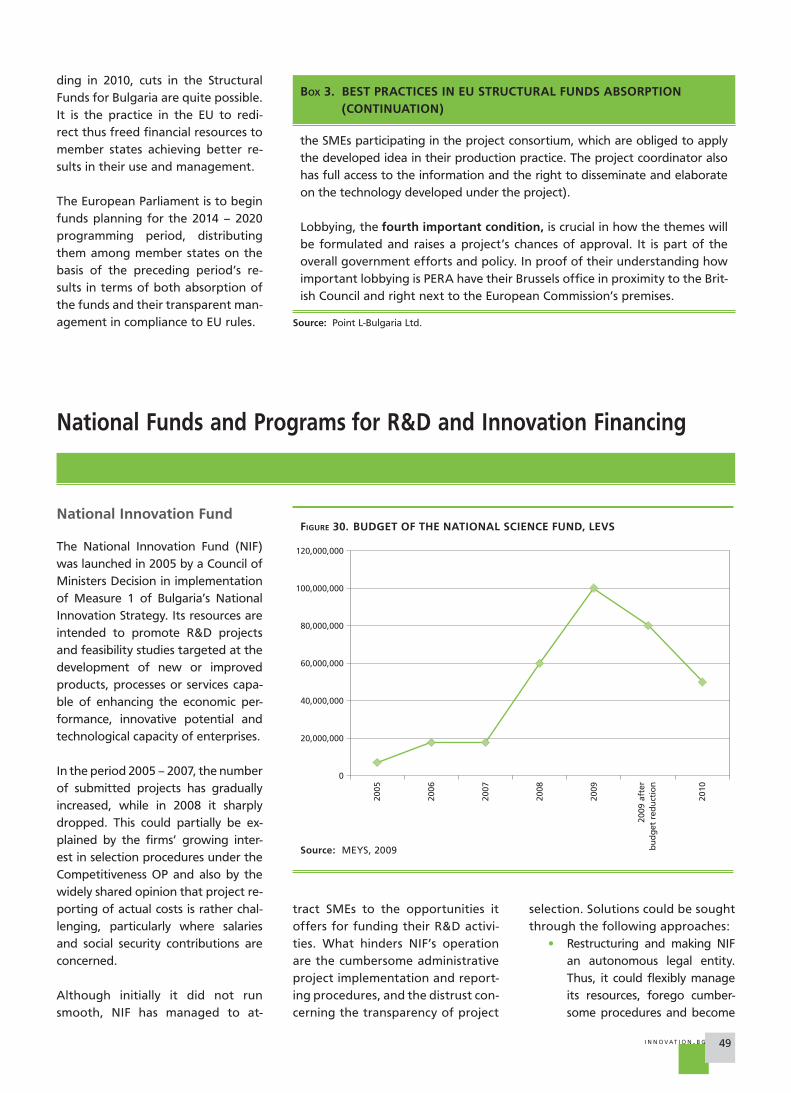
49I N N OVAT I O N . B G
BOX 3. BEST PRACTICES IN EU STRUCTURAL FUNDS ABSORPTION (CONTINUATION)
the SMEs participating in the project consortium, which are obliged to apply
the developed idea in their production practice. The project coordinator also
has full access to the information and the right to disseminate and elaborate
on the technology developed under the project).
Lobbying, the fourth important condition, is crucial in how the themes will
be formulated and raises a project’s chances of approval. It is part of the
overall government efforts and policy. In proof of their understanding how
important lobbying is PERA have their Brussels office in proximity to the Brit-
ish Council and right next to the European Commission’s premises.
Source: Point L-Bulgaria Ltd.
ding in 2010, cuts in the Structural
Funds for Bulgaria are quite possible.
It is the practice in the EU to redi-
rect thus freed financial resources to
member states achieving better re-
sults in their use and management.
The European Parliament is to begin
funds planning for the 2014 – 2020
programming period, distributing
them among member states on the
basis of the preceding period’s re-
sults in terms of both absorption of
the funds and their transparent man-
agement in compliance to EU rules.
National Innovation Fund
The National Innovation Fund (NIF)
was launched in 2005 by a Council of
Ministers Decision in implementation
of Measure 1 of Bulgaria’s National
Innovation Strategy. Its resources are
intended to promote R&D projects
and feasibility studies targeted at the
development of new or improved
products, processes or services capa-
ble of enhancing the economic per-
formance, innovative potential and
technological capacity of enterprises.
In the period 2005 – 2007, the number
of submitted projects has gradually
increased, while in 2008 it sharply
dropped. This could partially be ex-
plained by the firms’ growing inter-
est in selection procedures under the
Competitiveness OP and also by the
widely shared opinion that project re-
porting of actual costs is rather chal-
lenging, particularly where salaries
and social security contributions are
concerned.
Although initially it did not run
smooth, NIF has managed to at-
National Funds and Programs for R&D and Innovation Financing
FIGURE 30. BUDGET OF THE NATIONAL SCIENCE FUND, LEVS
Source: MEYS, 2009
0
20,000,000
40,000,000
60,000,000
80,000,000
100,000,000
120,000,000
2005
2006
2007
2008
2009
2009 a
fter
bu
dg
et r
edu
ctio
n
2010
tract SMEs to the opportunities it
offers for funding their R&D activi-
ties. What hinders NIF’s operation
are the cumbersome administrative
project implementation and report-
ing procedures, and the distrust con-
cerning the transparency of project
selection. Solutions could be sought
through the following approaches:
• Restructuring and making NIF
an autonomous legal entity.
Thus, it could flexibly manage
its resources, forego cumber-
some procedures and become
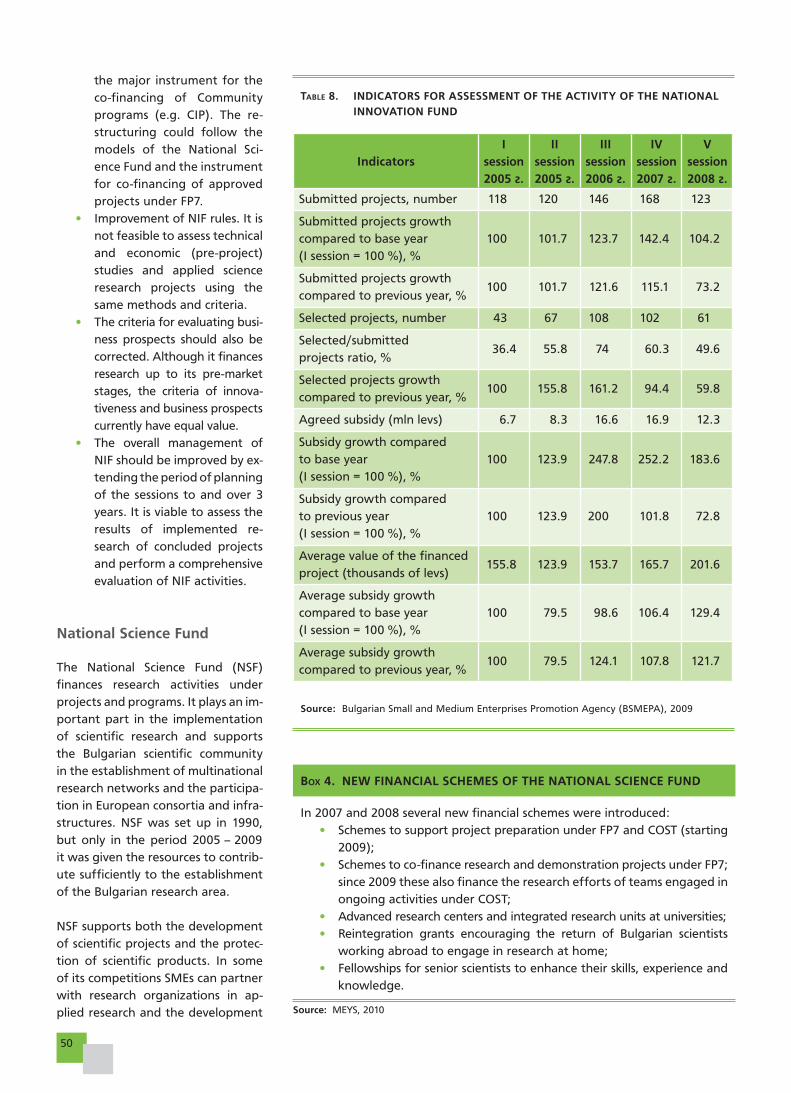
50
BOX 4. NEW FINANCIAL SCHEMES OF THE NATIONAL SCIENCE FUND
In 2007 and 2008 several new financial schemes were introduced:
• Schemes to support project preparation under FP7 and COST (starting
2009);
• Schemes to co-finance research and demonstration projects under FP7;
since 2009 these also finance the research efforts of teams engaged in
ongoing activities under COST;
• Advanced research centers and integrated research units at universities;
• Reintegration grants encouraging the return of Bulgarian scientists
working abroad to engage in research at home;
• Fellowships for senior scientists to enhance their skills, experience and
knowledge.
Source: MEYS, 2010
TABLE 8. INDICATORS FOR ASSESSMENT OF THE ACTIVITY OF THE NATIONAL INNOVATION FUND
Source: Bulgarian Small and Medium Enterprises Promotion Agency (BSMEPA), 2009
IndicatorsI
session2005 ã.
II session2005 ã.
III session2006 ã.
IV session 2007 ã.
V session 2008 ã.
Submitted projects, number 118 120 146 168 123
Submitted projects growth
compared to base year
(I session = 100 %), %
100 101.7 123.7 142.4 104.2
Submitted projects growth
compared to previous year, %100 101.7 121.6 115.1 73.2
Selected projects, number 43 67 108 102 61
Selected/submitted
projects ratio, %36.4 55.8 74 60.3 49.6
Selected projects growth
compared to previous year, %100 155.8 161.2 94.4 59.8
Agreed subsidy (mln levs) 6.7 8.3 16.6 16.9 12.3
Subsidy growth compared
to base year
(I session = 100 %), %
100 123.9 247.8 252.2 183.6
Subsidy growth compared
to previous year
(I session = 100 %), %
100 123.9 200 101.8 72.8
Average value of the financed
project (thousands of levs) 155.8 123.9 153.7 165.7 201.6
Average subsidy growth
compared to base year
(I session = 100 %), %
100 79.5 98.6 106.4 129.4
Average subsidy growth
compared to previous year, %100 79.5 124.1 107.8 121.7
the major instrument for the
co-financing of Community
programs (e.g. CIP). The re-
structuring could follow the
models of the National Sci-
ence Fund and the instrument
for co-financing of approved
projects under FP7.
• Improvement of NIF rules. It is
not feasible to assess technical
and economic (pre-project)
studies and applied science
research projects using the
same methods and criteria.
• The criteria for evaluating busi-
ness prospects should also be
corrected. Although it finances
research up to its pre-market
stages, the criteria of innova-
tiveness and business prospects
currently have equal value.
• The overall management of
NIF should be improved by ex-
tending the period of planning
of the sessions to and over 3
years. It is viable to assess the
results of implemented re-
search of concluded projects
and perform a comprehensive
evaluation of NIF activities.
National Science Fund
The National Science Fund (NSF)
finances research activities under
projects and programs. It plays an im-
portant part in the implementation
of scientific research and supports
the Bulgarian scientific community
in the establishment of multinational
research networks and the participa-
tion in European consortia and infra-
structures. NSF was set up in 1990,
but only in the period 2005 – 2009
it was given the resources to contrib-
ute sufficiently to the establishment
of the Bulgarian research area.
NSF supports both the development
of scientific projects and the protec-
tion of scientific products. In some
of its competitions SMEs can partner
with research organizations in ap-
plied research and the development
51I N N OVAT I O N . B G
of new products. Its instrument for
co-financing FP7 projects is a strong
incentive for the prospective partici-
pation of Bulgarian organizations in
the program.
The highest funding was provided
by NSF in 2008. In 2009, however,
considerable cuts were made which
amounts to reducing public resourc-
es spent through tendering.
Over the period 2005–2007 interna-
tional expertise started to be used
in evaluating project applications to
the NSF without exception. This re-
duced the approval rate from 45 %
in 2005 to 30 % in 2007, but oppor-
tunities were provided to increase
the average funding of projects
and thus enhance the efficiency
and quality of research (in 2005
and 2006 the average per-project
funding was about 20,000 levs,
in 2007 it exceeded 80,000 and
in 2008 reached 250,000 levs). In
2008, the selection procedure was
changed to include a national-level
selection round, which breaches in-
ternational practices of independ-
ent and objective expertise based
on scientific quality. This compro-
mised NSF’s transparency and ef-
fectiveness in 2008 and 2009. It is
necessary to restore the good prac-
tice of international evaluation and
to foreclose the possibility of politi-
cally influenced award decisions.
There are several internationally ap-
plied principles that Bulgaria should
embrace with regard to the pub-
lic funding of R&D and innovation:
project funding should prevail over
institutional funding; resources
should be distributed according to
clearly stated priorities and a mecha-
nism to assess the achieved effects;
the various funding sources should
complement each other where pos-
sible depending on the overall con-
ditions and value of any particular
investment; business investment into
the introduction of new products
and processes should be encour-
aged through a variety of regulatory
mechanisms.

52
53I N N OVAT I O N . B G
Making the most of the potential of modern technology and turning the
country into an attractive destination for foreign investment on the basis
of an advanced high-tech sector (as would seem to be the declared goal of
the Bulgarian government)41 depend on several factors:
• Culture supporting and fostering innovation;
• Knowledge creating the preconditions for implementation of modern
technologies;
• Capacity for mobilization and pursuit of ambitious goals.
All three factors can be regarded as conditional on human capital qualities.
Under the conditions of increasing complexity of technologies, blurred geo-
graphic boundaries and changing values, it is worth noting the additional
need for:
• ”broadband” people – sufficiently open-minded and capable of re-
sponding quickly even to weak external signals and of achieving what
they believe in;
• leaders – either brilliant technocrats or visionary politicians – to put in
place the environment that can help form such broadband people.
In times of economic hardship it is worth asking ourselves: Does Bulgaria pos-
sess such people? What are the limits of their capacity? Will they manage to
take our society into the future? The answers depend on the state of the ed-
ucation system; the quality of the education services; lifelong learning skills;
Human Capital for Innovation
41 Government Program for Bulgaria’s European Development 2009-2013, http://www.government.bg/cgi-bin/e-cms/vis/vis.pl?s=001&p=0233&n=1&g=

54
the pool of highly qualified specialists available to the economy; and
how well their knowledge is put to use in areas of high added value. The
present section considers the progress made under these and other related
indicators, the emerging trends in the past few years, as well as the future
prospects.
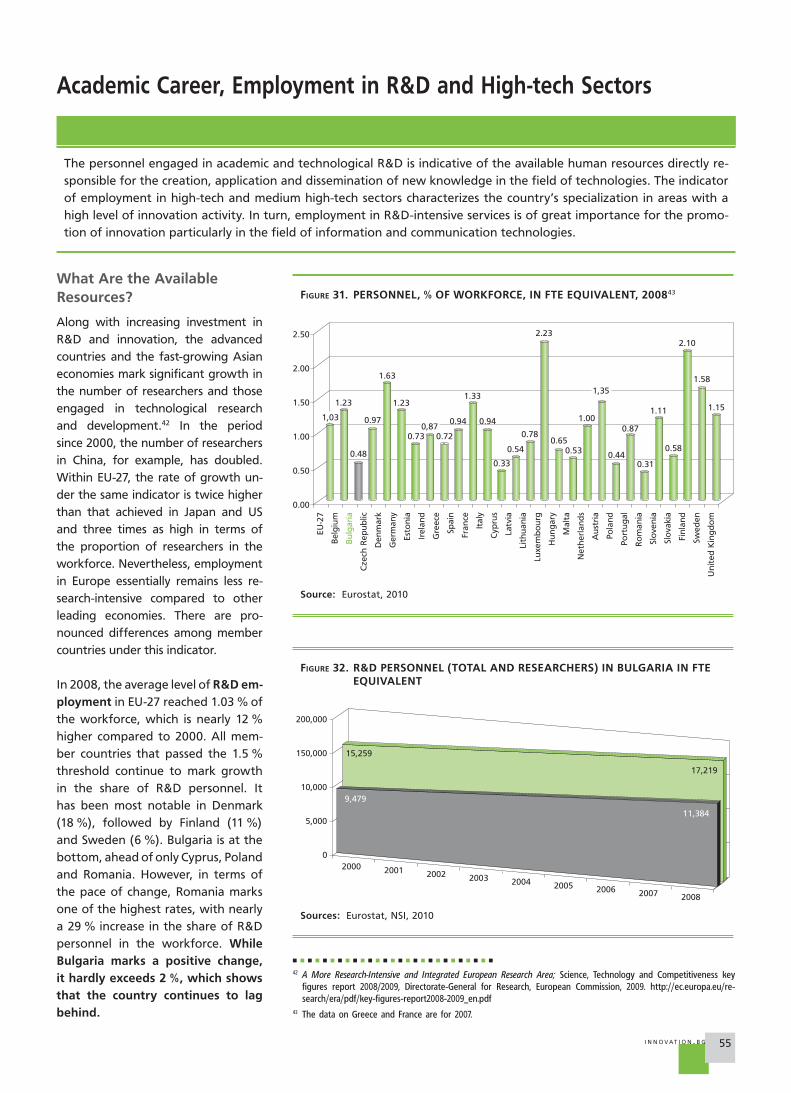
55I N N OVAT I O N . B G
Academic Career, Employment in R&D and High-tech Sectors
The personnel engaged in academic and technological R&D is indicative of the available human resources directly re-
sponsible for the creation, application and dissemination of new knowledge in the field of technologies. The indicator
of employment in high-tech and medium high-tech sectors characterizes the country’s specialization in areas with a
high level of innovation activity. In turn, employment in R&D-intensive services is of great importance for the promo-
tion of innovation particularly in the field of information and communication technologies.
What Are the Available Resources?
Along with increasing investment in
R&D and innovation, the advanced
countries and the fast-growing Asian
economies mark significant growth in
the number of researchers and those
engaged in technological research
and development.42 In the period
since 2000, the number of researchers
in China, for example, has doubled.
Within EU-27, the rate of growth un-
der the same indicator is twice higher
than that achieved in Japan and US
and three times as high in terms of
the proportion of researchers in the
workforce. Nevertheless, employment
in Europe essentially remains less re-
search-intensive compared to other
leading economies. There are pro-
nounced differences among member
countries under this indicator.
In 2008, the average level of R&D em-ployment in EU-27 reached 1.03 % of
the workforce, which is nearly 12 %
higher compared to 2000. All mem-
ber countries that passed the 1.5 %
threshold continue to mark growth
in the share of R&D personnel. It
has been most notable in Denmark
(18 %), followed by Finland (11 %)
and Sweden (6 %). Bulgaria is at the
bottom, ahead of only Cyprus, Poland
and Romania. However, in terms of
the pace of change, Romania marks
one of the highest rates, with nearly
a 29 % increase in the share of R&D
personnel in the workforce. While Bulgaria marks a positive change, it hardly exceeds 2 %, which shows that the country continues to lag behind.
FIGURE 31. PERSONNEL, % OF WORKFORCE, IN FTE EQUIVALENT, 200843
Source: Eurostat, 2010
0.00
0.50
1.00
1,03
1.23
0.48
0.97
1.63
1.231.33
1,351.58
1.15
2.232.10
0.73
0.33
0.54 0.53
0.780.87
0.65
0.440.58
0.31
1.111.000.94 0.94
0.720,87
1.50
2.00
2.50
EU-2
7
Swed
en
Un
ited
Kin
gd
om
Bel
giu
m
Bu
lgar
ia
Cze
ch R
epu
blic
Den
mar
k
Ger
man
y
Esto
nia
Irel
and
Gre
ece
Spai
n
Fran
ce
Ital
y
Cyp
rus
Latv
ia
Lith
uan
ia
Luxe
mb
ou
rg
Hu
ng
ary
Mal
ta
Net
her
lan
ds
Au
stri
a
Po
lan
d
Po
rtu
gal
Ro
man
ia
Slo
ven
ia
Slo
vaki
a
Fin
lan
d
FIGURE 32. R&D PERSONNEL (TOTAL AND RESEARCHERS) IN BULGARIA IN FTE EQUIVALENT
Sources: Eurostat, NSI, 2010
2000 2001 2002 2003 2004 2005 2006 2007 2008
0
5,000
10,000
150,000
200,000
15,259
17,219
11,384
9,479
42 A More Research-Intensive and Integrated European Research Area; Science, Technology and Competitiveness key figures report 2008/2009, Directorate-General for Research, European Commission, 2009. http://ec.europa.eu/re-search/era/pdf/key-figures-report2008-2009_en.pdf
43 The data on Greece and France are for 2007.
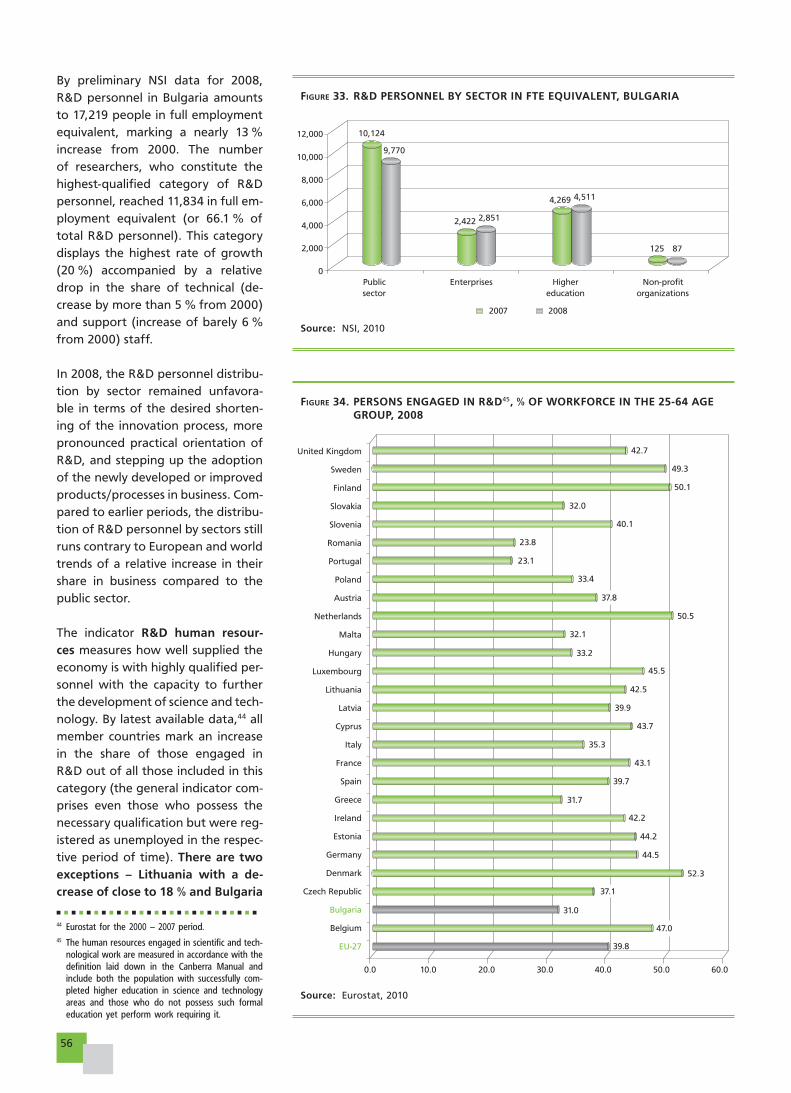
56
By preliminary NSI data for 2008,
R&D personnel in Bulgaria amounts
to 17,219 people in full employment
equivalent, marking a nearly 13 %
increase from 2000. The number
of researchers, who constitute the
highest-qualified category of R&D
personnel, reached 11,834 in full em-
ployment equivalent (or 66.1 % of
total R&D personnel). This category
displays the highest rate of growth
(20 %) accompanied by a relative
drop in the share of technical (de-
crease by more than 5 % from 2000)
and support (increase of barely 6 %
from 2000) staff.
In 2008, the R&D personnel distribu-
tion by sector remained unfavora-
ble in terms of the desired shorten-
ing of the innovation process, more
pronounced practical orientation of
R&D, and stepping up the adoption
of the newly developed or improved
products/processes in business. Com-
pared to earlier periods, the distribu-
tion of R&D personnel by sectors still
runs contrary to European and world
trends of a relative increase in their
share in business compared to the
public sector.
The indicator R&D human resour-ces measures how well supplied the
economy is with highly qualified per-
sonnel with the capacity to further
the development of science and tech-
nology. By latest available data,44 all
member countries mark an increase
in the share of those engaged in
R&D out of all those included in this
category (the general indicator com-
prises even those who possess the
necessary qualification but were reg-
istered as unemployed in the respec-
tive period of time). There are two exceptions – Lithuania with a de-crease of close to 18 % and Bulgaria
FIGURE 33. R&D PERSONNEL BY SECTOR IN FTE EQUIVALENT, BULGARIA
Source: NSI, 2010
FIGURE 34. PERSONS ENGAGED IN R&D45, % OF WORKFORCE IN THE 25-64 AGE GROUP, 2008
Source: Eurostat, 2010
0.0 10.0 20.0 30.0 40.0
44.5
44.2
42.2
39.8
47.0
31.0
31.7
35.3
39.7
39.9
43.1
42.5
33.2
37.8
40.1
42.7
32.0
33.4
23.1
23.8
32.1
45.5
50.5
50.1
49.3
43.7
37.1
60.050.0
52.3
EU-27
Belgium
Bulgaria
Czech Republic
Denmark
Germany
Estonia
Ireland
Greece
Spain
France
Italy
Cyprus
Latvia
Lithuania
Luxembourg
Hungary
Malta
Netherlands
Austria
Poland
Portugal
Romania
Slovenia
Slovakia
Finland
Sweden
United Kingdom
0
10,124
9,770
2,422 2,851
4,269 4,511
125 87
10,000
12,000
8,000
6,000
4,000
2,000
2008
Publicsector
Enterprises Highereducation
Non-profitorganizations
2007
44 Eurostat for the 2000 – 2007 period.45 The human resources engaged in scientific and tech-
nological work are measured in accordance with the definition laid down in the Canberra Manual and include both the population with successfully com-pleted higher education in science and technology areas and those who do not possess such formal education yet perform work requiring it.
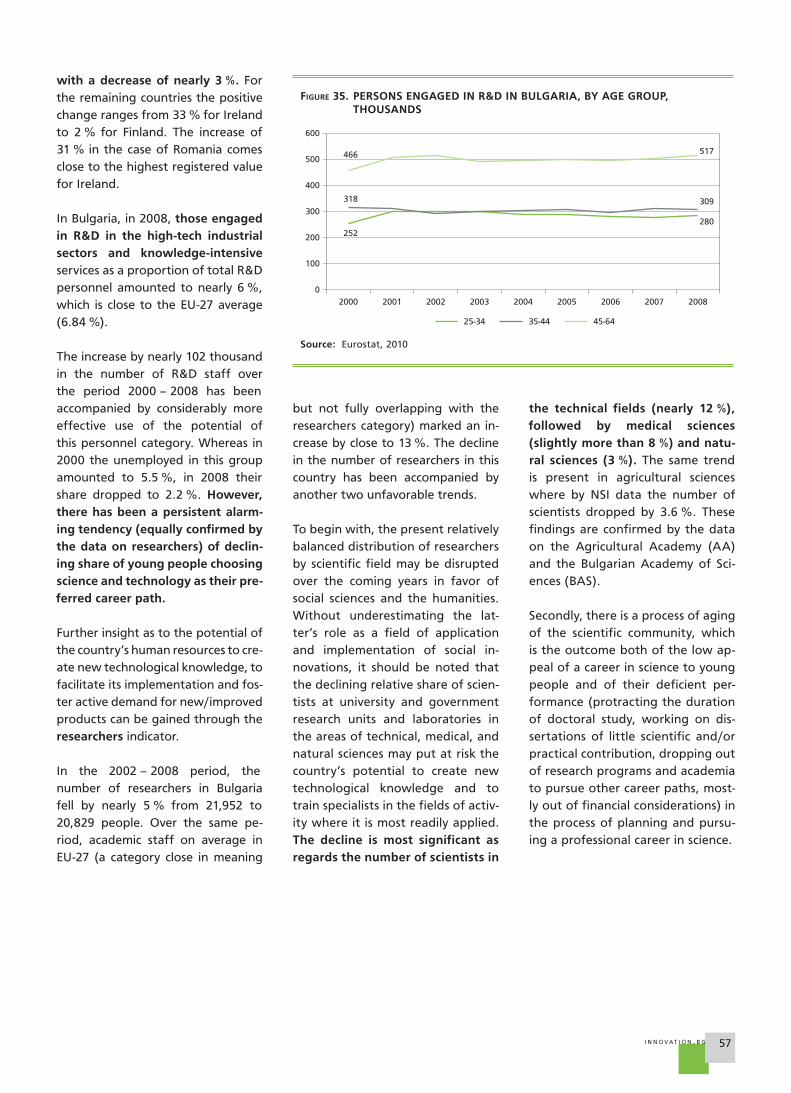
57I N N OVAT I O N . B G
FIGURE 35. PERSONS ENGAGED IN R&D IN BULGARIA, BY AGE GROUP, THOUSANDS
Source: Eurostat, 2010
2008
0
500
600
400
300
200
100
2000 2001 2002 2003
252
318
466 517
309
280
2004 2005 2006 2007
25-34 35-44 45-64
with a decrease of nearly 3 %. For
the remaining countries the positive
change ranges from 33 % for Ireland
to 2 % for Finland. The increase of
31 % in the case of Romania comes
close to the highest registered value
for Ireland.
In Bulgaria, in 2008, those engaged in R&D in the high-tech industrial sectors and knowledge-intensive
services as a proportion of total R&D
personnel amounted to nearly 6 %,
which is close to the EU-27 average
(6.84 %).
The increase by nearly 102 thousand
in the number of R&D staff over
the period 2000 – 2008 has been
accompanied by considerably more
effective use of the potential of
this personnel category. Whereas in
2000 the unemployed in this group
amounted to 5.5 %, in 2008 their
share dropped to 2.2 %. However, there has been a persistent alarm-ing tendency (equally confirmed by the data on researchers) of declin-ing share of young people choosing science and technology as their pre-ferred career path.
Further insight as to the potential of
the country’s human resources to cre-
ate new technological knowledge, to
facilitate its implementation and fos-
ter active demand for new/improved
products can be gained through the
researchers indicator.
In the 2002 – 2008 period, the
number of researchers in Bulgaria
fell by nearly 5 % from 21,952 to
20,829 people. Over the same pe-
riod, academic staff on average in
EU-27 (a category close in meaning
but not fully overlapping with the
researchers category) marked an in-
crease by close to 13 %. The decline
in the number of researchers in this
country has been accompanied by
another two unfavorable trends.
To begin with, the present relatively
balanced distribution of researchers
by scientific field may be disrupted
over the coming years in favor of
social sciences and the humanities.
Without underestimating the lat-
ter’s role as a field of application
and implementation of social in-
novations, it should be noted that
the declining relative share of scien-
tists at university and government
research units and laboratories in
the areas of technical, medical, and
natural sciences may put at risk the
country’s potential to create new
technological knowledge and to
train specialists in the fields of activ-
ity where it is most readily applied.
The decline is most significant as regards the number of scientists in
the technical fields (nearly 12 %), followed by medical sciences (slightly more than 8 %) and natu-ral sciences (3 %). The same trend
is present in agricultural sciences
where by NSI data the number of
scientists dropped by 3.6 %. These
findings are confirmed by the data
on the Agricultural Academy (AA)
and the Bulgarian Academy of Sci-
ences (BAS).
Secondly, there is a process of aging
of the scientific community, which
is the outcome both of the low ap-
peal of a career in science to young
people and of their deficient per-
formance (protracting the duration
of doctoral study, working on dis-
sertations of little scientific and/or
practical contribution, dropping out
of research programs and academia
to pursue other career paths, most-
ly out of financial considerations) in
the process of planning and pursu-
ing a professional career in science.
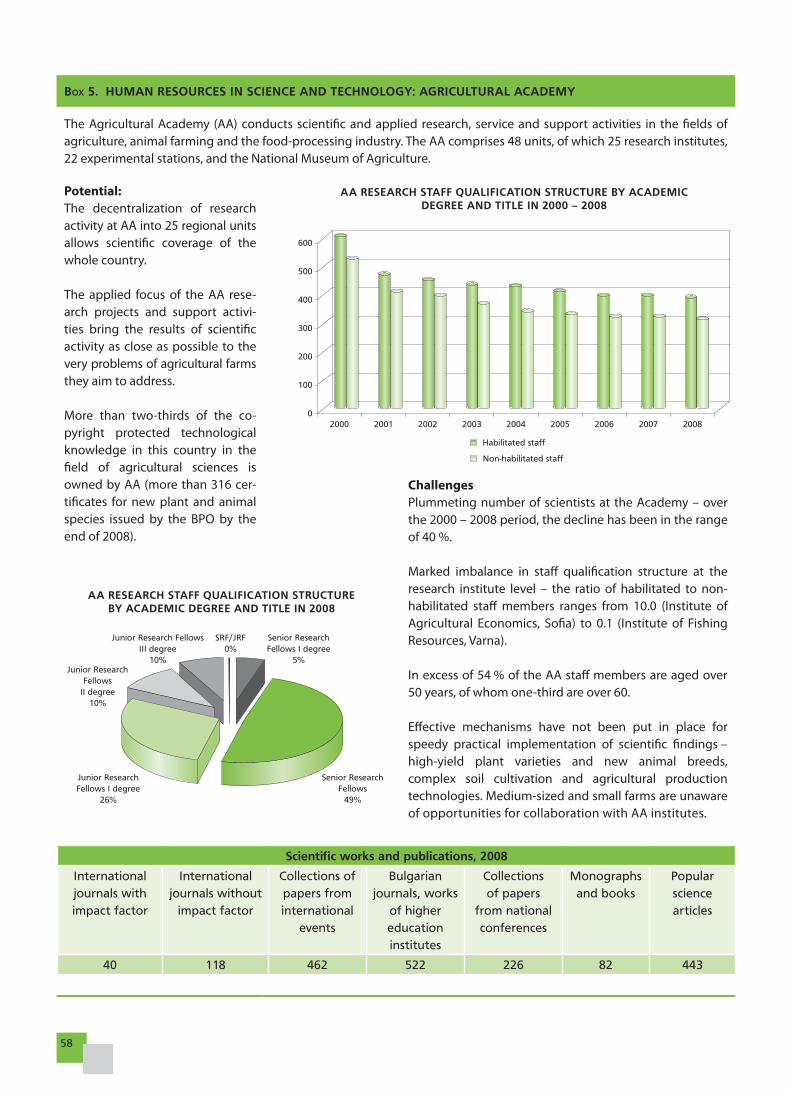
58
BOX 5. HUMAN RESOURCES IN SCIENCE AND TECHNOLOGY: AGRICULTURAL ACADEMY
The Agricultural Academy (AA) conducts scientific and applied research, service and support activities in the fields ofagriculture, animal farming and the food-processing industry. The AA comprises 48 units, of which 25 research institutes, 22 experimental stations, and the National Museum of Agriculture.
Potential:The decentralization of research activity at AA into 25 regional units allows scientific coverage of thewhole country.
The applied focus of the AA rese-arch projects and support activi-ties bring the results of scientificactivity as close as possible to the very problems of agricultural farms they aim to address.
More than two-thirds of the co-pyright protected technological knowledge in this country in the field of agricultural sciences isowned by AA (more than 316 cer-tificates for new plant and animalspecies issued by the BPO by the end of 2008).
AA RESEARCH STAFF QUALIFICATION STRUCTURE BY ACADEMICDEGREE AND TITLE IN 2000 – 2008
AA RESEARCH STAFF QUALIFICATION STRUCTUREBY ACADEMIC DEGREE AND TITLE IN 2008
ChallengesPlummeting number of scientists at the Academy – over the 2000 – 2008 period, the decline has been in the range of 40 %.
Marked imbalance in staff qualification structure at theresearch institute level – the ratio of habilitated to non-habilitated staff members ranges from 10.0 (Institute ofAgricultural Economics, Sofia) to 0.1 (Institute of FishingResources, Varna).
In excess of 54 % of the AA staff members are aged over 50 years, of whom one-third are over 60.
Effective mechanisms have not been put in place forspeedy practical implementation of scientific findings – high-yield plant varieties and new animal breeds, complex soil cultivation and agricultural production technologies. Medium-sized and small farms are unaware of opportunities for collaboration with AA institutes.
Scientific works and publications, 2008
International
journals with
impact factor
International
journals without
impact factor
Collections of
papers from
international
events
Bulgarian
journals, works
of higher
education
institutes
Collections
of papers
from national
conferences
Monographs
and books
Popular
science
articles
40 118 462 522 226 82 443
0
100
2000 2001 2002 2003 2004 2005 2006 2007 2008
200
300
400
500
600
Habilitated staff
Non-habilitated staff
Senior ResearchFellows
49%
Senior ResearchFellows I degree
5%
Junior ResearchFellows I degree
26%
Junior ResearchFellows
II degree10%
Junior Research FellowsIII degree
10%
SRF/JRF0%
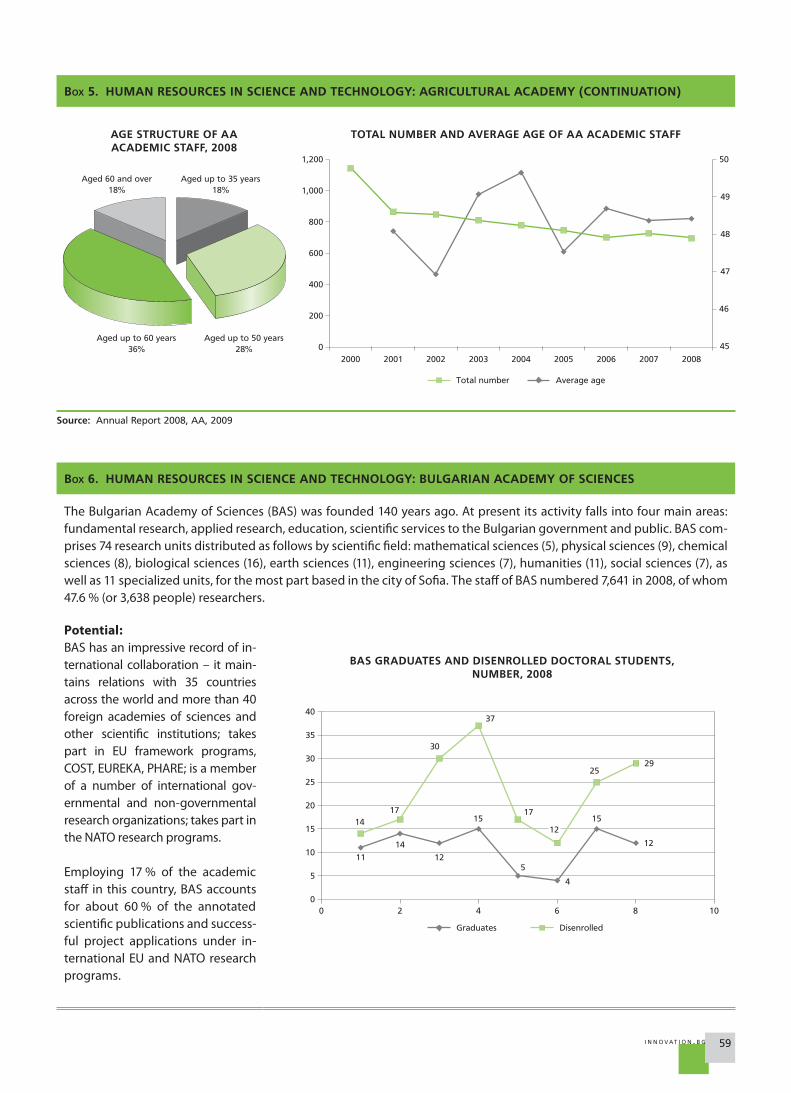
59I N N OVAT I O N . B G
BOX 5. HUMAN RESOURCES IN SCIENCE AND TECHNOLOGY: AGRICULTURAL ACADEMY (CONTINUATION)
Source: Annual Report 2008, AA, 2009
AGE STRUCTURE OF AA ACADEMIC STAFF, 2008
BOX 6. HUMAN RESOURCES IN SCIENCE AND TECHNOLOGY: BULGARIAN ACADEMY OF SCIENCES
The Bulgarian Academy of Sciences (BAS) was founded 140 years ago. At present its activity falls into four main areas: fundamental research, applied research, education, scientific services to the Bulgarian government and public. BAS com-prises 74 research units distributed as follows by scientific field: mathematical sciences (5), physical sciences (9), chemicalsciences (8), biological sciences (16), earth sciences (11), engineering sciences (7), humanities (11), social sciences (7), as well as 11 specialized units, for the most part based in the city of Sofia. The staff of BAS numbered 7,641 in 2008, of whom47.6 % (or 3,638 people) researchers.
Potential:BAS has an impressive record of in-ternational collaboration – it main-tains relations with 35 countries across the world and more than 40 foreign academies of sciences and other scientific institutions; takespart in EU framework programs, COST, EUREKA, PHARE; is a member of a number of international gov-ernmental and non-governmental research organizations; takes part in the NATO research programs.
Employing 17 % of the academic staff in this country, BAS accountsfor about 60 % of the annotated scientific publications and success-ful project applications under in-ternational EU and NATO research programs.
BAS GRADUATES AND DISENROLLED DOCTORAL STUDENTS, NUMBER, 2008
Aged 60 and over18%
Aged up to 35 years18%
Aged up to 50 years28%
Aged up to 60 years36%
TOTAL NUMBER AND AVERAGE AGE OF AA ACADEMIC STAFF
0
1,200
1,000
800
600
400
200
50
48
49
47
45
46
2000 20082001 2002 2003 2004 2005 2006 2007
Total number Average age
00 108642
11
14
17
30
37
17
12
2529
14
12
12
15 15
5
4
40
35
30
25
20
15
10
5
DisenrolledGraduates
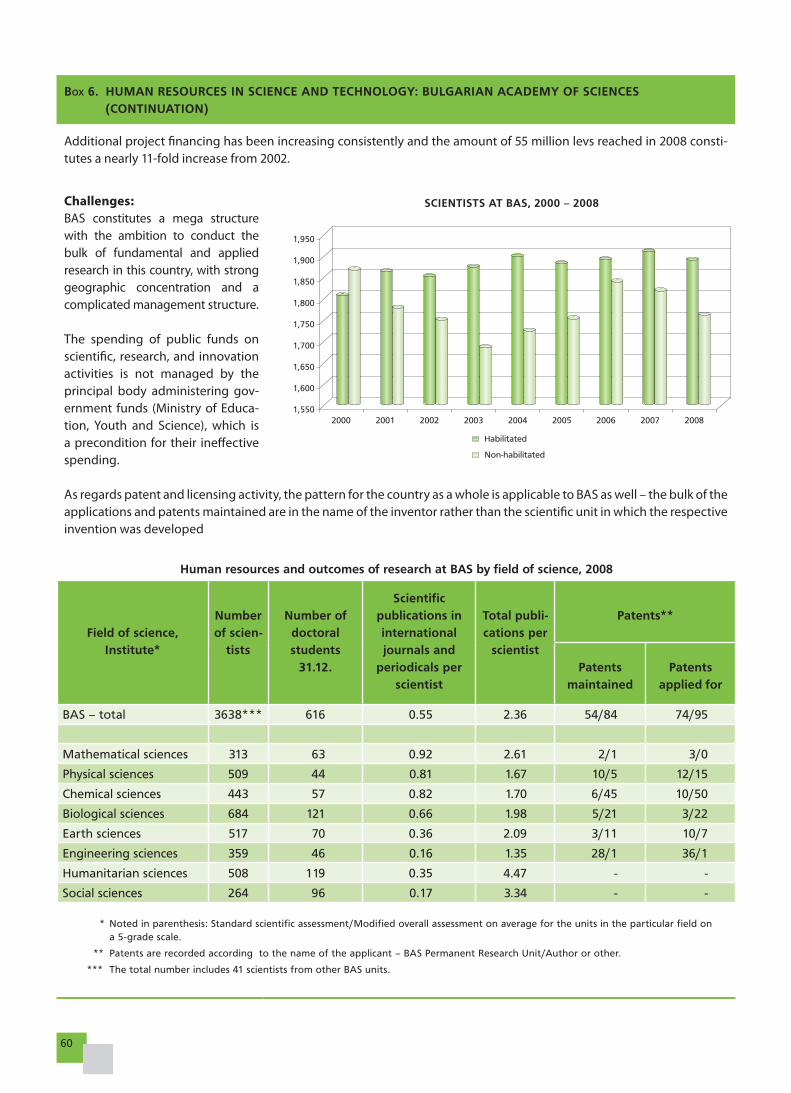
60
Challenges:BAS constitutes a mega structure with the ambition to conduct the bulk of fundamental and applied research in this country, with strong geographic concentration and a complicated management structure.
The spending of public funds on scientific, research, and innovationactivities is not managed by the principal body administering gov-ernment funds (Ministry of Educa-tion, Youth and Science), which is a precondition for their ineffectivespending.
As regards patent and licensing activity, the pattern for the country as a whole is applicable to BAS as well – the bulk of the applications and patents maintained are in the name of the inventor rather than the scientific unit in which the respectiveinvention was developed
BOX 6. HUMAN RESOURCES IN SCIENCE AND TECHNOLOGY: BULGARIAN ACADEMY OF SCIENCES (CONTINUATION)
Additional project financing has been increasing consistently and the amount of 55 million levs reached in 2008 consti-tutes a nearly 11-fold increase from 2002.
SCIENTISTS AT BAS, 2000 – 2008
Human resources and outcomes of research at BAS by field of science, 2008
Field of science,Institute*
Number of scien-
tists
Number of doctoral students
31.12.
Scientific publications in international journals and
periodicals per scientist
Total publi-cations per
scientist
Patents**
Patentsmaintained
Patentsapplied for
BAS – total 3638*** 616 0.55 2.36 54/84 74/95
Mathematical sciences 313 63 0.92 2.61 2/1 3/0
Physical sciences 509 44 0.81 1.67 10/5 12/15
Chemical sciences 443 57 0.82 1.70 6/45 10/50
Biological sciences 684 121 0.66 1.98 5/21 3/22
Earth sciences 517 70 0.36 2.09 3/11 10/7
Engineering sciences 359 46 0.16 1.35 28/1 36/1
Humanitarian sciences 508 119 0.35 4.47 - -
Social sciences 264 96 0.17 3.34 - -
* Noted in parenthesis: Standard scientific assessment/Modified overall assessment on average for the units in the particular field on a 5-grade scale.
** Patents are recorded according to the name of the applicant – BAS Permanent Research Unit/Author or other.
*** The total number includes 41 scientists from other BAS units.
1,5502000 2001 2002 2003 2004 2005 2006 2007 2008
1,600
1,650
1,750
1,700
1,850
1,800
1,950
1,900
Habilitated
Non-habilitated
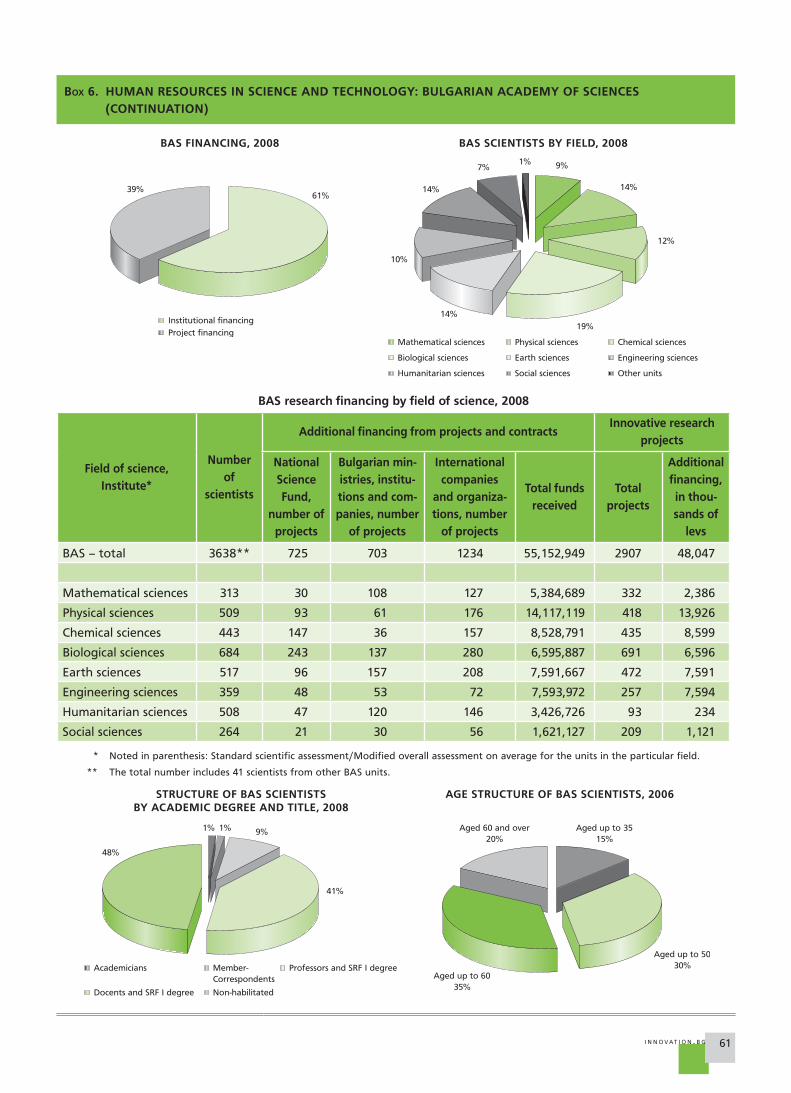
61I N N OVAT I O N . B G
BOX 6. HUMAN RESOURCES IN SCIENCE AND TECHNOLOGY: BULGARIAN ACADEMY OF SCIENCES (CONTINUATION)
BAS FINANCING, 2008 BAS SCIENTISTS BY FIELD, 2008
AGE STRUCTURE OF BAS SCIENTISTS, 2006
BAS research financing by field of science, 2008
Field of science,Institute*
Number of
scientists
Additional financing from projects and contracts Innovative research
projects
National Science Fund,
number of projects
Bulgarian min-istries, institu-tions and com-panies, number
of projects
International companies
and organiza-tions, number
of projects
Total funds received
Total projects
Additional financing, in thou-sands of
levs
BAS – total 3638** 725 703 1234 55,152,949 2907 48,047
Mathematical sciences 313 30 108 127 5,384,689 332 2,386
Physical sciences 509 93 61 176 14,117,119 418 13,926
Chemical sciences 443 147 36 157 8,528,791 435 8,599
Biological sciences 684 243 137 280 6,595,887 691 6,596
Earth sciences 517 96 157 208 7,591,667 472 7,591
Engineering sciences 359 48 53 72 7,593,972 257 7,594
Humanitarian sciences 508 47 120 146 3,426,726 93 234
Social sciences 264 21 30 56 1,621,127 209 1,121
* Noted in parenthesis: Standard scientific assessment/Modified overall assessment on average for the units in the particular field.
** The total number includes 41 scientists from other BAS units.
STRUCTURE OF BAS SCIENTISTSBY ACADEMIC DEGREE AND TITLE, 2008
Institutional financing
61%39%
Project financing
1% 9%
14%
12%
19%
14%
10%
14%
7%
Biological sciences
Chemical sciencesPhysical sciencesMathematical sciences
Earth sciences Engineering sciences
Humanitarian sciences Social sciences Other units
Docents and SRF I degree
Professors and SRF I degreeMember-Correspondents
Academicians
1% 1% 9%
41%
48%
Non-habilitated
Aged 60 and over20%
Aged up to 3515%
Aged up to 5030%
Aged up to 6035%
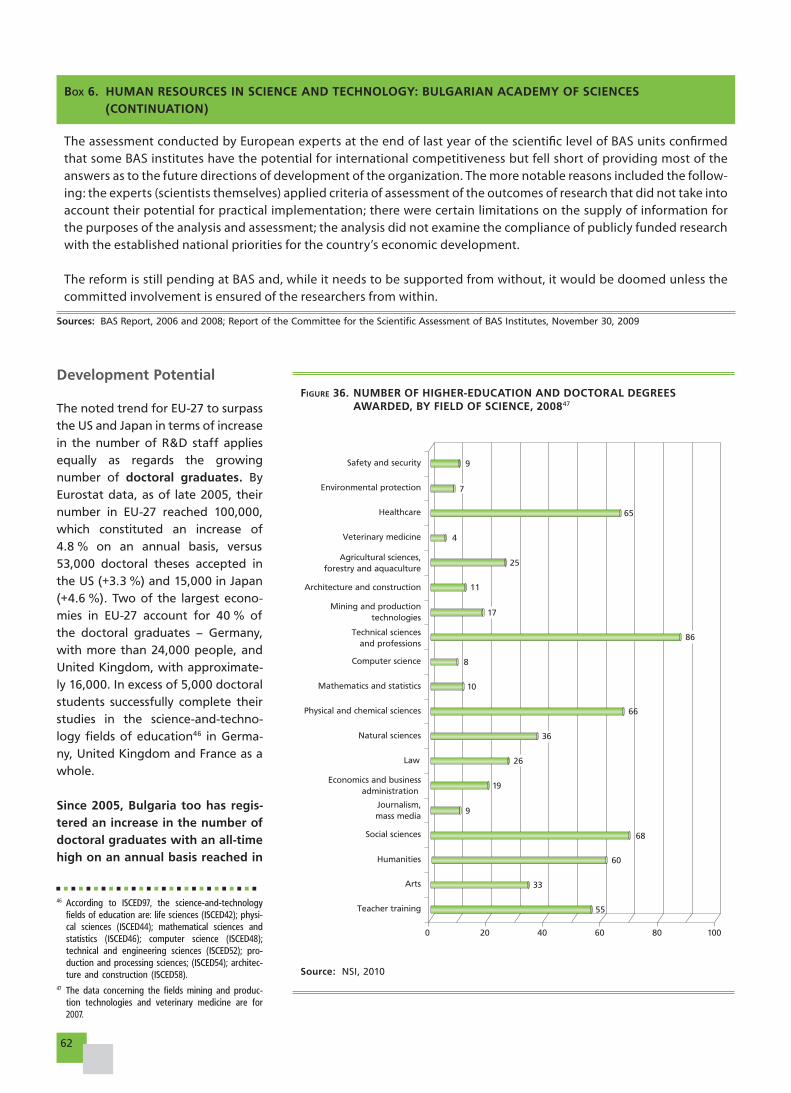
62
BOX 6. HUMAN RESOURCES IN SCIENCE AND TECHNOLOGY: BULGARIAN ACADEMY OF SCIENCES (CONTINUATION)
The assessment conducted by European experts at the end of last year of the scientific level of BAS units confirmedthat some BAS institutes have the potential for international competitiveness but fell short of providing most of the answers as to the future directions of development of the organization. The more notable reasons included the follow-ing: the experts (scientists themselves) applied criteria of assessment of the outcomes of research that did not take into account their potential for practical implementation; there were certain limitations on the supply of information for the purposes of the analysis and assessment; the analysis did not examine the compliance of publicly funded research with the established national priorities for the country’s economic development.
The reform is still pending at BAS and, while it needs to be supported from without, it would be doomed unless the committed involvement is ensured of the researchers from within.
Sources: BAS Report, 2006 and 2008; Report of the Committee for the Scientific Assessment of BAS Institutes, November 30, 2009
FIGURE 36. NUMBER OF HIGHER-EDUCATION AND DOCTORAL DEGREES AWARDED, BY FIELD OF SCIENCE, 200847
Source: NSI, 2010
Development Potential
The noted trend for EU-27 to surpass
the US and Japan in terms of increase
in the number of R&D staff applies
equally as regards the growing
number of doctoral graduates. By
Eurostat data, as of late 2005, their
number in EU-27 reached 100,000,
which constituted an increase of
4.8 % on an annual basis, versus
53,000 doctoral theses accepted in
the US (+3.3 %) and 15,000 in Japan
(+4.6 %). Two of the largest econo-
mies in EU-27 account for 40 % of
the doctoral graduates – Germany,
with more than 24,000 people, and
United Kingdom, with approximate-
ly 16,000. In excess of 5,000 doctoral
students successfully complete their
studies in the science-and-techno-
logy fields of education46 in Germa-
ny, United Kingdom and France as a
whole.
Since 2005, Bulgaria too has regis-tered an increase in the number of doctoral graduates with an all-time high on an annual basis reached in
Teacher training
Arts
Humanities
Social sciences
Journalism,mass media
Economics and businessadministration
Law
Natural sciences
Physical and chemical sciences
Mathematics and statistics
Computer science
Technical sciencesand professions
Mining and productiontechnologies
Architecture and construction
Agricultural sciences,forestry and aquaculture
Veterinary medicine
Healthcare
Environmental protection
Safety and security
0 10020 60
10
8
66
19
26
9
68
60
33
80
65
25
17
11
86
7
9
40
4
36
5546 According to ISCED97, the science-and-technology
fields of education are: life sciences (ISCED42); physi-cal sciences (ISCED44); mathematical sciences and statistics (ISCED46); computer science (ISCED48); technical and engineering sciences (ISCED52); pro-duction and processing sciences; (ISCED54); architec-ture and construction (ISCED58).
47 The data concerning the fields mining and produc-tion technologies and veterinary medicine are for 2007.
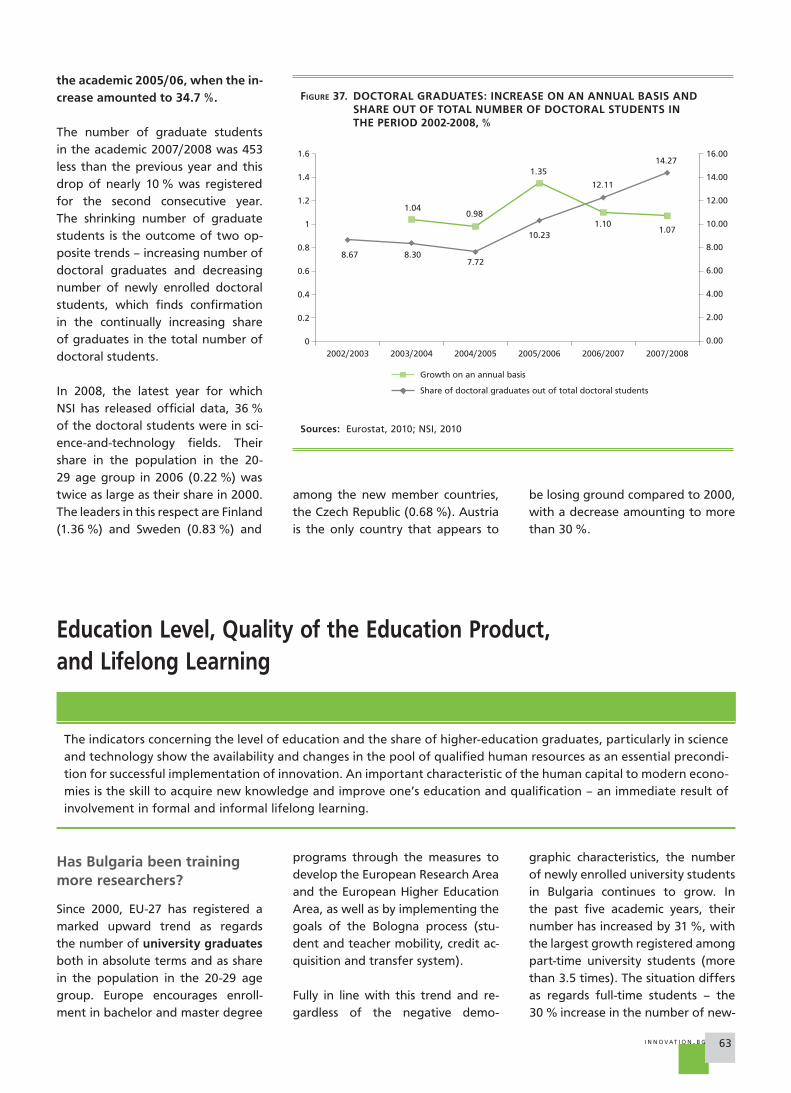
63I N N OVAT I O N . B G
FIGURE 37. DOCTORAL GRADUATES: INCREASE ON AN ANNUAL BASIS AND SHARE OUT OF TOTAL NUMBER OF DOCTORAL STUDENTS IN THE PERIOD 2002-2008, %
Sources: Eurostat, 2010; NSI, 2010
Education Level, Quality of the Education Product,and Lifelong Learning
The indicators concerning the level of education and the share of higher-education graduates, particularly in science
and technology show the availability and changes in the pool of qualified human resources as an essential precondi-
tion for successful implementation of innovation. An important characteristic of the human capital to modern econo-
mies is the skill to acquire new knowledge and improve one’s education and qualification – an immediate result of
involvement in formal and informal lifelong learning.
the academic 2005/06, when the in-crease amounted to 34.7 %.
The number of graduate students
in the academic 2007/2008 was 453
less than the previous year and this
drop of nearly 10 % was registered
for the second consecutive year.
The shrinking number of graduate
students is the outcome of two op-
posite trends – increasing number of
doctoral graduates and decreasing
number of newly enrolled doctoral
students, which finds confirmation
in the continually increasing share
of graduates in the total number of
doctoral students.
In 2008, the latest year for which
NSI has released official data, 36 %
of the doctoral students were in sci-
ence-and-technology fields. Their
share in the population in the 20-
29 age group in 2006 (0.22 %) was
twice as large as their share in 2000.
The leaders in this respect are Finland
(1.36 %) and Sweden (0.83 %) and
0
1.6
1.4
1.2
1
0.8
0.6
0.4
0.2
8.67 8.30
1.040.98
1.35
1.101.07
7.72
10.23
12.11
14.27 16.00
8.00
12.00
10.00
14.00
6.00
4.00
0.00
2.00
2002/2003 2003/2004 2004/2005 2005/2006 2006/2007 2007/2008
Growth on an annual basis
Share of doctoral graduates out of total doctoral students
among the new member countries,
the Czech Republic (0.68 %). Austria
is the only country that appears to
be losing ground compared to 2000,
with a decrease amounting to more
than 30 %.
Has Bulgaria been training more researchers?
Since 2000, EU-27 has registered a
marked upward trend as regards
the number of university graduates
both in absolute terms and as share
in the population in the 20-29 age
group. Europe encourages enroll-
ment in bachelor and master degree
programs through the measures to
develop the European Research Area
and the European Higher Education
Area, as well as by implementing the
goals of the Bologna process (stu-
dent and teacher mobility, credit ac-
quisition and transfer system).
Fully in line with this trend and re-
gardless of the negative demo-
graphic characteristics, the number
of newly enrolled university students
in Bulgaria continues to grow. In
the past five academic years, their
number has increased by 31 %, with
the largest growth registered among
part-time university students (more
than 3.5 times). The situation differs
as regards full-time students – the
30 % increase in the number of new-
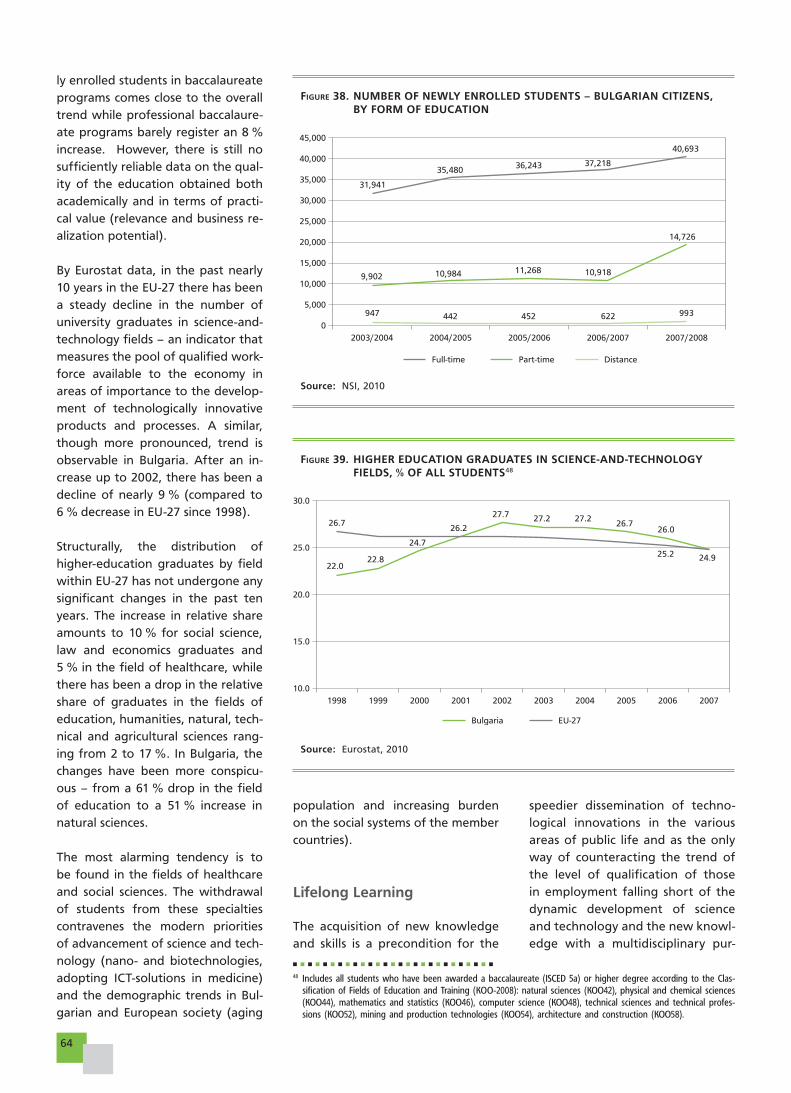
64
ly enrolled students in baccalaureate
programs comes close to the overall
trend while professional baccalaure-
ate programs barely register an 8 %
increase. However, there is still no
sufficiently reliable data on the qual-
ity of the education obtained both
academically and in terms of practi-
cal value (relevance and business re-
alization potential).
By Eurostat data, in the past nearly
10 years in the EU-27 there has been
a steady decline in the number of
university graduates in science-and-
technology fields – an indicator that
measures the pool of qualified work-
force available to the economy in
areas of importance to the develop-
ment of technologically innovative
products and processes. A similar,
though more pronounced, trend is
observable in Bulgaria. After an in-
crease up to 2002, there has been a
decline of nearly 9 % (compared to
6 % decrease in EU-27 since 1998).
Structurally, the distribution of
higher-education graduates by field
within EU-27 has not undergone any
significant changes in the past ten
years. The increase in relative share
amounts to 10 % for social science,
law and economics graduates and
5 % in the field of healthcare, while
there has been a drop in the relative
share of graduates in the fields of
education, humanities, natural, tech-
nical and agricultural sciences rang-
ing from 2 to 17 %. In Bulgaria, the
changes have been more conspicu-
ous – from a 61 % drop in the field
of education to a 51 % increase in
natural sciences.
The most alarming tendency is to
be found in the fields of healthcare
and social sciences. The withdrawal
of students from these specialties
contravenes the modern priorities
of advancement of science and tech-
nology (nano- and biotechnologies,
adopting ICT-solutions in medicine)
and the demographic trends in Bul-
garian and European society (aging
FIGURE 38. NUMBER OF NEWLY ENROLLED STUDENTS – BULGARIAN CITIZENS, BY FORM OF EDUCATION
Source: NSI, 2010
0
45,000
31,941
40,000
35,00035,480 36,243 37,218
40,693
25,000
20,000
30,000
15,000
10,000
5,000
9,902
947 993442 452 622
10,984 11,268 10,918
14,726
2003/2004 2007/20082004/2005 2005/2006 2006/2007
Part-time Full-time Distance
FIGURE 39. HIGHER EDUCATION GRADUATES IN SCIENCE-AND-TECHNOLOGY FIELDS, % OF ALL STUDENTS48
Source: Eurostat, 2010
10.0
30.0
25.0
22.0
26.7
22.8
24.7
26.2
27.7 27.2 27.226.7
26.0
25.2 24.9
20.0
15.0
1999 2000 2001 2002 2003 2004 20051998 20072006
EU-27Bulgaria
population and increasing burden
on the social systems of the member
countries).
Lifelong Learning
The acquisition of new knowledge
and skills is a precondition for the
speedier dissemination of techno-
logical innovations in the various
areas of public life and as the only
way of counteracting the trend of
the level of qualification of those
in employment falling short of the
dynamic development of science
and technology and the new knowl-
edge with a multidisciplinary pur-
48 Includes all students who have been awarded a baccalaureate (ISCED 5a) or higher degree according to the Clas-sification of Fields of Education and Training (ÊÎÎ-2008): natural sciences (KOO42), physical and chemical sciences (KOO44), mathematics and statistics (KOO46), computer science (KOO48), technical sciences and technical profes-sions (KOO52), mining and production technologies (KOO54), architecture and construction (KOO58).
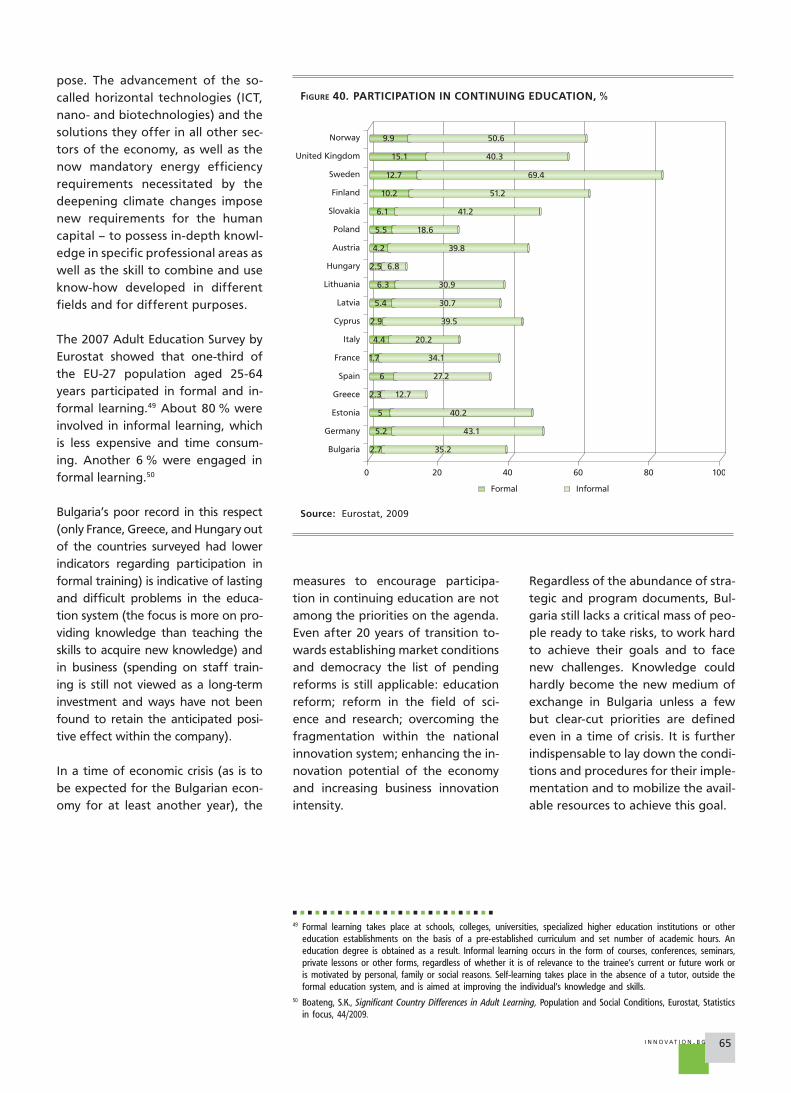
65I N N OVAT I O N . B G
FIGURE 40. PARTICIPATION IN CONTINUING EDUCATION, %
Source: Eurostat, 2009
pose. The advancement of the so-
called horizontal technologies (ICT,
nano- and biotechnologies) and the
solutions they offer in all other sec-
tors of the economy, as well as the
now mandatory energy efficiency
requirements necessitated by the
deepening climate changes impose
new requirements for the human
capital – to possess in-depth knowl-
edge in specific professional areas as
well as the skill to combine and use
know-how developed in different
fields and for different purposes.
The 2007 Adult Education Survey by
Eurostat showed that one-third of
the EU-27 population aged 25-64
years participated in formal and in-
formal learning.49 About 80 % were
involved in informal learning, which
is less expensive and time consum-
ing. Another 6 % were engaged in
formal learning.50
Bulgaria’s poor record in this respect
(only France, Greece, and Hungary out
of the countries surveyed had lower
indicators regarding participation in
formal training) is indicative of lasting
and difficult problems in the educa-
tion system (the focus is more on pro-
viding knowledge than teaching the
skills to acquire new knowledge) and
in business (spending on staff train-
ing is still not viewed as a long-term
investment and ways have not been
found to retain the anticipated posi-
tive effect within the company).
In a time of economic crisis (as is to
be expected for the Bulgarian econ-
omy for at least another year), the
0 20 40 60 80
Bulgaria
Germany
Estonia
Greece
Spain
France
Italy
Cyprus
Latvia
Lithuania
Hungary
Austria
Poland
Slovakia
Finland
Sweden
United Kingdom
Norway
InformalFormal
2.7
2.3
6
1.7
4.4
2.9
5.4
6.3
2.5
4.2
5.5
6.1
10.2
12.7
15.1
9.9 50.6
40.3
69.4
51.2
41.2
18.6
39.8
6.8
30.9
30.7
39.5
20.2
34.1
27.2
12.7
5.2
5 40.2
43.1
35.2
49 Formal learning takes place at schools, colleges, universities, specialized higher education institutions or other education establishments on the basis of a pre-established curriculum and set number of academic hours. An education degree is obtained as a result. Informal learning occurs in the form of courses, conferences, seminars, private lessons or other forms, regardless of whether it is of relevance to the trainee’s current or future work or is motivated by personal, family or social reasons. Self-learning takes place in the absence of a tutor, outside the formal education system, and is aimed at improving the individual’s knowledge and skills.
50 Boateng, S.K., Significant Country Differences in Adult Learning, Population and Social Conditions, Eurostat, Statistics in focus, 44/2009.
measures to encourage participa-
tion in continuing education are not
among the priorities on the agenda.
Even after 20 years of transition to-
wards establishing market conditions
and democracy the list of pending
reforms is still applicable: education
reform; reform in the field of sci-
ence and research; overcoming the
fragmentation within the national
innovation system; enhancing the in-
novation potential of the economy
and increasing business innovation
intensity.
Regardless of the abundance of stra-
tegic and program documents, Bul-
garia still lacks a critical mass of peo-
ple ready to take risks, to work hard
to achieve their goals and to face
new challenges. Knowledge could
hardly become the new medium of
exchange in Bulgaria unless a few
but clear-cut priorities are defined
even in a time of crisis. It is further
indispensable to lay down the condi-
tions and procedures for their imple-
mentation and to mobilize the avail-
able resources to achieve this goal.

66
67I N N OVAT I O N . B G
Information and CommunicationTechnologies
The information and communication technologies (ICT) are one of the most
important engines for innovation in enterprises and growth of economies.
ICT enter enterprises as general purpose technologies (GPT) which are inte-
grated in the new production and management processes. ICT also change
the organizational boundaries and transform the models for adding value,
competitiveness, and consumption. The effects of their use include de-
creased relative transaction costs, shortened product life cycles and structur-
al changes in markets (convergence, concentration and bargaining power).
The expenditure for Research and Development, patent activity and venture
financing in the ICT sector exceed substantially that in the other sectors in
the OECD countries.51 R&D focused on ICT, nanotechnologies and new mate-
rials, is among the most important driving forces leading to product innova-
tions. The driving forces are connected to the health and leisure industries
(including electronic games). Modern processes and marketing innovations
cannot exist without ICT. The internet and web-based services have caused
important social innovations, including in the political process and state gov-
ernance. The ICT infrastructure is already considered an essential element of
the critical infrastructure of each country, while the issues of digital security
are of primary importance for the policy of each country or corporation.
51 Information Technology Outlook 2008, OECD, p. 144.
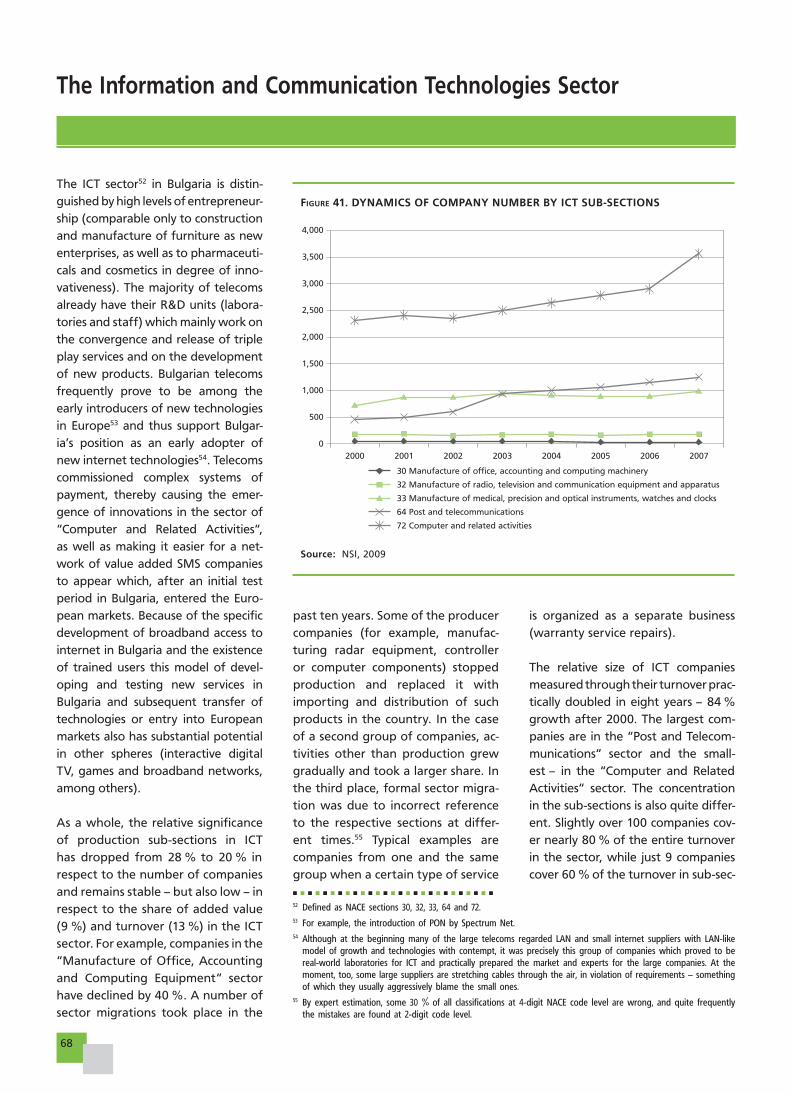
68
The Information and Communication Technologies Sector
FIGURE 41. DYNAMICS OF COMPANY NUMBER BY ICT SUB-SECTIONS
Source: NSI, 2009
The ICT sector52 in Bulgaria is distin-
guished by high levels of entrepreneur-
ship (comparable only to construction
and manufacture of furniture as new
enterprises, as well as to pharmaceuti-
cals and cosmetics in degree of inno-
vativeness). The majority of telecoms
already have their R&D units (labora-
tories and staff) which mainly work on
the convergence and release of triple
play services and on the development
of new products. Bulgarian telecoms
frequently prove to be among the
early introducers of new technologies
in Europe53 and thus support Bulgar-
ia’s position as an early adopter of
new internet technologies54. Telecoms
commissioned complex systems of
payment, thereby causing the emer-
gence of innovations in the sector of
”Computer and Related Activities”,
as well as making it easier for a net-
work of value added SMS companies
to appear which, after an initial test
period in Bulgaria, entered the Euro-
pean markets. Because of the specific
development of broadband access to
internet in Bulgaria and the existence
of trained users this model of devel-
oping and testing new services in
Bulgaria and subsequent transfer of
technologies or entry into European
markets also has substantial potential
in other spheres (interactive digital
TV, games and broadband networks,
among others).
As a whole, the relative significance
of production sub-sections in ICT
has dropped from 28 % to 20 % in
respect to the number of companies
and remains stable – but also low – in
respect to the share of added value
(9 %) and turnover (13 %) in the ICT
sector. For example, companies in the
”Manufacture of Office, Accounting
and Computing Equipment” sector
have declined by 40 %. A number of
sector migrations took place in the
0
4,000
3,500
3,000
2,500
1,000
2,000
1,500
500
20072000 2001 2002 2003 2004 2005 2006
32 Manufacture of radio, television and communication equipment and apparatus
30 Manufacture of office, accounting and computing machinery
33 Manufacture of medical, precision and optical instruments, watches and clocks
64 Post and telecommunications
72 Computer and related activities
past ten years. Some of the producer
companies (for example, manufac-
turing radar equipment, controller
or computer components) stopped
production and replaced it with
importing and distribution of such
products in the country. In the case
of a second group of companies, ac-
tivities other than production grew
gradually and took a larger share. In
the third place, formal sector migra-
tion was due to incorrect reference
to the respective sections at differ-
ent times.55 Typical examples are
companies from one and the same
group when a certain type of service
is organized as a separate business
(warranty service repairs).
The relative size of ICT companies
measured through their turnover prac-
tically doubled in eight years – 84 %
growth after 2000. The largest com-
panies are in the ”Post and Telecom-
munications” sector and the small-
est – in the ”Computer and Related
Activities” sector. The concentration
in the sub-sections is also quite differ-
ent. Slightly over 100 companies cov-
er nearly 80 % of the entire turnover
in the sector, while just 9 companies
cover 60 % of the turnover in sub-sec-
52 Defined as NACE sections 30, 32, 33, 64 and 72.53 For example, the introduction of PON by Spectrum Net.54 Although at the beginning many of the large telecoms regarded LAN and small internet suppliers with LAN-like
model of growth and technologies with contempt, it was precisely this group of companies which proved to be real-world laboratories for ICT and practically prepared the market and experts for the large companies. At the moment, too, some large suppliers are stretching cables through the air, in violation of requirements – something of which they usually aggressively blame the small ones.
55 By expert estimation, some 30 % of all classifications at 4-digit NACE code level are wrong, and quite frequently the mistakes are found at 2-digit code level.
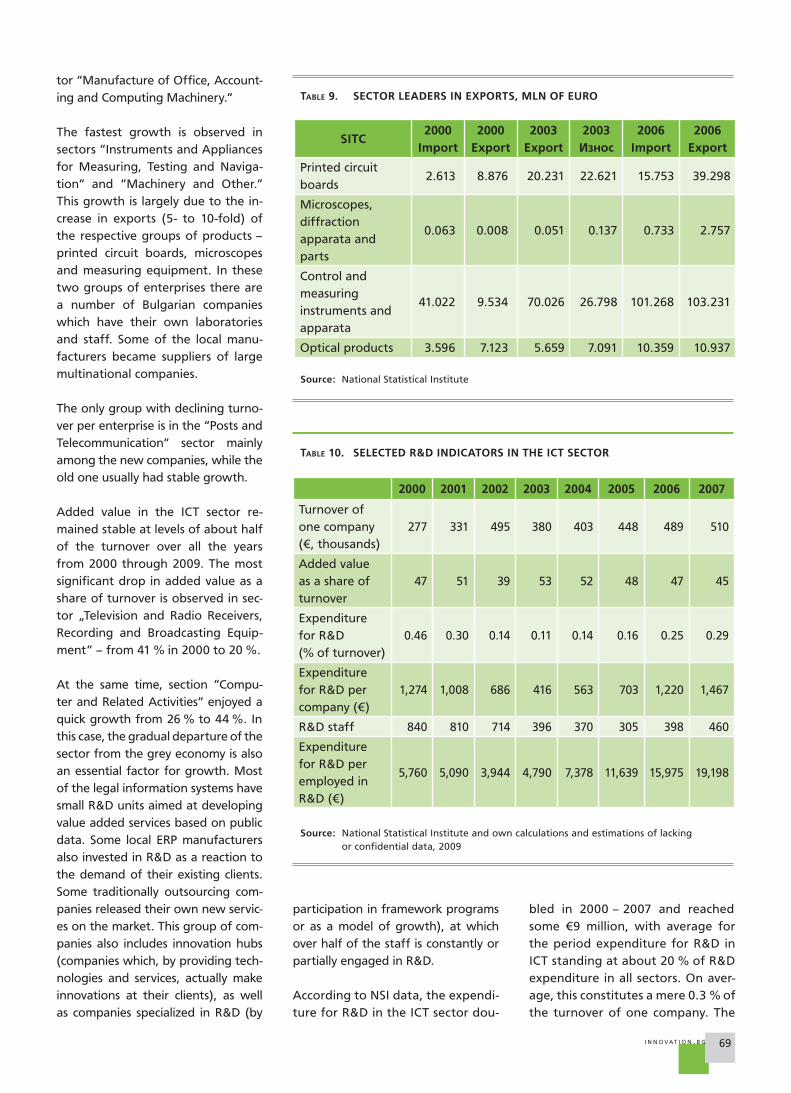
69I N N OVAT I O N . B G
TABLE 9. SECTOR LEADERS IN EXPORTS, MLN OF EURO
Source: National Statistical Institute
SITC2000
Import2000
Export2003
Export2003
Èçíîñ2006
Import2006
Export
Printed circuit
boards2.613 8.876 20.231 22.621 15.753 39.298
Microscopes,
diffraction
apparata and
parts
0.063 0.008 0.051 0.137 0.733 2.757
Control and
measuring
instruments and
apparata
41.022 9.534 70.026 26.798 101.268 103.231
Optical products 3.596 7.123 5.659 7.091 10.359 10.937
TABLE 10. SELECTED R&D INDICATORS IN THE ICT SECTOR
Source: National Statistical Institute and own calculations and estimations of lacking or confidential data, 2009
2000 2001 2002 2003 2004 2005 2006 2007
Turnover of
one company
(€, thousands)
277 331 495 380 403 448 489 510
Added value
as a share of
turnover
47 51 39 53 52 48 47 45
Expenditure
for R&D
(% of turnover)
0.46 0.30 0.14 0.11 0.14 0.16 0.25 0.29
Expenditure
for R&D per
company (€)
1,274 1,008 686 416 563 703 1,220 1,467
R&D staff 840 810 714 396 370 305 398 460
Expenditure
for R&D per
employed in
R&D (€)
5,760 5,090 3,944 4,790 7,378 11,639 15,975 19,198
tor ”Manufacture of Office, Account-
ing and Computing Machinery.”
The fastest growth is observed in
sectors ”Instruments and Appliances
for Measuring, Testing and Naviga-
tion” and ”Machinery and Other.”
This growth is largely due to the in-
crease in exports (5- to 10-fold) of
the respective groups of products –
printed circuit boards, microscopes
and measuring equipment. In these
two groups of enterprises there are
a number of Bulgarian companies
which have their own laboratories
and staff. Some of the local manu-
facturers became suppliers of large
multinational companies.
The only group with declining turno-
ver per enterprise is in the ”Posts and
Telecommunication” sector mainly
among the new companies, while the
old one usually had stable growth.
Added value in the ICT sector re-
mained stable at levels of about half
of the turnover over all the years
from 2000 through 2009. The most
significant drop in added value as a
share of turnover is observed in sec-
tor „Television and Radio Receivers,
Recording and Broadcasting Equip-
ment” – from 41 % in 2000 to 20 %.
At the same time, section ”Compu-
ter and Related Activities” enjoyed a
quick growth from 26 % to 44 %. In
this case, the gradual departure of the
sector from the grey economy is also
an essential factor for growth. Most
of the legal information systems have
small R&D units aimed at developing
value added services based on public
data. Some local ERP manufacturers
also invested in R&D as a reaction to
the demand of their existing clients.
Some traditionally outsourcing com-
panies released their own new servic-
es on the market. This group of com-
panies also includes innovation hubs
(companies which, by providing tech-
nologies and services, actually make
innovations at their clients), as well
as companies specialized in R&D (by
participation in framework programs
or as a model of growth), at which
over half of the staff is constantly or
partially engaged in R&D.
According to NSI data, the expendi-
ture for R&D in the ICT sector dou-
bled in 2000 – 2007 and reached
some €9 million, with average for
the period expenditure for R&D in
ICT standing at about 20 % of R&D
expenditure in all sectors. On aver-
age, this constitutes a mere 0.3 % of
the turnover of one company. The
70
low level of expenditure for R&D is
also demonstrated by the fact that
R&D expenditure per employed in
the same activity are comparable
to the salary of the said employee,
which means that either the em-
ployed actually engage in R&D in a
very small portion of their time, or
that nearly no funds are set aside
for investment in technologies nec-
essary for R&D. In-depth interviews
with representatives of various
companies (not only ICT) with R&D
show, however, that most of the
companies do not report their R&D
at the National Statistical Institute
or keep special account of it which
may help them to constantly have
an adequate picture of their own
R&D from the point of view of in-
vested resources (including number
of staff). If by 2000 tax considera-
tions for preferring accounting di-
rect costs for the respective period
to expenditure for R&D for future
periods had a considerable role, at
the end of the first decade of the
21st century the problem is rather
that inertia has settled in, as well
as the lack of accounting and or-
ganizational capacity to follow and
record these indicators. By rough
estimates, the real share of R&D in
ICT turnover is underestimated 3 to
10-fold, but more detailed research
is necessary for a precise evaluation.
It is expected that the data for 2009
and the following years will feature
many more companies reporting
R&D, as well as innovation activity
in ICT, because state institutions be-
gan to use the statements filed with
the National Statistical Institute as
source of information for some re-
quirements in cases where compa-
nies applied for financing from the
structural funds.56 A problem yet to
be resolved57 in this respect is the
application of a methodology for
software innovativeness assessment
aligned with international defini-
tions in applications to the Opera-
tional Program Competitiveness.
The future of R&D in ICT depends on
endogenous factors like human capi-
tal/university systems (which pro-
duce a maximum of 3,500 IT special-
ists a year58), local demand by other
industries and public procurement
for electronic management systems,
as well as on exogenous factors like
the decisions of foreign companies
about the future of their branches,59
the EU framework programs and the
coordination activities in European
Research Area in the field of ICT.
In Bulgaria the patent activity of en-
terprises in the ICT sector is very low,
with an average of some 20 patents
a year for the period 2000 – 2007
(with about 10 patents a year reg-
istered at the end of the period) or
about 2 % of the total registered
patents a year. This is largely due to
the fact that the greater frequency
of innovations in ICT is associated
with the production of software
which cannot be patented anyway
(in Europe). At the same time, nearly
all applications and registered pat-
ents in the USA in recent years, for
which Bulgarians (or foreigners liv-
ing in Bulgaria) have been entered
as inventors, are in the field of ICT.
The leader in terms of patents is SAP
(for 2009). Another leader is RaiSat
(with an equal number of applica-
tions along with SAP in 2009). Both
companies have sustainable connec-
tion with scientific institutions (Sofia
University’s Faculty of Mathematics
and Informatics and the Faculty of
Physics, as well as the Technical Uni-
versity in Sofia) in Bulgaria – their
leading specialists are established
scientists or promising young people
(doctoral students).
The leading Bulgarian ICT compa-
nies participating in R&D funded
under the framework programs of
the EU also have a close partner-
ship with academic institutions and
laboratories. A case in point is Sir-
ma Solutions in which lecturers in
the field of software engineering
work and staff (frequently doctoral
students) publish in prestigious in-
ternational journals with a high im-
pact factor (Sirma is the Bulgarian
company with the largest number
of publications in the field of ICT).
More detailed research is needed
in respect to the connection of
science (publication activity and
teaching), patents and innovations
with business, but qualitative stud-
ies unequivocally demonstrate that
recognized scientists in the field
of ICT work jointly (and frequently
also have their own firms) with lead-
ing companies in the sector and vice
versa. The situation in other high-
tech fields of science and the econo-
my is similar. The ICT sector is in the
unique position of balancing inter-
action between the educational sys-
tem (even from secondary schools),
science and business – there are
other sectors (for example, bio-
technologies, chemistry and others)
that cannot have the existing R&D
potential used for developing lo-
cal production and scientists work
for foreign contracting agents. The
problems are largely due to the lack
of institutional opportunities for
this interaction and it remains in
most of the cases at personal level,
as well as to the fact that the state
has not invested in infrastructure
for education for years.
56 In 2009, many companies controlled by famous entrepreneurs in the sector were registered in order to be able to meet the requirements for a start-up company, because they cannot receive funding with those established on the market. This process will also continue in 2010.
57 For 2009. It is expected that the problem will be overcome in the first half of 2010 with the active intervention of the Ministry of Transport, Information Technologies and Com-munications.
58 The total shortage of IT specialists in the economy for 2012 is estimated at some 10-15,000.59 For example, the German Intercomponentware closed its branch in Bulgaria in 2009 as a result of the crisis, while an American company for casino IT systems expanded its staff
significantly.
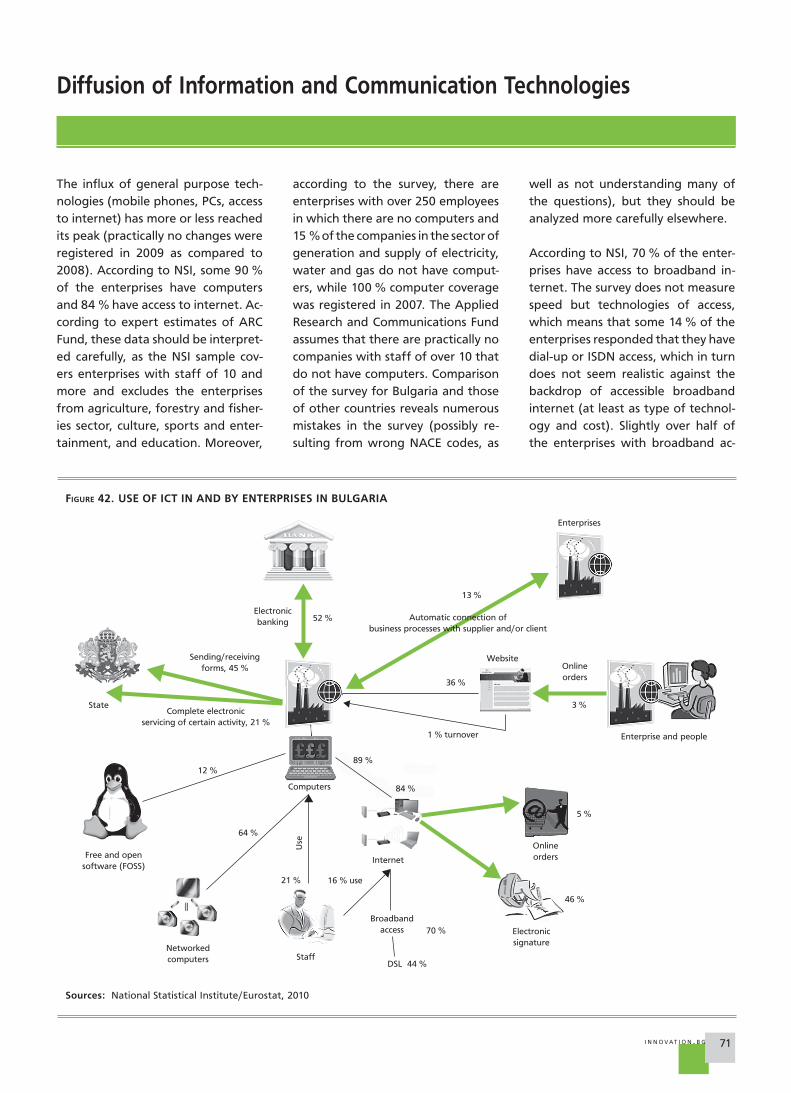
71I N N OVAT I O N . B G
Diffusion of Information and Communication Technologies
The influx of general purpose tech-
nologies (mobile phones, PCs, access
to internet) has more or less reached
its peak (practically no changes were
registered in 2009 as compared to
2008). According to NSI, some 90 %
of the enterprises have computers
and 84 % have access to internet. Ac-
cording to expert estimates of ARC
Fund, these data should be interpret-
ed carefully, as the NSI sample cov-
ers enterprises with staff of 10 and
more and excludes the enterprises
from agriculture, forestry and fisher-
ies sector, culture, sports and enter-
tainment, and education. Moreover,
according to the survey, there are
enterprises with over 250 employees
in which there are no computers and
15 % of the companies in the sector of
generation and supply of electricity,
water and gas do not have comput-
ers, while 100 % computer coverage
was registered in 2007. The Applied
Research and Communications Fund
assumes that there are practically no
companies with staff of over 10 that
do not have computers. Comparison
of the survey for Bulgaria and those
of other countries reveals numerous
mistakes in the survey (possibly re-
sulting from wrong NACE codes, as
well as not understanding many of
the questions), but they should be
analyzed more carefully elsewhere.
According to NSI, 70 % of the enter-
prises have access to broadband in-
ternet. The survey does not measure
speed but technologies of access,
which means that some 14 % of the
enterprises responded that they have
dial-up or ISDN access, which in turn
does not seem realistic against the
backdrop of accessible broadband
internet (at least as type of technol-
ogy and cost). Slightly over half of
the enterprises with broadband ac-
FIGURE 42. USE OF ICT IN AND BY ENTERPRISES IN BULGARIA
Sources: National Statistical Institute/Eurostat, 2010
Electronicsignature
Onlineorders
Enterprise and people
Onlineorders
Enterprises
Website
5 %
3 %
13 %
36 %
1 % turnover
Computers
12 %
64 %
21 % 16 % use
70 %
84 %
89 %
52 %
46 %
Automatic connection ofbusiness processes with supplier and/or client
Electronicbanking
Sending/receivingforms, 45 %
Complete electronicservicing of certain activity, 21 %
State
Free and opensoftware (FOSS)
Networkedcomputers Staff
Internet
Broadbandaccess
DSL 44 %
Use
72
Impact of Information and CommunicationTechnologies on Innovation
cess use ADSL. About 15-20 % use
more than one access technology as
backup.
Nearly all employed (94 %) work at
an enterprise with at least one com-
puter but only 21 % of the employed
have routine access to a computer
a week within their official duties.
A total of 16 % of the employed
have routine access to computers
connected to the web at the work-
place. By these two indicators Bul-
garia ranks at the bottom among
European Union member-states,
but there are serious grounds to
doubt the reliability of the data. For
example, Romania, where 19 % of
the enterprises do not have a com-
puter at all, registered that 51 % of
the employed routinely use comput-
ers at their workplace at least once
a week. In Croatia this share is even
65 %, and in Slovakia – 70 % (in
comparison, Austria and Germany
registered about 40 %).
A total of 36 % of the enterprises
have websites (NSI/Eurostat). Here
again it can be assumed that the
data are significantly underestimat-
ed as even in 2006 38 % of the en-
terprises with over 10 employees had
websites (åBulgaria 2006), and in
2007 more than half (55.36 %) of all
enterprises (including with less than
10 employees) had websites. INA-4
shows that 48 % of the enterprises
have a website, and even in the case
of the least innovative enterprises
those with a website are 37 %. These
differences are probably mostly due
to the samples, but it is possible that
part of the lower values in the lat-
est surveys are due to the fact that
the respondent considers that the
existing website is not of sufficiently
high quality (about 10-15 % of the
enterprise websites in INA-4 have er-
rors, are in the process of develop-
ment and so on). According to INA-4
data, 35 % of the companies have
websites which allow online place-
ment of orders, but those where
online payment is possible are less
than 1 %. The total turnover of en-
terprises generated by online orders
is about 1 %. By all of these indictors
Bulgaria (with the exception of Ro-
mania where 28 % of the enterprises
have websites) ranks at the bottom
among other member-countries.
Bulgaria ranks best by broadband
access indicators, outstripping more
than half of the EU countries in terms
of connections alternative to DSL, al-
though it is lagging behind in DSL.
Another indicator where Bulgaria
traditionally registers high values is
the use of electronic signature (46 %
of enterprises). The reason for this,
as has repeatedly been analyzed in all
editions of Innovation.bg, is the sav-
ing of time, effort and bureaucratic
red tape related to accounting of so-
cial security, health and tax dues. To
a large extent this is precisely what
the communication using various
forms between enterprises and state
institutions is (45 % of enterprises) as
well as complete electronic service of
an individual activity (21 %).
The use of open code and free soft-
ware systems is still slow in entering
enterprise operation (12 % say they
use such), but Bulgaria nevertheless
has better results than 7 countries,
including Spain which is frequently
quoted as an example for using open
source and free software.
The intensive introduction of tech-
nologies into the business environ-
ment, the convergence of the vari-
ous information and communica-
tion technologies and the structural
changes in consumer demand are
the three most significant external
forces which determine contempo-
rary product, process, organizational
and marketing innovation.60 Around half of the product and three-quar-ters of the process innovations61
in Europe are based on the inno-vative use of ICT at some of the stages – from R&D and prototypes,
through including ICT components
in the new products and produc-
tion processes to release of the new
products and services on the market.
The latest empirical data from 2009
for the European Union, which show
the influence of ICT on innovations,
pertain to section 35 (”Manufacture
and Distribution of Electricity, Gas,
Steam and Air-Conditioner Gases”),
where 71 % of the R&D-based inno-
vations and an equal number of new
products and services are based on
60 Innovation.bg 2007.61 e-Business W@tch, 2007. The data are for the period 2005-2007, resulting from sample surveys for several large
or leading EU countries. The USA is also included in some cases. For more information about the surveys visit http://www.ebusiness-watch.org
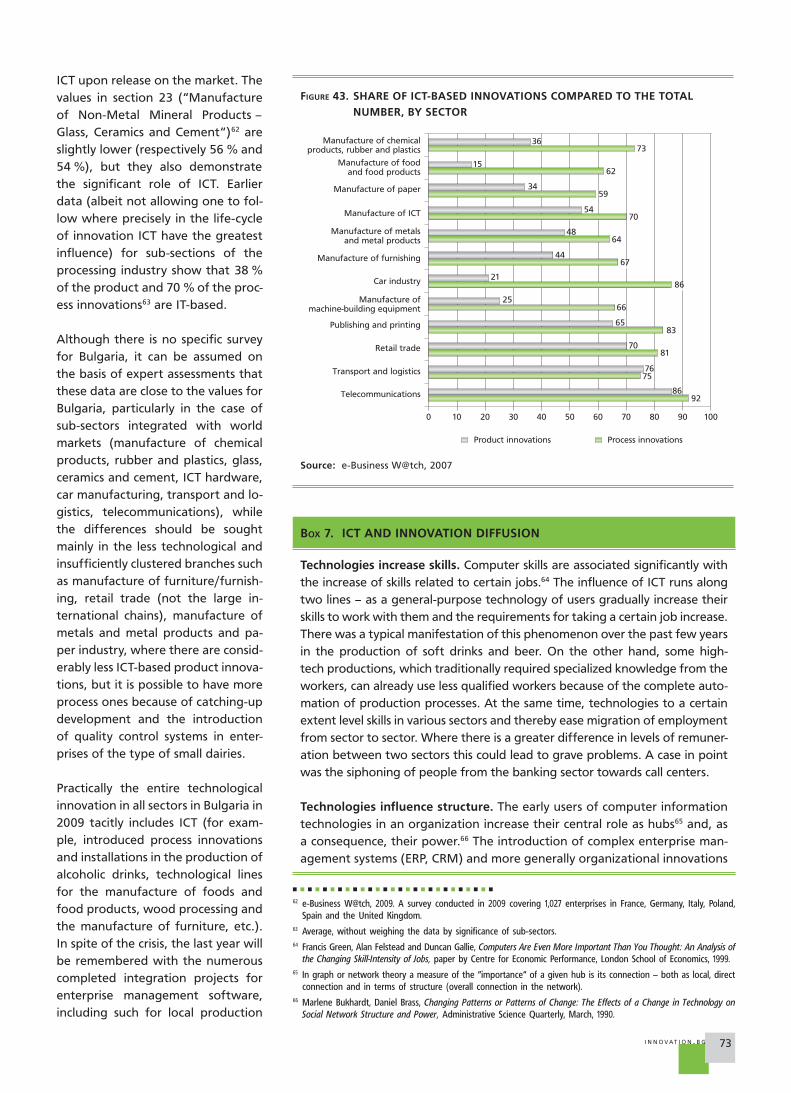
73I N N OVAT I O N . B G
ICT upon release on the market. The
values in section 23 (”Manufacture
of Non-Metal Mineral Products –
Glass, Ceramics and Cement”)62 are
slightly lower (respectively 56 % and
54 %), but they also demonstrate
the significant role of ICT. Earlier
data (albeit not allowing one to fol-
low where precisely in the life-cycle
of innovation ICT have the greatest
influence) for sub-sections of the
processing industry show that 38 %
of the product and 70 % of the proc-
ess innovations63 are IT-based.
Although there is no specific survey
for Bulgaria, it can be assumed on
the basis of expert assessments that
these data are close to the values for
Bulgaria, particularly in the case of
sub-sectors integrated with world
markets (manufacture of chemical
products, rubber and plastics, glass,
ceramics and cement, ICT hardware,
car manufacturing, transport and lo-
gistics, telecommunications), while
the differences should be sought
mainly in the less technological and
insufficiently clustered branches such
as manufacture of furniture/furnish-
ing, retail trade (not the large in-
ternational chains), manufacture of
metals and metal products and pa-
per industry, where there are consid-
erably less ICT-based product innova-
tions, but it is possible to have more
process ones because of catching-up
development and the introduction
of quality control systems in enter-
prises of the type of small dairies.
Practically the entire technological
innovation in all sectors in Bulgaria in
2009 tacitly includes ICT (for exam-
ple, introduced process innovations
and installations in the production of
alcoholic drinks, technological lines
for the manufacture of foods and
food products, wood processing and
the manufacture of furniture, etc.).
In spite of the crisis, the last year will
be remembered with the numerous
completed integration projects for
enterprise management software,
including such for local production
FIGURE 43. SHARE OF ICT-BASED INNOVATIONS COMPARED TO THE TOTAL
NUMBER, BY SECTOR
Source: e-Business W@tch, 2007
Process innovations
Retail trade
Transport and logistics
Telecommunications
0 10 20 30 40 50 60 80
81
86
90
92
70
75
70
76
100
Product innovations
48
67
Manufacture of chemicalproducts, rubber and plastics
Manufacture of foodand food products
Manufacture of paper
Manufacture of ICT
Manufacture of metalsand metal products
Manufacture of furnishing
Manufacture ofmachine-building equipment
Car industry
Publishing and printing83
86
65
25
21
66
44
54
15
34
36
59
70
73
64
62
62 e-Business W@tch, 2009. A survey conducted in 2009 covering 1,027 enterprises in France, Germany, Italy, Poland, Spain and the United Kingdom.
63 Average, without weighing the data by significance of sub-sectors.64 Francis Green, Alan Felstead and Duncan Gallie, Computers Are Even More Important Than You Thought: An Analysis of
the Changing Skill-Intensity of Jobs, paper by Centre for Economic Performance, London School of Economics, 1999.65 In graph or network theory a measure of the ”importance” of a given hub is its connection – both as local, direct
connection and in terms of structure (overall connection in the network).66 Marlene Bukhardt, Daniel Brass, Changing Patterns or Patterns of Change: The Effects of a Change in Technology on
Social Network Structure and Power, Administrative Science Quarterly, March, 1990.
BOX 7. ICT AND INNOVATION DIFFUSION
Technologies increase skills. Computer skills are associated significantly with
the increase of skills related to certain jobs.64 The influence of ICT runs along
two lines – as a general-purpose technology of users gradually increase their
skills to work with them and the requirements for taking a certain job increase.
There was a typical manifestation of this phenomenon over the past few years
in the production of soft drinks and beer. On the other hand, some high-
tech productions, which traditionally required specialized knowledge from the
workers, can already use less qualified workers because of the complete auto-
mation of production processes. At the same time, technologies to a certain
extent level skills in various sectors and thereby ease migration of employment
from sector to sector. Where there is a greater difference in levels of remuner-
ation between two sectors this could lead to grave problems. A case in point
was the siphoning of people from the banking sector towards call centers.
Technologies influence structure. The early users of computer information
technologies in an organization increase their central role as hubs65 and, as
a consequence, their power.66 The introduction of complex enterprise man-
agement systems (ERP, CRM) and more generally organizational innovations
74
BOX 7. ICT AND INNOVATION DIFFUSION (CONTINUATION)
frequently encounter considerable resistance from employees because they
have to change certain business processes or certain employees lose specific
power fed by information asymmetry or brokerage.
ICT-intensive sectors grow faster than non-intensive ones. This conclusion
was made on the basis of data for the period 1990 – 1999.69
ICT boosts competition. ICT boosts competition through a reduction of
information asymmetry and the unlimited access of clients to the com-
petitors, including through easier international trade. In turn, competitive pressure has a retroactive increasing effect of increased ICT use – for ex-
ample, a company has a statistically higher probability of having a website
if its largest direct competitor has a website than if it does not (Innovation.bg 2008). Half of the companies from the sector of manufacture of chemi-
cal products, rubber and plastics in Europe think that ICT have increased competition in the sector (e-Business W@tch, 2008). The same result was
registered a year earlier in retail trade in Europe (e-Business W@tch, 2007). Of course, there are sectors where this influence is practically nonexistent
(for example, metallurgy).
ICT increases the probability of innovation, but the power of this influ-ence is greater in the early stages of introduction of the respective type of ICT. When adoptions are made by the late majority or the laggards this
connection can be lost. In other words, the early introducers of ICT are more innovative (Innovation.bg 2009). For example, the use of software
applications for e-business correlates with considerable organizational
changes and process innovations, but no correlation is found between
the use of internet and the existence of local network infrastructure and
organizational changes in several sectors (e-Business W@tch, 2007, 2008). The same surveys register that ICT-based innovations lead to an increase
of sales. Enterprises with computers are more innovative than those with-
out, and there is a tangible – albeit weak – correlation between innova-
tiveness of an enterprise and the indicators of number of computers per
employed (Innovation.bg 2009). As in the case of computers, the existence
of a website, ERP, CRM, joint work and project management systems and
open code systems are significant factors which divide enterprises into
more innovative and less innovative ones (Innovation.bg 2009).
developed by foreign companies
(not only in their local outlets in
Bulgaria). A large portion of these,
however, were planned in 2008 and
some even in 2007.
In Bulgaria, ICT innovations in the
utility sectors67 ”Production and Dis-
tribution of Energy,” ”Supply of Wa-
ter,” ”Sewerage Services” and ”Waste
Management” in 2009 are related
to changes in (or the introduction
of new) systems for (including mo-
bile, electronic, web) payments and
relations with partners who collect
payments, consumption accounting
systems, the introduction of systems
for management of reserves, sup-
plies and business processes, systems
for remote consumption accounting,
for remote risk surveillance, control
and evaluation, the introduction or
improvement of centers for work
with clients and the introduction of
systems or individual elements in the
process of management of human
resources. All these innovations (and
the related changes in business pro-
cesses) induce and presuppose con-
siderable organizational changes, not
only in the energy sector, but in the
entire processing industry as well.
In spite of Solow’s widely discussed
productivity paradox,68 which gener-
ally consists in the apparent contra-
diction between the measured in-
vestments in ICT and the aggregate
results (productivity and growth) at
national and sector level (particular-
ly with data for the 1980s and the
1990s), at academic and policy level
it is accepted as valid (particularly for
the future) that ICT are one of the
most important motors of innova-
tiveness of enterprises and growth
of economies. The effects of their
use include reduced relative trans-
action costs, shortened production
cycle, streamlining of production,
structural changes in markets. At the
same time, a lot of additional risks
also appeared (for company security,
for example) and threats (in respect
to company competitive position).
67 Although only 325 enterprises with over 10 employees operated there in 2008 and they had only 10 % of the added value in the non-financial sector, they held a considerable portion of the retail electronic payments and were an important factor (maybe second after the state) in the development of local ICT business. Part of these companies in turn own companies in the telecommunications sector, while their problem-free functioning is a condition for the operation of practically the entire economy, which makes them an interesting subject of research about the role of ICT in them.
68 Brynjolfsson, Erik, The Productivity Paradox of Information Technology, Communications of the ACM, December, 1993.69 Bart van Ark, Robert Inklaar, Robert McGuckin, ”Changing Gear: Productivity, ICT and Service Industries in Europe
and United States”, in Jens Christensen and Peter Maskell, eds., The Industrial Dynamics of the New Digital Economy, Edward Elgar Publishing, 2003.
75I N N OVAT I O N . B G
Bulgarian Innovation Policy:Options for the Next Decade
70 Communication from the Commission to the European Parliament, the Council, the European Economic and Social Committee and the Committee of the Regions, Reviewing Community innovation policy in a changing world, Brussels, 2.9.2009, COM(2009) 442 final.
The political changes in the EU – the entry into force of the Treaty of Lisbon,
the new composition of EU institutions, as well as the development of their re-
mit – will influence policy in the field of innovation in Bulgaria and the EU over
the next decade. Regardless of the fact that in respect to science and innova-
tion the Treaty of Lisbon preserves the current competencies of the member-
states and the complementarity of the measures for encouraging innovations,
at EU level there are designs for essential change and promotion of initiatives
in support of innovation policy. Should Bulgaria miss 2010 too for drafting a
national innovation policy, the country’s model of economic development will
increasingly resemble those of the most backward in Europe – low competi-
tiveness, long-term low income, a high degree of indebtedness and extreme
vulnerability to external economic shocks.
European initiatives in support of innovation
Since 2005, innovation policy has acquired greater significance among EU com-
mon policies and was recognized as a key factor for competitiveness, productiv-
ity and sustainability. The results and the problems of EU innovation policy can
be structured in three fields – framework conditions for innovation, initiatives
in support of innovation demand and supply.70
Framework conditions include the changes in the provision of state aid for
research, innovation and development, which include help for young entrepre-
neurs, centers for providing innovation services, loans for highly qualified staff,
support of innovation clusters and so on. The new regulation for exempting
76
from notification state aid to the amount of up to €200,000 per enterprise for
a three-year period allows member-states to use a variety of tools in support
of innovations and for the development of eco-innovation. Tax initiatives for
encouraging research and development are embodied mainly in comparative
analysis of member-state tax policies and in the distribution of good practices.
Access of business to a single patent, keeping talented scientists in the EU, the
reform in the structure of educational degrees and the acquisition of e-skills
remain unresolved problems.
The supply and demand of innovations in the EU are characterized by limited access to venture capital in the first stages of the innovation process and the
investment readiness of entrepreneurs. The Commission has undertaken sever-
al initiatives to encourage cross-border venture capital investment and to clarify
the interests of venture investors, but they cannot replace the measures at the
national level. The European Institute of Innovation and Technology has the key
task of generating pioneer innovations by stimulating the connection between
education, science and business, as well as the development of public-private
partnerships. The first knowledge and innovation communities through which
it operates are those in the field of climate change, sustainable energy and the
future of information and communication technologies. Important initiatives
of the European Commission include the drafting of an innovation policy in
respect to services and linking cohesion policy with innovation policy. The
utilization of funds under the operational programs for overcoming the conse-
quences of the economic crisis remains a problem for member states.
The measures for simultaneous support of demand and supply are taken in sev-
eral main directions:
• Development of lead markets in the sectors of e-health, sustainable con-
struction, recycling, bio-products, renewable energy sources, as well as
wider access to and better utilization of the technologies ready for com-
mercialization in the field of eco-innovation;
• Information and communication technologies;
• Intelligent transport systems and intelligent energy;
• Using the potential of public procurement to encourage innovation;
• Development of active policy in the field of standardization;
• Better regulation of new technologies and newly emerging markets and
assessment of their impact.
On this basis the European Commission recommends that policies at the level of
EU member states define priorities in the following fields:
• A clear understanding of the significance of R&D and innovations to
overcome the crisis quickly and create potential for sustainable growth;
increasing the regulatory functions of the state towards reconsidering
regulatory regimes, overcoming the barriers to entrepreneurship and in-
novation, and financial support for companies incapable of setting aside
the necessary funding for innovation;
• Simultaneous stimulation of the supply and demand of fundamental and
applied research results, with a focus on encouraging interaction be-
tween innovation system units and shortening the cycle for application
of new technological projects;
• Uniting efforts around the so-called national strategic technologies set
down as priorities and thus focusing the principal portion of the planned
investments in research and technology;
• Orientation of financial schemes towards support for building a green
and clean economy and a healthy society.
77I N N OVAT I O N . B G
European innovation policy prospects
The European innovation policy is reflected in the EU 2020 strategy.71 The strat-
egy focuses on three thematic objectives:
• Creating value by basing growth on knowledge;
• Empowering people in inclusive societies;
• Creating a competitive, connected and greener economy.
Innovations concern all three objectives. The Commission is expected to make
a detailed proposal for updating the European innovation policy to the Spring
European Council. This is part of the overall European program for reform. The
2010 Spring European Council conclusions will underpin the so-called ‘integrat-
ed guidelines’, confirming the policy priorities which should be pursued by the
EU and member states in partnership. The new guidelines will replace those in
force under the Lisbon Strategy since 2005. For each of these objectives, mem-
ber states will be invited to set national objectives for five years corresponding
to their specific situations and their starting points.
Bulgaria’s innovation policy as EU member
Given Bulgaria’s membership in the EU, the modernization and enhanced com-
petitiveness of its economy emerge as a requirement for the improvement of
living conditions.
The adoption of a National Innovation Strategy of the Republic of Bulgaria
in 2004 and its implementation through concrete projects, such as the estab-
lishment of the National Innovation Fund and the development and launch
of Operational Program Competitiveness, were the first – albeit quite restrict-
ed – measures in support of innovation in the transition to a market economy.
Because of the lack of consistent policy and adequate financial support they
did not succeed in bringing essential change to the environment for innovation.
The surveys of the European Commission – the European Innovation Score-
board and Innobarometer – classified Bulgaria as a ”catching-up country” in the
field of innovation, characterized by a downturn of investment in innovation in
a time a crisis and increasing innovation deficit in several key problem zones:
1. The national innovation policy is implemented on the basis of a strate-
gic document developed more than five years ago, without updating of
the objectives set down in it according to the change in the potential of
the Bulgarian economy and the conditions of the environment in which
the national innovation system units operate. The misbalances which ex-
isted at the launch of the National Innovation Strategy and the lack of
coordination with the then draft research development strategy and the
objectives of the country’s economic development continue at present.
In practice, the National Innovation Strategy has not been implemented
since 2007 – there are no annual plans, part of the few measures under-
taken earlier have been terminated or are carried out formally, without
a vision, the consultative body established with the Minister of Economy,
71 The Commission launches consultation on EU 2020: a new strategy to make the EU a smarter, greener social market, http://ec.europa.eu/enterprise/policies/innovation/index_en.htm
78
Energy and Tourism – the National Council on Innovation – does not
fulfill the commitments set down in the Strategy, while the Ministry of
Economy, Energy and Tourism does not engage in effective monitoring
of its implementation. The national innovation policy (inasmuch as it
could be said to exist) is carried out on the basis of sporadic measures
which are not subject to an overall logic and are not oriented towards
achieving the objectives of national development within the EU.
2. The approaches to updating the legislative framework in support of innovation in Bulgaria (lack of transparency and public debate), as well
as the mechanisms for the implementation of the legislative documents
(lack of control and ineffectively operating judicial system) cannot be
considered part of an innovation enabling environment. This is the case
with the actions undertaken – or not – for the development of high-
tech, human resources (engaged in science and technology), higher edu-
cation, protection of intellectual property (including by R&D units and
universities), and enterprise and innovation activity.
3. Funding of R&D is declining as a share of GDP. There is a lack of strategic
orientation, responsibility and administrative capacity for more effec-
tive utilization of the finances from the European funds in support of
R&D. Insufficient financing, combined with the lack of a long-term vi-
sion, leads to the establishment of units in support of innovation with
questionable sustainability. Cases in point are the technology transfer
offices established with some universities and scientific organizations.
They were supported financially for a year, with the clear prospect that
they would be unable to support themselves and would have to change
their functions after this period in order to exist. Such projects can be
described as tests of initiatives for encouraging innovation rather than a
well designed innovation strategy.
4. The reform of the national innovation system is yet to come, both in
respect to state-subsidized scientific units and to defining the role of
Bulgarian universities in the ”science – education – innovation” triangle.
Against this backdrop, the number of innovation companies in Bulgaria
is growing, regardless of the neutral – and in some cases hostile to in-
novation – business environment, while among publicly funded research
organizations and higher education institutions there are effectively
working units whose achievements find practical application. In spite
of that, the issues research and innovation remain a terra incognita for
Bulgarian media.
The need of developing a national program within the EU 2020 Strategy is an
appropriate occasion for reconsidering the national innovation policy and for
reforming the innovation system so that the strategic foundations for the de-
velopment of the Bulgarian economy over the next decade would improve.
Recommendations for the establishment of a working nationalinnovation system
The analysis of the innovation potential of the Bulgarian economy presented in
this report confirms the need for measures for catching up with the rest of the
European economies in respect of innovative development. Support of compa-
ny and national competitiveness by the introduction of advanced technological
achievements in enterprises will help overcome a number of economic and so-
cial problems and will permit an improved utilization of the existing innovation
79I N N OVAT I O N . B G
potential. The changes in Bulgaria’s innovation policy, which the Innovation.bg report summarized for the past six years, should include:
1. Making innovations a priority of the country’s economic and social de-velopment.
• Updating the National Innovation Strategy and its integration with the
research strategy and the country’s priorities of economic development.
Coordination of the main priorities for economic development and the
key technological fields in support of their achievement.
The prioritizing of innovation in the economy should be visible in the work of
the individual ministries and in the implementation of all operational programs
and financial instruments of the state, including the procedures for public pro-
curement, licensing, etc.
It is necessary to draw up an action plan by sectors and scientific and techno-
logical fields for the application of the objectives and priorities of the strategy
and to determine the financial, legal and institutional instruments for its imple-
mentation. The annual and medium-term action plans of the individual minis-
tries and other units disbursing public funds should be linked to the fulfillment
of objectives and priorities set down in the action plan, as well as to the assess-
ment of their implementation. Annual updating of the action plan according to
the rate of its implementation and external factors, as well as respective updat-
ing of the annual action plans of ministries and units operating with budget
funds based on it.
• Designing a mechanism of accountability, monitoring and control of the execution of measures set down in the national strategy. The strat-
egy should feature measurable results allowing for impact assessment
of scientific research and innovation on boosting the competitiveness of
the economy. Financial backing of the implementation of the strategy
aiming to ensure consistency and continuity in the long-term application
of the national innovation policy.
Modern information and communication technologies permit the establish-
ment of procedures for adequate interaction and exchange of information be-
tween the state institutions which create an environment and participate in the
implementation of the measures set down in the innovation strategy. Drafting
of governance rules for decision-making at national, regional and local level in
the conditions of transparency and open interaction with the various units of
the innovation system. Following the best practices in the developed countries,
the potential of civil society organizations in the country which have consider-
able experience in carrying out such initiatives should be used to hold a broad
debate on the issues of the innovative development of the economy.
• Organizational measures on the application of international stand-ards for collection, processing and provision of statistical data about
the operation and innovation activity of enterprises, research and uni-
versity institutions in the country. The establishment of an updated in-
formation database to serve the analytical process and the introduction
of measures for an innovation-supportive environment will lead to an
improved ranking of Bulgaria’s achievements in the European Innovation
Scoreboard and will help form a policy adequate to the existing innova-
tion potential.
80
2. Drafting legislation encouraging science, research and innovation in their interaction.
• Revision of legislation in the field of science and innovation with the
objective of creating a favorable statutory environment for innovations.
Updating existing laws and secondary legislation, including the Promo-
tion of Scientific Research Act and the Public Procurement Act, among
others;
• Drafting and adoption of legislative acts which would provide an over-
all regulation of activity of the units integrated in the innovation process
(business, universities, research units), including in terms of protection
and transfer of the intellectual property they hold.
The practice of EU countries shows the need of legislation which promotes the
development of innovation-related processes such as mobility between research
organizations and business, technology transfer, public-private partnerships in
R&D, incorporation in the European scientific infrastructure framework. Legisla-
tion should support innovation through the procedures for public procurement,
state aid and the introduction of international regulations and standards.
3. Establishment of a center for integrated decision-making which would coordinate the implementation of the country’s scientific, technological and innovation policy.
A unit should be established with the Council of Ministers, headed by the Prime
Minister or a Deputy Prime Minister, which would ensure significant changes
in the national innovation system on the basis of commitment at the highest
political level. The establishment of such a structure should overcome the prob-
lems in the work of the existing innovation and research councils in Bulgaria.
4. Sustainable increase of research and innovation funding.
• Formation of a sustainable financial framework for the implementa-tion of the measures included in the innovation strategy by setting
a national objective for investment in R&D. On the basis of the studies
of the sectors of investment in R&D by business it could be concluded
that the achievement of 2.1 % of GDP investments in R&D by 2020 is a
feasible objective. Participation of the state sector should remain within
0.8 – 0.9 % of GDP.
• Integrating the institutional and project approaches to funding re-search and innovation activity, including by synchronizing the existing
financial instruments – National Innovation Fund and National Science
Fund.
• Providing a national co-funding instrument for projects funded by Eu-ropean framework programs in the field of science, technology and
innovation, with the objective of encouraging the investment of fresh
money in the Bulgarian economy and of improving the management of
innovation in the research and industry sectors.
• Establishment of mechanisms of transparency and control of public expenditure. Building the capacity and streamlining the operation of
the public administration managing finances under the European Cohe-
sion Fund and the structural funds supporting innovation.
The limited funding for innovation calls for a reconsideration of the measures
under Operational Program Competitiveness for 2011 – innovation products,
81I N N OVAT I O N . B G
processes and services, which should be supported under the Program, as well
as the processes of technological modernization, development of clusters and
technology transfer offices. Changes are also necessary in Operational Program
Human Resources Development, which would turn it from a tool applied in
areas of low added value and low starting qualifications into an instrument
supporting human resources and business in high-tech and R&D-intensive in-
dustries. This can be done both by the transfer of more funds and responsi-
bilities under the program from the Ministry of Labor and Social Policy to the
Ministry of Education, Youth and Science and the Ministry of Economy, Energy
and Tourism, and by raising the caps of costs per trainee adequate to the neces-
sary training courses.
5. Reform of the national innovation system.
• The restructuring of scientific organizations in the country is a must.
Regular international evaluations should be introduced for the opera-
tion of all state-funded scientific organizations against targets and policy
objectives set in advance. The restructuring should establish more flex-
ible structures where mobility of scientists between organizations and
companies is possible; attract back Bulgarian scientists working abroad;
combine education and research and connect them to business. The es-
tablishment of a platform for increasing the quality of the research and
educational product is a fundamental problem which should be resolved
in this respect.
• Support for the establishment of intermediary units between research
organizations and business in the form of technology transfer offices,
innovation and enterprise centers, etc., as well as funding organizations
such as venture investment funds. The association of businesses for in-
novation ends by means of enhancing the functions of trade associations
of industry branches or the formation of clusters would support the de-
mand for innovations in the country.
6. Study, dissemination and introduction of best innovation practices of Bul-
garian and foreign companies and research organizations.
Measures for popularizing the role of innovation for the development of a knowledge-based economy should be provided in the updated and integrated
innovation strategy of Bulgaria. Best practices should be promoted, for exam-
ple through annual innovation and enterprise awards and/or by the develop-
ment of innovative journalism, particularly in national public media.

82
83I N N OVAT I O N . B G
Appendix: Methodological Notes, Sources of Information and Definitions
Innovation.bg comprises five groups of indicators which describe the national
innovation system and its functioning:
1. Gross innovation product.
2. Entrepreneurship and innovation networks.
3. Investments and financing of innovation.
4. Human capital for innovation.
5. Information and communication technologies.
Each group contains several synthetic indicators. Working definitions which
could differ from stricter theoretical definitions have been applied to the
groups and the indicators. The latter consist of various numbers of statisti-
cal values displayed graphically. They are grouped in way providing the most
comprehensive view of the respective component of the national innovation
system. The graphs representing the values are based on the internationally
recognized definitions and concepts.
The report uses innovation in its many forms and meanings. Innovation is the
adoption of a new or significantly improved idea, product, service, process or
practice in order to meet a certain need. The concept is also used in a narrower
sense in some parts of the report.
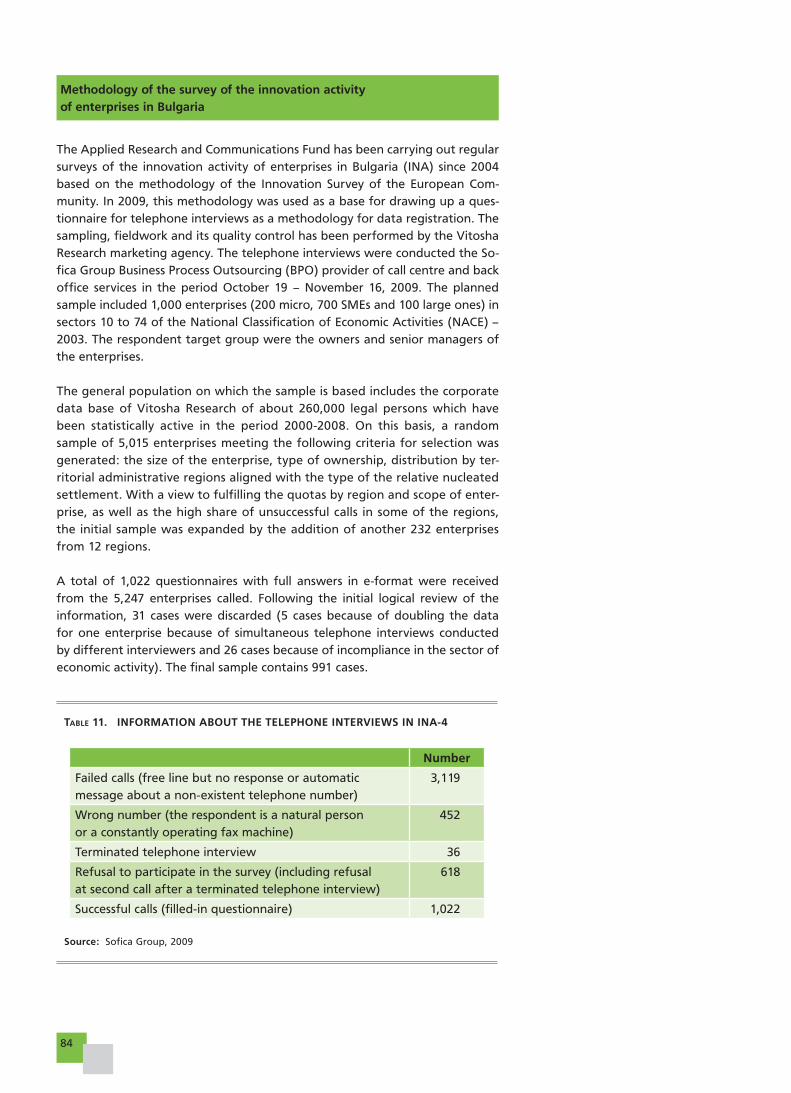
84
TABLE 11. INFORMATION ABOUT THE TELEPHONE INTERVIEWS IN INA-4
Source: Sofica Group, 2009
Number
Failed calls (free line but no response or automatic
message about a non-existent telephone number)
3,119
Wrong number (the respondent is a natural person
or a constantly operating fax machine)
452
Terminated telephone interview 36
Refusal to participate in the survey (including refusal
at second call after a terminated telephone interview)
618
Successful calls (filled-in questionnaire) 1,022
Methodology of the survey of the innovation activityof enterprises in Bulgaria
The Applied Research and Communications Fund has been carrying out regular
surveys of the innovation activity of enterprises in Bulgaria (INA) since 2004
based on the methodology of the Innovation Survey of the European Com-
munity. In 2009, this methodology was used as a base for drawing up a ques-
tionnaire for telephone interviews as a methodology for data registration. The
sampling, fieldwork and its quality control has been performed by the Vitosha
Research marketing agency. The telephone interviews were conducted the So-
fica Group Business Process Outsourcing (BPO) provider of call centre and back
office services in the period October 19 – November 16, 2009. The planned
sample included 1,000 enterprises (200 micro, 700 SMEs and 100 large ones) in
sectors 10 to 74 of the National Classification of Economic Activities (NACE) –
2003. The respondent target group were the owners and senior managers of
the enterprises.
The general population on which the sample is based includes the corporate
data base of Vitosha Research of about 260,000 legal persons which have
been statistically active in the period 2000-2008. On this basis, a random
sample of 5,015 enterprises meeting the following criteria for selection was
generated: the size of the enterprise, type of ownership, distribution by ter-
ritorial administrative regions aligned with the type of the relative nucleated
settlement. With a view to fulfilling the quotas by region and scope of enter-
prise, as well as the high share of unsuccessful calls in some of the regions,
the initial sample was expanded by the addition of another 232 enterprises
from 12 regions.
A total of 1,022 questionnaires with full answers in e-format were received
from the 5,247 enterprises called. Following the initial logical review of the
information, 31 cases were discarded (5 cases because of doubling the data
for one enterprise because of simultaneous telephone interviews conducted
by different interviewers and 26 cases because of incompliance in the sector of
economic activity). The final sample contains 991 cases.
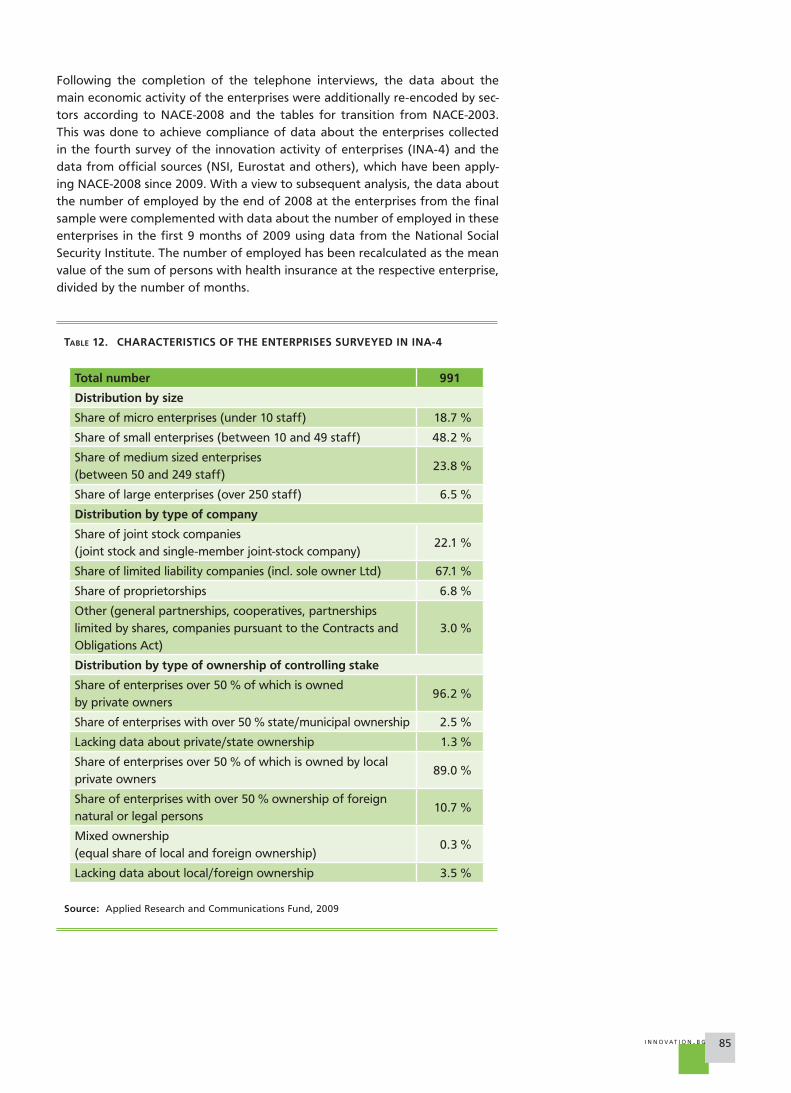
85I N N OVAT I O N . B G
TABLE 12. CHARACTERISTICS OF THE ENTERPRISES SURVEYED IN INA-4
Source: Applied Research and Communications Fund, 2009
Total number 991
Distribution by size
Share of micro enterprises (under 10 staff) 18.7 %
Share of small enterprises (between 10 and 49 staff) 48.2 %
Share of medium sized enterprises
(between 50 and 249 staff)23.8 %
Share of large enterprises (over 250 staff) 6.5 %
Distribution by type of company
Share of joint stock companies
(joint stock and single-member joint-stock company)22.1 %
Share of limited liability companies (incl. sole owner Ltd) 67.1 %
Share of proprietorships 6.8 %
Other (general partnerships, cooperatives, partnerships
limited by shares, companies pursuant to the Contracts and
Obligations Act)
3.0 %
Distribution by type of ownership of controlling stake
Share of enterprises over 50 % of which is owned
by private owners96.2 %
Share of enterprises with over 50 % state/municipal ownership 2.5 %
Lacking data about private/state ownership 1.3 %
Share of enterprises over 50 % of which is owned by local
private owners89.0 %
Share of enterprises with over 50 % ownership of foreign
natural or legal persons10.7 %
Mixed ownership
(equal share of local and foreign ownership)0.3 %
Lacking data about local/foreign ownership 3.5 %
Following the completion of the telephone interviews, the data about the
main economic activity of the enterprises were additionally re-encoded by sec-
tors according to NACE-2008 and the tables for transition from NACE-2003.
This was done to achieve compliance of data about the enterprises collected
in the fourth survey of the innovation activity of enterprises (INA-4) and the
data from official sources (NSI, Eurostat and others), which have been apply-
ing NACE-2008 since 2009. With a view to subsequent analysis, the data about
the number of employed by the end of 2008 at the enterprises from the final
sample were complemented with data about the number of employed in these
enterprises in the first 9 months of 2009 using data from the National Social
Security Institute. The number of employed has been recalculated as the mean
value of the sum of persons with health insurance at the respective enterprise,
divided by the number of months.
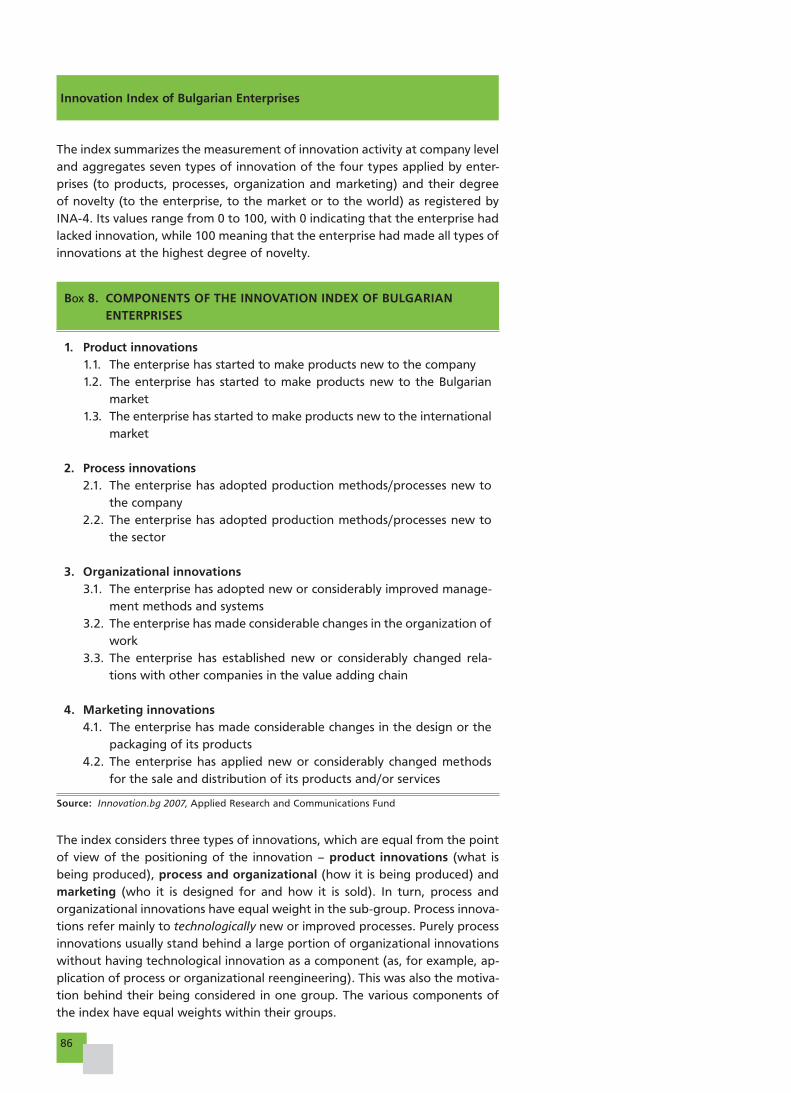
86
BOX 8. COMPONENTS OF THE INNOVATION INDEX OF BULGARIAN ENTERPRISES
1. Product innovations 1.1. The enterprise has started to make products new to the company
1.2. The enterprise has started to make products new to the Bulgarian
market
1.3. The enterprise has started to make products new to the international
market
2. Process innovations 2.1. The enterprise has adopted production methods/processes new to
the company
2.2. The enterprise has adopted production methods/processes new to
the sector
3. Organizational innovations3.1. The enterprise has adopted new or considerably improved manage-
ment methods and systems
3.2. The enterprise has made considerable changes in the organization of
work
3.3. The enterprise has established new or considerably changed rela-
tions with other companies in the value adding chain
4. Marketing innovations 4.1. The enterprise has made considerable changes in the design or the
packaging of its products
4.2. The enterprise has applied new or considerably changed methods
for the sale and distribution of its products and/or services
Source: Innovation.bg 2007, Applied Research and Communications Fund
Innovation Index of Bulgarian Enterprises
The index summarizes the measurement of innovation activity at company level
and aggregates seven types of innovation of the four types applied by enter-
prises (to products, processes, organization and marketing) and their degree
of novelty (to the enterprise, to the market or to the world) as registered by
INA-4. Its values range from 0 to 100, with 0 indicating that the enterprise had
lacked innovation, while 100 meaning that the enterprise had made all types of
innovations at the highest degree of novelty.
The index considers three types of innovations, which are equal from the point
of view of the positioning of the innovation – product innovations (what is
being produced), process and organizational (how it is being produced) and
marketing (who it is designed for and how it is sold). In turn, process and
organizational innovations have equal weight in the sub-group. Process innova-
tions refer mainly to technologically new or improved processes. Purely process
innovations usually stand behind a large portion of organizational innovations
without having technological innovation as a component (as, for example, ap-
plication of process or organizational reengineering). This was also the motiva-
tion behind their being considered in one group. The various components of
the index have equal weights within their groups.
87I N N OVAT I O N . B G
Availability of data, information sources and definitions
Innovation.bg contains secondary statistical and administrative data and data
from nationally representative surveys of enterprises conducted by the Applied
Research and Communications Fund. The report uses a number of freely acces-
sible Bulgarian and foreign sources, which in some cases has resulted in differ-
ences in time horizons, definitions of the used variables and graphically repre-
sented indicators. Detailed information about the sources used can be found
in the report and systematized information about the data used in Innova- tion.bg is available at www.arcfund.net and www.innovation.bg. The Applied
Research and Communications Fund updates the Innovation.bg report annu-
ally, aiming at making it a reliable and effective instrument for monitoring the
Bulgarian national innovation system.

88
89I N N OVAT I O N . B G
LITERATURE
A more research-intensive and integrated European Research Area; Science, Technology and Competitiveness key figures
report 2008/2009, Directorate-General for Research, European Commission, 2009. http://ec.europa.eu/research/era/
pdf/key-figures-report2008-2009_en.pdf
Boateng, S. K., Significant country differences in adult learning, Population and social conditions, Eurostat, Statistics in
focus, 44/2009.
Brynjolfsson, Erik The Productivity Paradox of Information Technology, Communications of the ACM, December, 1993.
Communication from the Commission to the European Parliament, the Council, the European Economic and Social
Committee and the Committee of the Regions, Reviewing Community innovation policy in a changing world,
Brussels, 2.9.2009, COM(2009) 442 final.
Council Regulation No 696 / 93 of 15 March 1993 on the statistical units for the observation and analysis of the
production system in the Community, OJ No L 76, p.1, section III/A of the annex; ISIC Rev. 3.1., p. 16-17, §§ 49-56;
ISIC Rev. 4, p. 16, §§ 77-79, 93-94.
e-Business W@tch, 2007, http://www.ebusiness-watch.org
Evaluation of the Finnish National Innovation System. Policy Report. 2009. Helsinki University Print.
Harhoff D., Ph.D.,”Economic Cost-Benefit Analysis of a Unified and Integrated European Patent Litigation System”,
26 February 2009, Tender No. MARKT/2008/06/D.
IMD World Competitiveness Online 1995-2009 (Updated: May 2009).
Indicators Programme. 2009, OECD Statistics Directorate.
Information Technology Outlook 2008, OECD, 2008.
Innobarometer 2009, Analytical Report, Innobarometer on Strategic trends in innovation 2006-2008, Flash EB #267,
European Commission, May 2009. http://cordis.europa.eu/innovation/en/policy/innobarometer.htm
Measuring Entrepreneurship. A Collection of Indicators. 2009 Edition. OECD-Eurostat Entrepreneurship.
Oslo Manual. Guidelines for Collecting and Interpreting Innovation Data 2005. OECD.
P.L. 96-517, Patent and Trademark Act Amendments of 1980, codified in 35 U.S. Code § 200-212, implemented by
37 Code of Federal Regulations 401.
Schumpeter, J. 2008 Capitalism, socialism, democracy, HarperCollins Publishers, New York and London.
Schumpeter, J. 2002. The theory of economic development, Transaction Publishers, New Brunswick, USA & London, UK.
Wright M., B. Clarysse, Ph. Mustar and A. Lockett. 2007. Academic Entrepreneurship in Europe. Edward Elgar Publishing,
Massachusetts, USA.
Ãîäèøåí îò÷åò çà 2008 ãîäèíà, ÑÑÀ, 2009.
Äîêëàä êúì ïðîåêòà çà Çàêîí çà äúðæàâíèÿ áþäæåò íà Ðåïóáëêà Áúëãàðèÿ çà 2010 ã., Ìèíèñòåðñòâî íà
ôèíàñòèòå.
Äîêëàä íà Êîìèñèÿòà çà îöåíÿâàíå íà íàó÷íîòî íèâî íà èíñòèòóòèòå íà Áúëãàðñêàòà àêàäåìèÿ íà íàóêèòå,
30 íîåìâðè 2009 ã.
Èíîâàöèè.áã 2009, Áúëãàðñêàòà èíîâàöèîííà ñèñòåìà â Åâðîïåéñêèÿ ñúþç, Ôîíäàöèÿ „Ïðèëîæíè èçñëåäâàíèÿ è
êîìóíèêàöèè”, 2007.
Èíîâàöèè.áã 2009, Áúëãàðñêàòà èíîâàöèîííà ñèñòåìà â óñëîâèÿòà íà ãëîáàëíà èêîíîìè÷åñêà êðèçà, Ôîíäàöèÿ
„Ïðèëîæíè èçñëåäâàíèÿ è êîìóíèêàöèè”, 2009.
Îò÷åò íà ÁÀÍ, 2006.
Îò÷åò íà ÁÀÍ, 2008.
Ïðåñòúïëåíèå áåç íàêàçàíèå: Ïðîòèâîäåéñòâèå íà êîðóïöèÿòà è îðãàíèçèðàíàòà ïðåñòúïíîñò â Áúëãàðèÿ,
Öåíòúð çà èçñëåäâàíå íà äåìîêðàöèÿòà, 2009.
Ïðîãðàìà íà ïðàâèòåëñòâîòî íà åâðîïåéñêîòî ðàçâèòèå íà Áúëãàðèÿ 2009-2013, http://www.government.bg/
fce/001/0226/files/03.11.2009FINAL-ednostranen%20pechat1.pdf
Ñòîïàíñêà êîíþíêòóðà. Áèçíåñ àíêåòè íà ÍÑÈ, íîåìâðè 2009.
Ñúîáùåíèå íà Êîìèñèÿòà äî Åâðîïåéñêèÿ ïàðëàìåíò è Ñúâåòà, „Óñúâúðøåíñòâàíå íà ïàòåíòíàòà ñèñòåìà
â Åâðîïà”, COM (2007) 29-03-07.
INN
OVATIO
N.B
G 2010 ��
��������
Innovation����WWW.ARCFUND.NET
Applied Research and Communications Fund
5 Alexander Zhendov Street, Sofia 1113
tel.: +359 (2) 973 3000 fax: +359 (2) 973 3588
www.arcfund.net
APPLIED RESEARCH AND COMMUNICATIONS FUND
The Applied Research and Communications Fund is a Bulgarian research non-profit organization, registered in public benefit, established in 1991. Its mission is to support the development of innovation and the knowledge economy in Bulgaria through:
■ advice and advocacy on establishing national, regional and local level policies and strategies for the country’s successful integration into the global innovation economy;
■ research and analyses of development trends and policy options for supporting innovation as well as information and communication technologies;
■ public-private partnerships among businesses, public institutions, the academic community and civil society for addressing specific issues of ICT and innovation based competitiveness.
The Applied Research and Communications Fund has set up two functional units for the provision of IT and consulting services:
■ European Innovation Centre – Bulgaria is part of the largest information and consultancy support network in Europe: Enterprise Europe Network, and coordinates its work in Bulgaria. The Network aims to assist small and medium-sized enterprises in their innovation potential development and to raise their awareness about the European Commission’s business-oriented policies.
■ ARC Consulting EOOD is the consulting arm of the Applied Research and Communications Fund. The company offers consulting services in the fields of innovation and information and communication technologies, as well as advisory services in the design and implementation of national and international projects under the EU Framework Programs, the Cohesion and Structural Funds.


![[MS-RPL]: Report Page Layout (RPL) Binary Stream Format€¦ · MS-RPL] —. stream report. report page. report report report](https://img.pdfslide.us/doc/110x75/5fd9f7a7a90b7c34145fa364/ms-rpl-report-page-layout-rpl-binary-stream-format-ms-rpl-a-stream-report.jpg)


![For The Region: Report, Report, Report [Eng]](https://img.pdfslide.us/doc/110x75/579079761a28ab6874c751c6/for-the-region-report-report-report-eng.jpg)