Embed Size (px)
Citation preview
Perusahaan Umum Listrik Negara
Republic of Indonesia
STUDY
FOR
REHABILITATION OF HYDROPOWER STATIONS
IN
INDONESIA
FINAL REPORT
(MAIN REPORT)
September 2010
JAPAN INTERNATIONAL COOPERATION AGENCY
NIPPON KOEI CO., LTD.
Perusahaan Umum Listrik Negara
Republic of Indonesia
STUDY
FOR
REHABILITATION OF HYDROPOWER STATIONS
IN
INDONESIA
FINAL REPORT
(MAIN REPORT)
September 2010
JAPAN INTERNATIONAL COOPERATION AGENCY
NIPPON KOEI CO., LTD.
IDDJR
10 - 091
STUDY
FOR
REHABILITATION OF HYDROPOWER STATIONS
IN
INDONESIA
Final Report
September 2010
Japan International Cooperation Agency
NIPPON KOEI CO., LTD.

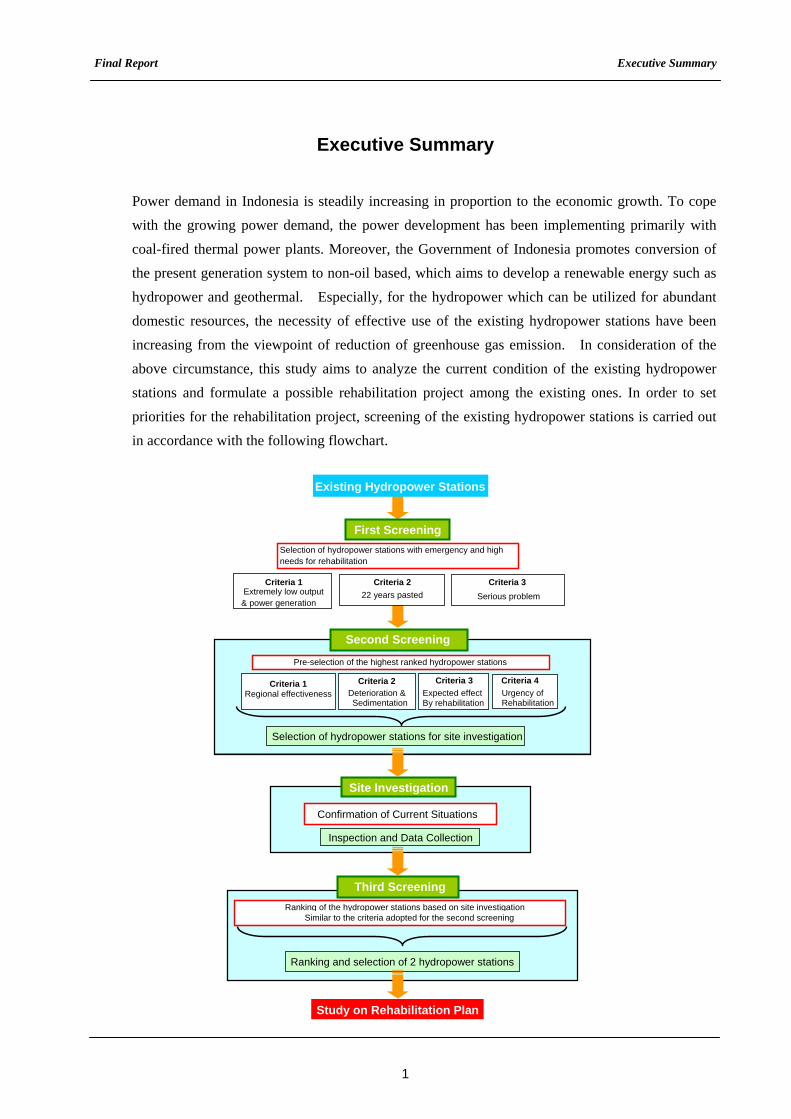
Executive Summary
Final Report Executive Summary
1
Executive Summary
Power demand in Indonesia is steadily increasing in proportion to the economic growth. To cope
with the growing power demand, the power development has been implementing primarily with
coal-fired thermal power plants. Moreover, the Government of Indonesia promotes conversion of
the present generation system to non-oil based, which aims to develop a renewable energy such as
hydropower and geothermal. Especially, for the hydropower which can be utilized for abundant
domestic resources, the necessity of effective use of the existing hydropower stations have been
increasing from the viewpoint of reduction of greenhouse gas emission. In consideration of the
above circumstance, this study aims to analyze the current condition of the existing hydropower
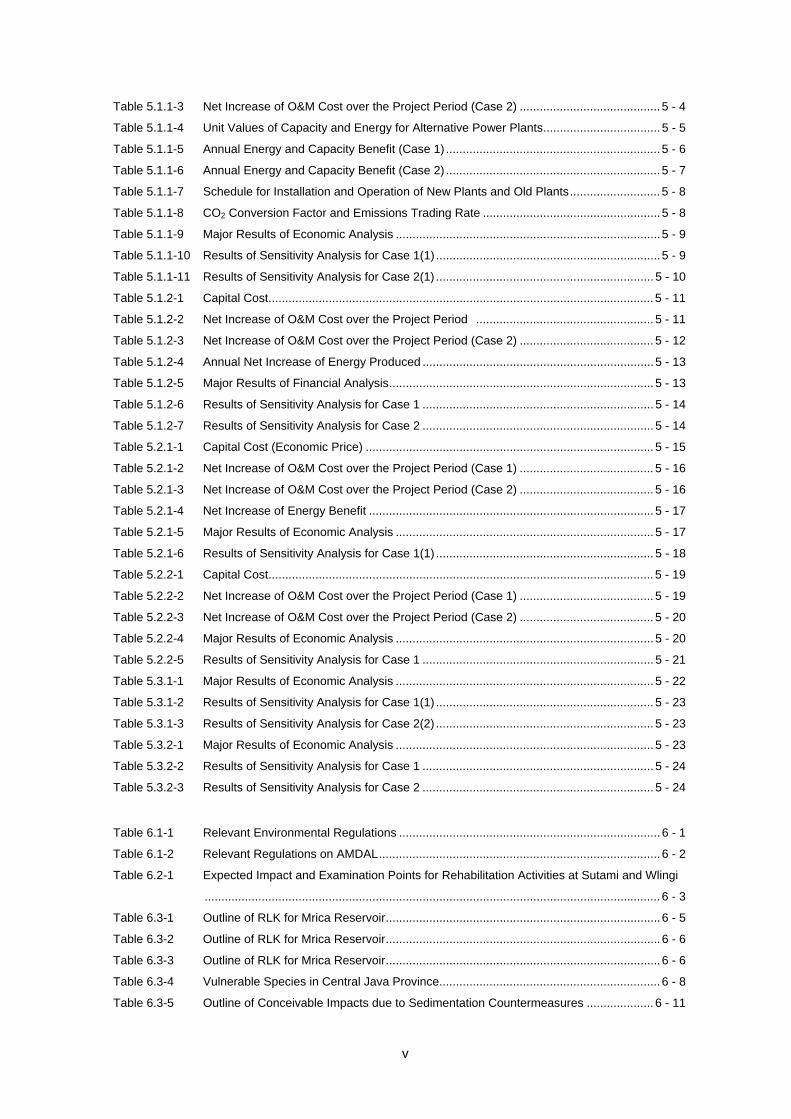
stations and formulate a possible rehabilitation project among the existing ones. In order to set
priorities for the rehabilitation project, screening of the existing hydropower stations is carried out
in accordance with the following flowchart.
Existing Hydropower Stations
Criteria 1 Extremely low output & power generation
Criteria 2
22 years pasted
Site Investigation
Criteria 3
Serious problem
Confirmation of Current Situations
Inspection and Data Collection
First Screening
Selection of hydropower stations with emergency and highneeds for rehabilitation
Second Screening
Pre-selection of the highest ranked hydropower stations
Criteria 1 Regional effectiveness
Criteria 2Deterioration & Sedimentation
Criteria 3
Expected effect By rehabilitation
Criteria 4
Urgency of Rehabilitation
Selection of hydropower stations for site investigation
Study on Rehabilitation Plan
Third Screening
Ranking of the hydropower stations based on site investigationSimilar to the criteria adopted for the second screening
Ranking and selection of 2 hydropower stations
Final Report Executive Summary
2
Total 46 hydropower stations exist in the whole Indonesia excluding small-size, but information of
25 hydropower stations were presented by PLN for this study. As the results of the first and second
screening, 4 hydropower stations located in Java Island as described below were selected with high
priorities given based on the criteria of i) regional effectiveness, ii) degree of deterioration, iii)
degree of sedimentation, iv) expected effect of rehabilitation, and iv) urgency of rehabilitation.
Consequently, site investigation for those hydropower stations was carried out to recognize the
current situations. Observations under the site investigations are summarized as follows:
Sutami (Karangkates) Hydropower Station (105 MW) in East Java
Sutami has been operating for over 36 year since1973. The existing generating equipment was
designed based on the technology and practice in the 1970’s, and major components such as turbine
runner, generator windings and control and protection panel have not yet been rehabilitated to date.
Corrosion of turbine runner by cavitations pitting was observed and residual life of the generator
windings has been evaluated at 2~3 years. In addition, spare parts for the original equipment are
difficult to find in the market.
Wlingi Hydropower Station (54 MW) in East Java
Wlingi has been operating for over 31 years as a cascade power station of Sutami since 1978. The
existing generating equipment was designed based on the technology and practice in the 1970’s,
and major components such as turbine runner, generator windings and control and protection panel
have not yet been rehabilitated to date.
Soedirman (Mrica) Hydropower Station (180.9 MW) in Central Java
Soedirman has been operating for 21 years since 1988. The reservoir is facing a serious
sedimentation problem, but the power generation is not affected at the moment. The annual
sedimentation to the reservoir with about 4.2 MCM, which is more than expected, has been
experienced. IP has predicted that in 2014, 80% of the gross reservoir capacity will be buried and
sedimentation will reach up to the HWL in 2021. Under these circumstances, watershed
management is executing such as construction of sabo dams and campaign to residents on the
present growing crop conversion. However, because of the huge amount of sedimentation, it is very
questionable whether the watershed management countermeasures can solve the sedimentation
problems or not.
The Soedirman (Mrica) Reservoir is utilized for downstream irrigation water supply (10,000 ha)
and flood control besides power generation. Implementation of the radical countermeasures to
solve the sedimentation problems should be carried out not only to keep function of water
utilization but also to ensure flood control function of the Soedirman (Mrica) Reservoir.
Final Report Executive Summary
3
Saguling Hydropower Station (700 MW) in West Java
Saguling has been operating for 24 years since 1985. Control system was replaced with the modern
computerized system in 2002. Due to water quality with chemical contents, the cooling water
system suffers from frequent cleaning of filters. Thus, the existing cooling water pipes including
the existing governor system is scheduled to be replaced under the financial assistance of JBIC
export credit line.
The annual sedimentation to the reservoir is observed at around 4 MCM. However, since the
reservoir capacity is very large (875 MCM), it can still be functional for around 30 years from now.
The problems at the moment are the reservoir water pollution and intruded waste materials from
households. The study for the water resources management plan in the Citarum River basin
including the reservoir watershed is now on-going under the technical assistance of ADB.
Result of Screening
Taking results of the site investigation into consideration, the following hydropower stations are
selected to make a study for rehabilitation work or countermeasure as the highest ranked projects at
the third screening.
1) Rehabilitation work for the generating equipment in Sutami Hydropower Station
2) Countermeasure for sedimentation in Soedirman (Mrica) Reservoir
In addition to the study for rehabilitation work of Sutami, a rehabilitation project combined with
Wlingi is proposed to be made to enhance effectiveness of the rehabilitation because the both
hydropower stations were constructed in the 1970’s as cascade power stations in the Brantas River.
Results of the study for the rehabilitation project for Sutami and Wlingi, and countermeasure for
Soedirman (Mrica) reservoir are summarized as follows
Rehabilitation Project in Sutami and Wlingi Hydropower Stations
Replacement of major components of the generating equipment is recommended and outline of the
rehabilitation project is described as follows.
1) Scope of Rehabilitation Works
For Sutami Hydropower Station
Replacement of turbine runner, guide vanes, turbine bearing, inlet valve, governor, generator
stator and rotor windings, thrust bearing, AVR and control and protection panels
For Wlingi Hydropower Station
Replacement of runner blade, runner hub, guide vanes, turbine bearing, governor, generator
stator and rotor windings, thrust bearing and control and protection panels
2) Implementation Period for Sutami and Wlingi Hydropower Stations
Overall: 5 years including;
Final Report Executive Summary
4
- Consultancy services: 1.5 years (including Consultant tender, design and preparation of
Tender Documents)
- Tender for rehabilitation work: 0.5 years
- Manufacturing and delivery of equipment: 1.5 years
- Rehabilitation work at site: 1.5 years (unit by unit for Sutami and Wlingi)
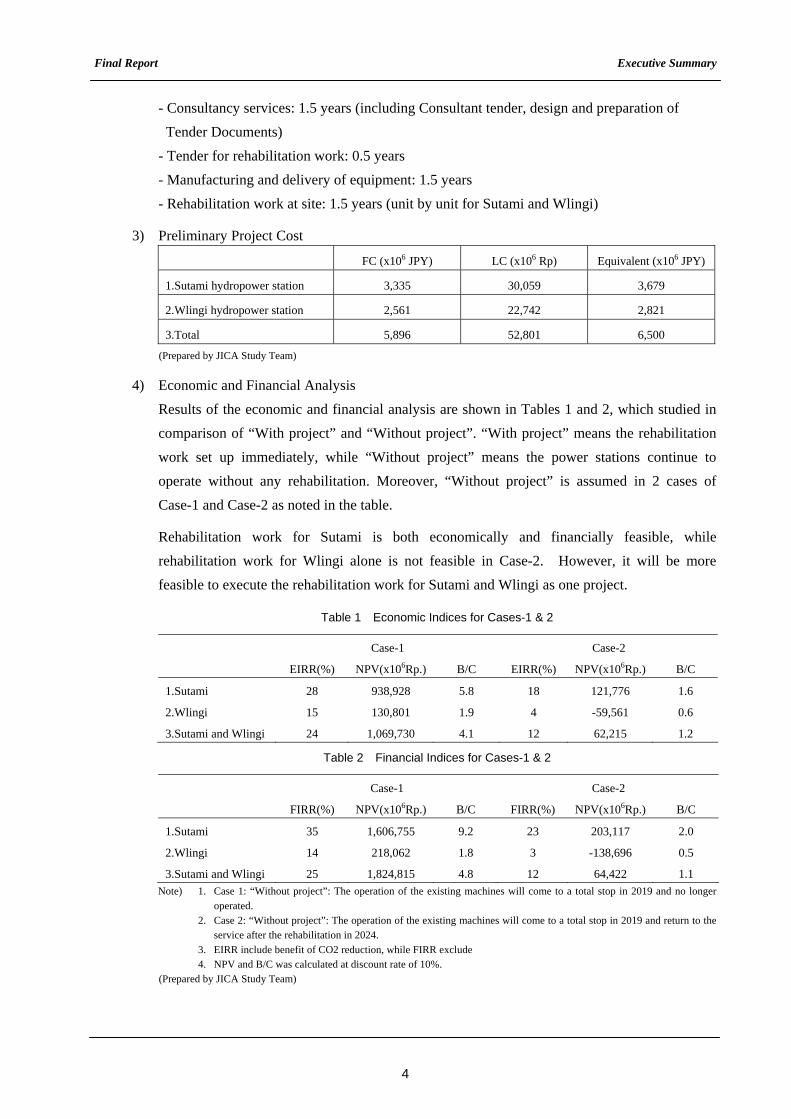
3) Preliminary Project Cost
FC (x106 JPY) LC (x106 Rp) Equivalent (x106 JPY)
1.Sutami hydropower station 3,335 30,059 3,679
2.Wlingi hydropower station 2,561 22,742 2,821
3.Total 5,896 52,801 6,500
(Prepared by JICA Study Team)
4) Economic and Financial Analysis
Results of the economic and financial analysis are shown in Tables 1 and 2, which studied in
comparison of “With project” and “Without project”. “With project” means the rehabilitation
work set up immediately, while “Without project” means the power stations continue to
operate without any rehabilitation. Moreover, “Without project” is assumed in 2 cases of
Case-1 and Case-2 as noted in the table.
Rehabilitation work for Sutami is both economically and financially feasible, while
rehabilitation work for Wlingi alone is not feasible in Case-2. However, it will be more
feasible to execute the rehabilitation work for Sutami and Wlingi as one project.
Table 1 Economic Indices for Cases-1 & 2
Case-1 Case-2
EIRR(%) NPV(x106Rp.) B/C EIRR(%) NPV(x106Rp.) B/C
1.Sutami 28 938,928 5.8 18 121,776 1.6
2.Wlingi 15 130,801 1.9 4 -59,561 0.6
3.Sutami and Wlingi 24 1,069,730 4.1 12 62,215 1.2
Table 2 Financial Indices for Cases-1 & 2
Case-1 Case-2
FIRR(%) NPV(x106Rp.) B/C FIRR(%) NPV(x106Rp.) B/C
1.Sutami 35 1,606,755 9.2 23 203,117 2.0
2.Wlingi 14 218,062 1.8 3 -138,696 0.5
3.Sutami and Wlingi 25 1,824,815 4.8 12 64,422 1.1
Note) 1. Case 1: “Without project”: The operation of the existing machines will come to a total stop in 2019 and no longer operated.
2. Case 2: “Without project”: The operation of the existing machines will come to a total stop in 2019 and return to the service after the rehabilitation in 2024.
3. EIRR include benefit of CO2 reduction, while FIRR exclude 4. NPV and B/C was calculated at discount rate of 10%. (Prepared by JICA Study Team)
Final Report Executive Summary
5
5) Expected Effect of Rehabilitation
Sutami and Wlingi place high priority not only for power distribution to the regional area, but
also for power supply of black start of Paiton thermal power plant (3,300MW) located in East
Java. Upon renovating the major components, Sutami and Wlingi are expected to have an
extended life of another 40 years, and thus Sutami and Wlingi continue to play an important
function for reliable and stable power supply in the regional area.
Countermeasure for Sedimentation of Soedirman (Mrica) Reservoir
In order to solve the serious sediment problems in the Serayu River basin, the local government
and IP have carried out lots of examination and countermeasures so far. Referring to actual
examples of sediment countermeasures in Japan, The sediment countermeasures in the Serayu
River basin from the sustainable sediment management point of view are examined and results of
the study are summarized as follows:
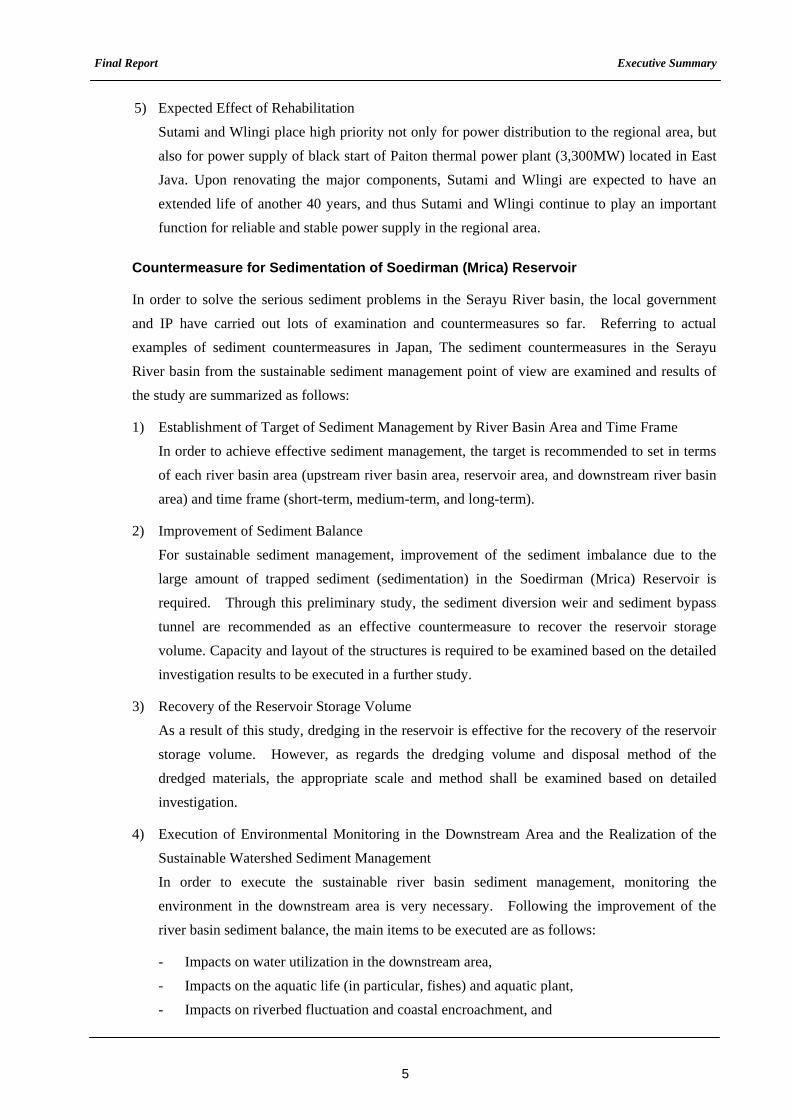
1) Establishment of Target of Sediment Management by River Basin Area and Time Frame
In order to achieve effective sediment management, the target is recommended to set in terms
of each river basin area (upstream river basin area, reservoir area, and downstream river basin
area) and time frame (short-term, medium-term, and long-term).
2) Improvement of Sediment Balance
For sustainable sediment management, improvement of the sediment imbalance due to the
large amount of trapped sediment (sedimentation) in the Soedirman (Mrica) Reservoir is
required. Through this preliminary study, the sediment diversion weir and sediment bypass
tunnel are recommended as an effective countermeasure to recover the reservoir storage
volume. Capacity and layout of the structures is required to be examined based on the detailed
investigation results to be executed in a further study.
3) Recovery of the Reservoir Storage Volume
As a result of this study, dredging in the reservoir is effective for the recovery of the reservoir
storage volume. However, as regards the dredging volume and disposal method of the
dredged materials, the appropriate scale and method shall be examined based on detailed
investigation.
4) Execution of Environmental Monitoring in the Downstream Area and the Realization of the
Sustainable Watershed Sediment Management
In order to execute the sustainable river basin sediment management, monitoring the
environment in the downstream area is very necessary. Following the improvement of the
river basin sediment balance, the main items to be executed are as follows:
- Impacts on water utilization in the downstream area,
- Impacts on the aquatic life (in particular, fishes) and aquatic plant,
- Impacts on riverbed fluctuation and coastal encroachment, and
Final Report Executive Summary
6
- Impacts on the structures of the river and seashore.
Finally, the sustainable river basin sediment management adopt the PDCA cycle.
5) Future Vision of the Watershed Sediment Management
The future vision of the sustainable sediment management in the Serayu River basin (i.e.,
long-term target) is summarized in Table 3.
Table 3 Future Vision of River Basin Sediment Management
Area Target of the Sediment
Management Countermeasures to be Implemented /
Operation and Maintenance Up-stream Basin
Area
- Trapping of bed load
- Reduction of sediment inflow
- Sabo dams construction and the maintenance
- Reforestation
- River basin conservation countermeasure
Reservoir Area - Passing the sediment inflow
- Recovery of the reservoir storage
volume
- Construction of sediment bypass tunnel and
appropriate operation and maintenance
- Execution of dredging in the reservoir and
appropriate disposal of the dredged material
Downstream
Basin Area
- Improvement of sediment balance
- Minimizing the negative impact in
the downstream area and maximizing
the positive impact in the whole area
- Execution of the environmental monitoring
- Execution of the sustainable sediment monitoring
through the PDCA cycle
(Prepared by JICA Study Team)
6) Comprehensive Master Plan for the Watershed Sediment Management and Urgent
Countermeasure
The comprehensive master plan for the watershed sediment management is recommended to
execute first and then the road map for the appropriate sediment balance planning,
sedimentation countermeasures, and Operation and Maintenance planning are prepared.
Based on the master plan, the urgent sedimentation countermeasures in the Serayu River basin
are required.
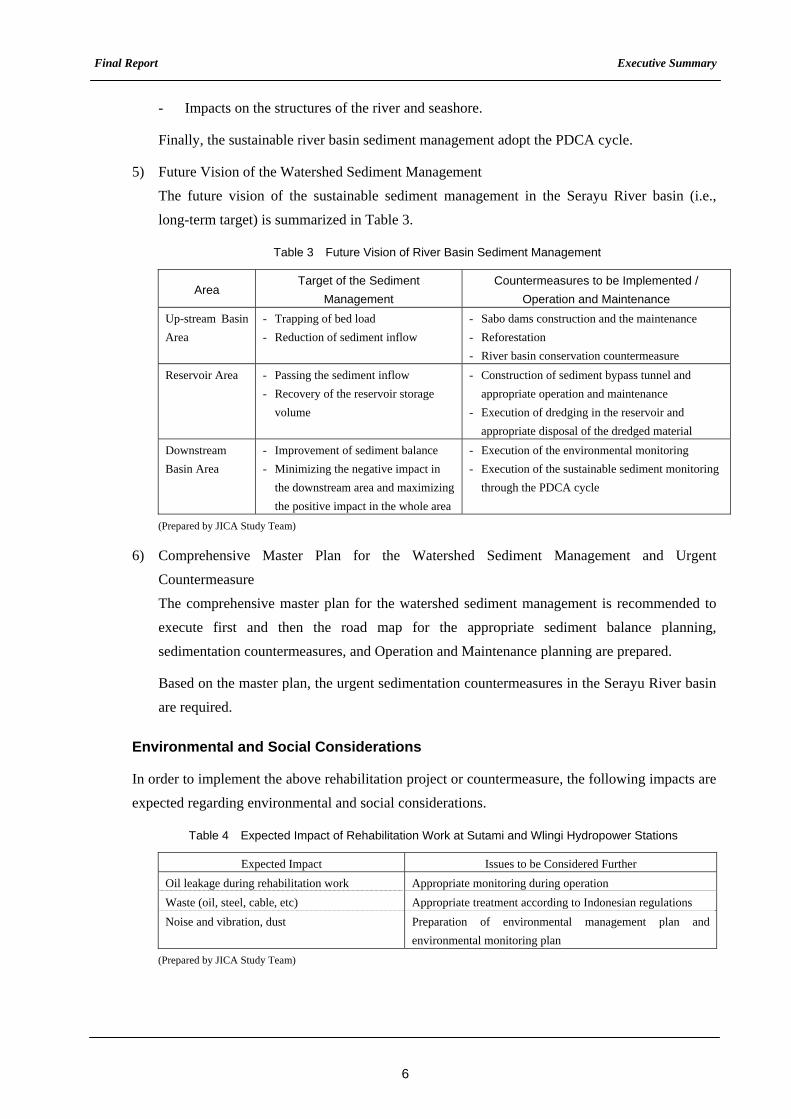
Environmental and Social Considerations
In order to implement the above rehabilitation project or countermeasure, the following impacts are
expected regarding environmental and social considerations.
Table 4 Expected Impact of Rehabilitation Work at Sutami and Wlingi Hydropower Stations
Expected Impact Issues to be Considered Further
Oil leakage during rehabilitation work Appropriate monitoring during operation
Waste (oil, steel, cable, etc) Appropriate treatment according to Indonesian regulations
Noise and vibration, dust Preparation of environmental management plan and
environmental monitoring plan
(Prepared by JICA Study Team)
Final Report Executive Summary
7
Table 5 Expected Impact of Sediment Countermeasure at Mrica Reservoir and Serayu River Basin
Expected Impact Issues to be Considered Further
Impact on water use at downstream area Confirmation of water use and land use at downstream area
Impact on aquatic environment Examination of impact on fishery at downstream area
Possibility of land acquisition and involuntary
resettlement due to construction of weir
Conduct of appropriate consultation with land owners
Impact on existing infrastructure due to change
of river bed level
Examination of impact on existing infrastructure such as
bridges or banks
(Prepared by JICA Study Team)
Conclusions and Recommendation
1) Rehabilitation Project in Sutami and Wlingi Hydropower Stations
The reliable life of hydropower plant prior to major rehabilitation is typically estimated
between 30 and 50 years. Sutami and Wlingi hydropower stations were constructed in the
1970’s and their operating years nearly reach their reliable lives. The opportune time for
starting rehabilitation should be prior to the equipment experiencing frequent and severe
problems with its major components. To avoid long term stoppage due to a severe problem
and/or non availability of spare parts for damaged components, it is recommended that the
appropriate time for rehabilitation for Sutami and Wlingi shall be initiated prior to shutdown
by a severe problem of the major components later on in the near future, so as to minimize
significant loss of revenue.
2) Countermeasure for Sedimentation of Soedirman (Mrica) Reservoir
For the sustainable sediment management in the Serayu River basin, the watershed sediment
management is required to be planned and executed to maximize the whole benefit in the
Serayu River basin. From this point of view, organization of the implementation and
Operation and Maintenance for the watershed sediment management is recommended as
follows:
- Establishment of the Organization for the Watershed Sediment Management
- Participation of the Residents in Decision Making, Planning, Operation and Maintenance -
Initiation of Watershed Sediment Management with Financial Support
- Implementation of the Master Plan for Watershed Sediment Management in Serayu River
basin.

Contents
i
Study for Rehabilitaiton of Hydropower Stations in Indonesia
Final Report
Contents
Executive Summary
Chapter 1 Introduction 1.1 Background........................................................................................................................... 1 - 1 1.2 Purpose of Study................................................................................................................... 1 - 2 1.3 Study Team and Schedule....................................................................................................1 - 2
1.3.1 Study Team .............................................................................................................. 1 - 2 1.3.2 Study Schedule ........................................................................................................ 1 - 2
Chapter 2 Current Status of Power Sector
2.1 Power Supply and Demand .................................................................................................. 2 - 1 2.1.1 Outline of Power Sector............................................................................................ 2 - 1 2.1.2 Outline of PLN and Organization Structure...............................................................2 - 5
2.2 Power Development Plan...................................................................................................... 2 - 6
Chapter 3 Screening of Hydropower Stations
3.1 Methodology of Screening of Existing Hydropower Stations................................................. 3 - 1 3.1.1 Existing Hydropower Stations...................................................................................3 - 1 3.1.2 Methodology for the Screening of Existing Hydropower Stations ............................. 3 - 2
3.2 First Screening...................................................................................................................... 3 - 5 3.2.1 List of Hydropower Stations......................................................................................3 - 5 3.2.2 Study of First Screening ........................................................................................... 3 - 6 3.2.3 Result of First Screening ........................................................................................ 3 - 11
3.3 Second Screeing................................................................................................................. 3 - 12 3.3.1 Criteria .................................................................................................................... 3 - 12 3.3.2 Evaluation of Second Screening............................................................................. 3 - 12 3.3.3 Results of Second Screening ................................................................................. 3 - 15
3.4 Site Investigations ............................................................................................................... 3 - 17 3.4.1 Current Conditions of Sutami Hydropower Station ................................................. 3 - 17 3.4.2 Current Conditions of Wlingi Hydropower Station................................................... 3 - 29 3.4.3 Current Conditions of Soedirman Hydropower Station ........................................... 3 - 36 3.4.4 Current Conditions of Saguling Hydropower Station .............................................. 3 - 44
3.5 Third Screening................................................................................................................... 3 - 49 3.5.1 Criteria .................................................................................................................. 3 - 49 3.5.2 Evaluation of Third Screening ............................................................................... 3 - 49 3.5.3 Results of Third Screening .................................................................................... 3 - 54
Chapter 4 Rehabilitation Works for Hydropower Stations
4.1 Sutami and Wlingi Hydropower Stations ...............................................................................4 - 1 4.1.1 Basic Concept for Rehabilitation Works ...................................................................4 - 1 4.1.2 Rehabilitation Works................................................................................................. 4 - 2 4.1.3 Effectiveness of the Rehabilitation Works............................................................... 4 - 12 4.1.4 Project Financial Cost............................................................................................. 4 - 18 4.1.5 Implementation of Rehabilitaiton Works ................................................................. 4 - 19
4.2 Soedirman (Mrica) Hydropower Station .............................................................................. 4 - 21 4.2.1 General................................................................................................................... 4 - 21
ii
4.2.2 Sustainable Watershed Sediment Management..................................................... 4 - 27 4.2.3 Supplementary Study on Sediment Countermeasures........................................... 4 - 32 4.2.4 Conclusion.............................................................................................................. 4 - 37
Chapter 5 Economic and Financial Analysis
5.1 Economic and Financial Analysis of Rehabilitation Work for Sutami..................................... 5 - 1 5.1.1 Economic Analysis .................................................................................................. 5 - 1 5.1.2 Financial Analysis .................................................................................................5 - 10
5.2 Economic and Financial Analysis of Rehabilitation Work for Wlingi .................................... 5 - 15 5.2.1 Economic Analysis ................................................................................................ 5 - 15 5.2.2 Financial Analysis .................................................................................................5 - 18
5.3 Economic and Financial Analysis of Rehabilitation Work for Sutami and Wlingi ................. 5 - 22 5.3.1 Calculation of EIRR .............................................................................................. 5 - 22 5.3.2 Calculation of FIRR ............................................................................................... 5 - 23
Chapter 6 Environmental and Social Considerations
6.1 Basic information................................................................................................................... 6 - 1 6.1.1 Objectives................................................................................................................. 6 - 1 6.1.2 Regulations and Administrative Framework .............................................................6 - 1
6.2 Environmental Considerations for Rehabilitation Activities at Sutami and Wlingi.................. 6 - 3 6.3 Environmental Considerations for Mrica Reservoir ...............................................................6 - 4
6.3.1 Current Condition ..................................................................................................... 6 - 4 6.3.2 Recognition of Problems .......................................................................................... 6 - 9 6.3.3 Suggestions for Next Stage ...................................................................................... 6 - 9 6.3.4 Items to be examined Further................................................................................. 6 - 12
6.4 Environmental Checklist in the JBIC Guidelines ................................................................. 6 - 14 6.5 Environmental and Social Issues of Brantas River Basin and Saguling Reservoir.............. 6 - 15
6.5.1 Current Condition of the Brantas River Basin ......................................................... 6 - 15 6.5.2 Recognition of Problems ........................................................................................ 6 - 21 6.5.3 Suggestions for the Next Stage .............................................................................. 6 - 21
Chapter 7 Conclusions and Recommendations
7.1 Conclusions ......................................................................................................................... 7 - 1 7.2 Recommendations .............................................................................................................. 7 - 9
7.2.1 Rehabilitation Works at Sutami and Wlingi Hydropower Stations............................. 7 - 9 7.2.2 Watershed Sediment Management for Serayu River Basin.................................... 7 - 11
Appendices
Appendix A List of existing Hydropower Stations in Indonesia
Appendix B Principal Feature of Priority Projects
Appendix C Result of Site Investigation
Appendix D Site Investigation Report for Sutami (2004)
Appendix E Power and Energy Calculation of Sutami and Wlingi
Appendix F Cash Flow for Rehabilitation Works for Sutami and Wilingi
Appendix G Photos

iii
ANNEX
as a supplementary volume
ANNEX A Geology of Project Sites
ANNEX B Preliminary Study of Sediment Countermeasure for Soedirman (Mrica) Reservoir (For
Reference)
ANNEX C Sedimentation Control : Part II Intensive Measures the Inside of The Mrica Reservoir, Central
Java
ANNEX D Socio-cultural Perspective on Effect of Soil Erosion from Upland Cultivation Fields (A Case
Study : Mrica Watershed, Central Java)
iv
Tables
Table 1.3.1-1 Member List of the Study Team ...................................................................................... 1 - 2
Table 2.1.1-1 Installed Capacity and Available Capacity ...................................................................... 2 - 3
Table 2.1.2-1 Services of PLN on Power Utility classified by Region.................................................... 2 - 5
Table 2.1.2-2 Supply Cost and Power Tariff Rate (2002~2008)............................................................ 2 - 6
Table 2.2.2-1 Power Development Plan of Hydropower .......................................................................2 - 8
Table 3.2.1-1 List of Existing Hydropower Stations given by PLN......................................................... 3 - 5
Table 3.2.2-1 Output and Power Generation of Existing Hydropower Stations ..................................... 3 - 7
Table 3.2.2-2 Hydropower Stations Operating for more than 22 Years................................................. 3 - 9
Table 3.2.2-3 Current Issues and Past Rehabilitations of Existing Hydropower Stations.................... 3 - 10
Table 3.2.3-1 Selected Hydropower Stations during First Screening .................................................. 3 - 12
Table 3.3.2-1 Power Balance (MW) in Year 2008 ............................................................................... 3 - 13
Table 3.3.2-2 Output/Generation of Candidate Hydropower Sations .................................................. 3 - 15
Table 3.3.3-1 Selected Hydropower Stations Based on Second Screening........................................ 3 - 16
Table 3.4.1-1 Prediction of Sedimentation in Sutami Reservoir .......................................................... 3 - 26
Table 3.4.1-2 Annual Dredging Volume in Sutami Reservoir .............................................................. 3 - 27
Table 3.4.2-1 Annual Dredging and Sand Flushing Volume ...............................................................3 - 35
Table 3.4.3-1 Maintenance and Monitoring Activities for the Dam and Civil Structures ...................... 3 - 39
Table 3.5.2-1 Results of Third Screening............................................................................................ 3 - 49
Table 3.5.2-2 Power Flow in East Area in East Java (March 3,2010) ................................................. 3 - 50
Table 3.5.2-3 Main Roles of Candidate Hydropower Stations............................................................. 3 - 53
Table 4.1.2-1 Major Components of Generating Equipment ................................................................. 4 - 2
Table 4.1.2-2 Evaluation of Major Components of Generating Equipment ........................................... 4 - 3
Table 4.1.2-3 Evaluation of Major Components of Generating Equipment (Wlingi) .............................. 4 - 8
Table 4.1.3-1 Potential Total Gain in Efficiency from Replacement of Francis Runner ....................... 4 - 14
Table 4.1.3-2 Combination of Operated Generating Equipment ......................................................... 4 - 16
Table 4.1.3-3 Power Generation Simulation Results in Sutami........................................................... 4 - 17
Table 4.1.4-1 Estimated Project Financial Cost for Sutami and Wlingi ............................................... 4 - 19
Table 4.2.1-1 Difference Ratio between Initial Storage Volume and Current Volume in Mrica Reservoir
...................................................................................................................................... 4 - 22
Table 4.2.1-2 Sediment Flushing Volume ........................................................................................... 4 - 23
Table 4.2.2-1 Implementation Policy of Watershed Sediment Management....................................... 4 - 31
Table 4.2.3-1 Comparison of Sediment Routing Countermeasure...................................................... 4 - 33
Table 4.2.3-2 Comparison on Methods of Recovering of Effective Storage Volume........................... 4 - 34
Table 4.2.3-3 Disposal Method for Dredging Work ............................................................................. 4 - 35
Table 4.2.4-1 Future Vision of River Basin Sediment Management.................................................... 4 - 39
Table 5.1.1-1 Capital Cost (Economic Price) ........................................................................................ 5 - 2
Table 5.1.1-2 Net Increase of O&M Cost over the Project Period (Case 1) .......................................... 5 - 3
v
Table 5.1.1-3 Net Increase of O&M Cost over the Project Period (Case 2) .......................................... 5 - 4
Table 5.1.1-4 Unit Values of Capacity and Energy for Alternative Power Plants...................................5 - 5
Table 5.1.1-5 Annual Energy and Capacity Benefit (Case 1) ................................................................ 5 - 6
Table 5.1.1-6 Annual Energy and Capacity Benefit (Case 2) ................................................................ 5 - 7
Table 5.1.1-7 Schedule for Installation and Operation of New Plants and Old Plants........................... 5 - 8
Table 5.1.1-8 CO2 Conversion Factor and Emissions Trading Rate .....................................................5 - 8
Table 5.1.1-9 Major Results of Economic Analysis ...............................................................................5 - 9
Table 5.1.1-10 Results of Sensitivity Analysis for Case 1(1) ...................................................................5 - 9
Table 5.1.1-11 Results of Sensitivity Analysis for Case 2(1) ................................................................. 5 - 10
Table 5.1.2-1 Capital Cost................................................................................................................... 5 - 11
Table 5.1.2-2 Net Increase of O&M Cost over the Project Period ..................................................... 5 - 11
Table 5.1.2-3 Net Increase of O&M Cost over the Project Period (Case 2) ........................................ 5 - 12
Table 5.1.2-4 Annual Net Increase of Energy Produced .....................................................................5 - 13
Table 5.1.2-5 Major Results of Financial Analysis............................................................................... 5 - 13
Table 5.1.2-6 Results of Sensitivity Analysis for Case 1 ..................................................................... 5 - 14
Table 5.1.2-7 Results of Sensitivity Analysis for Case 2 ..................................................................... 5 - 14
Table 5.2.1-1 Capital Cost (Economic Price) ...................................................................................... 5 - 15
Table 5.2.1-2 Net Increase of O&M Cost over the Project Period (Case 1) ........................................ 5 - 16
Table 5.2.1-3 Net Increase of O&M Cost over the Project Period (Case 2) ........................................ 5 - 16
Table 5.2.1-4 Net Increase of Energy Benefit ..................................................................................... 5 - 17
Table 5.2.1-5 Major Results of Economic Analysis ............................................................................. 5 - 17
Table 5.2.1-6 Results of Sensitivity Analysis for Case 1(1) ................................................................. 5 - 18
Table 5.2.2-1 Capital Cost................................................................................................................... 5 - 19
Table 5.2.2-2 Net Increase of O&M Cost over the Project Period (Case 1) ........................................ 5 - 19
Table 5.2.2-3 Net Increase of O&M Cost over the Project Period (Case 2) ........................................ 5 - 20
Table 5.2.2-4 Major Results of Economic Analysis ............................................................................. 5 - 20
Table 5.2.2-5 Results of Sensitivity Analysis for Case 1 ..................................................................... 5 - 21
Table 5.3.1-1 Major Results of Economic Analysis ............................................................................. 5 - 22
Table 5.3.1-2 Results of Sensitivity Analysis for Case 1(1) ................................................................. 5 - 23
Table 5.3.1-3 Results of Sensitivity Analysis for Case 2(2) ................................................................. 5 - 23
Table 5.3.2-1 Major Results of Economic Analysis ............................................................................. 5 - 23
Table 5.3.2-2 Results of Sensitivity Analysis for Case 1 ..................................................................... 5 - 24
Table 5.3.2-3 Results of Sensitivity Analysis for Case 2 ..................................................................... 5 - 24
Table 6.1-1 Relevant Environmental Regulations .............................................................................. 6 - 1
Table 6.1-2 Relevant Regulations on AMDAL.................................................................................... 6 - 2
Table 6.2-1 Expected Impact and Examination Points for Rehabilitation Activities at Sutami and Wlingi
........................................................................................................................................ 6 - 3
Table 6.3-1 Outline of RLK for Mrica Reservoir.................................................................................. 6 - 5
Table 6.3-2 Outline of RLK for Mrica Reservoir.................................................................................. 6 - 6
Table 6.3-3 Outline of RLK for Mrica Reservoir.................................................................................. 6 - 6
Table 6.3-4 Vulnerable Species in Central Java Province.................................................................. 6 - 8
Table 6.3-5 Outline of Conceivable Impacts due to Sedimentation Countermeasures .................... 6 - 11
vi
Table 6.3-6 Items to be examined for Sediment Flushing through Bypass Tunnel and Diversion Weir
...................................................................................................................................... 6 - 12
Table 6.3-7 Items to be examined for Sediment Flushing ................................................................ 6 - 13
Table 6.3-8 Items to be examined Further for Dredging and Disposal of Bed Load at Spoil Bank... 6 - 13
Table 6.3-9 Items to be examined Further for Flushing Wash and Suspended Loads to Downstream
...................................................................................................................................... 6 - 13
Table 6.5-1 Result of Water Pollution Monitoring at Sengguruh, Sutami and Wlingi Reservoir........ 6 - 17
Table 6.5-2 Flora at Sutami Reservoir ............................................................................................. 6 - 18
Table 6.5-3 Fauna at Sutami Reservoir ........................................................................................... 6 - 18
Table 6.5-4 Fish at Sutami Reservoir ............................................................................................... 6 - 18
Table 6.5-5 Additional Species Confirmed at Wlingi Reservoir ........................................................ 6 - 19
Table 7.1-1 Economic Indices for Cases-1 & 2 .................................................................................. 7 - 5
Table 7.1-2 Financial Indices for Cases-1 & 2.................................................................................... 7 - 5
Table 7.1-3 Future Vision of River Basin Sediment Management...................................................... 7 - 7
Table 7.1-4 Expected Impact of Rehabilitation Work at Sutami and Wlingi Hydropower Stations...... 7 - 8
Table 7.1-5 Expected Impact of Sediment Countermeasure at Mrica Reservoir and Serayu
River Basin .................................................................................................................... 7 - 8
Table 7.2-1 Required Study Items of the Master Plan......................................................................7 - 12
Figures
Figure 2.1.1-1 Installed Capacity of PLN as of 2008 .............................................................................. 2 - 1
Figure 2.1.1-2 Installed Capacity in Indonesia (2000 ~ 2008) ................................................................ 2 - 2
Figure 2.1.1-3 Installed Capacity and Available Capacity (2000~2008) .................................................2 - 2
Figure 2.1.1-4 Power generation of PLN as of 2008 ..............................................................................2 - 4
Figure 2.1.1-5 Power generation Classified by Power Source .............................................................. 2 - 4
Figure 2.1.2-1 PLN Business Components ........................................................................................... 2 - 5
Figure 2.1.2-2 Organization Chart of PLN .............................................................................................. 2 - 6
Figure 2.2.2-1 Demand Projection and Power Development Plan ......................................................... 2 - 7
Figure 3.1.1-1 Location and Installed Capacity of Hydropower Stations ................................................ 3 - 1
Figure 3.1.1-2 Completion Year and Capacity of Hydropower Stations ................................................. 3 - 1
Figure 3.1.1-3 Completion Year and Number of Hydropower Stations................................................... 3 - 1
Figure 3.1.2-1 Screening Flow Chart...................................................................................................... 3 - 2
Figure 3.2.1-1 Location Map Showing the Existing Hydropower Stations Presented by PLN .............. 3 - 6
Figure 3.3.2-1 Power Network in Java Bali ......................................................................................... 3 - 13
Figure 3.4.1-1 Location Map of Sutami and Wlingi Hydropower Stations............................................. 3 - 17
Figure 3.4.1-2 Power Network in East Java ......................................................................................... 3 - 21
Figure 3.4.1-3 Basin Map of Brantas River .......................................................................................... 3 - 23
Figure 3.4.1-4 Sedimentation Record in Sutami Reservoir ..................................................................3 - 24
Figure 3.4.1-5 Layout Plan and Profile of Sutami and Sengguruh Power Station ................................ 3 - 25
Figure 3.4.1-6 Sediment Control Plan in the Upper Brantas River ....................................................... 3 - 28
vii
Figure 3.4.2-1 Sediment Control Plan in Mt. Kelud Area...................................................................... 3 - 34
Figure 3.4.2-2 Bypass Channel Detail in Mt. Kelud Area ..................................................................... 3 - 34
Figure 3.4.3-1 Location Map of Soedirman Hydropower Station .......................................................... 3 - 36
Figure 3.4.3-2 Location Map of Soedirman (Mrica) Dam...................................................................... 3 - 40
Figure 3.4.3-3 Profile of Drawdown Culvert.......................................................................................... 3 - 42
Figure 3.4.4-1 Location Map of Saguling Hydropower Stations............................................................ 3 - 45
Figure 4.1.2-1 Scope of Rehabilitation Works for Sutami Hydropower Station....................................... 4 - 6
Figure 4.1.2-2 Scope of Rehabilitation Works for Wlingi Hydropower Station...................................... 4 - 10
Figure 4.1.3-1 Daily Load Curve in East Java ...................................................................................... 4 - 12
Figure 4.1.3-2 Operational Pattern Curve of Sutami Hydropower Station in 2008 ............................... 4 - 13
Figure 4.1.3-3 Operational Pattern Curve of Sutami and Wlingi hydro power stations in 2008 ............ 4 - 13
Figure 4.1.3-4 Power Generation for Without Project and With Project in Sutami................................ 4 - 17
Figure 4.1.5-1 Implementation Schedule for Rehabilitation Works for Sutami and Wlingi.................... 4 - 20
Figure 4.2.1-1 Prediction of Remaining Useful Life of Mrica Reservoir ................................................4 - 21
Figure 4.2.1-2 Profile of Drawdown Culvert Intake ............................................................................... 4 - 23
Figure 4.2.1-3 Target Water Level and Observed Water Level ............................................................ 4 - 23
Figure 4.2.1-4 Trapped Sediment Record and Assumed Sediment Inflow in the Reservoir................. 4 - 24
Figure 4.2.1-5 Image of Sediment Flushing Operation......................................................................... 4 - 25
Figure 4.2.1-6 Degradation of the Riverbed at Downstream of Mrica Dam .......................................... 4 - 26
Figure 4.2.2-1 Strategy of Watershed Sediment Management of Serayu River Basin ......................... 4 - 28
Figure 4.2.2-2 Current Status of Sediment Problems over the Serayu River Basin ............................. 4 - 29
Figure 4.2.2-3 Final Target of Watershed Sediment Management in Serayu River Basin ................... 4 - 30
Figure 4.2.3-1 Environment Management System for Watershed Sediment Management.................. 4 - 37
Figure 6.1-1 AMDAL Approval Procedure ........................................................................................... 6 - 3
Figure 7.2-1 Proposed Implementation Procedure............................................................................7 - 13
viii
Abbreviations
ABB : Air Blast Type Circuit Breaker
AC : Alternating Current
ACSR : Aluminum Conductor Steel Reinforced
ADB : Asian Development Bank
AI : Annual Inspection
AMDAL : Analysis Mengenai Dampak Lingkungar Hidup
ANDAL : Analisis Dampak Lingkungan
AVR : Automatic Voltage Regulator
B/C : Benefit Cost Ratio
BBWS : Besar Balley Willya Sungai
BOD : Biochemical Oxygen Demand
BPS : Balai Penelitian Kehutanan Solo
CBM : Condition Based Maintenance
CFD : Computational Fluid Dynamics
CITES : Convention on International Trade in Endangered Species
COD : Chemical Oxygen Demand
CSR : Corporate Social Responsibilities
DC : Direct Current
DCS : Distributed Control System
DG : Diesel Generator
DDC : Drawdown Culvert
DO : Dissolved Oxygen
E/S : Engineering Services
EDG : Emergency Diesel Generator
EIRR : Economic Internal Rate of Return
EL : Elevation
ENPV : Expected Net Present Value
EU : European Union
FIRR : Financial Internal Rate of Return
FC : Foreign Currency
FNPV : Financial Net Present Value
G/E : Generating Equipment
GCB : SF6 Gas Circuit Breaker
GI : General Inspection
GIS : Gas Insulated Switchgear
GoI : Government of Indonesia
HPS : Hydro Power Station
HWL : High Water Level
ICB : International Competitive Bidding
IEC : International Electromechanical Commission
IP : Indonesian Power
ix
IPP : Independent Power Producer
IUCN : International Union for Conservation of Nature and Natural Resources
JBIC : Japan Bank for International Cooperation
JICA : Japan International Cooperation Agency
LC : Local Currency
LFC : Load Frequency Control
LS : Lump Sum
LWL : Low Water Level
MEMR : Ministry of Energy and Mineral Resources
MO : Major Overhaul
MOD : Minutes of Discussion
NPV : Net Present Value
O&M : Operation and Maintenance
ODA : Official Development Assistance
OECF : Overseas Economic Cooperation Fund
P3B : Penyaluran Dan Pusat Pengatur Beban Jawa Bali (Jawa Bali Transmission and Load Dispatching Center)
PCDA : Plan, Do, Check and Action
PID : Proportional, Integral and Derivative
PJB : PT Java Bali Power Company
PJT I : Perusahaan Jasa Tirta I
PLC : Power Line Carrier
PLC : Programmable Logic Controller
PLN : Perusahaan Umum Listrik Negara Persero (Indonesia Electricity Corporation)
PMF : Probable Maximum Flood
PMG : Permanent Magnetic Generator
PST : Pumped Storage
RES : Reserver
RKL : Rencana Pengelolaan Lingkungan
ROR : Run of River
RPL : Rencana Pemantauan Lingkungan
RUKN : Rencana Umum Ketenagalistrikan Nasional
RUPTL : Rencana Usaha Penyediaan Tenaga Listrik (Electrical Power Supply Business Plan)
SCADA : Supervisory Control and Data Acquisition
SCF : Standard Conversion Factor
S/S : Substation
TBM : Time Based Maintenance
TDS : Total Dissolved Solids
TP : Total Phosphorus
UBP : Unit Busnis Pembangkitan (Generation Business Unit)
VAT : Value-added Tax
WB : World Bank

Chapter 1 Introduction
Final Report Chapter 1 Introduction
1 - 1
CHAPTER 1 INTRODUCTION
1.1 Background
Power demand in Indonesia is steadily increasing in proportion to the economic growth. Moreover,
according to the Review of Power Strategy in Indonesia published by the International Energy
Agency in 2008, the increase rate of the power demand between 1997 and 2004 after the Asian
monetary crisis, reached about 7% in yearly average.
In consideration of the future economic growth in the country, it is necessary to immediately
strengthen the power supply ability in order to meet the power demand which is expected to
increase continuously in the future, especially in the islands of Java and Sumatra where major
industries are concentrated. To cope with the growing power demand, the first crash program
consisting of 10,000 MW coal fired thermal power plants has been implemented. Furthermore, a
second crash program is on-going
The Government of Indonesia has announced in November 2008 the national electric power
development plan (RUKN: Rencana Umum Ketenagalistrikan Nasional) to promote the conversion
of the present generation system to non-oil based power generation. It aims to develop electric
power by utilizing renewable energy including hydropower and geothermal energy in the future.
Especially, needs of the hydropower development which can be utilized effectively for abundant
own energy resources have been rising.
The necessity for the effective use of the existing hydropower station has also been increasing to
meet the current power demand. It is also intended to urgently realize the use of "non-fossil fuel"
for the present energy consumption structure, from the viewpoint of reduction of greenhouse gas
emission.
The power system in Java-Bali is a developed system with share of 60% of the whole power
system in Indonesia and hence, PLN (Perusahaan Umum Listrik Negara Persero) sets a higher
priority on implementing the power development. However, some of the existing hydropower
stations are facing problems such as less reliability, non-availability of spare parts and/or loss of
performance due to deterioration and/or sedimentation. Under such circumstances, it is deemed
effective to conduct investigation and study on the possibility of rehabilitating the existing
hydropower stations.
In consideration of the above issues, this study analyzes the corrected data and information, and
carries out review of the rehabilitation project to restore the original function and/or performance.
This aims to establish an appropriate plan for said rehabilitation project, basically focusing on the
existing hydropower station constructed under the financial assistance of Government of Japan.
Final Report Chapter 1 Introduction
1 - 2
The study was conducted in accordance with the Minutes of Discussion (MOD) between JICA and
PLN signed on 18 February 2010 in Jakarta, Indonesia.
1.2 Purpose of Study
The purpose of the study is to formulate optimal rehabilitation plan or countermeasures to the
current problem for the selected hydropower stations by screening the existing hydropower stations
according to priority of needs for rehabilitation or countermeasure. This is intended to recover
and maintain the initial functions of them especially in areas with high demand for power supply.
1.3 Study Team and Schedule
1.3.1 Study Team
Nippon Koei Co., Ltd. was awarded the contract to provide consulting services for the study. The
study team consists of the following ten experts, and a coordinator:
Table 1.3.1-1 Member List of the Study Team
Name Position/Expertise
MATSUSHIMA Noriaki Team Leader / Hydropower Rehabilitation Planning
KAWASHIMA Motoyoshi Hydropower Civil Engineering
TAGUCHI Shigehisa Hydropower Mechanical Engineering
KIKUCHI Tatsuhiko Hydropower Electrical Engineering
KUMASU Munenori Transmission Line and Substation Engineering
MIYAZATO Tatsuya Hydrological / Meteorological / Sedimentation Study
SATO Susumu Geology
EGAWA Hitoshi / IWABUCHI Masahiro Demand Forecast/Power System
ISHIZATO Hiroshi Economic and Financial Analysis
OTA Tomoko Environmental and Social Considerations
YAZAWA Kazumasa Coordinator
(Prepared by JICA Study Team)
1.3.2 Study Schedule
The study team conducted site works in Indonesia from 18 March 2010 to 22 April 2010 which
includes collecting information and data. During said period, site survey for the four hydropower
stations namely, Sutami (Karangkates) in East Java, Wlingi in East Java, Soedirman (Mrica) in
Central Java and Saguling in West Java were carried out to recognize the current situation by
collecting data, through interviews with concerned authorities/personnel. Analysis of the
collected data and preparation of draft final report was conducted in Japan. Consequently, the draft
final report was presented to PLN in July 2010. The final report, which was revised based on
PLN comments, was submitted to JICA in September 2010.

Chapter 2 Current Status of Power Sector
Final Report Chapter 2 Current Status of Power Sector
2 - 1
CHAPTER 2 CURRENT STATUS OF POWER SECTOR
2.1 Power Supply and Demand
2.1.1 Outline of Power Sector
(1) Installed Capacity
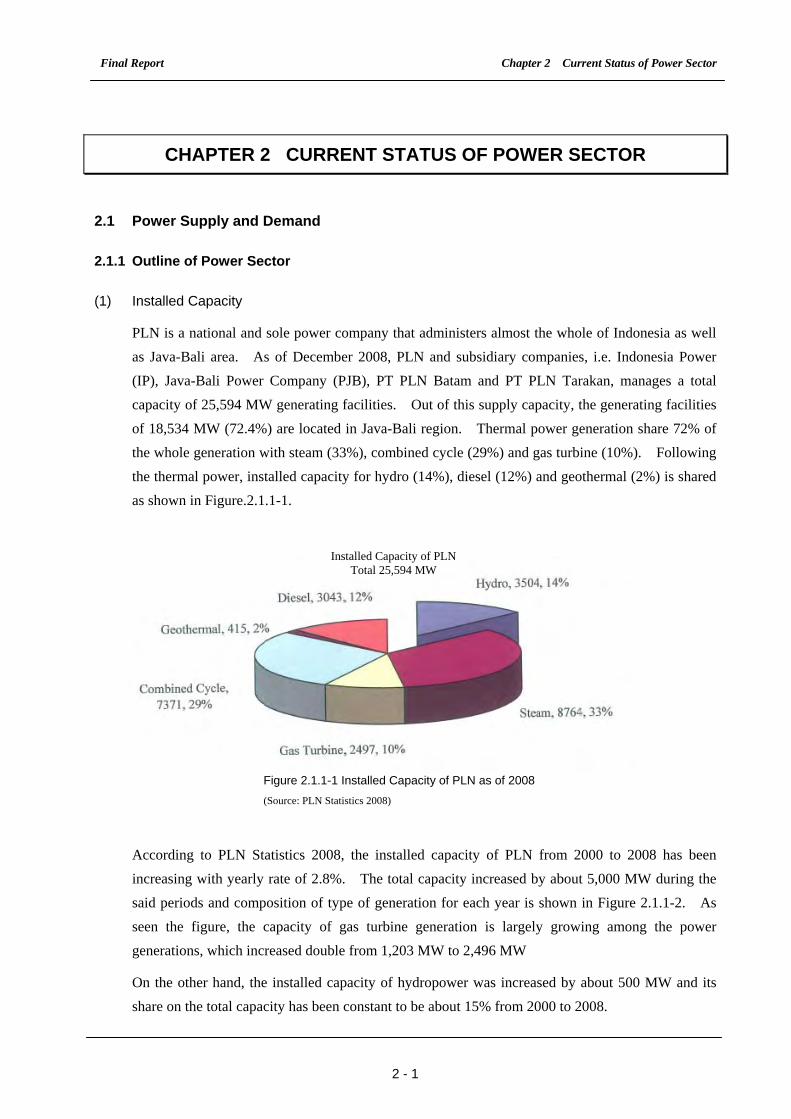
PLN is a national and sole power company that administers almost the whole of Indonesia as well
as Java-Bali area. As of December 2008, PLN and subsidiary companies, i.e. Indonesia Power
(IP), Java-Bali Power Company (PJB), PT PLN Batam and PT PLN Tarakan, manages a total
capacity of 25,594 MW generating facilities. Out of this supply capacity, the generating facilities
of 18,534 MW (72.4%) are located in Java-Bali region. Thermal power generation share 72% of
the whole generation with steam (33%), combined cycle (29%) and gas turbine (10%). Following
the thermal power, installed capacity for hydro (14%), diesel (12%) and geothermal (2%) is shared
as shown in Figure.2.1.1-1.
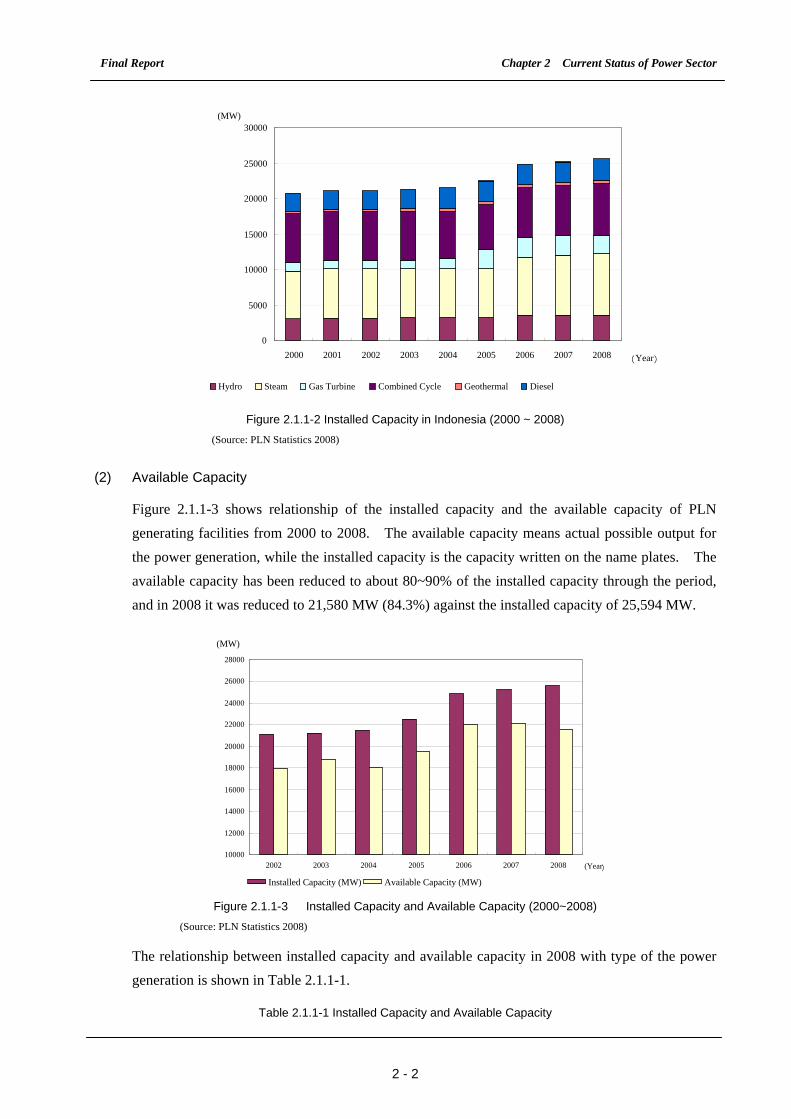
According to PLN Statistics 2008, the installed capacity of PLN from 2000 to 2008 has been
increasing with yearly rate of 2.8%. The total capacity increased by about 5,000 MW during the
said periods and composition of type of generation for each year is shown in Figure 2.1.1-2. As
seen the figure, the capacity of gas turbine generation is largely growing among the power
generations, which increased double from 1,203 MW to 2,496 MW
On the other hand, the installed capacity of hydropower was increased by about 500 MW and its
share on the total capacity has been constant to be about 15% from 2000 to 2008.
Figure 2.1.1-1 Installed Capacity of PLN as of 2008 (Source: PLN Statistics 2008)
Installed Capacity of PLN Total 25,594 MW
Final Report Chapter 2 Current Status of Power Sector
2 - 2
Figure 2.1.1-2 Installed Capacity in Indonesia (2000 ~ 2008) (Source: PLN Statistics 2008)
(2) Available Capacity
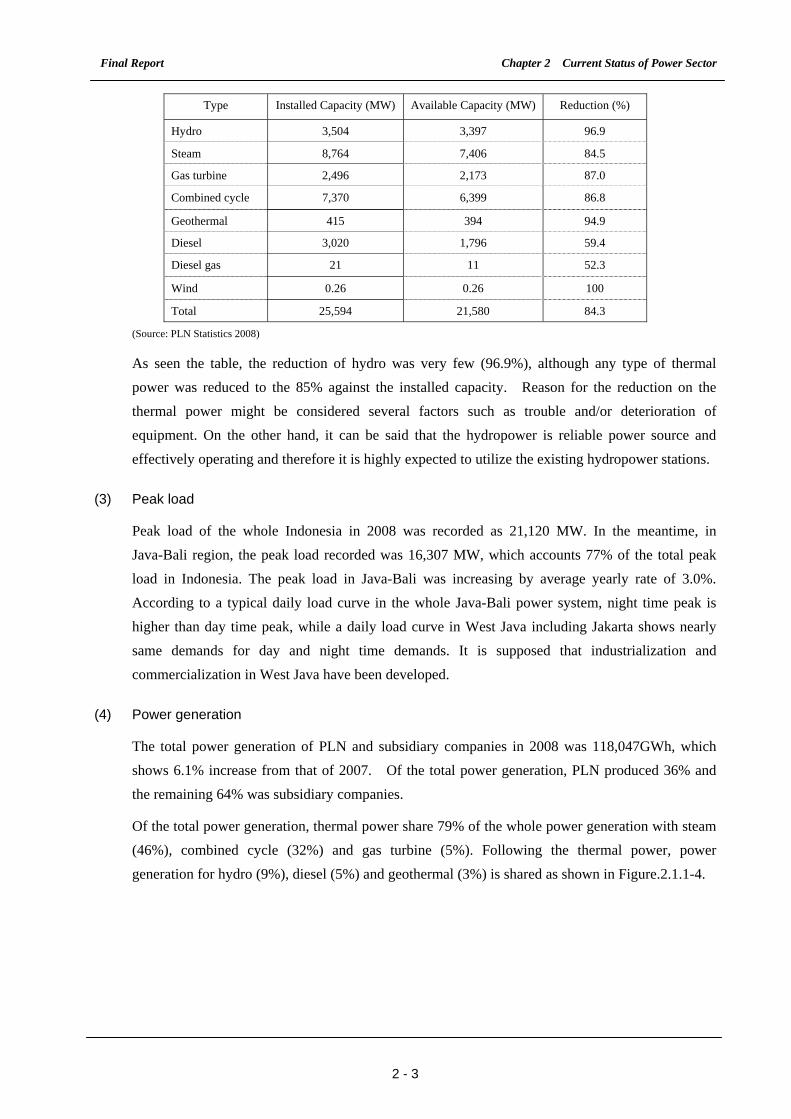
Figure 2.1.1-3 shows relationship of the installed capacity and the available capacity of PLN
generating facilities from 2000 to 2008. The available capacity means actual possible output for
the power generation, while the installed capacity is the capacity written on the name plates. The
available capacity has been reduced to about 80~90% of the installed capacity through the period,
and in 2008 it was reduced to 21,580 MW (84.3%) against the installed capacity of 25,594 MW.
Figure 2.1.1-3 Installed Capacity and Available Capacity (2000~2008)
(Source: PLN Statistics 2008)
The relationship between installed capacity and available capacity in 2008 with type of the power
generation is shown in Table 2.1.1-1.
Table 2.1.1-1 Installed Capacity and Available Capacity
0
5000
10000
15000
20000
25000
30000
2000 2001 2002 2003 2004 2005 2006 2007 2008 ( Year )
(MW)
Hydro Steam Gas Turbine Combined Cycle Geothermal Diesel
10000
12000
14000
16000
18000
20000
22000
24000
26000
28000
2002 2003 2004 2005 2006 2007 2008 (Year )
(MW)
Installed Capacity (MW) Available Capacity (MW)
Final Report Chapter 2 Current Status of Power Sector
2 - 3
Type Installed Capacity (MW) Available Capacity (MW) Reduction (%)
Hydro 3,504 3,397 96.9
Steam 8,764 7,406 84.5
Gas turbine 2,496 2,173 87.0
Combined cycle 7,370 6,399 86.8
Geothermal 415 394 94.9
Diesel 3,020 1,796 59.4
Diesel gas 21 11 52.3
Wind 0.26 0.26 100
Total 25,594 21,580 84.3
(Source: PLN Statistics 2008)
As seen the table, the reduction of hydro was very few (96.9%), although any type of thermal
power was reduced to the 85% against the installed capacity. Reason for the reduction on the
thermal power might be considered several factors such as trouble and/or deterioration of
equipment. On the other hand, it can be said that the hydropower is reliable power source and
effectively operating and therefore it is highly expected to utilize the existing hydropower stations.
(3) Peak load
Peak load of the whole Indonesia in 2008 was recorded as 21,120 MW. In the meantime, in
Java-Bali region, the peak load recorded was 16,307 MW, which accounts 77% of the total peak
load in Indonesia. The peak load in Java-Bali was increasing by average yearly rate of 3.0%.
According to a typical daily load curve in the whole Java-Bali power system, night time peak is
higher than day time peak, while a daily load curve in West Java including Jakarta shows nearly
same demands for day and night time demands. It is supposed that industrialization and
commercialization in West Java have been developed.
(4) Power generation
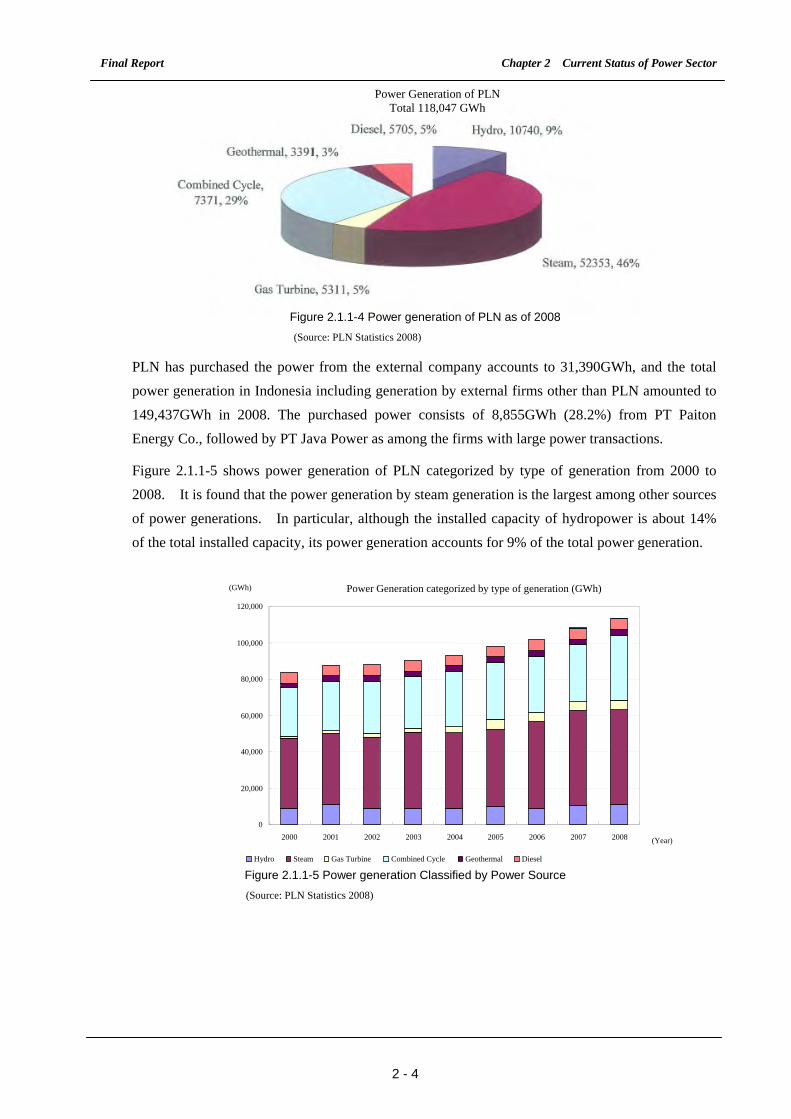
The total power generation of PLN and subsidiary companies in 2008 was 118,047GWh, which
shows 6.1% increase from that of 2007. Of the total power generation, PLN produced 36% and
the remaining 64% was subsidiary companies.
Of the total power generation, thermal power share 79% of the whole power generation with steam
(46%), combined cycle (32%) and gas turbine (5%). Following the thermal power, power
generation for hydro (9%), diesel (5%) and geothermal (3%) is shared as shown in Figure.2.1.1-4.
Final Report Chapter 2 Current Status of Power Sector
2 - 4
Figure 2.1.1-4 Power generation of PLN as of 2008 (Source: PLN Statistics 2008)
PLN has purchased the power from the external company accounts to 31,390GWh, and the total
power generation in Indonesia including generation by external firms other than PLN amounted to
149,437GWh in 2008. The purchased power consists of 8,855GWh (28.2%) from PT Paiton
Energy Co., followed by PT Java Power as among the firms with large power transactions.
Figure 2.1.1-5 shows power generation of PLN categorized by type of generation from 2000 to
2008. It is found that the power generation by steam generation is the largest among other sources
of power generations. In particular, although the installed capacity of hydropower is about 14%
of the total installed capacity, its power generation accounts for 9% of the total power generation.
Figure 2.1.1-5 Power generation Classified by Power Source (Source: PLN Statistics 2008)
Power Generation categorized by type of generation (GWh)
0
20,000
40,000
60,000
80,000
100,000
120,000
2000 2001 2002 2003 2004 2005 2006 2007 2008 (Year)
(GWh)
Hydro Steam Gas Turbine Combined Cycle Geothermal Diesel
Power Generation of PLN Total 118,047 GWh
Final Report Chapter 2 Current Status of Power Sector
2 - 5
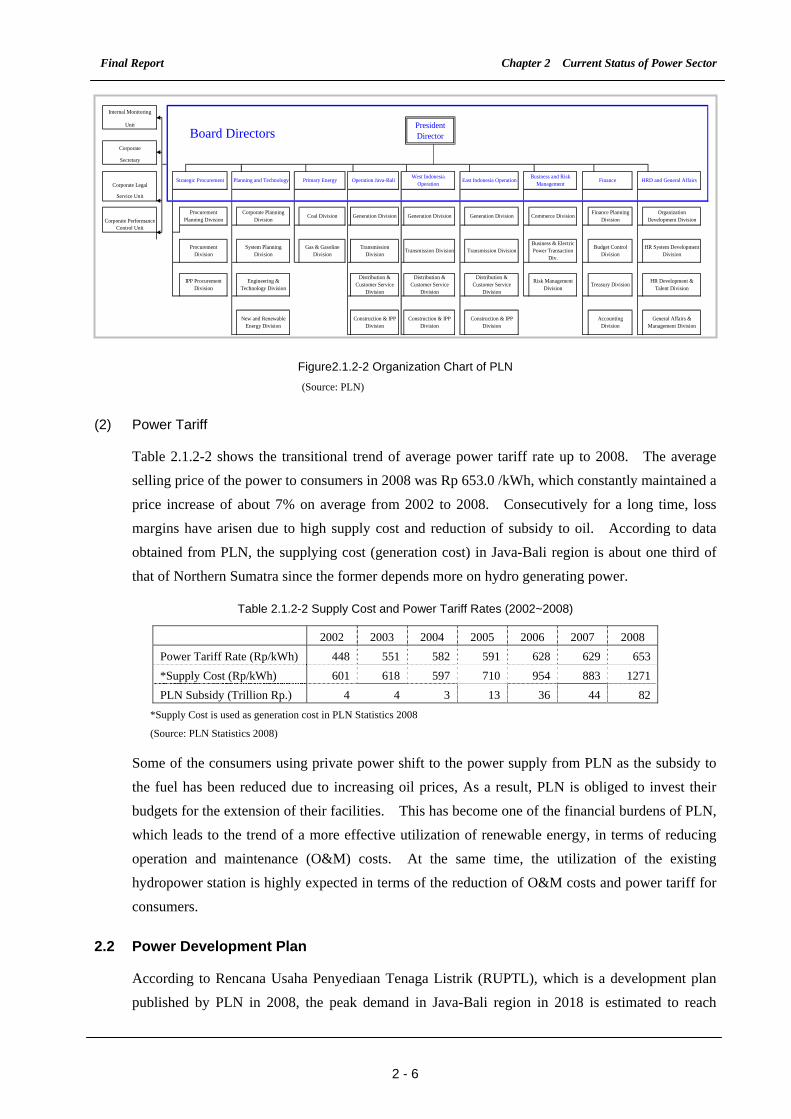
2.1.2 Outline of PLN and Organization Structure
(1) Organization
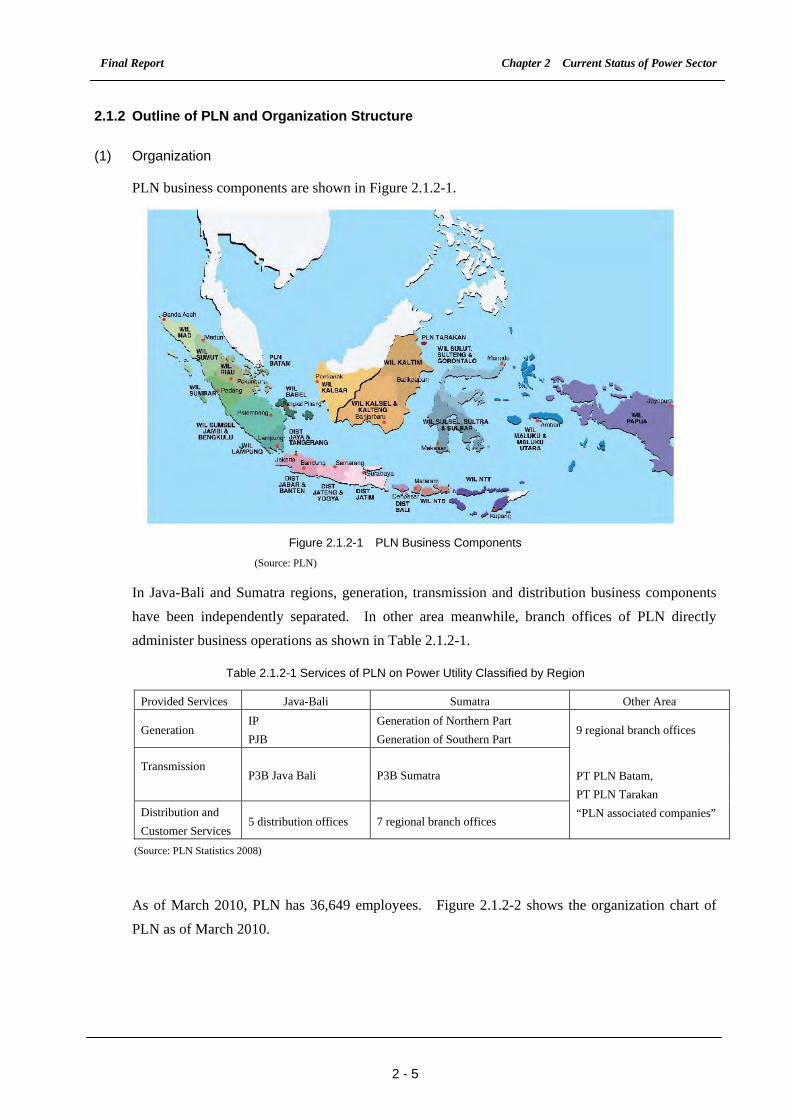
PLN business components are shown in Figure 2.1.2-1.
Figure 2.1.2-1 PLN Business Components
(Source: PLN)
In Java-Bali and Sumatra regions, generation, transmission and distribution business components
have been independently separated. In other area meanwhile, branch offices of PLN directly
administer business operations as shown in Table 2.1.2-1.
Table 2.1.2-1 Services of PLN on Power Utility Classified by Region
Provided Services Java-Bali Sumatra Other Area
Generation IP
PJB
Generation of Northern Part
Generation of Southern Part 9 regional branch offices
Transmission
P3B Java Bali P3B Sumatra
Distribution and
Customer Services 5 distribution offices 7 regional branch offices
PT PLN Batam,
PT PLN Tarakan
“PLN associated companies”
(Source: PLN Statistics 2008)
As of March 2010, PLN has 36,649 employees. Figure 2.1.2-2 shows the organization chart of
PLN as of March 2010.
Final Report Chapter 2 Current Status of Power Sector
2 - 6
Figure2.1.2-2 Organization Chart of PLN (Source: PLN)
(2) Power Tariff
Table 2.1.2-2 shows the transitional trend of average power tariff rate up to 2008. The average
selling price of the power to consumers in 2008 was Rp 653.0 /kWh, which constantly maintained a
price increase of about 7% on average from 2002 to 2008. Consecutively for a long time, loss
margins have arisen due to high supply cost and reduction of subsidy to oil. According to data
obtained from PLN, the supplying cost (generation cost) in Java-Bali region is about one third of
that of Northern Sumatra since the former depends more on hydro generating power.
Table 2.1.2-2 Supply Cost and Power Tariff Rates (2002~2008)
2002 2003 2004 2005 2006 2007 2008
Power Tariff Rate (Rp/kWh) 448 551 582 591 628 629 653
*Supply Cost (Rp/kWh) 601 618 597 710 954 883 1271
PLN Subsidy (Trillion Rp.) 4 4 3 13 36 44 82
*Supply Cost is used as generation cost in PLN Statistics 2008
(Source: PLN Statistics 2008)
Some of the consumers using private power shift to the power supply from PLN as the subsidy to
the fuel has been reduced due to increasing oil prices, As a result, PLN is obliged to invest their
budgets for the extension of their facilities. This has become one of the financial burdens of PLN,
which leads to the trend of a more effective utilization of renewable energy, in terms of reducing
operation and maintenance (O&M) costs. At the same time, the utilization of the existing
hydropower station is highly expected in terms of the reduction of O&M costs and power tariff for
consumers.
2.2 Power Development Plan
According to Rencana Usaha Penyediaan Tenaga Listrik (RUPTL), which is a development plan
published by PLN in 2008, the peak demand in Java-Bali region in 2018 is estimated to reach
Internal Monitoring
Unit
Board DirectorsCorporate
Secretary
Corporate Legal
Service Unit
Corporate PerformanceControl Unit
AccountingDivision
General Affairs &Management Division
HR Development &Talent Division
New and RenewableEnergy Division
Construction & IPPDivision
Construction & IPPDivision
Construction & IPPDivision
Distribution &Customer Service
Division
Distribution &Customer Service
Division
Risk ManagementDivision
Treasury Division
HR System DevelopmentDivision
Budget ControlDivision
TransmissionDivision
Transmission Division Transmission DivisionBusiness & ElectricPower Transaction
Div.
Finance PlanningDivision
OrganizationDevelopment Division
Corporate PlanningDivision
Coal Division Generation Division Generation Division
Finance HRD and General AffairsBusiness and Risk
Management
IPP ProcurementDivision
Engineering &Technology Division
Distribution &Customer Service
Division
West IndonesiaOperation
Generation Division Commerce Division
Strategic Procurement
ProcurementPlanning Division
ProcurementDivision
System PlanningDivision
East Indonesia OperationPlanning and Technology Primary Energy Operation Java-Bali
Gas & GasolineDivision
PresidentDirectorBoard Directors
Final Report Chapter 2 Current Status of Power Sector
2 - 7
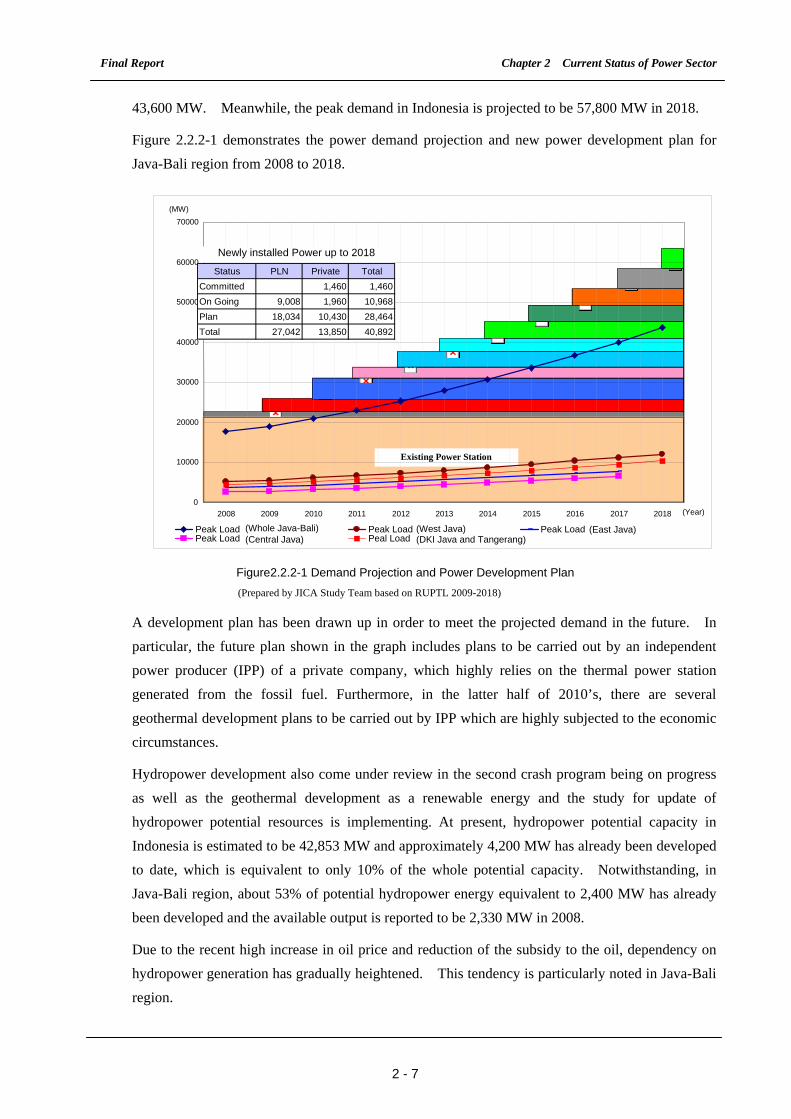
43,600 MW. Meanwhile, the peak demand in Indonesia is projected to be 57,800 MW in 2018.
Figure 2.2.2-1 demonstrates the power demand projection and new power development plan for
Java-Bali region from 2008 to 2018.
Figure2.2.2-1 Demand Projection and Power Development Plan (Prepared by JICA Study Team based on RUPTL 2009-2018)
A development plan has been drawn up in order to meet the projected demand in the future. In
particular, the future plan shown in the graph includes plans to be carried out by an independent
power producer (IPP) of a private company, which highly relies on the thermal power station
generated from the fossil fuel. Furthermore, in the latter half of 2010’s, there are several
geothermal development plans to be carried out by IPP which are highly subjected to the economic
circumstances.
Hydropower development also come under review in the second crash program being on progress
as well as the geothermal development as a renewable energy and the study for update of
hydropower potential resources is implementing. At present, hydropower potential capacity in
Indonesia is estimated to be 42,853 MW and approximately 4,200 MW has already been developed
to date, which is equivalent to only 10% of the whole potential capacity. Notwithstanding, in
Java-Bali region, about 53% of potential hydropower energy equivalent to 2,400 MW has already
been developed and the available output is reported to be 2,330 MW in 2008.
Due to the recent high increase in oil price and reduction of the subsidy to the oil, dependency on
hydropower generation has gradually heightened. This tendency is particularly noted in Java-Bali
region.
Existing Power Station
0
10000
20000
30000
40000
50000
60000
70000
2008 2009 2010 2011 2012 2013 2014 2015 2016 2017 2018 (Year)
(MW)
Peak Load (Whole Java-Bali) Peak Load (West Java) Peak Load (East Java) Peak Load (Central Java) Peal Load (DKI Java and Tangerang)
Status PLN Private TotalCommitted 1,460 1,460On Going 9,008 1,960 10,968Plan 18,034 10,430 28,464Total 27,042 13,850 40,892
Newly installed Power up to 2018
Final Report Chapter 2 Current Status of Power Sector
2 - 8
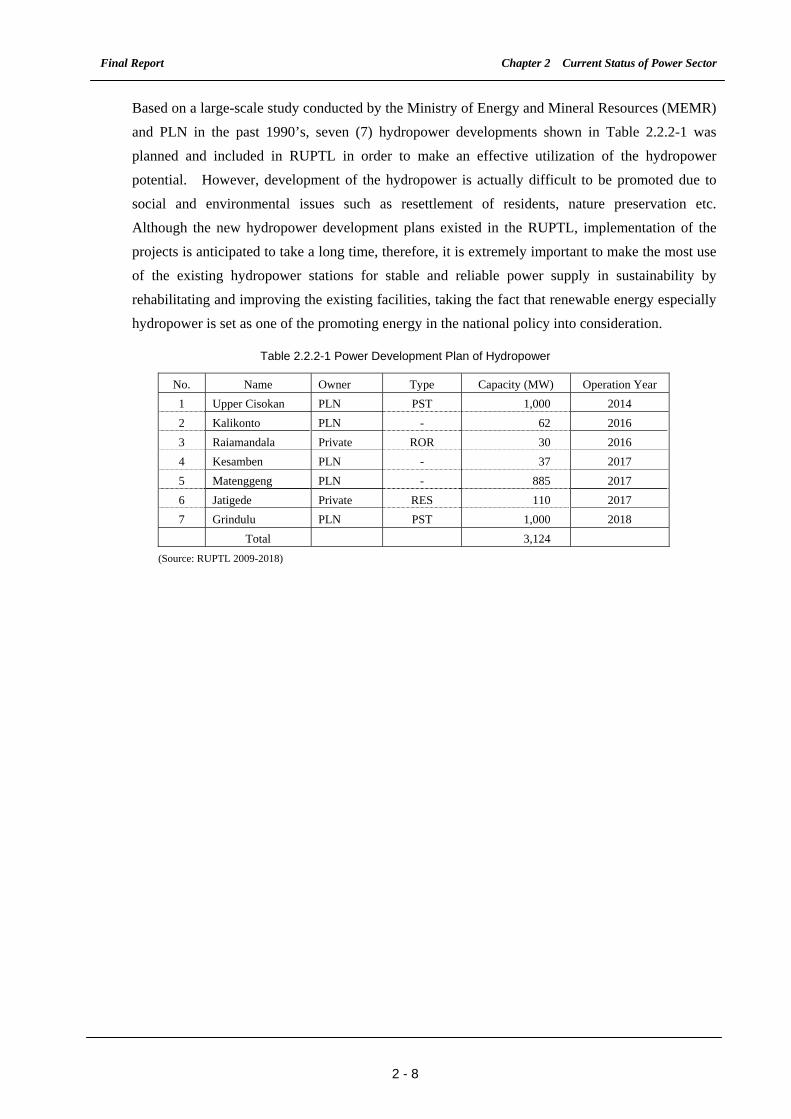
Based on a large-scale study conducted by the Ministry of Energy and Mineral Resources (MEMR)
and PLN in the past 1990’s, seven (7) hydropower developments shown in Table 2.2.2-1 was
planned and included in RUPTL in order to make an effective utilization of the hydropower
potential. However, development of the hydropower is actually difficult to be promoted due to
social and environmental issues such as resettlement of residents, nature preservation etc.
Although the new hydropower development plans existed in the RUPTL, implementation of the
projects is anticipated to take a long time, therefore, it is extremely important to make the most use
of the existing hydropower stations for stable and reliable power supply in sustainability by
rehabilitating and improving the existing facilities, taking the fact that renewable energy especially
hydropower is set as one of the promoting energy in the national policy into consideration.
Table 2.2.2-1 Power Development Plan of Hydropower
No. Name Owner Type Capacity (MW) Operation Year
1 Upper Cisokan PLN PST 1,000 2014
2 Kalikonto PLN - 62 2016
3 Raiamandala Private ROR 30 2016
4 Kesamben PLN - 37 2017
5 Matenggeng PLN - 885 2017
6 Jatigede Private RES 110 2017
7 Grindulu PLN PST 1,000 2018
Total 3,124
(Source: RUPTL 2009-2018)
Chapter 3 Screening of Hydropower Stations
Final Report Chapter 3 Screening of Hydropower Stations
3 - 1
CHAPTER 3 SCREENING OF HYDROPOWER STATIONS
3.1 Methodology of Screening of Existing Hydropower Stations
3.1.1 Existing Hydropower Stations
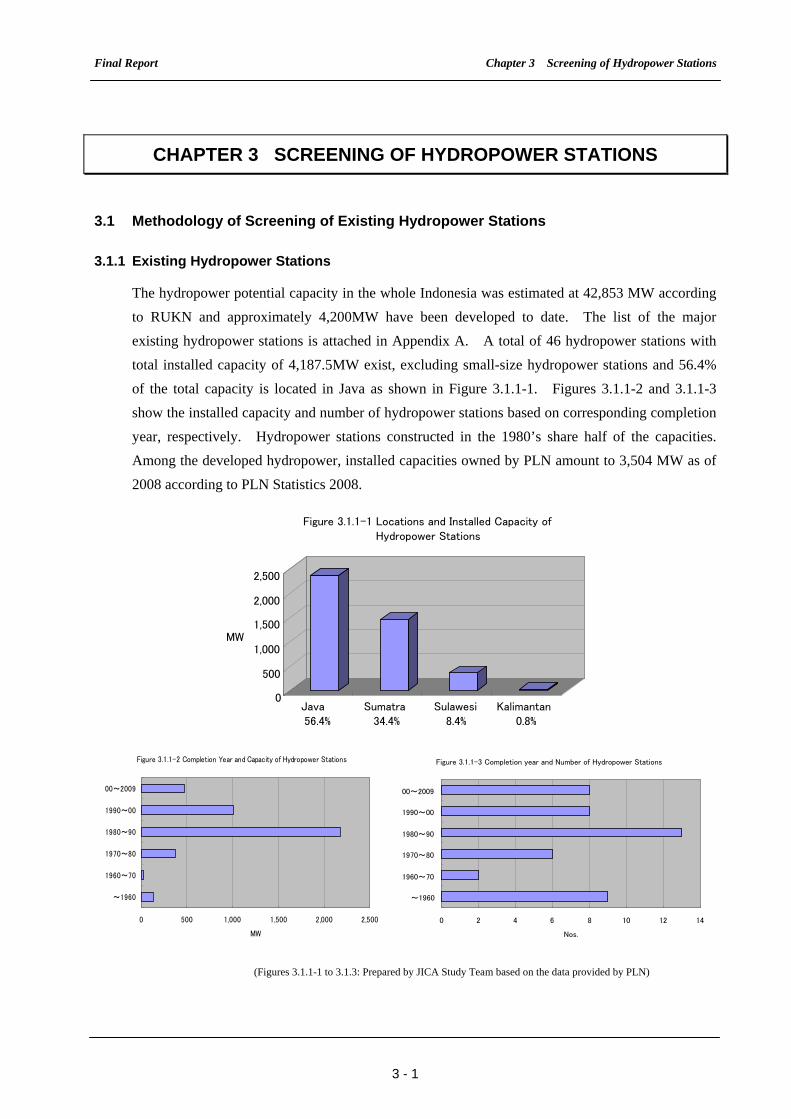
The hydropower potential capacity in the whole Indonesia was estimated at 42,853 MW according
to RUKN and approximately 4,200MW have been developed to date. The list of the major
existing hydropower stations is attached in Appendix A. A total of 46 hydropower stations with
total installed capacity of 4,187.5MW exist, excluding small-size hydropower stations and 56.4%
of the total capacity is located in Java as shown in Figure 3.1.1-1. Figures 3.1.1-2 and 3.1.1-3
show the installed capacity and number of hydropower stations based on corresponding completion
year, respectively. Hydropower stations constructed in the 1980’s share half of the capacities.
Among the developed hydropower, installed capacities owned by PLN amount to 3,504 MW as of
2008 according to PLN Statistics 2008.
Figure 3.1.1-2 Completion Year and Capacity of Hydropower Stations
0 500 1,000 1,500 2,000 2,500
~1960
1960~70
1970~80
1980~90
1990~00
00~2009
MW
(Figures 3.1.1-1 to 3.1.3: Prepared by JICA Study Team based on the data provided by PLN)
0
500
1,000
1,500
2,000
2,500
MW
Java 56.4%
Sumatra34.4%
Sulawesi8.4%
Kalimantan0.8%
Figure 3.1.1-1 Locations and Installed Capacity ofHydropower Stations
Figure 3.1.1-3 Completion year and Number of Hydropower Stations
0 2 4 6 8 10 12 14
~1960
1960~70
1970~80
1980~90
1990~00
00~2009
Nos.
Final Report Chapter 3 Screening of Hydropower Stations
3 - 2
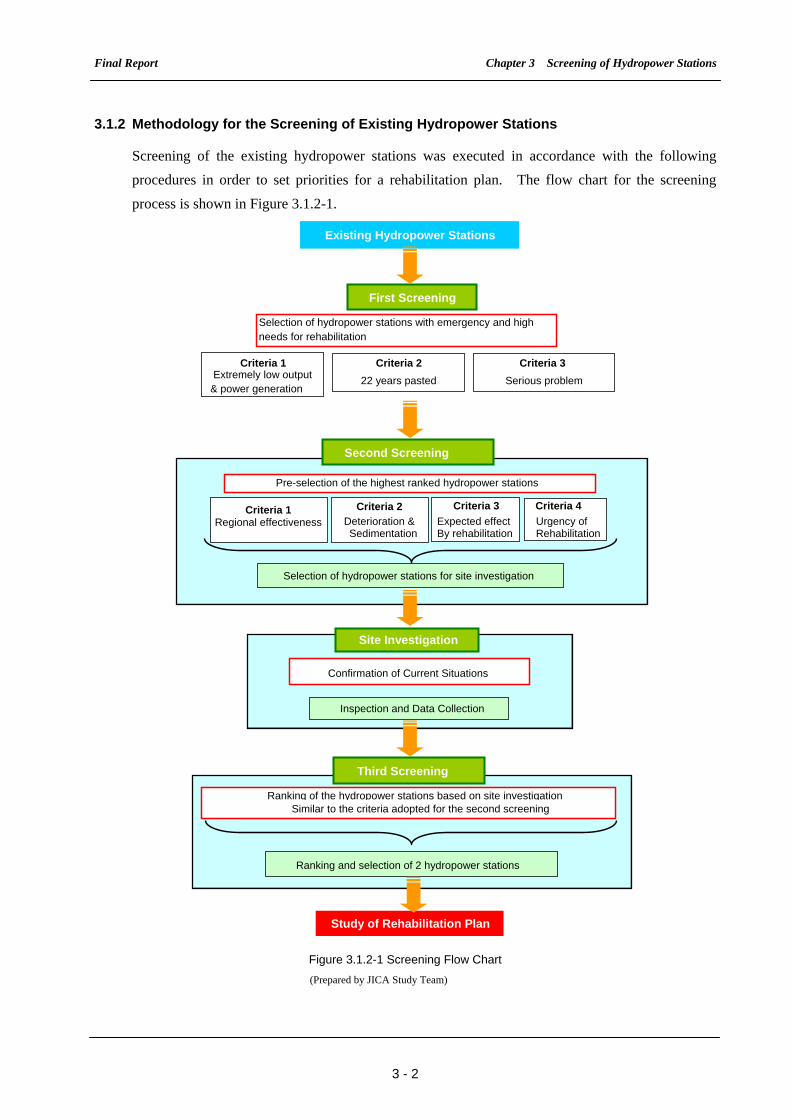
3.1.2 Methodology for the Screening of Existing Hydropower Stations
Screening of the existing hydropower stations was executed in accordance with the following
procedures in order to set priorities for a rehabilitation plan. The flow chart for the screening
process is shown in Figure 3.1.2-1.
Figure 3.1.2-1 Screening Flow Chart (Prepared by JICA Study Team)
Existing Hydropower Stations
Criteria 1 Extremely low output
& power generation
Criteria 2
22 years pasted
Site Investigation
Criteria 3 Serious problem
Confirmation of Current Situations
Inspection and Data Collection
First Screening
Selection of hydropower stations with emergency and highneeds for rehabilitation
Second Screening
Pre-selection of the highest ranked hydropower stations
Criteria 1 Regional effectiveness
Criteria 2Deterioration & Sedimentation
Criteria 3
Expected effect By rehabilitation
Criteria 4 Urgency of Rehabilitation
Selection of hydropower stations for site investigation
Study of Rehabilitation Plan
Third Screening
Ranking of the hydropower stations based on site investigation Similar to the criteria adopted for the second screening
Ranking and selection of 2 hydropower stations
Final Report Chapter 3 Screening of Hydropower Stations
3 - 3
(1) First Screening: Selection of hydropower stations based on urgency and necessity of
rehabilitation, from among the existing hydropower stations.
(2) Second Screening: Selection of hydropower stations with higher priority for rehabilitation
from among the selected hydropower stations in the first screening.
(3) Site Investigation: Site investigation for the selected hydropower stations in the second
screening.
(4) Third Screening: Rehabilitation priority ranking of the hydropower stations selected in the
second screening based on the results of site investigation, and selection of the two highest
ranked hydropower stations
(1) First Screening
The first screening was focused on the following three criteria based on the existing
data/information given by PLN. The concept of these criteria describe as follows:
(i) Hydropower stations that exhibit remarkable decrease in the output and power generation
(ii) Hydropower stations that are 22 years of service age or more since becoming operational
(iii) Hydropower stations with serious problems on proper continuous operation
(i) Hydropower stations that show remarkable decrease in output and power generation
Hydropower stations which have a remarkable reduction of generated output and power
generation were screened in comparison with the designed value and the current data.
(ii) Hydropower stations that are 22 years of service age or more since becoming operational
Legal lifetime of electrical and mechanical equipment related to hydropower station is set at 22
years in a guideline in Japan. There is a possibility that the equipment exceeding said legal
lifetime have already deteriorated, causing large scale adverse impacts to the continuous
operation of power station in near future. Procurement of spare parts for such equipment
exceeding the regal life time may be impossible in the market.
(iii) Hydropower stations with serious problems on proper continuous operation
Hydropower stations that presently have serious problems and concerns on continuous
operation were determined through the review of data and information given by PLN
(2) Second Screening
The second screening was conducted to select hydropower stations which could be subjected to site
investigation since verification of current conditions cannot be sufficiently carried out through
review of data itself. Therefore, site investigation is an essential prerequisite of the final screening
in order to identify proposed sites in the rehabilitation plans.
Final Report Chapter 3 Screening of Hydropower Stations
3 - 4
The second screening was focused on the following four criteria to prioritize the proposed
rehabilitation projects.
(i) Importance of the electricity system in the region
(ii) Degree of equipment deterioration and sedimentation
(iii) Effect of power recovery expected through the execution of the rehabilitation
(iv) Urgency of rehabilitation
(i) Importance as the electricity system in the region
The functions of the hydropower station were considered as important in the regional power
network.
(ii) Degree of equipment deterioration and sedimentation
The problems on power generation facilities are obtained from the first screening based on
existing data e.g. feasibility studies and design reports, power generation operation records,
and water depth of the reservoir survey records, etc. and hearing results from PLN. Causes to
such problems were identified.
(iii) Effect of power recovery expected by execution of the rehabilitation
In relation to criteria (i), rehabilitation is intended to contribute in sustaining a stable and
reliable power supply to the regional power network. Possible effects of the rehabilitation
works include performance improvement, reliable and safety improvement, O&M cost
reduction, etc.
(iv) Urgency of rehabilitation
Function and/or safety of hydropower station have to be sustained to realize stable power
generation. If any of the hydropower stations is facing such a serious situation, urgent
countermeasure is required to be taken.
(3) Site investigation
Site investigation was implemented for the hydropower stations selected in the second screening.
This aims to confirm actual conditions of the current issues determined in the second screening,
through visual inspections and interviews.
(4) Third Screening
Base on the collected data/information and interviews during the site investigation, priority ranking
was conducted considering the same criteria adopted for the second screening. This is intended in
to select two candidate rehabilitation plans.
Final Report Chapter 3 Screening of Hydropower Stations
3 - 5
3.2 First Screening
3.2.1 List of Hydropower Stations
At the kick-off meeting held on 21 March 2010 at the PLN head office, the study team requested
PLN to present the current operating conditions of the existing hydropower stations for the purpose
of first screening. However, it was confirmed that Wonogiri in CentralJava and Bakaru in Sulawesi
were excluded from the objectives of this study, because study of their current problems is carrying
out under Japanese Official Development Assistance (ODA).
List of the existing hydropower stations with respective current operating conditions given by PLN
was shown in Table 3.2.1-1. As shown in the table, 25 hydropower stations were presented by
PLN. Locations of these hydropower stations meanwhile are shown in Figure 3.2.1-1.
Table 3.2.1-1 List of Existing Hydropower Stations given by PLN
Area Hydropower Station Completion Year Financial Source
East Java 1 Sengguruh 1988 ADB
2 Sutami (Karangkates) 1973 JBIC
3 Wlingi 1978 JBIC
4 Lodoyo 1983 JBIC
5 Tulungagung 1993 Austria Loan
6 Wonorejo 2003 JBIC
7 Selorejo (Kalikonto) 1973 JBIC
Central Java 8 Soedirman (Mrica) 1988 WB
9 Jelok 1937 WB
10 Tulis 2003 WB
West Java 11 Saguling 1985 JBIC
Sulawesi 12 Tonsea Lama 1950 Own fund
13 Tanggari I 1987 ADB
14 Tanggari II 1998 ADB
Sumatra 15 Tes 1991 ADB
16 Musi 2006 ADB
17 Batang Agam 1983 ADB
18 Maninjau 1983 ADB
19 Singkarak 1998 ADB
20 Besai 2001 WB
21 Batutegi 2002 JBIC
22 Kotapanjang 1998 JBIC
23 Sipansihoporas-1 2005 JBIC
24 Sipansihoporas-2 2002 JBIC
25 Renun 2005 JBIC
(Source: PLN)
Final Report Chapter 3 Screening of Hydropower Stations
3 - 6
Figure 3.2.1-1 Location Map Showing the Existing Hydropower Stations Presented by PLN
(Prepared by JICA Study Team)
3.2.2 Study of First Screening
(1) Decrease of Output (MW) and Power Generation (GWh)
The current output and power generation of the hydropower stations were reported as shown in
Table 3.2.2-1 and results of considerations were described as follows.
Final Report Chapter 3 Screening of Hydropower Stations
3 - 7
Table 3.2.2-1 Output and Power Generation of Existing Hydropower Stations
Output (MW) Power Generation (GWh) Area
Hydropower Station Design Present
% for design
DesignPlan
(2009)Actual (2009)
% for plan
% for design
East Java Sengguruh 29 29 100 99 79 75 95 76
Sutami 105 105 100 488 463 462 100 95
Wlingi 54 54 100 167 153 144 94 86
Lodoyo 4.5 4.5 100 37 40 39 98 105
Tulungagung 36 36 100 184 131 121 92 66
Wonorejo 6.5 6.5 100 32 19 20 105 63
Selorejo 4.5 4.5 100 20 24 27 113 135
Central Java Soedirman(Mrica) 180.9 180.9 100 580 652 479 73 82
Jelok 20.48 20.48 100 97 97 94 97 97
Tulis 12.4 6.0 52 15 15 10 67 67
West Java Saguling 700 700 100 2156 2156 2295 106 106
Sulawesi Tonsea Lama 10 10 100 58 50 44 88 76
Tanggari I 18 18 100 90 63 64 102 71
Tanggari II 19 19 100 92 66 70 106 76
Sumatra Tes 17.6 17.6 100 87 152 96 63 110
Musi 21.5 21.5 100 1120 1839 797 43 71
Batang Agam 10.5 10.5 100 21 40 35 87 167
Maninjau 68 68 100 270 218 205 94 76
Singkarak 175 175 100 986 698 704 101 71
Besai 90 90 100 804 804 646 80 80
Batutegi 28.6 28.6 100 200 200 115 58 58
Kotapanjang 114 114 100 542 542 489 90 90
Sipansihoporas-1 33 33 100 135 142 65 46 48
Sipansihoporas-2 17 17 100 69 72 55 76 80
Renun 41 41 100 618 616 566 92 92
(Source: PLN)
1) Output (MW) of Hydropower Station:
The design and present outputs were shown in the above table. Only the present output of Tulis
(12.4 MW) hydropower station in Central Java was reduced to half of the designed output.
Consequently, it was confirmed that although Tulis had two units of generating equipment, one
of which has been out of service due to alignment problem of the machines caused by the
deformation of the civil structure. Meanwhile, the hydropower stations other than Tulis
maintained their designed outputs.
2) Power Generation (GWh) of Hydropower Station:
The design power generation as well as the planned and actual generation in 2009, were shown
in the above table. Power generation of hydropower stations varies depending on several
factors such as climate, water management, equipment trouble etc., aside from the
deterioration of the power station. Thus, the annual power generation for each power station is
planned every year taking said factors into considerations.
Final Report Chapter 3 Screening of Hydropower Stations
3 - 8
Therefore, the following hydropower stations with remarkable decrease in power generation as
compared to the designed value were reviewed to determine the reasons.
Tulugagung in East Java:
Tulugagung hydropower station commenced the operation in 1993 with designed features of
the output 36 MW (2x18 MW) and the annual power generation 184 GWh. The power
station was constructed to use bypass-water of the existing Palit Agung canal between Brantas
River and the diversion tunnel to Indian Ocean, which has a purpose of lowering the river
water level particularly in wet season for prevention of flood in surrounding area. Under
such situation, available water for the power generation is limited and dependent on the
Brantas river water availability. It is supposed to be less river water availability to Tulugagung
in 2009. This situation is also supposed by Wonorejo for which power generation was
reduced due to more river water supplies for Surabaya city than power generation.
Wonorejo in East Java:
Wonorejo hydropower station commenced operation in 2002 with designed features of 6.5
MW (1x6.5 MW) output and annual power generation of 32 GWh. Wonorejo Dam has
multipurpose functions such as to supply water to Surabaya City and to supply for irrigation
and power generation. The water supply to Surabaya City is the highest priority and therefore,
power generation was only initiated during cases when water discharge from the dam is
available. Under such situation, power generation is nearly half the designed value, which is
about 16 -20 GWh, from the initial operation.
Batutegi in Sumatra:
Batutegi Hydropower Station commenced operation in 2002 with designed features of 28.6
MW (2x14.3 MW) output and annual power generation of 200 GWh. Batutegi Dam has
multipurpose functions such as to supply water for irrigation and power generation. The
power generation depends on water management conducted by PI which gives a higher priority
on irrigation water rather than power generation. Since the damaged stator windings were
repaired in 2009, the power generation in 2009 was reduced from the intended design value.
Sipansihoporas-1in Sumatra:
Sipansihoporas-1 commenced operation in 2005 with designed features of 33 MW (1x33 MW)
output and annual power generation of 135GWh. The power generation in 2009 was
remarkably reduced to 48% of the design value. It was confirmed that the reduction caused by
the long term outage of generator due to short circuit in the stator winding that occurred in
2009. After the repair of the damaged stator windings, the power generation is expected to
recover the design value.
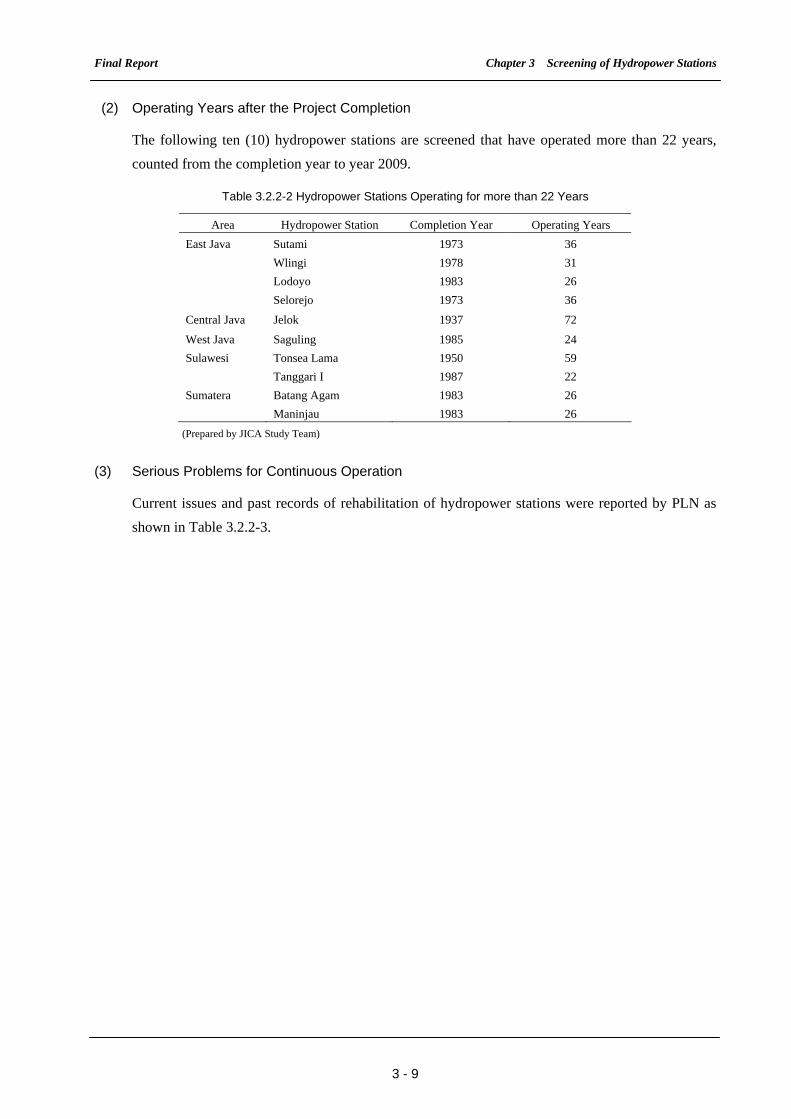
Final Report Chapter 3 Screening of Hydropower Stations
3 - 9
(2) Operating Years after the Project Completion
The following ten (10) hydropower stations are screened that have operated more than 22 years,
counted from the completion year to year 2009.
Table 3.2.2-2 Hydropower Stations Operating for more than 22 Years
Area Hydropower Station Completion Year Operating Years
East Java Sutami 1973 36
Wlingi 1978 31
Lodoyo 1983 26
Selorejo 1973 36
Central Java Jelok 1937 72
West Java Saguling 1985 24
Sulawesi Tonsea Lama 1950 59
Tanggari I 1987 22
Sumatera Batang Agam 1983 26
Maninjau 1983 26
(Prepared by JICA Study Team)
(3) Serious Problems for Continuous Operation
Current issues and past records of rehabilitation of hydropower stations were reported by PLN as
shown in Table 3.2.2-3.
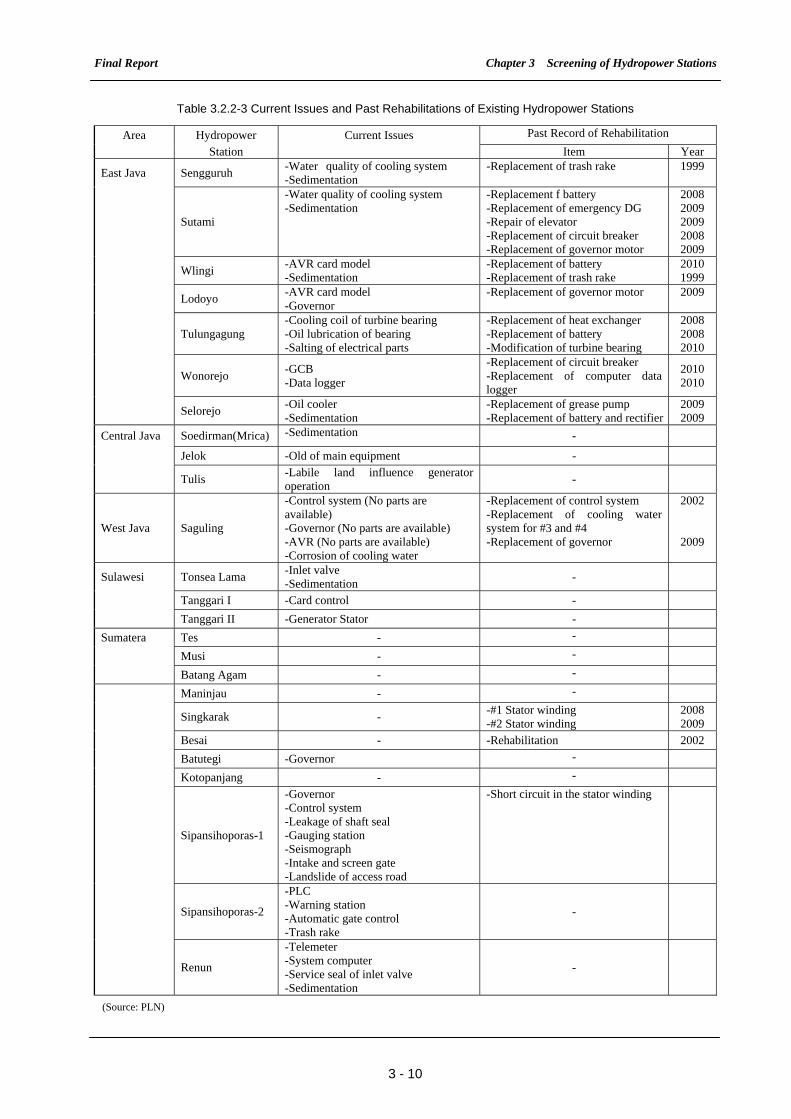
Final Report Chapter 3 Screening of Hydropower Stations
3 - 10
Table 3.2.2-3 Current Issues and Past Rehabilitations of Existing Hydropower Stations
Area Hydropower Current Issues Past Record of Rehabilitation
Station Item Year
East Java Sengguruh -Water quality of cooling system -Sedimentation
-Replacement of trash rake 1999
Sutami
-Water quality of cooling system -Sedimentation
-Replacement f battery -Replacement of emergency DG -Repair of elevator -Replacement of circuit breaker -Replacement of governor motor
20082009200920082009
Wlingi -AVR card model -Sedimentation
-Replacement of battery -Replacement of trash rake
20101999
Lodoyo -AVR card model -Governor
-Replacement of governor motor 2009
Tulungagung -Cooling coil of turbine bearing -Oil lubrication of bearing -Salting of electrical parts
-Replacement of heat exchanger -Replacement of battery -Modification of turbine bearing
200820082010
Wonorejo -GCB -Data logger
-Replacement of circuit breaker -Replacement of computer data logger
20102010
Selorejo -Oil cooler -Sedimentation
-Replacement of grease pump -Replacement of battery and rectifier
20092009
Central Java Soedirman(Mrica) -Sedimentation -
Jelok -Old of main equipment -
Tulis -Labile land influence generator operation
-
West Java Saguling
-Control system (No parts are available) -Governor (No parts are available) -AVR (No parts are available) -Corrosion of cooling water
-Replacement of control system -Replacement of cooling water system for #3 and #4 -Replacement of governor
2002
2009
Sulawesi Tonsea Lama -Inlet valve -Sedimentation
-
Tanggari I -Card control -
Tanggari II -Generator Stator -
Sumatera Tes - -
Musi - -
Batang Agam - -
Maninjau - -
Singkarak - -#1 Stator winding -#2 Stator winding
20082009
Besai - -Rehabilitation 2002
Batutegi -Governor -
Kotopanjang - -
Sipansihoporas-1
-Governor -Control system -Leakage of shaft seal -Gauging station -Seismograph -Intake and screen gate -Landslide of access road
-Short circuit in the stator winding
Sipansihoporas-2
-PLC -Warning station -Automatic gate control -Trash rake
-
Renun
-Telemeter -System computer -Service seal of inlet valve -Sedimentation
-
(Source: PLN)
Final Report Chapter 3 Screening of Hydropower Stations
3 - 11
As seen in the table, most of the existing hydropower stations have been operating with some
issues. However, it can be said that such issues could not seriously affect the continuous operation
at the moment except for Soedirman (Mrica) Hydropower Station, as the result of the following
considerations.
Hydropower stations in East Java
Hydropower stations constructed in the 1970’s and the 1980’s such as Sutami, Wlingi, Tulugagung
and Wonorejo have undergone several rehabilitations in the recent years, and those rehabilitation
works were replacement and/or repair for auxiliary equipment (battery, emergency diesel engine,
governor motor etc), but not for major generating equipment such as turbine runner, generator etc.
However, such frequent replacements even for the auxiliary equipment could be sign of
deteriorations of equipment.
Hydropower stations in Central Java
According to information from IP, Soedirman (Mrica) is facing a serious problem on sedimentation
and concern about operating continuance in the near future. The gross storage capacity of Mrica
reservoir has been reduced to 65% of the original capacity due to sedimentation at an average rate
of 4.2 MCM per year. If sedimentation will continuously occur at the same rate, the function of the
reservoir will be terminated in 2014 according to IP evaluation. Furthermore, safety of dam itself
could also be affected.
Hydropower stations in West Java
Saguling, which commenced the operation in 1985, made rehabilitation work for control and
protection system that the old type analog system was replaced with new digital type in 2002.
Saguling is facing a problem on cooling water system, but a rehabilitation work of cooling water
system as well as governor is planned to be carried out under JBIC export credit line.
Hydropower stations in Sumatra
Singkarak, which commenced the operation in 1998, made rehabilitation works for stator winding
of 2 units in 2008 and 2009 respectively.
Sipansihoporas-1, which was commenced the operation in 2005, has several issues for various
components of generating equipment such as governor, control system etc., but considering that it
commenced operation in 2005, it is supposed that such issues are not caused by the deterioration of
equipment. Thus, post evaluation for Sipansihoporas-1 is recommended to recognize the current
situation of the equipment.
3.2.3 Result of First Screening
Based on the above study for the first screening, twelve (12) hydropower stations were selected for
further screening, as shown in Table 3.2.3-1. These include ten hydropower stations operating for
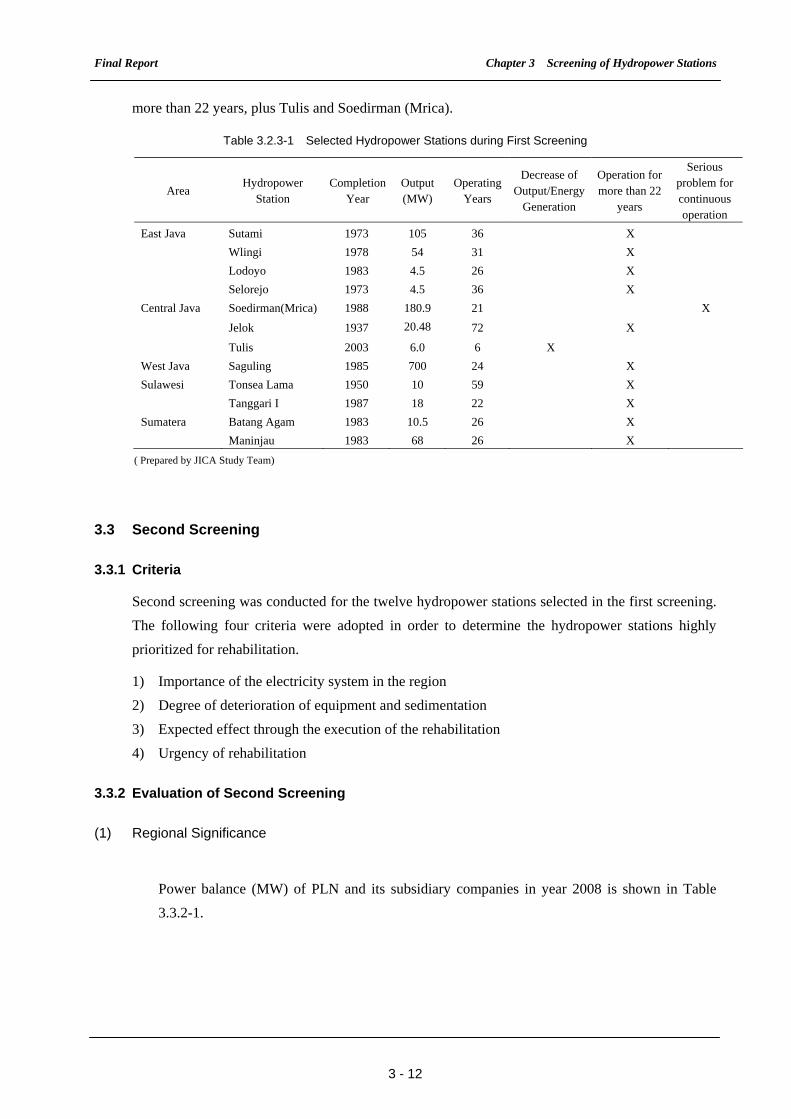
Final Report Chapter 3 Screening of Hydropower Stations
3 - 12
more than 22 years, plus Tulis and Soedirman (Mrica).
Table 3.2.3-1 Selected Hydropower Stations during First Screening
Area Hydropower
Station Completion
Year Output(MW)
Operating Years
Decrease of Output/Energy
Generation
Operation for more than 22
years
Serious problem for continuous operation
East Java Sutami 1973 105 36 X
Wlingi 1978 54 31 X
Lodoyo 1983 4.5 26 X
Selorejo 1973 4.5 36 X
Central Java Soedirman(Mrica) 1988 180.9 21 X
Jelok 1937 20.48 72 X
Tulis 2003 6.0 6 X
West Java Saguling 1985 700 24 X
Sulawesi Tonsea Lama 1950 10 59 X
Tanggari I 1987 18 22 X
Sumatera Batang Agam 1983 10.5 26 X
Maninjau 1983 68 26 X
( Prepared by JICA Study Team)
3.3 Second Screening
3.3.1 Criteria
Second screening was conducted for the twelve hydropower stations selected in the first screening.
The following four criteria were adopted in order to determine the hydropower stations highly
prioritized for rehabilitation.
1) Importance of the electricity system in the region
2) Degree of deterioration of equipment and sedimentation
3) Expected effect through the execution of the rehabilitation
4) Urgency of rehabilitation
3.3.2 Evaluation of Second Screening
(1) Regional Significance
Power balance (MW) of PLN and its subsidiary companies in year 2008 is shown in Table
3.3.2-1.
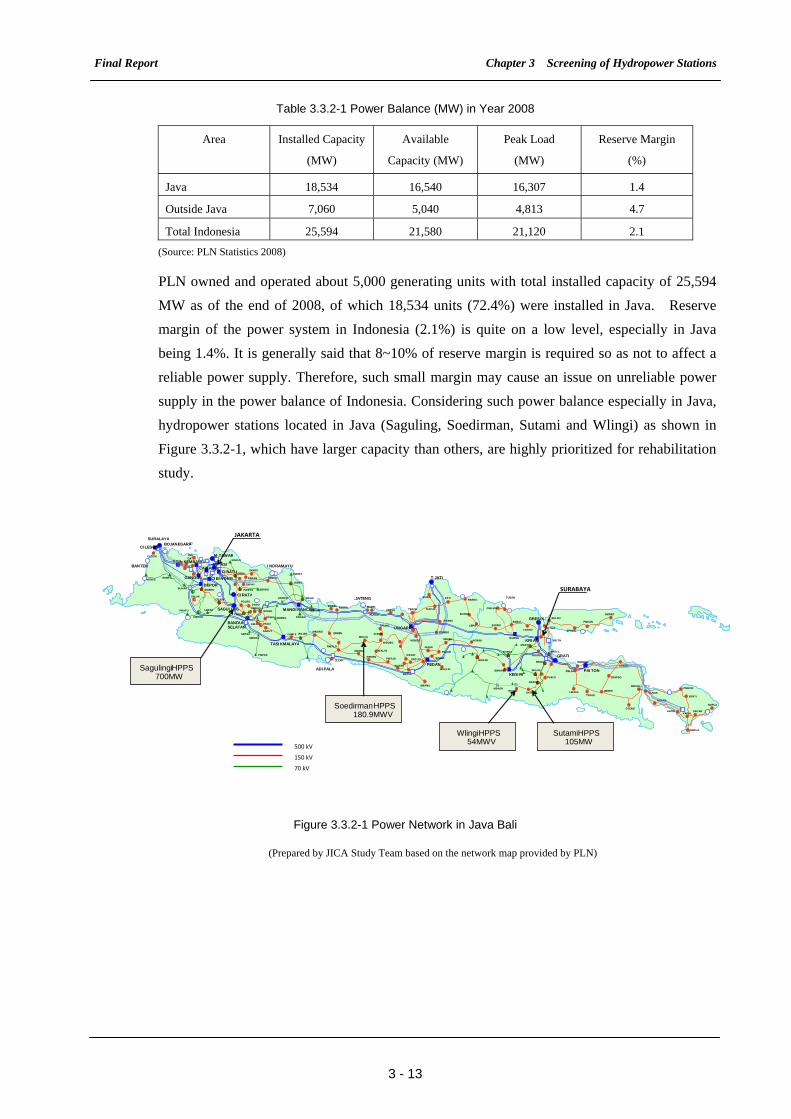
Final Report Chapter 3 Screening of Hydropower Stations
3 - 13
Table 3.3.2-1 Power Balance (MW) in Year 2008
Area Installed Capacity
(MW)
Available
Capacity (MW)
Peak Load
(MW)
Reserve Margin
(%)
Java 18,534 16,540 16,307 1.4
Outside Java 7,060 5,040 4,813 4.7
Total Indonesia 25,594 21,580 21,120 2.1
(Source: PLN Statistics 2008)
PLN owned and operated about 5,000 generating units with total installed capacity of 25,594
MW as of the end of 2008, of which 18,534 units (72.4%) were installed in Java. Reserve
margin of the power system in Indonesia (2.1%) is quite on a low level, especially in Java
being 1.4%. It is generally said that 8~10% of reserve margin is required so as not to affect a
reliable power supply. Therefore, such small margin may cause an issue on unreliable power
supply in the power balance of Indonesia. Considering such power balance especially in Java,
hydropower stations located in Java (Saguling, Soedirman, Sutami and Wlingi) as shown in
Figure 3.3.2-1, which have larger capacity than others, are highly prioritized for rehabilitation
study.
Figure 3.3.2-1 Power Network in Java Bali
(Prepared by JICA Study Team based on the network map provided by PLN)
SURALAYA CILEGON
M.TAWAR
GANDUL CIBATU
CIBINONG
CIRATA SAGULING
DEPOK
BEKASI CAWANG
TASIKMALAYA
BANDUNG SELATAN
MANDIRANCAN UNGARAN
T.JATI
PEDAN
KEDIRIPAITON
GRATI KRIAN
GRESIK
KEMBANGAN
GLNUK
PMRON
BTRTI
KAPAL
NGARA
ANTRI GNYAR
AMPLA
NSDUA
GTENG
STBDO
BWNGI BDWSO
JMBER TNGUL LMJNG
GNDING PBLGO
PAKIS
WLNGIKKTES
KBAGN
BNGIL BNGIL
SKLNG
KBAGN
BNRAN
GLTMR
BKLAN SPANG
PMKSN SMNEP LNGAN
NGBNG
MKRTO
NGOROKTSNO
SBLTN
TUBAN
BABAT
DWIMA
BJGRO
NGAWI
MNRJO
RBANG
BLORA
CEPU
SRGEN
PWRDI
KDMBO
PATIJPARA
KUDUSTBROKKRPYKWLERI
KLNGU
GRUNG
DIENG
WSOBO
WALIN
PWRJO
WATES
BNTUL
SMANU
MDARI
KNTUG
WNGIRI
WNSRI
PALUR
JAJAR
MJNGO
KBSENBRBES
KBSEN
RWALO
CLCAP
GBONG
KBMEN
MRICA
MNANG BNJAR CAMIS
JTBRG HRGLS
SRAGI
SKMDI INDMY
SBANG PWKTA CKPAY PBRAN
GARUT DRJAT CKSKA RCKEK KMJNG
CGRLG
UBRNG PDLRG DAGO
KSBRU RGDLK
KNGAN BBKAN MLBNG ARJWN
PMPEK SMDRA SNTSA
CNJUR LBSTU PRATU
UBRUG
SALAK BGBRU BUNAR RKBTG
MENES
CLGON TNA GA
BLRJA
P P P P
P P P P
P P
500 kV
INDRAMAYU
.JATENG
ADIPALA
BOJANEGARA
BANTEN
Sutami HPPS 105MW
SoedirmanHPPS180.9MWV
WlingiHPPS54MWV
Sagulingi HPPS 700MW
150 kV 70 kV
JAKARTA
SURABAYA
Final Report Chapter 3 Screening of Hydropower Stations
3 - 14
(2) Degree of Equipment Deterioration and Sedimentation
Replacement of major generating equipment such as water turbine and generator of twelve
hydropower stations have not been carried out. Meanwhile, replacement of auxiliary equipment
such as battery, EDG, motor etc, have already been implemented. It is especially noted that Sutami
and Wlingi hydropower stations in East Java, constructed in the 1970’s, have been within the
30~50 years expected reliable lifetime of electrical and mechanical equipment related to
hydropower station. Therefore, it is considered that these hydropower stations are at high risk of
serious problems.
Problems on sedimentation and reservoir water pollution are very serious in Java and Kalimantan
islands from characteristics of geology and soils point of view and also due to watershed
management problems. In particular, Sengguluh, Sutami and Wlingi in East Java, and Soedirman
in Central Java have big reservoirs, but their capacities are drastically decreased at present as
compared to the planned volume. Also Saguling in West Java suffered from serious water quality
problems. Meanwhile, significant volume of sediment flows to the reservoir due to effects of
deforestation. However as the reservoir gross capacity is considerably huge (Gross: 875 MCM,
Effective: 611 MCM), such sedimentation problem is not regarded as serious at present.
(3) Expected Effect of the Execution of the Rehabilitation
The major roles of hydropower station are to function during peak load operation of the power
network and to serve water for irrigation and/or city use. It is considered that hydropower stations
with large capacities are intended to provide effective power output and reservoir capacity,
consequently ensuring a reliable and stable power supply to the region. Hence, hydropower stations
such as Saguling (700 MW), Soedirman (180 MW), Sutami (105 MW) and Wlingi (54 MW) which
have relatively large capacities are considered to produce remarkable effects through the extension
of their service life. In addition, Saguling has a particular function to provide Load Frequency
Control (LFC) of 500 kV power transmission network for stabilizing network frequency in case of
sudden load change. On the other hand, the expected effect of rehabilitation with small hydropower
station is comparatively low.
Based on the above standpoint, such hydropower stations with the output less than 50MW and the
power generation less than 100GWh were excluded from the candidate hydropower stations during
the second screening.
Final Report Chapter 3 Screening of Hydropower Stations
3 - 15
Table 3.3.2-2 Output/Generation of Candidate Hydropower Stations
Area Hydropower
Station Output(MW)
Design Generation
(GWh)
Operating Years
West Java Saguling 700 2,156 24
Central Java Soedirman(Mrica) 180.9 580 21
East Java Sutami 105 488 36
Sumatera Maninjau 68 270 26
East Java Wlingi 54 167 31
Central Java Jelok 20.48 97 72
Sulawesi Tanggari I 18 90 22
Sumatera Batang Agam 10.5 21 26
Sulawesi Tonsea Lama 10 58 59
Central Java Tulis 6.0 15 6
East Java Lodoyo 4.5 37 26
East Java Selorejo 4.5 20 36
(Prepared by JICA Study Team)
(4) Urgency of Rehabilitation
As evaluated in the first screening, urgent countermeasures against sedimentation problem of Mrica
reservoir were considered to be taken so as to protect its reservoir function and dam safety.
3.3.3 Results of Second Screening
Taking the above assessments into consideration for the second screening, the four (4) high-priority
hydropower stations were selected from the 12 hydropower stations that were left during the first
screening.
From the view point of regional significance, the power network in Java has a significant issue
because of a very small margin in the generation capacity against for the maximum power demand,
and moreover the power network in the East Java has partly failed due to acting of the
mud-volcano. The stable operation of hydropower stations in the East Java is so important to
ensure the stable and reliable power supply to whole Java because the power supply to West Java
depends heavily on the large-scale thermal power stations such as Paiton and Grati in East Java.
By the reason, Sutami and Wling which are relatively large-scale hydropower stations in the East
Java were selected from the view points of the regional significant and the expected effect, whereas
other hydropower stations of Lodoyo, Selorejo, Julok and Tulis located in Java were excluded
during the second screening.
In addition to the above selection of Sutami and Wlingi, two more hydropower stations of Saguling
and Soedirman were also selected by the following reasons.
1) Saguling, which is located in the West Java, was selected because Saguling has the largest
output and annual generation so as to have a great impact to the power network by the LFC
Final Report Chapter 3 Screening of Hydropower Stations
3 - 16
function not only by its scale.
2) Soedirman, which is located in the Central Java, was selected because Mrica reservoir has a
serious problem of sedimentation and an urgent countermeasure is required for cultivation,
irrigation as well as for power generation.
On the other hand, hydropower stations located in Sulawesi (Tonsea Lama and Tanggari I) and
Sumatra (Batam Agam and Maninjau) were set lower priority than the above hydropower stations
The selected hydropower stations by the second screening were shown in Table 3.3.3-1 for which
set with higher priorities than others and to be subject to site investigation for further study.
Table 3.3.3-1 Selected Hydropower Stations Based on Second Screening
Area Hydropower Station Financial
Source Output Completion Year Operating Years
East Java Sutami JBIC 105 MW 1973 36
Wlingi JBIC 54 MW 1978 31
Central Java Soedirman (Mrica) WB 180 MW 1988 21
West Java Saguling JBIC 700 MW 1985 24
(Prepared by JICA Study Team)
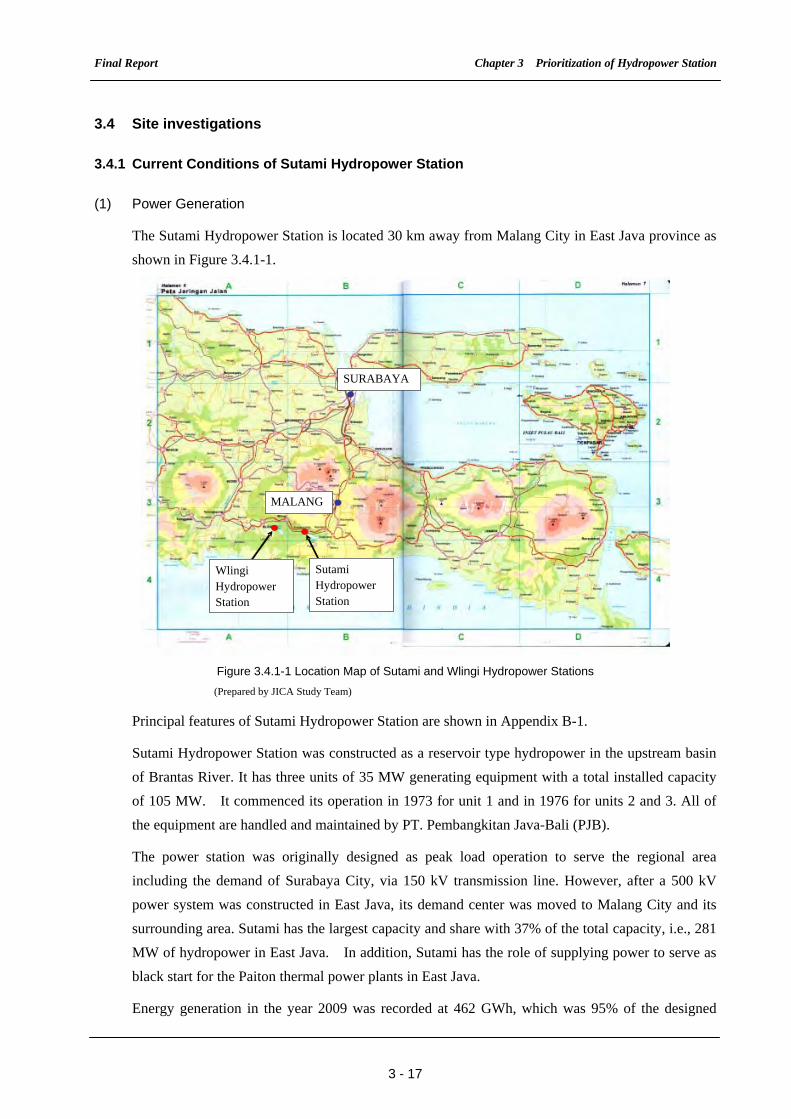
Final Report Chapter 3 Prioritization of Hydropower Station
3 - 17
3.4 Site investigations
3.4.1 Current Conditions of Sutami Hydropower Station
(1) Power Generation
The Sutami Hydropower Station is located 30 km away from Malang City in East Java province as
shown in Figure 3.4.1-1.
Figure 3.4.1-1 Location Map of Sutami and Wlingi Hydropower Stations
(Prepared by JICA Study Team)
Principal features of Sutami Hydropower Station are shown in Appendix B-1.
Sutami Hydropower Station was constructed as a reservoir type hydropower in the upstream basin
of Brantas River. It has three units of 35 MW generating equipment with a total installed capacity
of 105 MW. It commenced its operation in 1973 for unit 1 and in 1976 for units 2 and 3. All of
the equipment are handled and maintained by PT. Pembangkitan Java-Bali (PJB).
The power station was originally designed as peak load operation to serve the regional area
including the demand of Surabaya City, via 150 kV transmission line. However, after a 500 kV
power system was constructed in East Java, its demand center was moved to Malang City and its
surrounding area. Sutami has the largest capacity and share with 37% of the total capacity, i.e., 281
MW of hydropower in East Java. In addition, Sutami has the role of supplying power to serve as
black start for the Paiton thermal power plants in East Java.
Energy generation in the year 2009 was recorded at 462 GWh, which was 95% of the designed
MALANG
SURABAYA
Wlingi Hydropower Station
SutamiHydropower Station
Final Report Chapter 3 Prioritization of Hydropower Station
3 - 18
value of 488 GWh.
(2) Hydromechanical Equipment (Gates and Penstocks)
Technical specifications and results of the site investigation of the hydro mechanical equipment are
shown in Appendix C-1. Other than the equipment shown in the Appendix C-1, the dam is
equipped with a spillway gate and river outlet facilities that are being operated by Perusahaan Jasa
Tirta I (PJT I), and not by PJB. Hence, investigation and studies about the equipment undertaken
by PJT I are excluded from this report.
The equipment has been maintained well since the completion of installation in 1972. Routine
inspection and maintenance works have been conducted by the PJB’s staff at the power station. It
was found that there had been no serious troubles on operation, through interviews with personnel
in charge at the power station. It was only reported that a small leakage was observed on the
rubber seal of Intake Gate No. 1. This seal is scheduled to be replaced with a new one in the next
maintenance period.
During the visual checking of equipment at the site, it was found that the model of the control
system of intake gates was obsolete. The system does not conform to the requirements of the
current safety regulations for electrical devices. Thus, it was evaluated that these control cabinets
must be replaced with the ones that meet the current safety regulations. Furthermore, the colored
lenses that cover the indicator lights on the local control cabinet were broken.
Steel surge tanks and steel penstocks have been maintained well and no significant defects such as
heavy corrosion were observed.
Although it was observed the draft tube gate (tailrace gate) is fairly corroded, such corrosion does
not influence the operating life time of the equipment.
(3) Generating Equipment (Water Turbines, Generators and Control System)
Technical specifications and results of the site investigation of the generating equipment are shown
in Appendix C-1.
Unit 1 has been operating for over 36 years since its installation on 30 September 1973, while units
2 and 3 for over 33 years since 28 February 1976.
The generating equipment has been maintained well by power station staff by implementing
planned annual inspection, general inspection and major overhaul. It was observed during the site
investigation that there were no serious problems that affect the continuous operation. However,
the following observations were noted:
1) Water Turbine: Water turbine is of Francis type and a spare runner was provided at the same
time as the completion of project. The spare runner was replaced by a used runner during
major overhaul, which is carried out after 40,000 hours of operation. Damage or cavitations
Final Report Chapter 3 Prioritization of Hydropower Station
3 - 19
found in the removed runner were repaired by welding at a workshop in Surabaya, and stored
in the power station for further use during the next major overhaul. The existing runners have
not yet been replaced with new ones since the initial operation.
2) Inlet Valve: Leakage from rubber seals of inlet valves were observed for all units due to gland
packing degradation. The rubber seals have not been replaced since the installation of the
respective units in 1973 and 1976.
3) Governor and Automatic Voltage Regulator (AVR): Governor and AVR, which have
important functions such as speed and voltage control in response to fluctuation of the power
demand, are of mechanical types with analog indicators. These are already obsolete
considering that they were designed in the 1970’s and thus, their spare parts are no longer
available in the market.
4) Generator: Stator and rotor windings were inspected only by means of measuring the
insulation resistance during major overhauls. According to the data for unit 2 during the major
overhaul conducted in 2006, the insulation resistances were plotted in the range between 1.22
M-ohm and 136 M-ohm for stator windings, and between 83.6 M-ohm and 1,480 M-ohm for
rotor windings. The insulation resistance values indicate a sign of deteriorating electrical
insulation; however, it is very difficult to evaluate the degree of deterioration with such limited
data. Moreover, the measured values were unbalanced and plotted in a wide range from small
to large values. It is deemed that there is a potential insulation problem inside the stator and
rotor windings. In 2004, Nippon Koei conducted inspection of the generating equipment using
the testing equipment for stator windings. Subsequently, the estimated residual life of stator
windings was assessed to be two years based on the calculated braking voltage of stator
windings. The inspection report is attached in Appendix D of this report.
5) Supervisory and Control System: The supervisory and control system are of analog types
designed in the 1970’s, and replacement of any of said components has not taken place as of
date. Operating apparatus on the operating desk such as the handle or knob was worn out.
Moreover, all protection relays for the system protection including major components such as
water turbine, generator and main transformer are of mechanical types and spare parts are no
longer available in the market. Since it is not equipped with automatic data logger used for
recording operating status and events, the operating staff takes records manually. Furthermore,
data communication to Load Dispatch Center in Surabaya is very limited due to limited band
of communication means at the Power Line Carrier (PLC), through the transmission lines.
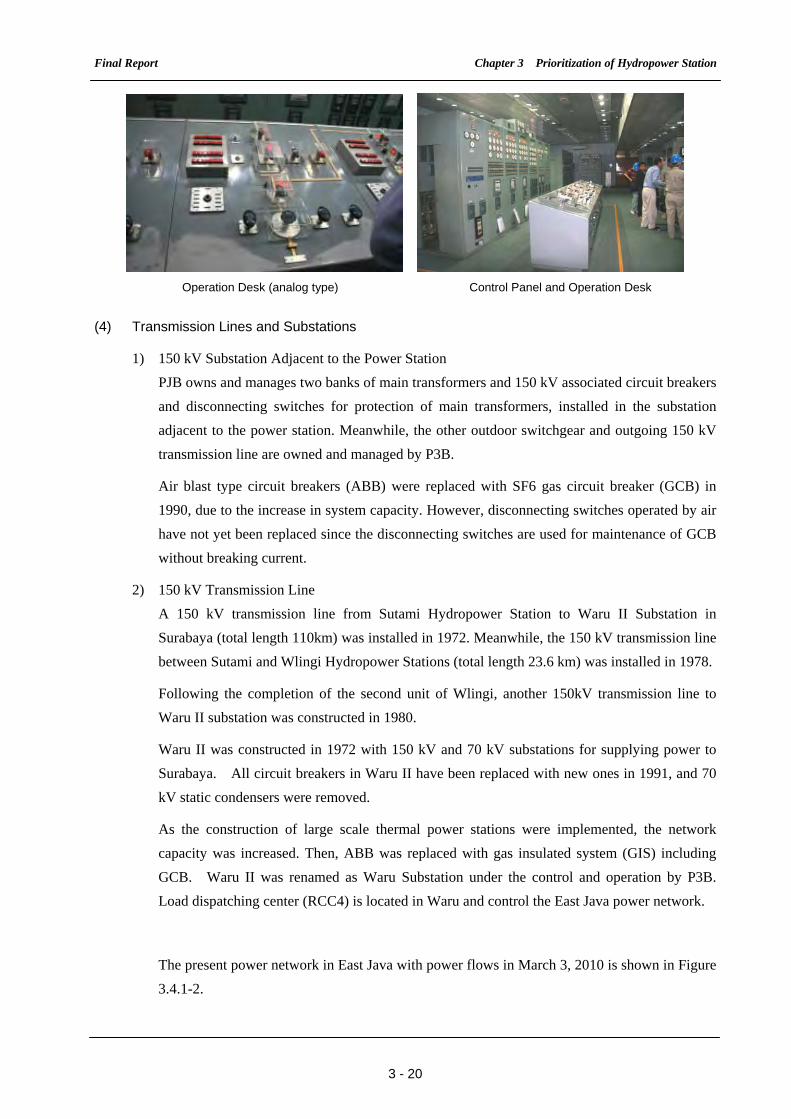
Final Report Chapter 3 Prioritization of Hydropower Station
3 - 20
Operation Desk (analog type) Control Panel and Operation Desk
(4) Transmission Lines and Substations
1) 150 kV Substation Adjacent to the Power Station
PJB owns and manages two banks of main transformers and 150 kV associated circuit breakers
and disconnecting switches for protection of main transformers, installed in the substation
adjacent to the power station. Meanwhile, the other outdoor switchgear and outgoing 150 kV
transmission line are owned and managed by P3B.
Air blast type circuit breakers (ABB) were replaced with SF6 gas circuit breaker (GCB) in
1990, due to the increase in system capacity. However, disconnecting switches operated by air
have not yet been replaced since the disconnecting switches are used for maintenance of GCB
without breaking current.
2) 150 kV Transmission Line
A 150 kV transmission line from Sutami Hydropower Station to Waru II Substation in
Surabaya (total length 110km) was installed in 1972. Meanwhile, the 150 kV transmission line
between Sutami and Wlingi Hydropower Stations (total length 23.6 km) was installed in 1978.
Following the completion of the second unit of Wlingi, another 150kV transmission line to
Waru II substation was constructed in 1980.
Waru II was constructed in 1972 with 150 kV and 70 kV substations for supplying power to
Surabaya. All circuit breakers in Waru II have been replaced with new ones in 1991, and 70
kV static condensers were removed.
As the construction of large scale thermal power stations were implemented, the network
capacity was increased. Then, ABB was replaced with gas insulated system (GIS) including
GCB. Waru II was renamed as Waru Substation under the control and operation by P3B.
Load dispatching center (RCC4) is located in Waru and control the East Java power network.
The present power network in East Java with power flows in March 3, 2010 is shown in Figure
3.4.1-2.
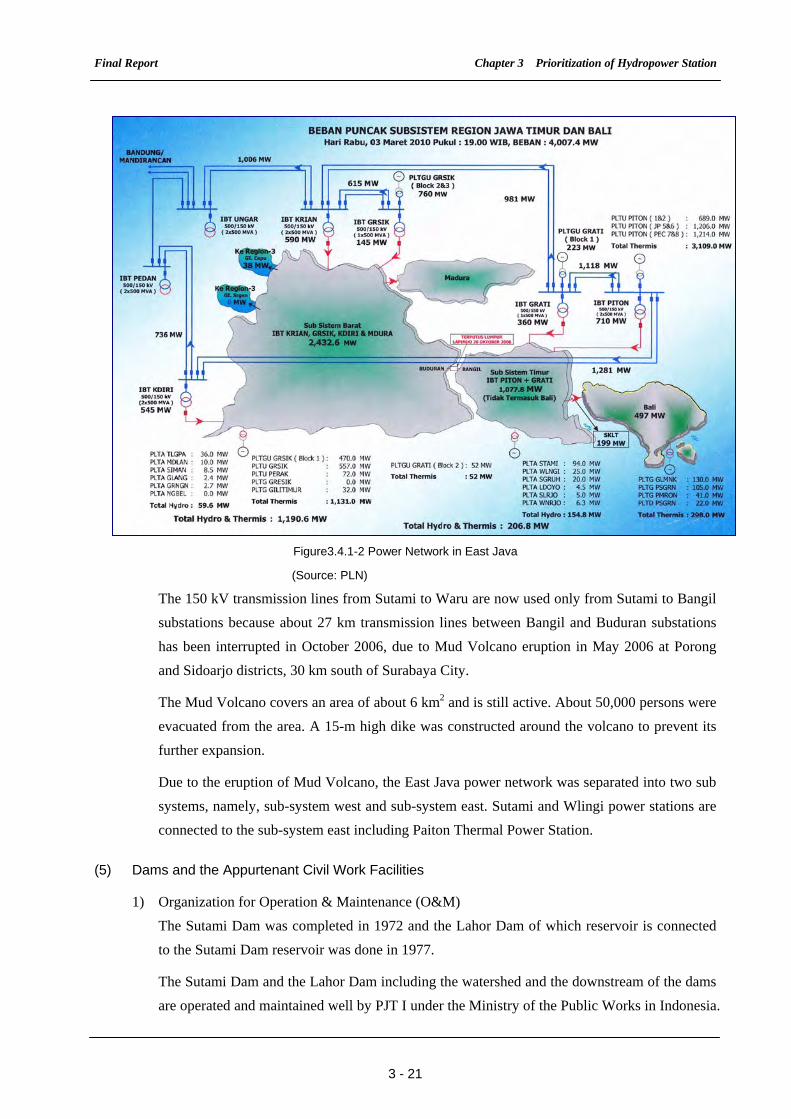
Final Report Chapter 3 Prioritization of Hydropower Station
3 - 21
Figure3.4.1-2 Power Network in East Java
(Source: PLN)
The 150 kV transmission lines from Sutami to Waru are now used only from Sutami to Bangil
substations because about 27 km transmission lines between Bangil and Buduran substations
has been interrupted in October 2006, due to Mud Volcano eruption in May 2006 at Porong
and Sidoarjo districts, 30 km south of Surabaya City.
The Mud Volcano covers an area of about 6 km2 and is still active. About 50,000 persons were
evacuated from the area. A 15-m high dike was constructed around the volcano to prevent its
further expansion.
Due to the eruption of Mud Volcano, the East Java power network was separated into two sub
systems, namely, sub-system west and sub-system east. Sutami and Wlingi power stations are
connected to the sub-system east including Paiton Thermal Power Station.
(5) Dams and the Appurtenant Civil Work Facilities
1) Organization for Operation & Maintenance (O&M)
The Sutami Dam was completed in 1972 and the Lahor Dam of which reservoir is connected
to the Sutami Dam reservoir was done in 1977.
The Sutami Dam and the Lahor Dam including the watershed and the downstream of the dams
are operated and maintained well by PJT I under the Ministry of the Public Works in Indonesia.
Final Report Chapter 3 Prioritization of Hydropower Station
3 - 22
Meanwhile, the power generation facilities consisting of the power intake, the headrace tunnel,
the penstock pipe, the powerhouse and the tailrace outlet are properly maintained by PJB.
2) Current Status of Sutami Dam and Lahor Dam
According to PJT I, behaviors of the measuring apparatus installed to monitor the movement
of the dams and the appurtenant structures are generally normal. The ordinary and visual
inspection reveal no abnormal phenomena in the dams and the appurtenant structures. The dam
safety evaluation based on the measuring apparatus records are made twice per year and the
results are then fully reported to the Dam Safety Committee in the Ministry of the Public
Works.
The downstream training wall of the spillway in the Sutami Dam was repaired in 2007 under
the financial assistance of Japanese ODA (Water Resources Existing Facilities Rehabilitation
and Capacity Improvement Project, JBIC Loan No. IP-510, hereinafter called as ‘Brantas
River Rehabilitation Project’). Subsequently no inconvenience in the dam operation was
reported.
3) Current Status of Power Generation Facilities
According to PJB, no periodic inspection has been carried out for the civil structures of the
power generation faculties. Nevertheless, it is evident from the observation that the structures
are not exhibiting any defects.
4) Visual Inspection Results
The JCA Study Team has carried out the visual inspection of the civil structure focusing on
settlement, deformation, leakage, and crack at the dams and power generation facilities. No
serious defects have been observed. Results from the observation of the above facilities are
shown in Appendix C1.
(6) Sedimentation in the Reservoir
1) Geology in the watershed
As shown in Figure 3.4.1-3, the Brantas River between the Sengguruh Dam and the Sutami
Dam flows in the northern margin of the “Southern Mountains Zone” area. The area of the
zone shows mountainous topography consisting of Tertiary Oligocene - Miocene volcanic
rocks and sedimentary rocks. These rocks are soft to medium hard, and are considered
generally to have sediment discharge ratios which are not so high. The tributaries of the
Brantas River distributed in the Southern Mountains Zone area have very minor lengths
compared to others. Accordingly, it is estimated that no large amount of sedimentation occurs
in the area of these dams.
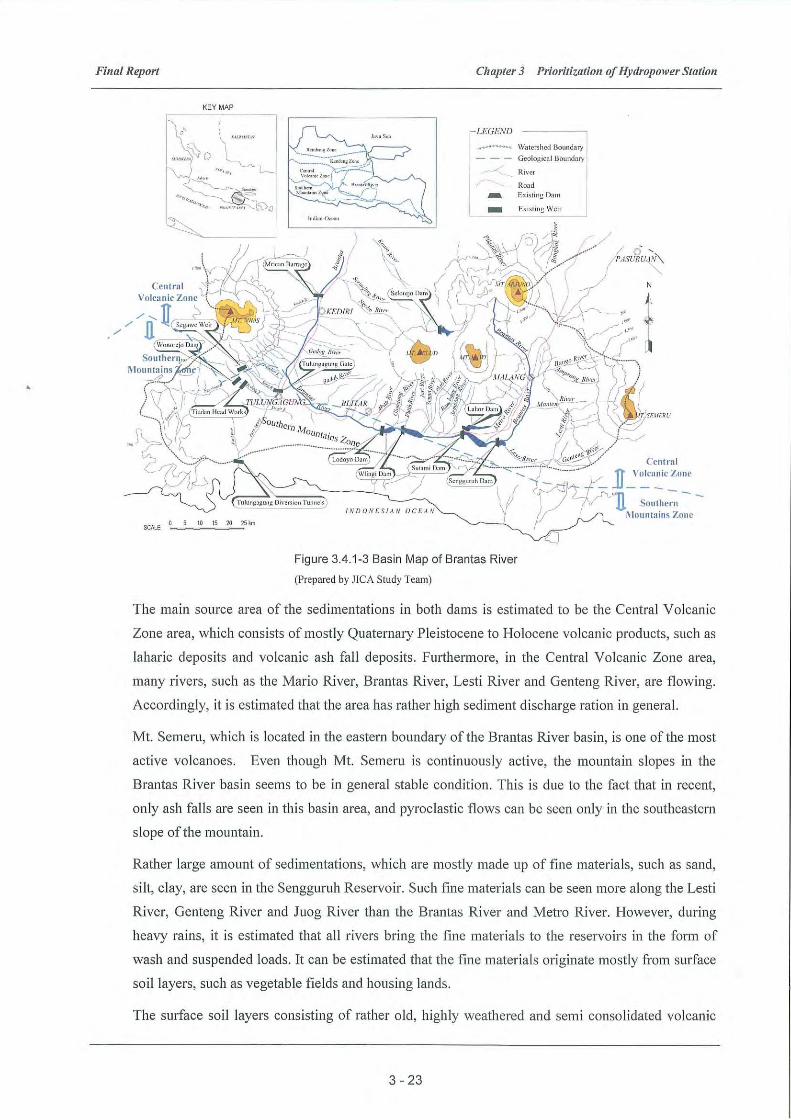
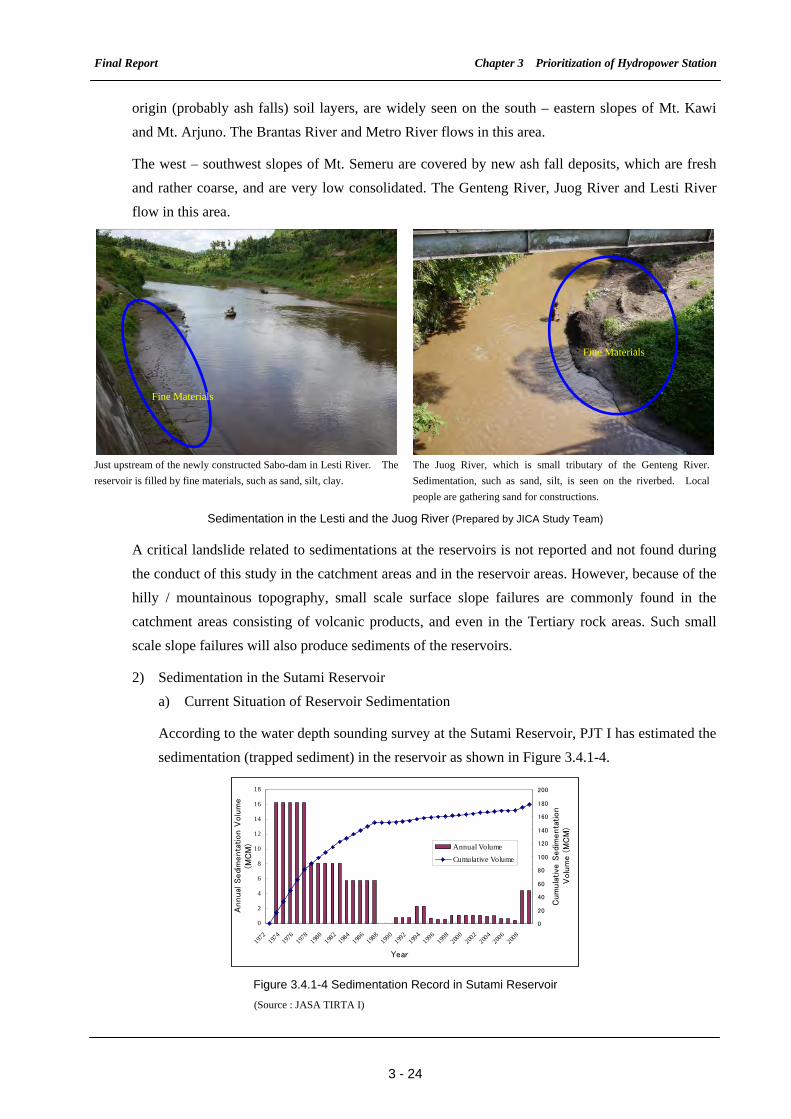
Final Report Chapter 3 Prioritization of Hydropower Station
3 - 24
origin (probably ash falls) soil layers, are widely seen on the south – eastern slopes of Mt. Kawi
and Mt. Arjuno. The Brantas River and Metro River flows in this area.
The west – southwest slopes of Mt. Semeru are covered by new ash fall deposits, which are fresh
and rather coarse, and are very low consolidated. The Genteng River, Juog River and Lesti River
flow in this area.
Just upstream of the newly constructed Sabo-dam in Lesti River. The
reservoir is filled by fine materials, such as sand, silt, clay.
The Juog River, which is small tributary of the Genteng River.
Sedimentation, such as sand, silt, is seen on the riverbed. Local
people are gathering sand for constructions.
Sedimentation in the Lesti and the Juog River (Prepared by JICA Study Team)
A critical landslide related to sedimentations at the reservoirs is not reported and not found during
the conduct of this study in the catchment areas and in the reservoir areas. However, because of the
hilly / mountainous topography, small scale surface slope failures are commonly found in the
catchment areas consisting of volcanic products, and even in the Tertiary rock areas. Such small
scale slope failures will also produce sediments of the reservoirs.
2) Sedimentation in the Sutami Reservoir
a) Current Situation of Reservoir Sedimentation
According to the water depth sounding survey at the Sutami Reservoir, PJT I has estimated the
sedimentation (trapped sediment) in the reservoir as shown in Figure 3.4.1-4.
0
2
4
6
8
10
12
14
16
18
1972
1974
1976
1978
1980
1982
1984
1986
1988
1990
1992
1994
1996
1998
2000
2002
2004
2006
2008
Year
Annual
Sedi
menta
tion V
olu
me
(MC
M)
0
20
40
60
80
100
120
140
160
180
200
Cum
ula
tive
Sedi
menta
tion
Volu
me (
MC
M)
Annual Volume
Cumulative Volume
Figure 3.4.1-4 Sedimentation Record in Sutami Reservoir (Source : JASA TIRTA I)
Fine Materials
Fine Materials
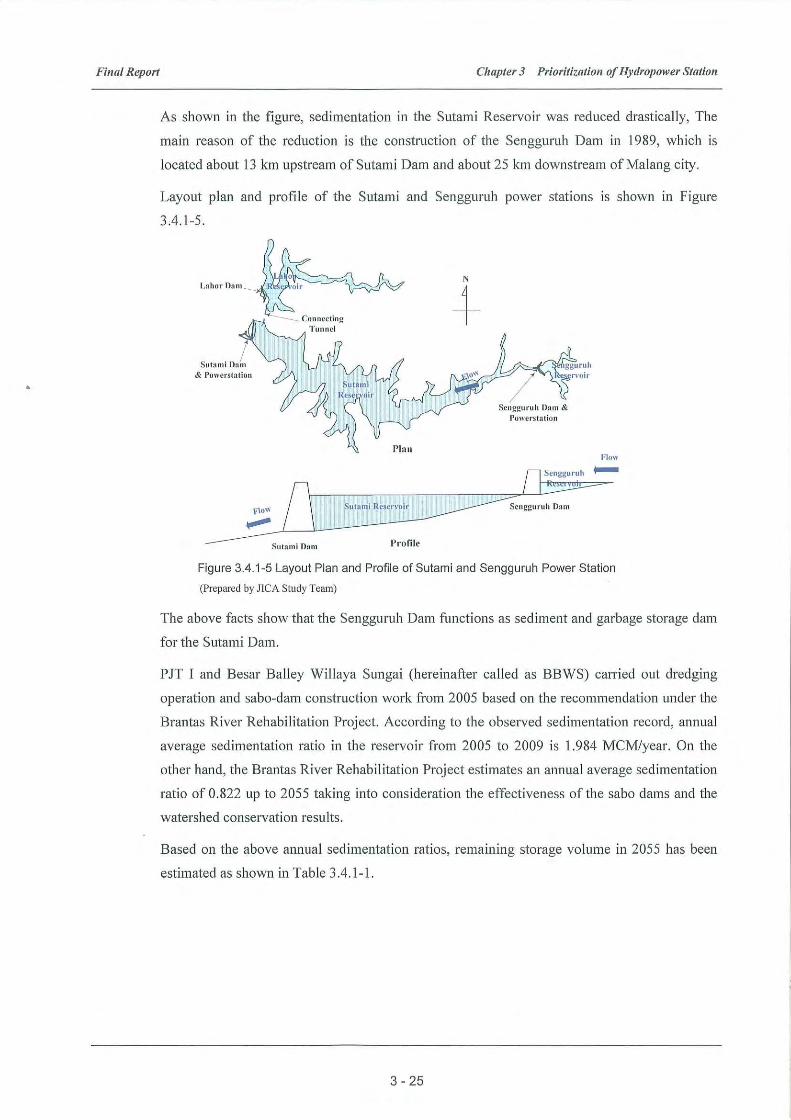
Final Report Chapter 3 Prioritization of Hydropower Station
3 - 26
Table 3.4.1-1 Prediction of Sedimentation in Sutami Reservoir
Item
Estimated based
on observed
record from
2005 to 2009
Estimated in the
Brantas River
Rehabilitation
Project
Remarks
Remaining Gross storage Capacity in
2009 (MCM) (1)
165.454*1) 165.454*1) *1) Observed record in 2009
Annual Average Sedimentation
(trapped sediment) Rate in the
reservoir (MCM/Year) (2)
1.984 *2) 0.822 *3) *2) Estimated based on
observed record from 2005 to
2009.
*3) Derived from Figure 3.15 of
the Report on Engineering
Studies for the Brantas River
and the Bengawan Solo River
Basins Volume 1 Summary
Dredging (MCM/Year) (3) Included*4) 0.3 *4) Effectiveness of the
dredging has been included in
the annual sedimentation rate
obtained in *2)
Accumulated Sedimentation Volume
in the Reservoir from 2010 to 2055 (
91.264 24.012 (4)=((2)-(1)) x 46)
Remaining Gross Storage Capacity in
2055 (MCM)
74.190 141.438 ((5)=(1)-(4))
Ratio of Remaining Storage Capacity
between 2009 and 2055 (%)
45% 85% ((6)=((5) / (1)) x 100)
(Prepared by JICA Study Team based on the observation results by PJT I)
According to the Brantas River Rehabilitation Project, if the watershed conservation master
(M/P) was implemented on schedule along with the maintenance dredging works of
300,000m3/year, the service time of the Sutami Reservoir will be extended up-to around 2055.
However, if the expected results will not be obtained regardless of the watershed conservation,
essential works, such as the large-scale dredging or the dam crest raising, shall be considered
as the long-term countermeasures.
b) Current Situation of Sediment Management
In order to achieve the expected results of the Brantas Rehabilitation Project, PJT I and the
Besar Balley Willya Sungai (hereinafter called as BBWS) under the Ministry of Public Works
are actively conducting the following countermeasures in the reservoir and in the watershed
under the financial assistance of Japanese ODA and through its his own fund.
b-1) Sediment Management of Sengguruh Reservoir
A large quantity of sediment and erupted materials from the Semer Volcano flow into the
Sengguruh Reservoir from the Lesti River, left bank tributary of the Brantas River.
Moreover a large quantity of waste materials from households flows from Malang city.
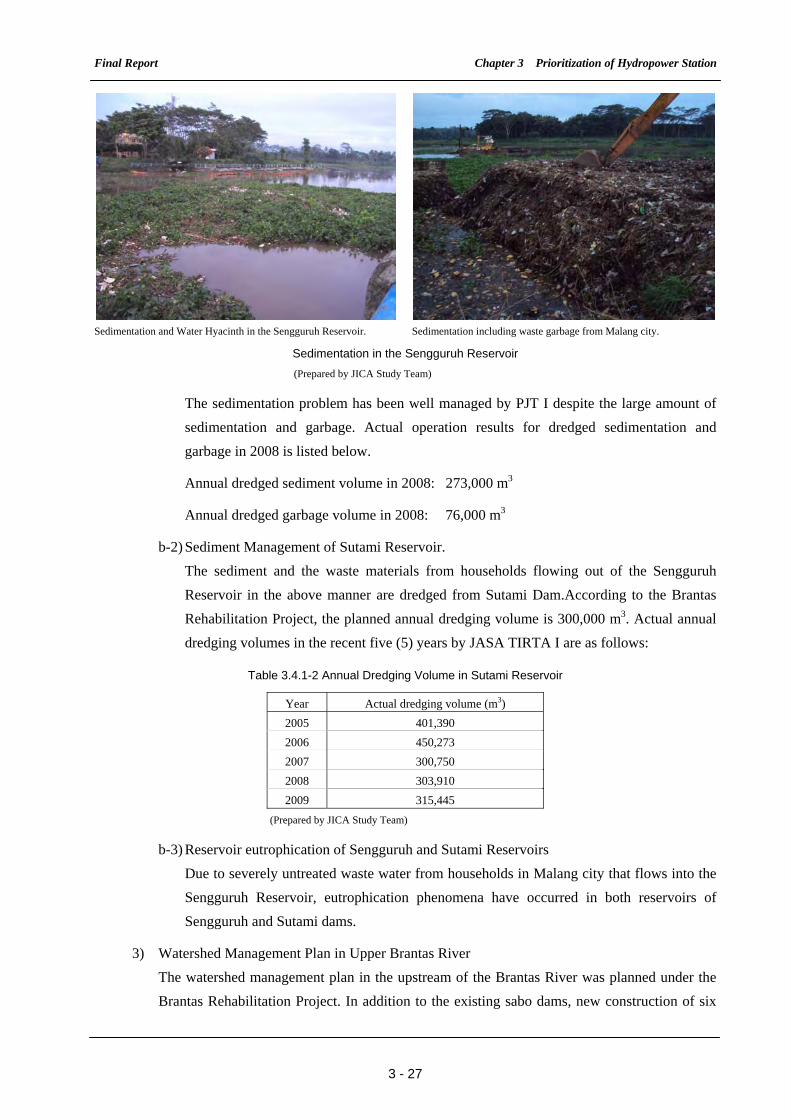
Final Report Chapter 3 Prioritization of Hydropower Station
3 - 27
Sedimentation and Water Hyacinth in the Sengguruh Reservoir. Sedimentation including waste garbage from Malang city.
Sedimentation in the Sengguruh Reservoir (Prepared by JICA Study Team)
The sedimentation problem has been well managed by PJT I despite the large amount of
sedimentation and garbage. Actual operation results for dredged sedimentation and
garbage in 2008 is listed below.
Annual dredged sediment volume in 2008: 273,000 m3
Annual dredged garbage volume in 2008: 76,000 m3
b-2) Sediment Management of Sutami Reservoir.
The sediment and the waste materials from households flowing out of the Sengguruh
Reservoir in the above manner are dredged from Sutami Dam.According to the Brantas
Rehabilitation Project, the planned annual dredging volume is 300,000 m3. Actual annual
dredging volumes in the recent five (5) years by JASA TIRTA I are as follows:
Table 3.4.1-2 Annual Dredging Volume in Sutami Reservoir
Year Actual dredging volume (m3)
2005 401,390
2006 450,273
2007 300,750
2008 303,910
2009 315,445
(Prepared by JICA Study Team)
b-3) Reservoir eutrophication of Sengguruh and Sutami Reservoirs
Due to severely untreated waste water from households in Malang city that flows into the
Sengguruh Reservoir, eutrophication phenomena have occurred in both reservoirs of
Sengguruh and Sutami dams.
3) Watershed Management Plan in Upper Brantas River
The watershed management plan in the upstream of the Brantas River was planned under the
Brantas Rehabilitation Project. In addition to the existing sabo dams, new construction of six
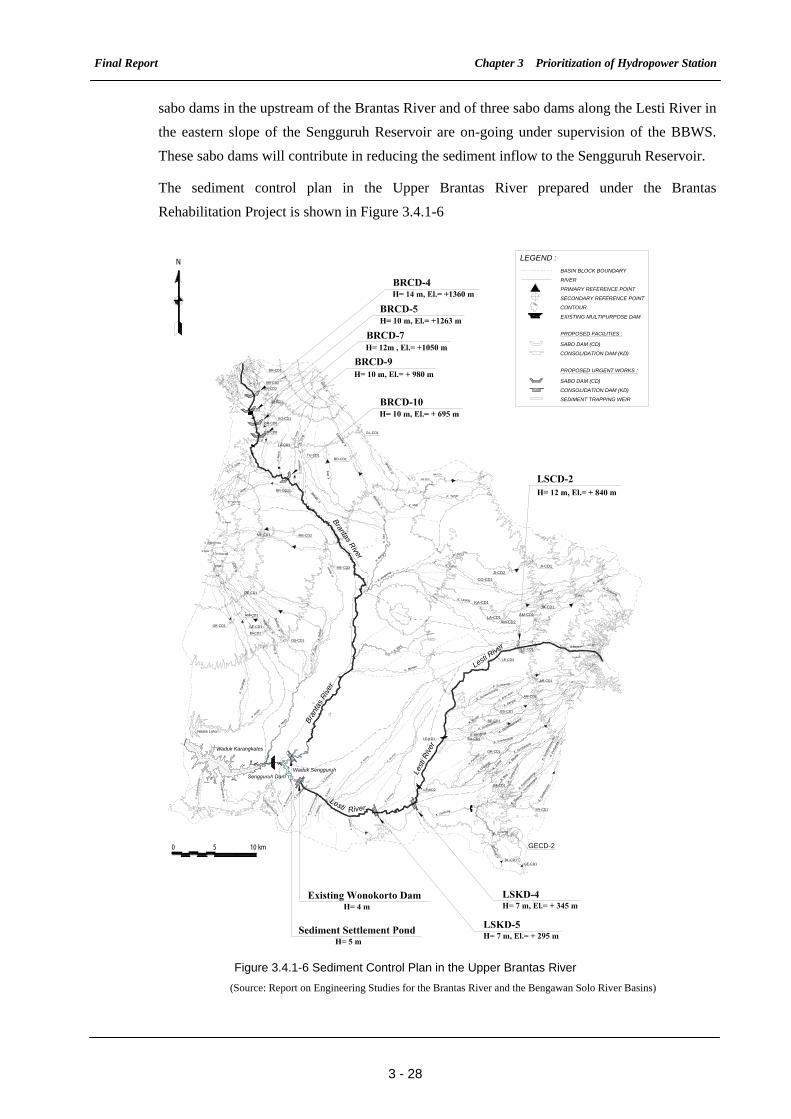
Final Report Chapter 3 Prioritization of Hydropower Station
3 - 28
sabo dams in the upstream of the Brantas River and of three sabo dams along the Lesti River in
the eastern slope of the Sengguruh Reservoir are on-going under supervision of the BBWS.
These sabo dams will contribute in reducing the sediment inflow to the Sengguruh Reservoir.
The sediment control plan in the Upper Brantas River prepared under the Brantas
Rehabilitation Project is shown in Figure 3.4.1-6
10 km50
Lesti R
iver
Brantas River
GECD-2
AM-CD1
GE-CD1
BI-CD1
GS-CD1
DE-CD1
GE-CD1
ME-CD3
ME-CD2ME-CD1
SR-CD1
SA-CD1
GE-CD1BL-CD1
BS-CD1
AR-CD2
AR-CD1
LE-KD2
BE-CD1
BA-CD1
GR-CD1
LE-CD1
LE-CD3
LE-KD1
KA-CD1
LA-CD1
CO-CD1
JI-CD2
JI-CD1
JA-CD1
AM-CD1
AM-CD2
TU-CD1BD-CD1
GL-CD1
MA-CD2
MA-CD1
JU-CD2
JU-CD1
SG-CD1
LA-CD1
BR-CD1
BR-CD2
BR-CD3
BR-CD6
BR-CD8
BR-CD11
K. K
edun
gban
teng
K. S
umbe
rkom
bang
500
500
K. Am
po
K. G
endo
go
Waduk Karangkates
Waduk Lahor
500
1000
1500
2000
500
K. D
em
K. M
etro
K. D
emK
. Bab
arK. G
elon
dog
K. G
esan
gK
. Biru
K. Met
ro
2500
2500
500
2500
2000
Waduk Sengguruh
K. K
asim
K. Gon
ggan
g
K. S
egar
an
K. M
ahar
do
K. S
umbe
rkar
angs
uko
K. Cur
ahgu
muk
mas
K. Sum
berw
ungu
K. S
umbe
rcur
ah
K. Kem
ulan
K. Jar
uman
K. Sip
ring
500
500
K. Genteng
K. Sum
bera
ngkr
it
K. Bug
K. S
umbe
ranc
ar
K. S
umbe
rture
nK
. Pur
baka
la
K. Sum
berp
eten
g
K. Padang
K. S
umbe
rem
is
K. B
aler
ejo
K. Genteng
1000
2500
2000
1500
1000
3000
3000
K. Bau
ng
K. Sumberboto
K. Juw
ok
K. Pam
otan
K. Gra
ngse
l
Lest
i Riv
er
K. Sumberputih
K. Sumberbambang
K. BambangK. SumberbuluK. B
endo
K. BangsriK. SumberbonangK. Sumberejo
K. Aran-Aran
Bra
ntas
Riv
er
K. Meri
K. Manten
1500
2000
1000
2500
2500
2500
K. Kanting
K. Jarak
K. Amprong
K. Lanjing
K. Cokro
K. Jilu
K. Amprong
3000
2500
2000
1500
1000
1000
1000
K. Tengo
K. K
rend
o
K. B
ande
ng
K. K
lam
pok
K. G
latik
K. Mati
K. T
ung
K.
Be
ji
K. Mew
ek
K. S
ari
K. Ban
go
2
1
1500K. M
ranak
K. K
asin
K. Brugan
1500
2000
2000
2500
3000
K. Junggo
K. S
umbe
rgun
ung
K. N
g uju
n g
K. L
anan
gK.
Jur
angs
usuh
N
SEDIMENT TRAPPING WEIR
LEGEND :
CONTOUR
SECONDARY REFERENCE POINT
PRIMARY REFERENCE POINT
RIVER
BASIN BLOCK BOUNDARY
PROPOSED FACILITIES :
EXISTING MULTIPURPOSE DAM
SABO DAM (CD)
CONSOLIDATION DAM (KD)
PROPOSED URGENT WORKS :
SABO DAM (CD)
CONSOLIDATION DAM (KD)
Figure 3.4.1-6 Sediment Control Plan in the Upper Brantas River
(Source: Report on Engineering Studies for the Brantas River and the Bengawan Solo River Basins)
Final Report Chapter 3 Prioritization of Hydropower Station
3 - 29
4) Conclusion for Current Sediment Management of Sutami including Upper Brantas River
In conclusion, after the completion of the above ‘Brantas River Rehabilitation Project’ under
Japanese ODA, the sedimentation problem in the Sutami Reservoir will be settled for a few
decades. Further in Malang city and the surrounding area, a number of the treatment facilities
for the waste materials from households shall be increased to mitigate the troublesome
dredging works and cleaning of the trash rack which form part of the intake facilities of the
Sengguruh Dam and Sutami Dam. Moreover, modernization or new construction of sewage
treatment plants is recommended to improve the reservoir water quality management.
3.4.2 Current Conditions of Wlingi Hydropower Station
(1) Power Generation
Wlingi Hydropower Station is a run-of-river type and located about 30 km downstream of the
aforesaid Sutami Dam along the Brantas River.
Principal features of said hydropower station are shown in Appendix B-2.
Wlingi Hydropower Station has two units of 27 MW generating equipment with a total installed
capacity of 54 MW. Unit 1 and Unit 2 of the station commenced operation in 1978 and 1980,
respectively. The power station is interconnected with Sutami though 150 kV transmission line.
The generating equipment are handled and maintained by PJB.
Wlingi has the same role as Sutami, namely, to function during peak load operation to serve the
regional area as a cascade hydropower station in the Brantas River. However, its continuous
operation as a base load is also taken into consideration as long as water is available.
The energy generation in the year 2009 was 144 GWh/year, which is 86% of the designed value of
167 GWh.
(2) Hydromechanical Equipment (Gates and Penstocks)
Results of the site investigation of the hydro-mechanical equipment are shown in Appendix C,
together with the technical specifications. Other than said equipment, the dam is equipped with
spillway gate and irrigation intake gates which have been handled by PJT I, and not by PJB.
Therefore investigation and studies about the equipment undertaken by PJT I are excluded from
this report.
The equipment has been maintained well since the completion of the project in 1978. Routine
inspection and maintenance works have been conducted by PJB staff for the power station. It was
found that there had been no serious troubles about operation through interviews with personnel in
charge at the power station.
During investigations at the site, water hyacinth was observed on the surface of the reservoir.
These grasses and rubbish trapped on the trash racks have been removed using two sets of trash
Final Report Chapter 3 Prioritization of Hydropower Station
3 - 30
removing system, whenever required. Any reduction of the power generation due to choking of
trash racks with water hyacinth and materials was not shown in the data log book.
(3) Generating Equipment (Water Turbines, Generators and Control System)
Results of the site investigation of the generating equipment are shown in Appendix C-2 together
with the technical specifications.
Unit 1 has been operating for over 31 years since its completion in 1978. while unit 2 remained
operational for over 29 years since its completion in 1980.
The generating equipment has been maintained well by power station staff by implementing
planned annual inspection, general inspection and major overhaul. Recent major overhaul was
carried out in 2006 and 2008 for unit 1 and unit 2, respectively.
It was observed during the site investigation that there were no serious problems that affect the
continuous operation. However, the following observations were noted.
1) AVR: Output of unit 1 is restricted up to 70% of the rated value due to failure of AVR. The
existing AVR is an old model with analog indicators which has been used since the beginning
of the operation. PJB plans to replace it with a new one in 2010 using its own fund.
2) Governor: Governor is of mechanical type with analog indicators. This type of governor is
obsolete considering that it was designed in the 1970’s and thus its spare parts are no longer
available in the market.
3) Generator: Stator and rotor windings were inspected only by means of measuring the
insulation resistance during major overhauls. According to the data for unit 2 during the major
overhaul conducted in 2008, the insulation resistances were plotted in the range between 235
M-ohm and 1.03 G-ohm for stator windings, and between 253 M-Ohm and 1.74 G-ohm for
rotor windings. The measured values were randomly plotted in a wide range from a small
one to large one. It is considerable to have tendency of potential insulation problem inside
stator and rotor windings. Thus, the insulation resistance values indicate a sign of deteriorating
electrical insulation; however, it is very difficult to evaluate degree of deterioration with such
limited data.
4) Supervisory and Control System: The supervisory and control system was of analog type
designed in the 1970’s, and replacement of any of said components has not taken place as of
date. Operating apparatus on the operating desk such as the handle or knob was worn out.
Moreover, all protection relays for the system protection including major components such as
water turbine, generator and main transformer are of mechanical types with spare parts which
are no longer available in the market. Since it is not equipped with automatic data logger
used for recording operating status and events, the operating staff takes records manually.
Furthermore, data communication to Load Dispatch Center in Surabaya is very limited due to
Final Report Chapter 3 Prioritization of Hydropower Station
3 - 31
limited range of communication means at the PLC, though the transmission lines.
(4) Transmission Lines and Substations
PJB owns and manages the main transformers of 30 MVA and 150 kV associated disconnecting
switches for protection of main transformer, installed in the switchyard adjacent to the power
station. Meanwhile, other outdoor switchgear and 150 kV transmission line to Sutami constructed
under the financial assistance of OECF in 1978 are owned and managed by P3B.
Air blast type circuit breakers (ABB) were replaced with SF6 gas circuit breaker (GCB) in 1990
due to the increase in system capacity. However, disconnecting switches operated by air have not
yet been replaced since the disconnecting switches are used for maintenance of GCB without
breaking current.
(5) Dams and the Appurtenant Civil Work Facilities
1) Organization for Operation & Maintenance
Wlingi Dam was completed in 1976 while the Wlingi Power Station became operational in
1979.
In the same manner as other hydroelectric power stations existing in the Brantas River basin,
the dam including the watershed and its downstream of the dam is operated and maintained
well by PJT I while the power station is also properly maintained by PJB.
2) Current Status of the Wlingi Dam
Thirty three years have passed since the completion of the dam and the power station.
According to PJT I, behaviors of measuring apparatus which have been installed to monitor the
movement of dams and the appurtenant structures are generally normal and the ordinary and
visual inspection results also reveal no abnormal phenomena in the dams and the appurtenant
structures. The dam safety evaluation based on the measuring apparatus records are made
twice per year and the results are then fully reported to the Dam Safety Committee in the
Ministry of the Public Works.
Mt. Kelud erupted on a large scale on February of 1990. Consequently, Wlingi Reservoir was
filled fully with the erupted volcanic materials. In order to immediately restore the reservoir
function, dredging works in the reservoir and various sabo works have been undertaken under
the financial assistance of OECF between 1990 and 1995. Afterwards, in order to prevent the
intrusion of the erupted volcanic deposits from the southern slope of Mt. Kelud into the
reservoir, Mt. Kelud sabo project was initiated. However the progress of the project
implementation was only 50 % by 1996.
3) Current Status of Power Generation Facilities
According to the PJB, no periodical inspection has been carried out for the civil structures of
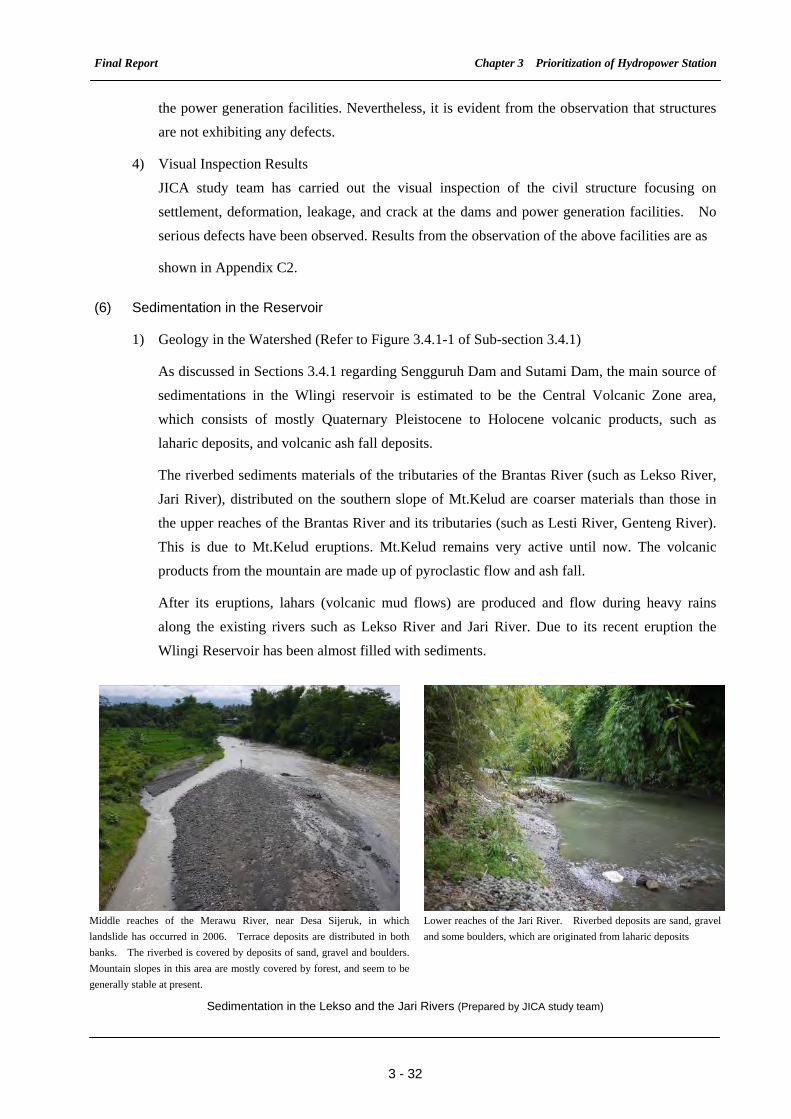
Final Report Chapter 3 Prioritization of Hydropower Station
3 - 32
the power generation facilities. Nevertheless, it is evident from the observation that structures
are not exhibiting any defects.
4) Visual Inspection Results
JICA study team has carried out the visual inspection of the civil structure focusing on
settlement, deformation, leakage, and crack at the dams and power generation facilities. No
serious defects have been observed. Results from the observation of the above facilities are as
shown in Appendix C2.
(6) Sedimentation in the Reservoir
1) Geology in the Watershed (Refer to Figure 3.4.1-1 of Sub-section 3.4.1)
As discussed in Sections 3.4.1 regarding Sengguruh Dam and Sutami Dam, the main source of
sedimentations in the Wlingi reservoir is estimated to be the Central Volcanic Zone area,
which consists of mostly Quaternary Pleistocene to Holocene volcanic products, such as
laharic deposits, and volcanic ash fall deposits.
The riverbed sediments materials of the tributaries of the Brantas River (such as Lekso River,
Jari River), distributed on the southern slope of Mt.Kelud are coarser materials than those in
the upper reaches of the Brantas River and its tributaries (such as Lesti River, Genteng River).
This is due to Mt.Kelud eruptions. Mt.Kelud remains very active until now. The volcanic
products from the mountain are made up of pyroclastic flow and ash fall.
After its eruptions, lahars (volcanic mud flows) are produced and flow during heavy rains
along the existing rivers such as Lekso River and Jari River. Due to its recent eruption the
Wlingi Reservoir has been almost filled with sediments.
Middle reaches of the Merawu River, near Desa Sijeruk, in which
landslide has occurred in 2006. Terrace deposits are distributed in both
banks. The riverbed is covered by deposits of sand, gravel and boulders.
Mountain slopes in this area are mostly covered by forest, and seem to be
generally stable at present.
Lower reaches of the Jari River. Riverbed deposits are sand, gravel
and some boulders, which are originated from laharic deposits
Sedimentation in the Lekso and the Jari Rivers (Prepared by JICA study team)
Final Report Chapter 3 Prioritization of Hydropower Station
3 - 33
Consequently, the most critical sediments that discharge to the Wlingi Reservoir deemed to be
materials from the tributaries of the Brantas River, distributed on the southern slope of
Mt.Kelud.
The southern mountainous area of the Wlingi Reservoir consists of tertiary volcanic /
sedimentary rock formations of the southern mountains zone. Due to very short tributaries of
the Brantas River distributed in this area and the geological condition mentioned above, the
sediment discharge ratio in such area is estimated to be very low in general.
The sediments discharged from the upstream of the Brantas River are also estimated to be very
minimal due to the existence of the Sutami Dam and Sengguruh Dam in the upstream of the
Wlingi Dam.
A critical landslide related to sedimentations to the reservoir is not reported and not found in
this study in the catchment areas and in the reservoir area during the field reconnaissance study.
However, due to the hilly/mountainous topography, small scale surface slope failures are
commonly found in the catchment areas consisting of volcanic products, and even in the
tertiary rock area. Such small scale slope failures will also produce sediments in the reservoir.
2) Current Situation of Sediment Managemen in the Wlingi Reservoir
Under the above circumstances, in order to maintain the reservoir function of the Wlingi Dam,
BBWS is actively conducting the following countermeasures in the reservoir and in the
watershed under the financial assistance of Japanese ODA and through its own fund
a) Sediment Control Plan around Southern Slope of Mt. Kelud.
As shown in Figure 3.4.2-1 several sabo projects in the western and southern slopes of Mt.
Kelud are presently ongoing.
In particular in order to mitigate the intrusion of sedimentation to the Wlingi Reservoir,
construction of bypass channel is necessary to flush out sediments from the branching
rivers such as the Putih River, Jari River, Semute River and Lekso River discharging into
the downstream of the Lodoyo weir(See Figure 3.4.2-2).
This bypass channel is not completed as of date. The lowering of the riverbed in the
middle and the lower reaches of the Brantas River causes serious impacts, thus the
construction of this bypass channel will be essential to mitigate the situation.
Final Report Chapter 3 Prioritization of Hydropower Station
3 - 34
Existing Sabo Facilities (OECF Loan)
Existing Sabo Facilities (National Budget)
Planning Sabo Facilities
Check Dam
Consolidation Dam
Consolidation Dam with Local Bridge
Consolidation Dam with Irrigation Intake
Sand Pocket
River Improvement / Nomalizaion
Konto River Sand Pocket
Ground Sills Proposed by SAPS Team
Serinjing River Sand Pocket
Ngobo River Sand Pocket
Badak River Sand Pocket
Putih River Sand Pocket
Semut River Sand Pocket
6
5
4
3
2
1N
100
200
300
400
500
600
500
400
300
200100
TULUNGAGUNG
KEDIRI
.
BA.CD.6
SE.CD.5
6
5
4
2
1
3
Legend
Bra
ntas
To Surabaya
Riv
er
To Madiun
Batan River
Serinjing River
Sukorejo River
Dermo River
Badak River
Put
ih R
iver
Sem
ut R
iver
Leks
o R
iver
Jari
Riv
er
Bypass
Channel
Wlingi DamLodoyo Dam
Termas Baru River
Termas Lama RiverBrantas River
Mt. Kelud
Figure 3.4.2-1 Sediment Control Plan in Mt. Kelud Area
(Source: Report on Engineering Studies for the Brantas River and the Bengawan Solo River Basins)
Figure 3.4.2-2 Bypass Channel Detail in Mt. Kelud Area
(Source: Report on Engineering Studies for the Brantas River and the Bengawan Solo River Basins)
Final Report Chapter 3 Prioritization of Hydropower Station
3 - 35
b) Dredging Work and Sediment Flushing Operation for Wlingi Reservoir
As shown in the photos below, large scale continuous dredging in the Wlingi Reservoir
and sand flushing through the spillway gates, are being carried out, several times per
annum. Sand flushing operation to flush out the sedimentation in the Wlingi Reservoir and
Lodoyo Weir reservoir into the downstream of the Lodoyo Weir in the Brantas River, is
executed in the following manners:
Wlingi reservoir, Reservoir dredging works Wlingi dam, Existing spoil bank
Dredging Works for Wlingi Reservoir (Prepared by JICA study team)
- Making Wlingi and Lodoyo reservoir perfectly empty, and
- Discharging the reservoir water from the Sutami dam, upstream of Wlingi dam and
Lodoyo weir.
The annual dredging volume and the annual sand flushing volume in the Wlingi reservoir
proposed by the aforesaid ‘Brantas Rehabilitation Project’ are as follows:
Planned annual dredging volume: 200,000 m3
Planned annual sand flushing volume: 400,000 m3
On the other hand, actual annual dredging volume and sand flushing volume in the last
five (5) years are shown in Table 3.4.2-1.
Table 3.4.2-1 Annual Dredging and Sand Flushing Volume (Unit: m3)
Actual dredging volume Actual sand flushing volume
2005 115,502 935,498
2006 80,258 356,555
2007 150,630 459,179
2008 150,100 395,480
2009 175,626 145,514
(Prepared by JICA study team)
Consequently, the effective reservoir volume of Wlingi Dam was kept to more or less 2.0
MCM on Dec. of 2009, which is 38% of the planned effective reservoir volume of 5.2
Final Report Chapter 3 Prioritization of Hydropower Station
3 - 36
MCM.
c) Lots of waste materials from households are mixed with the sediment likes in the reservoir
such as Sengguruh Dam located upstream of Sutami dam. In order to mitigate the
troublesome dredging works and cleaning of the trash rack which form part of the intake
facilities, campaign for the river environmental conservation to the local residents in the
river basin are being conducted. It will however take time to realize the effects of said
campaign.
3) In conclusion, sedimentation problems in the Wlingi Dam will be resolved upon completion of
construction of the abovementioned bypass channel and by actively campaigning for river
environmental conservation.
3.4.3 Current Conditions of Soedirman Hydropower Station
(1) Power Generation
Soedirman Hydropower Station is located on the Serayu River flowing near Banjarnegara City in
the Central Java province in Central Java as shown in Figure 3.4.3-1.
Figure 3.4.3-1 Location Map of Soedirman Hydropower Station (Prepared by JICA study team)
Principal features of Soedirman Hydropower Station are shown in Appendix B-3.
Soedirman Hydropower Station was constructed as a reservoir type hydropower in the Serayu
BANJARNEGARA
SEMARANG
Soedirman
Hydropower
Station
Final Report Chapter 3 Prioritization of Hydropower Station
3 - 37
River for the purpose of irrigation and power generation. It commenced operation in 1988 and all
the equipment including the associated civil structures are managed and maintained by Indonesia
Power (IP).
The power station has three units of 60.3 MW generating equipment with a total installed capacity
180.9 MW. The generated power is transmitted to Wonosobo and Rawalo through 150 kV power
network. The total installed capacity of Central Java (Region 3) is 4,510 MW which is obtained
from 4,166 MW thermal (steam and gas), 309 MW hydro and 35 MW geothermal. The capacity
of Soedirman Hydropower Station shares 4.0 % of the total installed capacity, and 58% of the
hydropower in the Central Java.
The operating pattern of Soedirman is quite different between rainy and dry seasons due to the
availability of reservoir water and the balance of irrigation water. As a typical daily operating
pattern in the rainy season, 120 MW was continuously generated through the day plus 180 MW
peak load operation from 17:00 to 22:00 hrs, recorded in Jan, 2009. On the other hand, only 5 hours
peak load operation was recorded in the dry season of Nov. 2009, since supplying irrigation water
to the downstream is given priority over power generation. The average energy generation in the
past 5 years was 450 GWh/year, which is 77.6% of the designed value of 580 GWh.
(2) Hydromechanical Equipment (Gates and Penstocks)
Results of the site investigation of the generating equipment are shown in Appendix C-3 together
with the technical specifications.
The equipment has been maintained well since the completion of project in 1988. Routine
inspection and maintenance works have been conducted by IP staff at the power station. It was
found that there had been no serious troubles about operation through interviews with personnel in
charge at the power station.
During the visual checking of equipment at the site, a small leakage was found from the rubber seal
on the gate leaf of spillway gate no. 3. The rubber seals have not been replaced since 1988 but are
scheduled for replacement in the next maintenance period.
It was reported that minor leaks of hydraulic fluid were observed at the upper flange of the guard
gate of lane no. 1 of drawdown culvert gate during the closing operation of the gate. The gasket
at the upper flange is also scheduled for replacement in the next maintenance period.
Small seepage water was observed at the upstream end of the guard gate lane no. 2. The O&M
staff reported that this seepage between concrete and bonnet of the gate was found recently. It
was advised that grouting of the gap is necessary to stop water seepage to avoid the gate from
heavily corroding.
It is reported that all the hydraulic fluid for all the hydro-mechanical equipment in this power
station have not been completely replaced since the completion of the project. Thus, the concerned
Final Report Chapter 3 Prioritization of Hydropower Station
3 - 38
staff were advised to check the quality of the fluid and to replace them periodically, so as to avoid
pressure oil unit and piping from clogging due to scales.
(3) Generating Equipment (Water Turbines, Generators and Control System)
Results of the site investigation of the generating equipment are shown in Appendix C-3 together
with the technical specifications.
The three units have been operating for over 21 years since the project completion in 1988.
The generating equipment has been maintained well by power station staffs by implementing
planned annual inspection, general inspection and major overhaul. It was observed during the site
investigation that there have been no serious problems that affect the continuous operation.
However, the following observations were noted:
1) Inlet Valve: Small leakage was found on the rubber seal of the inlet valve No. 3. The rubber
seals have not been replaced since 1988 but are scheduled for replacement with new ones in
August 2010.
2) Governor and AVR: Governor and AVR, which have important functions such as speed and
voltage control in response to fluctuation of the power system, were rehabilitated in 2006 by
means of replacement to digital type electric apparatus since the original parts were not
available in the market.
3) Control and Protection System: The control and protection system have been replaced in 2006
with modern system with computers. Hence, all data for operation and status can automatically
be monitored and controlled in display of the computers.
(4) Transmission Lines and Substations
Main transformers of 70 MVA and 150 kV associated outdoor switchgears including circuit
breakers and disconnecting switches and 150 kV transmission lines which were constructed under
the WB funds in 1988 are controlled, operated and maintained by P3B of subsidiary company of
PLN. All outdoor switchgear is operating without any trouble.
(5) Dams and the Appurtenant Civil Work Facilities
1) Organization for Operation &Maintenance
Some dams used for the operation of the hydroelectric power station owned by IP, are the
property of the Ministry of the Public Works. However, for Soedirman Hydropower Station,
all facilities including dam is owned and managed by IP.
2) Current Status of the Mrica Dam
Although IP itself has no regulation on the management of the dam, it carries out monitoring
and periodical maintenance in accordance with the regulation of the Ministry of Public Works.
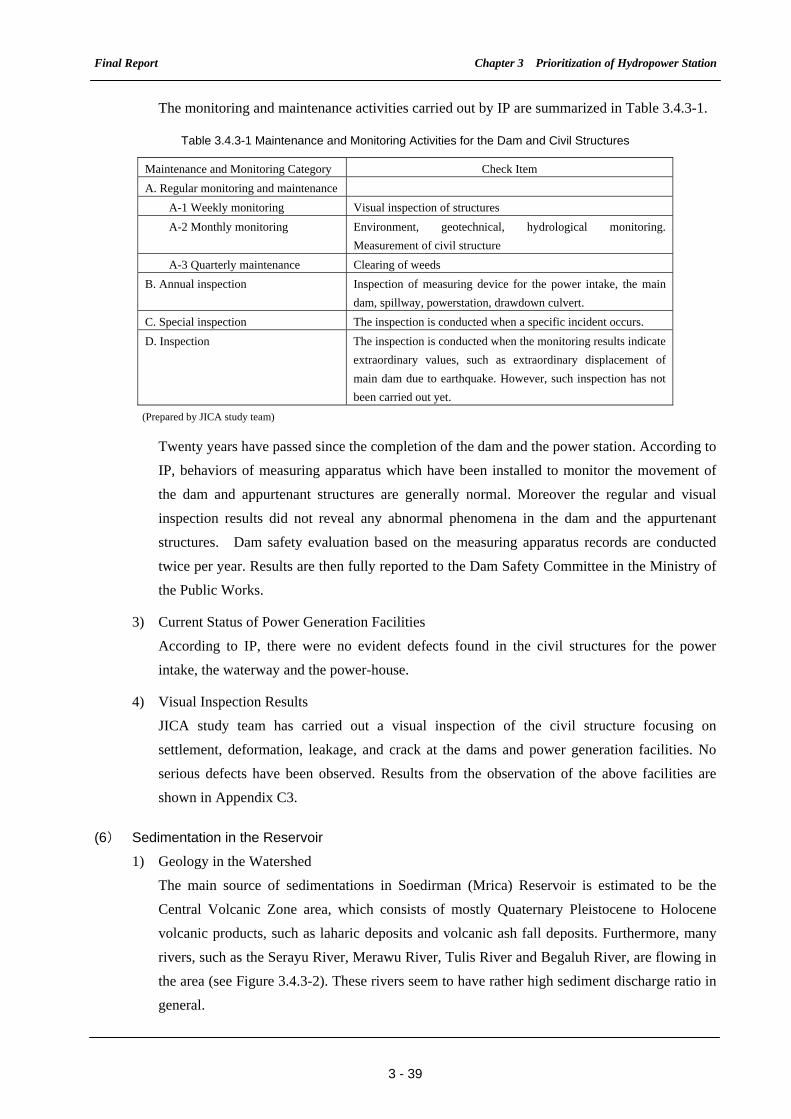
Final Report Chapter 3 Prioritization of Hydropower Station
3 - 39
The monitoring and maintenance activities carried out by IP are summarized in Table 3.4.3-1.
Table 3.4.3-1 Maintenance and Monitoring Activities for the Dam and Civil Structures
Maintenance and Monitoring Category Check Item
A. Regular monitoring and maintenance
A-1 Weekly monitoring Visual inspection of structures
A-2 Monthly monitoring Environment, geotechnical, hydrological monitoring.
Measurement of civil structure
A-3 Quarterly maintenance Clearing of weeds
B. Annual inspection Inspection of measuring device for the power intake, the main
dam, spillway, powerstation, drawdown culvert.
C. Special inspection The inspection is conducted when a specific incident occurs.
D. Inspection The inspection is conducted when the monitoring results indicate
extraordinary values, such as extraordinary displacement of
main dam due to earthquake. However, such inspection has not
been carried out yet.
(Prepared by JICA study team)
Twenty years have passed since the completion of the dam and the power station. According to
IP, behaviors of measuring apparatus which have been installed to monitor the movement of
the dam and appurtenant structures are generally normal. Moreover the regular and visual
inspection results did not reveal any abnormal phenomena in the dam and the appurtenant
structures. Dam safety evaluation based on the measuring apparatus records are conducted
twice per year. Results are then fully reported to the Dam Safety Committee in the Ministry of
the Public Works.
3) Current Status of Power Generation Facilities
According to IP, there were no evident defects found in the civil structures for the power
intake, the waterway and the power-house.
4) Visual Inspection Results
JICA study team has carried out a visual inspection of the civil structure focusing on
settlement, deformation, leakage, and crack at the dams and power generation facilities. No
serious defects have been observed. Results from the observation of the above facilities are
shown in Appendix C3.
(6) Sedimentation in the Reservoir
1) Geology in the Watershed
The main source of sedimentations in Soedirman (Mrica) Reservoir is estimated to be the
Central Volcanic Zone area, which consists of mostly Quaternary Pleistocene to Holocene
volcanic products, such as laharic deposits and volcanic ash fall deposits. Furthermore, many
rivers, such as the Serayu River, Merawu River, Tulis River and Begaluh River, are flowing in
the area (see Figure 3.4.3-2). These rivers seem to have rather high sediment discharge ratio in
general.
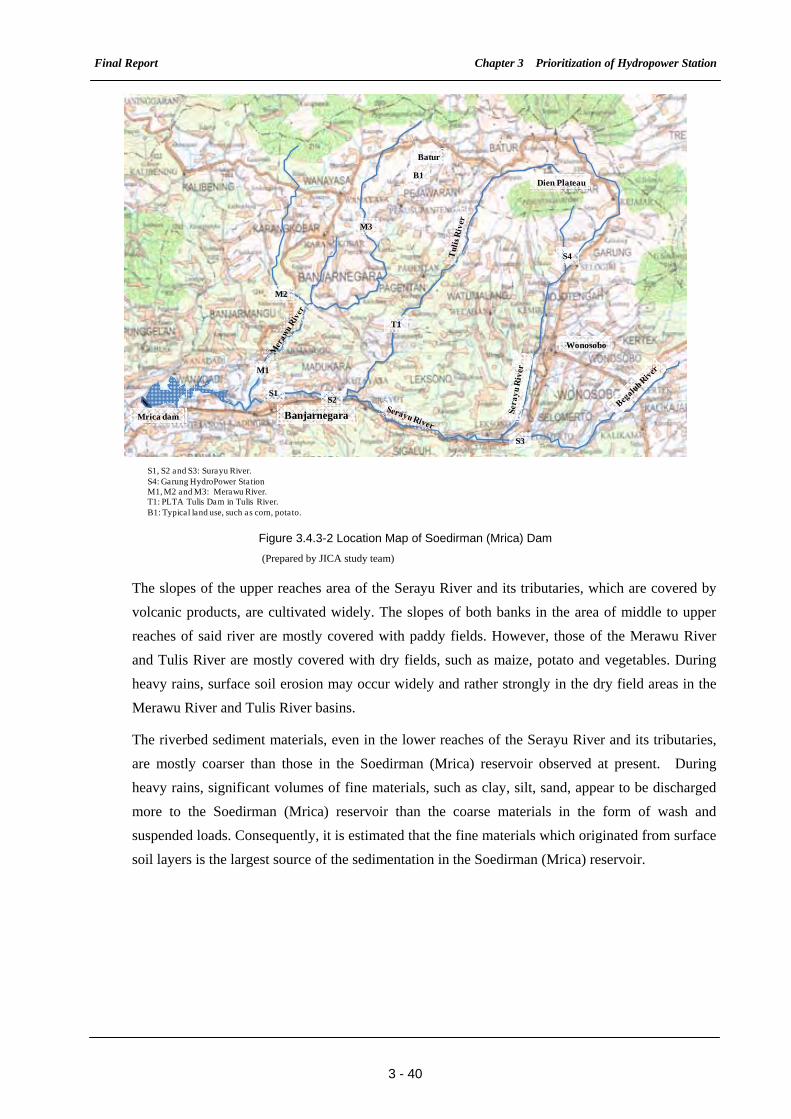
Final Report Chapter 3 Prioritization of Hydropower Station
3 - 40
Mrica dam
Batur
M1
M2
M3
S1
Banjarnegara
T1
S2
S3
S4
B1
S1, S2 and S3: Surayu River.S4: Garung HydroPower StationM1, M2 and M3: Merawu River.T1: PLTA Tulis Dam in Tulis River.B1: Typical land use, such as corn, potato.
Dien Plateau
Wonosobo
Figure 3.4.3-2 Location Map of Soedirman (Mrica) Dam (Prepared by JICA study team)
The slopes of the upper reaches area of the Serayu River and its tributaries, which are covered by
volcanic products, are cultivated widely. The slopes of both banks in the area of middle to upper
reaches of said river are mostly covered with paddy fields. However, those of the Merawu River
and Tulis River are mostly covered with dry fields, such as maize, potato and vegetables. During
heavy rains, surface soil erosion may occur widely and rather strongly in the dry field areas in the
Merawu River and Tulis River basins.
The riverbed sediment materials, even in the lower reaches of the Serayu River and its tributaries,
are mostly coarser than those in the Soedirman (Mrica) reservoir observed at present. During
heavy rains, significant volumes of fine materials, such as clay, silt, sand, appear to be discharged
more to the Soedirman (Mrica) reservoir than the coarse materials in the form of wash and
suspended loads. Consequently, it is estimated that the fine materials which originated from surface
soil layers is the largest source of the sedimentation in the Soedirman (Mrica) reservoir.
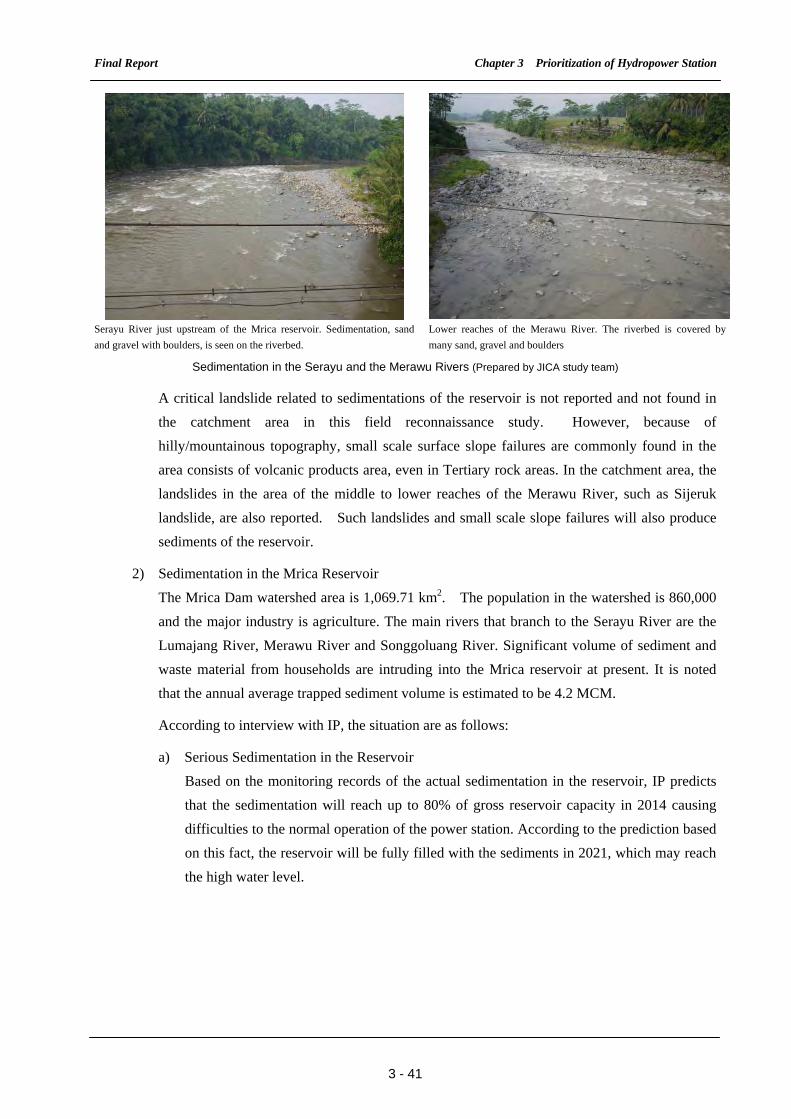
Final Report Chapter 3 Prioritization of Hydropower Station
3 - 41
Serayu River just upstream of the Mrica reservoir. Sedimentation, sand
and gravel with boulders, is seen on the riverbed.
Lower reaches of the Merawu River. The riverbed is covered by
many sand, gravel and boulders
Sedimentation in the Serayu and the Merawu Rivers (Prepared by JICA study team)
A critical landslide related to sedimentations of the reservoir is not reported and not found in
the catchment area in this field reconnaissance study. However, because of
hilly/mountainous topography, small scale surface slope failures are commonly found in the
area consists of volcanic products area, even in Tertiary rock areas. In the catchment area, the
landslides in the area of the middle to lower reaches of the Merawu River, such as Sijeruk
landslide, are also reported. Such landslides and small scale slope failures will also produce
sediments of the reservoir.
2) Sedimentation in the Mrica Reservoir
The Mrica Dam watershed area is 1,069.71 km2. The population in the watershed is 860,000
and the major industry is agriculture. The main rivers that branch to the Serayu River are the
Lumajang River, Merawu River and Songgoluang River. Significant volume of sediment and
waste material from households are intruding into the Mrica reservoir at present. It is noted
that the annual average trapped sediment volume is estimated to be 4.2 MCM.
According to interview with IP, the situation are as follows:
a) Serious Sedimentation in the Reservoir
Based on the monitoring records of the actual sedimentation in the reservoir, IP predicts
that the sedimentation will reach up to 80% of gross reservoir capacity in 2014 causing
difficulties to the normal operation of the power station. According to the prediction based
on this fact, the reservoir will be fully filled with the sediments in 2021, which may reach
the high water level.
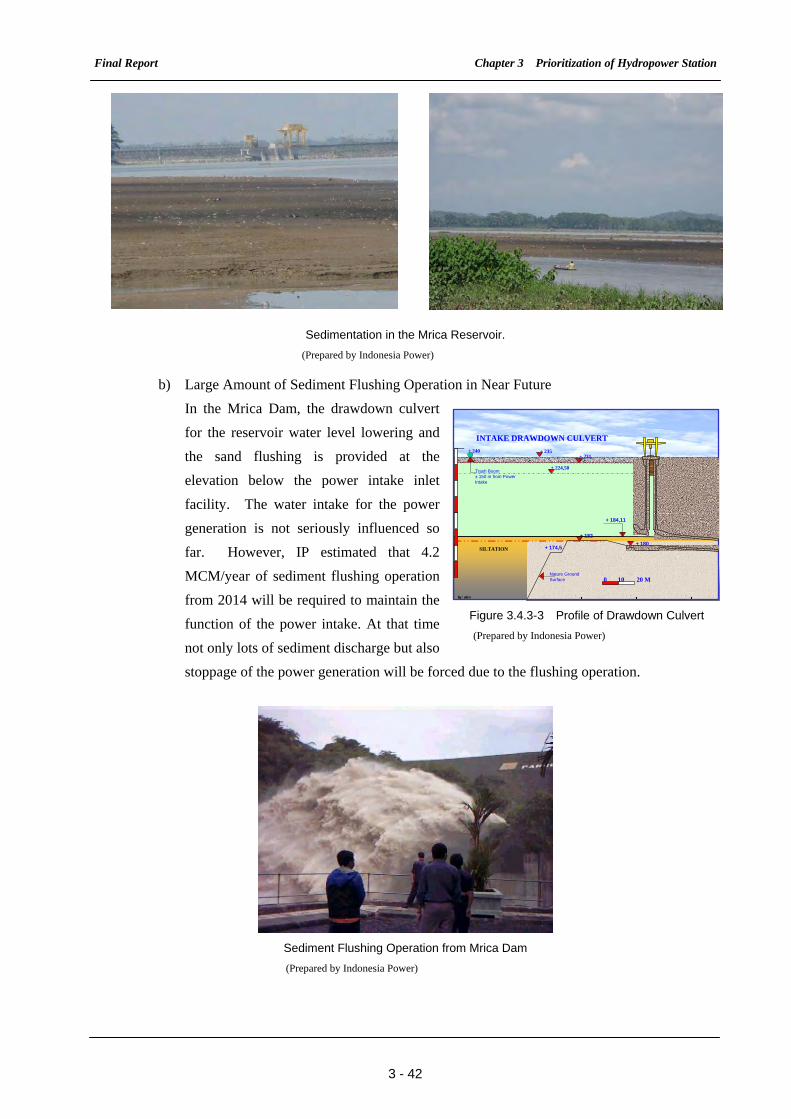
Final Report Chapter 3 Prioritization of Hydropower Station
3 - 42
Sedimentation in the Mrica Reservoir. (Prepared by Indonesia Power)
b) Large Amount of Sediment Flushing Operation in Near Future
In the Mrica Dam, the drawdown culvert
for the reservoir water level lowering and
the sand flushing is provided at the
elevation below the power intake inlet
facility. The water intake for the power
generation is not seriously influenced so
far. However, IP estimated that 4.2
MCM/year of sediment flushing operation
from 2014 will be required to maintain the
function of the power intake. At that time
not only lots of sediment discharge but also
stoppage of the power generation will be forced due to the flushing operation.
Sediment Flushing Operation from Mrica Dam (Prepared by Indonesia Power)
Figure 3.4.3-3 Profile of Drawdown Culvert (Prepared by Indonesia Power)
+ 235
+ 224,50
+ 231
INTAKE DRAWDOWN CULVERT
+ 174,5
0 10 20 M
by : wiro
+ 240
+ 182
SILTATION+ 180
Trash Boom± 150 m from PowerIntake
Nature GroundSurface
+ 184,11
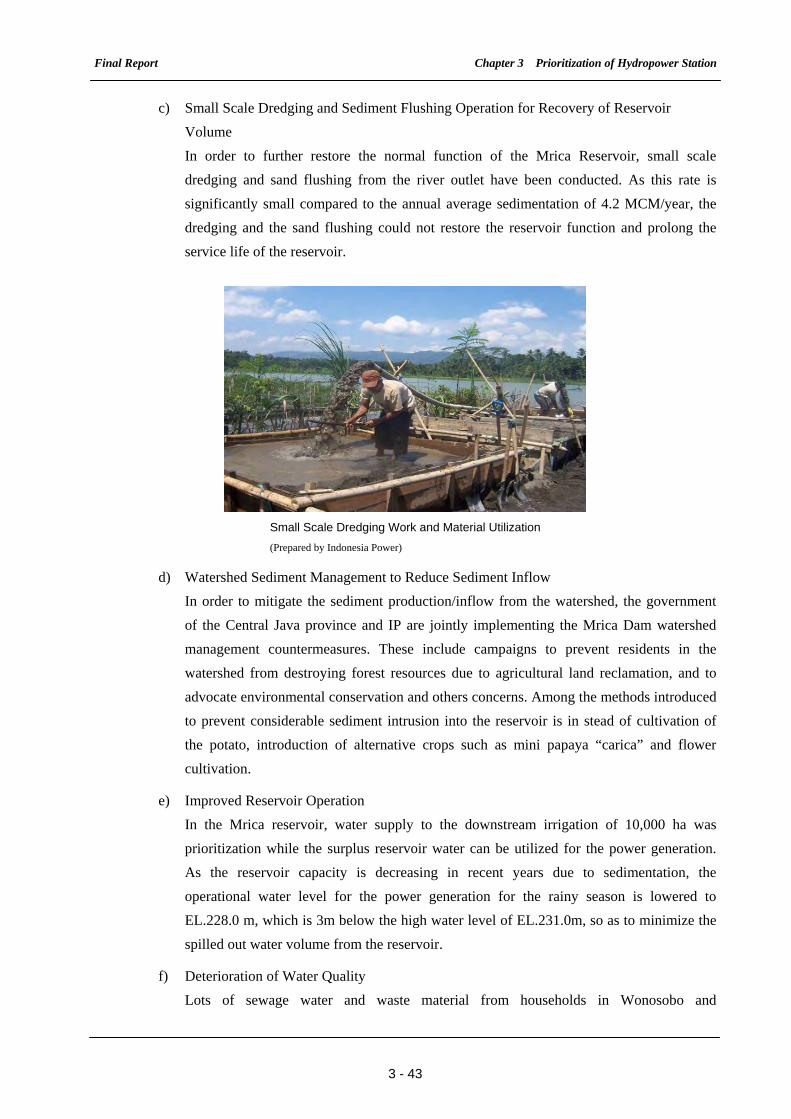
Final Report Chapter 3 Prioritization of Hydropower Station
3 - 43
c) Small Scale Dredging and Sediment Flushing Operation for Recovery of Reservoir
Volume
In order to further restore the normal function of the Mrica Reservoir, small scale
dredging and sand flushing from the river outlet have been conducted. As this rate is
significantly small compared to the annual average sedimentation of 4.2 MCM/year, the
dredging and the sand flushing could not restore the reservoir function and prolong the
service life of the reservoir.
Small Scale Dredging Work and Material Utilization (Prepared by Indonesia Power)
d) Watershed Sediment Management to Reduce Sediment Inflow
In order to mitigate the sediment production/inflow from the watershed, the government
of the Central Java province and IP are jointly implementing the Mrica Dam watershed
management countermeasures. These include campaigns to prevent residents in the
watershed from destroying forest resources due to agricultural land reclamation, and to
advocate environmental conservation and others concerns. Among the methods introduced
to prevent considerable sediment intrusion into the reservoir is in stead of cultivation of
the potato, introduction of alternative crops such as mini papaya “carica” and flower
cultivation.
e) Improved Reservoir Operation
In the Mrica reservoir, water supply to the downstream irrigation of 10,000 ha was
prioritization while the surplus reservoir water can be utilized for the power generation.
As the reservoir capacity is decreasing in recent years due to sedimentation, the
operational water level for the power generation for the rainy season is lowered to
EL.228.0 m, which is 3m below the high water level of EL.231.0m, so as to minimize the
spilled out water volume from the reservoir.
f) Deterioration of Water Quality
Lots of sewage water and waste material from households in Wonosobo and
Final Report Chapter 3 Prioritization of Hydropower Station
3 - 44
Banjaranegara are dumped into the Mrica reservoir. Therefore the water quality has
deteriorated with waste materials drifting in the reservoir and with thick mats of water
hyacinths being formed at present. However, the serious affection to the reservoir
operation and the power generation have not occurred so far.
g) Consideration of Downstream River Basin
There exists the Bendung intake weir is intended to supply the irrigation water to 20,000
ha, located at Kebasan about 100 km downstream of the Mrica Dam. On the way to the
intake weir, small fishery business and small scale of sand mining activities are observed.
There are presently no report on damages in the downstream of the Mrica dam and
complains from the river user and the residents along the river due to the abovementioned
sediment flushing operation in the Mrica Dam.
3) Recommendation for the Sediment Problem
Regardless of the above practices by the local government and IP, there were no essential
improvements achieved due to the small scale countermeasures compared to the huge amount
of the sediment inflow.
Under the above circumstances, a mass sedimentation in the Mrica reservoir is considered
serious causing social problems to the region. IP as well as PLN intends to mitigate the
severe sedimentation problem and thus. IP requests the Government of Indonesia for a
financial assistance to execute an effective sediment countermeasure. However, the financial
assistance has been pending and no practical measures have been executed at present.
Therefore, it is strongly recommended that the sediment mitigation measure for the Mrica
reservoir as well as for the Serayu River basin should be initiated as a practical solution with
definite financial support.
3.4.4 Current Conditions of Saguling Hydropower Station
(1) Power Generation
Saguling Hydropower Station is located in the middle reach of the Citarum River flowing near
Bandung City in the West Java province. Meanwhile, Cirata and Jatiluhur dams are located at the
middle and lower reaches of the Citarum River as shown in Figure 3.4.4-1.
Principal features of Saguling Hydropower Station are shown in Appendix B-4.
Saguling Hydropower Station is about 30 km away from Bandung. Operation of the power
station commenced in 1985 and all of the equipment have been managed and maintained by IP.
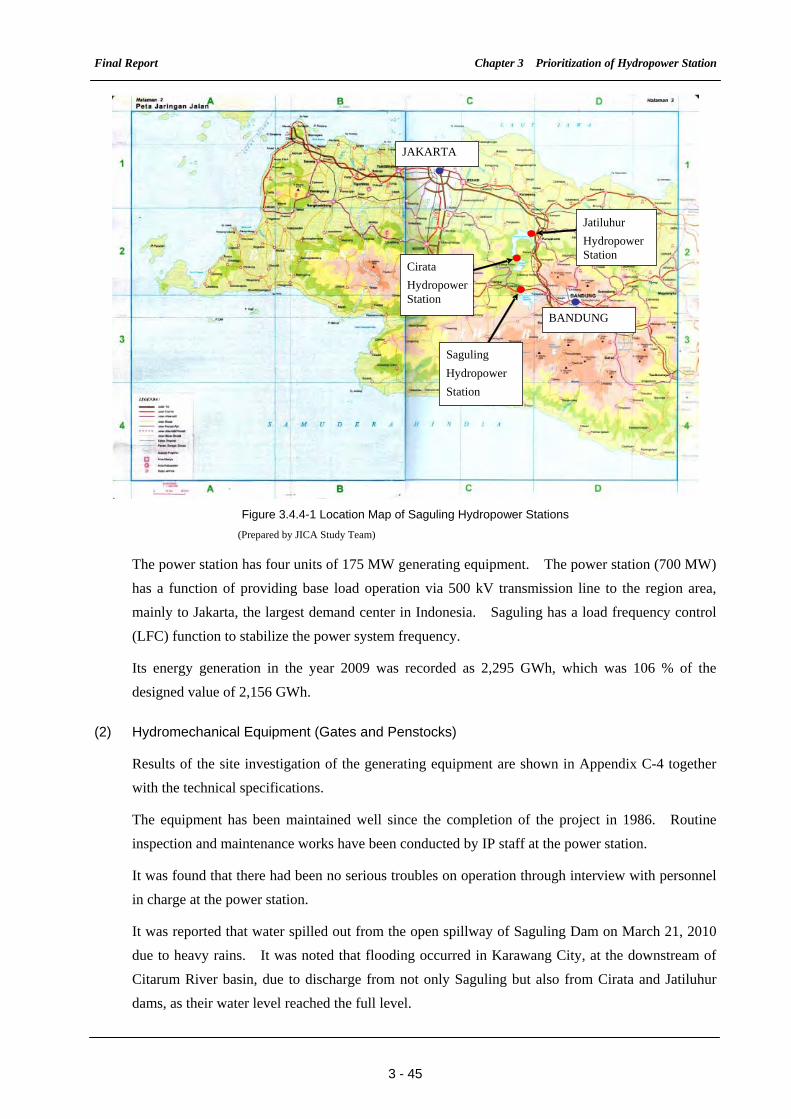
Final Report Chapter 3 Prioritization of Hydropower Station
3 - 45
Figure 3.4.4-1 Location Map of Saguling Hydropower Stations
(Prepared by JICA Study Team)
The power station has four units of 175 MW generating equipment. The power station (700 MW)
has a function of providing base load operation via 500 kV transmission line to the region area,
mainly to Jakarta, the largest demand center in Indonesia. Saguling has a load frequency control
(LFC) function to stabilize the power system frequency.
Its energy generation in the year 2009 was recorded as 2,295 GWh, which was 106 % of the
designed value of 2,156 GWh.
(2) Hydromechanical Equipment (Gates and Penstocks)
Results of the site investigation of the generating equipment are shown in Appendix C-4 together
with the technical specifications.
The equipment has been maintained well since the completion of the project in 1986. Routine
inspection and maintenance works have been conducted by IP staff at the power station.
It was found that there had been no serious troubles on operation through interview with personnel
in charge at the power station.
It was reported that water spilled out from the open spillway of Saguling Dam on March 21, 2010
due to heavy rains. It was noted that flooding occurred in Karawang City, at the downstream of
Citarum River basin, due to discharge from not only Saguling but also from Cirata and Jatiluhur
dams, as their water level reached the full level.
JAKARTA
BANDUNG
Saguling
Hydropower
Station
Cirata
HydropowerStation
Jatiluhur
Hydropower Station

Final Report Chapter 3 Prioritization of Hydropower Station
3 - 46
(3) Generating Equipment (Water Turbines, Generators and Control System)
Results of the site investigation of the generating equipment are shown in Appendix C-4 together
with the technical specifications.
Unit 1 and unit 2 have been operating for over 24 years since its completion in 1985, while unit 3
and 4 have operational for 23 years 1986.
The generating equipment has been maintained well by power station staff by implementing
planned annual inspection, general inspection and major overhaul. It was observed during the site
investigation that there have been no serious problems that affect its continuous operation.
However, the following observations were noted:
1) Water Turbine: Water turbine is of Francis type and a spare runner was provided at the time
the project was completed. It was replaced by a used runner during the major overhaul in 2004.
Damage or cavitations appeared in the removed runner were repaired by power station staff. It
is then stored in the power station for futures use in the next major overhaul. It is noted that
the existing runners have not yet been replaced with new ones from the time of initial
operation.
2) Inlet Valve: Leakage from valve bearing was observed in unit 3.
3) Governor: Governor is of analog PID type which is already obsolete and none of its parts are
available in the market. It is planned to be replaced with new ones through the financial
assistance of JBIC export credit line.
4) Cooling water system: Cooling water system has been corroding due to chemical contents in
the river water being polluted by drainage water from industrial factories at the upper reach of
the river in Bundung City. Under such circumstance, PLN was requested to replace the
embedded pipes of the cooling water system through the assistance of JBIC export credit line
in 2006. The contract for the replacement has been signed by the supplier and PLN in 2009.
5) Supervisory and Control System: The supervisory and control system originally provided with
analog type has been replaced with computerized system in 2002, through IP’s own fund.
Automatic data logger is equipped with control system and operating status to monitor events
displayed on the generating equipment.
(4) Transmission Lines and Substations
Two units of main transformers with 412.2 MVA are installed adjacent to the power station
belonging to IP. Meanwhile, all 500 kV outdoor switchgear and 500 kV transmission lines
constructed under the financial assistance of OECF in 1985 are controlled, operated and maintained
by P3B. Moreover, Six 500 kV transmission lines are connected from Saguling Switchgear to the
500 kV power transmission network in Java-Bali. Presently, all outdoor switchgears are operating
without any trouble.
Final Report Chapter 3 Prioritization of Hydropower Station
3 - 47
(5) Dams and the Appurtenant Civil Work Facilities
1) Organization for Operation & Maintenance
Saguling Dam and Saguling Power Station were completed in 1986. The dam has been utilized
for supplying water for power generation and irrigation water downstream. The dam and the
power station are operated and maintained well by IP.
2) Current Status of the Saguling Dam
Twenty three years have passed since the completion of the dams and the power station.
According to IP, behaviors of the measuring apparatus installed to monitor the movement of
dam and the appurtenant structures are generally normal. Moreover, regular and visual
inspection results did not reveal abnormal phenomena in the dam and the appurtenant
structures. Dam safety evaluation based on the measuring apparatus records are conducted
twice per year and the results are then fully reported to the Dam Safety Committee in the
Ministry of the Public Works.
3) Current Status of Power Generation Facilities
According to IP, there were no evident defects found in the civil structures in the power intake,
the waterway and the power station.
4) Visual Inspection Results
The JCA Study Team has carried out a visual inspection of the civil structures focusing on
settlement, deformation, leakage, and crack at the dams and power generation facilities. No
serious defects have been observed. Results from the observation results of the above facilities
are shown in Appendix C4.
(6) Sedimentation in the Reservoir
There exists Bandung city of which population is 2,500,000 people within the watershed of the
Saguling reservoir, and due to the affection of Bandung city, the pollution of the reservoir water
becomes deteriorated gradually. According to IP, the present situation is as follows:
1) Current Situation of Reservoir Sedimentation
Annual average sedimentation including waste material from households and factories to the
Saguling reservoir is estimated about 4.0 MCM. According to IP, as the gross reservoir
capacity is 875 MCM and very large, the operation of the Saguling reservoir can be made as
scheduled for about 30 years from now.
2) Water Pollution Problem of Reservoir
The reservoir water pollution is caused by lots of sewage/waste material from households and
factories in Bandung city. Intrusion of lots of polluted water and garbage to the Saguling
reservoir is caused by poor sewage treatment facilities, bad manner of surrounding residents
such as throwing garbage and limits of garbage collection capacities by the local government.
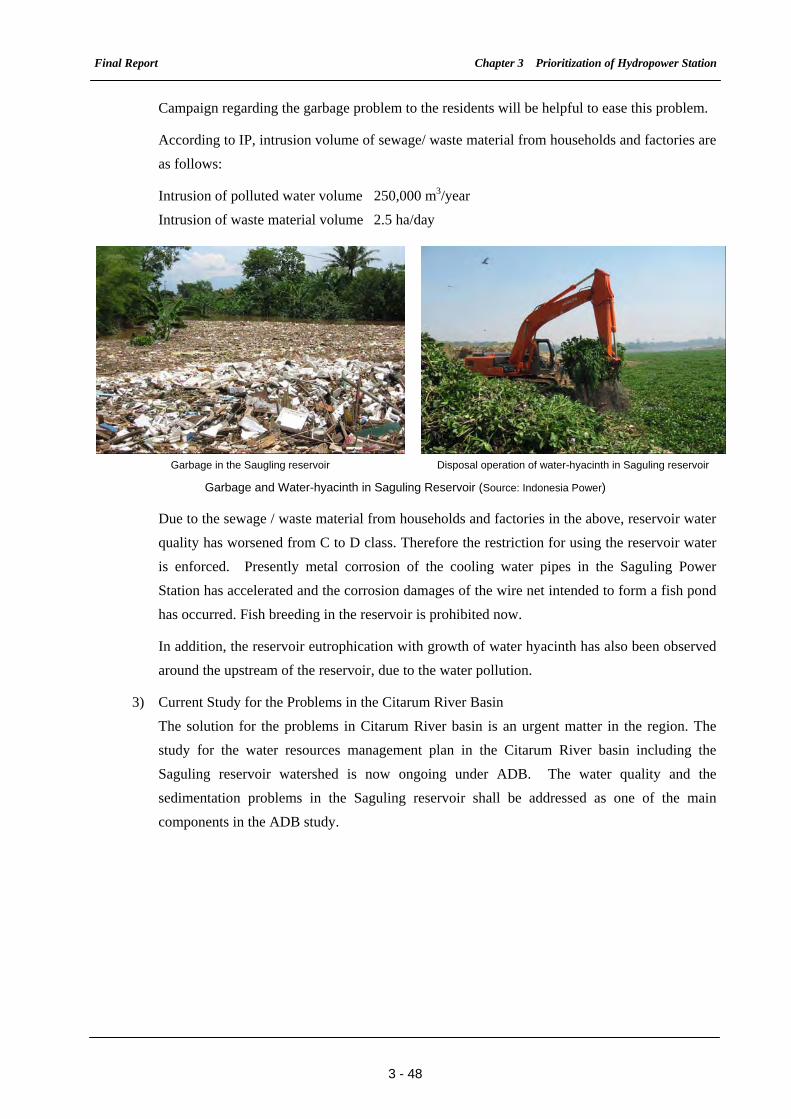
Final Report Chapter 3 Prioritization of Hydropower Station
3 - 48
Campaign regarding the garbage problem to the residents will be helpful to ease this problem.
According to IP, intrusion volume of sewage/ waste material from households and factories are
as follows:
Intrusion of polluted water volume 250,000 m3/year
Intrusion of waste material volume 2.5 ha/day
Garbage in the Saugling reservoir Disposal operation of water-hyacinth in Saguling reservoir
Garbage and Water-hyacinth in Saguling Reservoir (Source: Indonesia Power)
Due to the sewage / waste material from households and factories in the above, reservoir water
quality has worsened from C to D class. Therefore the restriction for using the reservoir water
is enforced. Presently metal corrosion of the cooling water pipes in the Saguling Power
Station has accelerated and the corrosion damages of the wire net intended to form a fish pond
has occurred. Fish breeding in the reservoir is prohibited now.
In addition, the reservoir eutrophication with growth of water hyacinth has also been observed
around the upstream of the reservoir, due to the water pollution.
3) Current Study for the Problems in the Citarum River Basin
The solution for the problems in Citarum River basin is an urgent matter in the region. The
study for the water resources management plan in the Citarum River basin including the
Saguling reservoir watershed is now ongoing under ADB. The water quality and the
sedimentation problems in the Saguling reservoir shall be addressed as one of the main
components in the ADB study.
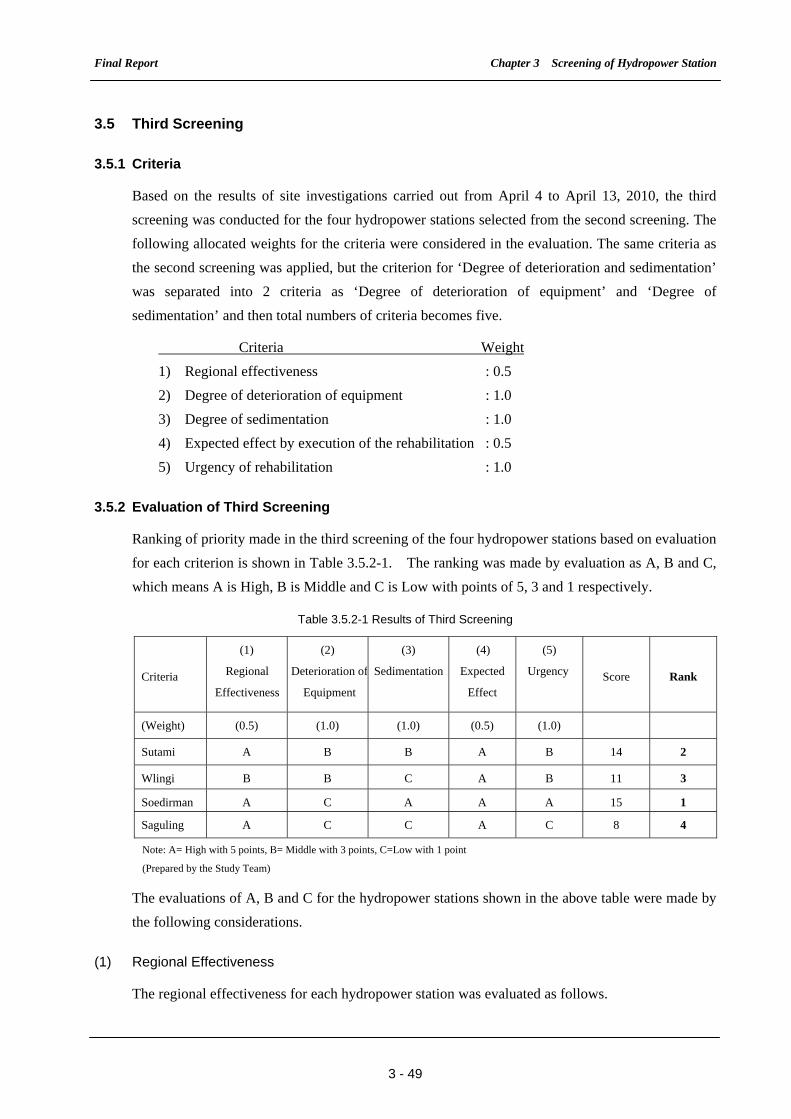
Final Report Chapter 3 Screening of Hydropower Station
3 - 49
3.5 Third Screening
3.5.1 Criteria
Based on the results of site investigations carried out from April 4 to April 13, 2010, the third
screening was conducted for the four hydropower stations selected from the second screening. The
following allocated weights for the criteria were considered in the evaluation. The same criteria as
the second screening was applied, but the criterion for ‘Degree of deterioration and sedimentation’
was separated into 2 criteria as ‘Degree of deterioration of equipment’ and ‘Degree of
sedimentation’ and then total numbers of criteria becomes five.
Criteria Weight
1) Regional effectiveness : 0.5
2) Degree of deterioration of equipment : 1.0
3) Degree of sedimentation : 1.0
4) Expected effect by execution of the rehabilitation : 0.5
5) Urgency of rehabilitation : 1.0
3.5.2 Evaluation of Third Screening
Ranking of priority made in the third screening of the four hydropower stations based on evaluation
for each criterion is shown in Table 3.5.2-1. The ranking was made by evaluation as A, B and C,
which means A is High, B is Middle and C is Low with points of 5, 3 and 1 respectively.
Table 3.5.2-1 Results of Third Screening
Criteria
(1)
Regional
Effectiveness
(2)
Deterioration of
Equipment
(3)
Sedimentation
(4)
Expected
Effect
(5)
Urgency Score Rank
(Weight) (0.5) (1.0) (1.0) (0.5) (1.0)
Sutami A B B A B 14 2
Wlingi B B C A B 11 3
Soedirman A C A A A 15 1
Saguling A C C A C 8 4
Note: A= High with 5 points, B= Middle with 3 points, C=Low with 1 point
(Prepared by the Study Team)
The evaluations of A, B and C for the hydropower stations shown in the above table were made by
the following considerations.
(1) Regional Effectiveness
The regional effectiveness for each hydropower station was evaluated as follows.
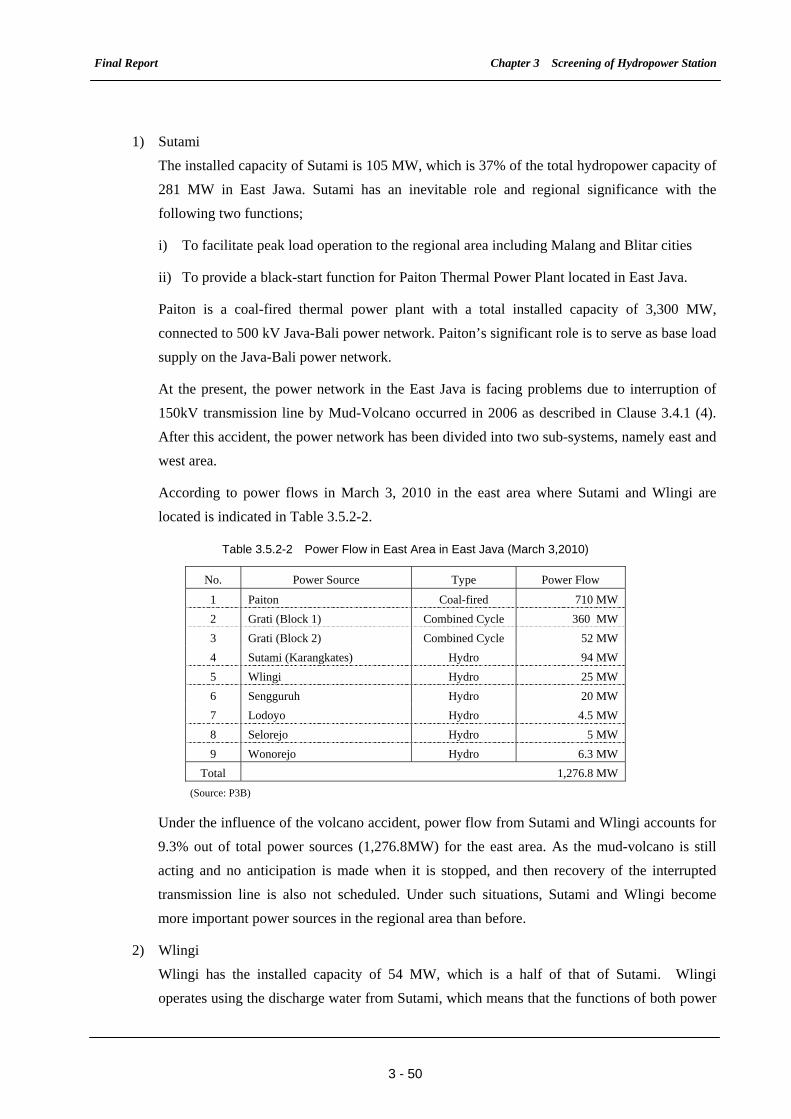
Final Report Chapter 3 Screening of Hydropower Station
3 - 50
1) Sutami
The installed capacity of Sutami is 105 MW, which is 37% of the total hydropower capacity of
281 MW in East Jawa. Sutami has an inevitable role and regional significance with the
following two functions;
i) To facilitate peak load operation to the regional area including Malang and Blitar cities
ii) To provide a black-start function for Paiton Thermal Power Plant located in East Java.
Paiton is a coal-fired thermal power plant with a total installed capacity of 3,300 MW,
connected to 500 kV Java-Bali power network. Paiton’s significant role is to serve as base load
supply on the Java-Bali power network.
At the present, the power network in the East Java is facing problems due to interruption of
150kV transmission line by Mud-Volcano occurred in 2006 as described in Clause 3.4.1 (4).
After this accident, the power network has been divided into two sub-systems, namely east and
west area.
According to power flows in March 3, 2010 in the east area where Sutami and Wlingi are
located is indicated in Table 3.5.2-2.
Table 3.5.2-2 Power Flow in East Area in East Java (March 3,2010)
No. Power Source Type Power Flow
1 Paiton Coal-fired 710 MW
2 Grati (Block 1) Combined Cycle 360 MW
3 Grati (Block 2) Combined Cycle 52 MW
4 Sutami (Karangkates) Hydro 94 MW
5 Wlingi Hydro 25 MW
6 Sengguruh Hydro 20 MW
7 Lodoyo Hydro 4.5 MW
8 Selorejo Hydro 5 MW
9 Wonorejo Hydro 6.3 MW
Total 1,276.8 MW
(Source: P3B)
Under the influence of the volcano accident, power flow from Sutami and Wlingi accounts for
9.3% out of total power sources (1,276.8MW) for the east area. As the mud-volcano is still
acting and no anticipation is made when it is stopped, and then recovery of the interrupted
transmission line is also not scheduled. Under such situations, Sutami and Wlingi become
more important power sources in the regional area than before.
2) Wlingi
Wlingi has the installed capacity of 54 MW, which is a half of that of Sutami. Wlingi
operates using the discharge water from Sutami, which means that the functions of both power
Final Report Chapter 3 Screening of Hydropower Station
3 - 51
stations are closely related. Major function of Wlingi is peak load operation to serve the power
to the regional area as described in the above for Sutami, however, as far as water is available,
Wlingi is forced to be operated continuously.
3) Soedirman (Mrica)
Soedirman has installed capacity of 189 MW and facilitate peak load operation to the regional
area and also has two major regional functions other than the power generation. Firstly, it
supplies water for irrigation while the second is to serve as flood control facility. Mrica
supplies water for irrigation purposes to serve an area of 10,000 ha and functions as a
water-refilling facility across 20,000 ha downstream.
Furthermore, Mrica Reservoir highly contributes to the reduction and prevention of flood
damages at the downstream area.
Under this present status, the Serayu River with Soedirman Hydropower Station is expected to
give impacts to water utilization and safety of residents in the Searyu River basin if functions
of the water utilization and the flood contorl deteriorate in the near future.
4) Saguling
Saguling is a large-scale hydropower station with 700 MW, which is the largest hydropower
station of PLN. The generated power is directly connected to 500 kV Java-Bali power
transmission network. Saguling was originally designed for 6 hours peak load operation, but
presently, it is utilized for base-load operation of 24 hours as long as water is available.
Saguling has a important function in the power transmission network, which is one of the few
power stations that can keep and provide 20 MW to the load frequency control (LFC) to the
power system.
From the above assessment, Sutami, Soedirman and Saguling were evaluated as A while Wlingi as
B, in terms of regional effectiveness.
(2) Degree of Equipment Deterioration
The generating equipment of all four hydropower stations have been maintained by power station
staff by conducting regular maintenance (annual inspection and general inspection) and periodic
major overhaul. At present, no serious damages or accidents have been reported based on the
recent operation records.
Although maintenance works for Sutami and Wlingi hydropower stations were properly executed,
the working lifetime of their electrical and mechanical equipment have been exceeded considering
that the facilities were constructed in the 1970s. Therefore, it is deemed that these hydropower
stations are subject to high potential risk in continuing their reliable and stable operation.
For Soedirman and Sagling hydropower stations, rehabilitation works for the supervisory and
control system have been done through own fund. As a result, the system was modernized and
Final Report Chapter 3 Screening of Hydropower Station
3 - 52
has been equipped with automatic data logger, which allows monitoring of the operating status of
generating equipment through the display monitor. Rehabilitation of governor and embedded
pipes for cooling water supply system in Saguling has been initiated under the financial assistance
of JBIC export credit line.
Meanwhile control system including governor and AVR at Sutami and Wlingi hydropower stations
are obsolete, along with the analog indicator. Said facilities do not have automatic data logger for
their control system. PJB, which operates 12 hydropower stations including Sutami and Wlingi
along the Brantas River, intends to rehabilitate the control system of all the 12 hydropower stations
in the future. This should enable the hydropower stations to be controlled, operated and monitored
by only one control center.
From the above assessment, Sutami and Wlingi were evaluated as B, while Soedirman and
Saguling as C, in terms of degree of deterioration of equipment.
(3) Degree of Sedimentation
Degree of sedimentation of each of the hydropower station was determined from the results of
the site investigation as follows:
Appropriate sediment managements has been carried out for the Sutami Reservoir and the
Wlingi Reservoir by PJT-I regardless serious sedimentation problem in the reservoirs. Furthermore,
BBS undertakes the construction of sabo dams in the upstream area and construction of sediment
bypass channel for the Wlingi Reservoir. Hence, long-term countermeasures against the
sedimentation problem in the Wlingi Reservoir has been carried out.
For the Soedirman (Mrica) Reservoir, watershed management works are being undertaken by IP,
local government and other agencies. Small scale sediment dredging and sediment flushing
operation in front of the power intake, through the drawdown culvert gate are carried out
periodically. However, this seems ineffective since the countermeasures are relatively small scale
comparing with the significant sediment inflow into the reservoir.
For the Saguling Reservoir, the overall study on the water resources management in the Citarum
River basin is on-going. The main concerns for the reservoir however are the polluted water and
waste material intrusion. Since the Saguling Reservoir has large capacity comparing with the
sediment inflow into the reservoir, the sedimentation problem does not significantly affect the
reservoir function at the moment.
(4) Expected Effect by Execution of the Rehabilitation
Main roles of the four candidate hydropower stations for power network are summarized in Table
3.5.2-3.
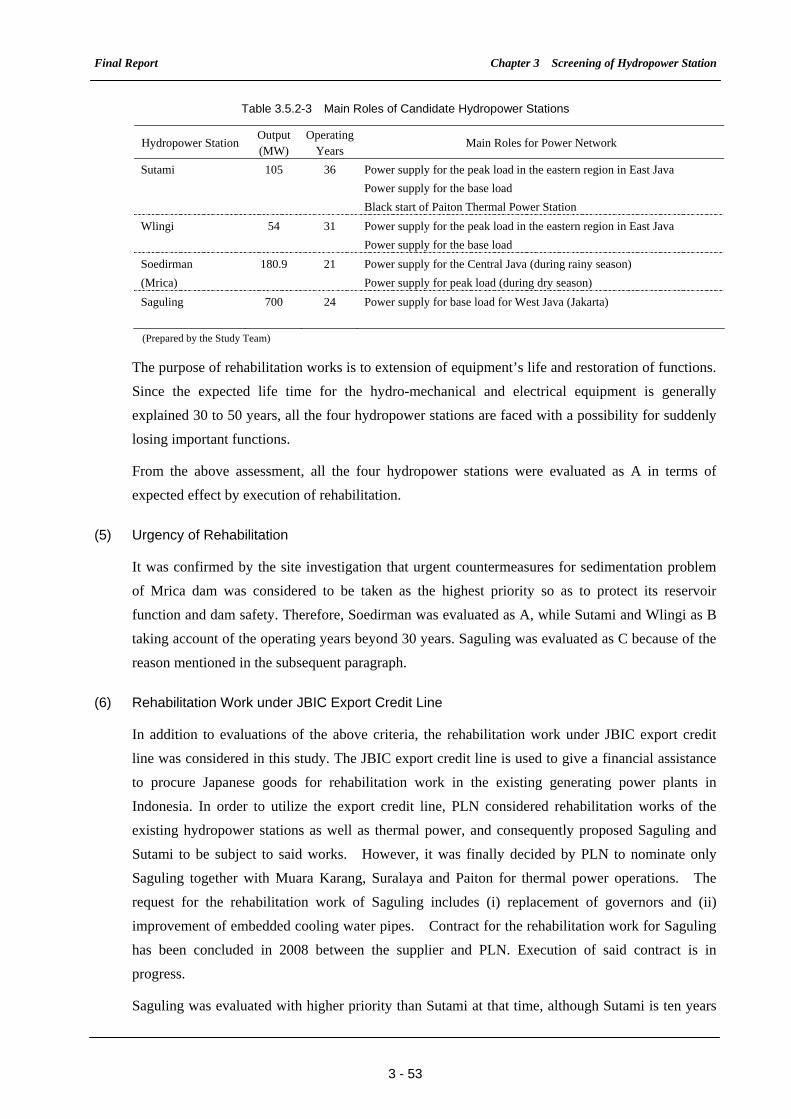
Final Report Chapter 3 Screening of Hydropower Station
3 - 53
Table 3.5.2-3 Main Roles of Candidate Hydropower Stations
Hydropower StationOutput (MW)
Operating Years
Main Roles for Power Network
Sutami 105 36 Power supply for the peak load in the eastern region in East Java
Power supply for the base load
Black start of Paiton Thermal Power Station
Wlingi 54 31 Power supply for the peak load in the eastern region in East Java
Power supply for the base load
Soedirman
(Mrica)
180.9 21 Power supply for the Central Java (during rainy season)
Power supply for peak load (during dry season)
Saguling 700 24 Power supply for base load for West Java (Jakarta)
(Prepared by the Study Team)
The purpose of rehabilitation works is to extension of equipment’s life and restoration of functions.
Since the expected life time for the hydro-mechanical and electrical equipment is generally
explained 30 to 50 years, all the four hydropower stations are faced with a possibility for suddenly
losing important functions.
From the above assessment, all the four hydropower stations were evaluated as A in terms of
expected effect by execution of rehabilitation.
(5) Urgency of Rehabilitation
It was confirmed by the site investigation that urgent countermeasures for sedimentation problem
of Mrica dam was considered to be taken as the highest priority so as to protect its reservoir
function and dam safety. Therefore, Soedirman was evaluated as A, while Sutami and Wlingi as B
taking account of the operating years beyond 30 years. Saguling was evaluated as C because of the
reason mentioned in the subsequent paragraph.
(6) Rehabilitation Work under JBIC Export Credit Line
In addition to evaluations of the above criteria, the rehabilitation work under JBIC export credit
line was considered in this study. The JBIC export credit line is used to give a financial assistance
to procure Japanese goods for rehabilitation work in the existing generating power plants in
Indonesia. In order to utilize the export credit line, PLN considered rehabilitation works of the
existing hydropower stations as well as thermal power, and consequently proposed Saguling and
Sutami to be subject to said works. However, it was finally decided by PLN to nominate only
Saguling together with Muara Karang, Suralaya and Paiton for thermal power operations. The
request for the rehabilitation work of Saguling includes (i) replacement of governors and (ii)
improvement of embedded cooling water pipes. Contract for the rehabilitation work for Saguling
has been concluded in 2008 between the supplier and PLN. Execution of said contract is in
progress.
Saguling was evaluated with higher priority than Sutami at that time, although Sutami is ten years
Final Report Chapter 3 Screening of Hydropower Station
3 - 54
older than Saguling. The high priority rating for Saguling was based on evaluation results as
follows: (1) Saguling has a large capacity, (2) Saguling is located close to Jakarta which is the
biggest demand center in Indonesia and (3) Saguling has an LFC function and (4) Saguling faces
problem on cooling water system due to water quality.
The above evaluation results have been considered in this study considering regional effectiveness
and other expected effects. However, the urgency was rated as C because the rehabilitation of
Saguling has already been committed for execution under JBIC export credit line. On the other
hand, the urgency for rehabilitation work for Sutami was evaluated as B, which set higher priority
than Saguling since no rehabilitation work has been committed.
3.5.3 Results of Third Screening
In accordance with the results of the third screening, Soedirman was ranked as the highest priority
hydropower station for rehabilitation. Soedirman is required to make a countermeasure for the
sedimentation problem, while the generating equipment is not required to be rehabilitated at the
moment because the deterioration is not so serious and the replacement of major equipment such as
control and protection panel, AVR etc. has been done.
Sutami was ranked as the second priority hydropower station for rehabilitation. Sutami is required
to take considerations for rehabilitation of the generating equipment because rehabilitation for
major equipment such as turbine runner, generator, control and protection panel etc. have not yet
carried out although the operating years are nearly 40 years. On the other hand, Sutami is facing
sedimentation problem, but a countermeasure are being undertaken by BBWS. Therefore, a
countermeasure for the sedimentation is not taken in this study.
Based on the above, the following two rehabilitation works were considered to be studied in the
next stage:
1) Rehabilitation work for the generating equipment in Sutami Hydropower Station
2) Countermeasure for sedimentation in Soedirman (Mrica) Reservoir
In addition to the rehabilitation work for Sutami, it is proposed to be combined with the
rehabilitation works for Wlingi to enhance the expected effectiveness. This was considered since
both power stations were constructed in the 1970s as cascade power station in the Brantas River,
and rehabilitation works for Wlingi generating equipment have not yet been done so far.