Embed Size (px)
Citation preview
INNOVATION MATTERSMSCI EQUITY ANALYTICS ROADMAP Q3 2015
TODAY WE ARE MORE
FOCUSED THAN EVER
ON OUR CLIENTS’
BUSINESS NEEDS.
Peter Zangari
Managing Director and Global Head of MSCI’s Analytics Business
CLIENTS MATTER
MSCI EQUITY ROADMAP Q2 2015
MSCI EQUITY ROADMAP Q3 2015
3
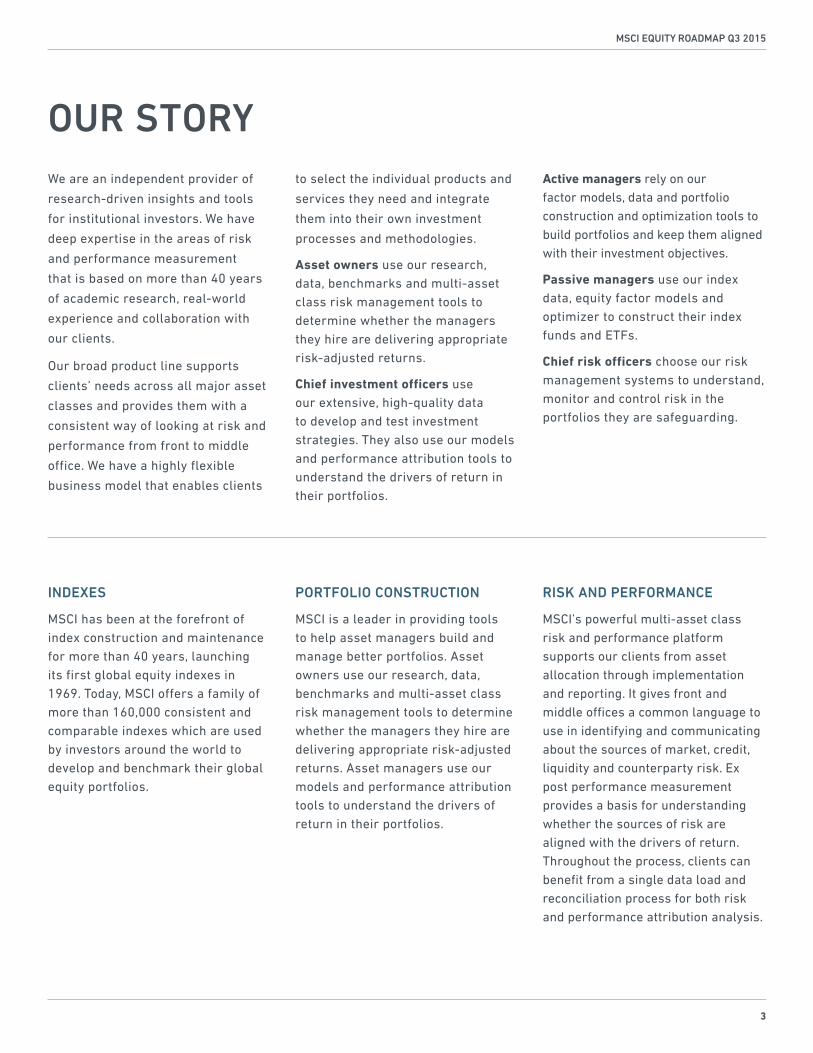
OUR STORYWe are an independent provider of
research-driven insights and tools
for institutional investors. We have
deep expertise in the areas of risk
and performance measurement
that is based on more than 40 years
of academic research, real-world
experience and collaboration with
our clients.
Our broad product line supports
clients’ needs across all major asset
classes and provides them with a
consistent way of looking at risk and
performance from front to middle
office. We have a highly flexible
business model that enables clients
INDEXES
MSCI has been at the forefront of index construction and maintenance for more than 40 years, launching its first global equity indexes in 1969. Today, MSCI offers a family of more than 160,000 consistent and comparable indexes which are used by investors around the world to develop and benchmark their global equity portfolios.
to select the individual products and
services they need and integrate
them into their own investment
processes and methodologies.
Asset owners use our research, data, benchmarks and multi-asset class risk management tools to determine whether the managers they hire are delivering appropriate risk-adjusted returns.
Chief investment officers use our extensive, high-quality data to develop and test investment strategies. They also use our models and performance attribution tools to understand the drivers of return in their portfolios.
PORTFOLIO CONSTRUCTION
MSCI is a leader in providing tools to help asset managers build and manage better portfolios. Asset owners use our research, data, benchmarks and multi-asset class risk management tools to determine whether the managers they hire are delivering appropriate risk-adjusted returns. Asset managers use our models and performance attribution tools to understand the drivers of return in their portfolios.
Active managers rely on our factor models, data and portfolio construction and optimization tools to build portfolios and keep them aligned with their investment objectives.
Passive managers use our index data, equity factor models and optimizer to construct their index funds and ETFs.
Chief risk officers choose our risk management systems to understand, monitor and control risk in the portfolios they are safeguarding.
RISK AND PERFORMANCE
MSCI’s powerful multi-asset class risk and performance platform supports our clients from asset allocation through implementation and reporting. It gives front and middle offices a common language to use in identifying and communicating about the sources of market, credit, liquidity and counterparty risk. Ex post performance measurement provides a basis for understanding whether the sources of risk are aligned with the drivers of return. Throughout the process, clients can benefit from a single data load and reconciliation process for both risk and performance attribution analysis.
MSCI EQUITY ROADMAP Q3 2015
4
BARRA® PORTFOLIOMANAGER
AVAILABLE NOWPEER ANALYTICS
Designed to provide institutional-grade,
holdings-based insight into investment
strategies and performance of mutual
funds for investment managers and
asset owners.
• Leverageholdings-leveldataforactive equity mutual funds to use as a source of comparison against your own portfolio
• Gaininsightsintoinvestmentstyles and sources of risk and return in various market segments via PDF reports
RISK DELTA
• Clientscannowseechangesinrisk using the correlated risk contribution framework. The user may select two portfolios, two dates, or two horizons of the same risk model side by side.
• Thegoalistounderstandwhatdrove the difference in risk between two dates or portfolios: differences in the PM’s bets, changes in risk measures, or changes in risk model correlations.
Barra Open Optimizer 8.1 IntegrationLeverage the latest research
and analytics from our Barra
Open Optimizer research team,
including a new second order cone
problem (SOCP) algorithm and new
constraint options
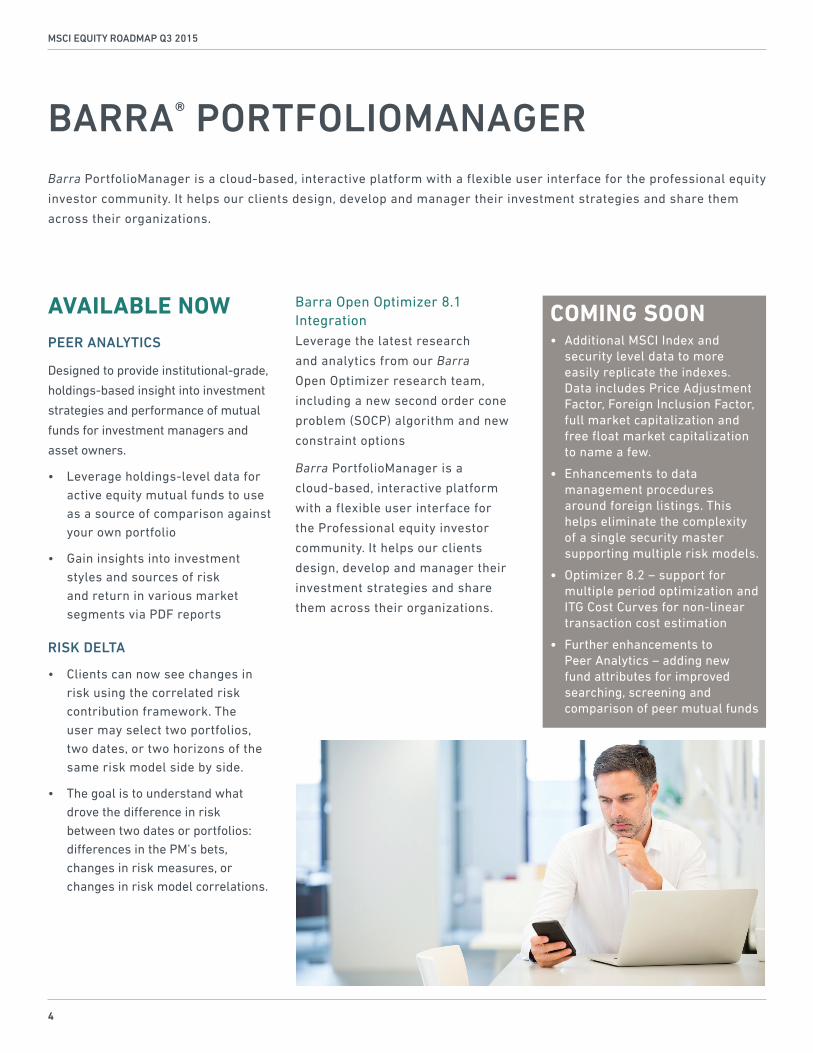
Barra PortfolioManager is a
cloud-based, interactive platform
with a flexible user interface for
the Professional equity investor
community. It helps our clients
design, develop and manager their
investment strategies and share
them across their organizations.
Barra PortfolioManager is a cloud-based, interactive platform with a flexible user interface for the professional equity
investor community. It helps our clients design, develop and manager their investment strategies and share them
across their organizations.
COMING SOON• Additional MSCI Index and
security level data to more easily replicate the indexes. Data includes Price Adjustment Factor, Foreign Inclusion Factor, full market capitalization and free float market capitalization to name a few.
• Enhancements to data management procedures around foreign listings. This helps eliminate the complexity of a single security master supporting multiple risk models.
• Optimizer 8.2 – support for multiple period optimization and ITGCostCurvesfornon-lineartransaction cost estimation
• Further enhancements to Peer Analytics – adding new fund attributes for improved searching, screening and comparison of peer mutual funds
MSCI EQUITY ROADMAP Q3 2015
5
Barra Aegis is an integrated suite of equity investment analytics and portfolio management tools designed to help
users actively manage equity risk against expected returns.
BARRA® AEGIS SUITE
AVAILABLE NOWThe latest version Barra Aegis 4.6
includes:
• BarraOptimizer 8.1 features including asset-level nonlinear transaction costs and limits on buy side and sell side turnover
• Enhancementsfortax-awareoptimization users, which include soft factor constraint support with after-tax optimization, tax-aware back-testing and new tax reports
• Supportforrestrictedtradinglistsin optimization
• Useofportfoliolevelattributes in formula
• Supportforasinglecommonrepository of MSCI-delivered portfolios across all models for more efficient model data management
• NewMSCIbranding
COMING SOON• Optimizer 8.2 and related
features
• Market timing in Asset Contribution reports
• Tax related features
PORTFOLI
OS
INVESTA
BLE O
PTIM
ALINN
OVATION
CON
TINUOUS
BarraOptimizer
MANAGEMENTBUILT FOR PORTFOLIO
®
OPTIMIZER
OPTIMIZER
®
®
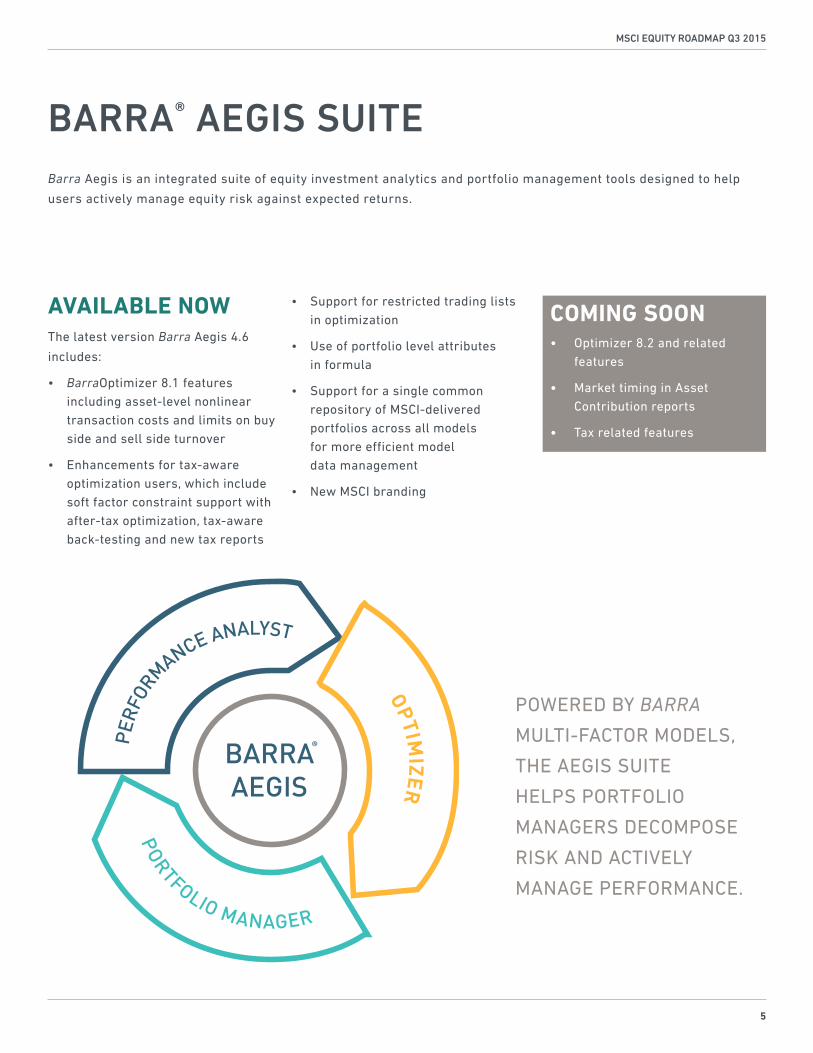
POWERED BY BARRA
MULTI-FACTOR MODELS,
THEAEGISSUITE
HELPS PORTFOLIO
MANAGERSDECOMPOSE
RISK AND ACTIVELY
MANAGEPERFORMANCE.
MSCI EQUITY ROADMAP Q3 2015
6
COMING SOON• Further enhanced functionality
for multiple-period optimization and portfolio diversification controls.
• Strongeroptimizationalgorithmswhen using thresholds or cardinality constraints.
• Additionalmethodologiesfor rules based portfolio construction based on maximum diversification or effective number of names
BARRA® OPEN OPTIMIZER 8.2
AVAILABLE NOWMULTIPLE-PERIOD OPTIMIZATION
Multiple-Period Optimization allows portfolio managers to take into consideration the alpha and transaction cost information not only for the current period, but also for future periods. It also enables traders to optimally schedule their trading in order to minimize transaction cost and risk over discrete periods in the trading day.
DIVERSIFICATION CONTROLS
• SetalowerboundonDiversification Ratio as an alternative rules-based portfolio construction technique to form risk-managed portfolios.
• UsethenewPortfolioConcentration Limit constraint to control total weight of the top 5 largest positions in a portfolio.
This new version of the Barra Open Optimizer also includes:
• Softlowerboundontotalriskortracking error
• Frontieroptimizationwithcardinality, threshold, and soft constraints.
This release also contains the following previously released features:
• Native support for the Python programming language with documentation and examples.
• Threeavailableasset penalty functions.
• Addedsupportforfixedholdingcosts in the objective function.
• AcompletesetofMATLABtutorials reflecting a variety of use cases, packaged into a MATLAB toolbox with the complete Open Optimizer documentation.
• Thenewsecondorderconesolver now supports threshold and cardinality constrained problems with convex risk constraints for faster optimizations and better results.
An optimization software library designed to fit seamlessly into portfolio management workflows and support
improved investment decision making processes. It utilizes multiple optimization engines from MSCI and 3rd
parties to create index tracking portfolios, manage asset allocation, implement tax aware strategies and other
objectives of portfolio managers.
MSCI EQUITY ROADMAP Q3 2015
7
BARRA® EQUITY MODELSHelps risk and portfolio managers identify fundamental sources of risk and return, resulting in greater
transparency into investment processes and decisions. Barra® Equity Models are built by more than 400
experienced industry experts working cross functional teams comprising researchers, mathematicians,
statisticians and financial engineers.
AVAILABLE NOWTHE BARRA® US TOTAL MARKET EQUITY MODELS:
• Multiplemodelswithfactorstructure and responsiveness aligned with different investment horizons and strategies. The Long-Term model incorporates the most stable set of style factors reflecting long-term strategies that aim to keep portfolio turnover and transaction costs at low levels while the Medium-Term and Trading versions of the models add additional style factors to improve model performance across shorter investment horizons.
• Enhancedstylefactorsbased
on Systematic Equity Strategies.
Introduces new factors based on
Management Quality, Prospect
and Profitability.
• Featurespremierdatafrom
MSCI’s comprehensive
database and additional leading
quantitative data sources.
THE BARRA® ASIA-PACIFIC EQUITY MODEL:
• NewfactorsfortheAsia-Pacificmarket based on Systematic Equity Strategies.
• Anewdualfactorstructuretocapture the unique dynamics of Asia ex-Japan and Japan.
COMING SOON• BarraGlobalTotalMarket
Equity Models
• Barra UK Total Market
Equity Models
• Barra Integrated Model (BIM
303) in Models Direct. The
model is available now in
Barra Portfolio Manager and
BarraOne.
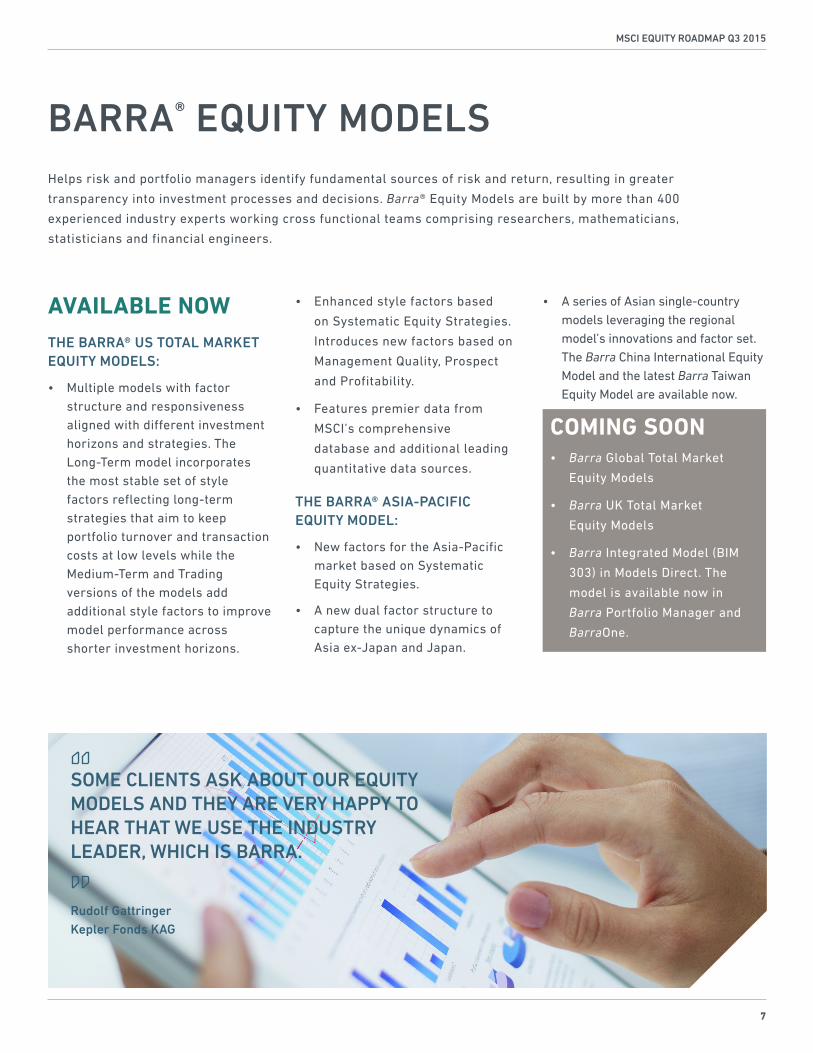
SOME CLIENTS ASK ABOUT OUR EQUITY MODELS AND THEY ARE VERY HAPPY TO HEAR THAT WE USE THE INDUSTRY LEADER, WHICH IS BARRA.
Rudolf GattringerKepler Fonds KAG
• AseriesofAsiansingle-countrymodels leveraging the regional model’s innovations and factor set. The Barra China International Equity Model and the latest Barra Taiwan Equity Model are available now.
MSCI EQUITY ROADMAP Q3 2015
8
BARRA® EQUITY MODELS:
• Capturepreviouslyhiddensourcesof risk and return that managers bet on, which result in greater transparency into investment processes and decisions.
• Improvetheaccuracyandexplanatory power of a risk model, especially during periods of economic crisis.
• Provideawiderviewintothesentiment around a stock, by matching the stock against widely followed attributes.
MODEL METHODOLOGY
Our model roadmap delivers MSCI’s new approach to risk modeling: Systematic Equity Strategies (SES)
improve risk forecast accuracy and capture evolving sources of risk and return. SES factors are included in
addition to the standard Barra style factors, market factor, and industry-specific factors. Together the models
illuminate previously uncaptured sources of risk and return. The SES factors allow users to measure portfolio
sensitivities to potentially crowded trades and positions, and uncover seasonality effects. During times of
market stress, this crowding may result in extreme levels of risk and SES factors can significantly improve
the performance of the model.
• Identifypersistentmarketanomaliesandtracktheseasonalityormarket-timingopportunitiesaroundsystematic equity strategies.
• Createmoremeaningfulandintuitiveportfolios.
MSCI now also delivers Barra Descriptors, which are the building blocks of the factors in the leading Barra
equity models.
• Provideanunprecedentedlevelof transparency through Barra Descriptors, the building block of the model’s styles. This enriched dataset is now available to use across your investment process.
RELATED RESEARCH
• Research Insight – Employing Systematic Equity Strategies: Distinguishing Important Sources of Risk from Common Sources of Return
• Research Insight – Systematic Equity Strategies: A Test Case Using Empirical Results from the Japan Equity Market
• Research Insight – Benefits of Including Systematic Equity Strategy (SES) Factors
• Research Insight – Introducing the Prospect Factor
• Research Insight – Introducing the Seasonality Factor
BARRA U.S. TOTAL MARKET EQUITY TRADING MODEL
AVAILABLE NOW
MSCI EQUITY ROADMAP Q3 2015
9
BARRA® EQUITY SECURITYMASTER
BENEFITS:
• Quality-assurancetechniquesincluding data normalization and multi-vendor validation as well as diagnostics resulting from collaboration between our data management and analytics research teams.
• Multipleexternalconsumers(i.e.,other clients) reviewing our data on a daily basis. Think of it as the most continually peer-reviewed dataset available on the market.
• DataReceipts(forthcoming)thatprovide transparency into our quality-assurance process by revealing what we checked, what we corrected, what we validated and why. To our knowledge, no other content provider reveals both corrections and related justification to their customers.
• Packagingmadetofacilitateefficient integration into a client’s operating platform.
AVAILABLE NOWIdentifier Mapping
• HistoryofBarra Identifiers mapped to the following identifiers: CUSIPs, CINS, ISINs, SEDOLs, gvKeys, MSCI Codes, MSCI Timeseries Codes, and local identifiers such as tickers.
Asset and Issuer Characteristics
• CountryofQuotation/Exposure/Classification/Incorporation/Domicile, Exchange information,
Share Type and Class, Issuer, Primary Listing Daily Equity Market Data
• Prices(open/high/low/close/Bbd/ask), number of shares, volume
• Deriveddata:marketcapitalization, returns and liquidity data
Corporate Events
• Dividendsincludingex-dateandreturn re-investment date
• MSCIPriceAdjustmentFactors,which aggregate the impact of corporate actions on an asset’s price
Other Data
• FXandrisk-freerates
• Exchangeholidays
The Barra Equity SecurityMaster
is the dataset used to create Barra
Equity Models. It provides full
transparency of all the data that
supports and builds the model and
is delivered in a format that can
be seamlessly integrated into your
investment platforms.
High quality data is the foundation for building quality models. Barra Equity SecurityMaster provides transparency into
the data that supports and builds our models, enabling you to focus on your core investment capabilities.
COMING SOON• Data Receipts: log of all the
exceptions we review, correct, and validate including reasons for our decisions. Version 1 will cover security reference data; Version 2 will cover market data.
• Corporate Actions Master – enhanced coverage and detail (e.g., not just PAFs and dividends, but buybacks, M&A, etc. as well). Expected start: Q4; expected launch: Q1 2016.
MSCI IS THE ONLY PROVIDER WHO PROVIDES DATA RECEIPTS AND UNDERLYINGDATA FOR ALL ITS MODELS
MSCI EQUITY ROADMAP Q3 2015
10
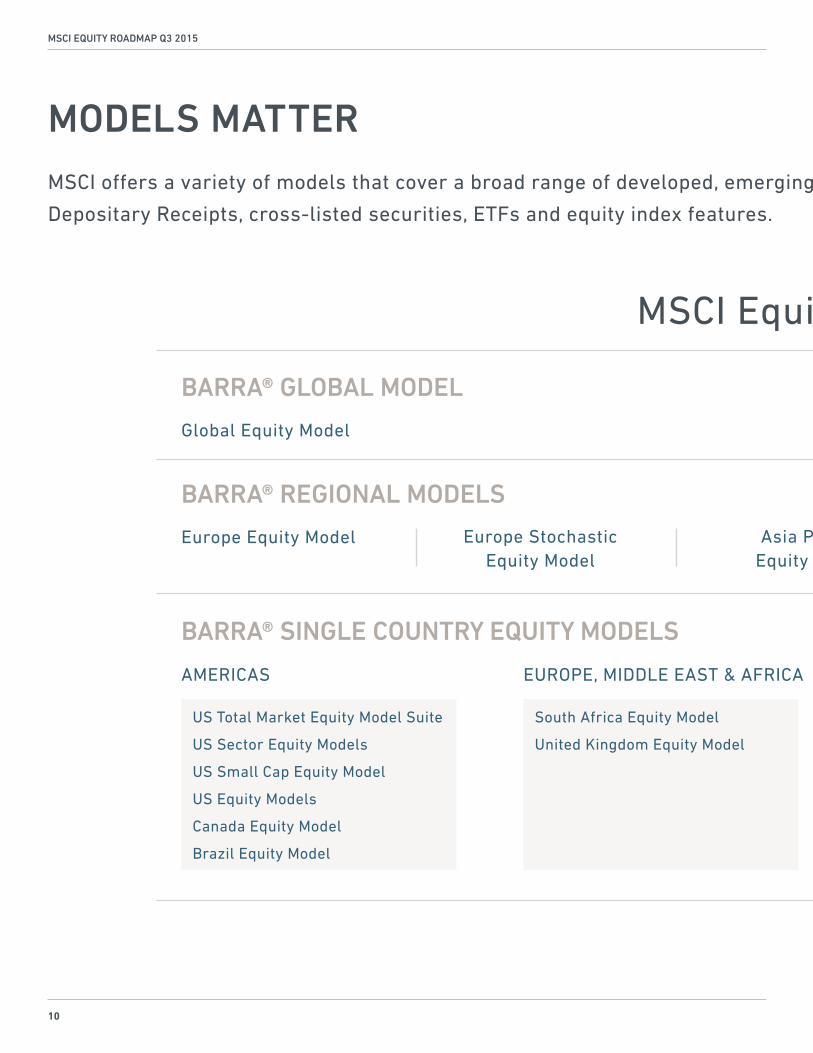
MODELS MATTER
MSCI offers a variety of models that cover a broad range of developed, emerging and frontier markets and over 88 countries around the world. This includes
Depositary Receipts, cross-listed securities, ETFs and equity index features.
MSCI Equity Models
GlobalEquityModel
BARRA® GLOBAL MODEL
Europe Equity Model Europe Stochastic Equity Model
Asia Pacific Equity Model
BARRA® REGIONAL MODELS
AMERICAS EUROPE, MIDDLE EAST & AFRICA
BARRA® SINGLE COUNTRY EQUITY MODELS
South Africa Equity Model
United Kingdom Equity Model
US Total Market Equity Model Suite
US Sector Equity Models
US Small Cap Equity Model
US Equity Models
Canada Equity Model
Brazil Equity Model
MSCI EQUITY ROADMAP Q3 2015
11
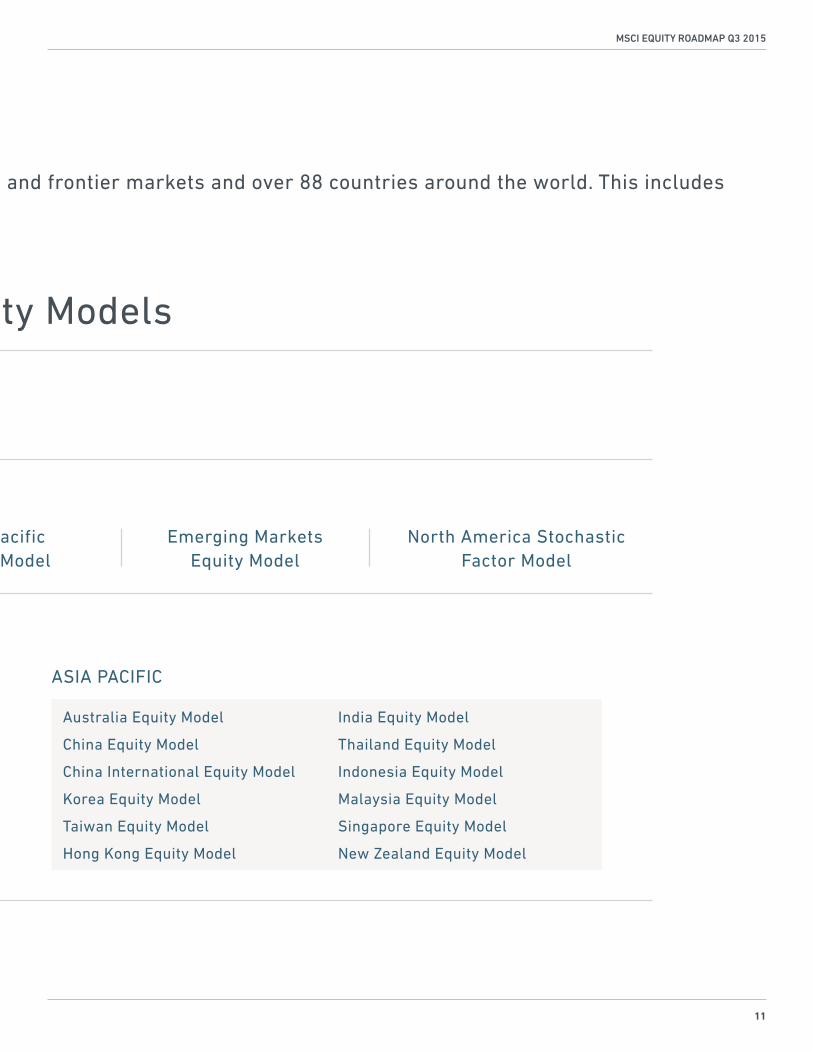
MSCI offers a variety of models that cover a broad range of developed, emerging and frontier markets and over 88 countries around the world. This includes
Depositary Receipts, cross-listed securities, ETFs and equity index features.
MSCI Equity Models
Asia Pacific Equity Model
Emerging Markets Equity Model
North America Stochastic Factor Model
EUROPE, MIDDLE EAST & AFRICA ASIA PACIFIC
BARRA® SINGLE COUNTRY EQUITY MODELS
Australia Equity Model
China Equity Model
China International Equity Model
Korea Equity Model
Taiwan Equity Model
Hong Kong Equity Model
India Equity Model
Thailand Equity Model
Indonesia Equity Model
Malaysia Equity Model
Singapore Equity Model
New Zealand Equity Model

WE USE BARRA PRODUCTS FOR OVERALL TOLERANCEFORACTIVEWEIGHTS,SECTORMINIMUMANDMAXIMUMWEIGHTSRELATIVETO OUR BENCHMARK AS WELL AS OTHER RISKS THAT ARE EMBEDDED IN THE PORTFOLIO. WE ALSOUSEBARRAAEGISTOHELPUSSIZETHEPOSITIONS IN THE PORTFOLIO AND CONTROL THE PRIMARY RISKS OF THE PORTFOLIO. MSCI’S BARRA PRODUCTS HELP US IMPLEMENT OUR IDEAS IN AN EFFICIENT MANNER.
James Abate
Founder, Managing Director and Fund Manager, Centre Asset Management

CONTACT USAmericasAtlanta Boston ChicagoMonterrey New YorkSan FranciscoSão Paulo Toronto
Cape Town Frankfurt GenevaLondon MilanParis
China NorthChina South Hong KongMumbai Seoul Singapore Sydney TaipeiThailandTokyo
AMERICAS EUROPE, MIDDLE EAST & AFRICA
ASIA PACIFIC
1 888 588 4567 (toll free)+ 1 404 551 3212+ 1 617 532 0920+ 1 312 675 0545+ 52 81 1253 4020+ 1 212 804 3901+ 1 415 836 8800+ 55 11 3706 1360+ 1 416 628 1007
+ 27 21 673 0100+ 49 69 133 859 00+ 41 22 817 9777+ 44 20 7618 2222+ 39 02 5849 0415 0800 91 59 17 (toll free)
10800 852 1032 (toll free)10800 152 1032 (toll free)+ 852 2844 9333+91 22 6784 916000798 8521 3392 (toll free)800 852 3749 (toll free)+ 61 2 9033 9333008 0112 7513 (toll free)0018 0015 6207 7181 (toll free)+ 81 3 5290 1555
TO FIND OUT MORE, PLEASE VISITMSCI Indexesmsci.com/indexes
Portfolio Constructionmsci.com/portfolio-management
Risk and Peformancemsci.com/risk-performance
msci.com
The information contained herein (the “Information”) may not be reproduced or redisseminated in whole or in part without prior written permission from MSCI. The Information may not be used to verify or correct other data, to create indexes, risk models, or analytics, or in connection with issuing, offering, sponsoring, managing or marketing any securities, portfolios, financial products or other investment vehicles. Historical data and analysis should not be taken as an indication or guarantee of any future performance, analysis, forecast or prediction. None of the Information or MSCI index or other product or service constitutes an offer to buy or sell, or a promotion or recommendation of, any security, financial instrument or product or trading strategy. Further, none of the Information or any MSCI index is intended to constitute investment advice or a recommendation to make (or refrain from making) any kind of investment decision and may not be relied on as such. The Information is provided “as is” and the user of the Information assumes the entire risk of any use it may make or permit to be made of the Information. NONE OF MSCI INC.ORANYOFITSSUBSIDIARIESORITSORTHEIRDIRECTORINDIRECTSUPPLIERSORANYTHIRDPARTYINVOLVEDINTHEMAKINGORCOMPILINGOFTHEINFORMATION(EACH,AN“MSCIPARTY”)MAKESANYWARRANTIESORREPRESENTATIONSAND,TOTHEMAXIMUMEXTENTPERMITTEDBYLAW,EACHMSCIPARTYHEREBYEXPRESSLYDISCLAIMSALLIMPLIEDWARRANTIES,INCLUDINGWARRANTIESOFMERCHANTABILITYANDFITNESSFORAPARTICULARPURPOSE.WITHOUTLIMITINGANYOFTHEFOREGOINGANDTOTHEMAXIMUMEXTENTPERMITTEDBYLAW,INNOEVENTSHALLANYOFTHEMSCIPARTIESHAVEANYLIABILITYREGARDINGANYOFTHEINFORMATIONFORANYDIRECT,INDIRECT,SPECIAL,PUNITIVE,CONSEQUENTIAL(INCLUDINGLOSTPROFITS)ORANYOTHERDAMAGESEVENIFNOTIFIEDOFTHEPOSSIBILITYOFSUCHDAMAGES.Theforegoingshallnotexcludeorlimitanyliabilitythatmaynotbyapplicablelawbeexcludedor limited.
©2015 MSCI Inc. All rights reserved | CBR0615
* MSCI Survey: “Shifting realities: Myths & Models”, September 2011
94% OFPORTFOLIOMANAGERAND INSTITUTIONAL INVESTORSAGREETHAT DATA QUALITY IS ESSENTIAL IN THE EQUITY MODELS THEY CHOOSE TO USE.1
©2015 MSCI Inc. All rights reserved.