Embed Size (px)
Citation preview
Innovation Leadership, Technological Coherence and Economic Performance
John Cantwell Rutgers Business School
111 Washington Street, Newark New Jersey NJ 07102-3027, USA
tel: +1 973 353 5050 fax: +1 973 353 1664
Email: [email protected]
Xia Wang Department of Economics University of Connecticut
341 Mansfield Road, Unit 1063 Storrs, CT 06269-1063, USA
tel: +1 860 486 9312 fax: +1 860 486 4463
Email: [email protected]

1
Innovation Leadership, Technological Coherence and Economic Performance
Abstract
The central research question in this paper is: what is the relationship between the
economic performance of the firm and (i) strategies of being a technological leader versus a
technological follower, and (ii) strategies of established technological coherence versus
novelty in technological combination? We present a quantitative investigation that enables
us to formulate some empirically grounded generalizations of average tendencies across
firms with different technological strategies in a specific industry, the biotechnology
industry. Our results suggest a bifurcation in the structure of corporate innovation
strategies with respect to both leadership and coherence.
Keywords: Innovation leadership; Technological coherence; Absorptive capacity;
Economic performance.
JEL-classifications: O31, O32, L20, L65.

2
1. Introduction
In this paper, we examine how leadership in technological innovation and the
degree of coherence in profiles of technological capabilities are related to corporate
economic performance. We focus upon how the ability of firms to realize increased
economic value through innovation relates to corporate technological strategies in terms of
whether a firm is a leader or a follower, and in terms of whether it is more oriented to
coherent or to experimental combinations of activity. These are both issues that have been
centrally raised in the work of David Teece (Teece, 1986; Teece et al., 1994). We illustrate
our argument with reference to empirical evidence from the biotechnology industry, and
examine these questions through the lens of the competence-based theory of the firm.
In the traditional market-based general equilibrium framework, firms profit from
innovation by obtaining first mover advantage, through earning the rents associated with
positions of (temporary) market power. This interpretation, while fitting well with the
market structure framework in which the firm is primarily perceived as a price and output
decision-maker, loses the distinctiveness of Schumpeter’s (1943) notion of innovation as a
disequilibrium process in which firms profit from innovation by adding new elements of
value creation that expand the existing circular flow of income (Cantwell, 2002). As
suggested by Schumpeter, innovation brings in the most sustainable long term corporate
profits by facilitating an ongoing stream of long-term profit creation through the continued
expansion in the scope of the value creating activities of the firm. In this perspective, it is
more appropriate to view innovation as a problem-solving search that creates and
continually renews technological or social capability within firms, and not as a search for
positions of market power as such.

3
The introduction of a resource-based view of the firm by Penrose (1959), who
defined the firm as a pool of resources, has since given rise to a competence-based theory
of the firm, in which the firm is an agent that creates and sustains dynamic capabilities. In
the competence-based approach, the firm is understood in part as a bundle of technological
capabilities, as a locus for learning and problem-solving efforts, and as a qualitative
dynamic coordination mechanism that aligns the creation, acquisition, and coordination of
relevant knowledge (Loasby, 1999). In this event, the major issue in the ability of firms to
profit from innovation (or from positions of leadership in innovation) is not so much how
well firms exploit some specific new technology when considered in isolation, but is rather
how smooth is a firm’s internal creative process (although it often draws upon cooperation
with other firms or organizations) in adapting and extending its knowledge base, or more
especially, its technological capabilities. This approach thus immediately renders as crucial
the linkage between own-capabilities and what has become known as the absorptive
capacity (Cohen and Levinthal, 1990) to recognize and assimilate the knowledge of others,
which connects in-house research and development (R&D) and learning with the scope for
inter- firm exchanges in innovation.
As theoretical and empirical studies have shown, technological leaders are not
necessarily the firms that are most profitable. Some may even fail in competition with
followers in their market (Teece, 1986; Cantwell and Andersen, 1996). The varying
relative fortunes of followers- imitators versus leaders- innovators in different industries and
at different times can be explained in large part by the crucial role of complementary
capabilities. To obtain a certain technology, a firm can either develop it by relying
essentially just on its own efforts through in-house R&D, or it can develop the absorptive

4
capacity needed to acquire it externally from others and to adapt it so as to be able to
integrate the technology with its internal capabilities. Thus, complementarity can be
considered in two respects. Internally complementary capabilities support the success of
in-house innovation and allow the firm to profit from its leadership in innovation. Teece
(1986) has argued that certain co-specialized assets are necessary for successfully
commercializing an innovation. Followers that are better equipped with the crucial
complementary assets may obtain most of the profits from innovating, while the leader may
die if it lacks such complementary assets. The ability to establish and maintain leadership
thus depends on the overall technological complementarity of the profile of assets held by
the firm. Even when the firm acts as a follower, its ability to evaluate and utilize external
knowledge is also a function of the preexisting knowledge base of the firm, or its
“absorptive capacity” as defined by Cohen and Levinthal (1990). In her theory of the
growth of the firm, Penrose had emphasized that the boundaries of growth are set by the
technological base of the firm. The direction of corporate learning and growth, she argued,
is a path-dependent and resource-constrained process.
What is more, increasing technological complexity further blurs any distinction
between innovation and imitation (Cantwell, 2002). Imitation requires the related
absorptive capacity that comes from innovation, while innovation always incorporates
some elements of imitation. Thus, in the analysis of relative technological positions (as
opposed to the speed of market entry), the distinction between either leading or following
in innovation is a matter of degree rather than kind, and involves the relative balance
between innovation and imitation. Leaders have a balance that is more tilted towards
innovation, while followers have a balance tilted more towards imitation. The intertwining

5
between innovation and imitation indicates that leading or following in innovation, the
extent of coherence or experimentation in the creation of complementary capabilities, and
the related absorptive capacity all influence how the firm can profit from innovation. The
firm may profit as an innovative leader by maintaining a sufficient coherence in its profile
of complementary assets, or as a follower especially when this strategy is supported by a
strong absorptive capacity.
We use the biotechnology industry to study how the firm’s role as a leader and its
parallel role as a follower influence its economic performance. Following Cantwell and
Andersen (1996), we define the technological leadership as specialization by a firm relative
to others in its industry, in the fastest growing fields of activity amongst those that are most
relevant to technological development in that industry. Each firm’s pattern of technological
specialization is measured by an index termed as revealed technological advantage (RTA).
We measure the degree to which each firm’s internal capabilities are complementary
according to the established standards of the industry by the overall coherence (or goodness
of fit) of its corporate technological profile with the wider industry pattern of cross-field
connections. We calculated the firm’s absorptive capacity in the fastest growing fields by
the extent to which it is specialized in activities that are well related to these fields (using
the measure of technological relatedness between fields proposed by Teece et al., 1994).
This index is intended to capture the complementarity that confers a higher absorptive
capacity that enables both leaders and followers to execute their respective strategies more
effectively. The sample we use in the study includes all the companies that appeared in
NASDAQ Biotechnology 100 Index during 2000-2004 (which are the years available) and
companies listed in the NYSE in 2004.

6
Our study discusses only innovation and capabilities in technology, and thereby
neglects any explicit treatment of other connected functions (i.e. organization, marketing)
that are important. However, when the economic history of the past 100 years is viewed as
a whole, technological innovation is increasingly becoming the central organizing principle.
The steadily rising significance of innovative profits relative to the more traditional kind of
profits derived from the exercise of market power in a market for an established product
with a stable process of production, justifies our focus on this aspect of capabilities. Also,
R&D activities are the most prominent driver of the growth in the biotechnology industry
(US Department of Commerce, 2004). This new-born, fast growing and science-based
industry is a good candidate to study and test the cross-firm evolution of technological
activities.
Our central research question is: what is the relationship between the economic
performance of the firm and (i) strategies of being a technological leader versus a
technological follower, and (ii) strategies of established technological coherence versus
novelty in technological combinations? In answering this question, the paper provides three
main contributions to the literature on the competence-based theory of the firm. First, most
existing studies of the relative success of innovators- leaders versus followers- imitators have
either been essentially theoretical (usually based upon simulation exercises), or they have
used qualitative case study approaches. In this paper we present a quantitative investigation
that offers greater scope for empirically grounded generalizations of average tendencies
across firms with differing strategies in an industry. Second, the paper combines innovation
leadership, overall corporate technological coherence, and absorptive capacity in relating
economic performance to technological innovation, and we thereby incorporate dynamic

7
interaction effects between these factors in the processes of learning and innovating in the
firm. Third, we apply the relatedness measure of Teece et al. (1994) to an analysis of the
effect of overall corporate technological coherence (in addition to absorptive capacity)
within a firm. In particular, we are thereby able to distinguish between strategies of
established technological coherence that best exploit existing capabilities, as against
strategies of experimenting with a greater novelty of technological combinations that shift
the balance of learning towards more exploration in the boundaries of corporate
technological search (to adapt the terminology of March, 1991).
In the next section, we first elaborate upon the conceptual framework for the study
and propose how economic performance may be related with innovation leadership,
corporate technological coherence, and absorptive capacity. A description of the data and
sample selected appear in section 3, while the methodology and models follow in section 4.
We then present the empirical results in section 5. A discussion of the findings concludes.
2. Innovation leadership, technological capabilities and profits
Following Schumpeter (1943), we can distinguish between two means for creating
profits: profiting from market power in static market structures characterized by imperfect
competition, and profiting from innovation through creating new sources of value added
associated with some distinctive technological and organizational path for learning. While
the first realm is consistent with the traditional general equilibrium analysis, which treats
firms as homogeneous units in the process of economic exchange that decide prices and
quantities in the relevant market(s), firms in the second realm are reservoirs of
technological capabilities and devices for learning and development based on dynamic
capabilities. Innovation, which is an empirically exploratative (generally non-deductive)

8
and open-end novelty-creating economic activity, is more institutionally embedded in and
reliant upon a complex network of external knowledge connections and a flexible profile of
internal knowledge capabilities entailing knowledge transfers between firms, and between
firms and other organizations.
Following the classical tradition, Schumpeter was concerned with the problem of
economic development – of the creation of wealth – rather than with questions of the
simple allocation of resources (Langlois, 2002). In Schumpeter’s view, competition from
imitators following innovations gradually reduces the profits from innovation at an industry
level. His theory stresses solely the need to identify the original sources of innovation as
opposed to subsequent imitation in order to explain the tendency within markets for
innovative profits to be subsequently whittled away through technological competition.
Therefore, his approach was not concerned with the extent to which imitators might also
share in the distribution of profits from innovation. He did not consider at all the still more
fundamental challenge that imitators (since they also have some mix of innovation and
imitation) may themselves also be the origin of new sources of value added, and hence of
innovative profits.
Cantwell and Andersen (1996) show that although amongst large firms
technological leaders tend to retain a leadership position from one phase of development to
another, the fields in which other firms catch up faster exhibit the highest level of the
industry innovative profits and technology-based growth. This suggests that innovative
profits are created not just by “leaders” but also by “followers”. It will not necessarily be
leaders that earn the highest rewards from innovation and hence enjoy the fastest growth,
and the existing historical evidence does indeed suggest that while sometimes leaders have

9
an advantage in subsequent performance, sometimes followers have the competitive edge
(Teece, 1992; Andersen and Cantwell, 1999). If innovation is profitable at the very
beginning, followers may only grab a smaller share of profits compared to leaders.
However, when innovation is risky and costly and when external inter- firm learning is high
relative to internal intra- firm learning, first movers in the innovation may be at a
disadvantage, while the followers may learn from the mistakes of leaders and earn larger
profits (Silverberg et al., 1988).
In this respect, the sharpness of Schumpeter's distinction between entrepreneurial
innovator- leaders and follower- imitators may be unhelpful. Although social capability is
created through internal learning processes within firms such learning is interactive and
involves continuous exchanges of knowledge, whether through deliberate cooperation in
learning or independent exchanges through licensing, imitation or the like (Cantwell and
Barrera, 1998). Defining innovation to be what is new to a firm with its own differentiated
area of expertise or what is new to a particular local context rather than as something new
to the world as a whole (Nelson, 1993), the most effective corporate innovators are not
necessarily the technological leaders whose expertise is focused on the leading edge fields
as such. They may be other firms that have found the most productive industrial
applications of the leading edge technologies, which applications themselves require further
innovation and other supporting capabilities - linked in part to the process of critical
revision of new technologies which enhances their workability and effectiveness, as
emphasized by Usher (1954) and Rosenberg (1982).
The blurring of the boundary between innovators and imitators is entirely
intelligible in terms of the most recent literature on the evolutionary approach to

10
technological change which has stemmed from the work of Nelson and Winter (1982) and
Rosenberg (1982), and in the process rediscovered the contribution of Penrose (1959). In
the evolutionary theory of technological change innovation is always context-specific and
localized since learning builds incrementally through guided experimentation on what is
already known, and so capabilities – including the capabilities to envisage new productive
opportunities – are always context-specific.
Lee and Harrison (2002) show by developing a dynamic model with adaptive and
experimental learning that it is plausible for two bifurcating strategic groups to emerge in
an innovating industry, which two alternative corporate strategies are defined by a
polarization across firms in their respective choices of the allocation of resources between
two R&D options – innovation and imitation. The critical firm strategic decision in this
respect involves the allocation of R&D investment between leading in innovation or
following, and according to this argument to be successful the firm needs to demonstrate
clear consistency in its chosen strategy, because of the highly uncertain nature of R&D
activities which confer high potential returns but also high risk. The least effective
“strategy” is thus being stuck in the middle, neither consistently leading nor consistently
following, and thus without a clear corporate innovative strategy. Crucial to the
bipolarization of firm strategies in the Lee and Harrison argument is that when firms
incrementally adapt their capabilities (as they do, according to the evolutionary approach
summarized earlier), incumbent firms will tend to become locked into a development path
in which R&D resources are either committed more to innovation (amongst those that
become the most successful innovators from the outset), or alternatively more to imitation
(amongst those whose initial innovations perform less well or fail).

11
The capabilities, organizational routines and search procedures that are required for
a strategy of leading in innovation and a strategy of following may be different. If the
capabilities and procedures for learning required are sufficiently distinct, then given that
resources for growth and development are limited (as stressed originally by Penrose), firms
may well have to make a clear strategic choice between these two alternative strategies.
Trying to maintain a foot in both camps risks doing neither well, once we recognize that
there is some element of trade off between innovating in a leading edge area and innovating
more in the applications of leading edge developments through fusing them with
technologies in other related fields. In this case two distinct strategies for innovative profit
creation may emerge, such that the relationship between technological leadership and
economic performance becomes U-shaped.
Hypothesis 1: Both firms with high leadership in innovation and firms with low
leadership (i.e. followers) tend to perform better than firms that are neither leaders nor
followers.
In his seminal contribution, Schumpeter (1934) defined innovations as “new
combinations” of productive means that entail some element of discontinuity from the past.
In building upon this conceptualization of innovation, we can recognize that such new
combinations may entail differing extents of discontinuity from the technological and
associated organizational methods of the recent past. On the side of lesser discontinuity
from the past, one strategy for firms is to focus their learning on intensively exploiting an
established relatedness between two fields of technological activity, to develop new
combinations that adapt the existing strengths of the firm in spanning these two fields of
endeavor. On the side of greater discontinuity or challenge, an alternative strategy for firms

12
is to experiment with potential new combinations of fields that have as yet been relatively
unexplored, and so between which fields no relatedness has thus far been established. This
too suggests a possible bifurcation of corporate strategies, between a strategy of learning in
and around combinations that are known to be coherent, as opposed to an experimental
strategy of attempting to establish more thoroughly novel combinations of technology.
Thus, the extent of corporate technological coherence reflects a further aspect of a
firm’s innovation strategy. The degree of corporate technological coherence exhibited by
each firm’s profile of activity represents the overall complementarity of the firm’s
technological capabilities, which composition is the outcome of a process of learning and
accumulation through the firm’s internal technological activities. Firms internally develop
their competence in two dimensions: deepening, by exploiting established strengths more
thoroughly, and widening, by exploring novel combinations that expand upon existing
strengths (March, 1991; Breschi et al., 2000; Cantwell and Mudambi, 2005). A deepening
pattern of innovative activities involves the continuous consolidation of a closely related
technological profile of activities that have been accumulated through the highly focused
exploitation of existing technological capabilities. A widening pattern of innovative
activities, in comparison, involves a continuing enlargement of the technological base
through exploring novel potential combinations that incorporate developments from new
technological fields. Especially in an R&D-intensive industry, firms are confronted with a
strategic decision between two options on R&D investment: exploiting more intensively an
expertise in currently established combinations of technologies, or exploring new forms of
more experimental technological combination.

13
On the one hand, for relatively stable technology fields, like those of the old
pharmaceutical industry, the direction of technological advancement may become
reasonably well defined, such that we can expect a convergence of firms around a primary
or dominant strategy of a clear focus on a consistently coherent path in continuing
technological exploitation and absorption based on their existing technological profiles
(Cohen and Levinthal, 1990). As shown in previous literature, the world’s largest firms
tend to display coherence in the ir patterns of corporate technological diversification (Pavitt
et al., 1989; Granstrand and Sjölander, 1990; Grandstrand et al., 1997).
However, on the other hand, matters may be quite different in technology areas that
are experiencing unexpected turbulence (Bosch et al., 1999), like the “therapeutic
revolution” spurred by the discovery of rDNA technology in the pharmaceutical and
biotechnology industry. The rise of a new, complex technology system may require an
industry group to shift the balance in its technological learning towards greater exploration,
which involves introducing new technological fields and deriving novel distinct
combinations of existing capabilities. In this event, in terms of the evolution in the
structure of the industry’s population of firms, while one group of firms may continue to
emphasize technological coherence, a second strategic grouping may emerge that
emphasizes instead a greater element of experimentation or exploration in technological
combinations. The efficiency of relying on the relatedness of the current technological base
may not be the only viable strategy in a turbulent technology environment, such as that
characterized by the newly emergent biotechnology industry. Exploiting technology only
in those areas that lie closest to its existing expertise may cause the firm to fail to catch on
to radical shifts in the industry, or to miss other potential windows of opportunity (Zahra
14
and George, 2002). Research in the area of cognitive and behavioral sciences suggests that
diversity enhances a firm’s learning and innovation abilities in two ways: through the
experiences gained by learning dissimilar knowledge, and through the creation of novel
associations with and linkages to existing knowledge (Cohen and Levinthal, 1990).
Thus, in a turbulent knowledge environment, at least some firms are likely to make
greater efforts to increase the scope and the extent of flexibility in the dimensions of their
technological capabilities, which being experimental may not conform to the norms of
coherence as established from the recent history of the industry, but which novelty makes
these firms more potentially adaptable to a changing environment, and enhances the
likelihood of their generating new and unexpected combinations from their existing
capabilities. Yet here too the capabilities, organizational routines and search procedures
that are required may be different for a strategy of further exploiting established
technological coherence, as opposed to a strategy of experimenting with more exploratative
new combinations of technological effort. In other words, we might again expect that two
distinct strategies for innovative profit creation may emerge, where in this case the
relationship between established technological coherence and economic performance
becomes U-shaped.
Hypothesis 2: Firms with either highly coherent or highly experimental
combinations of technological capabilities are likely to perform better than the firms with
neither coherent nor experimental combinations of capabilities.
Technological change is always context-specific and localized (Nelson and Winter,
1982). A technology developed in one context requires the cost of further innovation to be
transferred into some other (Teece, 1977), but the cost or difficulty of subsequent

15
innovation depends upon the initial degree of technological relatedness or complementarity
between the combination of activities in the originating and in the recipient contexts
(Cantwell and Barrera, 1998), and upon the degree of absorptive capacity in the recipient or
imitating firm (Cohen and Levinthal, 1990). When firms have a higher degree of
technological complementarity between their profiles of specialization and the external
innovation, they will have a greater absorptive capacity with respect to being able to take
advantage of the knowledge being created by others. In systemic networks of inter-
company interaction in innovation the greatest profits are likely to accrue to firms that have
the best fit between their initial capabilities and the fields of the greatest new opportunity,
as opposed to firms that are the first to initiate a new line of innovation. The greatest
benefits do not necessarily go to the “first to discover” or the “first to commercialize” a
core technology with important implications. Instead, the greatest innovative profits may
rather accrue to firms whose social capabilities are best adapted to absorb, and to further
develop and entrepreneurially to apply, the new lines of innovation that have emerged from
the fields of greatest technological opportunity to novel contexts, and in new combinations
with other branches of (and perhaps with more traditional fields of) technology.
Absorptive capacity matters for all the strategic groups identified earlier, although
for somewhat different reasons. For leaders focused on the fastest growing fields
absorptive capacity is needed to obtain knowledge spillovers from other leaders with a
related focus, and from followers developing applications that lead to a search for
adaptation that feeds back into efforts in the fastest growing fields themselves. Followers
are characterized by a relatively greater need for imitation, so they need especially a
capacity to absorb the pioneering achievements of leaders in the fast growing fields.

16
Coherent firms need absorptive capacity for those of the fast growing fields that are most
related to the structure of coherence on which they rely. More experimental firms need
absorptive capacity in the fast growing fields that are most related to the particular new
combinations that they are exploring. In general, all firms need absorptive capacity since
they all have some mix of innovation and imitation (as argued earlier), and the ease of
imitation always depends upon the extent of absorptive capacity.
Hypothesis 3: Absorptive capacity related to the fastest growing fields of
innovation for their industry is critical for firms to profit from innovation. Firms with the
highest absorptive capacity for the fields of the fastest growing new techno logies that are
relevant to their own existing capabilities are more likely to be able to achieve economic
gains from their innovations.
3. Data and Sample
3.1 Patents as an indicator of technological capabilities
Different indicators have been applied in studying the technological activities of
firms. Disaggregated R&D information is rarely available at the firm level, and when it is,
it is generally broken down by corporate division rather than by the type of activity. Some
researchers use innovation survey data, which is hard to generalize or again to categorize
into detailed fields of corporate specialization. These weaknesses of R&D and innovation
survey data explain the relative success of patents as an indicator of the distribution of
innovation activities across and within firms, in comparative context. The United States
Patent and Trademark Office (USPTO) keeps records of patents granted since 1790. More
important, USPTO provides a consistent technology classification for each patent granted.
The completeness, continuity, and consistency of the patent data provide us with a good
17
indicator of corporate technological capabilities, especially for larger firms, and especially
in science-based industries.
However, there are some potential problems in using patents. Technologies from
different disciplines may be closely integrated. And arbitrariness cannot be avoided in the
division between certain patent classes (Cantwell, 2004). Even without the problems in
patent classifications, it is necessary to recognize that patents have limited use among
smaller firms outside the science-based industries. Moreover, the codified knowledge
embodied in patents usually cannot be readily translated into production and
commercialization, but are rather indicative of knowledge inputs that are needed in the
processes of learning which generate the tacit capabilities of firms, and which knowledge
can only be used effectively in combination with such capabilities.
We rely on the methodology of Cantwell (2004) to alleviate the difficulties in
directly using the patent classification system by regrouping the 401 patent classes of the
USPTO classification system into 56 technology fields. Since we are studying a single
industry here, we further divide the Biotechnology and Pharmaceutical field into 4
subfields. Each patent is assigned to a technological field. Some technology fields do not
appear among firms of the biotechnology industry. To alleviate the small number problem
in using patent data, instead of studying distributions of activity across all 56 technological
fields, we only study the 25 most active technological fields, which have accumulated over
100 patents applications by our selection of firms in the US biotechnology industry
between 1985 and 2004.
3.2 The sample

18
The sample includes all the companies that appeared in NASDAQ Biotechnology
100 Index during 2000-2004 (which is the period available) and companies listed in the
NYSE in 2004. The initial sample includes 230 public biotechnology and pharmaceutical
companies (including foreign companies). After excluding companies that do not have any
patents, the final sample consisted of 202 companies.
We treat the 202 companies as a representative sample for the U.S. biotechnology
industry1 and use their patenting activities between 1985-2004 to calculate industry
reference points, including the patent growth rate of each technology field (to ascertain
which are the fastest growing fields for the industry as a whole), and the extent of
technological relatedness between any two fields.
Furthermore, we study corporate economic performance in three periods: 1990-
1994, 1995-1999, and 2000-2004. The patenting activity of firms during each of these
periods is used to depict the composition of their firm level technological characteristics at
the equivalent times. We study the economic performance only of firms that meet the
following requirements: (1) Only firms incorporated after 1976 are included. Owing to this
time constraint, we concentrate on newly established biotechnology firms. The first US
firm to exploit rDNA, Genentech, was established in 1976. Older firms, such as traditional
pharmaceutical firms, are also doing R&D in biotechnology. However, both their
knowledge bases and their market characteristics are quite different from those of the new
biotechnology firms. (2) We also suspect that very new firms will be different (subject to a
much higher variance in performance), and they may well present measurement problems
due to insufficient numbers of accumulated patents. For example, it may be inappropriate
1 According to Ernst & Young’s 2004 biotechnology industry report, there are 1,473 biotechnology companies in the United States, of which 314 are publicly held. It is reasonable to believe that the sample is well defined and representative of the U.S. biotech industry.

19
to study the technological capabilities of a one-year-old company by the patents for which
it has applied so far. Thus, we relied on the criterion of having a minimum of 5 years in
operation to select companies for this performance study. That is, companies in the 1999
sample should have been incorporated in or before 1994. (3) Firms needed to have applied
for patents in more than one field during the relevant sample sub-period. (4) We needed
firms for which financial data, including annual stock prices and total sales were available
from Computstat or Mergent. Selecting in accordance with these criteria, we have 17
companies for 1990-1994, 55 for 1995-1999, and 83 for 2000-2004. Because of the
administrative time lag between patent application and patent grant, we have been cautious
and so included a dummy variable for the 2000-2004 period.
3.3 Data
We used Delphion to collect patent data, including the patent number, the date of
granting, the date of filing, and the current U.S. classification for each patent. There are
two types of classifications for US patents: the US classification and an International Patent
Classification. We used the US classification in the study because it better reflects the
technological content of patents. The patent portfolio of each firm has been consolidated
by corporate group, such that it includes all patents assigned to itself and to all of its
subsidiaries during a sample period. We used Mergent and SEC filings to identify
companies’ subsidiary structure in each subperiod. The total revenues and R&D
expenditure were manually collected through online editions of Mergent. Stock prices
were taken from Compustat through WRDS.
4. Model and methodology

20
4.1 Dependent variable: economic performance as measured by the annual growth
rate of stock prices
Since most biotech firms have been incurring accounting losses, earnings per share
or any other index for economic performance related to net income may not be meaningful
here. Also, in this industry the value of firms is essentially the value of the technological
assets they generate and investment money was raised on the basis of promise in the future.
An index for each firm’s long run economic performance is thus more appropriate here.
Research in finance has shown that the stock price tends to be closely correlated with future
earnings. In our sample, technological performance as measured by the annual growth rate
of patents of biotech firms shows a positive and significant relationship with the growth in
their annual stock price. We thus use the average annual growth rate of the stock price
during each sub period as an indicator of the firm’s economic performance.
The time spans involved here were 5 years, and observations were recorded
annually within these periods. Assuming that the “true” growth during a period was
uniform and exponential but each observation was subject to multiplicative error, we use
the following regression fit to a uniform growth model (Rumelt, 1974) to estimate the
annual growth rate of the firm’s stock prices:
3,4,5. 2, 1,=for t,~~γgt
t AeS =
where tS~
is the observed annual average stock price, g is the ‘true’ uniform growth rate to
be estimated, γ~ is a random error term with a mean of one, and A is a constant. Taking
the logarithms of the above equation we have
3,4,5. 2, 1,=for t,~log~
log ε++= gtAS t
where ε~ is the now additive error with a zero mean.

21
4.2 Independent variable: technological leadership
As in Cantwell and Andersen (1996), we define the technological leadership as
specialization by a firm relative to others in its industry, in the fastest growing fields of
activity amongst those that are most relevant to technological development in that industry.
In the way in which corporate technological leadership has been defined here, smaller firms
may be leaders if they are particularly oriented towards development in the fastest growing
areas, although the absolute level of their activity in these fields may be less than that of
giant companies which specialize instead in mature technologies and so act as followers.
Hence, giant corporations may be either technological leaders or followers; what matters is
neither their overall size nor their overall degree of specialization, but rather the actual
composition or profile of that specialization – that is, whether their resources are especially
geared towards development in the fastest growing fields.
As a leader, a firm is particularly specialized in the fastest growing areas which
have the greatest impact on the biotechnology industry. Our first objective is then to
identify the fastest growing technological fields. We compare the number of patents in
each field applied by the firms during two periods: 1985-1992 and 1993-2000.2 The
growth rate of patents in Field i is measured as follows
)1000( 1
12
+−
=i
iii P
PPGrowthRate
where 1iP is the number of patents applied by all firms in Field i during 1985-1992 and 2iP
is the number of patents applied by all firms in that field during 1993-2000. Adding 1,000
2 We include only the patents that were applied for before 2000, considering the time lag between application and assignment of patents.
22
in the denominator avoids the exaggeration in the growth rate that would otherwise be
caused by having a small number of patents during the first period.
[Table 1 here]
For the purposes of identifying the structure of corporate technological leadership in
the biotechnology industry, we rank the growth rates of patenting in the 25 fields as shown
in Table 1. The “leadership” of a firm is measured by the distribution of its patenting
activity across fields, relative to its rivals in the same industry. Each firm’s pattern of
technological specialization is measured by an index termed as revealed technological
advantage (RTA). This index measures the concentration of the firm’s technological
specialization in favored fields. The RTA for each firm’s particular technical field is
defined by the firm’s patent share of US patents applied for3 in that field by all firms,
relative to the firm’s overall share of all US patents applied for by all the firms in the
industry. Specifically, denoting as ijP the number of US patents applied in field i by firm
j in a particular industry, the RTA index is defined as follows:
∑ ∑∑∑
=i i j ijij
j ijij
ij PP
PPRTA
/
/
Cantwell and Andersen (1996) point out that the reliability of the RTA index may be
harmed by small numbers of patents in total in certain categories. Regrouping patents into
the 25 most important fields is one of the ways to solve this problem.
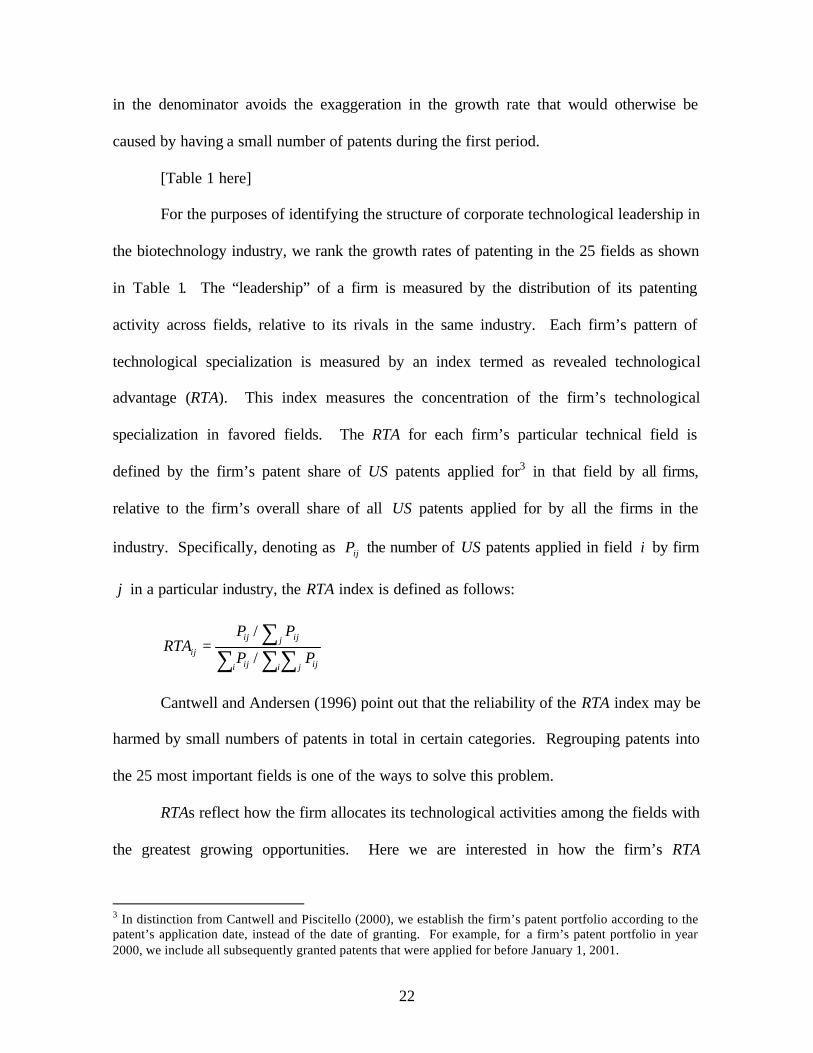
RTAs reflect how the firm allocates its technological activities among the fields with
the greatest growing opportunities. Here we are interested in how the firm’s RTA
3 In distinction from Cantwell and Piscitello (2000), we establish the firm’s patent portfolio according to the patent’s application date, instead of the date of granting. For example, for a firm’s patent portfolio in year 2000, we include all subsequently granted patents that were applied for before January 1, 2001.

23
distribution across the 25 fields matches with the industry growth rates of these fields. The
more the firm’s RTA distribution matches with the industry growth rate of the 25 active
fields, the more of the firm’s resources are oriented towards the fields with the greatest
opportunities, and the higher the firm’s leadership ranking in innovation. The leadership of
firm j is measured by the coefficient of correlation jβ in the following regression. jβ
measures the match between the firm’s specialization and the industry-wide fastest growing
fields. It shows how Firm j ’s competitive advantages in different technological fields are
linearly related with the growth rate in these fields in the industry. If a firm focuses on
patenting in the fastest growth fields, it has a higher position in the “leadership” of
technological innovation in the industry.
25. ,… 2, 1,=ifor ,0 iijij uGrowthRateRTA ++= ββ
If jβ =1, it implies that Firm j innovates across fields in the same proportions as
the industry does. If jβ >1, it implies that Firm j focuses more on the fastest growing
fields than on average across firms in the industry. (They are innovating in the same
direction as the industry.) If 0< jβ <1, the firm focuses more on the faster growing fields
than the more slowly growing fields, but it is not as focused as are firms on average in the
industry. If jβ <0, the firm specializes more in the slower growing fields. We define all
the firms with jβ >1 as innovation leaders and the others as followers.
4.3 Independent variables: technological complementarity in the measurement of
corporate technological coherence and absorptive capacity.
As suggested by Teece (1986), complementary assets are crucial in innovation.
Followers with complementary assets can easily imitate or learn from leaders and accrue

24
profits from innovation. Thus there is a need for the innovating firm to establish a prior
position in these complementary assets. We study two types of complementarity here. One
is the overall coherence of the firm’s technological capabilities. It measures the firm’s
balance between exploration and exploitation in internal innovation. The other is the extent
of specialization in those fields that are most related to the fastest growing fields, or the
firm’s absorptive capacity for the fastest growing fields. This index aims to measure the
capacity for imitation or follow-on applications of developments that derive from the fastest
growing fields.
To measure both overall coherence and absorptive capacity, we need first to identify
the relatedness between any two technological fields in the biotechnology industry. We
adopt the ex post measure of technological relatedness between fields proposed by Teece et
al. (1994). The relatedness between any two technology fields i and k ( ikR ) is:
ik
ikikik
nR
σµ−
=
Where: =ikn actual number of linkages across firms between technologies i and k ;
=ikµ the expected number of linkages between technologies i and k under
the hypergeometric distribution; and
=ikσ standard deviation of the number of linkages under the hypergeometric
distribution.
To calculate relatedness between each pair of technology fields, we include all
biotechnology and pharmaceutical firms listed in either NYSE or included in NASDAQ 100
biotech- index during 2000-2004. After deleting 28 firms without a single patent and 16

25
firms that were not technologically diversified, 186 firms remained in the sample. These
firms are active in 56 technological fields, with a total of 72,906 patents.
Of the 3,136 possible linkages between pairs of technology fields, 2,740 were
actually observed in practice. A measure of relatedness ( ikR ) was calculated for each such
pair. ikR ranged from 13.6015 to -1.6212. The average relatedness was 3.64 and the
standard deviation was 2.62. Thus, the assumption of randomness can be rejected, in line
with what has already been found by Teece et al. (1994) and Breschi et al. (2004).
Teece et al. (1994) suggested two measures for corporate coherence, the average of
the weighted-average relatedness (WAR ) and the average of the weighted average
relatedness of neighbors ( ).WARN We use the WAR in calculating corporate technological
coherence.4 For a firm with m technologies, in technology i it has ip patents, which field
has an industry-wide relatedness ikR with technology k . The weighted-average
relatedness kWAR of technology k to all other technologies within the firm is defined as
follows:
∑∑
≠
≠=ik i
ik iikk p
pRWAR
Corporate technological coherence is then the firm’s average WAR over the 25 active
technical fields (WARAVG).
4 As suggested by Breschi et al. (2004), in measuring global technological coherence, the WAR index is simple but its value depends on the number of technology fields in which the individual firm is active. The more technological fields the firm adds to its portfolio, the more “weak links” between those fields will be added to the index, thus lowering its value. WARN avoids this issue by considering only those links that belong to the closest neighbors. We argue, however, that excluding “weak links” is a somewhat arbitrary loss of information. Moreover, if a “weak link” is weak because a new small field has been added then the weight assigned to combinations involving that field will be low. But for the fields with large numbers of patents then surely we should be interested in a wider measure of their relatedness with the full spectrum of other activities of the firm, rather than an overly narrow measure.

26
The most prominent opportunities for innovation exist in the fastest growing fields.
The benefits that followers can obtain largely depend upon their absorptive capacity for
these fastest growing fields. To identify the fastest growing fields, we select the top 9
fields (out of 25) according to their patent growth rates shown in Table 1. The relatedness
of each of the 25 fields to the 9 fastest growing fields was measured by the WAR of each of
the 25 fields to the 9 fastest growing fields.5 In order to give greater weight to the
absorptive capacity in the fastest growing fields that are of greatest relevance to each
individual firm, we use an individual firm’s patents in each of 9 fastest growing fields as
the weights in calculation of its WAR. Absorptive capacity for the fastest growing fields is
measured by the correlation coefficient from the regression of the firm’s RTA distribution
across the 25 fields on its WAR between the 25 fields and the 9 fastest growing fields.
25. ,… 2, 1,=ifor ,0 iijjij vWARRTA ++= γγ
The magnitude of jγ shows how strongly that firm j ’s technological specialization
is related to the 9 fastest growing fields. A higher jγ indicates that the firm has a higher
absorptive capacity (ACWAR) for the fastest growing fields.
4.4 Control variables: core field participation, firm size and year
Cantwell and Santangelo (2000) have contended that there may be some categories
of fast growing technologies in which specialization can bring rewards in general
integrative capacity, where these fast growing technologies are themselves core to the
ability to fuse or combine previously separate branches of innovative development – which
is the facility provided by information technology (IT) today, much in the way that
5 If it is one of the 16 fields that are not among the fastest growing its WAR is the weighted average relatedness with all 9 of the fastest growing fields, while if it is one of the 9 then its WAR is weighted average relatedness with the other 8 (excluding itself).

27
machinery technology did for much of the nineteenth century (Rosenberg 1976). However,
it has also been argued that being locked into formerly successful general purpose systems
(or core fields which grew rapidly in the past) may be negatively related to performance
once there is a substantial shift in the underlying technological paradigm (Rosenberg, 1976;
Cantwell, 1991).
Hence, we need to consider how the firm’s technological specialization is related
with the fields that are most central to its industry. A firm may innovate in the most
dominant fields in terms of their absolute level of technological activity in the industry, or it
may innovate in a niche position in the industry. There is empirical evidence that either of
these strategies may be feasible (Pavitt, 1992; Pavit and Patel, 1997). Thus, we need to
control for the extent of the firm’s specialization in fields that attract the largest absolute
levels of technology activity. This is measured by regressing the firm’s RTA in each of the
25 technological fields on the shares of the industry’s total patenting in the corresponding
fields.
25. ,… 2, 1,=ifor ,0 iijij wPSRTA ++= ρρ
where ∑∑∑=j ijij iji PPPS / . If jρ >0, it implies that Firm j is relatively more
specialized in the core fields of the industry, thus we may call it a “core player;” if jρ <0, it
implies that Firm j innovates more in the niche fields of the industry, thus we might call it
a “niche player”. Thus, jρ denotes the extent of core field PARTICIPATION.
The absolute size of the firm may also have an impact on its economic performance.
In this industry, larger firms tend to outperform smaller firms. Therefore, we included the
logarithm of total revenues to control for the size (SIZE). Also, two dummies (Year99 and

28
Year04) were included to control for fixed effects associated with the differences between
specific periods.
5. Results
Table 2 and Table 3 show the descriptive statistics and the Pearson correlation
matrix of independent and control variables.6 The results of the econometric estimates of
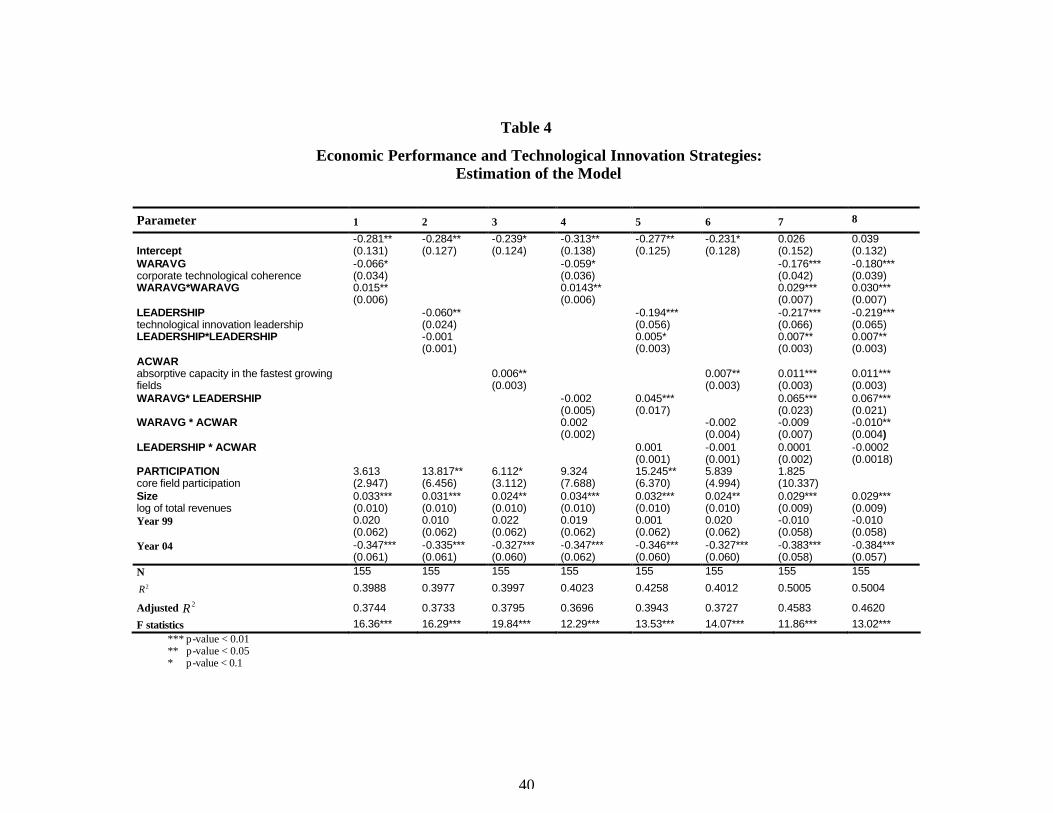
the models are set out in Table 4. Table 4 shows the estimates of the coefficients of the
independent variables, their standard errors, and the individual and joint significant levels.
[Table 2 here]
[Table 3 here]
[Table 4 here]
The main objective of this study is to highlight the role played by corporate
strategies for technological innovation leadership and complementary capabilities
(coherence and absorptive capacity) in the economic performance of firms. We ran 8
different models with various combinations of variables as shown in Table 4 to test the
effects of innovation leadership, corporate coherence and absorptive capacity.
6 Observing that the Pearson correlation between Leadership and Participation is as high as 0.888551, we must allow that it may cause a problem of multicollineaity. The model diagnostic tests for multicollinearity, though, indicate that multicollinearity is not a concern for these two variables. For all the models including Participation and Leadership in Table 4, only Model 7 shows that variation inflation factors (VIF) for Leadership and Participation are greater than 10 and the conditional numbers are greater than 15, which implies that Model 7 may suffer from a multicollinearity problem (although it is may caused by including interaction terms between variables.) The regression results do not change significantly (as shown in Model 8) if we exclude Participation. In fact, multicollinearity tends to cause the t-statistic to be biased toward insignificance because of the larger standard deviation of the estimates. Thus, if the t-statistic of a variable is significant in a model with a multicollinearity problem, we can tell for sure that the independent variable has a significant effect. To further investigate this problem, we also ran all the other models without Participation. Two of the rudimentary models for Leadership showed that the previously significant effect of Leadership somehow disappeared, which should not be the consequence of multicollinearity since that should work the other way if there was a problem. It may suggest that in the pre-models without considering all the combinations of strategies, Participation works as a proxy variable. Since Leadership shows no effect if we exclude Participation but shows a significant effect with Participation, these two variables may be confounding each other (since their effects on performance run in exactly opposite directions), and so it is necessary for us to control for one in order to check the effect of the other.

29
Model 5, Model 7 and Model 8 in Table 4 show that leadership has a significant and
U-shaped quadratic relationship with the annual growth rate of stock prices. The firms that
specialize in the fastest growing technological fields in the industry experienced higher
economic performance, while the firms that do not focus their resources on the fastest
growing fields also received higher market evaluation of their economic performance. The
firms with poorest economic performance were those stuck in the middle. As suggested by
Lee and Harrison’s (2002) simulation study, a bimodal distribution of performance is
evident when ordering firms by their degree of innovative leadership, which is likely to
lead over time to a bifurcation of strategic groups into leaders and followers, since these are
the most economically successful strategies (Hypothesis 1). As a follower, the firm has
lower uncertainty about its R&D activities and its profits are more secure. As a leader, the
firm faces greater risk but higher profits when they are realized. In Model 2, in which we
consider leadership as the only independent variable, leadership exhibits a negative and
significant linear effect on the growth rate of stock prices. This is the consequence of
failing to control for the roles of coherence and absorptive capacity, on which the success
of followers depends.
Table 4 shows that corporate technological coherence also has a significant and
quadratic effect on the economic performance, which suggests again a bifurcation structure
in corporate innovation strategies, in this context involving the relative balance between
exploitation and exploration in constructing new combinations (Hypothesis 2). To achieve
superior economic performance, a firm may allocate its R&D investment mainly to deepen
and exploit existing capabilities. There is much evidence in the literature of this innovative
strategy (Pavitt et al., 1989; Granstrand and Sjölander, 1990; Grandstrand et al., 1997). The

30
firm may also search for new fields to enlarge its technology scope by bringing in as yet
relatively unexplored combinations. This is consistent with the findings of Bosch et al.
(1999) and Gilsing and Nooteboom (2006) that for newly emergent technologies like those
in the biotechnology industry the focus of a firm’s knowledge absorption may shift more
towards knowledge exploration rather than exploitation. With all the uncertainties and
opportunities, a firm with a larger scope and greater flexibility in its technological profile is
more likely to create new values.
The interaction between these two innovation strategies is significant and positive
(Models 5, 7 and 8). That is, at the same level of leadership, coherent innovators are likely
to outperform experimental innovators; given the level of corporate technological
coherence, leaders tend to grab more profits than followers. So there does appear to be
some premium associated with innovative leadership when it is combined with a strategy of
technological coherence, or in other words for leaders that hold a coherent combination of
related capabilities around the fastest growing fields in which their activities are focused.
In the context of the above two innovative strategic choices between leading or
following and between being coherent or experimental, having absorptive capacity will
always be important no matter which strategic direction the firm adopts. Firms with
absorptive capacity related to the fastest growing technological fields show a superior
performance in the growth of stock price. It is thus critical for firms to establish absorptive
capacity no matter where they decide to position themselves strategically in the
composition of innovative activities in the industry.
The control variable for the extent of core field participation has a positive and
significant coefficient, implying that the firms that are core participators in the industry

31
tend to exhibit a higher economic performance than niche participators in the industry.
There may exist strong opportunities for horizontal technological combinations and
diversification, as it has been argued were obtained in some science-based industries
historically (Pavitt, 1992). However, core participation plays no significant role in the most
comprehensive Model 7, which suggests that it may also be acting as a proxy for excluded
effects in sparser model specifications. SIZE is positive and significant. Recall that SIZE is
calculated as the logarithm of total revenues in the period of interest. Thus, the firms with
higher total revenues receive higher economic evaluation in the stock market. The dummy
for the Year 2004 is significant and negative, which may show the effect of administrative
time lags between patent application and grant.
6. Discussion and conclusions
The question we have addressed in this study is how the firm’s strategies with
respect to leadership in innovation and coherence in technological capabilities are related to
the likely progress in the market’s evaluation of a firm’s value.
Previous studies have suggested that either leaders or followers may profit from
innovation so long as they possess the appropriate complementary capabilities (Teece,
1986). It has also been suggested that firms in most industries will converge towards some
pattern of technological coherence that is representative of the characteristics of innovation
in the relevant industry (Teece et al., 1994). Our findings suggest that at least in the
biotechnology industry market performance and selection may lead to a bifurcation of firms
into strategic groups not only with respect to innovative leadership, but also to corporate
technological coherence. That is, owing to the performance benefits of both high or low
leadership and high or low coherence, a selection mechanism may operate that would drive
32
firms towards clusters in one of four viable strategic combinations, as illustrated in Figure
1. Firms that evolve towards being Established Leaders, Radical Innovators, Traditional
Imitators or Boundary-Spanning Followers may all tend to survive and to perform well.
[Figure 1 here]
Although in a stable environment firms may generally tend to build upon coherent
technological bases, in a faster growing industry like that of biotechnology, it is possible
that firms select an alternative and a more experimental technology base, but can still
perform well. Innovation involves bringing about effective new combinations. To create
innovative profits by introducing new streams of value added – and hence to realize
performance benefits – firms may diverge to some extent in some consistent but unforeseen
way from the typical patterns inherited from the past.
Absorptive capacity related to the fastest growing fields turns out to be the one
systematic influence upon the ability of firms to profit from innovation in the industry. No
matter which strategic group the firm has evolved towards, a prior position in the requisite
complementary technologies is always an important condition for firms to execute their
respective strategies successfully.
Our results have further shown that although much of the literature has rightly paid
attention to the specific issues raised by the importance of being specialized in technologies
which are at the leading edge of development or at the technological frontier (i.e. a focus on
technological leadership); or to the importance of accumulative learning, inherited routines
and expertise (reflected in a firm’s overall coherence and absorptive capacity); or focused
on the issues of size or breadth in the range of technological specialization; that it may be
misleading to separately focus on just one of these factors treated in isola tion. To obtain

33
innovative profits, a firm is likely to benefit by clearly establishing itself as either as a
leader or as a follower, and by pursuing a path of technological search that is either
coherent or experimental, while always relying upon absorptive capacity for knowledge
spillovers from the fastest growing fields in its industry.

34
References:
Andersen, H.B., Cantwell, J.A., 1999. How firms differ in their types of technological competence, and why it matters. University of Manchester ESRC Centre for Research on Innovation and Competition Discussion Papers, no. 25.
Bosch, F.A., Volberda, H.W., Boer, M.D., 1999. Coevolution of firm absorptive capacity and knowledge environment: organizational forms and combinative capabilities. Organization Science 10(5), 551-568.
Breschi, S., Lissoni, F., Malerba, F., 2004. The empirical assessment of firms’ technological ‘coherence’: data and methodology, in Cantwell, J.A., Gambardella, A., Granstrand, O. (Eds.), The Economics and Management of Technological Diversification. Routledge, London and New York, pp. 68-96.
Breschi, S., Malerba, F., Orsenigo, L., 2000. Technological regimes and Schumpeterian patterns of innovation. The Economic Journal 110 (463), 388-410.
Cantwell, J.A., 1991. Historical trends in international patterns of technological innovation, in James Foreman-Peck (Eds.), New Perspectives on the Late Victorian Economy: Essays in Quantitative Economic History. Cambridge: Cambridge University Press, pp. 37-72.
Cantwell, J.A., 2002. Innovation, profits and growth: Penrose and Schumpeter, in Pitelis, C. (Ed.), The Theory of the Growth of the Firm: The Legacy of Edith Penrose. Oxford University Press, pp. 215-248.
Cantwell, J.A., 2004. An historical change in the nature of corporate technological diversification, in Cantwell, J.A., Gambardella, A., Granstrand, O. (Eds.), The Economics and Management of Technological Diversification. Routledge, London and New York, pp. 265-295.
Cantwell, J.A., Andersen, H.B., 1996. A statistical analysis of corporate technological leadership historically. Economics of Innovation and New Technology 4, 211-234.
Cantwell, J.A., Barrera, M.P., 1998. The localisation of corporate technological trajectories in the interwar cartels: cooperative learning versus an exchange of knowledge. Economics of Innovation and New Technology 6, 257-290.
Cantwell, J.A., Mudambi, R., 2005. MNE competence-creating subsidiary mandates. Strategic Management Journal 26, 1109-1128.
Cantwell, J.A., Piscitello, L., 2000. Accumulating technological competence: its changing impact on corporate diversification and internationalization. Industrial and Corporate Change 9 (1), 21-51.
Cantwell, J.A., Santangelo, G.D., 2000. Capitalism, profits and innovation in the new techno-economic paradigm. Journal of Evolutionary Economics 10, 131-157.
Cohen, W.M., Levinthal, D.A., 1990. Absorptive capacity: a new perspective on learning and innovation. Administrative Science Quarterly (Special Issue: Technology, Organizations, and Innovation) 35 (1), 128-152.

35
Gilsing, V., Nooteboom, B., 2006. Exploration and exploitation in innovation systems: The case of pharmaceutical biotechnology. Research Policy 35, 1-23.
Granstrand, O., Patel, P., Pavitt, K.L.R., 1997. Multi- technology corporations: why they have ‘distributed’ rather than ‘distinctive core’ competencies. California Management Review 39, 8-25.
Granstrand, O., Sjölander, S., 1990. Managing innovation in multi- technology corporations. Research Policy 19, 35-60.
Langlois, R.N., 2002. Schumpeter and the obsolescence of the entrepreneur. Department of Economics University of Connecticut Working Paper 2002-19.
Lee, J., Harrison, J.R., 2001. Innovation and industry bifurcation: the evolution of R&D strategy. Industrial and Corporate Change 10(1), 115-149.
Loasby, B.J., 1999. Knowledge, institutions and evolution in economics. Routledge, London.
March, J.G., 1991. Exploration and exploitation in organizational learning. Organization Science 2, 71-87.
Nelson, R.R. (Ed.), 1993. National Innovation Systems: A Comparative Analysis. Oxford University Press Oxford, Oxford and New York.
Nelson, R.R., Winter, S.G., 1982. An Evolutionary Theory of Economic Change. Harvard University Press, Cambridge, Massachusetts.
Patel, P., Pavitt, K.L.R., 1997. The technological competencies of the world’s largest firms: complex and path-dependent, but not much variety. Research Policy 26, 141-156.
Pavitt, K.L.R., 1992. Some foundations for a theory of the large innovating firm, in Dosi,G., Giannetti, R., Toninelli, P.A. (Eds.), Technology and Enterprise in Historical Perspective. Oxford University Press, Oxford and New York, pp. 212-228.
Pavitt, K.L.R., Robson, M., Townsend, J., 1989. Technological accumulation, diversification and organization in UK companies, 1945-1983. Management Science 35, 81-99.
Penrose, E.T., 1959. The Theory of the Growth of the Firm. John Wiley & Sons Inc, New York.
Rosenberg, N., 1976. Perspectives on Technology. Cambridge University Press, Cambridge and New York.
Rosenberg, N., 1982. Inside the Black Box: Technology and Economics. Cambridge University Press, Cambridge and New York.
Rumelt, R., 1974. Strategy, Structure, and Economic Performance. Harvard University Press, Cambridge, Massachusetts.
Silverberg, G., Dosi, G., Orsenigo, L., 1988. Innovation, diversity and diffusion: a self-organization model. The Economic Journal 98 (393), 1032-1054.

36
Schumpeter, J.A., 1934. The Theory of Economic Development. Harvard University Press, Cambridge, Massachusetts. (Oxford University Press, New York, 1961.) First published in German, 1912.
Schumpeter, J.A., 1943. Capitalism, Socialism and Democracy. London: Allen and Unwin (originally published in the USA in 1942; reprinted by Routledge, London in 1994).
Teece, D.J., 1977. Technology transfer by multinational firms: the resource cost of transferring technological know-how. The Economic Journal 87, 242-261.
Teece, D.J., 1986. Profiting from technological innovation: implication for integration, collaboration, licensing and public policy. Research Policy 15, 285-305.
Teece, D.J., 1992. Strategies for Capturing the Financial Benefits from Technological Innovation, in N. Rosenberg, R. Landau and D.C. Mowery (eds.), Technology and the Wealth of Nations. Stanford: Stanford University Press.
Teece, D.J., Rumelt, R., Dosi, G., Winter, S.G., 1994. Understanding corporate coherence: theory and evidence. Journal of Economic Behavior and Organization 23, 1-30.
U.S. Department of Commerce, viewed on May 21, 2004. A survey of the use of biotechnology in U.S. Industry. http: // www.technology.gov / reports / Biotechnology / CD120a_0310.pdf.
Usher, A.P., 1954. A History of Mechanical Inventions, second ed. Harvard University Press, Cambridge, Massachusetts.
Zahra, S.A., George, G., 2002. Absorptive capacity: a review, reconceptualization and extension. Academy of Management Review 27(2), 185-203.

37
Table 1
The growth rate of patents application in the 25 technological fields
Technological fields Patent Class No. total
No. of Patents Applied
1985-1992 (P1)
No. of Patents Applied
1993-2000 (P2)
Growth Rate=
)1000( 1
12
+−
PPP
Rank
1 Food and Tobacco Products 127, 131, 426 426 235 191 -0.03563 18 3 Inorganic Chemical 423 165 122 43 -0.07041 22 4 Agricultural Chemical 71, 504 1007 468 539 0.048365 15
5 Chemical Process 23, 51, 62, 95, 117, 134, 156, 204, 205, 210, 216, 427,
432, 518 902 412 490 0.055241 13 6 Photographic Chemistry 430 351 269 82 -0.14736 25 7 Cleaning Agents and Other Compositions 106, 252, 507, 508, 510, 516, 588 993 539 454 -0.05523 21 8 Disinfecting and Preserving 422 119 32 87 0.053295 14 9 Synthetic Resins and Fibres 520-528 2213 1236 977 -0.11583 24 10 Bleaching and Dyeing 8 526 340 186 -0.11493 23
11 Other Organic Compounds 260, 530, 534, 536, 540, 544, 546, 548, 549, 552, 556,
558, 560, 562, 564, 568, 570 15396 6127 9269 0.440859 5 12 Pharmaceutical and Biotechnology
121 Drug, bio-affecting and body treating compositions 424, 514 29970 9986 19984 0.910067 2 122 Chemistry: Molecular biology and microbiology 435 12717 2550 10167 2.145634 1 123 Chemistry: Analytical and immunological testing 436 637 143 494 0.307087 6 124 Multicellular living organisms and unmodified parts thereof 800 1202 131 1071 0.831123 3
13 Metallurgical Processes 29, 75, 148, 164, 228, 419, 420, 483 203 97 106 0.008204 17
14 Miscellaneous metal products 4, 16, 24, 30, 49, 108, 132, 206, 211, 215, 220, 248,
267, 279, 285, 312, 383, 403, 623 1149 432 717 0.199022 7
16 Chemical and allied equipment 34, 55, 68, 96, 118, 134, 156, 159, 202, 209, 210, 261,
366, 422, 451, 494, 502, 503 935 374 561 0.136099 9 18 Paper making apparatus 53, 162, 229, 493 202 78 124 0.042672 16
28 Other Specialized machinery 15, 30, 116, 140, 141, 221, 222, 227, 277, 300, 401,
425, 454 565 202 363 0.133943 10
29 Other General Industrial Equipment 91, 92, 110, 122, 126, 137, 165, 184, 192, 239, 251,
303, 415, 416, 417, 418, 431, 432 180 113 67 -0.04133 20 39 Other General Electrical Equipment 62, 136, 204, 219, 310, 318, 373, 388, 392, 429, 438 347 123 224 0.089938 11 41 Office Equipment and Data Processing Systems 235, 360, 365, 369, 377, 700-715 277 43 234 0.183126 8 49 Rubber and Plastic Products 152, 264 400 165 235 0.060086 12 50 Non-metallic Mineral Products 52, 65, 215, 241, 428, 501 762 407 355 -0.03696 19
53 Other Instruments and Controls 33, 73, 74, 128, 177, 235, 250, 324, 346, 347, 349, 351,
356, 359, 368, 374, 378, 385, 433, 600-607 5209 1741 3468 0.630062 4

38
Table 2
Descriptive Statistics
Variable N Mean Std Dev Sum Minimum Maximum
GROWTH the annual growth rate in the stock price
155 -0.09818 0.28233 -15.21852 -0.74432 0.58321
WARAVG corporate technological coherence
155 2.41707 1.34809 374.6465 -0.60843 5.36876
LEADERSHIP technological innovation leadership
155 0.37527 1.9241 58.16641 -20.02561 2.80418
ACWAR absorptive capacity in the fastest growing fields
155 0.95934 7.95951 148.6972 -39.88941 54.8337
PARTICIPATION core field participation
155 0.00133 0.00635 0.20656 -0.06128 0.00494
Size log of total revenues
155 12.07859 1.92936 1872 7.90295 17.28356

39
Table 3 Pearson Correlation Matrix (N=155, Prob > |r| under H0: Rho=0)
GROWTH WARAVG LEADERSHIP ACWAR PARTICIPATION Size GROWTH 1 the annual growth rate in the stock price WARAVG -0.07276 1 corporate technological coherence (0.3683) LEADERSHIP 0.06864 -0.17978 1 technological innovation leadership (0.3961) (0.0252) ACWAR 0.0886 0.29021 -0.37018 1 absorptive capacity in the fastest growing fields (0.273) (0.0002) (<.0001) PARTICIPATION 0.15144 -0.21932 0.88551 -0.40201 1 core field participation (0.06) (0.0061) (<.0001) (<.0001) Size 0.06504 -0.06028 -0.01571 0.19049 -0.09753 1 log of total revenues (0.4214) (0.4562) (0.8461) (0.0176) (0.2273)
40
Table 4
Economic Performance and Technological Innovation Strategies: Estimation of the Model
Parameter 1 2 3 4 5 6 7 8
Intercept -0.281** (0.131)
-0.284** (0.127)
-0.239* (0.124)
-0.313** (0.138)
-0.277** (0.125)
-0.231* (0.128)
0.026 (0.152)
0.039 (0.132)
WARAVG corporate technological coherence
-0.066* (0.034)
-0.059* (0.036)
-0.176*** (0.042)
-0.180*** (0.039)
WARAVG*WARAVG 0.015** (0.006)
0.0143** (0.006)
0.029*** (0.007)
0.030*** (0.007)
LEADERSHIP technological innovation leadership
-0.060** (0.024)
-0.194*** (0.056)
-0.217*** (0.066)
-0.219*** (0.065)
LEADERSHIP*LEADERSHIP
-0.001 (0.001)
0.005* (0.003)
0.007** (0.003)
0.007** (0.003)
ACWAR absorptive capacity in the fastest growing fields
0.006** (0.003)
0.007** (0.003)
0.011*** (0.003)
0.011*** (0.003)
WARAVG* LEADERSHIP
-0.002 (0.005)
0.045*** (0.017)
0.065*** (0.023)
0.067*** (0.021)
WARAVG * ACWAR
0.002 (0.002)
-0.002 (0.004)
-0.009 (0.007)
-0.010** (0.004)
LEADERSHIP * ACWAR
0.001 (0.001)
-0.001 (0.001)
0.0001 (0.002)
-0.0002 (0.0018)
PARTICIPATION core field participation
3.613 (2.947)
13.817** (6.456)
6.112* (3.112)
9.324 (7.688)
15.245** (6.370)
5.839 (4.994)
1.825 (10.337)
Size log of total revenues
0.033*** (0.010)
0.031*** (0.010)
0.024** (0.010)
0.034*** (0.010)
0.032*** (0.010)
0.024** (0.010)
0.029*** (0.009)
0.029*** (0.009)
Year 99
0.020 (0.062)
0.010 (0.062)
0.022 (0.062)
0.019 (0.062)
0.001 (0.062)
0.020 (0.062)
-0.010 (0.058)
-0.010 (0.058)
Year 04
-0.347*** (0.061)
-0.335*** (0.061)
-0.327*** (0.060)
-0.347*** (0.062)
-0.346*** (0.060)
-0.327*** (0.060)
-0.383*** (0.058)
-0.384*** (0.057)
N 155 155 155 155 155 155 155 155 2R 0.3988 0.3977 0.3997 0.4023 0.4258 0.4012 0.5005 0.5004
Adjusted 2R 0.3744 0.3733 0.3795 0.3696 0.3943 0.3727 0.4583 0.4620
F statistics 16.36*** 16.29*** 19.84*** 12.29*** 13.53*** 14.07*** 11.86*** 13.02*** *** p-value < 0.01 ** p-value < 0.05 * p-value < 0.1

41
Figure 1
The Four Types of Innovation Strategies
Coherence
Coherent Experimental
Leaders
Established leader
Radical innovator
Leadership
Followers
Traditional imitator
Boundary-spanning
Follower