Embed Size (px)
Citation preview
Leadership of Technological ChangeTen Areas of Disruption, Strategic Opportunity, and Threat
MITREApr 2013 McLean, VA
John Smart, President,
Acceleration Studies [email protected]

Theory of ChangeWhat Drives Accelerating Change?
Los Angeles
New York
Palo Alto
AccelerationStudiesFoundationA 501(c)(3) Nonprofit
© 2013 Accelerating.org
Are You Accelaware? The Most Complex Universal Systems Are Always Accelerating
Free energy rate density growth in hierarchically emergent
complex systems over universal time.
Free Energy Rate Density (Φ)System (ergs/sec/gm)
Global AI of the 21st C 10^12+
Pentium II of the 1990's 10^11
Intel 8080 of the 1970's 10^10
Modern Engines 10^5 to 10^8
Culture (human) 500,000 (10^5)
Brains (human) 150,000 (10^5)
Animals (human body) 20,000 (10^4)
Plants and Ecosystems 900 (10^2)
Planets (Early) 75
Stars 2
Galaxies 0.5
Cosmic Evolution,
Chaisson, 2001
We don’t know why yet. But one thing is clear: Leading-edge
systems are always more Space, Time, Energy, and
Matter (STEM) dense and efficient over time.
Los Angeles
New York
Palo Alto
AccelerationStudiesFoundationA 501(c)(3) Nonprofit
Strategic Vision:What’s Your Theory of Change? Of Progress?
Good theories of change include values, and an idea of progress.
My bias: I’m in a group of scholars who study complex systems from
• Evolutionary “evo” variation,
• Computational “compu” selection, and
• Developmental “devo” optimization approaches.
More at:
EvoDevoUniverse.comBury, 1920
Los Angeles
New York
Palo Alto
AccelerationStudiesFoundationA 501(c)(3) Nonprofit
© 2012 Accelerating.org
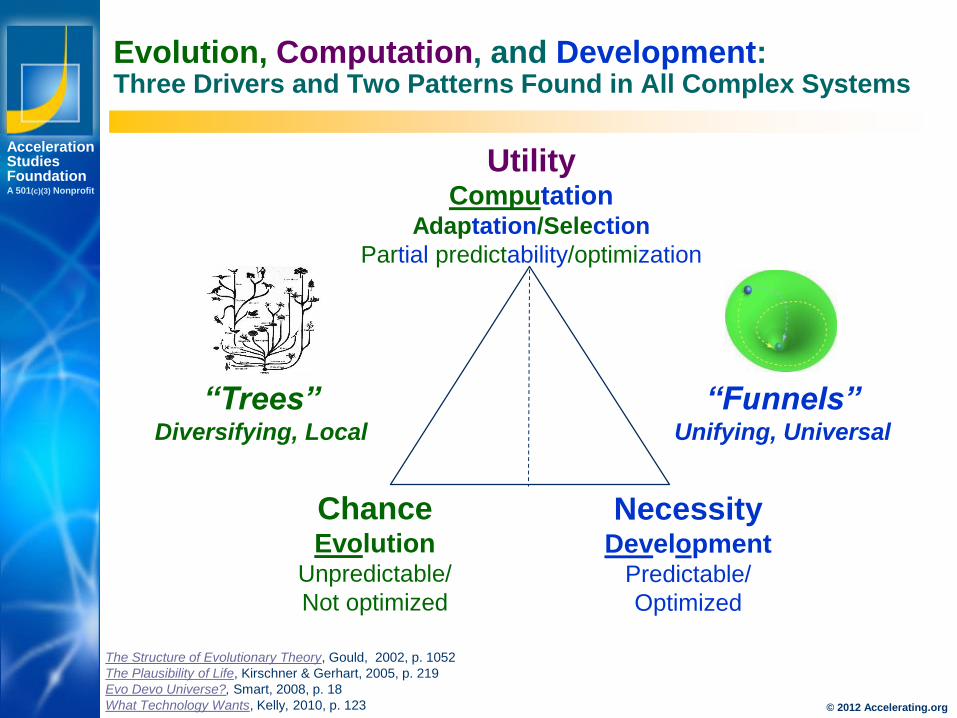
Evolution, Computation, and Development: Three Drivers and Two Patterns Found in All Complex Systems
ChanceEvolution
Unpredictable/
Not optimized
NecessityDevelopment
Predictable/
Optimized
UtilityComputation
Adaptation/Selection
Partial predictability/optimization
The Structure of Evolutionary Theory, Gould, 2002, p. 1052
The Plausibility of Life, Kirschner & Gerhart, 2005, p. 219
Evo Devo Universe?, Smart, 2008, p. 18
What Technology Wants, Kelly, 2010, p. 123
“Funnels”Unifying, Universal
“Trees”Diversifying, Local
Los Angeles
New York
Palo Alto
AccelerationStudiesFoundationA 501(c)(3) Nonprofit
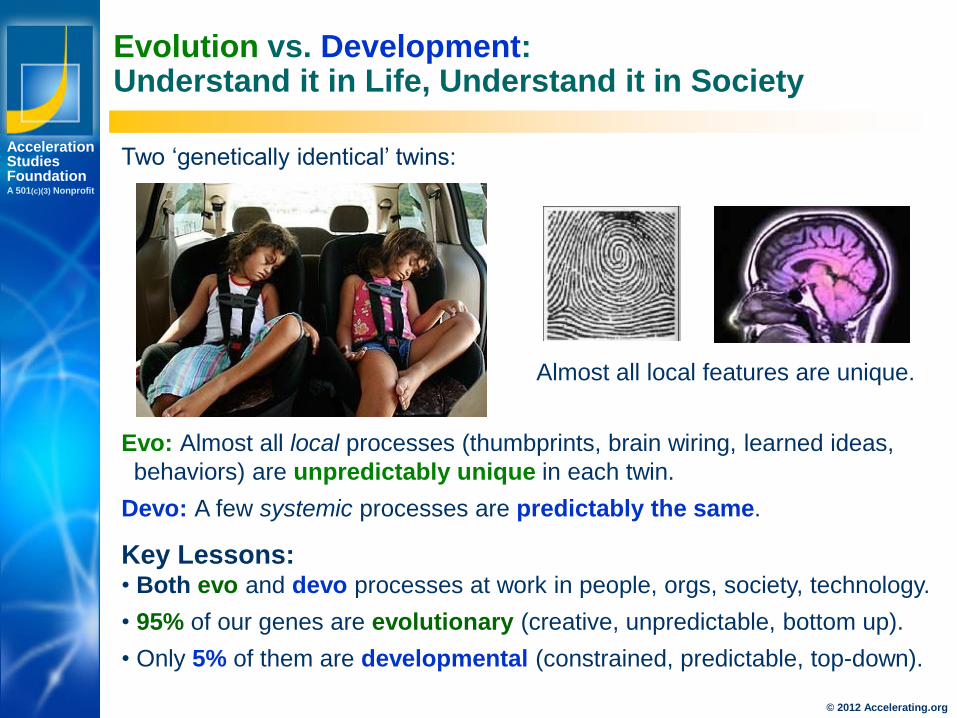
Evolution vs. Development:Understand it in Life, Understand it in Society
Two ‘genetically identical’ twins:
Evo: Almost all local processes (thumbprints, brain wiring, learned ideas,
behaviors) are unpredictably unique in each twin.
Devo: A few systemic processes are predictably the same.
Key Lessons: • Both evo and devo processes at work in people, orgs, society, technology.
• 95% of our genes are evolutionary (creative, unpredictable, bottom up).
• Only 5% of them are developmental (constrained, predictable, top-down).
Almost all local features are unique.
© 2012 Accelerating.org
Los Angeles
New York
Palo Alto
AccelerationStudiesFoundationA 501(c)(3) Nonprofit
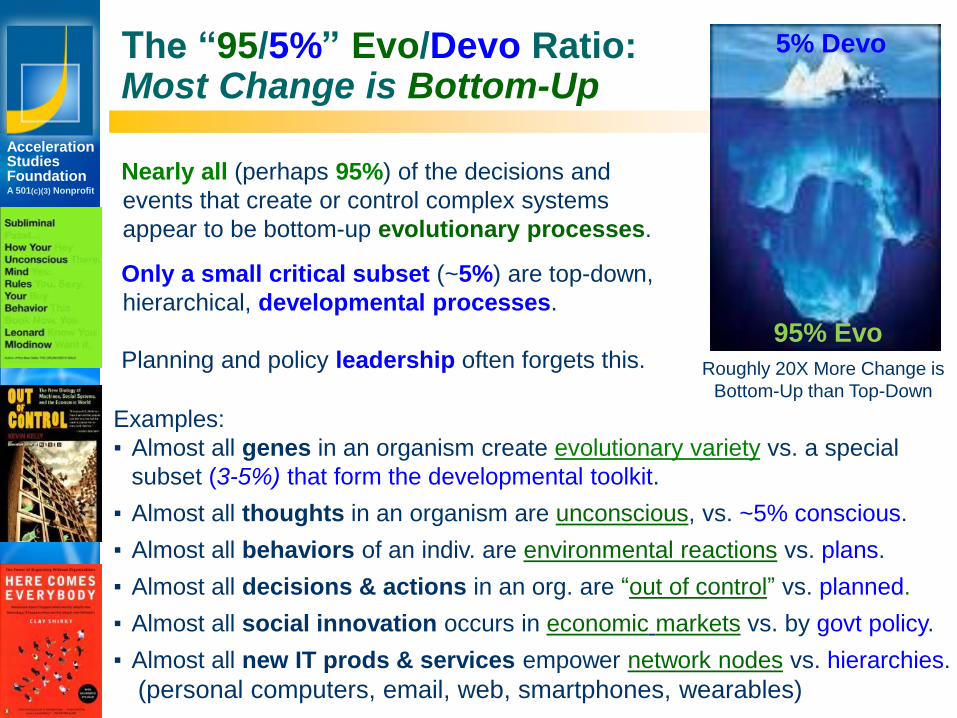
The “95/5%” Evo/Devo Ratio:Most Change is Bottom-Up
Examples:
▪ Almost all genes in an organism create evolutionary variety vs. a special
subset (3-5%) that form the developmental toolkit.
▪ Almost all thoughts in an organism are unconscious, vs. ~5% conscious.
▪ Almost all behaviors of an indiv. are environmental reactions vs. plans.
▪ Almost all decisions & actions in an org. are “out of control” vs. planned.
▪ Almost all social innovation occurs in economic markets vs. by govt policy.
▪ Almost all new IT prods & services empower network nodes vs. hierarchies.
(personal computers, email, web, smartphones, wearables)
Nearly all (perhaps 95%) of the decisions and
events that create or control complex systems
appear to be bottom-up evolutionary processes.
Only a small critical subset (~5%) are top-down,
hierarchical, developmental processes.
Planning and policy leadership often forgets this.
5% Devo
95% Evo
Roughly 20X More Change is
Bottom-Up than Top-Down
Los Angeles
New York
Palo Alto
AccelerationStudiesFoundationA 501(c)(3) Nonprofit
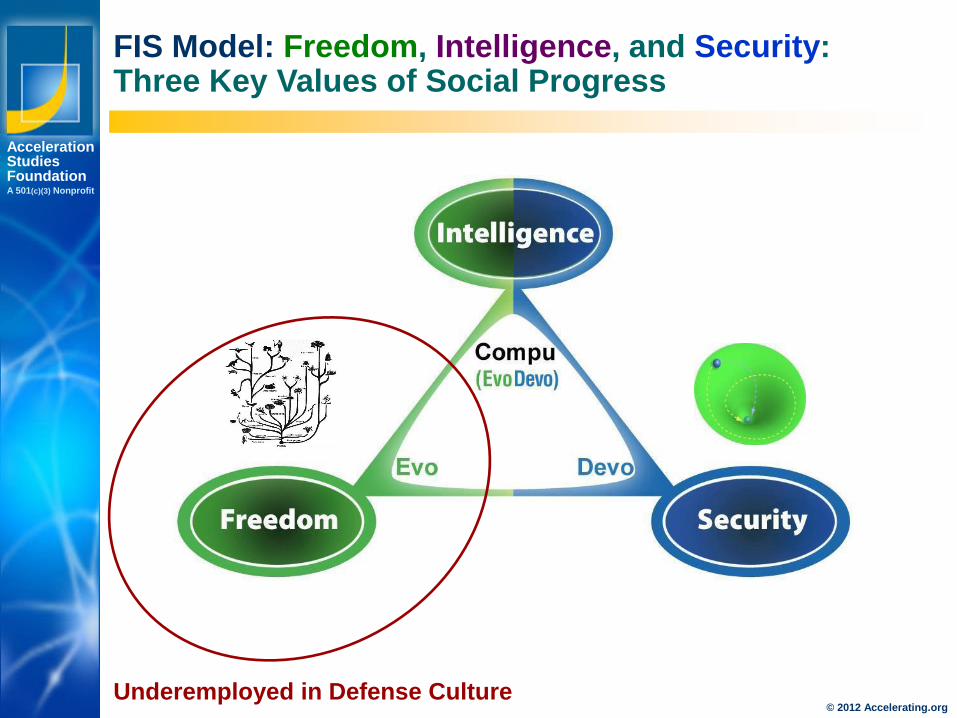
FIS Model: Freedom, Intelligence, and Security: Three Key Values of Social Progress
© 2012 Accelerating.orgUnderemployed in Defense Culture
Los Angeles
New York
Palo Alto
AccelerationStudiesFoundationA 501(c)(3) Nonprofit
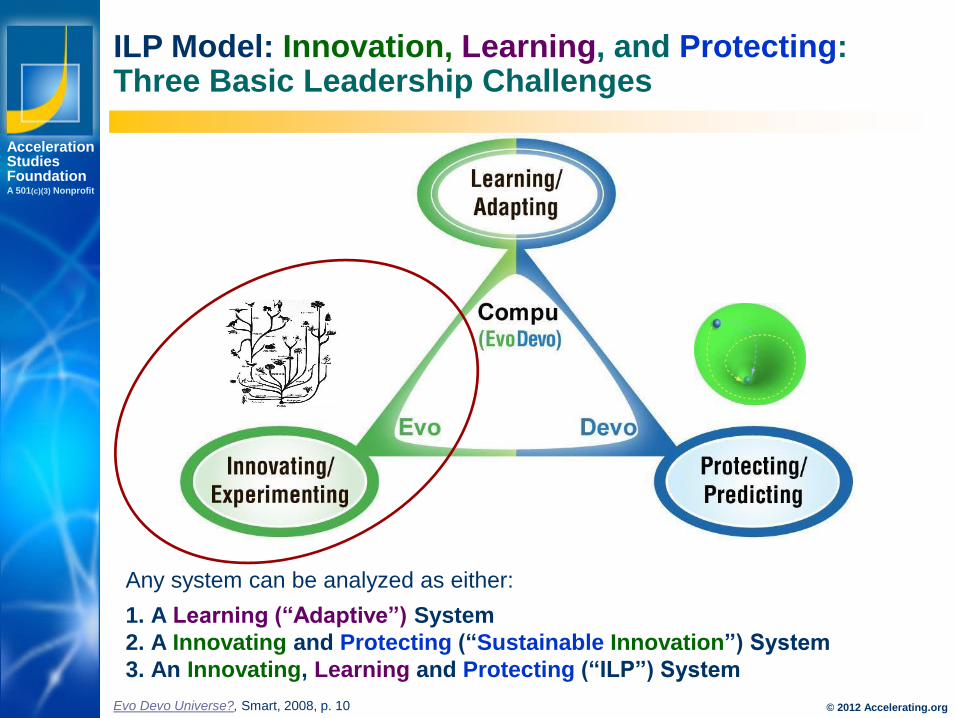
Any system can be analyzed as either:
1. A Learning (“Adaptive”) System
2. A Innovating and Protecting (“Sustainable Innovation”) System
3. An Innovating, Learning and Protecting (“ILP”) System
ILP Model: Innovation, Learning, and Protecting: Three Basic Leadership Challenges
© 2012 Accelerating.orgEvo Devo Universe?, Smart, 2008, p. 10
Los Angeles
New York
Palo Alto
AccelerationStudiesFoundationA 501(c)(3) Nonprofit
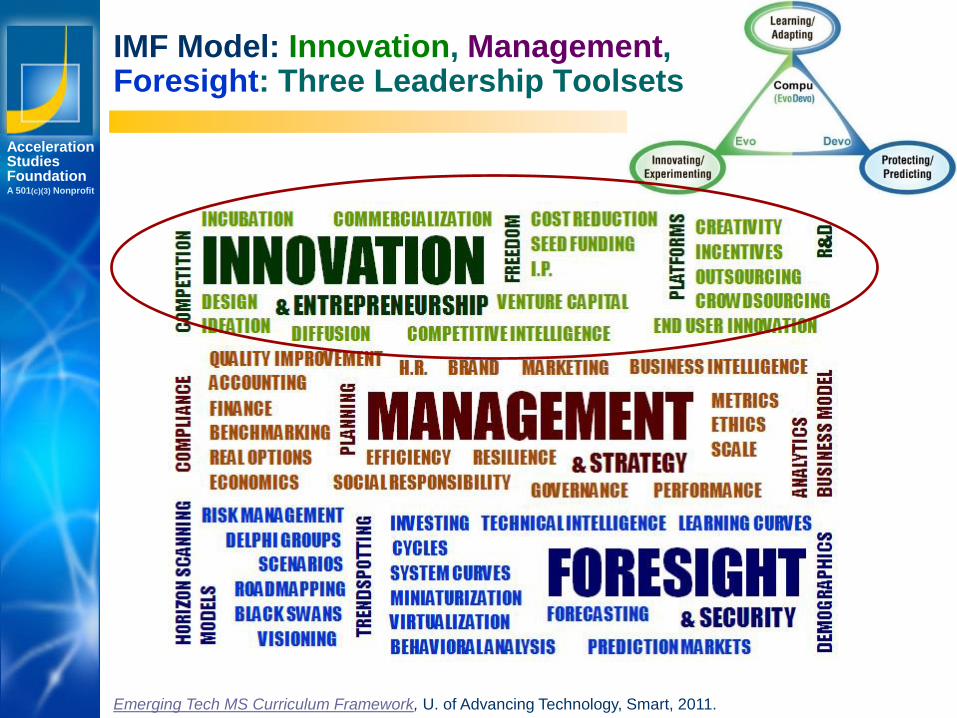
IMF Model: Innovation, Management, Foresight: Three Leadership Toolsets
Emerging Tech MS Curriculum Framework, U. of Advancing Technology, Smart, 2011.
Los Angeles
New York
Palo Alto
AccelerationStudiesFoundationA 501(c)(3) Nonprofit
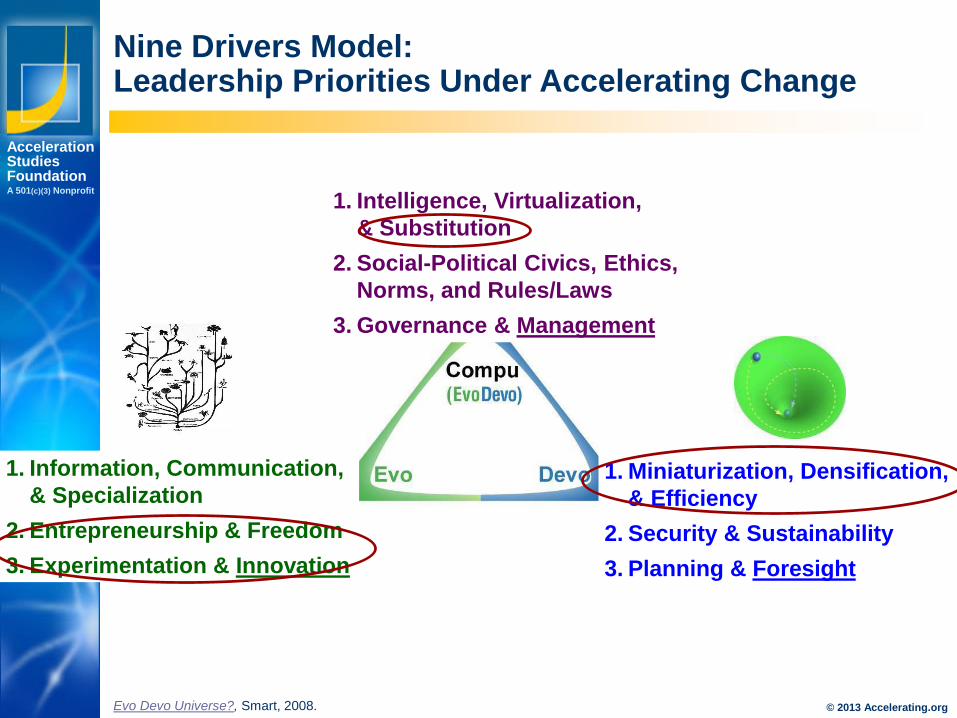
Nine Drivers Model:Leadership Priorities Under Accelerating Change
© 2013 Accelerating.orgEvo Devo Universe?, Smart, 2008.
1. Information, Communication,
& Specialization
2. Entrepreneurship & Freedom
3. Experimentation & Innovation
1. Miniaturization, Densification,
& Efficiency
2. Security & Sustainability
3. Planning & Foresight
1. Intelligence, Virtualization,
& Substitution
2. Social-Political Civics, Ethics,
Norms, and Rules/Laws
3. Governance & Management
Developmental ForesightWhat Can We Anticipate?
Los Angeles
New York
Palo Alto
AccelerationStudiesFoundationA 501(c)(3) Nonprofit
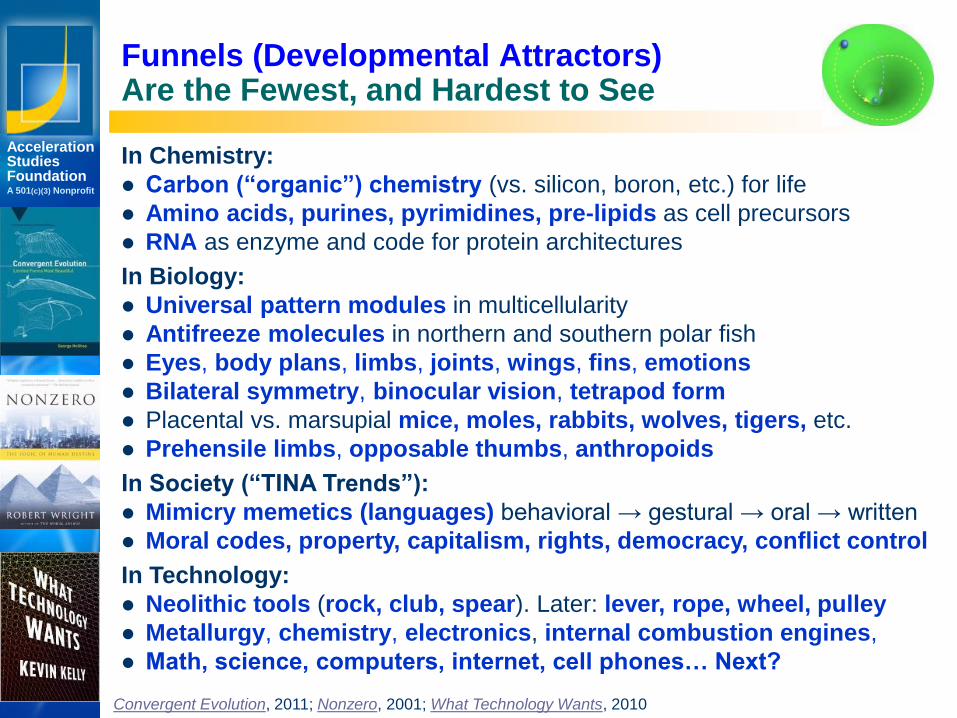
Funnels (Developmental Attractors) Are the Fewest, and Hardest to See
In Chemistry:
Carbon (“organic”) chemistry (vs. silicon, boron, etc.) for life
Amino acids, purines, pyrimidines, pre-lipids as cell precursors
RNA as enzyme and code for protein architectures
In Biology:
Universal pattern modules in multicellularity
Antifreeze molecules in northern and southern polar fish
Eyes, body plans, limbs, joints, wings, fins, emotions
Bilateral symmetry, binocular vision, tetrapod form
Placental vs. marsupial mice, moles, rabbits, wolves, tigers, etc.
Prehensile limbs, opposable thumbs, anthropoids
In Society (“TINA Trends”):
Mimicry memetics (languages) behavioral → gestural → oral → written
Moral codes, property, capitalism, rights, democracy, conflict control
In Technology:
Neolithic tools (rock, club, spear). Later: lever, rope, wheel, pulley
Metallurgy, chemistry, electronics, internal combustion engines,
Math, science, computers, internet, cell phones… Next?
Convergent Evolution, 2011; Nonzero, 2001; What Technology Wants, 2010
Los Angeles
New York
Palo Alto
AccelerationStudiesFoundationA 501(c)(3) Nonprofit
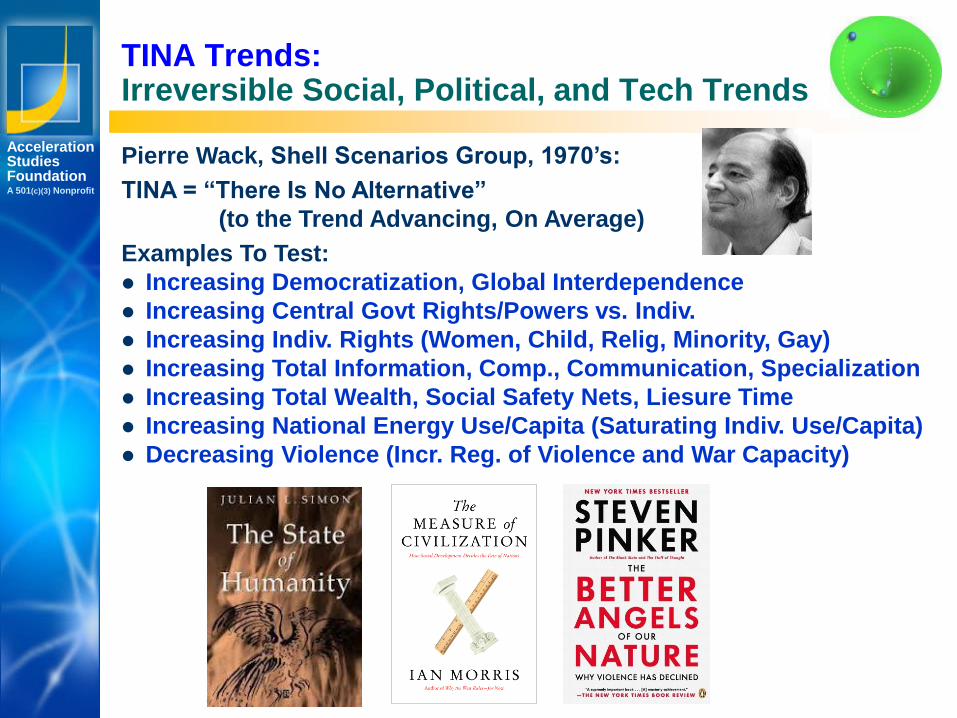
TINA Trends:Irreversible Social, Political, and Tech Trends
Pierre Wack, Shell Scenarios Group, 1970’s:
TINA = “There Is No Alternative”
(to the Trend Advancing, On Average)
Examples To Test:
Increasing Democratization, Global Interdependence
Increasing Central Govt Rights/Powers vs. Indiv.
Increasing Indiv. Rights (Women, Child, Relig, Minority, Gay)
Increasing Total Information, Comp., Communication, Specialization
Increasing Total Wealth, Social Safety Nets, Liesure Time
Increasing National Energy Use/Capita (Saturating Indiv. Use/Capita)
Decreasing Violence (Incr. Reg. of Violence and War Capacity)
Los Angeles
New York
Palo Alto
AccelerationStudiesFoundationA 501(c)(3) Nonprofit
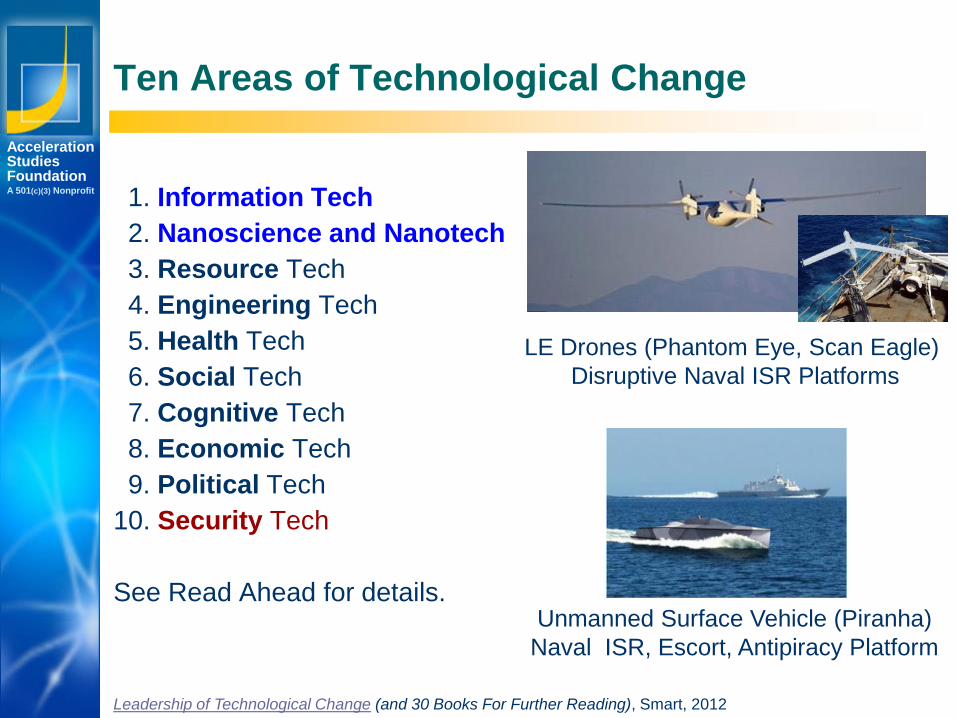
Ten Areas of Technological Change
1. Information Tech
2. Nanoscience and Nanotech
3. Resource Tech
4. Engineering Tech
5. Health Tech
6. Social Tech
7. Cognitive Tech
8. Economic Tech
9. Political Tech
10. Security Tech
See Read Ahead for details.
Leadership of Technological Change (and 30 Books For Further Reading), Smart, 2012
LE Drones (Phantom Eye, Scan Eagle)
Disruptive Naval ISR Platforms
Unmanned Surface Vehicle (Piranha)
Naval ISR, Escort, Antipiracy Platform
Los Angeles
New York
Palo Alto
AccelerationStudiesFoundationA 501(c)(3) Nonprofit
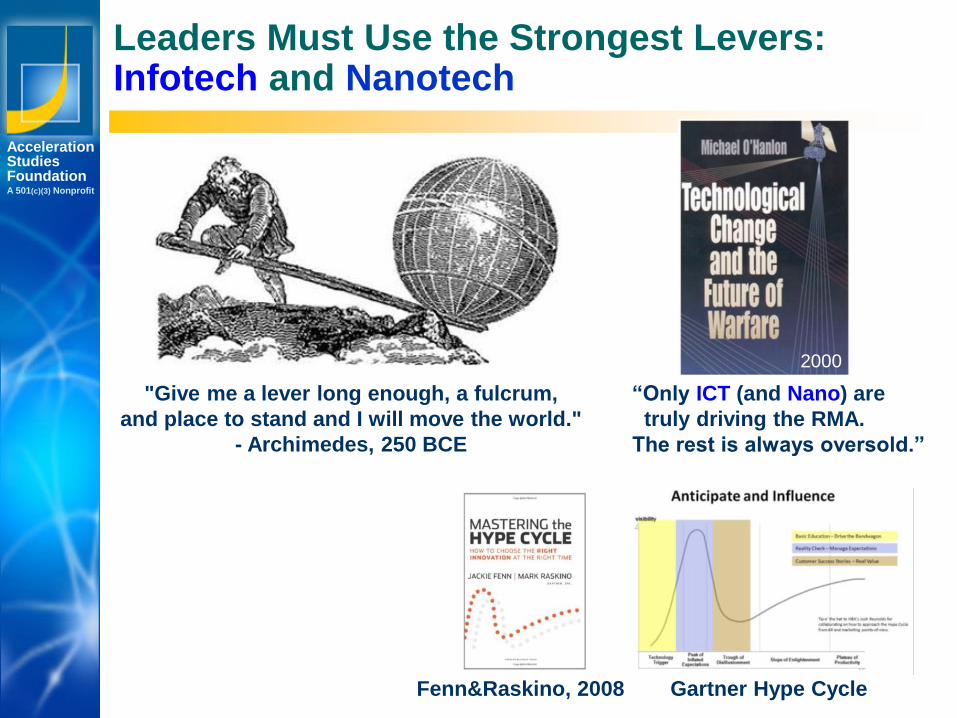
Leaders Must Use the Strongest Levers:Infotech and Nanotech
"Give me a lever long enough, a fulcrum,
and place to stand and I will move the world."
- Archimedes, 250 BCE
2000
“Only ICT (and Nano) are
truly driving the RMA.
The rest is always oversold.”
Gartner Hype CycleFenn&Raskino, 2008
Los Angeles
New York
Palo Alto
AccelerationStudiesFoundationA 501(c)(3) Nonprofit
© 2011 Accelerating.org
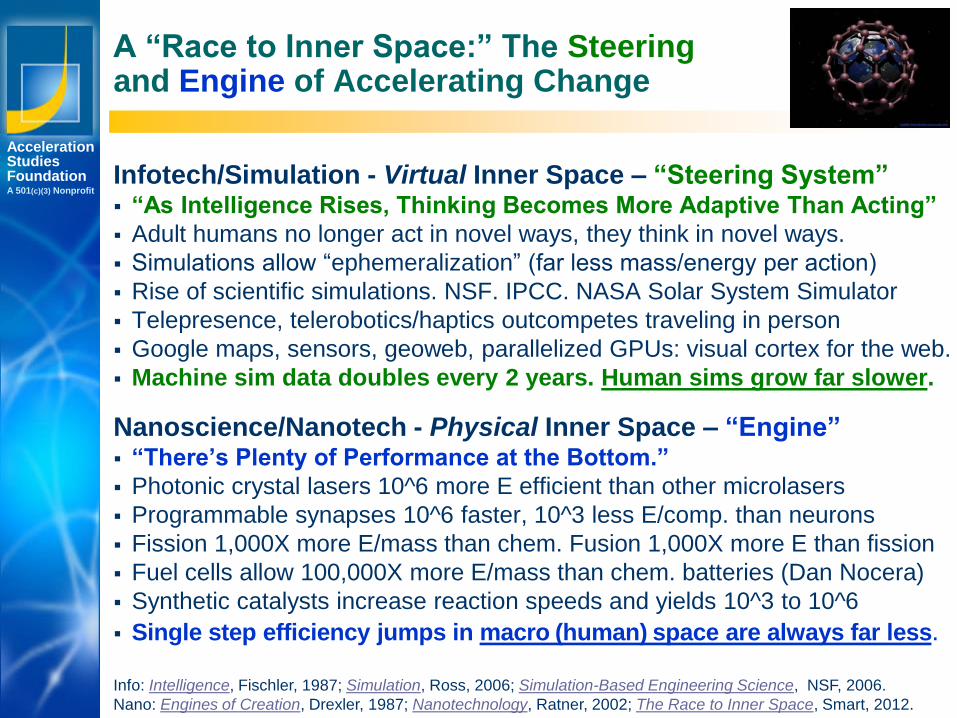
Infotech/Simulation - Virtual Inner Space – “Steering System” “As Intelligence Rises, Thinking Becomes More Adaptive Than Acting”
Adult humans no longer act in novel ways, they think in novel ways.
Simulations allow “ephemeralization” (far less mass/energy per action)
Rise of scientific simulations. NSF. IPCC. NASA Solar System Simulator
Telepresence, telerobotics/haptics outcompetes traveling in person
Google maps, sensors, geoweb, parallelized GPUs: visual cortex for the web.
Machine sim data doubles every 2 years. Human sims grow far slower.
Nanoscience/Nanotech - Physical Inner Space – “Engine” “There’s Plenty of Performance at the Bottom.”
Photonic crystal lasers 10^6 more E efficient than other microlasers
Programmable synapses 10^6 faster, 10^3 less E/comp. than neurons
Fission 1,000X more E/mass than chem. Fusion 1,000X more E than fission
Fuel cells allow 100,000X more E/mass than chem. batteries (Dan Nocera)
Synthetic catalysts increase reaction speeds and yields 10^3 to 10^6
Single step efficiency jumps in macro (human) space are always far less.
A “Race to Inner Space:” The Steeringand Engine of Accelerating Change
Info: Intelligence, Fischler, 1987; Simulation, Ross, 2006; Simulation-Based Engineering Science, NSF, 2006.
Nano: Engines of Creation, Drexler, 1987; Nanotechnology, Ratner, 2002; The Race to Inner Space, Smart, 2012.
Los Angeles
New York
Palo Alto
AccelerationStudiesFoundationA 501(c)(3) Nonprofit
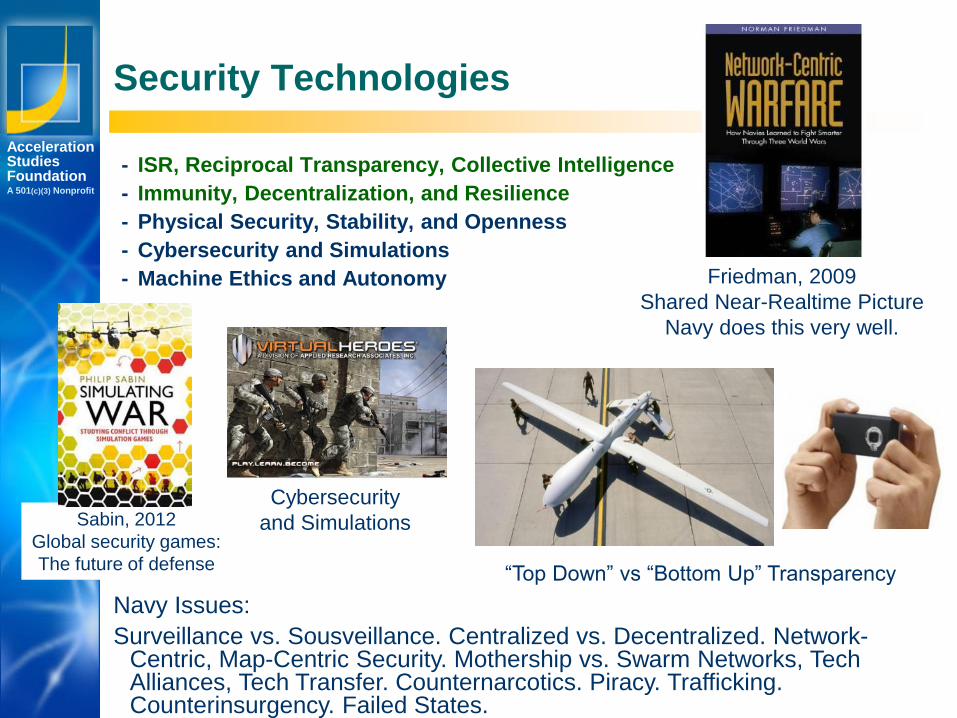
Security Technologies
- ISR, Reciprocal Transparency, Collective Intelligence
- Immunity, Decentralization, and Resilience
- Physical Security, Stability, and Openness
- Cybersecurity and Simulations
- Machine Ethics and Autonomy
Navy Issues:
Surveillance vs. Sousveillance. Centralized vs. Decentralized. Network-Centric, Map-Centric Security. Mothership vs. Swarm Networks, Tech Alliances, Tech Transfer. Counternarcotics. Piracy. Trafficking.Counterinsurgency. Failed States.
“Top Down” vs “Bottom Up” Transparency
Cybersecurity
and Simulations
Friedman, 2009
Shared Near-Realtime Picture
Navy does this very well.
Sabin, 2012
Global security games:
The future of defense
Los Angeles
New York
Palo Alto
AccelerationStudiesFoundationA 501(c)(3) Nonprofit
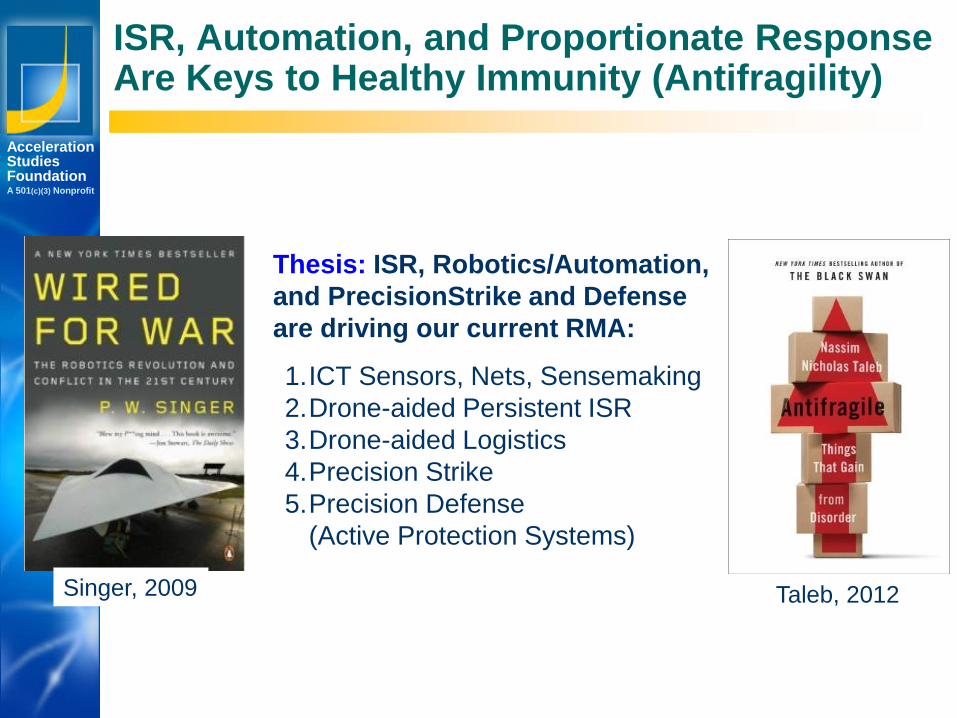
ISR, Automation, and Proportionate ResponseAre Keys to Healthy Immunity (Antifragility)
Thesis: ISR, Robotics/Automation,
and PrecisionStrike and Defense
are driving our current RMA:
1.ICT Sensors, Nets, Sensemaking
2.Drone-aided Persistent ISR
3.Drone-aided Logistics
4.Precision Strike
5.Precision Defense
(Active Protection Systems)
Singer, 2009 Taleb, 2012
Los Angeles
New York
Palo Alto
AccelerationStudiesFoundationA 501(c)(3) Nonprofit
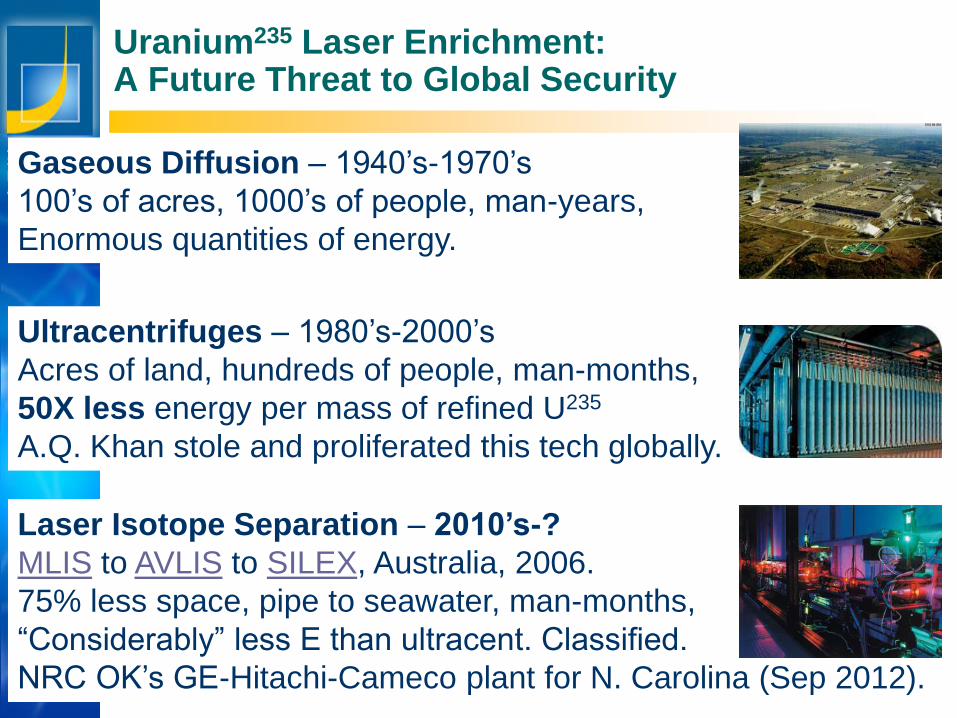
Uranium235 Laser Enrichment:A Future Threat to Global Security
Gaseous Diffusion – 1940’s-1970’s
100’s of acres, 1000’s of people, man-years,
Enormous quantities of energy.
Ultracentrifuges – 1980’s-2000’s
Acres of land, hundreds of people, man-months,
50X less energy per mass of refined U235
A.Q. Khan stole and proliferated this tech globally.
Laser Isotope Separation – 2010’s-?
MLIS to AVLIS to SILEX, Australia, 2006.
75% less space, pipe to seawater, man-months,
“Considerably” less E than ultracent. Classified.
NRC OK’s GE-Hitachi-Cameco plant for N. Carolina (Sep 2012).
Los Angeles
New York
Palo Alto
AccelerationStudiesFoundationA 501(c)(3) Nonprofit
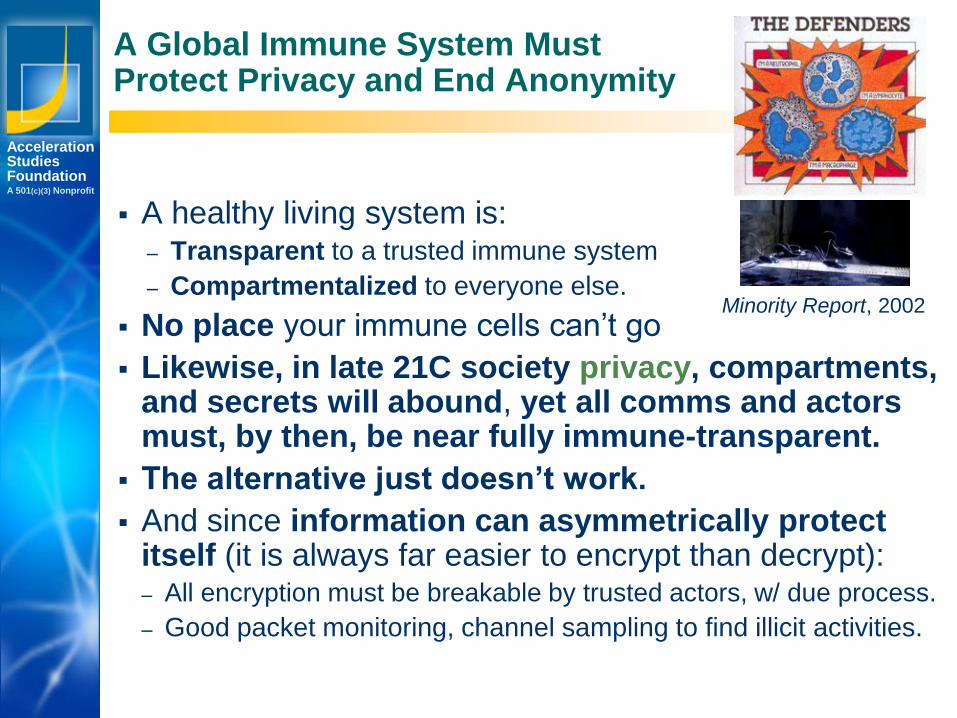
A Global Immune System MustProtect Privacy and End Anonymity
A healthy living system is:– Transparent to a trusted immune system
– Compartmentalized to everyone else.
No place your immune cells can’t go
Likewise, in late 21C society privacy, compartments, and secrets will abound, yet all comms and actors must, by then, be near fully immune-transparent.
The alternative just doesn’t work.
And since information can asymmetrically protect itself (it is always far easier to encrypt than decrypt):– All encryption must be breakable by trusted actors, w/ due process.
– Good packet monitoring, channel sampling to find illicit activities.
Minority Report, 2002
Los Angeles
New York
Palo Alto
AccelerationStudiesFoundationA 501(c)(3) Nonprofit
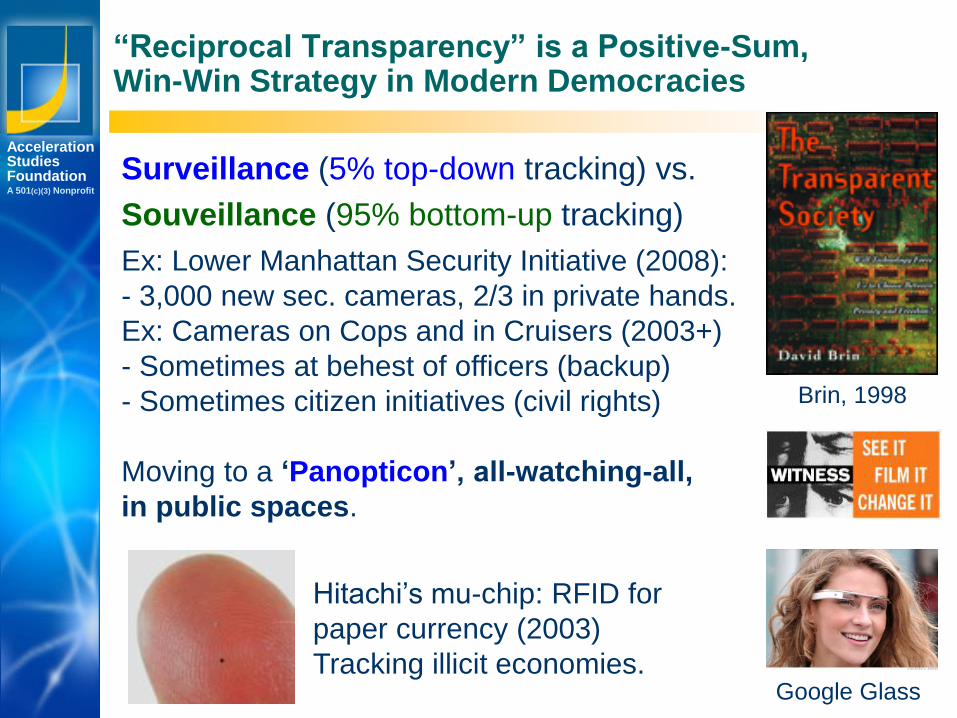
“Reciprocal Transparency” is a Positive-Sum, Win-Win Strategy in Modern Democracies
Hitachi’s mu-chip: RFID for
paper currency (2003)
Tracking illicit economies.
Surveillance (5% top-down tracking) vs.
Souveillance (95% bottom-up tracking)
Ex: Lower Manhattan Security Initiative (2008):
- 3,000 new sec. cameras, 2/3 in private hands.
Ex: Cameras on Cops and in Cruisers (2003+)
- Sometimes at behest of officers (backup)
- Sometimes citizen initiatives (civil rights)
Moving to a ‘Panopticon’, all-watching-all,
in public spaces.
Brin, 1998
Google Glass
Los Angeles
New York
Palo Alto
AccelerationStudiesFoundationA 501(c)(3) Nonprofit
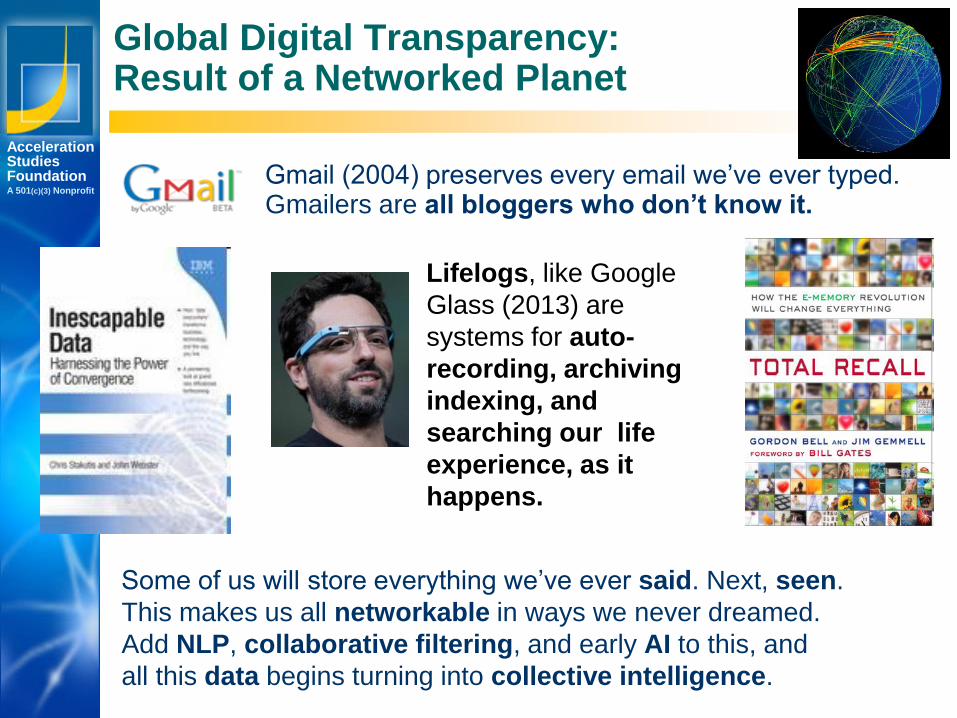
Global Digital Transparency:Result of a Networked Planet
Some of us will store everything we’ve ever said. Next, seen.
This makes us all networkable in ways we never dreamed.
Add NLP, collaborative filtering, and early AI to this, and
all this data begins turning into collective intelligence.
Gmail (2004) preserves every email we’ve ever typed. Gmailers are all bloggers who don’t know it.
Lifelogs, like Google
Glass (2013) are
systems for auto-
recording, archiving
indexing, and
searching our life
experience, as it
happens.
Los Angeles
New York
Palo Alto
AccelerationStudiesFoundationA 501(c)(3) Nonprofit
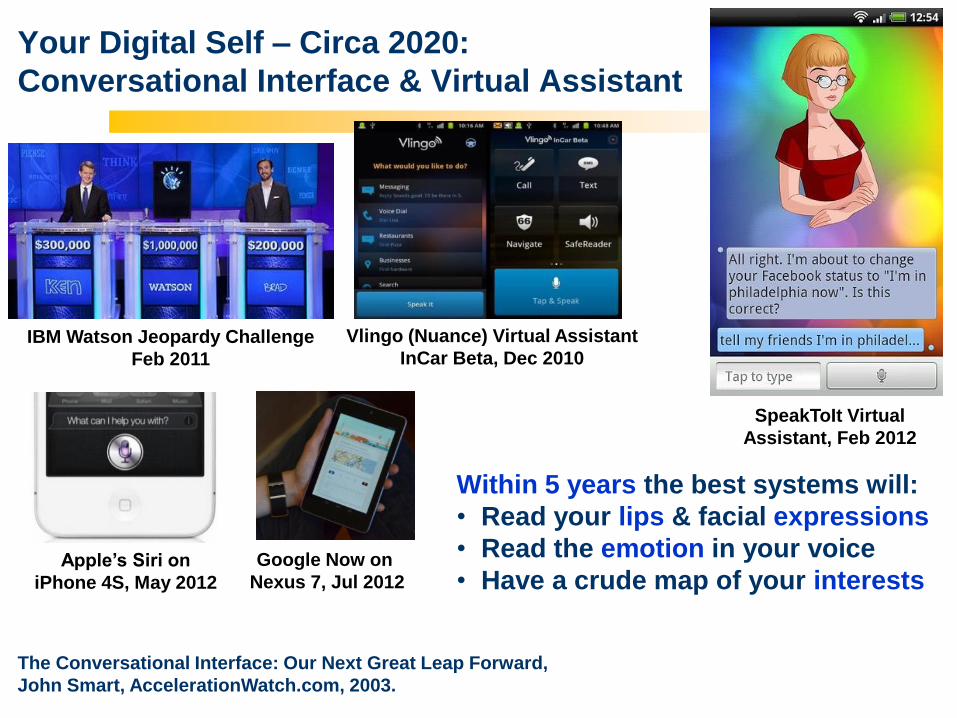
Your Digital Self – Circa 2020:
Conversational Interface & Virtual Assistant
Apple’s Siri on
iPhone 4S, May 2012
Google Now on
Nexus 7, Jul 2012
IBM Watson Jeopardy Challenge
Feb 2011
SpeakToIt Virtual
Assistant, Feb 2012
Vlingo (Nuance) Virtual Assistant
InCar Beta, Dec 2010
Within 5 years the best systems will:
• Read your lips & facial expressions
• Read the emotion in your voice
• Have a crude map of your interests
The Conversational Interface: Our Next Great Leap Forward,
John Smart, AccelerationWatch.com, 2003.
Los Angeles
New York
Palo Alto
AccelerationStudiesFoundationA 501(c)(3) Nonprofit
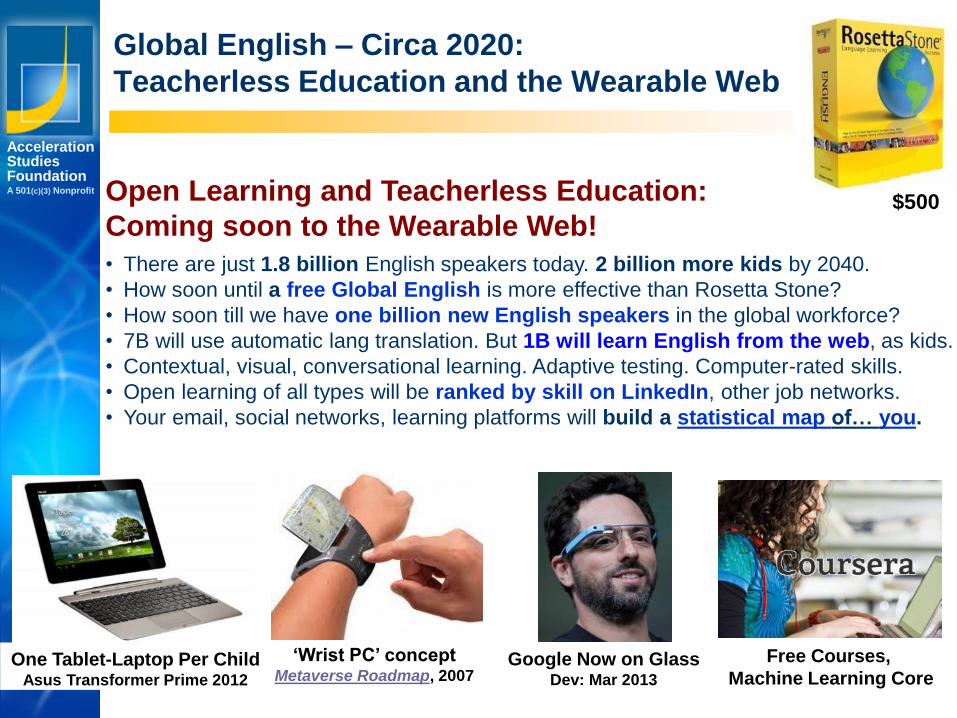
Global English – Circa 2020:
Teacherless Education and the Wearable Web
One Tablet-Laptop Per ChildAsus Transformer Prime 2012
Open Learning and Teacherless Education:
Coming soon to the Wearable Web!
• There are just 1.8 billion English speakers today. 2 billion more kids by 2040.
• How soon until a free Global English is more effective than Rosetta Stone?
• How soon till we have one billion new English speakers in the global workforce?
• 7B will use automatic lang translation. But 1B will learn English from the web, as kids.
• Contextual, visual, conversational learning. Adaptive testing. Computer-rated skills.
• Open learning of all types will be ranked by skill on LinkedIn, other job networks.
• Your email, social networks, learning platforms will build a statistical map of… you.
‘Wrist PC’ conceptMetaverse Roadmap, 2007
Google Now on GlassDev: Mar 2013
$500
Free Courses,
Machine Learning Core
Los Angeles
New York
Palo Alto
AccelerationStudiesFoundationA 501(c)(3) Nonprofit
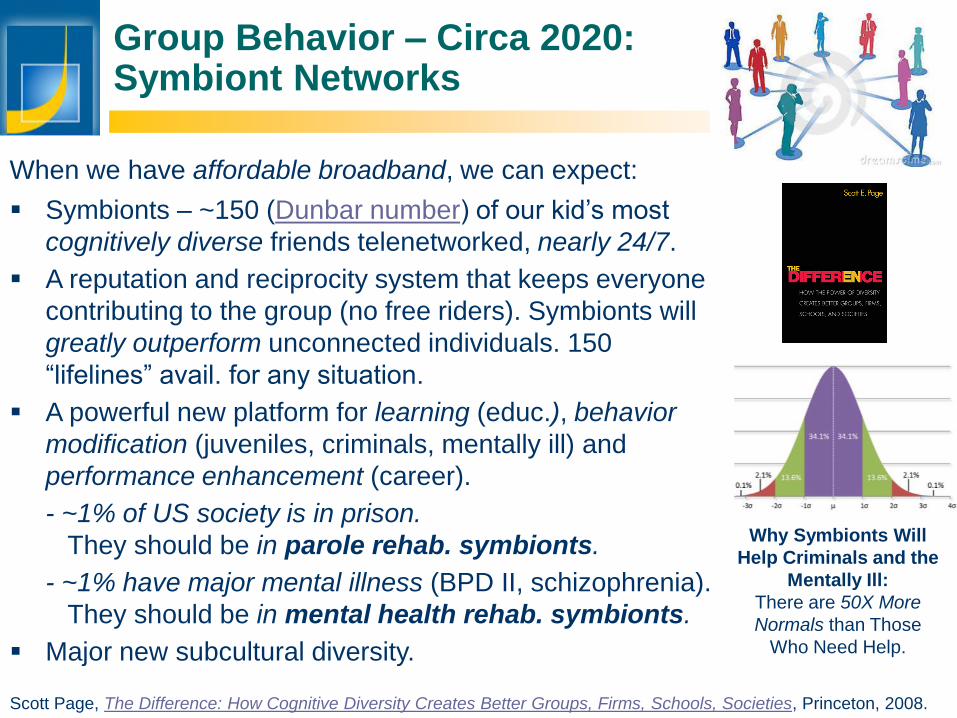
Group Behavior – Circa 2020:Symbiont Networks
Scott Page, The Difference: How Cognitive Diversity Creates Better Groups, Firms, Schools, Societies, Princeton, 2008.
When we have affordable broadband, we can expect:
Symbionts – ~150 (Dunbar number) of our kid’s most
cognitively diverse friends telenetworked, nearly 24/7.
A reputation and reciprocity system that keeps everyone
contributing to the group (no free riders). Symbionts will
greatly outperform unconnected individuals. 150
“lifelines” avail. for any situation.
A powerful new platform for learning (educ.), behavior
modification (juveniles, criminals, mentally ill) and
performance enhancement (career).
- ~1% of US society is in prison.
They should be in parole rehab. symbionts.
- ~1% have major mental illness (BPD II, schizophrenia).
They should be in mental health rehab. symbionts.
Major new subcultural diversity.
Why Symbionts Will
Help Criminals and the
Mentally Ill:
There are 50X More
Normals than Those
Who Need Help.
Leadership StrategiesInnovation, Management, Foresight
Los Angeles
New York
Palo Alto
AccelerationStudiesFoundationA 501(c)(3) Nonprofit
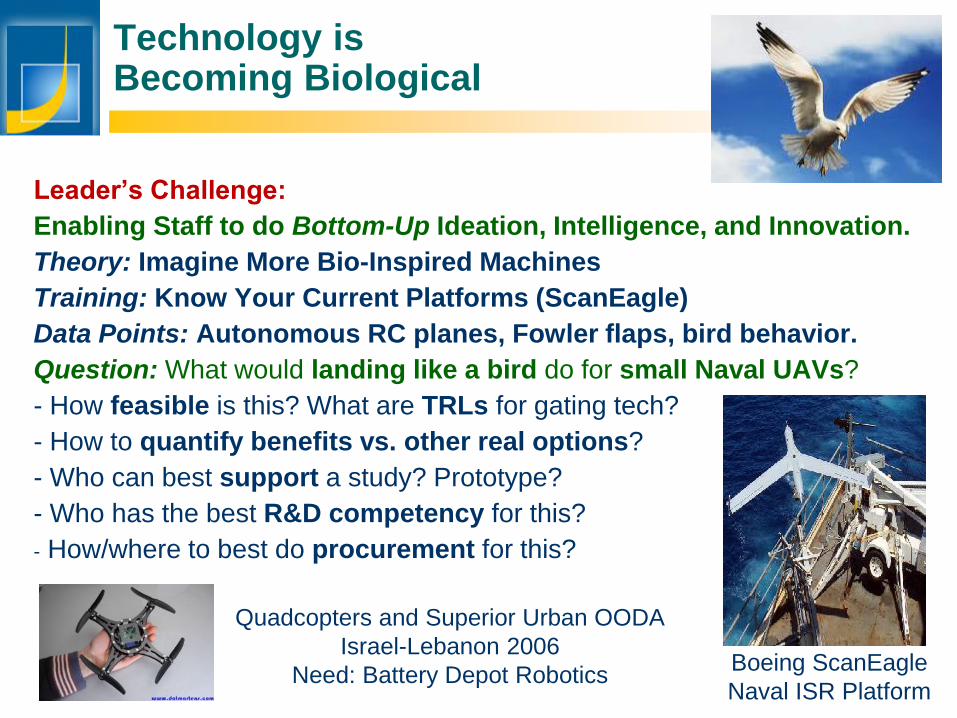
Technology is Becoming Biological
Leader’s Challenge:
Enabling Staff to do Bottom-Up Ideation, Intelligence, and Innovation.
Theory: Imagine More Bio-Inspired Machines
Training: Know Your Current Platforms (ScanEagle)
Data Points: Autonomous RC planes, Fowler flaps, bird behavior.
Question: What would landing like a bird do for small Naval UAVs?
- How feasible is this? What are TRLs for gating tech?
- How to quantify benefits vs. other real options?
- Who can best support a study? Prototype?
- Who has the best R&D competency for this?
- How/where to best do procurement for this?
Boeing ScanEagle
Naval ISR Platform
Quadcopters and Superior Urban OODA
Israel-Lebanon 2006
Need: Battery Depot Robotics
Los Angeles
New York
Palo Alto
AccelerationStudiesFoundationA 501(c)(3) Nonprofit
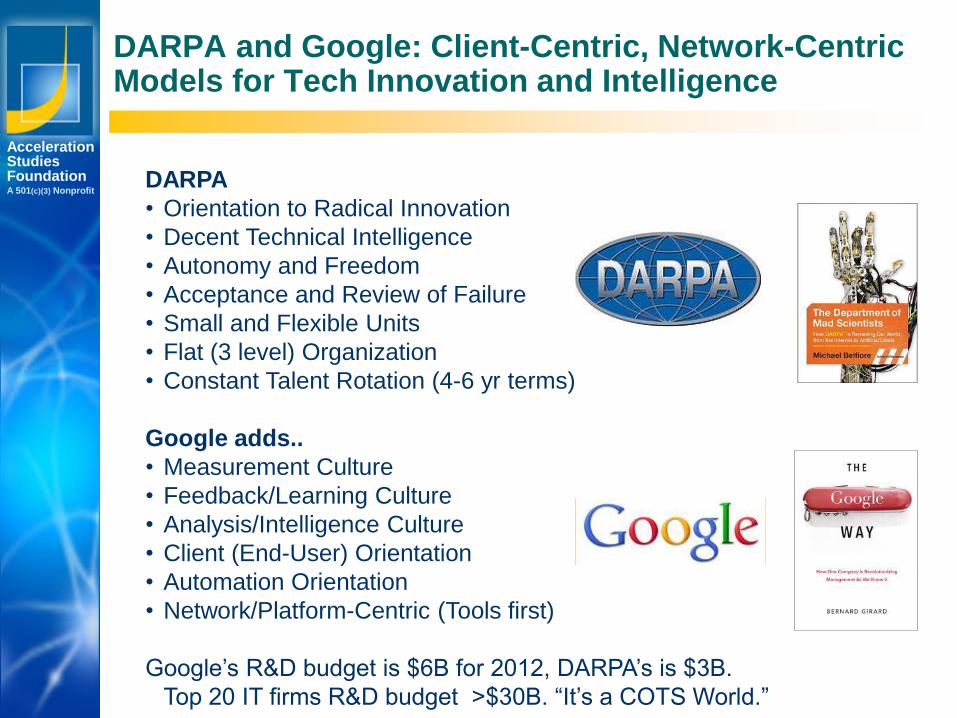
DARPA and Google: Client-Centric, Network-CentricModels for Tech Innovation and Intelligence
DARPA
• Orientation to Radical Innovation
• Decent Technical Intelligence
• Autonomy and Freedom
• Acceptance and Review of Failure
• Small and Flexible Units
• Flat (3 level) Organization
• Constant Talent Rotation (4-6 yr terms)
Google adds..
• Measurement Culture
• Feedback/Learning Culture
• Analysis/Intelligence Culture
• Client (End-User) Orientation
• Automation Orientation
• Network/Platform-Centric (Tools first)
Google’s R&D budget is $6B for 2012, DARPA’s is $3B.
Top 20 IT firms R&D budget >$30B. “It’s a COTS World.”
Los Angeles
New York
Palo Alto
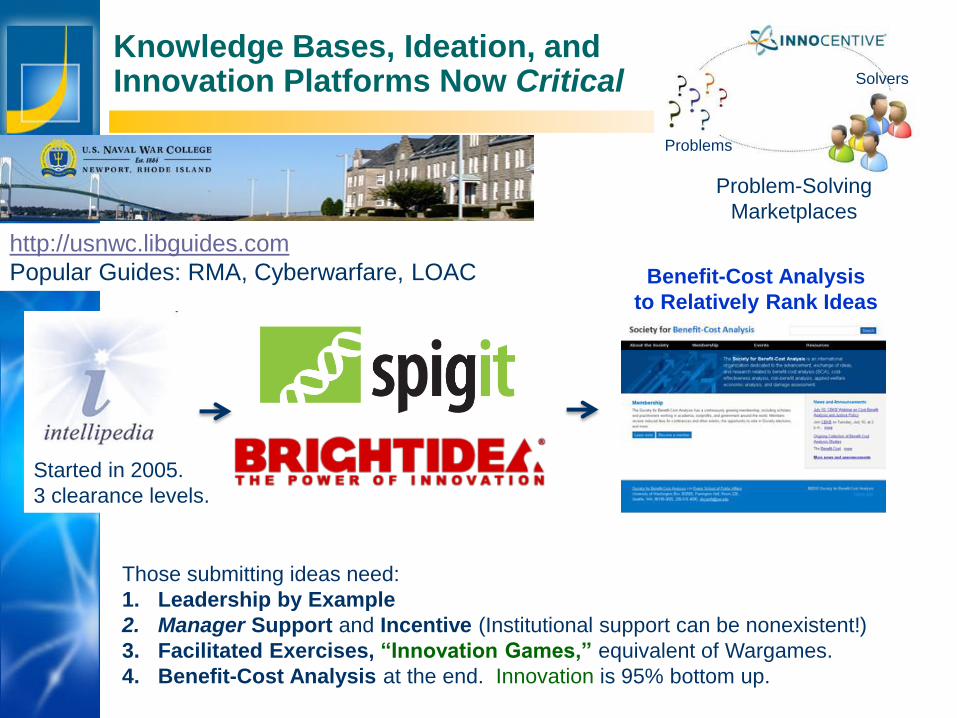
AccelerationStudiesFoundationA 501(c)(3) Nonprofit Problem-Solving
Marketplaces
Knowledge Bases, Ideation, andInnovation Platforms Now Critical
Those submitting ideas need:
1. Leadership by Example
2. Manager Support and Incentive (Institutional support can be nonexistent!)
3. Facilitated Exercises, “Innovation Games,” equivalent of Wargames.
4. Benefit-Cost Analysis at the end. Innovation is 95% bottom up.
Problems
Solvers
Benefit-Cost Analysis
to Relatively Rank Ideas
Started in 2005.
3 clearance levels.
http://usnwc.libguides.com
Popular Guides: RMA, Cyberwarfare, LOAC
Los Angeles
New York
Palo Alto
AccelerationStudiesFoundationA 501(c)(3) Nonprofit
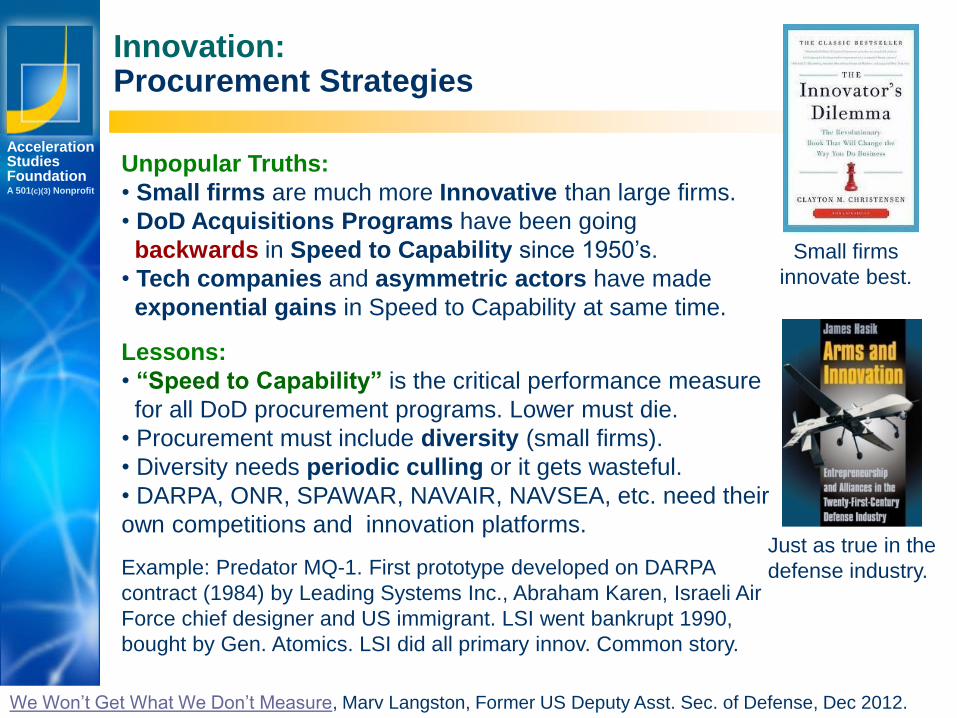
Innovation: Procurement Strategies
Unpopular Truths:
• Small firms are much more Innovative than large firms.
• DoD Acquisitions Programs have been going
backwards in Speed to Capability since 1950’s.
• Tech companies and asymmetric actors have made
exponential gains in Speed to Capability at same time.
Lessons:
• “Speed to Capability” is the critical performance measure
for all DoD procurement programs. Lower must die.
• Procurement must include diversity (small firms).
• Diversity needs periodic culling or it gets wasteful.
• DARPA, ONR, SPAWAR, NAVAIR, NAVSEA, etc. need their
own competitions and innovation platforms.
Example: Predator MQ-1. First prototype developed on DARPA
contract (1984) by Leading Systems Inc., Abraham Karen, Israeli Air
Force chief designer and US immigrant. LSI went bankrupt 1990,
bought by Gen. Atomics. LSI did all primary innov. Common story.
Small firms
innovate best.
Just as true in the
defense industry.
We Won’t Get What We Don’t Measure, Marv Langston, Former US Deputy Asst. Sec. of Defense, Dec 2012.
Los Angeles
New York
Palo Alto
AccelerationStudiesFoundationA 501(c)(3) Nonprofit
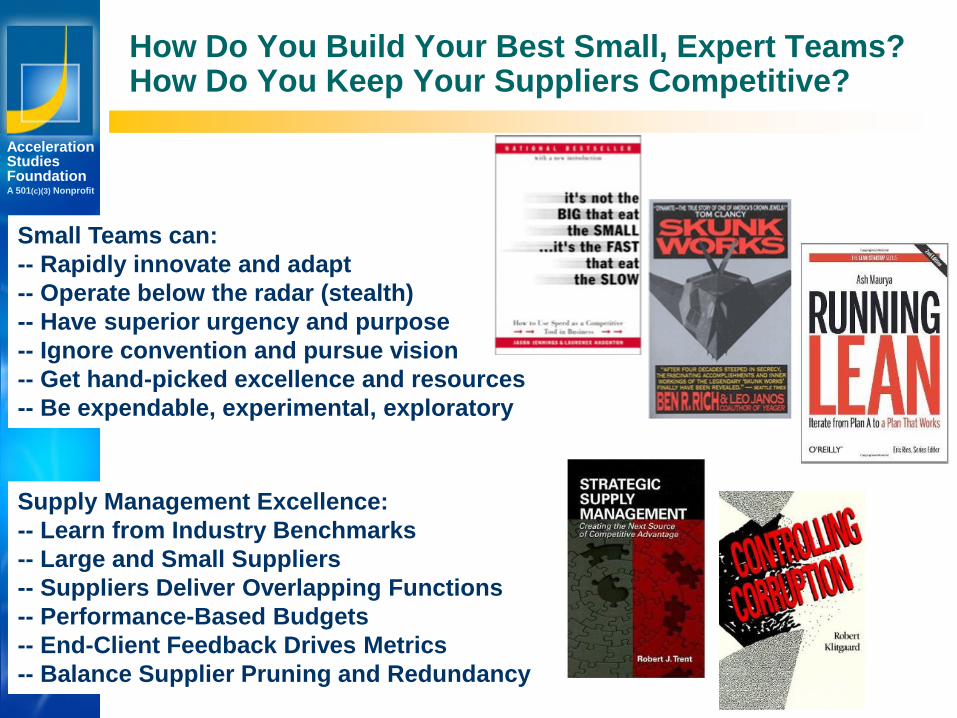
How Do You Build Your Best Small, Expert Teams?How Do You Keep Your Suppliers Competitive?
Small Teams can:
-- Rapidly innovate and adapt
-- Operate below the radar (stealth)
-- Have superior urgency and purpose
-- Ignore convention and pursue vision
-- Get hand-picked excellence and resources
-- Be expendable, experimental, exploratory
Supply Management Excellence:
-- Learn from Industry Benchmarks
-- Large and Small Suppliers
-- Suppliers Deliver Overlapping Functions
-- Performance-Based Budgets
-- End-Client Feedback Drives Metrics
-- Balance Supplier Pruning and Redundancy
Los Angeles
New York
Palo Alto
AccelerationStudiesFoundationA 501(c)(3) Nonprofit
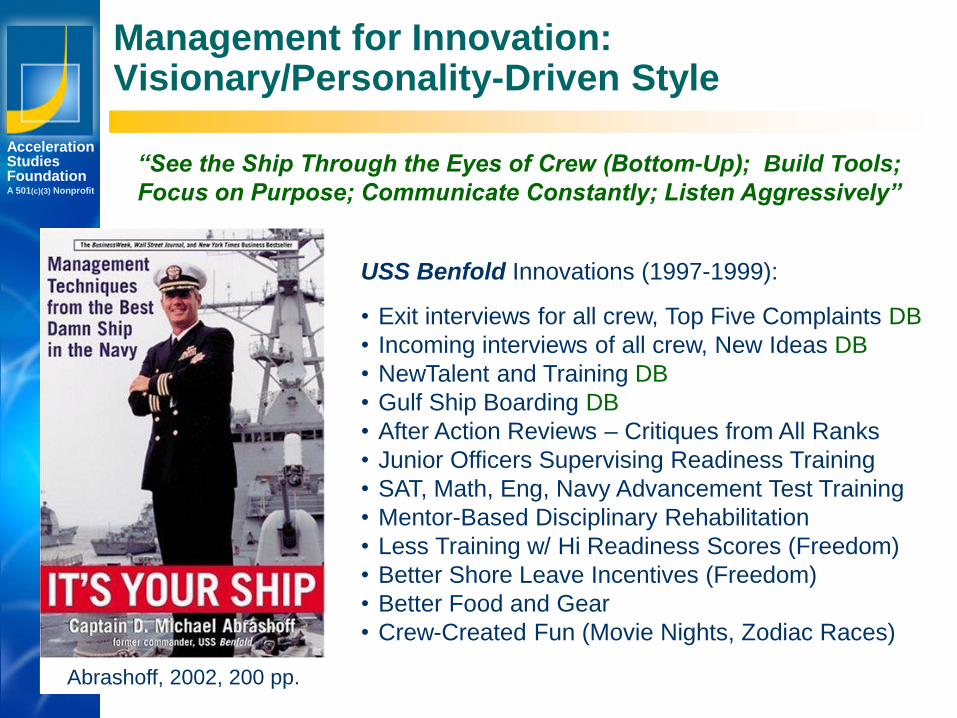
Management for Innovation:Visionary/Personality-Driven Style
USS Benfold Innovations (1997-1999):
• Exit interviews for all crew, Top Five Complaints DB
• Incoming interviews of all crew, New Ideas DB
• NewTalent and Training DB
• Gulf Ship Boarding DB
• After Action Reviews – Critiques from All Ranks
• Junior Officers Supervising Readiness Training
• SAT, Math, Eng, Navy Advancement Test Training
• Mentor-Based Disciplinary Rehabilitation
• Less Training w/ Hi Readiness Scores (Freedom)
• Better Shore Leave Incentives (Freedom)
• Better Food and Gear
• Crew-Created Fun (Movie Nights, Zodiac Races)
Abrashoff, 2002, 200 pp.
“See the Ship Through the Eyes of Crew (Bottom-Up); Build Tools;
Focus on Purpose; Communicate Constantly; Listen Aggressively”
Los Angeles
New York
Palo Alto
AccelerationStudiesFoundationA 501(c)(3) Nonprofit
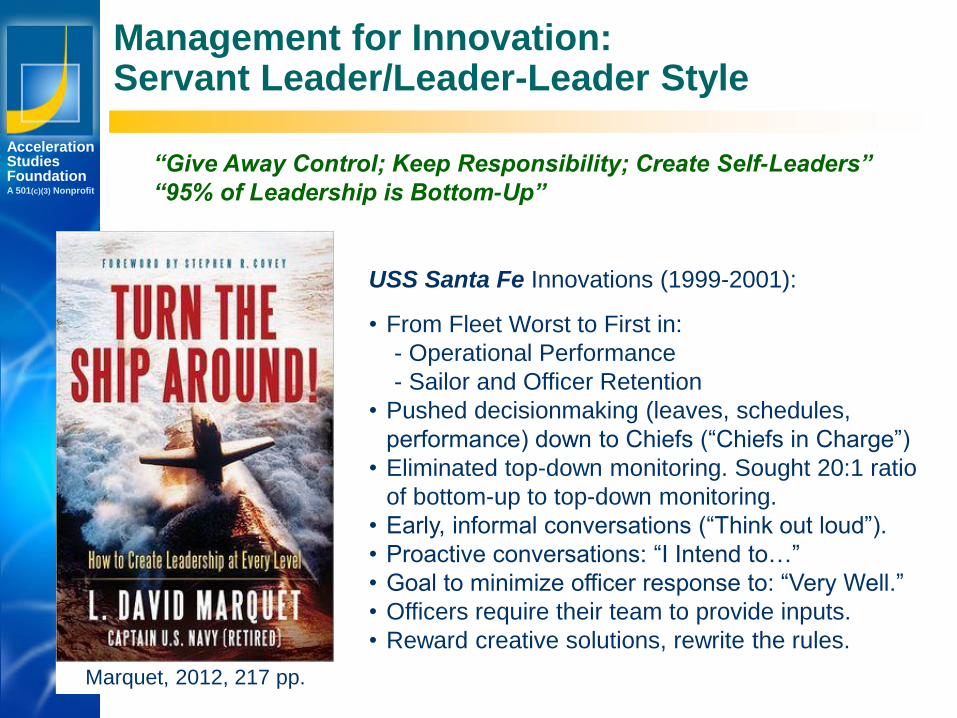
Management for Innovation:Servant Leader/Leader-Leader Style
USS Santa Fe Innovations (1999-2001):
• From Fleet Worst to First in:
- Operational Performance
- Sailor and Officer Retention
• Pushed decisionmaking (leaves, schedules,
performance) down to Chiefs (“Chiefs in Charge”)
• Eliminated top-down monitoring. Sought 20:1 ratio
of bottom-up to top-down monitoring.
• Early, informal conversations (“Think out loud”).
• Proactive conversations: “I Intend to…”
• Goal to minimize officer response to: “Very Well.”
• Officers require their team to provide inputs.
• Reward creative solutions, rewrite the rules.
Marquet, 2012, 217 pp.
“Give Away Control; Keep Responsibility; Create Self-Leaders”
“95% of Leadership is Bottom-Up”
Los Angeles
New York
Palo Alto
AccelerationStudiesFoundationA 501(c)(3) Nonprofit
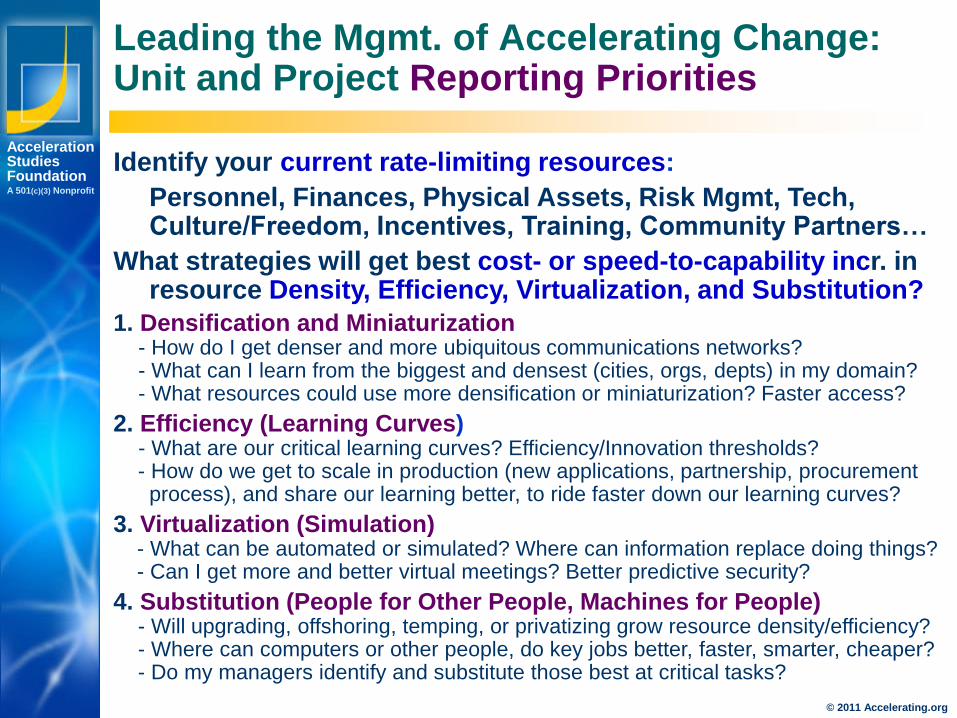
Leading the Mgmt. of Accelerating Change:Unit and Project Reporting Priorities
Identify your current rate-limiting resources:
Personnel, Finances, Physical Assets, Risk Mgmt, Tech, Culture/Freedom, Incentives, Training, Community Partners…
What strategies will get best cost- or speed-to-capability incr. in resource Density, Efficiency, Virtualization, and Substitution?
1. Densification and Miniaturization- How do I get denser and more ubiquitous communications networks?- What can I learn from the biggest and densest (cities, orgs, depts) in my domain?- What resources could use more densification or miniaturization? Faster access?
2. Efficiency (Learning Curves)- What are our critical learning curves? Efficiency/Innovation thresholds?- How do we get to scale in production (new applications, partnership, procurement process), and share our learning better, to ride faster down our learning curves?
3. Virtualization (Simulation)- What can be automated or simulated? Where can information replace doing things? - Can I get more and better virtual meetings? Better predictive security?
4. Substitution (People for Other People, Machines for People)- Will upgrading, offshoring, temping, or privatizing grow resource density/efficiency?- Where can computers or other people, do key jobs better, faster, smarter, cheaper? - Do my managers identify and substitute those best at critical tasks?
© 2011 Accelerating.org
Los Angeles
New York
Palo Alto
AccelerationStudiesFoundationA 501(c)(3) Nonprofit
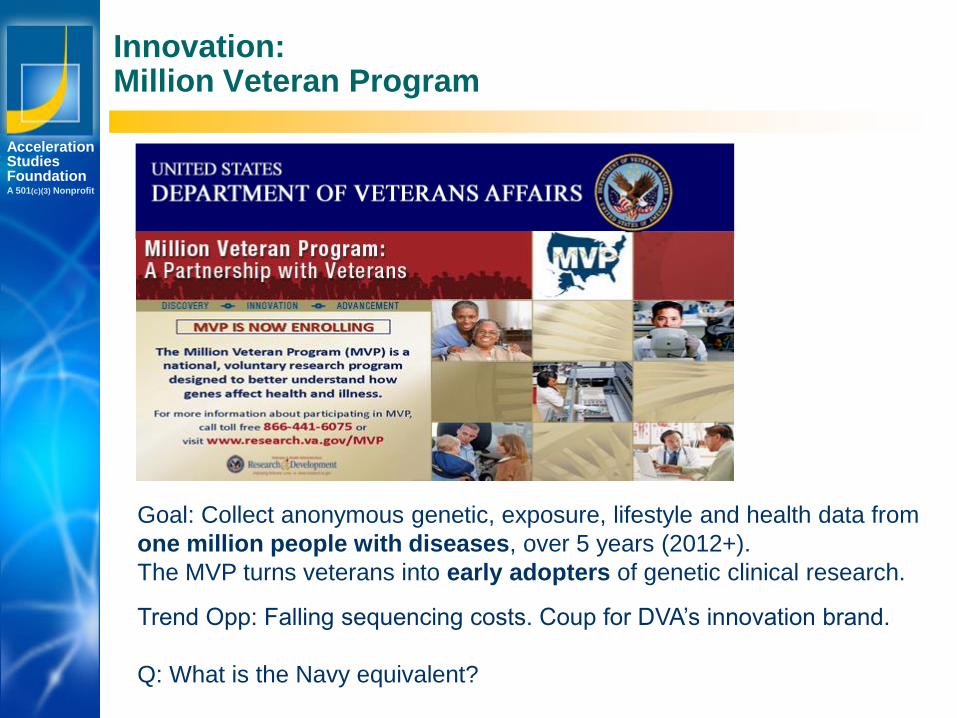
Innovation: Million Veteran Program
Goal: Collect anonymous genetic, exposure, lifestyle and health data from
one million people with diseases, over 5 years (2012+).
The MVP turns veterans into early adopters of genetic clinical research.
Trend Opp: Falling sequencing costs. Coup for DVA’s innovation brand.
Q: What is the Navy equivalent?
Los Angeles
New York
Palo Alto
AccelerationStudiesFoundationA 501(c)(3) Nonprofit
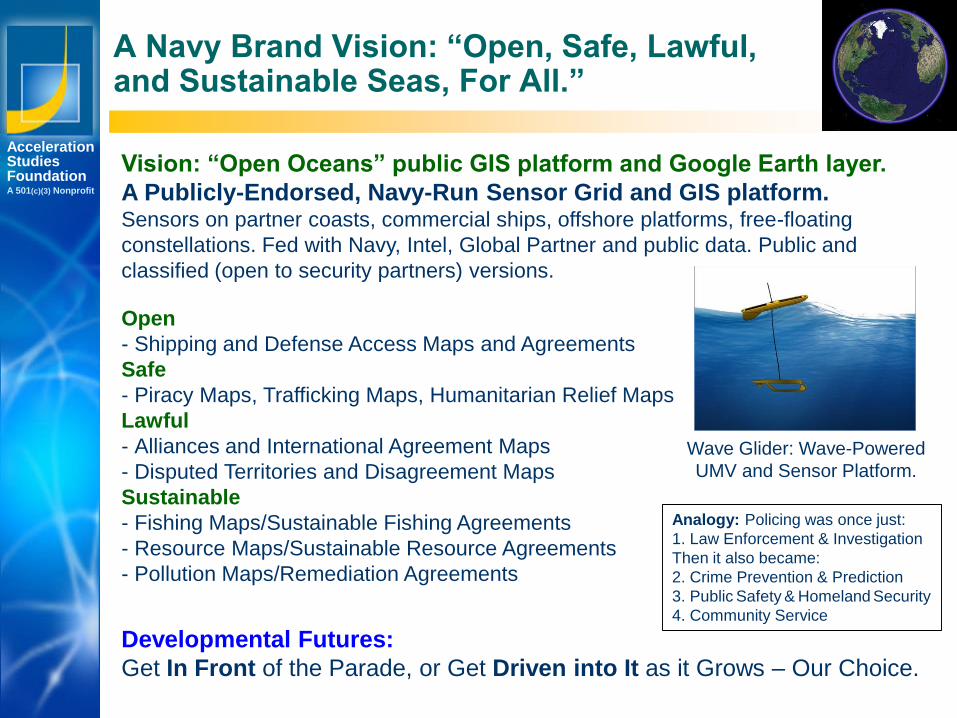
A Navy Brand Vision: “Open, Safe, Lawful, and Sustainable Seas, For All.”
Vision: “Open Oceans” public GIS platform and Google Earth layer.
A Publicly-Endorsed, Navy-Run Sensor Grid and GIS platform. Sensors on partner coasts, commercial ships, offshore platforms, free-floating
constellations. Fed with Navy, Intel, Global Partner and public data. Public and
classified (open to security partners) versions.
Open
- Shipping and Defense Access Maps and Agreements
Safe
- Piracy Maps, Trafficking Maps, Humanitarian Relief Maps
Lawful
- Alliances and International Agreement Maps
- Disputed Territories and Disagreement Maps
Sustainable
- Fishing Maps/Sustainable Fishing Agreements
- Resource Maps/Sustainable Resource Agreements
- Pollution Maps/Remediation Agreements
Developmental Futures:
Get In Front of the Parade, or Get Driven into It as it Grows – Our Choice.
Analogy: Policing was once just:
1. Law Enforcement & Investigation
Then it also became:
2. Crime Prevention & Prediction
3. Public Safety & Homeland Security
4. Community Service
Wave Glider: Wave-Powered
UMV and Sensor Platform.
Los Angeles
New York
Palo Alto
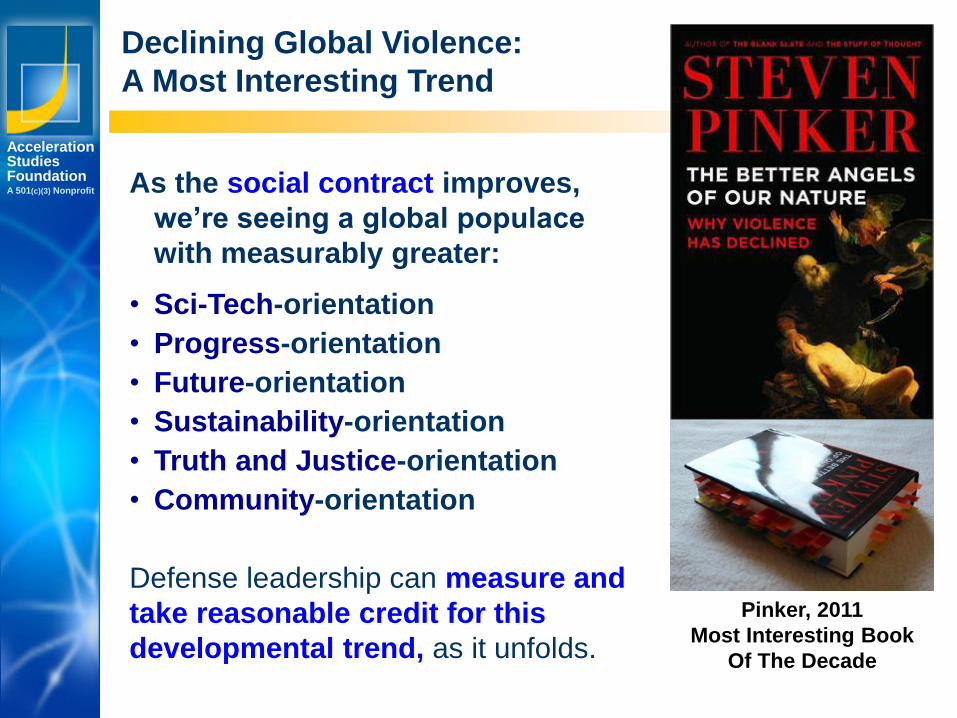
AccelerationStudiesFoundationA 501(c)(3) Nonprofit As the social contract improves,
we’re seeing a global populace
with measurably greater:
• Sci-Tech-orientation
• Progress-orientation
• Future-orientation
• Sustainability-orientation
• Truth and Justice-orientation
• Community-orientation
Defense leadership can measure and
take reasonable credit for this
developmental trend, as it unfolds.
Pinker, 2011
Most Interesting Book
Of The Decade
Declining Global Violence:
A Most Interesting Trend
Technology Foresight and ForecastingKey Elements
Los Angeles
New York
Palo Alto
AccelerationStudiesFoundationA 501(c)(3) Nonprofit
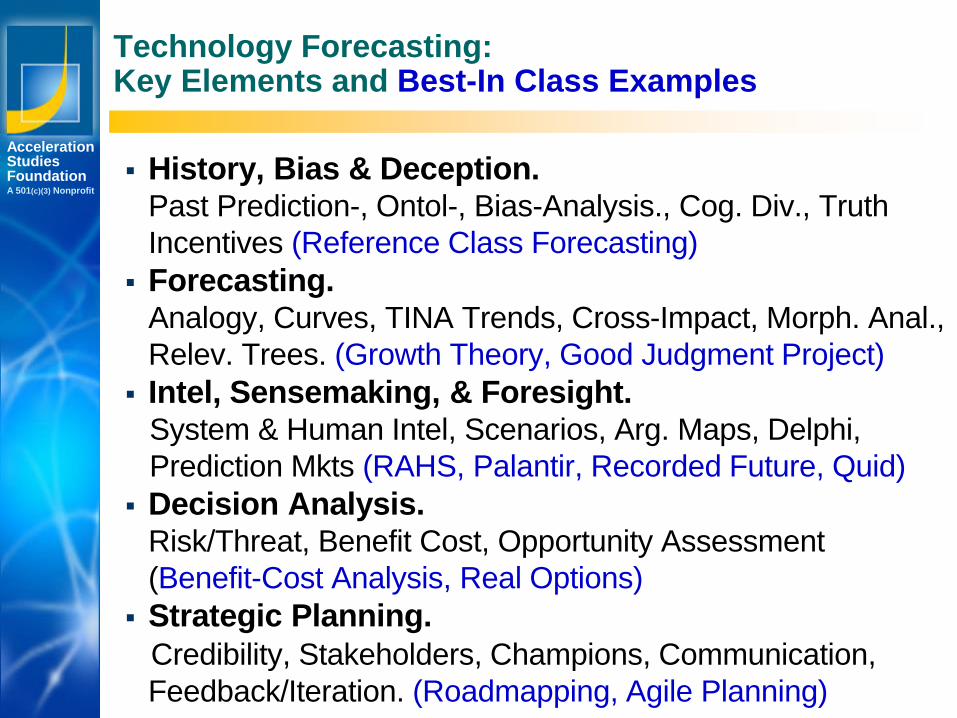
Technology Forecasting: Key Elements and Best-In Class Examples
History, Bias & Deception. Past Prediction-, Ontol-, Bias-Analysis., Cog. Div., Truth
Incentives (Reference Class Forecasting)
Forecasting.Analogy, Curves, TINA Trends, Cross-Impact, Morph. Anal.,
Relev. Trees. (Growth Theory, Good Judgment Project)
Intel, Sensemaking, & Foresight.System & Human Intel, Scenarios, Arg. Maps, Delphi,
Prediction Mkts (RAHS, Palantir, Recorded Future, Quid)
Decision Analysis. Risk/Threat, Benefit Cost, Opportunity Assessment
(Benefit-Cost Analysis, Real Options)
Strategic Planning.
Credibility, Stakeholders, Champions, Communication,
Feedback/Iteration. (Roadmapping, Agile Planning)
Los Angeles
New York
Palo Alto
AccelerationStudiesFoundationA 501(c)(3) Nonprofit
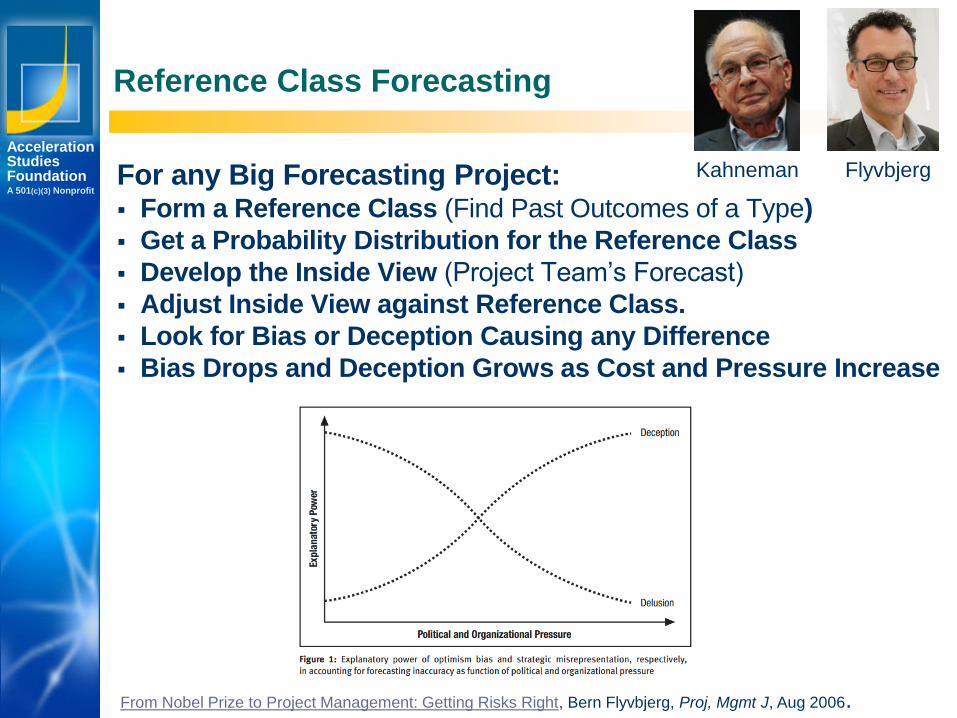
Reference Class Forecasting
For any Big Forecasting Project: Form a Reference Class (Find Past Outcomes of a Type)
Get a Probability Distribution for the Reference Class
Develop the Inside View (Project Team’s Forecast)
Adjust Inside View against Reference Class.
Look for Bias or Deception Causing any Difference
Bias Drops and Deception Grows as Cost and Pressure Increase
From Nobel Prize to Project Management: Getting Risks Right, Bern Flyvbjerg, Proj, Mgmt J, Aug 2006.
FlyvbjergKahneman
Los Angeles
New York
Palo Alto
AccelerationStudiesFoundationA 501(c)(3) Nonprofit
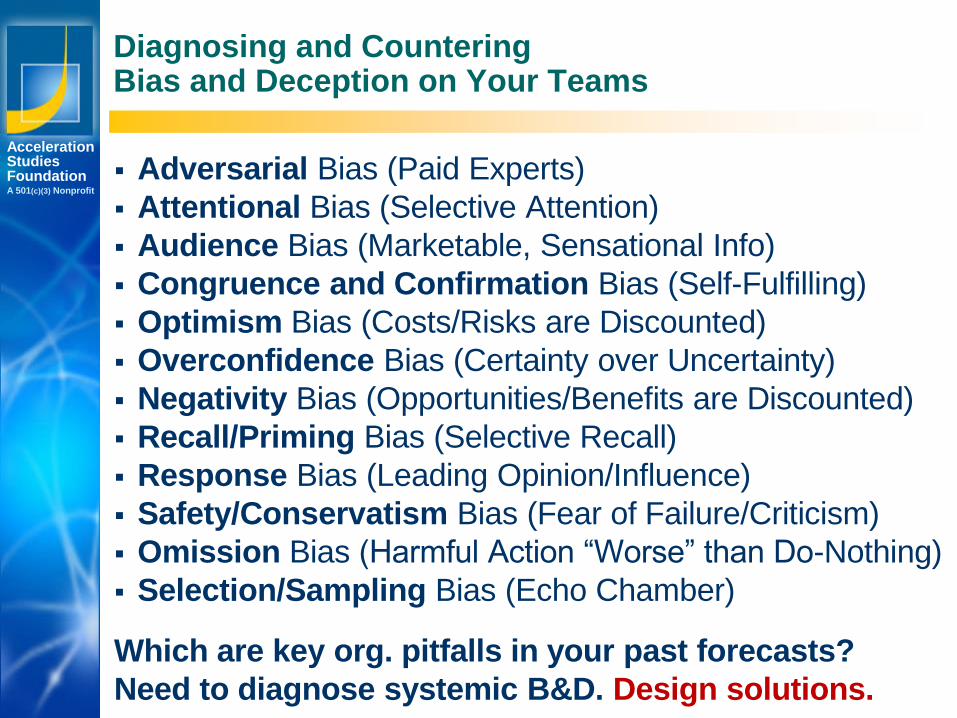
Diagnosing and Countering Bias and Deception on Your Teams
Adversarial Bias (Paid Experts)
Attentional Bias (Selective Attention)
Audience Bias (Marketable, Sensational Info)
Congruence and Confirmation Bias (Self-Fulfilling)
Optimism Bias (Costs/Risks are Discounted)
Overconfidence Bias (Certainty over Uncertainty)
Negativity Bias (Opportunities/Benefits are Discounted)
Recall/Priming Bias (Selective Recall)
Response Bias (Leading Opinion/Influence)
Safety/Conservatism Bias (Fear of Failure/Criticism)
Omission Bias (Harmful Action “Worse” than Do-Nothing)
Selection/Sampling Bias (Echo Chamber)
Which are key org. pitfalls in your past forecasts?
Need to diagnose systemic B&D. Design solutions.
Los Angeles
New York
Palo Alto
AccelerationStudiesFoundationA 501(c)(3) Nonprofit
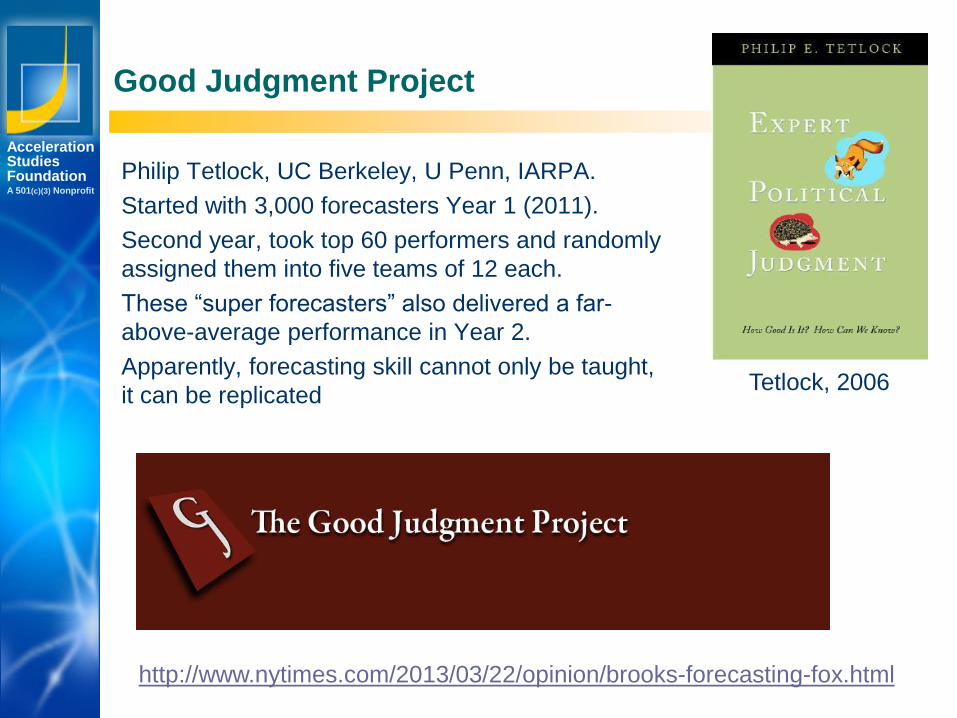
Good Judgment Project
Philip Tetlock, UC Berkeley, U Penn, IARPA.
Started with 3,000 forecasters Year 1 (2011).
Second year, took top 60 performers and randomly
assigned them into five teams of 12 each.
These “super forecasters” also delivered a far-
above-average performance in Year 2.
Apparently, forecasting skill cannot only be taught,
it can be replicatedTetlock, 2006
http://www.nytimes.com/2013/03/22/opinion/brooks-forecasting-fox.html
Los Angeles
New York
Palo Alto
AccelerationStudiesFoundationA 501(c)(3) Nonprofit
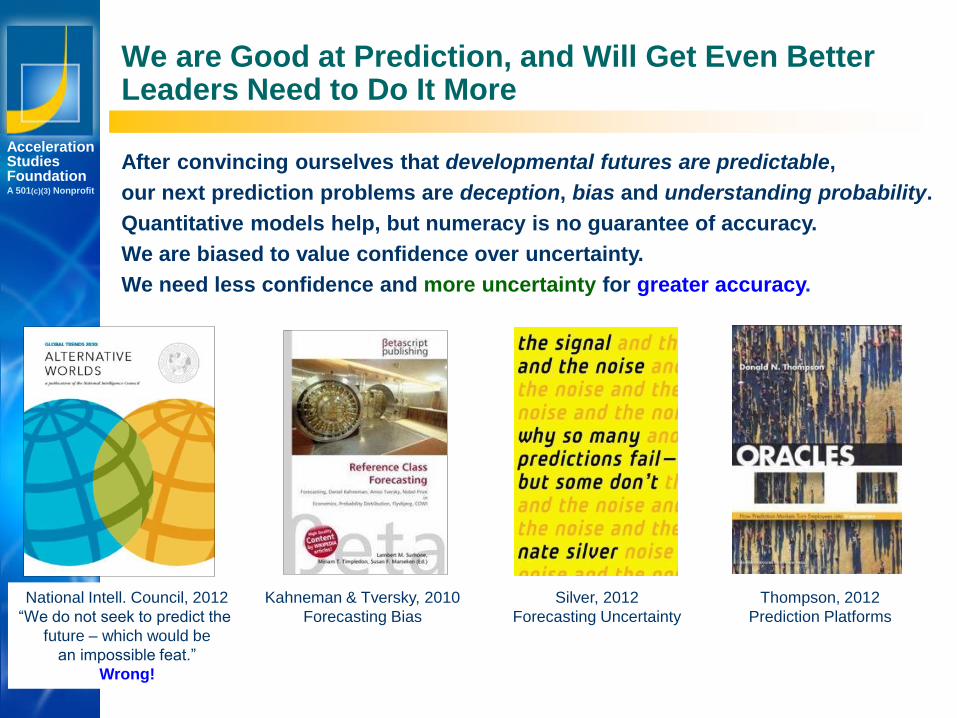
We are Good at Prediction, and Will Get Even BetterLeaders Need to Do It More
After convincing ourselves that developmental futures are predictable,
our next prediction problems are deception, bias and understanding probability.
Quantitative models help, but numeracy is no guarantee of accuracy.
We are biased to value confidence over uncertainty.
We need less confidence and more uncertainty for greater accuracy.
Silver, 2012
Forecasting Uncertainty
Thompson, 2012
Prediction Platforms
Kahneman & Tversky, 2010
Forecasting Bias
National Intell. Council, 2012
“We do not seek to predict the
future – which would be
an impossible feat.”
Wrong!
Los Angeles
New York
Palo Alto
AccelerationStudiesFoundationA 501(c)(3) Nonprofit
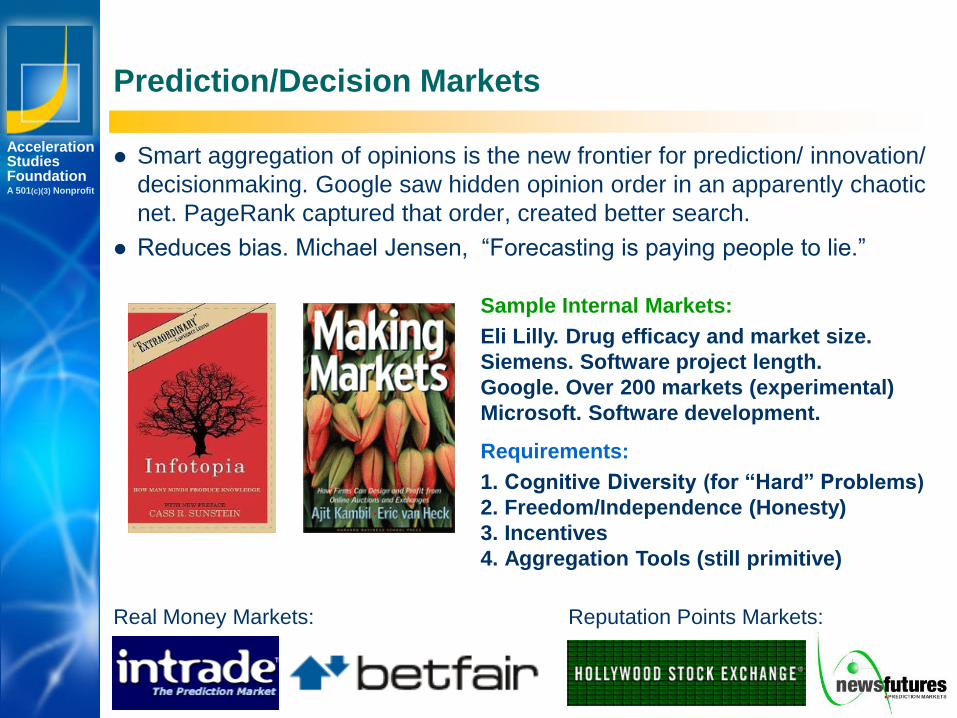
Prediction/Decision Markets
Smart aggregation of opinions is the new frontier for prediction/ innovation/
decisionmaking. Google saw hidden opinion order in an apparently chaotic
net. PageRank captured that order, created better search.
Reduces bias. Michael Jensen, “Forecasting is paying people to lie.”
Sample Internal Markets:
Eli Lilly. Drug efficacy and market size.
Siemens. Software project length.
Google. Over 200 markets (experimental)
Microsoft. Software development.
Requirements:
1. Cognitive Diversity (for “Hard” Problems)
2. Freedom/Independence (Honesty)
3. Incentives
4. Aggregation Tools (still primitive)
Real Money Markets: Reputation Points Markets:
Los Angeles
New York
Palo Alto
AccelerationStudiesFoundationA 501(c)(3) Nonprofit
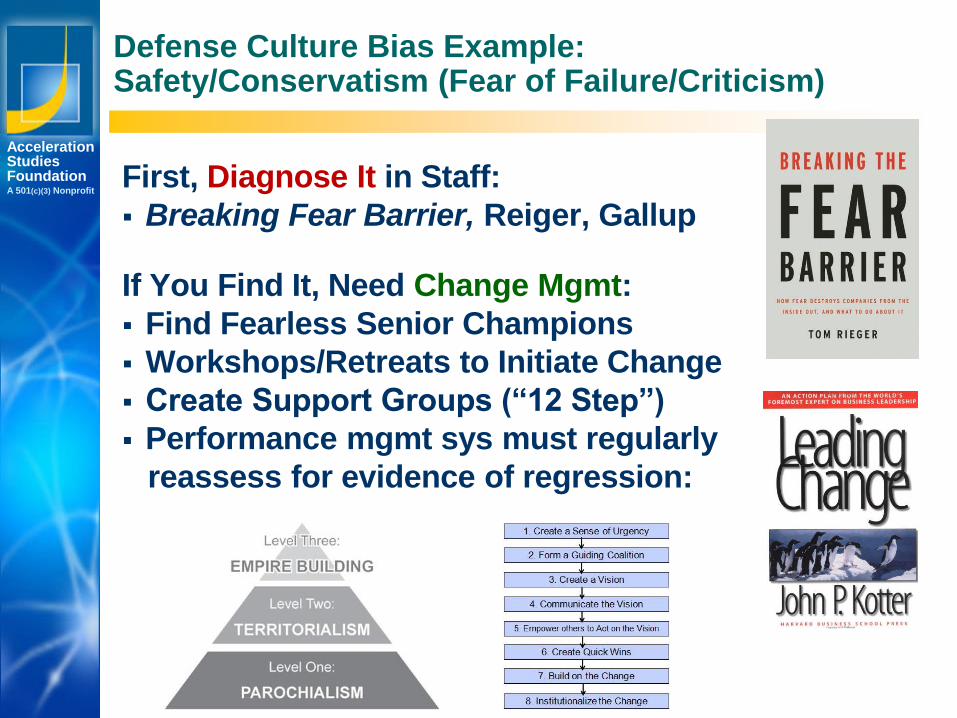
Defense Culture Bias Example:Safety/Conservatism (Fear of Failure/Criticism)
First, Diagnose It in Staff:
Breaking Fear Barrier, Reiger, Gallup
If You Find It, Need Change Mgmt:
Find Fearless Senior Champions
Workshops/Retreats to Initiate Change
Create Support Groups (“12 Step”)
Performance mgmt sys must regularly
reassess for evidence of regression:
Los Angeles
New York
Palo Alto
AccelerationStudiesFoundationA 501(c)(3) Nonprofit
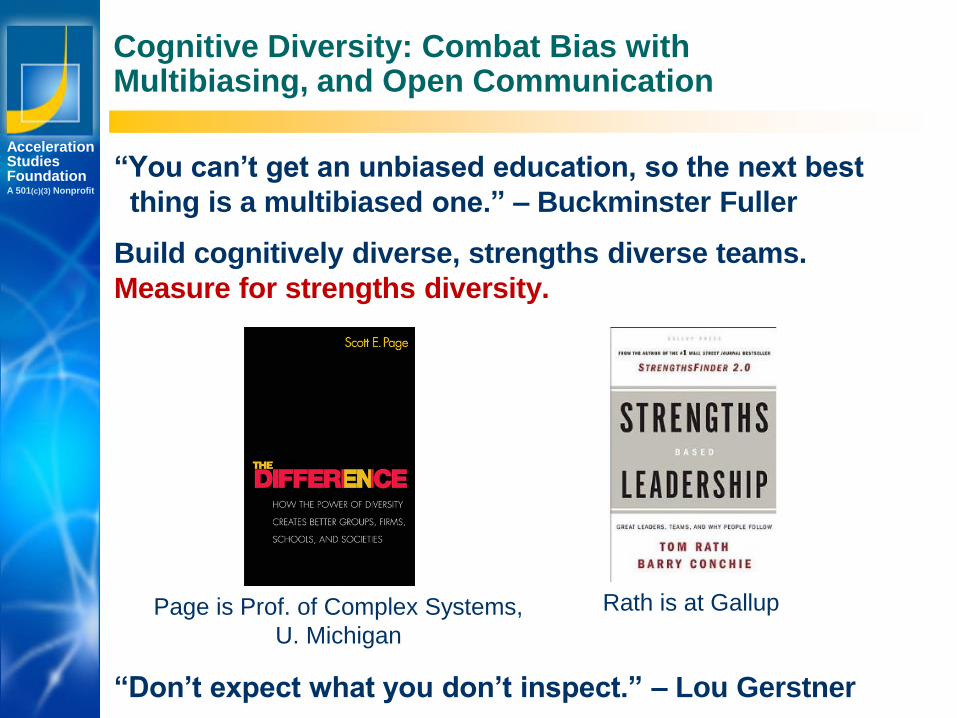
Cognitive Diversity: Combat Bias with Multibiasing, and Open Communication
“You can’t get an unbiased education, so the next best
thing is a multibiased one.” – Buckminster Fuller
Build cognitively diverse, strengths diverse teams.
Measure for strengths diversity.
“Don’t expect what you don’t inspect.” – Lou Gerstner
Page is Prof. of Complex Systems,
U. Michigan
Rath is at Gallup
Los Angeles
New York
Palo Alto
AccelerationStudiesFoundationA 501(c)(3) Nonprofit
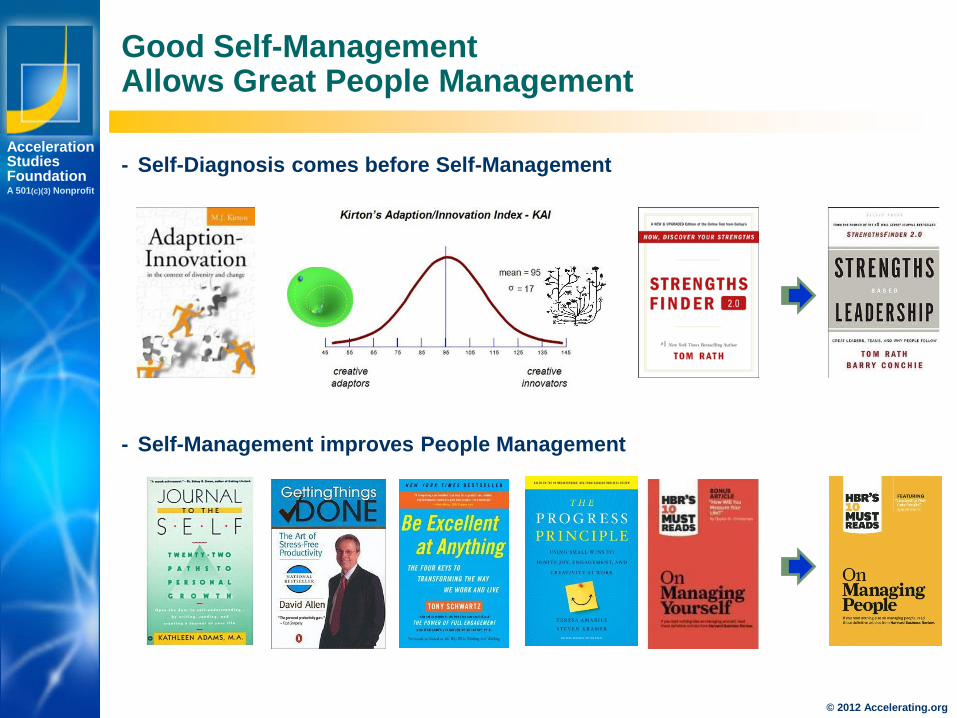
Good Self-Management Allows Great People Management
© 2012 Accelerating.org
- Self-Diagnosis comes before Self-Management
- Self-Management improves People Management
Los Angeles
New York
Palo Alto
AccelerationStudiesFoundationA 501(c)(3) Nonprofit
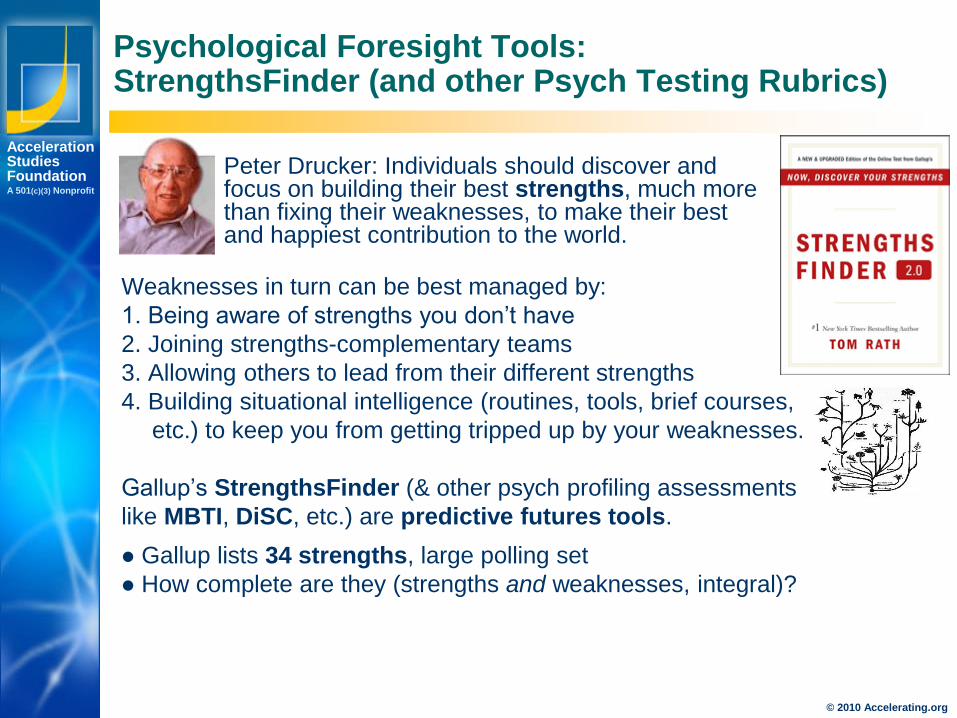
Psychological Foresight Tools:StrengthsFinder (and other Psych Testing Rubrics)
Peter Drucker: Individuals should discover and focus on building their best strengths, much more than fixing their weaknesses, to make their best and happiest contribution to the world.
Weaknesses in turn can be best managed by:
1. Being aware of strengths you don’t have
2. Joining strengths-complementary teams
3. Allowing others to lead from their different strengths
4. Building situational intelligence (routines, tools, brief courses,
etc.) to keep you from getting tripped up by your weaknesses.
Gallup’s StrengthsFinder (& other psych profiling assessments
like MBTI, DiSC, etc.) are predictive futures tools.
Gallup lists 34 strengths, large polling set
How complete are they (strengths and weaknesses, integral)?
© 2010 Accelerating.org
Los Angeles
New York
Palo Alto
AccelerationStudiesFoundationA 501(c)(3) Nonprofit
© 2010 Accelerating.org
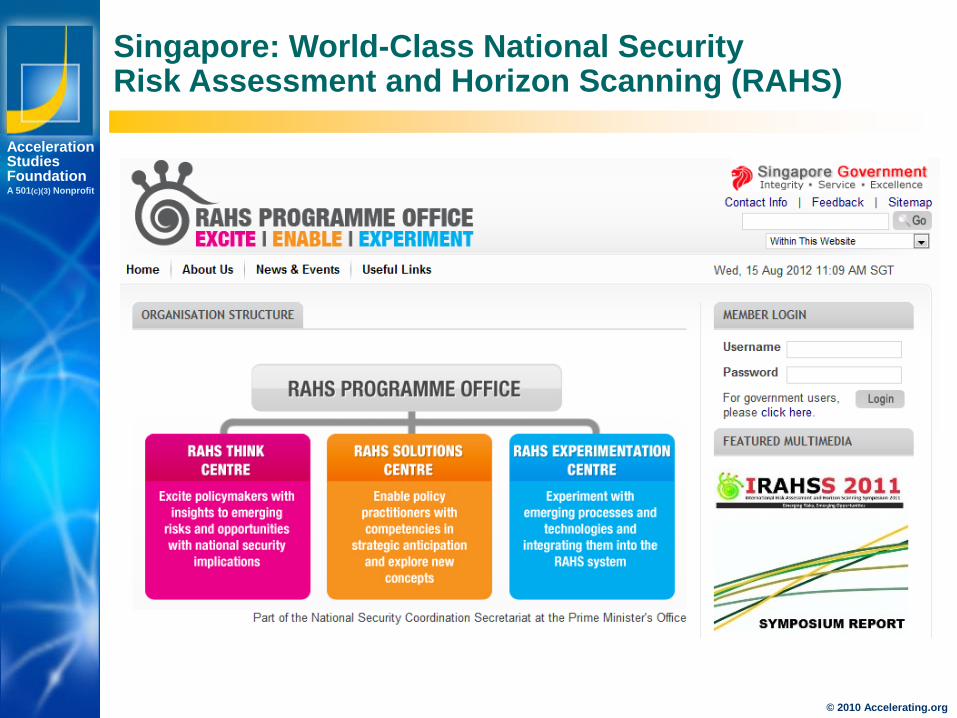
Singapore: World-Class National SecurityRisk Assessment and Horizon Scanning (RAHS)
Los Angeles
New York
Palo Alto
AccelerationStudiesFoundationA 501(c)(3) Nonprofit
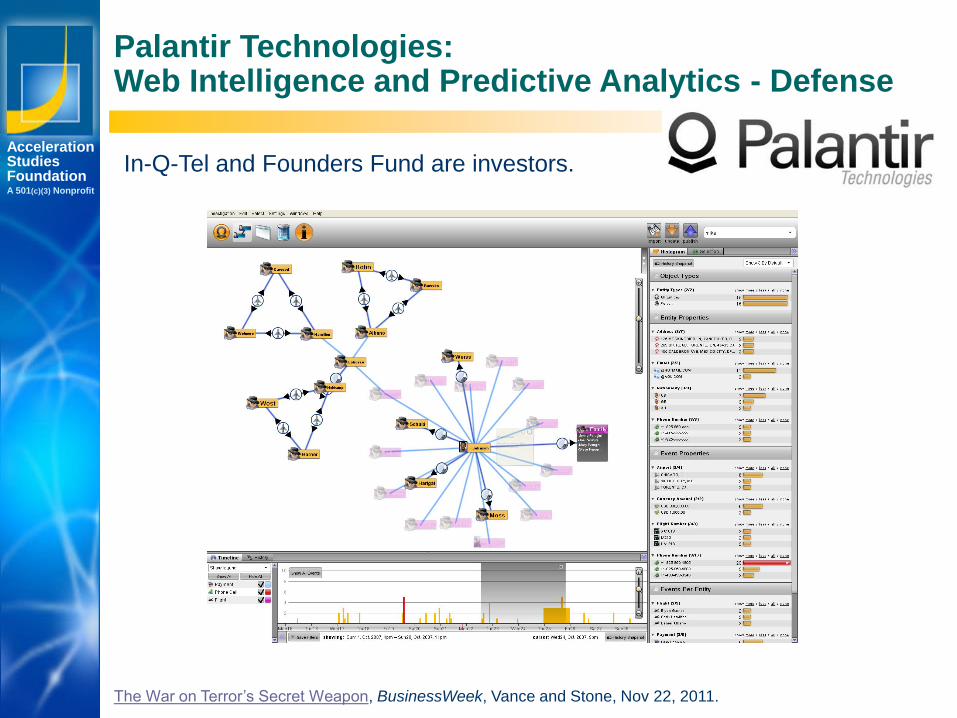
Palantir Technologies:Web Intelligence and Predictive Analytics - Defense
In-Q-Tel and Founders Fund are investors.
The War on Terror’s Secret Weapon, BusinessWeek, Vance and Stone, Nov 22, 2011.
Los Angeles
New York
Palo Alto
AccelerationStudiesFoundationA 501(c)(3) Nonprofit
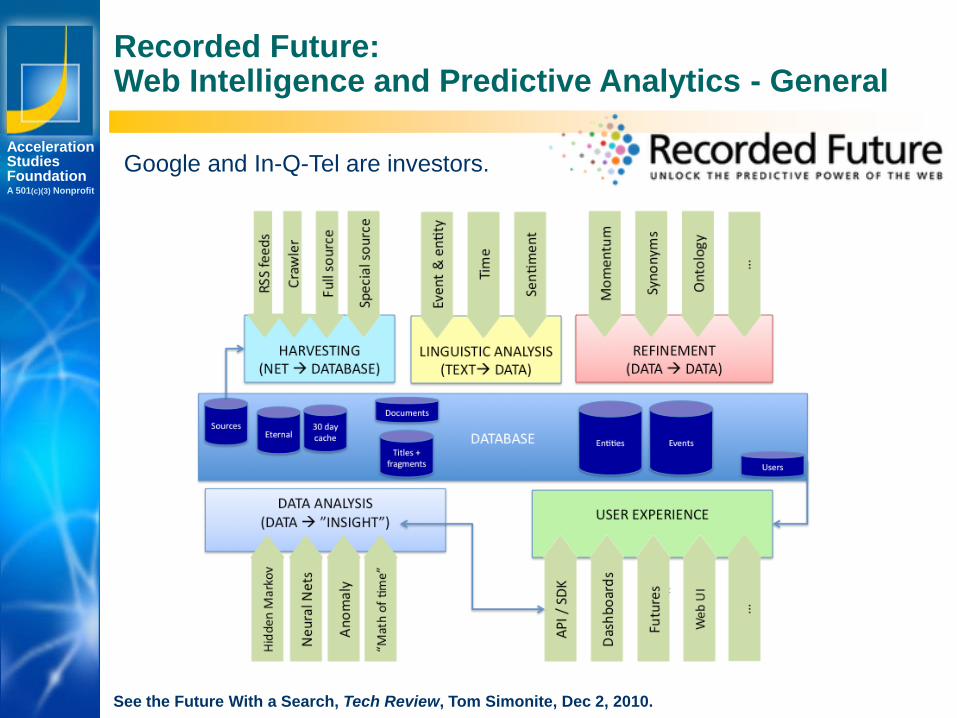
See the Future With a Search, Tech Review, Tom Simonite, Dec 2, 2010.
Recorded Future:Web Intelligence and Predictive Analytics - General
Google and In-Q-Tel are investors.
Los Angeles
New York
Palo Alto
AccelerationStudiesFoundationA 501(c)(3) Nonprofit
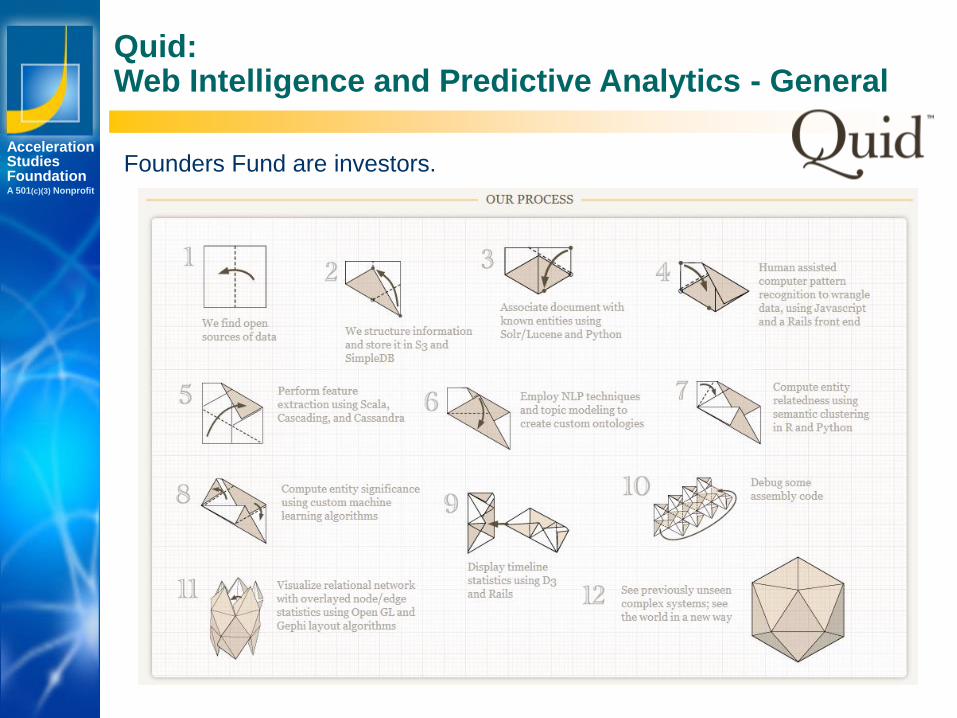
Quid:Web Intelligence and Predictive Analytics - General
Founders Fund are investors.
Growth Theory / Learning CurvesAn Evo Devo Taxonomy
Los Angeles
New York
Palo Alto
AccelerationStudiesFoundationA 501(c)(3) Nonprofit
© 2012 Accelerating.org
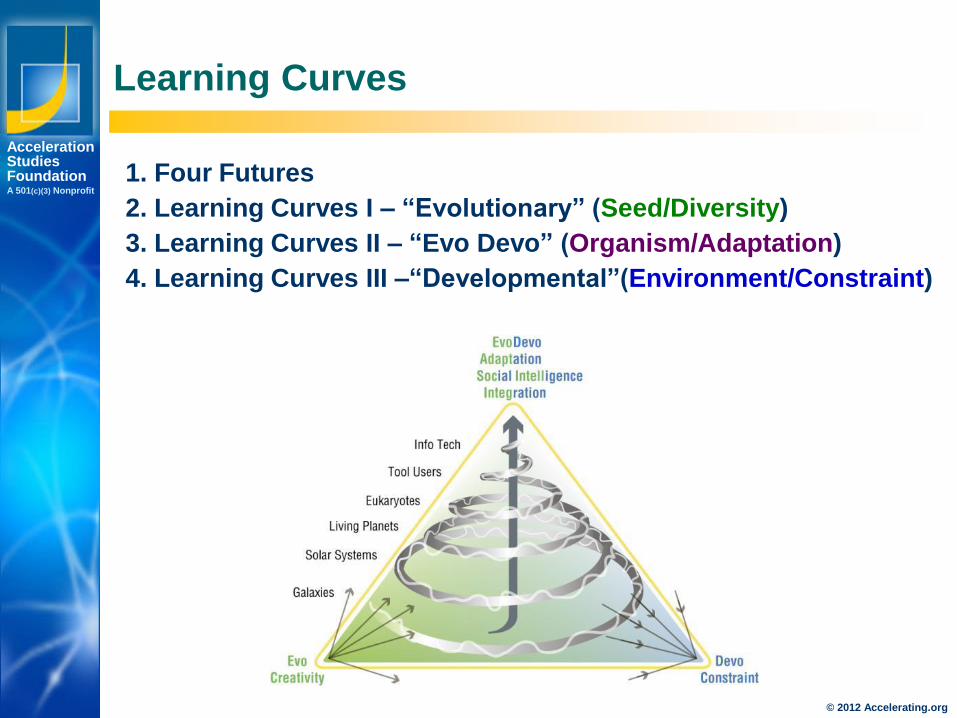
Learning Curves
1. Four Futures
2. Learning Curves I – “Evolutionary” (Seed/Diversity)
3. Learning Curves II – “Evo Devo” (Organism/Adaptation)
4. Learning Curves III –“Developmental”(Environment/Constraint)
Los Angeles
New York
Palo Alto
AccelerationStudiesFoundationA 501(c)(3) Nonprofit
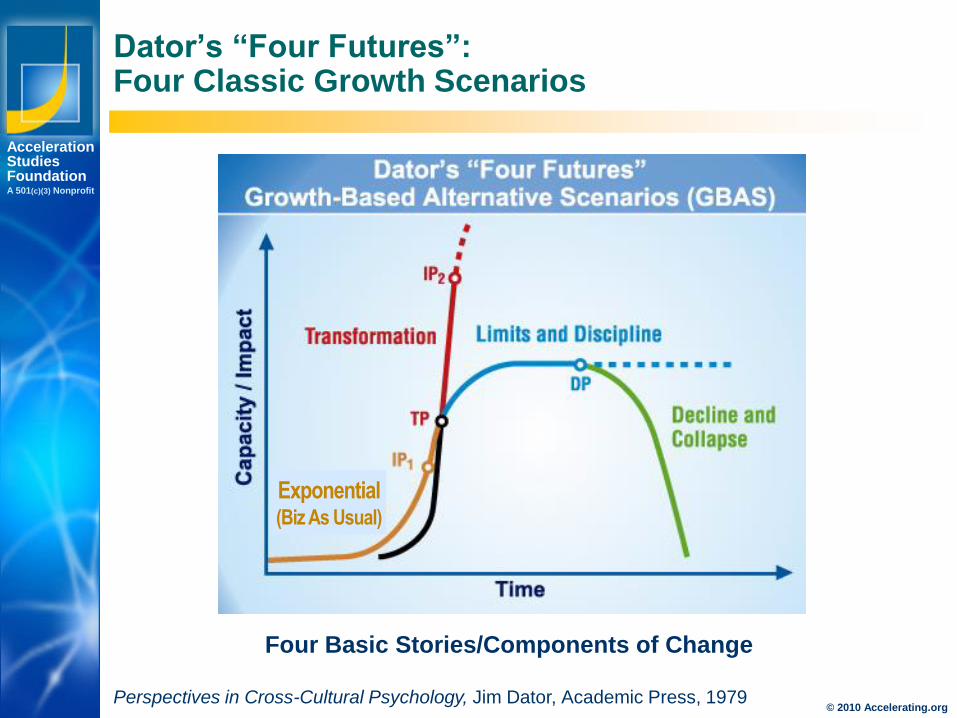
Dator’s “Four Futures”:Four Classic Growth Scenarios
Perspectives in Cross-Cultural Psychology, Jim Dator, Academic Press, 1979
Four Basic Stories/Components of Change
© 2010 Accelerating.org
Exponential(Biz As Usual)
Los Angeles
New York
Palo Alto
AccelerationStudiesFoundationA 501(c)(3) Nonprofit
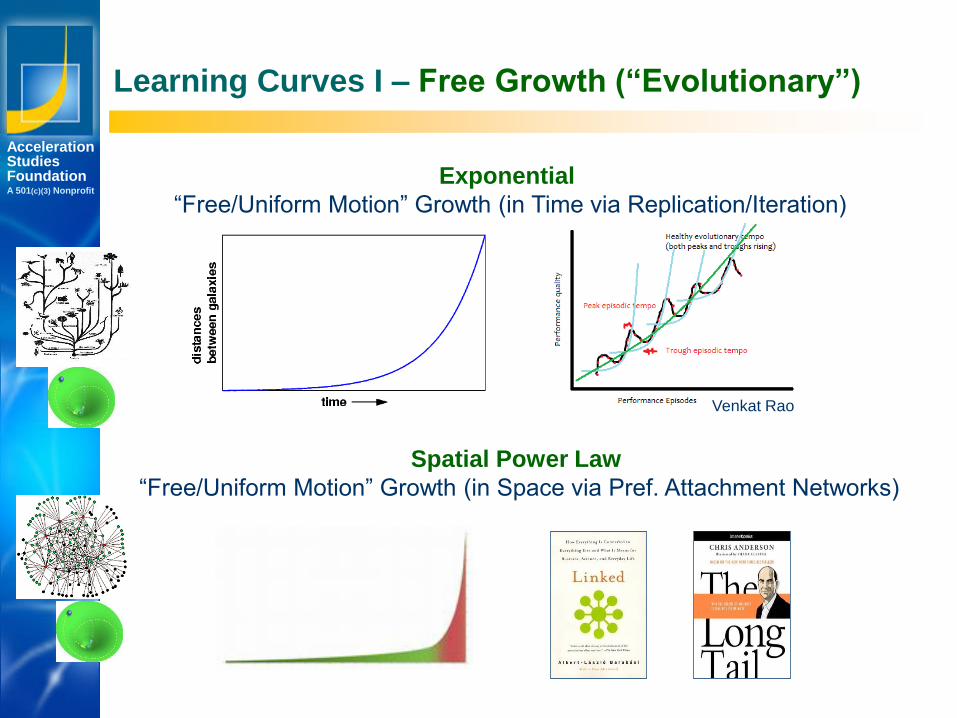
Learning Curves I – Free Growth (“Evolutionary”)
Exponential
“Free/Uniform Motion” Growth (in Time via Replication/Iteration)
Spatial Power Law
“Free/Uniform Motion” Growth (in Space via Pref. Attachment Networks)
Venkat Rao
Los Angeles
New York
Palo Alto
AccelerationStudiesFoundationA 501(c)(3) Nonprofit
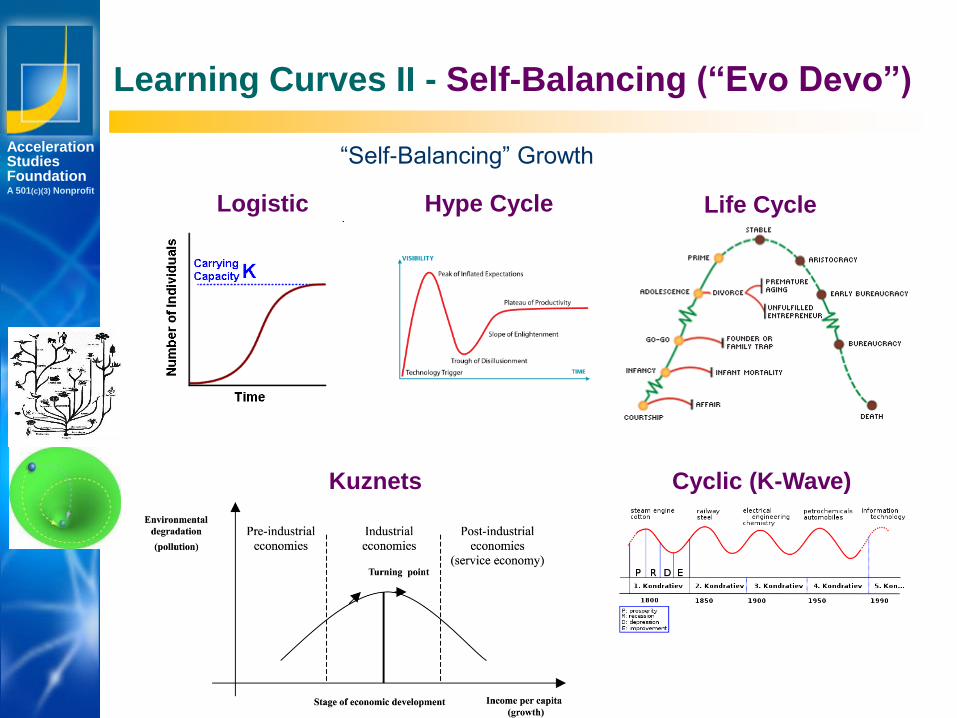
Learning Curves II - Self-Balancing (“Evo Devo”)
Logistic Hype Cycle
Kuznets Cyclic (K-Wave)
Life Cycle
“Self-Balancing” Growth
Los Angeles
New York
Palo Alto
AccelerationStudiesFoundationA 501(c)(3) Nonprofit
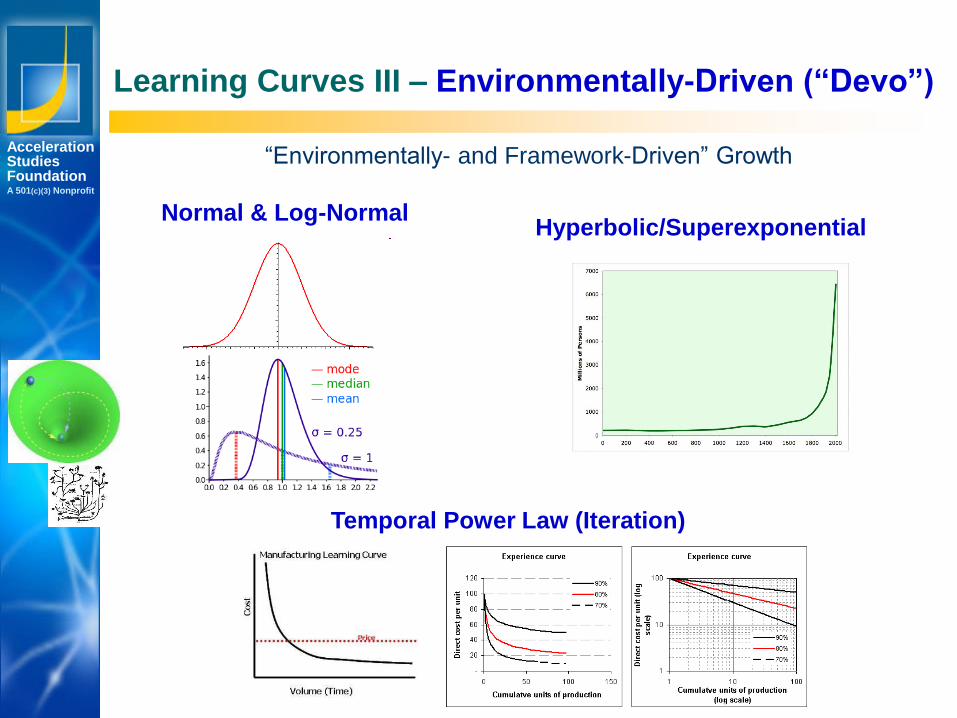
Learning Curves III – Environmentally-Driven (“Devo”)
Hyperbolic/SuperexponentialNormal & Log-Normal
Temporal Power Law (Iteration)
“Environmentally- and Framework-Driven” Growth
Learning CurvesA Few Interesting Examples
Los Angeles
New York
Palo Alto
AccelerationStudiesFoundationA 501(c)(3) Nonprofit
© 2011 Accelerating.org
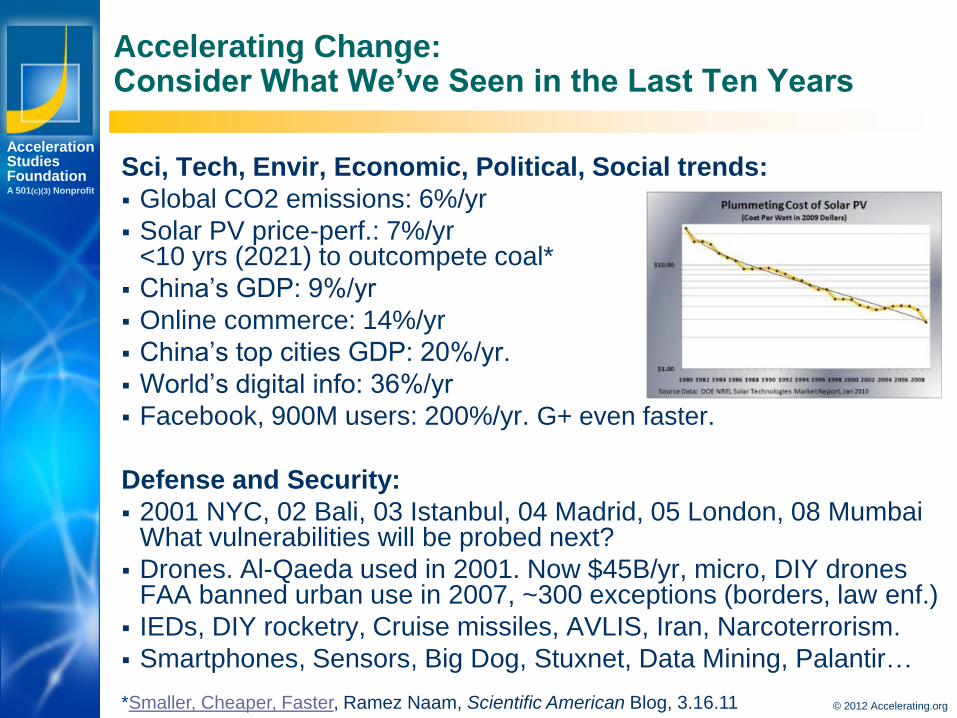
Sci, Tech, Envir, Economic, Political, Social trends:
Global CO2 emissions: 6%/yr
Solar PV price-perf.: 7%/yr <10 yrs (2021) to outcompete coal*
China’s GDP: 9%/yr
Online commerce: 14%/yr
China’s top cities GDP: 20%/yr.
World’s digital info: 36%/yr
Facebook, 900M users: 200%/yr. G+ even faster.
Defense and Security:
2001 NYC, 02 Bali, 03 Istanbul, 04 Madrid, 05 London, 08 MumbaiWhat vulnerabilities will be probed next?
Drones. Al-Qaeda used in 2001. Now $45B/yr, micro, DIY dronesFAA banned urban use in 2007, ~300 exceptions (borders, law enf.)
IEDs, DIY rocketry, Cruise missiles, AVLIS, Iran, Narcoterrorism.
Smartphones, Sensors, Big Dog, Stuxnet, Data Mining, Palantir…
Accelerating Change:Consider What We’ve Seen in the Last Ten Years
*Smaller, Cheaper, Faster, Ramez Naam, Scientific American Blog, 3.16.11 © 2012 Accelerating.org
Los Angeles
New York
Palo Alto
AccelerationStudiesFoundationA 501(c)(3) Nonprofit
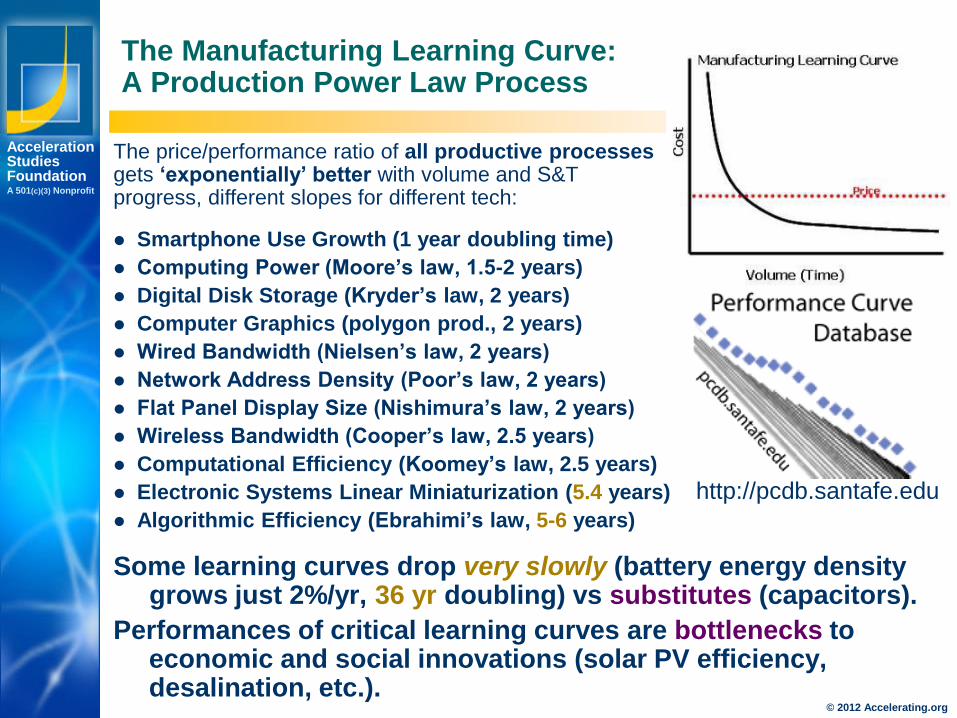
Smartphone Use Growth (1 year doubling time)
Computing Power (Moore’s law, 1.5-2 years)
Digital Disk Storage (Kryder’s law, 2 years)
Computer Graphics (polygon prod., 2 years)
Wired Bandwidth (Nielsen’s law, 2 years)
Network Address Density (Poor’s law, 2 years)
Flat Panel Display Size (Nishimura’s law, 2 years)
Wireless Bandwidth (Cooper’s law, 2.5 years)
Computational Efficiency (Koomey’s law, 2.5 years)
Electronic Systems Linear Miniaturization (5.4 years)
Algorithmic Efficiency (Ebrahimi’s law, 5-6 years)
Some learning curves drop very slowly (battery energy density grows just 2%/yr, 36 yr doubling) vs substitutes (capacitors).
Performances of critical learning curves are bottlenecks to economic and social innovations (solar PV efficiency, desalination, etc.).
The Manufacturing Learning Curve: A Production Power Law Process
The price/performance ratio of all productive processesgets ‘exponentially’ better with volume and S&T progress, different slopes for different tech:
http://pcdb.santafe.edu
© 2012 Accelerating.org
Los Angeles
New York
Palo Alto
AccelerationStudiesFoundationA 501(c)(3) Nonprofit
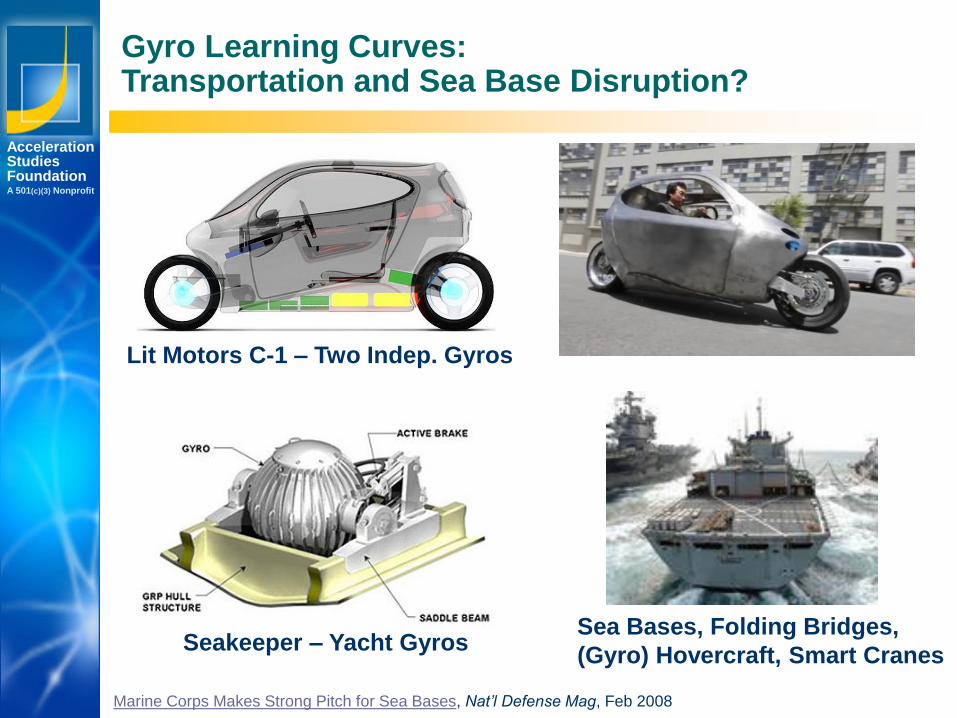
Lit Motors C-1 – Two Indep. Gyros
Seakeeper – Yacht Gyros
Gyro Learning Curves:Transportation and Sea Base Disruption?
Sea Bases, Folding Bridges,
(Gyro) Hovercraft, Smart Cranes
Marine Corps Makes Strong Pitch for Sea Bases, Nat’l Defense Mag, Feb 2008
Los Angeles
New York
Palo Alto
AccelerationStudiesFoundationA 501(c)(3) Nonprofit
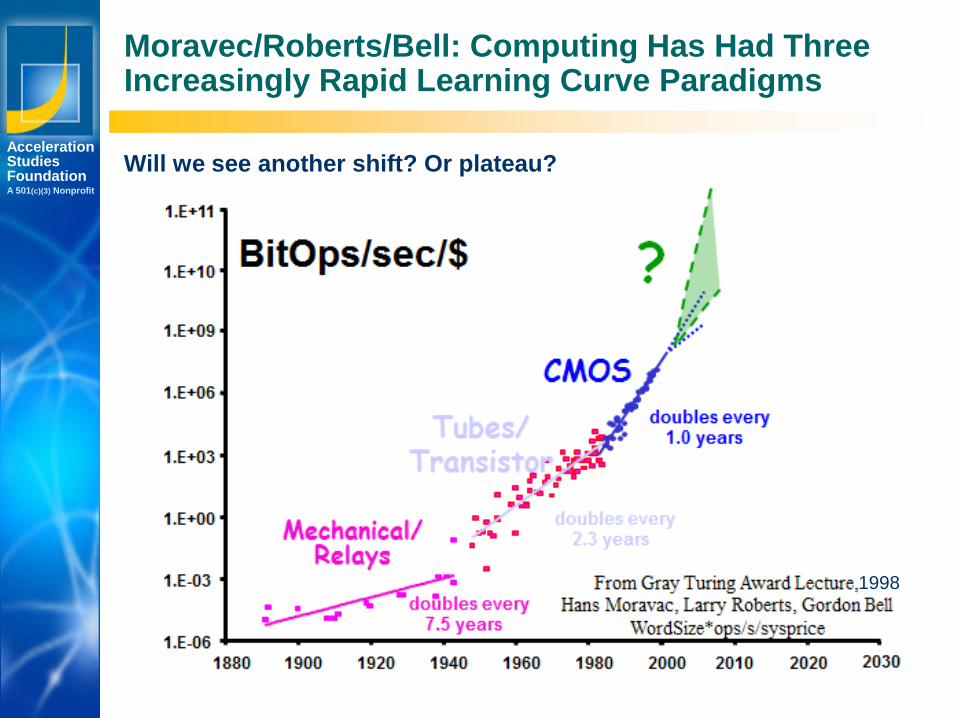
Moravec/Roberts/Bell: Computing Has Had ThreeIncreasingly Rapid Learning Curve Paradigms
1998
Will we see another shift? Or plateau?
Los Angeles
New York
Palo Alto
AccelerationStudiesFoundationA 501(c)(3) Nonprofit
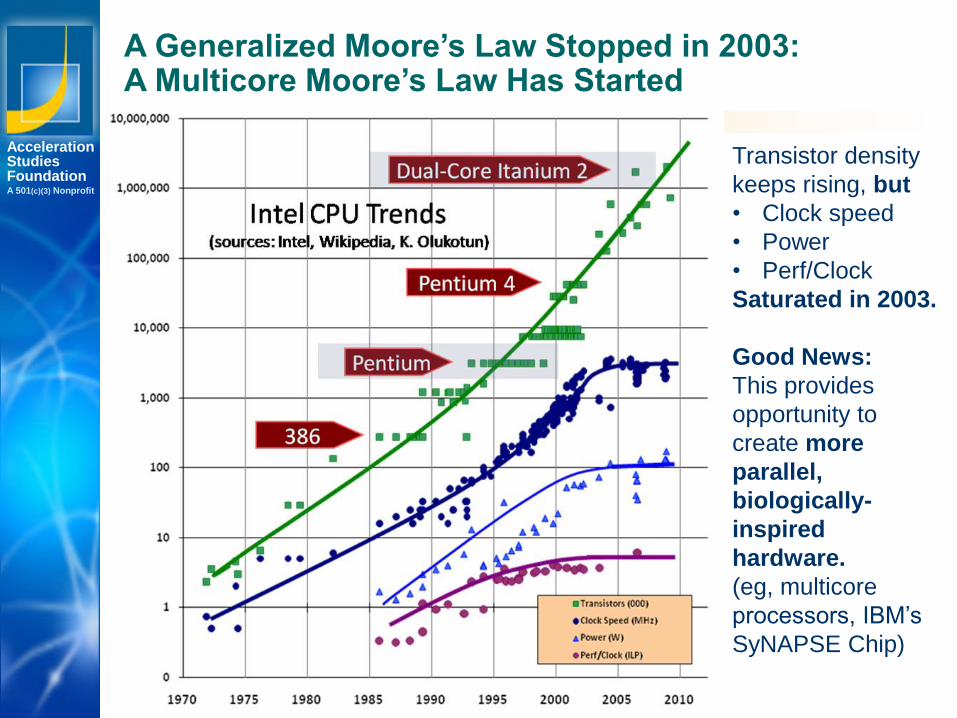
A Generalized Moore’s Law Stopped in 2003:A Multicore Moore’s Law Has Started
Transistor density
keeps rising, but
• Clock speed
• Power
• Perf/Clock
Saturated in 2003.
Good News:
This provides
opportunity to
create more
parallel,
biologically-
inspired
hardware.
(eg, multicore
processors, IBM’s
SyNAPSE Chip)
Los Angeles
New York
Palo Alto
AccelerationStudiesFoundationA 501(c)(3) Nonprofit
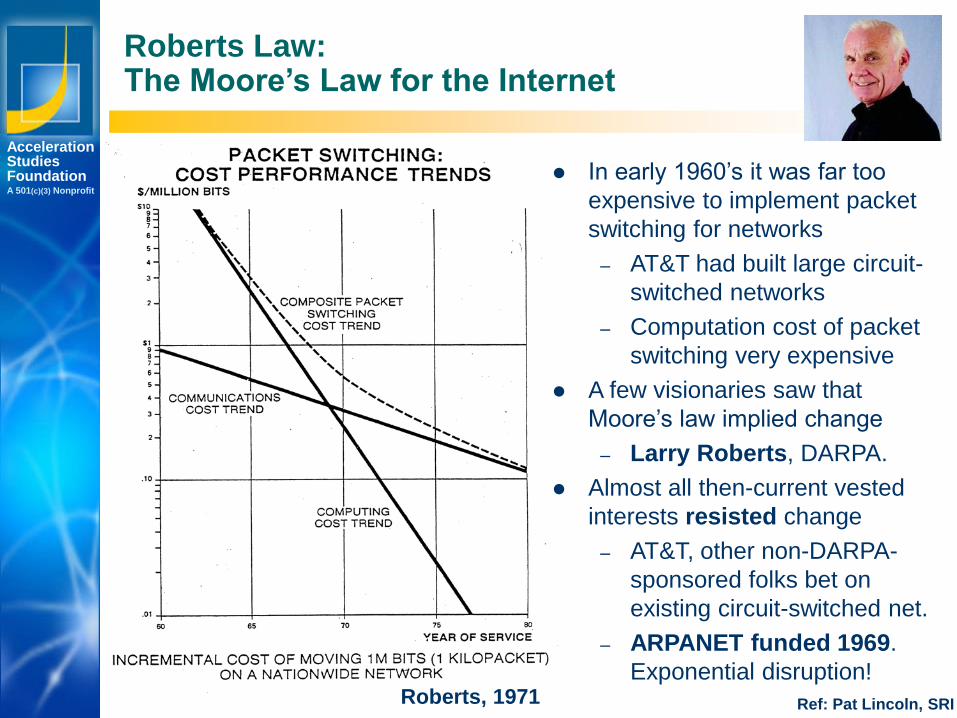
Roberts Law:The Moore’s Law for the Internet
In early 1960’s it was far too
expensive to implement packet
switching for networks
– AT&T had built large circuit-
switched networks
– Computation cost of packet
switching very expensive
A few visionaries saw that
Moore’s law implied change
– Larry Roberts, DARPA.
Almost all then-current vested
interests resisted change
– AT&T, other non-DARPA-
sponsored folks bet on
existing circuit-switched net.
– ARPANET funded 1969.
Exponential disruption!Roberts, 1971 Ref: Pat Lincoln, SRI
Los Angeles
New York
Palo Alto
AccelerationStudiesFoundationA 501(c)(3) Nonprofit
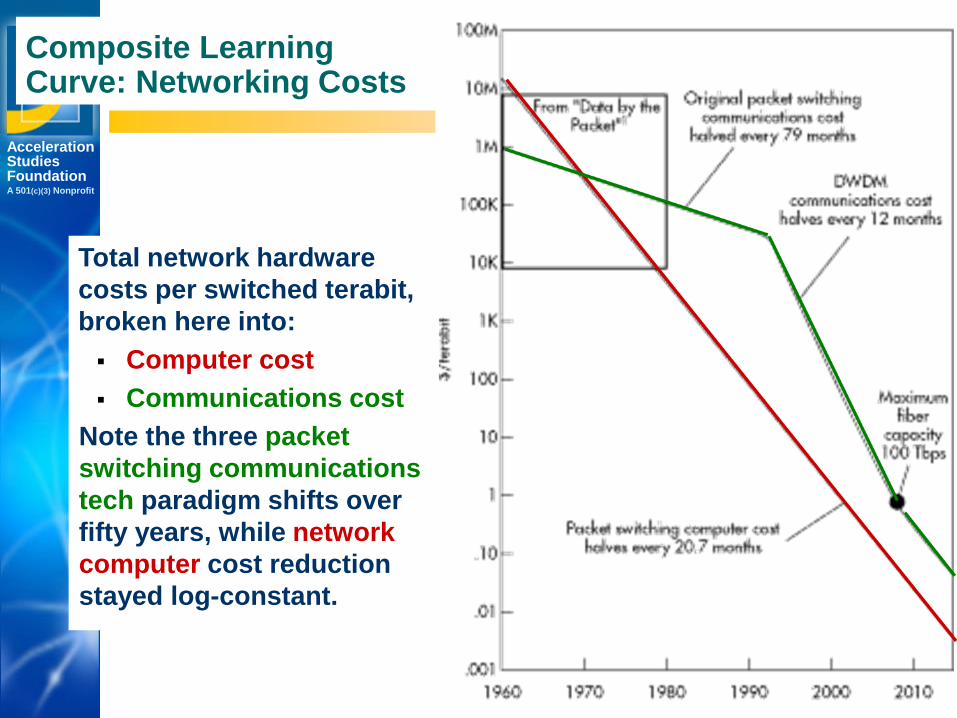
Composite LearningCurve: Networking Costs
Total network hardware
costs per switched terabit,
broken here into:
Computer cost
Communications cost
Note the three packet
switching communications
tech paradigm shifts over
fifty years, while network
computer cost reduction
stayed log-constant.
Los Angeles
New York
Palo Alto
AccelerationStudiesFoundationA 501(c)(3) Nonprofit
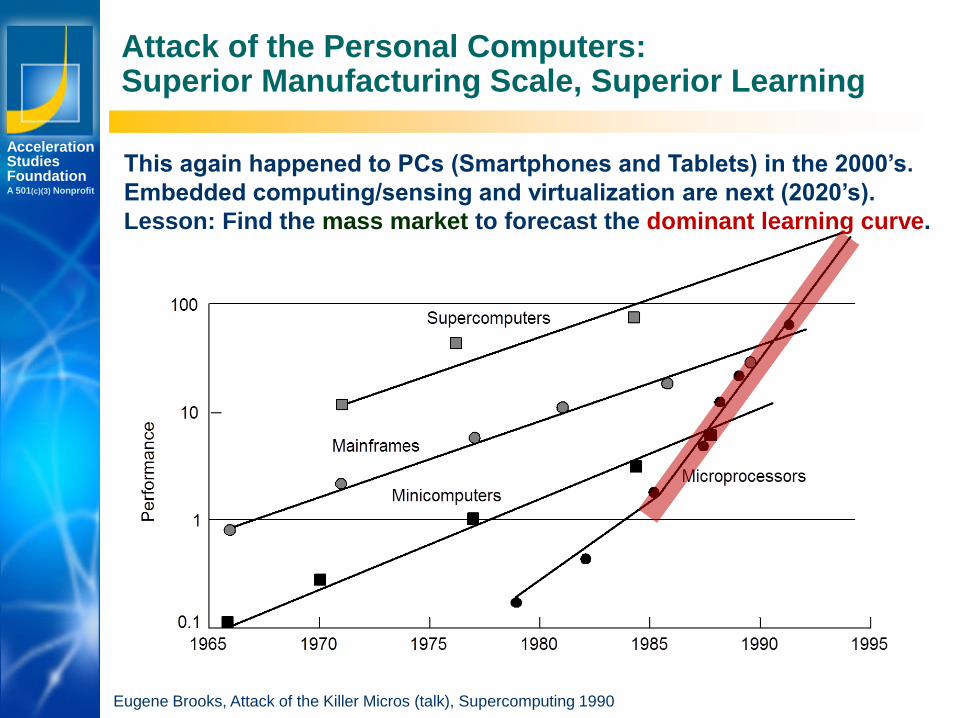
Attack of the Personal Computers:Superior Manufacturing Scale, Superior Learning
This again happened to PCs (Smartphones and Tablets) in the 2000’s.
Embedded computing/sensing and virtualization are next (2020’s).
Lesson: Find the mass market to forecast the dominant learning curve.
Eugene Brooks, Attack of the Killer Micros (talk), Supercomputing 1990
Los Angeles
New York
Palo Alto
AccelerationStudiesFoundationA 501(c)(3) Nonprofit
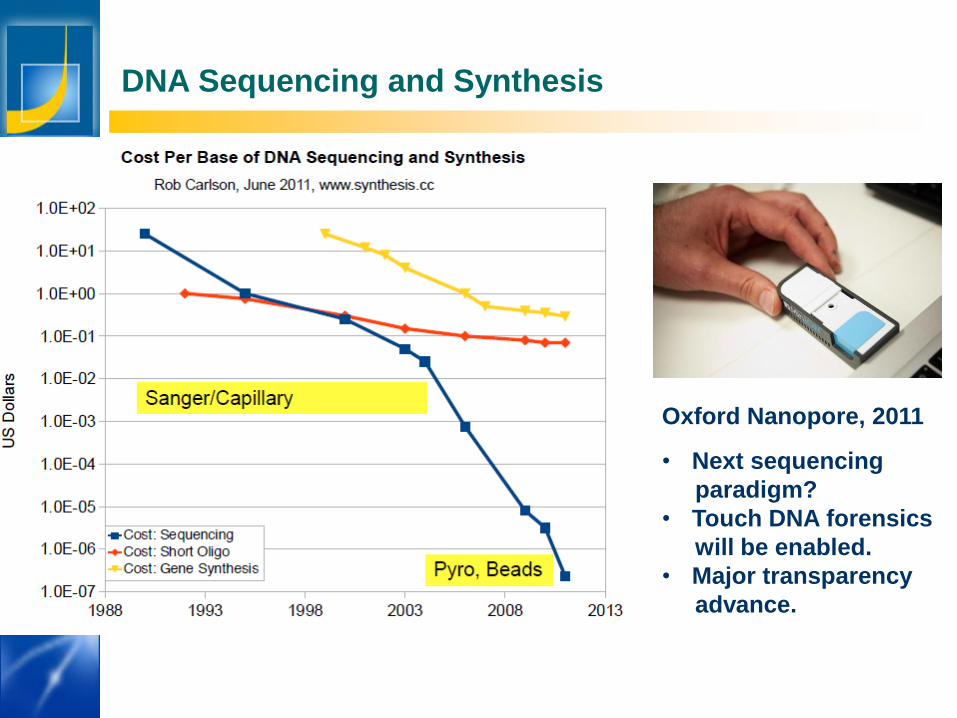
DNA Sequencing and Synthesis
Oxford Nanopore, 2011
• Next sequencing
paradigm?
• Touch DNA forensics
will be enabled.
• Major transparency
advance.
Los Angeles
New York
Palo Alto
AccelerationStudiesFoundationA 501(c)(3) Nonprofit
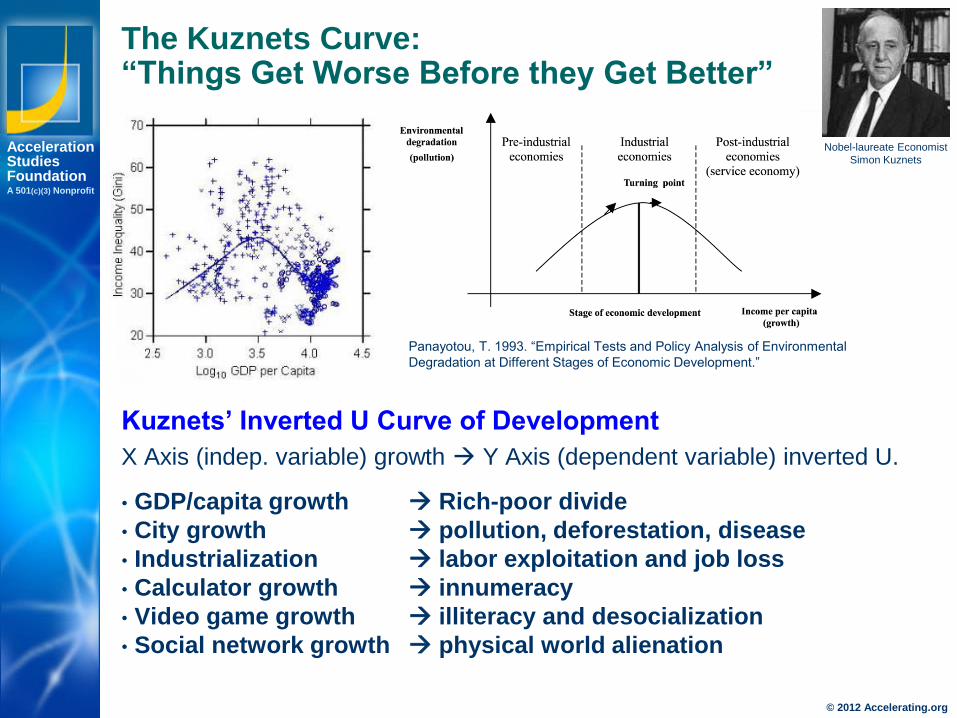
The Kuznets Curve:“Things Get Worse Before they Get Better”
Kuznets’ Inverted U Curve of Development
X Axis (indep. variable) growth Y Axis (dependent variable) inverted U.
• GDP/capita growth Rich-poor divide
• City growth pollution, deforestation, disease
• Industrialization labor exploitation and job loss
• Calculator growth innumeracy
• Video game growth illiteracy and desocialization
• Social network growth physical world alienation
Panayotou, T. 1993. “Empirical Tests and Policy Analysis of Environmental
Degradation at Different Stages of Economic Development.”
Nobel-laureate Economist
Simon Kuznets
© 2012 Accelerating.org
Los Angeles
New York
Palo Alto
AccelerationStudiesFoundationA 501(c)(3) Nonprofit
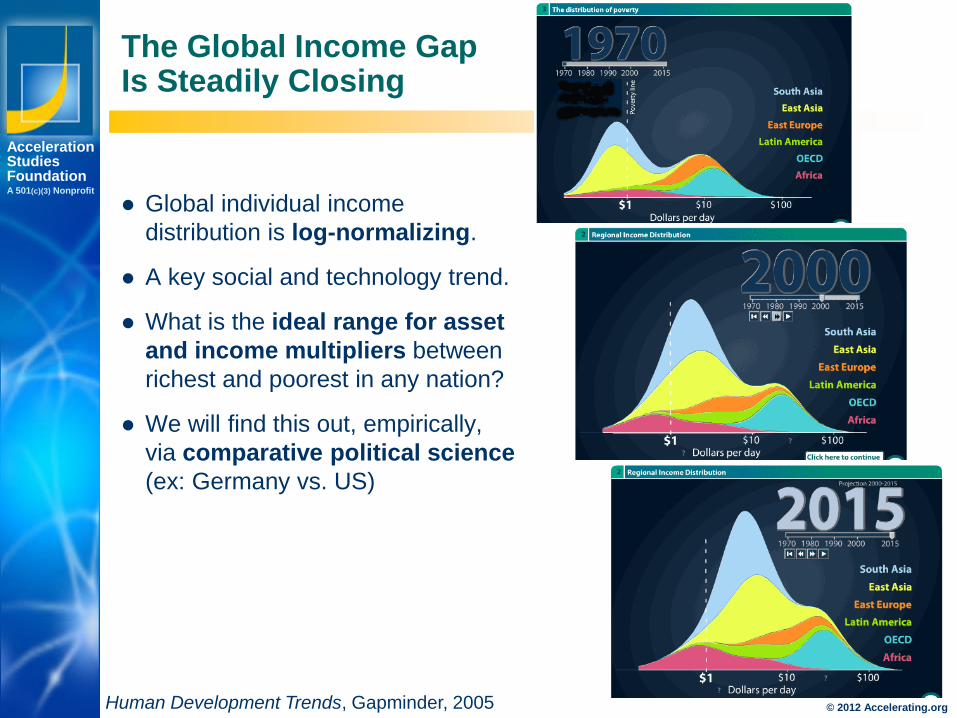
The Global Income GapIs Steadily Closing
Global individual income
distribution is log-normalizing.
A key social and technology trend.
What is the ideal range for asset
and income multipliers between
richest and poorest in any nation?
We will find this out, empirically,
via comparative political science
(ex: Germany vs. US)
Human Development Trends, Gapminder, 2005 © 2012 Accelerating.org
Los Angeles
New York
Palo Alto
AccelerationStudiesFoundationA 501(c)(3) Nonprofit
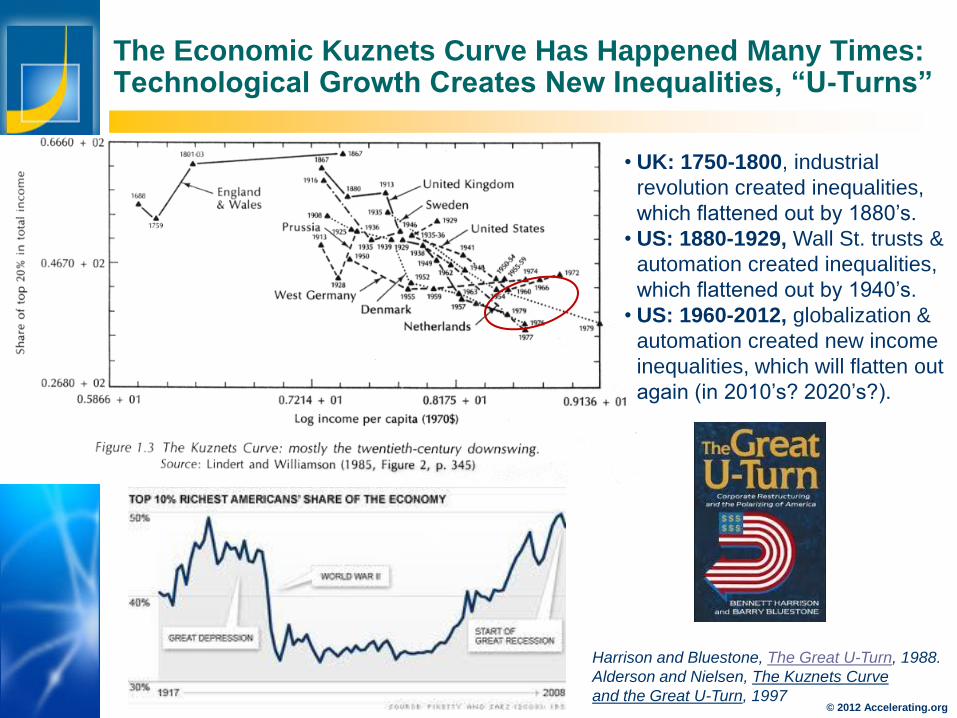
Harrison and Bluestone, The Great U-Turn, 1988.
Alderson and Nielsen, The Kuznets Curve
and the Great U-Turn, 1997
The Economic Kuznets Curve Has Happened Many Times:Technological Growth Creates New Inequalities, “U-Turns”
• UK: 1750-1800, industrial
revolution created inequalities,
which flattened out by 1880’s.
• US: 1880-1929, Wall St. trusts &
automation created inequalities,
which flattened out by 1940’s.
• US: 1960-2012, globalization &
automation created new income
inequalities, which will flatten out
again (in 2010’s? 2020’s?).
© 2012 Accelerating.org
Los Angeles
New York
Palo Alto
AccelerationStudiesFoundationA 501(c)(3) Nonprofit
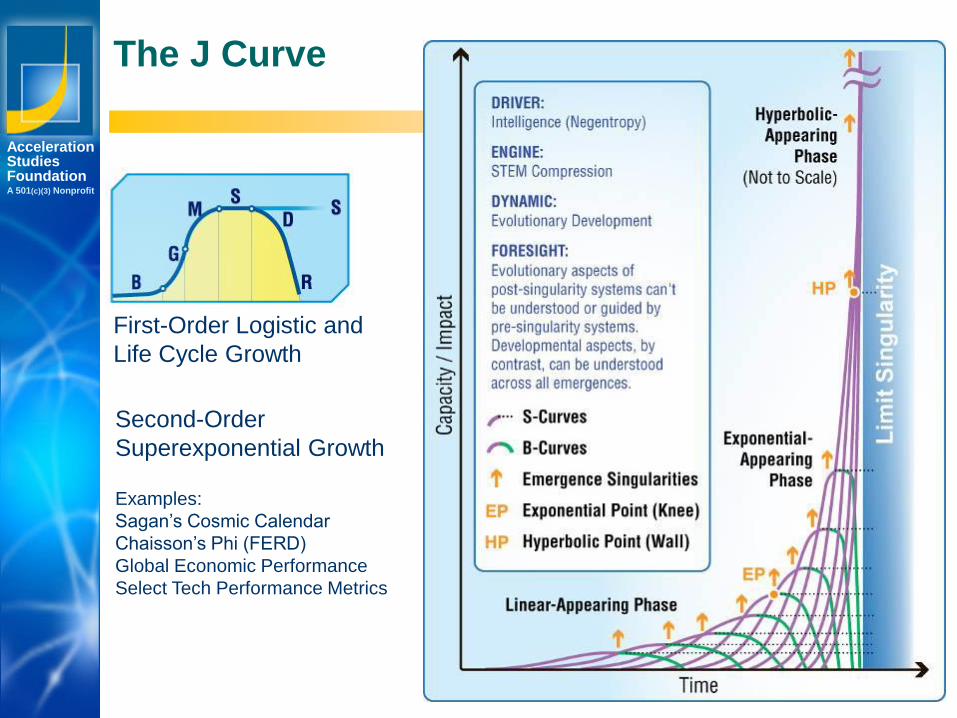
The J Curve
First-Order Logistic and
Life Cycle Growth
Second-Order
Superexponential Growth
Examples:
Sagan’s Cosmic Calendar
Chaisson’s Phi (FERD)
Global Economic Performance
Select Tech Performance Metrics
Los Angeles
New York
Palo Alto
AccelerationStudiesFoundationA 501(c)(3) Nonprofit
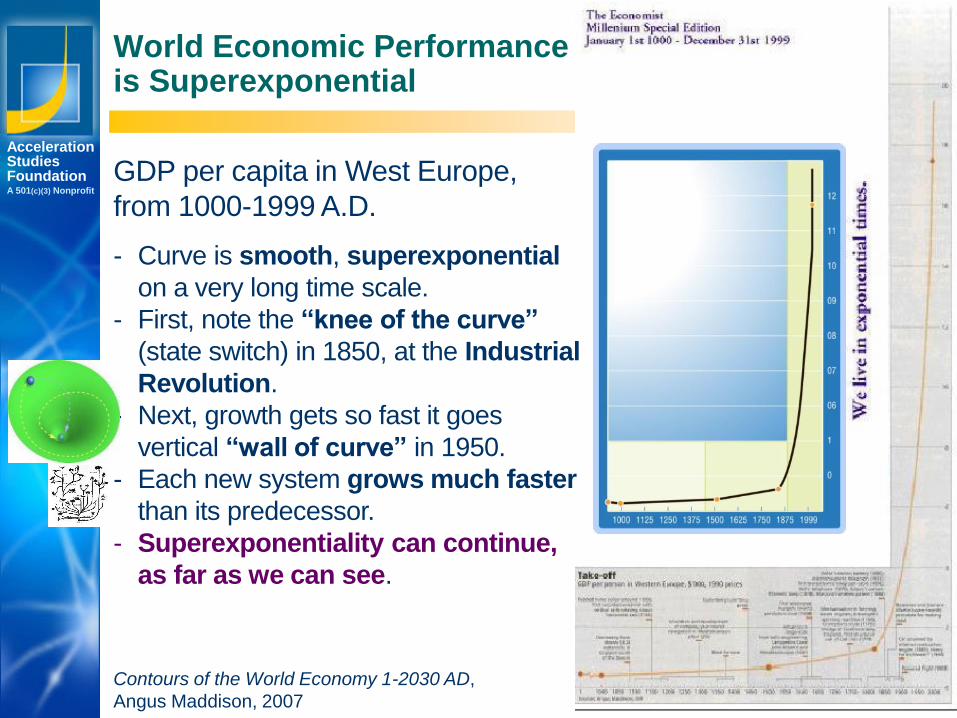
World Economic Performance is Superexponential
GDP per capita in West Europe,
from 1000-1999 A.D.
- Curve is smooth, superexponential
on a very long time scale.
- First, note the “knee of the curve”
(state switch) in 1850, at the Industrial
Revolution.
- Next, growth gets so fast it goes
vertical “wall of curve” in 1950.
- Each new system grows much faster
than its predecessor.
- Superexponentiality can continue,
as far as we can see.
Contours of the World Economy 1-2030 AD,
Angus Maddison, 2007

DiscussionWhat Do You Think?