Embed Size (px)
Citation preview

Fina
ncia
l sta
tem
ents
1
2016Financial Statements
Delivering results from 1966 – 2016
Annual Report 2016


Fina
ncia
l rep
ort
3
Financial report 2016IntroductionAuckland Airport’s golden anniversary provided the opportunity to reflect on long-term changes at New Zealand’s gateway. Passenger growth this financial year is the highest it has been in 12 years, and the need to continue evolving is as strong as ever. Changing technology and shifting global demographics are all helping to shape our airport of the future.
Growth has not been limited to those aspects of the business with tourism exposure. Investment in the company’s property portfolio topped $100 million in the 2016 financial year. This is a first for Auckland Airport, 58.8% higher than the previous peak investment, and looks to continue into the current financial year.
A significant amount of management’s focus this year has been on managing the exceptional demand growth across the business and delivering additional capacity within the complex and challenging environment of an
operating airport. However, the strong financial results for 2016 demonstrate management’s commitment to our faster, higher, stronger strategy and driving shareholder value.
Features that have enabled Auckland Airport to deliver earnings growth across the business include capitalising on demand growth to drive revenues, effective and targeted cost control and efficient capital management and investment. This financial report analyses our results for the 2016 financial year and its key trends. It covers the following areas:
• 2016 Financial performance summary
• Key financial performance measures
• 2016 Passenger movement analysis
• 2016 Aircraft volume analysis
• 2016 Financial performance analysis
• 2016 Financial position analysis
• 2016 Returns for shareholders.
2016 Financial performance summaryThis financial summary provides an overview of the financial results and key trends for the year ended 30 June 2016 compared with those for the previous financial year. Readers should refer to the accompanying notes and accounting policies as set out in the financial statements for a full understanding of the basis on which the financial results are determined.
In the 2016 financial year, revenue increased by 12.9% to $573.9 million with revenue growth strong across all segments of the business. Retail and property were standouts in 2016 with revenue increases of 19.3% and
18.0% respectively. Car parking and total aeronautical revenue (including airfield income, passenger services charge (PSC) and aeronautical rental income) also experienced strong growth in 2016 with revenue up 11.8% and 10.1% respectively.
Our reported profit after taxation for the 2016 financial year is $262.4 million – an increase of 17.4% on the prior year’s reported profit of $223.5 million. Excluding fair value changes, our underlying profit after taxation for the 2016 financial year is $212.7 million, an increase of 20.6% on the prior year’s underlying profit of $176.4 million.
Key financial results are shown in the table below.
2016$M
2015$M
% change
Income 573.9 508.5 12.9
Expenses 143.6 128.5 11.8
Earnings before interest, taxation, depreciation, fair value adjustments and investments in associates (EBITDAFI) 430.3 380.0 13.2
Reported profit after tax 262.4 223.5 17.4
Underlying profit after tax 212.7 176.4 20.6
Earnings per share (cents) 22.05 18.78 17.4
Underlying earnings per share (cents) 17.87 14.82 20.6
Ordinary dividends for the full year
Cents per share 17.50 14.60 19.9
Amount 208.30 173.80 19.9

Financials4
Auckland International Airport Limited
Underlying profit is how we measure our success
The directors and management of Auckland Airport understand the importance of reported profits meeting accounting standards. Because we comply with accounting standards, investors know that comparisons can be made with confidence between different companies and that there is integrity in our reporting approach. However, we also believe that an underlying profit measurement can assist investors to understand what is happening in a business such as Auckland Airport, where revaluation changes can distort financial results or where one-off transactions, both positive and negative, can make it difficult to compare profits between years.
For several years, Auckland Airport has referred to underlying profits alongside reported results. We do so when we report our results but also when we give our market guidance (where we exclude fair value changes and other one-off items) or when we consider dividends and our policy to pay 100% of net profit after tax, excluding unrealised gains and losses arising from revaluation of property or treasury instruments and other one-off items. However, in referring to underlying profits, we acknowledge our obligation to show investors how we have derived this result.
The table below shows how we reconcile reported profit after tax and underlying profit after tax for the 12 months ending 30 June 2016.
2016 2015
Reported
earnings $MAdjustments
$MUnderlying
earnings $MReported
earnings $MAdjustments
$MUnderlying
earnings $M
EBITDAFI per Income Statement 430.3 – 430.3 380.0 – 380.0
Share of (loss)/profit of associates (8.4) 19.9 11.5 12.5 (1.8) 10.7
Derivative fair value decrease (2.6) 2.6 – (0.7) 0.7 –
Investment property fair value increases 87.1 (87.1) – 57.2 (57.2) –
Property, plant and equipment revaluation decrease (16.5) 16.5 – (11.9) 11.9 –
Depreciation (73.0) – (73.0) (64.8) – (64.8)
Interest expense and other finance costs (79.1) – (79.1) (86.0) – (86.0)
Other taxation expense (75.4) (1.6) (77.0) (62.8) (0.7) (63.5)
Profit after tax 262.4 (49.7) 212.7 223.5 (47.1) 176.4

Fina
ncia
l rep
ort
5
We have made the following adjustments to show underlying profit after tax for the 12-month periods ended 30 June 2016 and 30 June 2015:
• We have reversed out the impact of revaluations of investment property in 2016 and 2015. An investor should monitor changes in investment property over time as a measure of growing value. However, a change in one particular year is too short to measure long-term performance. Changes between years can be volatile and, consequently, will impact comparisons. Finally, the revaluation is unrealised and, therefore, is not considered when determining dividends in accordance with the dividend policy.
• Consistent with the approach to revaluations of investment property, we also have reversed the revaluation of the land and infrastructure class of assets within property, plant and equipment for the 2016 financial year and for the buildings and services, runway, taxiways and aprons class of assets within property, plant and equipment for the 2015 financial year. The fair value changes in property, plant and equipment are less frequent than are investment property revaluations, which also makes comparisons between years difficult.
• The group recognises gains or losses in the income statement arising from valuation movements in interest rate derivatives that are not hedge accounted and where the counterparty credit risk on derivatives impacts accounting hedging relationships. These gains or losses, like investment property, are unrealised, and interest rate derivative movements are expected to reverse out over their lives.
• In addition, to be consistent, we have adjusted the revaluations of investment property and financial derivatives that are contained within the share of profit of associates in 2016 and 2015.
• We also reverse the taxation impacts of the above valuation movements in both the 2016 and 2015 financial years.
Key financial performance measuresAuckland Airport monitors a wide range of financial and non-financial performance measures. This year, we have again considered the most relevant measures of financial performance against our four strategic themes.
GROW TRAVEL MARKETS
Adopt an ambitious and innovative approach to help New Zealand sustainably unlock growth opportunities in travel, trade and tourism.
STRENGTHEN OUR CONSUMER BUSINESS
Strengthen and extend our retail, transport and accommodation businesses to ensure we can respond to evolving customer needs.
BE FAST, EFFICIENT AND EFFECTIVE
Improve our performance by increasing the productivity of our assets, processes and operations.
INVEST FOR FUTURE GROWTH
Build on our strong foundations for long-term sustainable growth by continuously investing in infrastructure that supports our long-term requirements.

Financials6
Auckland International Airport Limited
The key financial performance measures are outlined in the following table. The table lists each measure, provides the corresponding performance outcome for the 2016 financial year and indicates which of our four strategic themes is most relevant to the financial performance measure.
Commentaries on financial performance outcomes are included in the analysis in the remainder of this financial report.
STRATEGY MEASURE
2016
2015
2014% change
2015–2016% change
2014–2015
GROW TRAVEL MARKETS
Total aircraft seat capacityInternational aircraft seat capacity 11,630,058 10,816,313 10,499,819 7.5 3.0 Domestic aircraft seat capacity 9,937,754 9,065,388 8,912,475 9.6 1.7
Passenger movementsInternational passenger movements 8,779,576 8,124,435 7,687,836 8.1 5.7 International transit passenger movements 578,714 493,756 462,560 17.2 6.7 Domestic passenger movements 7,902,059 7,198,595 6,911,689 9.8 4.2
Maximum certified take-off weight (MCTOW)International MCTOW (tonnes) 4,909,786 4,556,051 4,339,266 7.8 5.0 Domestic MCTOW (tonnes) 2,069,157 1,890,764 1,879,199 9.4 0.6
STRENGTHEN OUR CONSUMER BUSINESS
Passenger spend rate (PSR)Change in international terminal PSR (1.3%) (1.0%) (2.4%)
Average revenue per parking space (ARPS)Change in ARPS 11.6% (5.4%) (0.6%)
BE FAST, EFFICIENT AND EFFECTIVE
Return on investmentReturn on capital employed 6.7%* 7.4% 7.5%
Passenger satisfaction/airport service quality (scale of 1–5)International 4.21 4.16 4.21 1.2 (1.2)Domestic 3.99 4.03 3.89 (1.0) 3.6
INVEST FOR FUTURE GROWTH
Rent rollAnnual rent roll $m (property division) 63.0 56.1 46.6 12.3 20.4
ALL EBITDAFIEBITDAFI per passenger $24.93 $24.03 $23.58 3.7 1.9
* The decrease in return on capital employed in 2016 resulted from the large increase in shareholders’ equity this financial year, which was dominated by the $784 million increase in the property, plant and equipment, land and infrastructure valuation.

Fina
ncia
l rep
ort
7
2016 Passenger movement analysisPassenger movements are a significant driver of value for Auckland Airport with the majority of aeronautical revenue coming from passenger charges. International passenger volumes have a greater impact on financial performance than domestic passenger volumes, with the aeronautical revenue generated by an international passenger approximately four times that of a domestic passenger.
2016 2015 % change
Auckland Airport passenger movements
International arrivals 4,420,669 4,077,749 8.4
International departures 4,358,907 4,046,686 7.7
International passengers excluding transits 8,779,576 8,124,435 8.1
Transit passengers 578,714 493,756 17.2
Total international passengers 9,358,290 8,618,191 8.6
Domestic passengers 7,902,059 7,198,595 9.8
Total passenger movements 17,260,349 15,816,786 9.1
International passenger numbers (excluding transits) increased by 8.1% in the 12 months to 30 June 2016. This was a very strong outcome across a broad range of routes and markets.
In the 2016 financial year, our work to grow travel markets with airlines and other travel partners continued the strong performance achieved in recent years. International passenger growth has been broad across Asia, the Americas and Australia markets this year driven by capacity increases in each. The return to growth in passenger numbers from our traditional markets has also continued, with passengers from the United Kingdom up 6.3% and France and Germany growing 14.1% and 10.9% respectively following the introduction of new and increased European connections through Beijing, Dubai and Bangkok.
The number of international airlines serving Auckland increased from 18 to 23 during FY2016 with the launch of China Eastern Airlines, Philippine Airlines, Air China, AirAsia X and American Airlines. Capacity increases were seen across all regions including a 9% increase on North American routes, an 8% increase on Tasman services and another year of impressive growth in China, where new and existing services added 34% to direct mainland China capacity. South America also benefited from larger aircraft and new services with a 50% increase in both capacity and passenger numbers this year.
In absolute passenger numbers by country of last residence, we saw strong increases from our four largest source markets. New Zealand passenger numbers increased by 111,740 (6.0%), Chinese passengers by 66,835 (22.9%), Australian passengers by 41,104 (5.3%), and additional services to North America, including the commencement of Houston in December, have helped deliver a United States passenger increase of 17,316 (9.3%).

Financials8
Auckland International Airport Limited
The table below shows the top 20 volumes of arrivals by country of last permanent residence in the 2016 financial year.
Country of last permanent residence
2016 Auckland
Airport arrivals
2015 Auckland
Airport arrivals % change% of total
2016 arrivals% of total
2015 arrivals
New Zealand 1,982,580 1,870,840 6.0 44.9 46.0
Australia 817,454 776,350 5.3 18.5 19.1
China, People’s Republic of 359,270 292,435 22.9 8.1 7.2
United States of America 203,573 186,257 9.3 4.6 4.6
United Kingdom 171,651 161,545 6.3 3.9 4.0
Japan 87,235 72,298 20.7 2.0 1.8
Germany 68,001 61,321 10.9 1.5 1.5
Korea, Republic of 57,972 47,339 22.5 1.3 1.2
India 49,284 45,755 7.7 1.1 1.1
Canada 48,866 44,700 9.3 1.1 1.1
Hong Kong 33,929 29,631 14.5 0.8 0.7
Singapore 32,408 28,859 12.3 0.7 0.7
France 31,987 28,038 14.1 0.7 0.7
Malaysia 30,058 23,417 28.4 0.7 0.6
Fiji 25,632 24,871 3.1 0.6 0.6
Samoa 23,984 21,477 11.7 0.5 0.5
Taiwan 23,062 22,098 4.4 0.5 0.5
Tonga 19,758 16,863 17.2 0.4 0.4
Thailand 18,594 15,193 22.4 0.4 0.4
Netherlands 18,412 17,019 8.2 0.4 0.4
SOURCE: STATISTICS NEW ZEALAND
Overseas visitor arrivals by purpose of visit
The most common purposes of visit for international arrivals continue to be holidays (25.7%) and visiting friends and relatives (16.2%). The strong growth in these categories reflects the success New Zealand has had in growing international tourism numbers. The other segments have also shown good growth, helping to maintain the broad mix of purposes of visit through the airport. The combination of a strong origin traffic base (New Zealand outbound), New Zealand’s attractive destinations and the mix of source markets of inbound passengers all support Auckland Airport’s resilient passenger growth.
Purpose of visit 2016 2015 % change % of total
Foreign residents
Holiday/vacation 1,133,760 973,136 16.5 25.7
Visit friends/relatives 717,680 676,336 6.1 16.2
Business/conference 257,552 240,736 7.0 5.8
Education/medical 53,136 49,344 7.7 1.2
Other (including not stated/not captured) 272,619 259,972 4.9 6.2
New Zealand residents 1,982,580 1,870,840 6.0 44.9
SOURCE: STATISTICS NEW ZEALAND

Fina
ncia
l rep
ort
9
Domestic passenger movements
Domestic passenger numbers also grew strongly in the 12 months to June 2016, increasing by 9.8% or 703,464 passengers. Increased frequencies on jet services, including Air New Zealand’s replacement of Boeing 737s with A320s on all main trunk routes, contributed some 60% of this growth. The balance was delivered through increased competition on regional services including the commencement of Jetstar’s Q300 services from December.
2016 Aircraft volume analysisTotal aircraft movements were 157,754, an increase of 4.5% from the 2015 financial year, while MCTOW increased to 6,978,943, up by 8.3%. Auckland Airport’s airfield income is determined by the MCTOW of aircraft landing at the airport. Whilst upgauging of aircraft has continued over the year with both passenger and MCTOW growth stronger than aircraft movements, FY16 is the first year with both domestic and international aircraft movements showing significant growth since 2008. This may be a sign that fleet upgauging is slowing and runway movements are back on the rise longer term.
2016 2015 % change
Aircraft movements
International aircraft movements 49,825 46,692 6.7
Domestic aircraft movements 107,929 104,264 3.5
Total aircraft movements 157,754 150,956 4.5
MCTOW (tonnes)
International MCTOW 4,909,786 4,556,051 7.8
Domestic MCTOW 2,069,157 1,890,764 9.4
Total MCTOW 6,978,943 6,446,815 8.3
2016 Financial performance analysisRevenueAuckland Airport’s total revenue was $573.9 million in the 2016 financial year, an increase of $65.4 million or 12.9% on the previous financial year. Revenue growth was strong across the business, with all segments experiencing significant increases. Retail and property rental performed strongest with revenue increases of 19.3% and 18.0% respectively. In addition, car parking and aeronautical revenues (including airfield income, PSC and total aeronautical rental income) delivered solid growth, up 11.8% and 10.1% respectively.
2016
$M2015
$M
% change
Operating revenue
Airfield income 103.4 93.3 10.8
Passenger services charge 154.9 140.9 9.9
Retail income 157.5 132.0 19.3
Car parking income 52.1 46.6 11.8
Rental income – property 59.1 50.1 18.0
Rental income – aeronautical 15.1 14.1 7.1
Rental income – retail 0.5 0.4 25.0
Total rental income 74.7 64.6 15.6
Rates recoveries 5.4 5.1 5.9
Interest income 1.7 3.3 (48.5)
Other income 24.2 22.7 6.6
Total revenue 573.9 508.5 12.9

Financials10
Auckland International Airport Limited
Airfield income
Airfield landing charges are based on the MCTOW of aircraft. Total MCTOW across international and domestic landings grew by 8.3% in the year to 30 June 2016. MCTOW growth, together with the 2.5% price increase in landing charges, delivered an airfield income increase of $10.1 million or 10.8%.
Passenger services charge
PSC income increased by $14.0 million or 9.9% in the year to 30 June 2016, in line with passenger growth and prices.
2016 $
2015 $
2016 price change %
2017 $
2017 price change %
International PSC (≥ 2 years) 15.85 15.62 1.5 16.09 1.5
Domestic PSC (≥ 2 years) 2.13 2.08 2.4 2.18 2.3
Transits PSC (≥ 2 years) 3.93 3.83 2.6 4.03 2.5
The 2017 financial year is the final year of the current FY2013–2017 published aeronautical pricing schedule. Auckland Airport has already begun consultation on the FY2018–2022 aeronautical prices, which we expect to announce in May 2017.
Retail income
Auckland Airport earns concession revenue from retailers within the domestic and international terminals, including duty free and specialty stores, foreign exchange, and food and beverage outlets. Total retail income was $157.5 million in the 2016 financial year, an increase of $25.5 million or 19.3% on the previous financial year.
Strong passenger growth, new commercial agreements in duty free and a shift to higher concession products have contributed to the excellent growth in retail income during 2016. During the year, Auckland Airport’s retail income per international passenger increased to $17.36 from $15.77 (up 10.1%). This result was supported by the release of a $0.30 per international passenger provision for potential losses following the changeover of duty free operators in early FY2016. No loss eventuated.
Overall passenger spend rate (PSR) fell 1.3% in the financial year to 30 June 2016 as a result of the duty free transition. Specialty and destination categories continue to stand out with exceptional PSR growth averaging 17% for the year. PSR gains, however, have not been universal as duty free has faced challenges when compared to the previous financial year. Our two new duty free retailers (Aelia and The Loop) began trading on 1 July 2015 following their successful tender late last year. The bed-in period for the new retailers has meant that PSR fell over the first half of the year. Whilst the fall was in line with the retailers’ expectations, PSR has improved in the second half of the financial year to 30 June 2016 and was up 4.0% on the equivalent prior period.
The new duty free retailers have brought new focus, and their changing product range has helped to drive increased sales in traditional higher-margin product lines. For example, spend rates on cosmetics and skincare have increased by 30% when compared with the previous financial year.
There was also strong growth in Auckland Airport’s lounge offering. The Emperor Lounge has gone from strength to strength this year with revenue up 104% on the prior year. Plans are under way to build on this success through the development of an enhanced Emperor Lounge as part of the international terminal level 1 expansion.
Car parking income
Our work on optimising car park usage has continued to drive strong car park revenue growth in the 2016 financial year. We continued to improve the range of online offers to attract customers across the product range. Valet and Park&Ride services led car parking growth for the 2016 financial year. As a result of this proactive management and strong passenger growth, car parking revenue was $52.1 million in the 2016 financial year, an increase of $5.5 million or 11.8% on FY2015.
As a result of higher utilisation and a small decrease in available car parks, including 50 spaces converted to the new free Wait Zone parking area, the average revenue per space (ARPS) has increased by 11.6%. This reversed the 5.4% decline in the previous financial year that arose from 1,200 new spaces becoming available in that year.

Fina
ncia
l rep
ort
11
Rental income
Auckland Airport earns rental income from space leased in facilities, such as terminals and cargo buildings, and from stand-alone investment properties. Total rental income was $74.7 million in the 2016 financial year, an increase of 15.6% on the previous financial year. Property rental income (excluding aeronautical and retail rental income) was $59.1 million in the 2016 financial year, an increase of $9.0 million or 18.0% on the previous financial year. Income growth in the year was due to new assets such as Hellmann, CEVA extension, Fuji Xerox, Coca-Cola Amatil and the full-year impact of developments completed during the previous financial year, such as the ibis Budget hotel expansion and rent increases from the existing portfolio. There are a number of projects expected to be completed in the next six to eight months (such as the new Agility warehouse and multi-tenant sites at 11 Maurice Wilson Avenue and Timberly Road) that will positively impact rental income in the 2017 financial year.
Other income
Other income includes utilities, such as the sale of electricity, gas, water reticulation and transport licence fees. Total income from these sources was $24.2 million, an increase of $1.5 million or 6.6% on the previous financial year.
ExpensesTotal operating expenses (excluding depreciation and interest) were $143.6 million in the 2016 financial year, an increase of $15.1 million or 11.8% on the previous period.
2016
$M2015
$M
% change
Operating expenses
Staff 46.8 46.3 1.1
Asset management, maintenance and airport operations 49.1 44.2 11.1
Rates and insurance 11.5 10.7 7.5
Marketing and promotions 16.3 13.2 23.5
Professional services and levies 9.7 7.3 32.9
Other 10.2 6.8 50.0
Total operating expenses 143.6 128.5 11.8
Operating expenses
Operating expense growth during FY2016 reflects ongoing strong growth in aeronautical and commercial activities. Staff costs were up marginally ($0.5 million or 1.1%) reflecting higher head count in aeronautical operations, airport development and delivery and retail to position the business for ongoing growth. Expenditure on customer service assistants was increased during the year to maintain the customer experience, given significant growth in passenger numbers. These increases were partially offset by a reduction in long-term incentives following changes to the long-term remuneration plan late last financial year.
Asset management, maintenance and airport operations expenses have increased by $4.9 million or 11.1% on the 2015 financial year. These costs have driven revenue growth as they are linked to increased activity in Park&Ride, the Emperor Lounge, the expanded valet car parking service at the international terminal and the ibis Budget hotel. Growth in aeronautical demand also required more air-side bus services as the use of non-gated stands increased.
Rates and insurance expenses increased by $0.8 million or 7.5% on the previous 12-month period. On average, rates increased by 6.5% across the portfolio with additional charges for newly developed investment property. Rates increases on developed investment property are matched by offsetting increases in rates recoveries within other income.
The increase in marketing and promotions expenditure of $3.1 million or 23.5% during this financial year reflects continued investment in long-term revenue growth. The primary areas of the business that received increased marketing during the year were retail and aeronautical route development. Aeronautical marketing helps to establish new routes and enhances our share of global growth going forward. Annualised

Financials12
Auckland International Airport Limited
capacity increases of 2.46 million seats were announced during the 2016 financial year, an increase of 22.8%, demonstrating the value generated by aeronautical marketing activities.
Fees for professional services have increased in the 2016 financial year by $2.4 million or 32.9% to $9.7 million. Along with business as usual consultancy services, key projects included a company-wide review of long-term procurement efficiency opportunities and a strategic review of the company’s future utilities infrastructure requirements and operating models. The second half of 2016 also included the forensic and internal audit reviews undertaken to identify the scale and scope of employee fraud identified in February this year including initiating enhanced internal control systems and processes to avoid a recurrence.
Depreciation
Depreciation expense in the 2016 financial year was $73.0 million. As part of the international terminal level 1 redevelopment, a number of assets were identified with shorter useful lives than previously assumed. The revised depreciation on these assets has contributed to an increase of $8.2 million or 12.7% on the previous period.
Interest
Interest expense was $79.1 million in the 2016 financial year, a decrease of $6.9 million or 8.0% on FY2015. The increase in the average debt balance of 6.1% for the 2016 financial year was offset by the decrease in the average cost of funds. Decreasing cash rates and the successful refinancing of debt from historically higher rates helped reduce the average cost of funds from 5.79% in the previous financial year to 5.09% in 2016.
Taxation
Taxation expense was $75.4 million in the 2016 financial year, an increase of $12.6 million or 20.1% on the previous financial year, reflecting the growth in profit for the year.
Share of profit from associates
Our total share of the underlying profit from associates in the 2016 financial year was $11.5 million, comprising North Queensland Airports (NQA) ($7.9 million), Tainui Auckland Airport Hotel Limited Partnership (TAAH) ($1.7 million) and Queenstown Airport ($1.9 million). This was an increase of $0.8 million or 7.5% compared with the previous period.
Our share of profit from associates, on the other hand, was a loss of $8.4 million (2015: gain of $12.5 million). This included our share of NQA’s asset impairment of $14.0 million and NQA’s $8.1 million fair valuation loss on financial instruments. Also included is TAAH’s fair valuation gain on investment property of $2.3 million (2015: $2.0 million) and TAAH’s fair valuation loss on financial instruments of $0.1 million (2015: loss of $0.1 million).

Fina
ncia
l rep
ort
13
North Queensland Airports
Extract from North Queensland Airports’ full company results
2016A$M
2015A$M % change
Financial performance
Total revenue 134.6 127.5 5.6
EBITDAFI 83.8 81.6 2.7
Total net (loss)/profit after tax (54.8) 26.7 (305.2)
Passenger performance
Domestic passengers – Mackay 845,384 989,560 (14.6)
Domestic passengers – Cairns 4,243,308 4,041,244 5.0
International passengers (excluding transits) – Cairns 621,455 515,245 20.6
International passengers (including transits) – Cairns 767,423 616,748 24.4
Auckland Airport’s 24.55% share of NQA’s net loss after tax was $14.2 million. The reported loss includes a number of non-cash items including fair value losses on investment property and fair value losses on financial instruments. During 2016, a review of the Mackay assets was undertaken and resulted in an impairment provision being recorded. Excluding Auckland Airport’s share of the impairment provision and non-cash derivative revaluations, the underlying FY2016 result was a net profit after tax of $7.9 million.
International passenger growth at Cairns Airport was strong with a 24.4% increase on the previous financial year. Domestic passenger growth also improved at Cairns Airport, up 5.0% compared with 2.4% in the previous financial year. Mackay Airport continues to face difficulties from its exposure to the mining sector with a reduction in passenger numbers of 14.6% versus FY2015.
Auckland Airport received AUD12.8 million in dividends from its investment in NQA during the 2016 financial year (including AUD3.1 million declared and receivable as at 30 June 2016), compared with AUD10.7 million in the 2015 financial year (including AUD2.5 million declared and receivable as at 30 June 2015).
Queenstown Airport
2016$M
2015$M % change
Financial performance
Total revenue 31.5 24.8 27.0
EBITDAFI 21.5 16.6 29.5
Total net profit after tax 7.8 8.3 (6.0)
Passenger performance
Domestic passenger volumes 1,176,330 1,000,713 17.5
International passenger volumes 474,779 397,927 19.3
Total passengers 1,651,109 1,398,640 18.1
Auckland Airport’s 24.99% share of Queenstown Airport’s net profit after tax for the 2016 financial year was $1.9 million, a 6.0% reduction on the previous financial year. Queenstown Airport’s outstanding international passenger growth continued in the 2016 financial year, up another 19.3% on top of last year’s growth of 29.0%. Domestic passenger numbers were also outstanding – up 17.5%. Operating leverage drove an increase in Queenstown Airport’s underlying net profit before tax of 29%. However, a one-off tax adjustment resulted in the fall in after-tax profit.
Auckland Airport received a dividend of $1.3 million from its investment in Queenstown Airport in the 2016 financial year, up from $1.1 million in the previous year.

Financials14
Auckland International Airport Limited
Tainui Auckland Airport Hotel Limited Partnership
Auckland Airport has a 20% investment in the Novotel hotel joint venture with Tainui Group Holdings and Accor Hotel Group. In the 2016 financial year, Auckland Airport’s share of profit from this investment was $3.9 million, an increase of $0.7 million or 21.9% compared with the previous financial year. Excluding TAAH’s fair valuation gains on investment property and financial instruments, Auckland Airport’s share of underlying profit from this investment was $1.7 million, an increase of $0.4 million or 30.8% compared with the previous year.
Reflecting greater demand for accommodation at the airport, the Novotel hotel’s annual average occupancy rate for the 2016 financial year increased to 89% – up from 87% last year.
Fair value changes
In the 2016 financial year, investment property fair value changes resulted in a gain in the income statement of $87.1 million compared with a gain of $57.2 million in the previous financial year. As was the case last year, this was due to continued improvements in lease terms during the period combined with firming of the capitalisation rates of the property portfolio as well as improved land values for undeveloped land.
Also, as at 30 June 2016, the land and infrastructure classes of assets within property, plant and equipment were revalued, resulting in an upward movement of $767.5 million. Land was revalued most recently as at 30 June 2014 and infrastructure as at 30 June 2011. The revaluation uplift included decreases of $16.5 million recorded directly in the income statement, offset by an increase of $784.0 million recorded directly in other comprehensive income. This revaluation has no impact on the value of Auckland Airport’s regulatory asset values as presented in the annual disclosure statements.
2016 Financial position analysis
As at 30 June2016
$M2015
$M
% change
Non-current assets 6,038.6 5,014.1 20.4
Current assets 102.9 87.4 17.7
Total assets 6,141.5 5,101.5 20.4
Non-current liabilities 1,768.6 1,748.7 1.1
Current liabilities 492.2 309.9 58.8
Equity 3,880.7 3,042.9 27.5
Total equity and liabilities 6,141.5 5,101.5 20.4
As at 30 June 2016, our total assets amounted to $6,141.5 million, an increase of $1,040.0 million or 20.4% on the 2015 financial year. The increase is mainly due to revaluations of property, plant and equipment, derivatives and investment property as well as increased capital expenditure over the 2016 financial year.
Shareholders’ equity was $3,880.7 million as at 30 June 2016, an increase of $837.8 million or 27.5% on 30 June 2015. The movement in equity included a $784.0 million increase to the property, plant and equipment revaluation reserve due to revaluations of land and infrastructure in the year.
Gearing, measured as debt to debt plus the market value of shareholders’ equity, decreased to 19.7% as at 30 June 2016 from 22.5% as at 30 June 2015.

Fina
ncia
l rep
ort
15
Capital expenditureIn October 2015, Auckland Airport announced increased guidance for the 2016 capital expenditure to between $230 million and $260 million. The increase in guidance was a direct result of the strong growth being experienced across the business, especially those parts driven by tourism and property. The updated guidance included an extra $30 million for aeronautical development with projects such as the international terminal level 1 expansion and the Pier B bus lounge being accelerated due to strong passenger growth.
Category $M Key projects
Aeronautical 119.7 International terminal level 1 expansion, airfield concrete pavement replacement, Operations Centre relocation and upgrade, international terminal baggage reclaim hall upgrade, Pier B bus lounge, domestic and international terminal space enhancement
Property 106.4
Timberley Road development, Hellmann warehouse development, Flex 2 Building development, The Landing precinct development, Fuji Xerox office and warehouse development, Coca-Cola Amatil development, Quad 7 development, purchase of two parcels of land, Maurice Wilson Avenue development, Agility warehouse development, Fonterra offices and warehouse development, DHL Express extension development
Retail/car parking 9.1 Park&Ride car park extension, DTB car park expansion, ITB walkways enhancement
Infrastructure and other 8.0 Website redevelopment, IT infrastructure upgrade, additional IT licences
Total 243.2
Recognising the need to accommodate strong growth in aeronautical demand, Auckland Airport is continuing to undertake a number of projects to increase capacity and maintain excellent customer service. In 2016, work continued on the expansion of the international departures area, which will significantly increase the footprint of the outbound customs processing and security areas as well as passenger dwell and retail space. The new domestic regional services also required additional apron investment, a new regional lounge and improved passenger flows.
Property capital expenditure was particularly strong and exceeded the original guidance by approximately $30 million or 40%. During the year, a number of projects were secured that were not included in the original budget of committed projects. These included the new Fonterra warehouse announced in April 2016 and two land parcels that were acquired during the year. The land was acquired to secure access to existing Auckland Airport land holdings and will facilitate new roading infrastructure.
Reflecting the continued growth in key areas of the business, capital expenditure for the 2017 financial year is forecast to be between $330 and $370 million, with a midpoint of $352 million as shown below.
CategoryForecast 2017
$M
Aeronautical 232
Property 98
Retail, car parking, infrastructure and other 22
Total capital expenditure 352
In 2017, key aeronautical projects such as the Pier B expansion, the international terminal level 1 expansion and increasing the number of remote stands will continue, contributing to increased aeronautical capital expenditure. Significant property projects such as the Fonterra warehouse, the Quad 7 office building and the Ministry for Primary Industries facility will drive another strong year for property development.
BorrowingsAs at 30 June 2016, Auckland Airport’s total borrowings were $1,886.9 million, an increase of $164.4 million on 30 June 2015. The increase is due to higher levels of borrowings to fund capital expenditure throughout financial year 2016 and reflects the revaluation of USPP debt. United States dollar appreciation and interest rate movements resulted in the USPP debt carrying value increasing by $21.6 million. The exchange rate movement was matched by an equal and offsetting movement in the cross-currency interest rate swaps fair value.

Financials16
Auckland International Airport Limited
Auckland Airport’s borrowings comprise USPP notes totalling $635.0 million, fixed rate bonds totalling $606.3 million, drawn bank facilities totalling $328.8 million, floating rate bonds totalling $225.0 million and commercial paper totalling $91.8 million.
Short-term borrowings with a maturity of one year or less accounted for $396.9 million, or 21.0% of total borrowings. This was an increase on the previous year’s $217.6 million. Current debt is made up of $91.8 million commercial paper, a $25.1 million bond that matures in August 2016, a $130.0 million bond that matures in November 2016 and a $150.0 million floating rate note that matures in April 2017.
As at 30 June 2016, Auckland Airport had total bank facilities of $608.8 million, of which $328.8 million was drawn and $280.0 million was available in standby capacity. As at 30 June 2016, total bank facilities included two fully drawn facilities with Bank of Tokyo totalling $145.0 million, a fully drawn AUD80.0 million Commonwealth Bank of Australia facility, a fully drawn NZD100.0 million Commonwealth Bank of Australia facility and undrawn standby facilities of $80.0 million from ANZ, $75.0 million from Westpac and $125.0 million from BNZ.
The longer-dated BNZ standby facility supports our commercial paper programme, which has a balance of $91.8 million as at 30 June 2016, and provides liquidity support for general working capital. As the commercial paper is supported by the bank facility, the following debt maturity profile chart, as at 30 June 2016, includes the commercial paper in the one to three-year brackets, matching the maturity of the supporting BNZ facility.
Borrowings by category
Commercial paper (4.9%)
Bank facilities (17.4%)
Floating bonds (11.9%)
Fixed bonds (32.1%)
USPP (33.7%)
Debt maturity profile as at 30 June 2016
0 100 200 300 400 500 600 700
Commercial paper
1–3 years
< 1 year
3–5 years
> 5 years
Bank facility Bonds – fixed
Bonds – floating
Debt maturity ($m)
USPP notes

Fina
ncia
l rep
ort
17
Auckland Airport manages its exposure to financial risk on a prudent basis. This is achieved by spreading borrowings across various roll-over and maturity dates and entering into financial instruments such as interest rate swaps in accordance with defined treasury policy parameters.
In the past year, we managed the impact of interest rate fluctuations by maintaining a policy-mandated level of fixed rate borrowings. We have also increased committed but undrawn bank facilities to provide for increased capital expenditure. Further details on Auckland Airport’s financial risk management objectives and policies are set out in note 18.4 of the financial statements.
Auckland Airport has a foreign currency exposure via its investment in North Queensland Airports from Australian to New Zealand dollars. Any movement in the value of this investment due to foreign currency translation is included in the foreign currency translation reserve (FCTR). As at 30 June 2016, Auckland Airport had AUD80.0 million of bank facilities drawn as a partial hedge of the currency exposure on this investment. At a consolidated group level, the foreign exchange movements on these bank facilities are also taken to the FCTR to partially offset the movements from the revaluation of the investment.
Key credit metrics
2016 2015 %
Debt/debt + market value of equity (as at 30 June) 19.7% 22.5%
Debt/EBITDAFI (as at 30 June) 4.4 4.5 (2.2)
Funds from operations interest cover (as at 30 June) 4.6 3.9 17.9
Weighted average interest cost (12 months to 30 June) 5.09% 5.79% (12.1)
Average debt maturity profile (as at 30 June, years) 4.29 4.89 (12.3)
Percentage of fixed borrowings (as at 30 June) 48.9% 49.5%
Capital structure and credit ratingAs at 30 June 2016, Standard & Poor’s (S&P) long-term credit rating of Auckland Airport was A- Stable, and the short-term credit rating was A2. S&P’s A- Stable rating reflects the strong ability of Auckland Airport to meet its financial commitments.
Cash flow
2016$M
2015$M
%change
Net cash inflow from operating activities 270.5 222.2 21.7%
Net cash outflow applied to investing activities (217.7) (130.6) 66.7%
Net cash outflow applied to financing activities (38.7) (94.5) (59.0%)
Net increase/(decrease) in cash held 14.1 (2.9)
Net cash inflow from operating activities was $270.5 million in the 2016 financial year, an increase of $48.3 million or 21.7% on the previous financial year. Consistent with prior years, the growth in net cash flow from operating activities was broadly in line with growth in earnings.
Net cash outflow applied to investing activities was $217.7 million in the 2016 financial year, an increase of $87.1 million or 66.7% due to an increase in the purchase of property, plant and equipment ($45.4 million) and investment property ($42.5 million).
Net cash outflow applied to financing activities was $38.7 million in the 2016 financial year, a decrease of $55.8 million or 59.0% on the previous financial year. Offsetting the $188.1 million of dividend payments, cash flows from financing activities for the 2016 financial year included a net inflow from borrowings of approximately $149.0 million to fund increased capital expenditure.

Financials18
Auckland International Airport Limited
2016 Returns for shareholders
Dividend policy
Auckland Airport’s dividend policy is to pay 100% of underlying net profit after tax (excluding unrealised gains and losses arising from a revaluation of property or treasury instruments and other one-off items), noting that, in special circumstances, the directors may consider the payment of ordinary dividends above or below this level, subject to the company’s cash flow requirements, forecast credit metrics and outlook at the time.
2016 dividend
The final dividend for the year ending 30 June 2016 is 9.00 cents per share (cps) compared to the final dividend of 7.30 cents per share in the 2015 financial year, an increase of 23.3%.
The 2016 final dividend will be paid on 13 October 2016 to shareholders on the register at the close of business on 29 September 2016. The dividend will carry full imputation credits at the company tax rate of 28%. In addition, the normal supplementary dividend, sourced from corresponding tax credits available to the company, will be paid to non-resident shareholders.
Distribution history
2012
2013
2014
2015
2016
Interim Final Capital return
0 5 10 15 20 25 30 35 40 45
Share price performance and total shareholder returns
Auckland Airport has seen strong share price performance in the year to 30 June 2016, with its share price increasing from $4.94 as at 30 June 2015 to $6.50 as at 30 June 2016. Total shareholder return, including share price appreciation and final dividends relating to the 2016 financial year, is 35.0%.
Five-year compound average total shareholder return
Share price
opening$
Share price
closing$
Dividend
cps
Total
return$
Average annualshareholder
return%
1 July 2011 to 30 June 2016 2.230 6.500 61.500 4.886 26.1%

Fina
ncia
l sta
tem
ents
19
Consolidated income statementFOR THE YEAR ENDED 30 JUNE 2016
Notes
2016$M
2015$M
Income
Airfield income 103.4 93.3
Passenger services charge 154.9 140.9
Retail income 5 157.5 132.0
Rental income 5 74.7 64.6
Rates recoveries 5.4 5.1
Car park income 52.1 46.6
Interest income 1.7 3.3
Other income 5 24.2 22.7
Total income 573.9 508.5
Expenses
Staff 5 46.8 46.3
Asset management, maintenance and airport operations 49.1 44.2
Rates and insurance 11.5 10.7
Marketing and promotions 16.3 13.2
Professional services and levies 9.7 7.3
Other expenses 5 10.2 6.8
Total expenses 143.6 128.5
Earnings before interest expense, taxation, depreciation, fair value adjustments and investments in associates (EBITDAFI) 430.3 380.0
Share of (loss)/profit of associates 8 (8.4) 12.5
Derivative fair value decrease 18.2 (2.6) (0.7)
Property, plant and equipment fair value revaluation 11(a) (16.5) (11.9)
Investment property fair value increase 12 87.1 57.2
Earnings before interest, taxation and depreciation (EBITDA) 489.9 437.1
Depreciation 11(a) 73.0 64.8
Earnings before interest and taxation (EBIT) 416.9 372.3
Interest expense and other finance costs 5 79.1 86.0
Profit before taxation 337.8 286.3
Taxation expense 7(a) 75.4 62.8
Profit after taxation attributable to owners of the parent 262.4 223.5
Cents Cents
Earnings per share
Basic and diluted earnings per share 10 22.05 18.78
The notes and accounting policies on pages 26 to 64 form part of and are to be read in conjunction with these financial statements.

Financials20
Auckland International Airport Limited
Consolidated statement of comprehensive incomeFOR THE YEAR ENDED 30 JUNE 2016
Notes
2016$M
2015$M
Profit for the year 262.4 223.5
Other comprehensive income
Items that will not be reclassified to the income statement
Net property, plant and equipment revaluation movement 11(a),16(ii) 784.0 109.3
Tax on the property, plant and equipment revaluation reserve 16(ii) (7.1) (30.1)
Items that will not be reclassified to the income statement 776.9 79.2
Items that may be reclassified subsequently to the income statement
Cash flow hedges
Fair value gains/(losses) recognised in the cash flow hedge reserve 16(iv) (36.5) (25.5)
Realised losses transferred to the income statement 16(iv) 6.0 9.2
Tax effect of movements in the cash flow hedge reserve 16(iv) 8.5 4.6
Total cash flow hedge movement (22.0) (11.7)
Movement in share of reserves of associates 8 10.8 1.7
Movement in foreign currency translation reserve 16(vi) (2.7) 1.7
Items that may be reclassified subsequently to the income statement (13.9) (8.3)
Total other comprehensive income 763.0 70.9
Total comprehensive income for the year, net of tax attributable to the owners of the parent 1,025.4 294.4
The notes and accounting policies on pages 26 to 64 form part of and are to be read in conjunction with these financial statements.
Fina
ncia
l sta
tem
ents
21
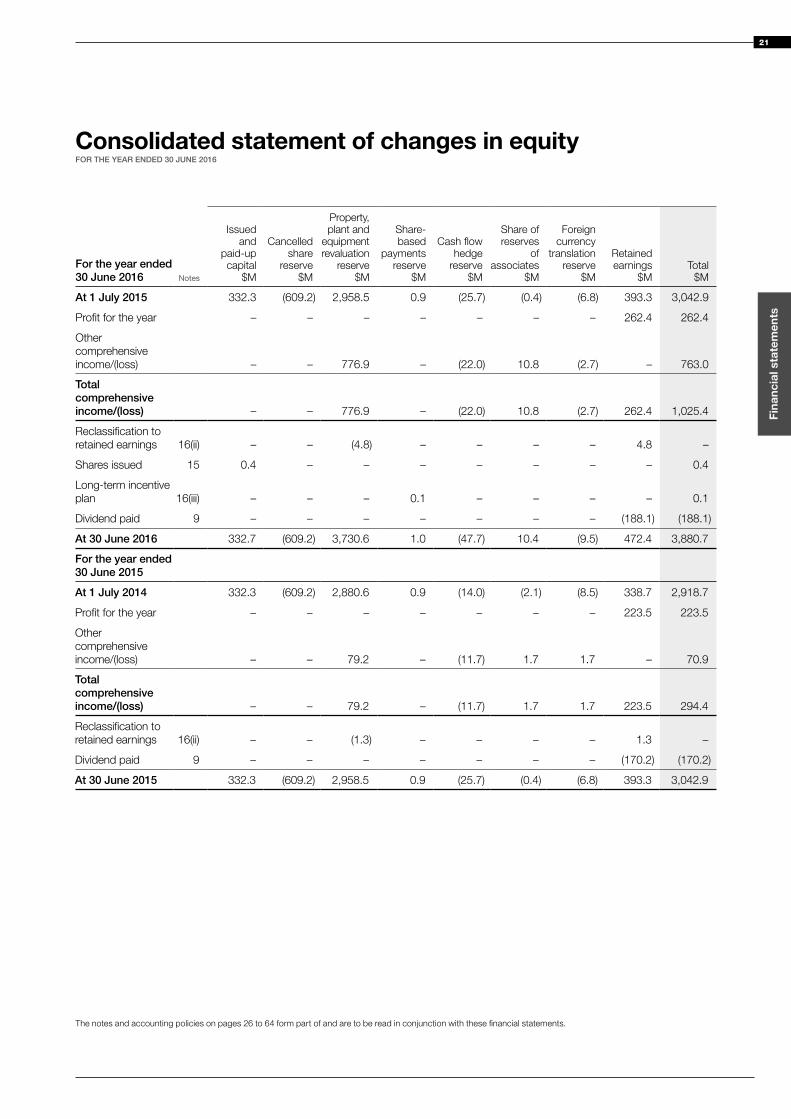
Consolidated statement of changes in equity FOR THE YEAR ENDED 30 JUNE 2016
For the year ended 30 June 2016 Notes
Issued and
paid-up capital
$M
Cancelled share
reserve $M
Property, plant and
equipment revaluation
reserve $M
Share- based
payments reserve
$M
Cash flow hedge
reserve $M
Share of reserves
of associates
$M
Foreign currency
translation reserve
$M
Retained earnings
$M Total
$M
At 1 July 2015 332.3 (609.2) 2,958.5 0.9 (25.7) (0.4) (6.8) 393.3 3,042.9
Profit for the year – – – – – – – 262.4 262.4
Other comprehensive income/(loss) – – 776.9 – (22.0) 10.8 (2.7) – 763.0
Total comprehensive income/(loss) – – 776.9 – (22.0) 10.8 (2.7) 262.4 1,025.4
Reclassification to retained earnings 16(ii) – – (4.8) – – – – 4.8 –
Shares issued 15 0.4 – – – – – – – 0.4
Long-term incentive plan 16(iii) – – – 0.1 – – – – 0.1
Dividend paid 9 – – – – – – – (188.1) (188.1)
At 30 June 2016 332.7 (609.2) 3,730.6 1.0 (47.7) 10.4 (9.5) 472.4 3,880.7
For the year ended 30 June 2015
At 1 July 2014 332.3 (609.2) 2,880.6 0.9 (14.0) (2.1) (8.5) 338.7 2,918.7
Profit for the year – – – – – – – 223.5 223.5
Other comprehensive income/(loss) – – 79.2 – (11.7) 1.7 1.7 – 70.9
Total comprehensive income/(loss) – – 79.2 – (11.7) 1.7 1.7 223.5 294.4
Reclassification to retained earnings 16(ii) – – (1.3) – – – – 1.3 –
Dividend paid 9 – – – – – – – (170.2) (170.2)
At 30 June 2015 332.3 (609.2) 2,958.5 0.9 (25.7) (0.4) (6.8) 393.3 3,042.9
The notes and accounting policies on pages 26 to 64 form part of and are to be read in conjunction with these financial statements.

Financials22
Auckland International Airport Limited
Consolidated statement of financial positionAS AT 30 JUNE 2016
Notes
2016$M
2015$M
Non-current assets
Property, plant and equipment 11(a) 4,708.1 3,884.1
Investment properties 12 1,048.9 848.1
Investment in associates 8 142.8 163.6
Derivative financial instruments 18 138.8 118.3
6,038.6 5,014.1
Current assets
Cash and cash equivalents 13 52.6 38.5
Inventories 0.1 –
Trade and other receivables 14 42.3 36.6
Dividends receivable 3.3 2.8
Taxation receivable 3.9 9.5
Derivative financial instruments 18 0.7 –
102.9 87.4
Total assets 6,141.5 5,101.5
The notes and accounting policies on pages 26 to 64 form part of and are to be read in conjunction with these financial statements.

Fina
ncia
l sta
tem
ents
23
Notes
2016$M
2015$M
Shareholders’ equity
Issued and paid-up capital 15 332.7 332.3
Reserves 16 3,075.6 2,317.3
Retained earnings 472.4 393.3
3,880.7 3,042.9
Non-current liabilities
Term borrowings 18.1 1,490.0 1,504.9
Derivative financial instruments 18 56.9 22.2
Deferred tax liability 7(c) 220.4 220.3
Other term liabilities 1.3 1.3
1,768.6 1,748.7
Current liabilities
Accounts payable and accruals 17 94.3 88.8
Derivative financial instruments 18 0.1 1.7
Short-term borrowings 18.1 396.9 217.6
Provisions 21 0.9 1.8
492.2 309.9
Total equity and liabilities 6,141.5 5,101.5
These financial statements were approved and adopted by the Board on 29 August 2016.
Signed on behalf of the Board by:
Sir Henry van der Heyden James MillerDirector, Chair of the Board Director, Chair of the Audit and Financial Risk Committee
The notes and accounting policies on pages 26 to 64 form part of and are to be read in conjunction with these financial statements.

Financials24
Auckland International Airport Limited
Consolidated cash flow statementFOR THE YEAR ENDED 30 JUNE 2016
Notes
2016$M
2015$M
Cash flow from operating activities
Cash was provided from:
Receipts from customers 569.5 500.6
Interest received 1.7 3.3
571.2 503.9
Cash was applied to:
Payments to suppliers and employees (151.2) (116.0)
Income tax paid (69.9) (79.5)
Interest paid (79.6) (86.2)
(300.7) (281.7)
Net cash flow from operating activities 6 270.5 222.2
Cash flow from investing activities
Cash was provided from:
Proceeds from sale of property, plant and equipment 0.1 0.3
Proceeds from sale of investment properties – 0.5
Dividends from associate 15.8 13.1
15.9 13.9
Cash was applied to:
Purchase of property, plant and equipment (124.4) (79.0)
Interest paid – capitalised (5.5) (4.3)
Expenditure on investment properties (103.7) (61.2)
(233.6) (144.5)
Net cash flow applied to investing activities (217.7) (130.6)
Cash flow from financing activities
Cash was provided from:
Increase in share capital 15 0.4 –
Increase in borrowings 275.0 565.8
275.4 565.8
Cash was applied to:
Decrease in borrowings (126.0) (490.1)
Dividends paid 9 (188.1) (170.2)
(314.1) (660.3)
Net cash flow applied to financing activities (38.7) (94.5)
Net increase/(decrease) in cash held 14.1 (2.9)
Opening cash brought forward 38.5 41.4
Ending cash carried forward 13 52.6 38.5
The notes and accounting policies on pages 26 to 64 form part of and are to be read in conjunction with these financial statements.

Fina
ncia
l sta
tem
ents
25
Notes and accounting policiesFOR THE YEAR ENDED 30 JUNE 2016

Notes and accounting policies CONTINUEDFOR THE YEAR ENDED 30 JUNE 2016
Financials26
Auckland International Airport Limited
1. Corporate informationAuckland International Airport Limited (the company or Auckland Airport) is a company established under the Auckland Airport Act 1987 and was incorporated on 20 January 1988 under the Companies Act 1955. The original assets of Auckland Airport were vested in the company on 1 April 1988 and 13 November 1988 by an Order in Council of the New Zealand Government. The company commenced trading on 1 April 1988. The company was reregistered under the Companies Act 1993 on 6 June 1997. The company is a Financial Markets Conduct reporting entity under Part 7 of the Financial Markets Conduct Act 2013.
The financial statements presented are for Auckland Airport and its wholly owned subsidiaries and associates (the group). There are five subsidiaries in the group. Three of the subsidiaries are Auckland Airport Limited, Auckland Airport Holdings Limited and Auckland Airport Holdings (No. 2) Limited. These subsidiaries hold the group’s investments in North Queensland Airports (Cairns Airport and Mackay Airport in Queensland
Australia), Queenstown Airport in New Zealand and the Tainui Auckland Airport Hotel Limited Partnership, which operates the Novotel hotel at Auckland Airport. The other two subsidiaries are the Auckland International Airport Limited Share Purchase Plan and the Auckland Airport Limited Executive Long Term Incentive Plan, which are consolidated because the company has control of the plans (refer note 23).
All the subsidiaries are incorporated in New Zealand.
Auckland Airport provides airport facilities and supporting infrastructure in Auckland, New Zealand. The group earns revenue from aeronautical activities, on-airport retail concessions and car parking facilities, stand-alone investment properties and other charges and rents associated with operating an airport.
These financial statements were authorised for issue in accordance with a resolution of the directors on 29 August 2016.
2. Summary of significant accounting policies
(a) Basis of preparation
Statutory baseThese financial statements have been prepared in accordance with the requirements of Part 7 of the Financial Markets Conduct Act 2013 and the NZX Main Board and Debt Market Listing Rules. In accordance with the Financial Markets Conduct Act 2013, separate financial statements for Auckland International Airport Limited are no longer required to be prepared and presented.
Measurement baseThe financial statements have been prepared on a historical cost basis, except for investment properties, land, buildings and services, runway, taxiways and aprons, infrastructural assets and derivative financial instruments, which have been measured at fair value.
The carrying values of recognised assets and liabilities that are hedged items in fair value hedges, and would otherwise be carried at cost or amortised at cost, are adjusted to record changes in the fair values attributable to the risks that are being hedged.
Presentation currencyThese financial statements are presented in New Zealand dollars, and all values are rounded to the nearest million dollars ($M) and one decimal point unless otherwise indicated.
(b) Statement of compliance
The financial statements have been prepared in accordance with generally accepted accounting practice in New Zealand. They comply with New Zealand equivalents to International Financial Reporting Standards (NZ IFRS) and other applicable Financial Reporting Standards as appropriate for profit-oriented entities. These financial statements also comply with International Financial Reporting Standards (IFRS).
(c) New accounting standards and interpretations
The accounting policies set out in these financial statements are consistent for all periods presented. The group did not adopt any new accounting standards, interpretation or amendments.
New or revised standards and interpretations that have been approved but are not yet effective have not been adopted by the group for the annual reporting period ended 30 June 2016. These will be applied when they become mandatory. The significant items are as follows:
• NZ IFRS 9 Financial Instruments is effective for annual periods beginning on or after 1 January 2018. NZ IFRS 9 addresses the classification, measurement and recognition of financial assets and financial liabilities and relaxes the current NZ IAS 39 requirements for hedge accounting. The group is yet to assess NZ IFRS 9’s full impact. The group intends to apply the standard from 1 July 2018.
• NZ IFRS 15 Revenue from Contracts with Customers is effective for annual periods beginning on or after 1 January 2018. It replaces the current revenue recognition guidance in NZ IAS 18 Revenue and NZ IAS 11 Construction Contracts. Revenue is recognised when a customer obtains control of a good or service. The group is yet to assess NZ IFRS 15’s full impact. The group will apply this standard from 1 July 2018.
• NZ IFRS 16 Leases is effective for annual periods beginning on or after 1 January 2019. NZ IFRS 16 sets out the principles for the recognition, measurement, presentation and disclosure of leases. The accounting requirements for lessors are substantially the same as those in NZ IAS 17, and while the group is yet to assess NZ IFRS 16’s full impact, it is expected to be immaterial. The group will apply this standard from 1 July 2019.

27
Fina
ncia
l sta
tem
ents
(d) Basis of consolidation
The consolidated financial statements incorporate the assets, liabilities and results of the subsidiaries over which the group has control.
On consolidation, all intercompany balances and transactions, income and expenses, and profit and losses resulting from transactions within the group have been eliminated in full.
(e) Investments in associates
The equity method of accounting is used for the three investments over which the group has significant influence but not a controlling interest.
Under the equity method, the investment in the associate is carried at cost plus post-acquisition changes in the group’s share of net assets of the associate less impairment losses. Goodwill relating to the associate is included in the carrying amount of the investment.
The group’s share of the change to associates’ post-acquisition profits or losses is recognised in the income statement, and its share of post-acquisition movements in reserves and the property, plant and equipment revaluation reserve is recognised in other comprehensive income and accumulated as a separate component of equity in the share of reserves of associates. The post-acquisition movements are included after adjustments to align the accounting policies with those of the group.
The results of North Queensland Airports that have an Australian dollar functional currency are translated to New Zealand dollars at an average exchange rate for the year. Assets (including goodwill) and liabilities are translated at the closing exchange rate at the balance date.
Exchange differences arising from the translation of the net investment in North Queensland Airport and of the foreign currency instruments designated as hedges of the net investment are recognised in other comprehensive income and accumulated in the foreign currency translation reserve.
(f) Property, plant and equipment
Properties held for airport operation purposes are classified as property, plant and equipment.
Property, plant and equipment are initially recognised at cost.
Vehicles, plant and equipment are carried at cost less accumulated depreciation and impairment losses.
Land, buildings and services, runway, taxiways and aprons and infrastructural assets are carried at fair value, as determined by an independent registered valuer, less accumulated depreciation and any impairment losses recognised after the date of any revaluation. Land, buildings and services, runway, taxiways and aprons and infrastructural assets acquired or constructed after the date of the latest revaluation are carried at cost, which approximates fair value. Revaluations are carried out with sufficient regularity to ensure that the carrying amount does not differ materially from fair value at the balance date.
RevaluationsRevaluation increases are recognised in other comprehensive income and accumulated as a separate component of equity in the property, plant and equipment revaluation reserve, except to the extent that they reverse a revaluation decrease of the same asset previously recognised in the income statement, in which case the increase is recognised in the income statement.
Revaluation decreases are recognised in the income statement, except to the extent that they offset a previous revaluation increase for the same asset, in which case the decrease is recognised in other comprehensive income and accumulated as a separate component of equity in the property, plant and equipment revaluation reserve.
Accumulated depreciation as at the revaluation date is eliminated against the gross carrying amounts of the assets and the net amounts are restated to the revalued amounts of the assets.
DepreciationDepreciation is calculated on a straight-line basis to allocate the cost or revalued amount of an asset, less any residual value, over its estimated useful life.
The estimated useful lives of property, plant and equipment are as follows:
Land (including reclaimed land) Indefinite
Buildings and services 5 – 50 years
Infrastructural assets 5 – 80 years
Runway, taxiways and aprons 12 – 40 years
Vehicles, plant and equipment 3 – 10 years
(g) Investment properties
Investment properties are properties held by the group to earn rental income, for capital appreciation or both (including property being constructed or developed for future use as investment property). Land held for a currently undetermined future use is classified as investment property.
Investment properties are measured initially at cost and then subsequent to that initial measurement are stated at fair value. To determine fair value, Auckland Airport commissions investment property valuations at least annually by independent valuers. Gains or losses arising from changes in the fair values of investment properties are recognised in the income statement.
If the fair value of investment property under construction cannot be reliably determined but it is expected the fair value of the property can be reliably determined when construction is complete, then investment property under construction will be measured at cost until either its fair value can be reliably determined or construction is complete.
Transfers are made to investment property when there is a change in use. This may be evidenced by ending of owner-occupation, commencement of an operating lease to another party or commencement of construction or development for future use as investment property.
A property transfer from investment property to property, plant and equipment or inventory has a deemed cost for subsequent accounting at its fair value at the date of change in use. If an item of property, plant and equipment becomes an investment property, the group accounts for such property as an investment property only subsequent to the date of change in use.
(h) Impairment of non-financial assets
Property, plant and equipment and investments in associates are assessed for indicators of impairment at each reporting date.

Notes and accounting policies CONTINUEDFOR THE YEAR ENDED 30 JUNE 2016
Financials28
Auckland International Airport Limited
(i) Borrowing costs
Borrowing costs that are directly attributable to the acquisition, construction or production of a qualifying asset are capitalised as part of the cost of that asset. Other borrowing costs are expensed as incurred.
(j) Financial instruments
The group’s financial assets comprise cash and cash equivalents, accounts receivable and dividends receivable (classified as loans and receivables) and derivatives (classified as held for trading or designated as a hedge).
The group’s financial liabilities comprise accounts payable and accruals, borrowings, provisions, other liabilities (classified as financial liabilities at amortised cost) and derivatives (classified as held for trading or designated as a hedge).
Cash
Cash in the statement of financial position and the cash flow statement comprises cash on hand, on-call deposits held with banks and short-term highly liquid investments.
Accounts receivable
Accounts receivable are recognised and carried at the original invoice amount less an allowance for impairment for any uncollectible amounts when there is objective evidence of impairment.
Accounts payable and accruals
Accounts payable and accruals are not interest bearing and are initially stated at their fair value and subsequently carried at amortised cost. Due to their short-term nature they are not discounted to net present value.
Borrowings
All borrowings are initially recognised at the fair value of the consideration received less directly attributable transaction costs, and subsequently measured at amortised cost using the effective interest method.
The increase and decrease in borrowings are reported net in the cash flow statement for bank facilities and commercial paper where the turnover is frequent and the maturities are short.
Derivative financial instruments
The group uses derivative financial instruments to hedge its risks associated with interest rates and foreign currency. Derivative financial instruments are recognised at fair value.
The group designates as fair value hedges derivative financial instruments on fixed-coupon debt where the fair value of the debt changes as a result of changes in market interest rates. The carrying amounts of the hedged items are adjusted for gains and losses attributable to the risk being hedged. The hedging instruments are also remeasured to fair value. Gains and losses from both are taken to the income statement.
Cash flow hedges are currently applied to future interest cash flows on variable rate loans. The effective portion of the gain or loss on the hedging instruments is recognised directly in other comprehensive income and accumulated as a separate component of equity in the cash flow hedge reserve, while the ineffective portion is recognised in the
income statement. Amounts taken to equity are transferred to the income statement when the hedged transaction affects the income statement.
For hedges of a net investment in a foreign operation, gains or losses on the hedging instruments relating to the effective portion of the hedge are recognised directly in other comprehensive income and accumulated as a separate component of equity in the foreign currency translation reserve. Any gains or losses relating to the ineffective portion are recognised in the income statement. On disposal of the foreign operation, the cumulative value of such gains or losses recognised in other comprehensive income is reclassified to the income statement.
(k) Issued and paid-up capital
Ordinary shares are classified as equity. Incremental costs directly attributable to the issue of new shares or options are shown in equity as a deduction, net of tax, from the proceeds.
When the group reacquires its own shares, those treasury shares are recognised as a reduction in shareholder equity.
(l) Revenue recognition
Rendering of servicesAirfield income, the passenger services charge and the terminal service charge are recognised as revenue when the airport facilities are used.
Retail concession fees are recognised as revenue on an accrual basis based upon the turnover of the concessionaires and in accordance with the related agreements.
Rental income is recognised as revenue on a straight-line basis over the term of the leases, on leases where the group is the lessor.
Revenue from public car parks is recognised when the car park utilisation has been completed. Revenue from staff car parks is recognised as revenue when the airport facilities are used.
Interest incomeInterest income is recognised as interest accrues using the effective interest method.
Dividend incomeDividends are recognised when the group’s right to receive payment is established.
(m) Employee benefits
Employee benefits including salaries and wages, superannuation and leave entitlements are expensed as the related service is provided.
The group also provides benefits to executives and employees of the group in the form of share-based payment transactions, whereby executives and employees render services in exchange for shares or rights over shares (‘equity-settled transactions’) and/or cash settlements based on the price of the group’s shares against performance targets (‘cash-settled transactions’). The cost of the transactions is spread over the period which the employees provide services and become entitled to the awards.
2. Summary of significant accounting policies CONTINUED

29
Fina
ncia
l sta
tem
ents
Equity-settled transactionsThe cost of the equity-settled transactions with employees is measured by reference to the fair value of the equity instruments at the date at which they are granted. The cost of equity-settled transactions is recognised in the income statement, together with a corresponding increase in the share-based payment reserve in equity.
Cash-settled transactionsThe fair value of cash-settled transactions is determined at each reporting date and the change in fair value is recognised in the income statement with a corresponding increase in the liability.
(n) Income tax and other taxes
Income taxCurrent tax assets and liabilities are measured at the amount expected to be recovered from or paid to the taxation authorities based on the current period’s taxable income.
Deferred taxDeferred income tax is provided on all temporary differences at the balance date between the tax bases of assets and liabilities and their carrying amounts for financial reporting purposes.
Income taxes relating to items recognised in other comprehensive income or directly in equity are recognised in other comprehensive income or directly in equity and not in the income statement.
Goods and services tax (GST)Revenue, expenses, assets and liabilities are stated exclusive of GST, except for receivables and payables, which are stated with the amount of GST included.
Cash flows are included in the cash flow statement on a gross basis and the GST component of cash flows arising from investing and financing activities, which is recoverable from, or payable to, the taxation authority, is classified as part of operating activities.
Commitments and contingencies are disclosed net of the amount of GST.
3. Significant accounting judgements, estimates and assumptions In producing the financial statements the group makes judgements, estimates and assumptions based on known facts, at a point in time. These accounting judgements, estimates and assumptions will rarely exactly match the actual outcome. The judgements that have the most significant effect on the amounts recognised, and estimates and assumptions that have a significant risk of causing a material adjustment to the carrying values of assets and liabilities within the next financial year are as follows:
(a) Fair value of investment property
Changes to market conditions or to assumptions made in the estimation of fair value may result in changes to the fair value of investment property. The carrying value of investment property and the valuation methodology are disclosed in note 12.
(b) Carrying value of property, plant and equipment
Judgement is required to determine whether the fair value of land, buildings and services, runway, taxiways and aprons and infrastructural assets has changed materially from the last revaluation. The determination of fair value at the time of the revaluation requires estimates and assumptions based on market conditions at that time. Changes to estimates, assumptions or market conditions subsequent to a revaluation
will result in changes to the fair value of property, plant and equipment.
Remaining useful lives and residual values are estimated based on management’s judgement, previous experience and guidance from registered valuers. Changes in those estimates affect the carrying value and the depreciation expense in the income statement.
The carrying value of property, plant and equipment and the valuation methodologies and assumptions are disclosed in note 11(c).
(c) Movements in the carrying value of property, plant and equipment
When revaluations are carried out by independent valuers, the valuer determines a value for individual assets. This may involve allocations to individual assets from projects and allocations to individual assets within a class of assets. The allocations to individual assets may be different to the allocations performed at the time a project was completed or different to the allocations to the individual asset made at the previous asset revaluation. These differences at an asset level may be material and can impact the income statement.

Notes and accounting policies CONTINUEDFOR THE YEAR ENDED 30 JUNE 2016
Financials30
Auckland International Airport Limited
4. Segment information
(a) Identification of reportable segments
The group has identified its operating segments based on the internal reports reviewed and used by the chief executive, as the chief operating decision maker, in assessing performance and in determining the allocation of resources.
The operating segments are identified by management based on the nature of services provided. Discrete financial information about each of these operating segments is reported to the chief executive at least monthly. The chief executive assesses performance of the operating segments based on segment EBITDAFI. Interest income and expenditure, taxation and depreciation, fair value adjustments and share of profits of associates are not allocated to operating segments as the group manages the cash position and assets at a group level.
(b) Types of services provided
AeronauticalThe aeronautical business provides services that facilitate the movement of aircraft, passengers and cargo and provides utility services that support the airport. The aeronautical business also earns rental revenue from space leased in facilities such as terminals.
RetailThe retail business provides services to the retailers within the terminals and provides car parking facilities for airport staff, visitors and passengers.
PropertyThe property business earns rental revenue from space leased on airport land outside the terminals including cargo buildings, hangars and stand-alone investment properties.
(c) Major customers
The group has a number of customers to which it provides services. The most significant customer in the 2016 financial year accounted for 25.1% of external revenue (2015: 25.8%). The revenue from this customer is included in all three operating segments.
(d) Geographical areas
Revenue from the reportable segments is derived in New Zealand, it being the location where the sale occurred. Property, plant and equipment and investment property of the reportable segments are located in New Zealand. The investments in associates are not part of the reportable segments of the group.
Aeronautical $M
Retail $M
Property $M
Total $M
Year ended 30 June 2016
Income from external customers
Airfield income 103.4 – – 103.4
Passenger services charge 154.9 – – 154.9
Retail income – 157.5 – 157.5
Rental income 15.1 0.5 59.1 74.7
Rates recoveries 0.7 0.8 3.9 5.4
Car park income – 52.1 – 52.1
Other income 7.5 9.2 2.2 18.9
Total segment income 281.6 220.1 65.2 566.9
Expenses
Staff 24.3 4.2 2.7 31.2
Asset management, maintenance and airport operations 31.7 11.4 3.7 46.8
Rates and insurance 3.6 1.5 5.7 10.8
Marketing and promotions 10.0 3.4 0.5 13.9
Professional services and levies 2.5 0.5 1.1 4.1
Other expenses 1.7 1.3 1.9 4.9
Total segment expenses 73.8 22.3 15.6 111.7
Segment earnings before interest, taxation and depreciation (segment EBITDAFI) 207.8 197.8 49.6 455.2

31
Fina
ncia
l sta
tem
ents
Aeronautical $M
Retail $M
Property $M
Total $M
Year ended 30 June 2015
Income from external customers
Airfield income 93.3 – – 93.3
Passenger services charge 140.9 – – 140.9
Retail income – 132.0 – 132.0
Rental income 14.1 0.4 50.1 64.6
Rates recoveries 0.7 1.1 3.3 5.1
Car park income – 46.6 – 46.6
Other income 7.7 9.0 2.2 18.9
Total segment income 256.7 189.1 55.6 501.4
Expenses
Staff 21.1 3.7 2.0 26.8
Asset management, maintenance and airport operations 29.7 8.9 3.3 41.9
Rates and insurance 3.5 1.3 5.2 10.0
Marketing and promotions 8.8 3.3 0.7 12.8
Professional services and levies 2.4 0.7 0.5 3.6
Other expenses 1.2 1.1 1.4 3.7
Total segment expenses 66.7 19.0 13.1 98.8
Segment earnings before interest, taxation and depreciation (segment EBITDAFI) 190.0 170.1 42.5 402.6
(e) Reconciliation of segment income to income statement
2016$M
2015$M
Segment income 566.9 501.4
Interest income 1.7 3.3
Other revenue 5.3 3.8
Total income 573.9 508.5

Notes and accounting policies CONTINUEDFOR THE YEAR ENDED 30 JUNE 2016
Financials32
Auckland International Airport Limited
(f) Reconciliation of segment EBITDAFI to income statement
The income included in unallocated external operating income consists mainly of interest from third-party financial institutions and income from telecommunication and technology services. The expenses included in unallocated external operating expenses consist mainly of corporate staff expenses and corporate legal and consulting fees.
2016$M
2015$M
Segment EBITDAFI 455.2 402.6
Unallocated external operating income 7.0 7.1
Unallocated external operating expenses (31.9) (29.7)
Share of (loss)/profit of associates (8.4) 12.5
Depreciation (73.0) (64.8)
Derivative fair value (decrease)/increase (2.6) (0.7)
Property, plant and equipment revaluation (16.5) (11.9)
Investment property fair value increase 87.1 57.2
Interest expense and other finance costs (79.1) (86.0)
Profit before taxation 337.8 286.3
4. Segment information CONTINUED

33
Fina
ncia
l sta
tem
ents
5. Profit for the year
Notes
2016$M
2015$M
Retail and rental income includes:
Contingent rent 14.9 11.2
Other income includes:
Gain on foreign currency movements – 0.3
Staff expenses comprise:
Salaries and wages 34.7 30.3
Employee benefits 4.9 4.3
Share-based payment plans 23 1.5 6.5
Defined contribution superannuation 1.5 1.2
Other staff costs 4.2 4.0
46.8 46.3
Other expenses include:
Audit fees for statutory audit and half-year review 0.2 0.2
Auditor’s regulatory audit, AGM fees 0.1 0.1
Directors’ fees 1.3 1.2
Bad and doubtful debts written off 0.4 0.2
Doubtful debts – change in provision – (0.1)
Loss on foreign currency movements 0.1 –
Interest expense and other finance costs comprise:
Interest on bonds and related hedging instruments 44.9 49.9
Interest on bank facilities and related hedging instruments 13.5 15.8
Interest on USPP notes and related hedging instruments 21.6 19.5
Interest on commercial paper and related hedging instruments 4.6 5.1
84.6 90.3
Less capitalised borrowing costs 11(a), 12 (5.5) (4.3)
79.1 86.0
Interest rate for capitalised borrowing costs 5.09% 5.79%
The gross interest costs of bonds, bank facilities, USPP notes and commercial paper excluding the impact of interest rate hedges was $79.1 million for the year ended 30 June 2016 (2015: $86.3 million).
The group makes contributions to a defined contribution superannuation scheme. The group has no legal or constructive obligation to make further contributions if the fund does not hold sufficient assets to pay employee benefits.
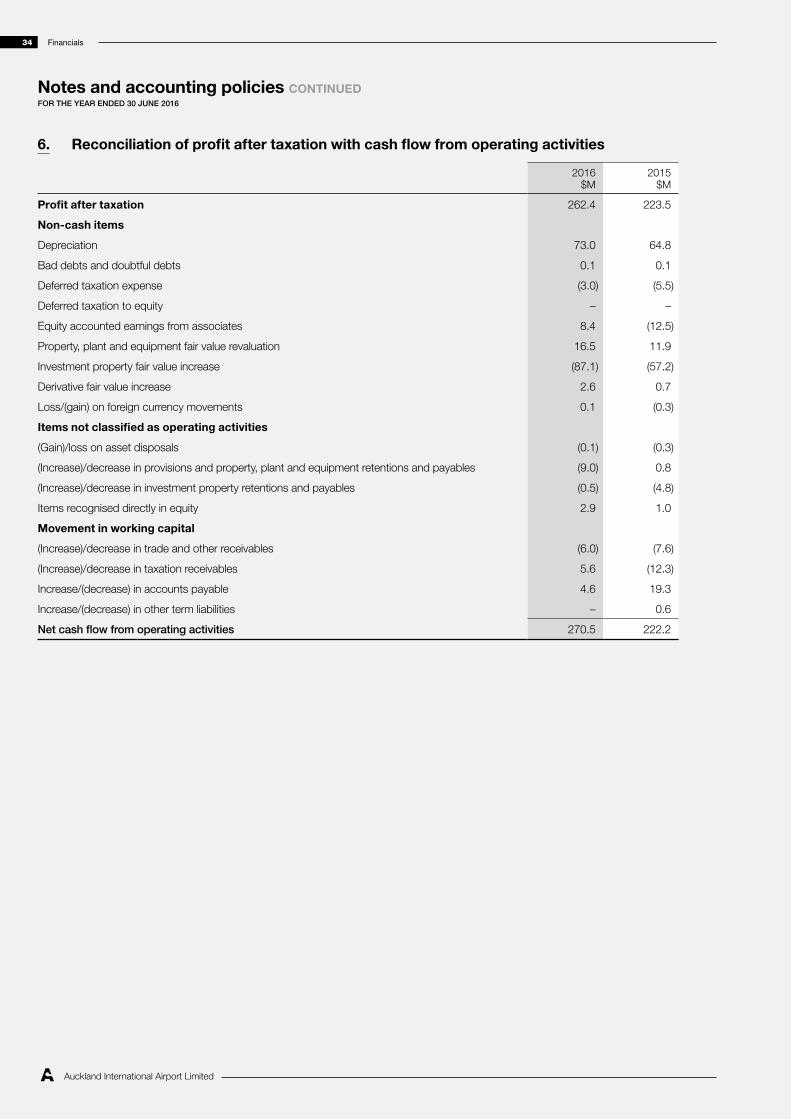
Notes and accounting policies CONTINUEDFOR THE YEAR ENDED 30 JUNE 2016
Financials34
Auckland International Airport Limited
6. Reconciliation of profit after taxation with cash flow from operating activities
2016$M
2015$M
Profit after taxation 262.4 223.5
Non-cash items
Depreciation 73.0 64.8
Bad debts and doubtful debts 0.1 0.1
Deferred taxation expense (3.0) (5.5)
Deferred taxation to equity – –
Equity accounted earnings from associates 8.4 (12.5)
Property, plant and equipment fair value revaluation 16.5 11.9
Investment property fair value increase (87.1) (57.2)
Derivative fair value increase 2.6 0.7
Loss/(gain) on foreign currency movements 0.1 (0.3)
Items not classified as operating activities
(Gain)/loss on asset disposals (0.1) (0.3)
(Increase)/decrease in provisions and property, plant and equipment retentions and payables (9.0) 0.8
(Increase)/decrease in investment property retentions and payables (0.5) (4.8)
Items recognised directly in equity 2.9 1.0
Movement in working capital
(Increase)/decrease in trade and other receivables (6.0) (7.6)
(Increase)/decrease in taxation receivables 5.6 (12.3)
Increase/(decrease) in accounts payable 4.6 19.3
Increase/(decrease) in other term liabilities – 0.6
Net cash flow from operating activities 270.5 222.2

35
Fina
ncia
l sta
tem
ents
7. Taxation
2016$M
2015$M
(a) Income tax expense
The major components of income tax are:
Current income tax
Current income tax charge 80.4 69.5
Income tax over provided in prior year (2.0) (1.2)
Deferred income tax
Movement in deferred tax (3.0) (5.5)
Total taxation expense 75.4 62.8
2016$M
2015$M
(b) Reconciliation between prima facie taxation and tax expense
Profit before taxation 337.8 286.3
Prima facie taxation at 28% 94.6 80.2
Adjustments:
Share of associates’ tax paid loss/(earnings) 3.4 (2.6)
Revaluation with no tax impact (21.4) (13.7)
Income tax over provided in prior year (2.0) (1.2)
Other 0.8 0.1
Total taxation expense 75.4 62.8

Notes and accounting policies CONTINUEDFOR THE YEAR ENDED 30 JUNE 2016
Financials36
Auckland International Airport Limited
(c) Deferred tax assets and liabilities
Balance1 July2015
$M
Movementin income
$M
Movementin other
comprehensiveincome
$M
Balance30 June
2016$M
Deferred tax liabilities
Property, plant and equipment 188.9 (12.2) 7.1 183.8
Investment properties 45.4 7.5 – 52.9
Foreign currency hedge – – 4.5 4.5
Other 2.0 0.8 – 2.8
Deferred tax liabilities 236.3 (3.9) 11.6 244.0
Deferred tax assets
Cash flow hedge 10.0 – 8.5 18.5
Provisions and accruals 6.0 (0.9) – 5.1
Deferred tax assets 16.0 (0.9) 8.5 23.6
Net deferred tax liability 220.3 (3.0) 3.1 220.4
Balance1 July2014
$M
Movementin income
$M
Movementin other
comprehensiveincome
$M
Balance30 June
2015$M
Deferred tax liabilities
Property, plant and equipment 166.8 (8.0) 30.1 188.9
Investment properties 41.8 3.6 – 45.4
Other 1.3 0.7 – 2.0
Deferred tax liabilities 209.9 (3.7) 30.1 236.3
Deferred tax assets
Cash flow hedge 5.4 – 4.6 10.0
Provisions and accruals 4.3 1.7 – 6.0
Deferred tax assets 9.7 1.7 4.6 16.0
Net deferred tax liability 200.2 (5.4) 25.5 220.3
At 30 June 2016, the group had accumulated tax losses in Australia of AUD56.6 million (30 June 2015: AUD53.8 million) relating to the group’s investment in North Queensland Airports. Deferred tax assets have not been recognised in respect of these Australian tax losses. This is because future Australian interest deductions are expected to offset any taxable distributed profits from North Queensland Airports in the Australian tax jurisdiction in the foreseeable future.
(d) Imputation credits
2016$M
2015$M
Imputation credits available for use in subsequent reporting periods at 30 June (36.0) (36.6)
The imputation credit account had a debit balance at 30 June 2016 and 30 June 2015. As required by tax legislation, the imputation credit account was in credit at 31 March 2016 and 31 March 2015.
7. Taxation CONTINUED

37
Fina
ncia
l sta
tem
ents
8. Associates
(a) Tainui Auckland Airport Hotel Limited Partnership
The limited partnership formed by AAPC Properties Pty Limited (Accor Hospitality), Tainui Group Holdings Limited and Auckland Airport developed and operates a 4-star plus, 263-room Novotel hotel adjacent to the international terminal at Auckland Airport. The Novotel hotel is 20% owned by Auckland Airport. The remaining 80% is owned in aggregate by Accor Hospitality and Tainui Group Holdings Limited.
The partnership has a balance date of 31 March 2016. The financial information for equity accounting purposes has been extracted from audited accounts for the period to 31 March 2016 and management accounts for the balance of the year to 30 June 2016.
Two of Auckland Airport’s senior management staff are directors on the board of the partnership. No directors’ fees are paid in relation to these appointments, but the skills and experience of these directors are being utilised to protect and grow Auckland Airport’s investment.
Other transactions with the partnership are as follows.
2016$M
2015$M
Rental income received 0.9 0.8
Facility hire fees paid 0.1 –
Future minimum rentals receivable under non-cancellable operating lease 10.0 10.4
(b) Stapled Securities of North Queensland Airports
Auckland Airport group owns a 24.55% stake in North Queensland Airports, the operator of Cairns and Mackay Airports in Queensland. The group purchased the stake in North Queensland Airports on 13 January 2010 for AUD132.8 million (NZD166.7 million).
During the year ended 30 June 2016, Auckland Airport received directors’ fees of $0.2 million (2015: $0.2 million) for the provision of two of Auckland Airport’s senior management staff who are each on one of the two boards of directors of North Queensland Airports. These directors apply their airport industry knowledge and skills, supported by the expertise of the other senior management of Auckland Airport, to protect and grow the value of the investment.
The bank financiers of North Queensland Airports have a security interest in the stapled securities held by Auckland Airport Holdings Limited in North Queensland Airports. There is no recourse to any other assets held by the group.
During the year ended 30 June 2016, North Queensland Airports recognised impairment losses of AUD60.8 million in relation to Mackay Airport and the ibis Mackay hotel. Auckland Airport group’s share of the impairments is NZD15.7 million.
(c) Queenstown Airport Corporation Limited
On 8 July 2010, Auckland Airport invested $27.7 million in 4.0 million new shares (24.99% of the increased shares on issue) in Queenstown Airport Corporation Limited (Queenstown Airport) and formed a strategic alliance. The strategic alliance commits both airports to work together to drive more tourist traffic into New Zealand and through the two airports. The airport companies also pursue operational synergies and benefits in other areas such as aeronautical operations, retailing activities and property development. The group does not earn fees for the services provided by Auckland Airport’s management staff under the strategic alliance agreement. During the year ended 30 June 2016, Auckland Airport received proceeds from the sale of assets to Queenstown Airport of $0.1 million (2015: nil).

Notes and accounting policies CONTINUEDFOR THE YEAR ENDED 30 JUNE 2016
Financials38
Auckland International Airport Limited
Summary financial information
The information below reflects the amounts in the financial statements of the associates (and not the group’s share of those amounts) before adjustments for depreciation expense and investment property revaluation gains to align the accounting policies with those of the group.
Tainui Auckland Airport Hotel Limited Partnership North Queensland Airports1 Queenstown Airport
2016$M
2015$M
2016$M
2015$M
2016$M
2015$M
Revenue 26.0 23.2 146.8 137.1 31.5 24.8
EBITDA 9.2 7.7 32.2 93.8 21.5 16.6
Profit after taxation 6.3 4.6 (59.8) 28.7 7.8 8.3
Other comprehensive income (loss) – – 10.8 2.0 34.9 (0.6)
Total comprehensive income for the year 6.3 4.6 (49.0) 30.7 42.7 7.7
Distributions
Repayment of partner contribution/dividends received (7.1) (3.0) (55.4) (46.1) (5.2) (4.3)
Auckland Airport share of repayment of partner contribution/dividends received (1.4) (0.6) (13.6) (11.4) (1.3) (1.1)
1. The extract from the North Queensland Airports income statement has been converted from AUD to NZD at the average rates for the year ended 30 June 2016: $0.9170, 30 June 2015: $0.9303.
Tainui Auckland Airport Hotel Limited Partnership North Queensland Airports1 Queenstown Airport
2016$M
2015$M
2016$M
2015$M
2016$M
2015$M
Current assets 3.8 3.9 43.0 38.0 3.8 2.3
Non-current assets 51.1 52.4 679.8 748.5 252.4 197.7
Goodwill – – 202.2 258.8 – –
Total assets 54.9 56.3 925.0 1,045.3 256.2 200.0
Current liabilities 5.2 4.0 51.0 46.3 4.9 4.7
Non-current liabilities 18.0 19.8 633.8 631.1 52.5 34.2
Shareholders’ equity 31.7 32.5 240.3 367.9 198.6 161.1
Total equity and liabilities 54.9 56.3 925.1 1,045.3 256.0 200.0
Auckland Airport ownership 20.00% 20.00% 24.55% 24.55% 24.99% 24.99%
Auckland Airport share of shareholders’ equity 6.3 6.5 59.0 90.3 49.6 40.3
Investment property revaluation 8.9 6.4 – – – –
Goodwill – – 19.7 21.1 – –
Gain on purchase – – – – (0.9) (0.9)
Subsequent adjustments made by associate – – – – – –
Carrying value of investment 15.2 12.9 78.7 111.4 48.7 39.4
1. The extract from the North Queensland Airports statement of financial position has been converted from AUD to NZD at the rate at 30 June 2016 $0.9552, 30 June 2015: $0.8930.
8. Associates CONTINUED

39
Fina
ncia
l sta
tem
ents
Movement in the group’s carrying amount of investment in associates
Notes
2016$M
2015$M
Investment in associates at beginning of year 163.6 158.4
Share of (loss)/profit of associates (8.4) 12.5
Share of reserves of associates 16(v) 10.8 1.7
Share of dividends received and repayment of partner contribution (16.3) (13.1)
Foreign currency translation 16(vi) (6.9) 4.1
Investment in associates at end of the period 142.8 163.6
9. Distribution to shareholders
Dividend payment date2016
$M2015
$M
2014 final dividend of 7.00 cps 17 October 2014 – 83.3
2015 interim dividend of 7.30 cps 2 April 2015 – 86.9
2015 final dividend of 7.30 cps 16 October 2015 86.9 –
2016 interim dividend of 8.50 cps 7 April 2016 101.2 –
Total dividends paid 188.1 170.2
Supplementary dividends of $12.1 million (2015: $10.2 million) are not included in the above dividends as the company receives an equivalent tax credit from Inland Revenue.
10. Earnings per shareThe earnings used in calculating basic and diluted earnings per share is net profit attributable to equity holders of $262.4 million (2015: $223.5 million).
The weighted average number of shares used to calculate basic and diluted earnings per share is as follows.
2016Shares
2015Shares
For basic earnings per share 1,190,213,008 1,190,127,831
Effect of dilution of share options – –
For dilutive earnings per share 1,190,213,008 1,190,127,831
The 2016 reported basic and diluted earnings per share is 22.05 cents (2015: 18.78 cents).

Notes and accounting policies CONTINUEDFOR THE YEAR ENDED 30 JUNE 2016
Financials40
Auckland International Airport Limited
11. Property, plant and equipment
(a) Reconciliation of carrying amounts at the beginning and end of the year
Year end 30 June 2016Land
$M
Buildingsand services
$MInfrastructure
$M
Runway,taxiways
and aprons$M
Vehicles,plant and
equipment$M
Total$M
Balances at 1 July 2015
At fair value 2,657.7 548.8 320.1 279.3 – 3,805.9
At cost – – – – 92.6 92.6
Work in progress at cost – 34.5 3.0 40.9 14.3 92.7
Accumulated depreciation – (0.3) (44.3) – (62.5) (107.1)
Balances at 1 July 2015 2,657.7 583.0 278.8 320.2 44.4 3,884.1
Additions and transfers within property, plant and equipment – 76.7 18.3 25.1 17.0 137.2
Transfers from/(to) investment property 0.5 (8.4) 0.5 (0.3) 0.1 (7.7)
Disposals – – – – – –
Revaluation recognised in property, plant and equipment revaluation reserve 758.5 – 25.5 – – 784.0
Revaluation recognised in the income statement 1.3 – (17.8) – – (16.5)
Depreciation – (38.9) (11.4) (11.7) (11.0) (73.0)
Movement to 30 June 2016 760.3 29.4 15.1 13.1 6.1 824.0
Balances at 30 June 2016 – – – – – –
At fair value 3,418.0 582.4 276.3 293.3 – 4,570.0
At cost – – – – 95.1 95.1
Work in progress at cost – 69.1 18.0 51.7 16.0 154.8
Accumulated depreciation – (39.1) (0.4) (11.7) (60.6) (111.8)
Balances at 30 June 2016 3,418.0 612.4 293.9 333.3 50.5 4,708.1

41
Fina
ncia
l sta
tem
ents
Year end 30 June 2015Land
$M
Buildingsand services
$MInfrastructure
$M
Runway,taxiways
and aprons$M
Vehicles,plant and
equipment$M
Total$M
Balances at 1 July 2014
At fair value 2,649.7 573.5 303.6 299.3 – 3,826.1
At cost – – – – 79.0 79.0
Work in progress at cost – 23.1 10.6 37.3 16.8 87.8
Accumulated depreciation – (97.6) (32.7) (38.4) (62.7) (231.4)
Balances at 1 July 2014 2,649.7 499.0 281.5 298.2 33.1 3,761.5
Additions and transfers within property, plant and equipment 0.1 44.7 8.8 8.0 20.0 81.6
Transfers from/(to) investment property 7.9 0.6 – – – 8.5
Disposals – – – – (0.1) (0.1)
Revaluation recognised in property, plant and equipment revaluation reserve – 80.1 – 29.2 – 109.3
Revaluation recognised in the income statement – (7.8) – (4.1) – (11.9)
Depreciation – (33.6) (11.5) (11.1) (8.6) (64.8)
Movement to 30 June 2015 8.0 84.0 (2.7) 22.0 11.3 122.6
Balances at 30 June 2015
At fair value 2,657.7 548.8 320.1 279.3 – 3,805.9
At cost – – – – 92.6 92.6
Work in progress at cost – 34.5 3.0 40.9 14.3 92.7
Accumulated depreciation – (0.3) (44.3) – (62.5) (107.1)
Balances at 30 June 2015 2,657.7 583.0 278.8 320.2 44.4 3,884.1
Additions for the year ended 30 June 2016 include capitalised interest of $3.7 million (2015: $2.8 million).

Notes and accounting policies CONTINUEDFOR THE YEAR ENDED 30 JUNE 2016
Financials42
Auckland International Airport Limited
11. Property, plant and equipment CONTINUED
(b) Carrying amounts of land, buildings and services, infrastructure, runway, taxiways and aprons if measured at historical cost less accumulated depreciation
Year end 30 June 2016Land
$M
Buildingsand services
$MInfrastructure
$M
Runway,taxiways
and aprons$M
Vehicles,plant and
equipment$M
Total$M
At historical cost 133.4 828.2 264.4 303.1 95.1 1,624.2
Work in progress at cost – 69.1 18.0 51.7 16.0 154.8
Accumulated depreciation – (480.2) (110.8) (180.7) (60.6) (832.3)
Net carrying amount 133.4 417.1 171.6 174.1 50.5 946.7
Year end 30 June 2015
At historical cost 133.4 811.4 265.0 290.7 92.6 1,593.1
Work in progress at cost – 34.5 3.0 40.9 14.3 92.7
Accumulated depreciation – (467.6) (107.3) (172.4) (62.5) (809.8)
Net carrying amount 133.4 378.3 160.7 159.2 44.4 876.0
(c) Revaluation of land, buildings and services, infrastructure, runway, taxiways and aprons
At the end of each reporting period, the group makes an assessment of whether the carrying amounts differ materially from fair value and whether a revaluation is required. The assessment considers changes in significant inputs since the previous valuation, movements in the capital goods price index and changes in valuations of investment property as an indicator of property, plant and equipment.
Valuations are completed in accordance with the company’s asset valuation handbook, which is prepared in accordance with financial reporting and valuation standards. Management reviews the key inputs, assesses valuation movements and holds discussions with the valuers as part of the process. Discussions about the valuation processes and results are held between the group’s management and the Board.
The group revalued infrastructure and land at 30 June 2016. Infrastructure assets were independently valued by Beca Projects NZ Limited (Beca), a multi-disciplinary engineering consultancy company. Infrastructure was previously revalued as at 30 June 2011 by Opus International Consultants Limited (Opus), a multi-disciplinary engineering consultancy company. Land assets were independently valued by Colliers International Limited (Colliers), Savills Limited (Savills), Jones Lang LaSalle Ltd (JLL) and Opus. Land was previously revalued as at 30 June 2014 by Colliers, Savills and Opus.
At 30 June 2016, the assessment is that there is no material change in the fair value of buildings and services, runway, taxiways and aprons. Those assets were independently revalued by Opus as at 30 June 2015.
Fair value measurementThe valuers use different approaches for valuing different asset groups. Where the fair value of an asset is able to be determined by reference to market-based evidence, such as sales of comparable assets, the fair value is determined using this information. Where fair value of the asset is not able to be reliably determined using market-based evidence, discounted cash flows or optimised depreciated replacement cost is used to determine fair value. Assets acquired or constructed after the date of the latest revaluation are carried at cost, which approximates fair value. The valuation methodologies used in the infrastructure and land revaluation as at 30 June 2016 are consistent with the valuation methodologies used in the last valuations as at 30 June 2011 and 30 June 2014 respectively.
The group’s land, buildings and services, infrastructure, runway, taxiways and aprons are all categorised as Level 3 in the fair value hierarchy as described in note 18.3. During the year, there were no transfers between the levels of the fair value hierarchy.

43
Fina
ncia
l sta
tem
ents
The table below summarises the valuation approach and the principal assumptions used in establishing the fair values.
2016 2015
Asset valuation approach
Inputs used to measure fair value
Range of significant unobservable inputs
Weighted average
Range of significant unobservable inputs
Weighted average
Land
Airfield land, including land for runway, taxiways, aprons and approachesMarket value alternative use valuation plus development and holding costs to achieve land suitable for airport use and direct sales comparison
Rate per sqm prior to holding costs (excluding approaches) $103–171 $133 $76–134 $101
Holding costs per sqm (excluding approaches) $38–62 $48 $28–49 $37
Holding period (excluding approaches) 5.0 years N/A 5.0 years N/A
Airfield land discount rate 9.00% N/A 9.00% N/A
Rate per sqm (approaches) $11–50 $16 $7–105 $18
Reclaimed land seawallsOptimised depreciated replacement cost
Unit costs of seawall construction per sqm $4,211–8,666 $6,125 $5,250–9,950 $7,600
Unit costs of reclamation per sqm $94–127 $117 $83–152 $106
Aeronautical land, including land associated with aircraft, freight and terminal usesDiscounted cash flow cross-referenced to a market capitalisation of net revenues as indicated by market activity from comparable transactions and direct sales comparison
Rate per sqm (excluding commercially leased assets) $78–793 $177 $58–450 $117
Market rent (per sqm) – average $41–304 $106 $41–318 $99
Market capitalisation rate – average 4.23–7.52% 6.23% 5.25–8.61% 7.17%
Terminal capitalisation rate 7.00–8.50% 6.30% 7.75–9.00% 8.37%
Discount rate 8.25–9.25% 8.45% 9.00–9.50% 9.16%
Rental growth rate (per annum) 2.61–2.80% 2.70% 2.50–3.40% 2.54%
Land associated with car park facilitiesDiscounted cash flow cross-referenced to a market capitalisation of net revenues as indicated by market activity from comparable transactions
Discount rate 9.00–11.25% 11.00% 9.50–12.50% 12.14%
Terminal capitalisation rate 7.00–7.50% 7.43% 8.00–8.75% 8.65%
Revenue growth rate (per annum) 2.03–3.21% 3.09% 2.03–3.50% 3.00%
Market capitalisation rate 6.95–7.51% 7.44% 8.00–8.75% 8.65%
Land associated with retail facilities within terminal buildingsDiscounted cash flow cross-referenced to a market capitalisation of net revenues as indicated by market activity from comparable transactions
Discount rate 12.50–12.50% 12.50% 9.50–18.50% 13.50%
Terminal capitalisation rate 9.25–9.25% 9.25% 9.50–9.50% 9.50%
Revenue growth rate (per annum) 4.11–5.38% 4.18% 3.34–3.86% 3.83%
Market capitalisation rate 8.38–8.50% 8.38% 9.50–9.50% 9.50%

Notes and accounting policies CONTINUEDFOR THE YEAR ENDED 30 JUNE 2016
Financials44
Auckland International Airport Limited
2016 2015
Asset valuation approach
Inputs used to measure fair value
Range of significant unobservable inputs
Weighted average
Range of significant unobservable inputs
Weighted average
Other landDirect sales comparison Rate per sqm $18–66 $58 $13–50 $44
Buildings and services
Terminal buildingsOptimised depreciated replacement cost Unit costs of construction per sqm $2,491–8,349 $6,016 $2,491–8,349 $6,016
Other buildingsOptimised depreciated replacement cost Unit costs of construction per sqm $636–2,374 $1,282 $636–2,374 $1,282
Infrastructure
Water and drainageOptimised depreciated replacement cost Unit costs of pipe construction
per m $207–3,074 $524 $90–1,680 $435
ElectricityOptimised depreciated replacement cost Unit costs of electrical cabling
construction per m $162–517 $370 $120–324 $206
RoadsOptimised depreciated replacement cost Unit costs of road and footpath
construction per sqm $2–168 $112 $76–121 $110
Other infrastructure assetsOptimised depreciated replacement cost
Unit costs of navigation aids and lights $418–81,731 $11,247 $3,000–7,000 $5,900
Unit costs of fuel pipe construction per m $3,661–5,231 $4,656 $2,620–3,750 $3,200
Runway, taxiways and aprons
Optimised depreciated replacement cost
Unit costs of concrete pavement construction per sqm $459 –737 $587 $459–737 $587
Unit costs of asphalt pavement construction per sqm $108–237 $142 $108–237 $142
11. Property, plant and equipment CONTINUED

45
Fina
ncia
l sta
tem
ents
The valuation inputs for infrastructure and land are from the 2016 valuation, and the valuation inputs for buildings and services and runway, taxiways and aprons are from the 2015 valuation.
Description of different valuation approaches
VALUATION APPROACH DESCRIPTION
Income capitalisation approach
A valuation methodology that determines fair value by capitalising a property’s sustainable net income at an appropriate market-derived capitalisation rate with subsequent capital adjustments for near-term events, typically including letting-up allowances for vacancies and pending expiries, expected short-term capital expenditure and the present value of any difference between contract and market rentals.
Discounted cash flow analysis
A valuation methodology that requires the application of financial modelling techniques. Discounted cash flow analysis requires explicit assumptions to be made regarding the prospective income and expenses of a property, such assumptions pertaining to the quantity, quality, variability, timing and duration of inflows and outflows over an assumed holding period. The assessed cash flows are discounted to present value at an appropriate market-derived discount rate to determine fair value.
Direct sales comparison approach
A valuation methodology whereby the subject property is compared to recently sold properties of a similar nature with fair value determined through the application of positive and negative adjustments for their differing attributes.
Market value alternative use (MVAU)
A valuation methodology whereby fair value is determined as the estimated amount for which a property should exchange on the date of valuation between a willing buyer and a willing seller in an arm’s length transaction after proper marketing, wherein the parties had each acted knowledgeably, prudently and without compulsion, with the explicit assumption that the existing use of the asset is ignored.
Optimised depreciated replacement cost (ODRC)
A valuation methodology whereby fair value is determined by calculating the cost of constructing a modern equivalent asset at current market-based input cost rates, adjusted for the remaining useful life of the assets (depreciation) and any suboptimal usage of the assets in their current application (optimisation). These inputs are deemed unobservable.
The table below summarises each registered valuer’s valuation of property, plant and equipment.
Asset classification Valuer
Fair value at 30 June 2016
$M Valuer
Fair value at 30 June 2015
$M
Airfield land, including land for runway, taxiways, aprons and approaches1 Savills 1,016.4 Savills 668.4
Reclaimed land seawalls1 Opus/Savills 205.1 Opus 194.3
Aeronautical land, including land associated with aircraft, freight and terminal uses1 JLL 120.0 Savills 228.6
Land associated with car park facilities1 Colliers 544.8 Colliers 390.2
Land associated with retail facilities within terminal buildings1 Colliers 1,433.8 Colliers 1,135.5
Other land1 Savills 97.9 Savills 40.7
Terminal buildings2 Opus 539.1 Opus 472.2
Other buildings2 Opus 73.3 Opus 110.8
Water and drainage3 Beca 123.3 Opus 114.0
Electricity3 Beca 46.8 Opus 47.1
Roads3 Beca 52.7 Opus 42.5
Other infrastructure assets3 Beca 71.1 Opus 75.2
Runway, taxiways and aprons2 Opus 333.3 Opus 320.2
Assets carried at fair value 4,657.6 3,839.7
Vehicles, plant and equipment (carried at cost less accumulated depreciation) N/A 50.5 N/A 44.4
Balance at 30 June 4,708.1 3,884.1
1. Land was revalued at 30 June 2016. That class was previously revalued at 30 June 2014.
2. At 30 June 2016, the assessment is that there is no material change in the fair value of buildings and services and runway, taxiways and aprons. Those classes were last revalued at 30 June 2015.
3. Infrastructure was revalued at 30 June 2016. That class was previously revalued at 30 June 2011.

Notes and accounting policies CONTINUEDFOR THE YEAR ENDED 30 JUNE 2016
Financials46
Auckland International Airport Limited
The following table shows the impact on the fair value due to a change in a significant unobservable input.
Fair value measurement sensitivity to significant:
Increase in input
Decrease in input
Unobservable inputs within the income capitalisation approach
Market rent The valuer’s assessment of the net market income attributable to the property
Increase Decrease
Market capitalisation rate The rate of return, determined through analysis of comparable market-related sales transactions, that is applied to the market rent to assess a property’s value
Decrease Increase
Unobservable inputs within the discounted cash flow analysis
Discount rate The rate, determined through analysis of comparable market-related sales transactions, that is applied to a property’s future net cash flows to convert those cash flows into a present value
Decrease Increase
Terminal capitalisation rate The rate that is applied to a property’s sustainable net income at the end of an assumed holding period to derive an estimated future market value
Decrease Increase
Rental growth rate The annual growth rate applied to the market rent over an assumed holding period
Increase Decrease
Unobservable inputs within the direct sales comparison approach
Rate per sqm The rate per square metre of recently sold properties of a similar nature Increase Decrease
Unobservable inputs within market value alternative use (MVAU) plus holding costs
Rate per sqm prior to holding costs
The assumed rate per square metre, based on recently sold properties, for which the group would acquire land, assuming it had not been designated for its existing use
Increase Decrease
Holding costs per sqm The costs of holding land while being developed to achieve land suitable for airport use
Increase Decrease
Holding period The expected holding period to achieve land suitable for airport use Increase Decrease
Unobservable inputs within optimised depreciated replacement cost (ODRC)
Unit costs of construction The costs of constructing various asset types based on a variety of sources including recent local competitively tendered construction works, published cost information, the valuer’s database of costing information and experience of typical industry rates and indexed historical cost information
Increase Decrease
11. Property, plant and equipment CONTINUED

47
Fina
ncia
l sta
tem
ents
12. Investment propertiesThe table below summarises the movements in fair value of investment properties.
Year end 30 June 2016
Retail andservice
$MIndustrial
$M
Vacantland$M
Other$M
Total$M
Balance at the beginning of the year 175.3 378.0 234.6 60.2 848.1
Additions – subsequent expenditure – 47.2 4.2 15.9 67.3
Additions – acquisitions or development 0.4 18.0 19.4 0.9 38.7
Transfers from (to) property, plant and equipment (note 11) – (2.6) – 10.3 7.7
Transfers within investment property – 13.2 (13.2) – –
Investment property fair value increase 15.7 53.2 9.9 8.3 87.1
Net carrying amount 191.4 507.0 254.9 95.6 1,048.9
Year end 30 June 2015
Balance at the beginning of the year 156.8 296.9 224.8 54.9 733.4
Additions – subsequent expenditure 6.8 32.5 0.6 2.4 42.3
Additions – acquisitions or development 0.5 12.3 10.0 0.9 23.7
Transfers from (to) property, plant and equipment (note 11) – (2.3) (6.2) – (8.5)
Transfers within investment property – 13.7 (13.7) – –
Investment property fair value increase 11.2 24.9 19.1 2.0 57.2
Net carrying amount 175.3 378.0 234.6 60.2 848.1
Additions for the year ended 30 June 2016 include capitalised interest of $1.8 million (2015: $1.5 million).
The group’s investment properties is categorised as Level 3 in the fair value hierarchy, as described in note 18.3.
During the year, there were no transfers of investment property between levels of the fair value hierarchy.
The basis of valuation is market value, based on each property’s highest and best use. The valuation methodologies used were a direct sales comparison or a direct capitalisation of rental income using market comparisons of capitalisation rates, supported by a discounted cash flow approach. Further details of the valuation methodologies and sensitivities are included in note 11(c). The valuation methodologies are consistent with prior years.

Notes and accounting policies CONTINUEDFOR THE YEAR ENDED 30 JUNE 2016
Financials48
Auckland International Airport Limited
The principal assumptions used in establishing the valuations were as follows.
2016 2015
Asset classification and valuation approach
Inputs used to measure fair value
Range of significant unobservable inputs
Weighted average
Range of significant unobservable inputs
Weighted average
Retail and service
Discounted cash flow cross-referenced to a market capitalisation of net revenues as indicated by market activity from comparable transactions
Market rent (per sqm) $41–579 $239 $39–584 $207
Market capitalisation rate 5.75–8.50% 7.06% 6.00–9.00% 6.80%
Terminal capitalisation rate 6.00–8.75% 7.24% 6.75–9.00% 7.52%
Discount rate 7.75–10.50% 9.31% 7.50–9.75% 8.43%
Rental growth rate (per annum) 2.61–2.80% 2.68% 2.42–3.10% 2.69%
Industrial
Discounted cash flow cross-referenced to a market capitalisation of net revenues as indicated by market activity from comparable transactions
Market rent (per sqm) $92–263 $128 $75–261 $110
Market capitalisation rate 5.75–9.25% 6.85% 5.28–9.13% 7.33%
Terminal capitalisation rate 6.00–9.50% 7.14% 6.63–10.00% 7.67%
Discount rate 7.50–11.00% 8.41% 8.25–10.75% 8.95%
Rental growth rate (per annum) 2.61–2.80% 2.70% 2.23–2.75% 2.03%
Vacant land
Direct sales comparison and residual value Rate per sqm $8–425 $84 $8–521 $78
Other
Discounted cash flow cross-referenced to a market capitalisation of net revenues as indicated by market activity from comparable transactions
Market rent (per sqm) $196–460 $336 $196–460 $306
Market capitalisation rate 6.75–8.00% 7.28% 6.75–8.00 % 7.48%
Terminal capitalisation rate 7.00–8.25% 7.54% 7.25–8.50% 7.92%
Discount rate 8.25–9.75% 9.03% 8.75–9.50% 8.96%
Rental growth rate (per annum) 2.61–2.80% 2.78% 2.50–2.75% 1.54%
The fair value of investment properties valued by each independent registered valuer is outlined below.
2016$M
2015$M
Colliers International Limited 322.2 295.4
CB Richard Ellis Limited – 252.5
Savills Limited 381.8 278.5
Jones Lang LaSalle Limited 314.7 –
Investment property carried at cost 30.2 21.7
Total fair value of investment properties 1,048.9 848.1
The investment properties assigned to valuers are rotated across the portfolio every three years, with the last rotation in June 2016. All valuers are registered valuers and industry specialists in valuing these types of investment properties.
Income and expenses related to investment property
2016$M
2015$M
Rental income for investment properties 43.7 37.0
Recoverable cost income 5.1 4.6
Direct operating expenses for investment properties that derived rental income (6.2) (5.6)
Direct operating expenses for investment properties that did not derive rental income (0.4) (0.4)
12. Investment properties CONTINUED

49
Fina
ncia
l sta
tem
ents
13. Cash and cash equivalents
2016$M
2015$M
Short-term deposits 48.7 33.7
Cash and bank balances 3.9 4.8
52.6 38.5
Cash and bank balances earn interest at daily bank deposit rates. During the year, surplus funds were deposited on the overnight money market and term deposit at a rate of 2.25–3.45% (2015: 3.25–4.25%). At 30 June 2016, the short-term deposits were held with two financial institutions, with no more than $40.0 million with a single institution.
14. Trade and other receivables
2016$M
2015$M
Trade receivables 7.5 4.4
Less: Provision for doubtful debts (0.5) (0.4)
Net trade receivables 7.0 4.0
Prepayments 10.4 7.0
Revenue accruals and other receivables 24.9 25.6
42.3 36.6
Allowance for impairment
Trade receivables have general payment terms of the 1st or the 20th of the month following invoice. Movements in the provision for doubtful debts have been included in other expenses in the income statement. No individual amount within the provision for doubtful debts is material.
15. Issued and paid-up capital
2016$M
2015$M
2016Shares
2015Shares
Opening issued and paid-up capital at 1 July 332.3 332.3 1,190,128,107 1,190,126,487
Shares fully paid and allocated to employees by employee share scheme 0.4 – 139,441 1,620
Closing issued and paid-up capital at 30 June 332.7 332.3 1,190,267,548 1,190,128,107
All issued shares are fully paid and have no par value. The company does not limit the amount of authorised capital.
Each ordinary share confers on the holder one vote at any shareholder meeting of the company and carries the right to dividends.
As members of the group, the shares held by the Employee Share Purchase Plan and the Executive Long-Term Incentive Plan are eliminated from the group’s issued and paid-up capital. When those shares are transferred out of the plans and allocated or vested to employees, they are recognised as an increase in issued and paid-up capital. 139,441 shares were allocated to employees in the year ended 30 June 2016 (2015: 1,620). Refer to note 23 Share-based payment plans.

Notes and accounting policies CONTINUEDFOR THE YEAR ENDED 30 JUNE 2016
Financials50
Auckland International Airport Limited
16. Reserves(i) Cancelled share reserve
2016$M
2015$M
Balance at the beginning and end of the year (609.2) (609.2)
The cancelled share reserve records the premium above paid-up share capital incurred on the return of capital to shareholders and on-market buy-backs of ordinary shares.
(ii) Property, plant and equipment revaluation reserve
2016$M
2015$M
Balance at 1 July 2,958.5 2,880.6
Reclassification to retained earnings (4.8) (1.3)
Revaluation 784.0 109.3
Movement in deferred tax (7.1) (30.1)
Balance at 30 June 3,730.6 2,958.5
(iii) Share-based payments reserve
2016$M
2015$M
Balance at 1 July 0.9 0.9
Long-term incentive plan expense 0.1 –
Balance at 30 June 1.0 0.9
The share-based payments reserve records the value of historical equity-settled share-based payments provided to employees, including key management personnel, as part of their remuneration.
(iv) Cash flow hedge reserve
2016$M
2015$M
Balance at 1 July (25.7) (14.0)
Fair value change in hedging instrument (36.5) (25.5)
Transfer to income statement 6.0 9.2
Movement in deferred tax 8.5 4.6
Balance at 30 June (47.7) (25.7)
The cash flow hedge reserve records the effective portion of the fair value of interest rate swaps that are designated as cash flow hedges. Amounts transferred to the income statement are included in interest expense and other finance costs.
(v) Share of reserves of associates
2016$M
2015$M
Balance at 1 July (0.4) (2.1)
Share of reserves of associates 10.8 1.7
Balance at 30 June 10.4 (0.4)
The share of reserves of associates records the group’s share of movements in the cash flow hedge reserve and the property, plant and equipment revaluation reserve of the associates. The cash flow hedge reserve of the associates records the effective portion of the fair value of interest rate swaps that are designated as cash flow hedges. Amounts transferred to the income statement of the associate are included in the share of profit of an associate.

51
Fina
ncia
l sta
tem
ents
(vi) Foreign currency translation reserve
2016$M
2015$M
Balance at 1 July (6.8) (8.5)
Fair value change in hedging instrument 4.2 (2.4)
Foreign currency translation (6.9) 4.1
Balance at 30 June (9.5) (6.8)
17. Accounts payable and accruals
2016$M
2015$M
Employee entitlements 7.3 6.2
Phantom option plan accrual (refer note 23(c)) 5.3 10.0
GST payable (0.4) 2.5
Property, plant and equipment retentions and payables 24.8 14.9
Investment property retentions and payables 11.4 10.9
Trade payables 3.9 3.3
Interest payables 13.4 13.6
Other payables and accruals 28.6 27.4
Total accounts payable and accruals 94.3 88.8
The above balances are unsecured.
Amount owing to the related parties at 30 June 2016 is $0.3 million (2015: $0.2 million).

Notes and accounting policies CONTINUEDFOR THE YEAR ENDED 30 JUNE 2016
Financials52
Auckland International Airport Limited
18. Financial assets and liabilitiesThe total carrying amounts of the group’s financial assets and liabilities are detailed below.
Notes
2016$M
2015$M
Current financial assets
Loan and receivables
Cash and cash equivalents 13 52.6 38.5
Trade and other receivables 31.9 29.6
Dividends receivable 3.3 2.8
87.8 70.9
Derivative financial instruments
Interest rate swaps – fair value hedges 0.7 –
Total current financial assets 88.5 70.9
Non-current financial assets
Derivative financial instruments
Cross-currency interest rate swaps 134.3 111.8
Interest rate swaps – fair value hedges 1.5 2.6
Interest rate swaps – cash flow hedges – 0.5
135.8 114.9
Derivative financial instruments
Interest basis swaps 3.0 3.4
Total non-current financial assets 138.8 118.3
Total financial assets 227.3 189.2
Current financial liabilities
Financial liabilities at amortised cost
Accounts payable and accruals 94.3 88.8
Short-term borrowings 18.1 396.9 217.6
Provisions 0.9 1.8
492.1 308.2
Derivative financial instruments
Interest rate swaps – cash flow hedges 0.1 1.7
Total current financial liabilities 492.2 309.9
Non-current liabilities
Financial liabilities at amortised cost
Term borrowings 18.1 1,490.0 1,504.9
Other term liabilities 1.3 1.3
1,491.3 1,506.2
Derivative financial instruments
Cross-currency interest rate swaps – cash flow hedges – –
Interest rate swaps – fair value hedges – –
Interest rate swaps – cash flow hedges 56.9 22.2
Total non-current financial liabilities 1,548.2 1,528.4
Total financial liabilities 2,040.4 1,838.3
The cross-currency interest rate swaps consist of a fair value component and a cash flow hedge component.

53
Fina
ncia
l sta
tem
ents
Amounts subject to potential offset
The group’s derivative financial instruments are subject to enforceable master netting arrangements. Each agreement allows the parties to elect net settlement of the relevant financial assets and liabilities in the event of default of the other
party. The group recognises derivative financial instruments in the statement of financial position on a gross basis. However, the potential net amounts if offsets were to occur would be derivative financial assets of $82.5 million and nil derivative financial liabilities (2015: derivative financial assets of $94.4 million and nil derivative financial liabilities).
18 .1 BorrowingsAt the balance date, the following borrowing facilities were in place for the group.
Maturity Coupon2016
$M2015
$M
Current
Commercial paper < 3 months Floating 91.8 117.6
Bonds 9/11/2015 7.25% – 100.0
Bonds 10/08/2016 8.00% 25.1 –
Bonds 15/11/2016 8.00% 130.0 –
Bonds 11/04/2017 Floating 150.0 –
Total short-term borrowings 396.9 217.6
Non-current
Bank facility 29/10/2019 Floating 100.0 100.0
Bank facility 1/12/2017 Floating 83.8 89.6
Bank facility 29/10/2017 Floating 45.0 45.0
Bank facility 6/04/2018 Floating 100.0 –
Bonds 10/08/2016 8.00% – 25.7
Bonds 15/11/2016 8.00% – 130.0
Bonds 11/04/2017 Floating – 150.0
Bonds 17/10/2017 5.47% 101.2 101.2
Bonds 1/10/2018 Floating 75.0 –
Bonds 13/12/2019 4.73% 100.0 100.0
Bonds 28/05/2021 5.52% 150.0 150.0
Bonds 9/11/2022 4.28% 100.0 –
USPP notes 15/02/2021 4.42% 77.0 78.0
USPP notes 12/07/2021 4.67% 78.1 78.8
USPP notes 15/02/2023 4.57% 80.1 79.2
USPP notes 25/11/2026 3.61% 399.8 377.4
Total term borrowings 1,490.0 1,504.9
Total
Commercial paper 91.8 117.6
Bank facilities 328.8 234.6
Bonds 831.3 756.9
USPP notes 635.0 613.4
Total borrowings 1,886.9 1,722.5

Notes and accounting policies CONTINUEDFOR THE YEAR ENDED 30 JUNE 2016
Financials54
Auckland International Airport Limited
Bank facilitiesBorrowings under the drawn bank facilities and standby bank facilities are supported by a negative pledge deed. In November 2015, an undrawn $25.0 million ANZ standby facility expired and was not replaced. In April 2016, the company established a new NZD100.0 million facility with the Commonwealth Bank of Australia.
BondsBorrowings under the bond programme are supported by a master trust deed. They are unsecured and unsubordinated.
In the year ended 30 June 2016, the company undertook the following bond financing:
• The issuance of $75.0 million of three-year floating rate notes in October 2015.
• The repayment of $100 million of 10-year, 7.25% fixed rate bonds maturing in November 2015.
• The issuance of $100 million of 7 year, 4.28% fixed rate bonds in November 2015.
During the current and prior years, there were no defaults or breaches on any of the borrowing facilities.
18.2 Hedging activity and derivativesCash flow hedgesAt 30 June 2016, the group held interest rate swaps where it pays a fixed rate of interest and receives a variable rate on the notional amount (in NZD and AUD). The notional amount of the interest rate swaps in a cash flow hedge at 30 June 2016 is $922.2 million (2015: $834.8 million). These interest rate swaps are designated as cash flow hedges of the future variable interest rate cash flows on bank facilities and commercial paper. The interest payment frequency on these borrowings is quarterly.
During the year, the group assessed the cash flow hedges to be highly effective. No ineffectiveness has been required to be recognised in the income statement except for the ineffective portion of a cash flow hedge prior to redesignation and recognition of counterparty credit risk associated with the derivatives.
Fair value hedgesAt 30 June 2016, the group held interest rate swaps and cross-currency interest rate swaps where it receives a fixed rate of interest and pays a variable rate on the notional amount. The notional amount of the interest rate swaps and cross-currency interest rate swaps at 30 June 2016 is $564.9 million (including $489.9 million of cross-currency interest rate swaps) (2015: $564.9 million, including $489.9 million of cross-currency interest rate swaps). These interest rate swaps and cross-currency interest rate swaps are designated as fair value hedges and transform a series of known fixed debt interest cash flows to future variable debt interest cash flows to mitigate exposure to fair value changes in fixed interest bonds and the USPP notes.
Gains or losses on the derivatives and fixed interest bonds and USPP notes for fair value hedges recognised in the income statement in interest expense during the period were:
2016$M
2015$M
Gains/(losses) on the fixed interest bonds 0.5 (1.0)
Gains/(losses) on the USPP notes (44.0) (16.2)
Gains/(losses) on the derivatives 41.6 16.7
As part of the issuance of the USPP notes and cross-currency interest rate swaps, additional interest rate basis swaps were taken out by the group to hedge the basis risk on the cross-currency interest rate swaps. The basis swaps are not hedge accounted.
Gains or losses on the basis swaps recognised in the income statement and the ineffective hedging component of the swaps recognised in the income statement relating to counterparty risk during the period were:
2016$M
2015$M
Interest basis swaps transacted as hedges but not qualifying for hedge accounting (0.4) (0.2)
Credit valuation adjustments on hedges qualifying for hedge accounting (1.8) (0.5)
Ineffective portion of cash flow hedge prior to redesignation (0.4) –
Derivative fair value (decrease)/increase (2.6) (0.7)
18.1 Borrowings CONTINUED

55
Fina
ncia
l sta
tem
ents
The following table demonstrates the sensitivity to a change in NZD/USD basis spread. The interest rate basis swaps taken out by the group to hedge the basis risk on the cross-currency interest rate swaps are not hedge accounted, therefore all fair
value movements are recognised in the income statement. The sensitivity on this basis spread was calculated by taking the spot 10-year basis spread and moving this spot rate by the reasonably possible movement of plus and minus 10 points.
2016$M
2015$M
Increase of NZD/USD basis spread of 10 points
Impact on profit before taxation (0.9) (1.0)
Decrease of NZD/USD basis spread of 10 points
Impact on profit before taxation 0.9 1.0
18.3 Fair valueThe group selects valuation techniques that aim to maximise the use of relevant observable inputs and minimise the use of unobservable inputs, provided that sufficient data is available. All assets and liabilities for which fair value is measured are assigned to levels within the fair value hierarchy. The different levels comprise:
• Level 1 – the fair value is calculated using quoted prices in active markets.
• Level 2 – the fair value is estimated using inputs other than quoted prices included in level 1 that are observable for the asset or liability, either directly (as prices) or indirectly (derived from prices).
• Level 3 – the fair value is estimated using inputs for the asset or liability that are not based on observable market data.
To determine the level used to estimate fair value, the group assesses the lowest level input that is significant to that fair value.
In the year ended 30 June 2016, there were no significant changes in the business or economic circumstances that affect the fair value of the group’s financial assets and financial liabilities. There have been no transfers between levels of the fair value hierarchy in the year ended 30 June 2016.
The carrying value approximates the fair value of cash, accounts receivable, dividend receivable, other non-current assets, derivative financial instruments, accounts payable and accruals, provisions and other term liabilities. The carrying amount of the group’s current and non-current borrowings issued at floating rates approximates their fair value.
The group’s bonds are classified as level 1. The fair value of the bonds is based on the quoted market prices for these instruments at balance date. The group’s USPP notes are classified as level 2. The fair value of the USPP notes has been determined at balance date on a discounted cash flow basis using the USD Bloomberg curve and applying discount factors to the future USD interest payment and principal payment cash flows.
2016 2015
Carryingamount
$M
Fairvalue
$M
Carryingamount
$M
Fairvalue
$M
Bonds 831.3 869.3 756.9 788.4
USPP Notes 635.0 627.6 613.4 610.1
The group’s derivative financial instruments are interest rate swaps, cross-currency interest rate swaps and interest basis swaps. They arise directly from the group’s operations as part of raising finance for the group’s operations or providing a net investment hedge for the group. All the derivative financial instruments with the exception of the interest basis swaps are hedging instruments for financial reporting purposes. The interest basis swaps are transacted as hedges but do not qualify for hedge accounting.
The group’s derivative financial instruments are classified as level 2. The future cash flows are estimated using the key inputs presented in the table alongside. The cash flows are discounted at a rate that reflects the credit risk of various counterparties.
Instrument Valuation key inputs
Interest rate swaps Forward interest rates (from observable yield curves) and contract interest rates
Interest basis swaps Observable forward basis swap pricing and contract basis rates
Cross-currency interest rate swaps
Forward interest and foreign exchange rates (from observable yield curves and forward exchange rates) and contract rates

Notes and accounting policies CONTINUEDFOR THE YEAR ENDED 30 JUNE 2016
Financials56
Auckland International Airport Limited
18.4 Financial risk management objectives and policies
(a) Credit risk
The group’s maximum exposure to credit risk at 30 June 2016 is equal to the carrying value for cash, accounts receivable, dividends receivable, other non-current assets and derivative financial instruments. Credit risk is managed by restricting the amount of cash and marketable securities that can be placed with any one institution, which will be either the New Zealand Government or a New Zealand registered bank with an appropriate international credit rating. The group minimises its credit risk by spreading such exposures across a range of institutions.
The group’s credit risk is also attributable to accounts receivable, which principally comprise amounts due from airlines, tenants and licensees.
The group has a policy that manages exposure to credit risk by way of requiring a performance bond for some customers whose credit rating or history indicates that this would be prudent. The value of performance bonds for the group is $1.3 million (2015: $1.3 million). There are no significant concentrations of credit risk.
(b) Liquidity risk
The group’s objective is to maintain a balance between continuity of funding and flexibility through the use of borrowings on the money market, bank loans, commercial paper, USPP and bonds.
To manage the liquidity risk, the group’s policy is to maintain sufficient available funding by way of committed, but undrawn, debt facilities. As at 30 June 2016, this facility headroom was $280.0 million (2015: $220.0 million). The group’s policy also requires the spreading of debt maturities.
Bank facilities
2016 2015
Type Bank MaturityFacility
currencyAvailable
NZ $MDrawnNZ $M
UndrawnNZ $M
AvailableNZ $M
DrawnNZ $M
UndrawnNZ $M
Standby facilityANZ Bank New Zealand 30/11/2015 NZD – – – 25.0 – 25.0
Standby facilityANZ Bank New Zealand 30/11/2017 NZD 80.0 – 80.0 80.0 – 80.0
Standby facility Bank of New Zealand 30/4/2016 NZD – – – 35.0 – 35.0
Standby facility Bank of New Zealand 7/4/2019 NZD 125.0 – 125.0 – – –
Standby facility Westpac 30/4/2016 NZD – – – 80.0 – 80.0
Standby facility Westpac 7/4/2019 NZD 75.0 – 75.0 – – –
Multi-currency facilityBank of Tokyo Mitsubishi UFJ 29/10/2017 NZD & AUD 45.0 45.0 – 45.0 45.0 –
Multi-currency facilityBank of Tokyo Mitsubishi UFJ 29/10/2019 NZD & AUD 100.0 100.0 – 100.0 100.0 –
Multi-currency facilityCommonwealth Bank of Australia 1/12/2017 AUD 83.8 83.8 – 89.6 89.6 –
Multi-currency facilityCommonwealth Bank of Australia 7/4/2018 NZD 100.0 100.0 – – – –
Total NZD equivalent 608.8 328.8 280.0 454.6 234.6 220.0

57
Fina
ncia
l sta
tem
ents
The following liquidity risk disclosures reflect all undiscounted repayments and interest resulting from recognised financial liabilities and financial assets as at June 2016. The timing of cash flows for liabilities is based on the contractual terms of the underlying contract. Liquid non-derivative assets comprising
cash and receivables are considered in the group’s overall liquidity risk. The group ensures that sufficient liquid assets or committed funding facilities are available to meet all the required short-term cash payments and expects borrowings to roll over.
Undiscounted cash flows on financial assets and liabilities
< 1 year$M
1 to 3 years$M
3 to 5 years$M
> 5 years$M
Total$M
Year ended 30 June 2016
Financial assets
Cash and cash equivalents 52.6 – – – 52.6
Accounts receivable 31.9 – – – 31.9
Dividend receivable 3.3 – – – 3.3
Derivative financial assets 5.6 10.0 20.4 158.9 194.9
Total financial assets 93.4 10.0 20.4 158.9 282.70
Financial liabilities
Accounts payable, accruals, provisions and other term liabilities (96.5) – – – (96.5)
Commercial paper (92.0) – – – (92.0)
Bank facilities – (228.8) (100.0) – (328.8)
Bonds (305.0) (175.0) (250.0) (100.0) (830.0)
USPP notes – – (76.6) (566.1) (642.7)
Derivative financial liabilities (9.8) (18.9) (14.9) (19.9) (63.5)
Interest payable (64.3) (92.8) (71.0) (79.8) (307.9)
Total financial liabilities (567.6) (515.5) (512.5) (765.8) (2,361.4)
Year ended 30 June 2015
Financial assets
Cash and cash equivalents 38.5 – – – 38.5
Accounts receivable 29.6 – – – 29.6
Dividend receivable 2.8 – – – 2.8
Derivative financial assets (1.8) 6.4 (2.1) 199.5 202.0
Total financial assets 69.1 6.4 (2.1) 199.5 272.9
Financial liabilities
Accounts payable, accruals, provisions and other term liabilities (91.9) – – – (91.9)
Commercial paper (118.0) – – – (118.0)
Bank facilities – (134.6) (100.0) – (234.6)
Bonds (100.0) (405.0) (100.0) (150.0) (755.0)
USPP notes – – – (710.8) (710.8)
Derivative financial liabilities (6.8) (11.9) (4.9) (2.5) (26.1)
Interest payable (65.2) (111.6) (79.0) (131.1) (386.9)
Total financial liabilities (381.9) (663.1) (283.9) (994.4) (2,323.3)
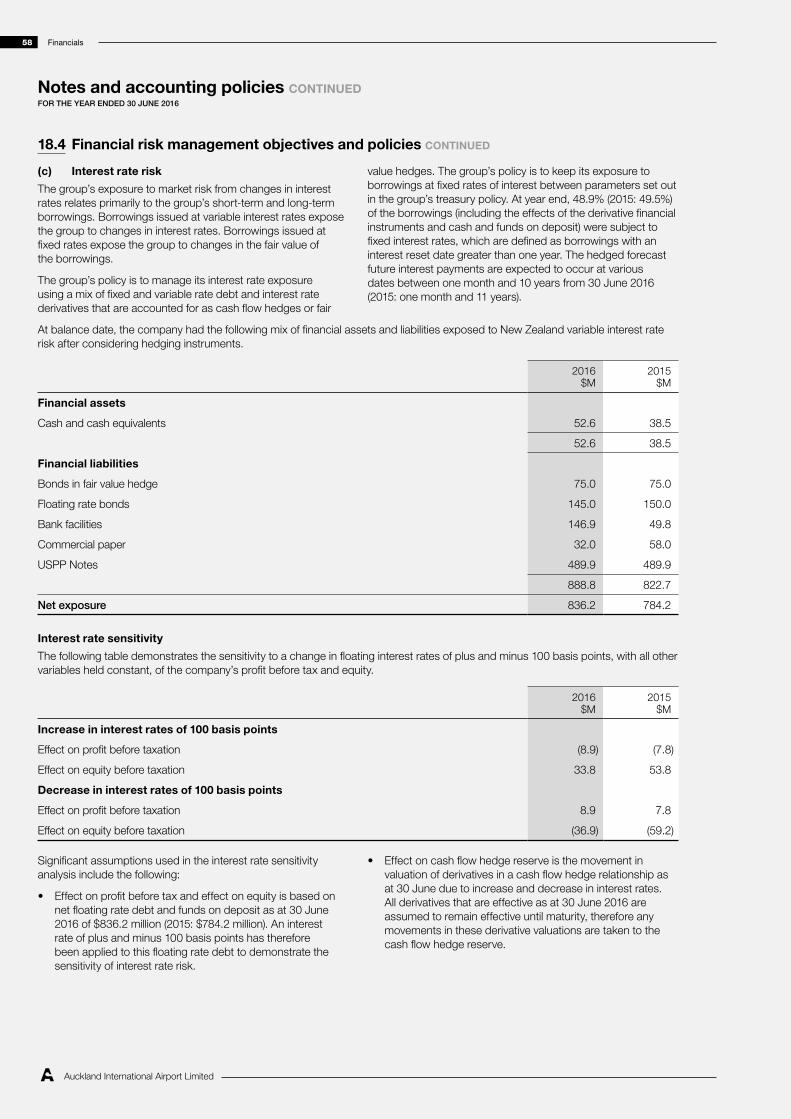
Notes and accounting policies CONTINUEDFOR THE YEAR ENDED 30 JUNE 2016
Financials58
Auckland International Airport Limited
(c) Interest rate risk
The group’s exposure to market risk from changes in interest rates relates primarily to the group’s short-term and long-term borrowings. Borrowings issued at variable interest rates expose the group to changes in interest rates. Borrowings issued at fixed rates expose the group to changes in the fair value of the borrowings.
The group’s policy is to manage its interest rate exposure using a mix of fixed and variable rate debt and interest rate derivatives that are accounted for as cash flow hedges or fair
value hedges. The group’s policy is to keep its exposure to borrowings at fixed rates of interest between parameters set out in the group’s treasury policy. At year end, 48.9% (2015: 49.5%) of the borrowings (including the effects of the derivative financial instruments and cash and funds on deposit) were subject to fixed interest rates, which are defined as borrowings with an interest reset date greater than one year. The hedged forecast future interest payments are expected to occur at various dates between one month and 10 years from 30 June 2016 (2015: one month and 11 years).
At balance date, the company had the following mix of financial assets and liabilities exposed to New Zealand variable interest rate risk after considering hedging instruments.
2016$M
2015$M
Financial assets
Cash and cash equivalents 52.6 38.5
52.6 38.5
Financial liabilities
Bonds in fair value hedge 75.0 75.0
Floating rate bonds 145.0 150.0
Bank facilities 146.9 49.8
Commercial paper 32.0 58.0
USPP Notes 489.9 489.9
888.8 822.7
Net exposure 836.2 784.2
Interest rate sensitivity
The following table demonstrates the sensitivity to a change in floating interest rates of plus and minus 100 basis points, with all other variables held constant, of the company’s profit before tax and equity.
2016$M
2015$M
Increase in interest rates of 100 basis points
Effect on profit before taxation (8.9) (7.8)
Effect on equity before taxation 33.8 53.8
Decrease in interest rates of 100 basis points
Effect on profit before taxation 8.9 7.8
Effect on equity before taxation (36.9) (59.2)
Significant assumptions used in the interest rate sensitivity analysis include the following:
• Effect on profit before tax and effect on equity is based on net floating rate debt and funds on deposit as at 30 June 2016 of $836.2 million (2015: $784.2 million). An interest rate of plus and minus 100 basis points has therefore been applied to this floating rate debt to demonstrate the sensitivity of interest rate risk.
• Effect on cash flow hedge reserve is the movement in valuation of derivatives in a cash flow hedge relationship as at 30 June due to increase and decrease in interest rates. All derivatives that are effective as at 30 June 2016 are assumed to remain effective until maturity, therefore any movements in these derivative valuations are taken to the cash flow hedge reserve.
18.4 Financial risk management objectives and policies CONTINUED

59
Fina
ncia
l sta
tem
ents
(d) Foreign currency risk
The group is exposed to foreign currency risk with respect to Australian and US dollars.
Exposure to the Australian dollar arises from the translation risk related to the investment in North Queensland Airports.
The group has one bank facility that is drawn down in Australian dollars to a total of AUD80.0 million as a partial hedge of the net investment in North Queensland Airports’ operation (2015: AUD80.0 million).
Exposure to the US dollar arises from USPP borrowings denominated in that currency.
This exposure has been fully hedged by way of cross-currency interest rate swaps combined with the basis swaps, hedging
US dollar exposure on both principal and interest. The cross-currency interest rate swaps correspond in amount and maturity to the US dollar borrowings with no residual US dollar foreign currency risk exposure.
The cross-currency interest rate swaps consist of a fair value hedge component and a cash flow hedge component. The effective movements on the fair value hedge component are taken to the income statement along with all movements of the hedged risk on the USPP notes. The effective movements of the cash flow hedge components are all taken to the cash flow hedge reserve.
The net exposure at balance date is representative of what the group was and is expecting to be exposed to in the next 12 months from balance date.
The following sensitivity analysis is based on the foreign currency risk exposures in existence at the reporting date. At 30 June 2016, had the New Zealand dollar moved, as illustrated in the table below, with all other variables held constant, post-tax profit and other comprehensive income would have been affected as follows.
2016$M
2015$M
Increase in value of NZ dollar of 10%
Impact on profit before taxation – (0.2)
Impact on equity before taxation (55.1) (59.3)
Decrease in value of NZ dollar of 10%
Impact on profit before taxation 0.1 0.2
Impact on equity before taxation 67.4 72.4
Significant assumptions used in the foreign currency exposure sensitivity analysis include the following:
• Reasonably possible movements in foreign exchange rates were determined based on a review of the last two years’ historical movements. A movement of plus or minus 10% has therefore been applied to the exchange rates to demonstrate the sensitivity to foreign currency risk of the company’s investment in foreign operations, debt and associated derivative financial instruments.
• The sensitivity was calculated by taking the spot rate as at balance date of 0.9552 (2015: 0.8930) for AUD and 0.7109 (2015: 0.6837) for USD and moving this spot rate by the reasonably possible movements of plus or minus 10% and then reconverting the foreign currency into NZD with the new spot rate. This methodology reflects the translation methodology undertaken by the group.
(e) Capital risk management
The group’s objective is to maintain a capital structure mix of shareholders’ equity and debt that achieves a balance between ensuring the group can continue as a going concern and providing a capital structure that maximises returns for shareholders and reduces the cost of capital to the group. The appropriate capital structure of the group is determined from consideration of appropriate credit rating, comparison to peers, sources of finance, borrowing costs, general shareholder expectations, the ability to distribute surplus funds efficiently, future business strategies and the ability to withstand business shocks.
The group can maintain or adjust the capital structure by adjusting the level of dividends, changing the level of capital expenditure investment, issuing new shares, returning capital to shareholders or selling assets to reduce debt. The group monitors the capital structure on the basis of the gearing ratio and by considering the credit rating of the company.
The gearing ratio is calculated as borrowings divided by borrowings plus the market value of shareholders’ equity. The gearing ratio as at 30 June 2016 is 19.7% (2015: 22.5%). The current long-term credit rating of Auckland Airport by Standard & Poor’s at 30 June 2016 is A- Stable Outlook (2015: A- Stable Outlook).

Notes and accounting policies CONTINUEDFOR THE YEAR ENDED 30 JUNE 2016
Financials60
Auckland International Airport Limited
19. Commitments
(a) Property, plant and equipment
The group had contractual obligations to suppliers to purchase or develop property, plant and equipment for $157.0 million at balance date (2015: $4.6 million).
(b) Investment property
The group had contractual obligations to suppliers to purchase or develop investment property for $83.8 million at balance date (2015: $65.6 million). The group has further contractual obligations to tenants to purchase or develop investment property for $3.0 million at balance date (2015: $17.5 million).
The group has contractual commitments for repairs, maintenance and enhancements on investment property for $1.6 million at balance date (2015: $1.4 million).
(c) Operating lease receivable – group as lessor
The group has commercial properties owned by the company that produce rental income and retail concession agreements that produce retail income.
These non-cancellable leases have remaining terms of between one month and 35 years. All leases include a clause to enable upward revision of the rental charge on contractual rent review dates according to prevailing market conditions.
Future minimum rental and retail income receivable under non-cancellable operating leases as at 30 June are as follows.
2016$M
2015$M
Within one year 196.6 178.2
After one year but no more than five years 576.7 545.0
After more than five years 260.3 278.1
Total minimum lease payments receivable 1,033.6 1,001.3
20. Contingent liabilities
Noise insulation
In December 2001, the Environment Court ratified an agreement that had been reached between Manukau City Council, the company and other interested parties on the location and future operation of a second runway to the north and parallel to the existing runway.
The Environment Court determination includes a number of conditions that apply to the operation of the airport. These conditions include obligations on the company to mitigate the impacts of aircraft noise on the local community. The obligations include the company offering acoustic treatment packages to schools and existing homes within defined areas. Noise levels are monitored continually, and as the noise impact area increases, offers will need to be made. The obligation does not extend to new houses. Overall, it is estimated that approximately 4,000 homes will eventually be offered assistance.
As it is not possible to accurately predict the rate of change in aircraft noise levels over time nor the rate of acceptance of offers of treatment to homeowners, the company cannot accurately predict the overall cost or timing of acoustic treatment. It is estimated that, overall, further costs would not exceed $9.0 million (refer to note 21).

61
Fina
ncia
l sta
tem
ents
21. Provisions for noise mitigationThe group has an obligation to fund the acoustic treatment of homes and schools within defined areas when noise exceeds certain thresholds and when the offer of acoustic treatment is accepted. On acceptance of offers, the group records a provision for the estimated cost of fulfilling the obligation. The amount of the provision will change depending on the number of offers accepted, a revision in the estimate of the cost of offers and when the obligation is funded. As directly
attributable costs of a future second runway, the costs are capitalised to the extent they are not recoverable from other parties.
Since 2005, the company has made acoustic treatment offers to a total of 3,784 houses and six schools. Homeowners of 390 homes and six schools have accepted these offers. The last offers were made in June 2016.
2016$M
2015$M
Opening balance 1.8 1.9
Expenditure in the period (0.9) (0.1)
Total provision for noise mitigation 0.9 1.8
22. Related party disclosures
(a) Transactions with related parties
All trading with related parties, including and not limited to rentals and other sundry charges, has been made on an arm’s length commercial basis, without special privileges, except for the provision of accounting and advisory services to Auckland International Airport Marae Limited at no charge.
No guarantees have been given or received.
Auckland CouncilAuckland Council is a significant shareholder of the company with a shareholding in excess of 20%.
On 28 October 2010, Auckland Airport and Manukau City Council came to an agreement where Auckland Airport agreed to vest approximately 24 hectares of land in the north of the airport to the Council as public open space for the consideration of $4.1 million. The vesting of the land will be triggered when building development in that precinct achieves certain levels. The same agreement also rationalised the road network within the airport with some roads to be transferred between the parties and some roads to be acquired by Auckland Airport for $3.1 million. These transactions are not complete as at 30 June 2016, and the obligations and benefits of the agreement relating to Manukau City Council now rest with Auckland Council.
Costs incurred for goods and services received from Auckland Council and its subsidiaries are as follows.
2016$M
2015$M
Rates 9.4 8.7
Building consent costs and other local government regulatory obligations 1.7 0.7
Water, wastewater and compliance services 2.2 1.8
Grounds maintenance 1.8 1.8
AssociatesRefer to note 8 for details of transactions with associate entities.

Notes and accounting policies CONTINUEDFOR THE YEAR ENDED 30 JUNE 2016
Financials62
Auckland International Airport Limited
(b) Key management personnel compensation
The table below includes the remuneration of directors and the senior management team.
Notes
2016$M
2015$M
Directors’ fees 1.3 1.2
Senior management’s salary and other short-term benefits 5.5 5.0
Senior management’s share-based payments 23(b), 23(c) 6.1 3.3
12.9 9.5
23. Share-based payment plans
(a) Employee share purchase plan
The purchase plan is open to all full-time and part-time employees (not directors) at an offer date. The company advances to the purchase plan all the monies necessary to purchase the shares under the purchase plan. The advances are repayable by way of deduction from the employee’s regular remuneration. These advances are interest free.
The shares allocated under the purchase plan are held in trust for the employees by the trustees of the purchase plan during the restrictive period, which is the longer of three years or the period of repayment by the employee of the loan made by the trust to the employee in relation to the acquisition of shares.
Movement in ordinary shares allocated to employees under the purchase plan is as follows.
2016Shares
2015Shares
Shares held on behalf of employees
Opening balance 171,630 166,770
Shares issued during the year 94,100 14,400
Shares fully paid and allocated during the year (139,441) (1,620)
Shares forfeited during the year (6,360) (7,920)
Total shares held on behalf of employees 119,929 171,630
Unallocated shares held by the purchase plan 206,469 198,760
Total shares held by the purchase plan 326,398 370,390
On 21 November 2015, shares were issued at a price of $4.20, being a 15% discount on the average market selling price over the 10 trading days ending on 8 October 2015. On 21 November 2014, shares were issued at a price of $3.45, being a 10% discount on the average market selling price over the 10 trading days ending on 8 October 2014.
22. Related party disclosures CONTINUED

63
Fina
ncia
l sta
tem
ents
(b) Long-term incentive plan – equity settled
In October 2015, the directors introduced a new equity-settled long term incentive plan (LTI plan) that will vest from calendar year 2018 onwards. This plan replaces the previous phantom option plan. Under the new LTI plan, shares are issued and then held in trust for participating executives for a three-year vesting period. The executives are entitled to the dividends on the shares during the vesting period at the same rate as paid to all ordinary shareholders. The receipt of the shares, or vesting, is at nil cost to executives and subject to remaining employed
by Auckland Airport during the vesting period and achievement of total shareholder return (TSR) performance hurdles. For 50% of the shares granted under the plan, all shares will vest if TSR equals or exceeds the company’s cost of equity plus 1%. For the other 50% of shares granted, the proportion of shares that vest depends on Auckland Airport’s TSR relative to a peer group. The peer group comprises the members of the Dow Jones Brookfield Airports Infrastructure Index (excluding Auckland Airport) at each grant date. To the extent that performance hurdles are not met or executives leave Auckland Airport prior to vesting, the shares are forfeited.
Number of shares held on behalf of executives
Grant date Vesting date
Balanceat the
beginningof the year
Granted during the
year
Vested during the
year
Forfeitedduring the
year
Balance atthe end of
the year
23 October 2015 23 October 2018 – 166,002 – – 166,002
Total LTI plan – 166,002 – – 166,002
Fair value of share rights granted
The LTI plan is valued as nil-price in-substance options at the date at which they are granted using a probability weighted payoff valuation model by First NZ Capital. The following table
lists the key inputs to the valuation. Volatility estimates were derived using historical data over the past two years. The cost is recognised in the income statement over the vesting period, together with a corresponding increase in the share-based payment reserve in equity.
Grant date Vesting date Grant price
Risk-freeinterest rate
range
Expectedvolatility of
share price
Estimatedfair value per
share right
23 October 2015 23 October 2018 $5.02 2.56–3.00% 18.1% $1.58
It has been assumed that participants will remain employed with the company until the vesting date.
The share-based payment expense relating to the LTI plan for the year ended 30 June 2016 is $0.1 million with a corresponding increase in the share-based payments reserve (refer note 16 (iii)).
(c) Long-term incentive plan – phantom options
The previous approach to leadership remuneration adopted by the directors was a cash-settled phantom option plan (phantom plan) for each calendar year from 2011 to 2014. In October 2015, the directors introduced the new executive share plan effective from calendar year 2015, which replaces the phantom plans.
The old phantom plan involved the notional allocation of options at prevailing market rates to participating executives. The vesting period for these phantom options was three years from the date of issue. Once the phantom options become exercisable, they remain exercisable for the next two years, subject to a total shareholder return hurdle being met. The gross amount payable is the volume-weighted average price of the shares over the previous 20 trading days less the initial share price for those phantom options on the day the phantom options were issued. The amount payable is now subject to a cap, based on a multiple of an executive’s fixed annual remuneration in the year the options are issued (three years prior to vesting).
The chief executive, Mr Adrian Littlewood, participated in each of the phantom option plans from 2011 to 2014 relating to his former role as general manager – retail and commercial and his current role as chief executive. Mr Littlewood has not participated in any other phantom option plans.
Mr Littlewood’s participation in the phantom plans as chief executive resulted in the phantom option allocation of 1,577,311, 1,578,125 and 1,486,929 phantom options for calendar 2012, 2013 and 2014 respectively.
In the year ended 30 June 2015, following a review of executive remuneration, the Board introduced a cap to the financial rewards payable upon the exercise of phantom options. Mr Littlewood’s potential financial rewards upon exercise of phantom options is capped at two and a half times his fixed annual remuneration for 2012 and two times his fixed annual remuneration for 2013 and 2014.
As at 30 June 2016, the estimate of the fair value of the cash-settled phantom plans for all the participating executives is $5.3 million (2015: $10.0 million).
An expense of $1.4 million (2015: $6.5 million) relating to the change in fair value or cash payments has been included in staff expenses in the income statement. Cash payments under the phantom plan were $6.1 million during the year ended 30 June 2016 (2015: $3.3 million).

Notes and accounting policies CONTINUEDFOR THE YEAR ENDED 30 JUNE 2016
Financials64
Auckland International Airport Limited
To assist the estimate of the fair value of the liability of the phantom option plans, the company undertakes a valuation of the phantom options, as measured at the reporting date, using the Black-Scholes methodology taking into account the terms
and conditions for the instruments including the caps that were introduced in 2015. The expected life of each phantom option assumes that participants exercise the phantom option at the optimal time to maximise expected value.
The following table lists the key inputs to the Black-Scholes methodology used for the years ended 30 June 2016 and 30 June 2015.
Assumptions2016
Assumptions2015
Expected volatility 20.00% 17.10%
Risk-free interest rate range (2.02–2.35%) (2.84–3.28%)
Share price at 30 June $6.500 $4.935
Phantom options
As at 30 June 2016
Issue dateDateexercisable Expiry date
Numbergranted
Numberlapsed
Numberexercised
Number at30 June 2016
Numberexercisable at30 June 2016
Share priceto meet
hurdle rate at30 June 2016
31/08/12 31/08/15 31/08/17 4,694,576 1,391,516 3,303,060* – – N/A
22/08/13 22/08/16 22/08/18 3,700,804 1,132,354 – 2,568,450 – $3.83
27/08/14 27/08/17 27/08/19 3,875,494 745,753 – 3,129,741 – $4.14
12,270,874 3,269,623 3,303,060 5,698,191 –
As at 30 June 2015
Issue dateDateexercisable Expiry date
Numbergranted
Numberlapsed
Numberexercised
Number at30 June 2015
Numberexercisable at30 June 2015
Share priceto meet
hurdle rate at30 June 2015
24/08/11 24/08/14 24/08/16 3,031,956 1,076,924 1,955,032 – – N/A
31/08/12 31/08/15 31/08/17 4,694,576 1,391,516 – 3,303,060 – $3.03
22/08/13 22/08/16 22/08/18 3,700,804 319,118 – 3,381,686 – $3.62
27/08/14 27/08/17 27/08/19 3,875,494 – – 3,875,494 – $3.89
15,302,830 2,787,558 1,955,032 10,560,240 –
* Payouts under the above phantom option scheme may or may not be subject to caps each year depending on share price.
24. Events subsequent to balance dateOn 29 August 2016, the directors approved the payment of a fully imputed final dividend of 9.0 cents per share amounting to $107.2 million to be paid on 13 October 2016.
On 19 August 2016, the directors of Queenstown Airport declared a dividend of $5.2 million. The group’s share of the dividend is $1.3 million.
23. Share-based payment plans CONTINUED

65
Fina
ncia
l sta
tem
ents
Audit Report
This audit report relates to the consolidated financial statements of Auckland International Airport Limited (the ‘Company’) for the year ended 30 June 2016 included on the Company’s website. The Company’s Board of Directors is responsible for the maintenance and integrity of the Company’s website. We have not been engaged to report on the integrity of the Company’s website. We accept no responsibility for any changes that may have occurred to the consolidated financial statements since they were initially presented on the website. The audit report refers only to the consolidated financial statements named above. It does not provide an opinion on any other information which may have been hyperlinked to/from these consolidated financial statements. If readers of this report are concerned with the inherent risks arising from electronic data communication they should refer to the published hard copy of the audited consolidated financial statements and related audit report dated 29 August 2016 to confirm the information included in the audited consolidated financial statements presented on this website. Legislation in New Zealand governing the preparation and dissemination of financial statements may differ from legislation in other jurisdictions.
INDEPENDENT AUDITOR’S REPORT TO THE SHAREHOLDERS OF AUCKLAND INTERNATIONAL AIRPORT LIMITED
Report on the Consolidated Financial Statements
We have audited the accompanying consolidated financial statements of Auckland International Airport Limited and its subsidiaries (‘the Group’) on pages 19 to 64, which comprise the consolidated statement of financial position as at 30 June 2016, and the consolidated income statement, statement of comprehensive income, statement of changes in equity and cash flow statement for the year then ended, and a summary of significant accounting policies and other explanatory information.
Board of Directors’ Responsibility for the Consolidated Financial Statements
The Board of Directors are responsible on behalf of the company for the preparation and fair presentation of these consolidated financial statements, in accordance with New Zealand Equivalents to International Financial Reporting Standards and International Financial Reporting Standards, and for such internal control as the Board of Directors determine is necessary to enable the preparation of consolidated financial statements that are free from material misstatement, whether due to fraud or error.
Auditor’s Responsibilities
Our responsibility is to express an opinion on these consolidated financial statements based on our audit. We conducted our audit in accordance with International Standards on Auditing and International Standards on Auditing (New Zealand). Those standards require that we comply with ethical requirements and plan and perform the audit to obtain reasonable assurance about whether the consolidated financial statements are free from material misstatement.
An audit involves performing procedures to obtain audit evidence about the amounts and disclosures in the consolidated financial statements. The procedures selected depend on the auditor’s judgement, including the assessment of the risks of material misstatement of the consolidated financial statements, whether due to fraud or error. In making those risk assessments, the auditor considers internal control relevant to the entity’s preparation and fair presentation of the consolidated financial statements in order to design audit procedures that are appropriate in the circumstances, but not for the purpose of expressing an opinion on the effectiveness of the entity’s internal control. An audit also includes evaluating the appropriateness of the accounting policies used and the reasonableness of accounting estimates, as well as the overall presentation of the consolidated financial statements.
We believe that the audit evidence we have obtained is sufficient and appropriate to provide a basis for our audit opinion.
Our firm carries out other assignments for Auckland International Airport Limited in the areas of AGM vote scrutineer assistance and assurance reporting for regulatory purposes. These services have not impaired our independence as auditor of the Group. In addition to this, partners and employees of our firm deal with the Group on normal terms within the ordinary course of trading activities of the business of the Group. The firm has no other relationship with, or interest in the Group.
Opinion
In our opinion, the consolidated financial statements on pages 19 to 64 present fairly, in all material respects, the financial position of Auckland International Airport Limited and its subsidiaries as at 30 June 2016, and their financial performance and cash flows for the year then ended in accordance with New Zealand Equivalents to International Financial Reporting Standards and International Financial Reporting Standards.
Chartered Accountants29 August 2016Auckland, New Zealand
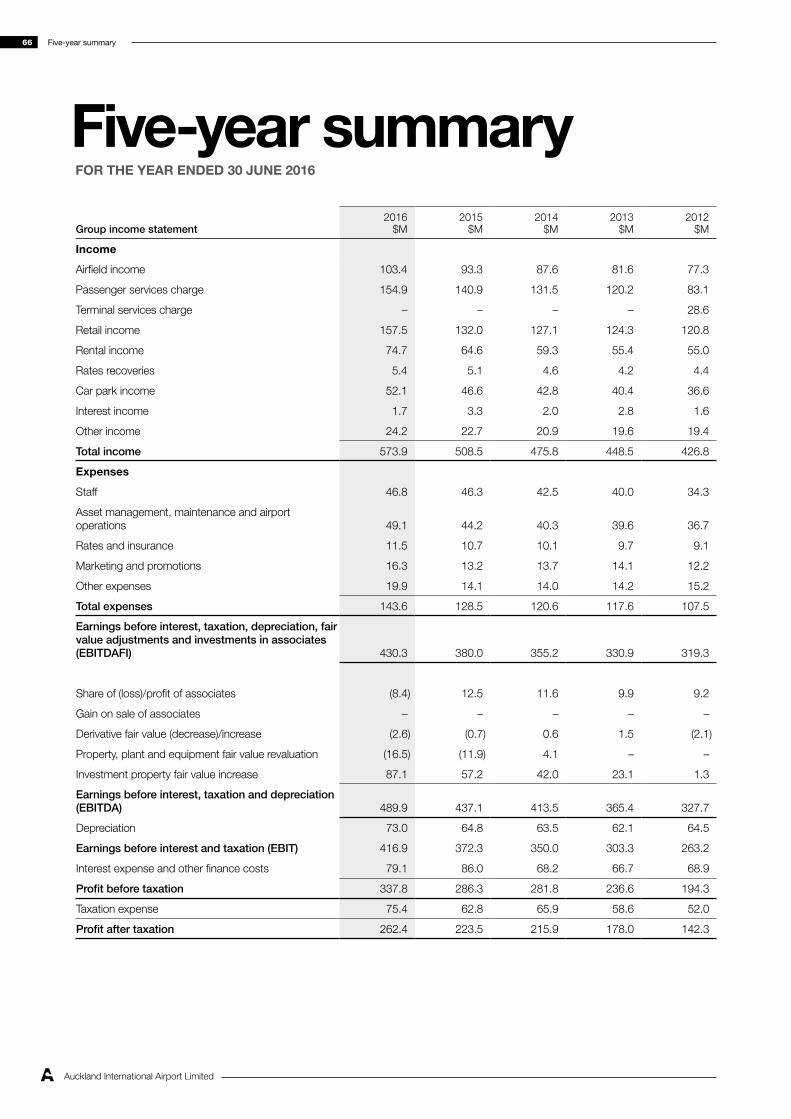
Five-year summary66
Auckland International Airport Limited
Five-year summaryFOR THE YEAR ENDED 30 JUNE 2016
Group income statement2016
$M 2015
$M 2014
$M 2013
$M 2012
$M
Income
Airfield income 103.4 93.3 87.6 81.6 77.3
Passenger services charge 154.9 140.9 131.5 120.2 83.1
Terminal services charge – – – – 28.6
Retail income 157.5 132.0 127.1 124.3 120.8
Rental income 74.7 64.6 59.3 55.4 55.0
Rates recoveries 5.4 5.1 4.6 4.2 4.4
Car park income 52.1 46.6 42.8 40.4 36.6
Interest income 1.7 3.3 2.0 2.8 1.6
Other income 24.2 22.7 20.9 19.6 19.4
Total income 573.9 508.5 475.8 448.5 426.8
Expenses
Staff 46.8 46.3 42.5 40.0 34.3
Asset management, maintenance and airport operations 49.1 44.2 40.3 39.6 36.7
Rates and insurance 11.5 10.7 10.1 9.7 9.1
Marketing and promotions 16.3 13.2 13.7 14.1 12.2
Other expenses 19.9 14.1 14.0 14.2 15.2
Total expenses 143.6 128.5 120.6 117.6 107.5
Earnings before interest, taxation, depreciation, fair value adjustments and investments in associates (EBITDAFI) 430.3 380.0 355.2 330.9 319.3
Share of (loss)/profit of associates (8.4) 12.5 11.6 9.9 9.2
Gain on sale of associates – – – – –
Derivative fair value (decrease)/increase (2.6) (0.7) 0.6 1.5 (2.1)
Property, plant and equipment fair value revaluation (16.5) (11.9) 4.1 – –
Investment property fair value increase 87.1 57.2 42.0 23.1 1.3
Earnings before interest, taxation and depreciation (EBITDA) 489.9 437.1 413.5 365.4 327.7
Depreciation 73.0 64.8 63.5 62.1 64.5
Earnings before interest and taxation (EBIT) 416.9 372.3 350.0 303.3 263.2
Interest expense and other finance costs 79.1 86.0 68.2 66.7 68.9
Profit before taxation 337.8 286.3 281.8 236.6 194.3
Taxation expense 75.4 62.8 65.9 58.6 52.0
Profit after taxation 262.4 223.5 215.9 178.0 142.3

Five
-yea
r su
mm
ary
67
Group statement of comprehensive Income2016
$M 2015
$M 2014
$M 2013
$M 2012
$M
Profit for the period 262.4 223.5 215.9 178.0 142.3
Other comprehensive income
Items that will not be reclassified to income statement
Property, plant and equipment net revaluation movements 784.0 109.3 734.8 – –
Tax on the property, plant and equipment revaluation reserve (7.1) (30.1) – (0.5) 0.5
Items that will not be reclassified to income statement 776.9 79.2 734.8 (0.5) 0.5
Items that may be reclassified subsequently to income statement
Cash flow hedges
Fair value gains/(losses) recognised in the cash flow hedge reserve (36.5) (25.5) (3.1) 3.2 (19.7)
Realised (gains)/losses transferred to the income statement 6.0 9.2 8.7 8.8 11.5
Tax effect of movements in the cash flow hedge reserve 8.5 4.6 (1.6) (3.3) 2.3
Total cash flow hedge movement (22.0) (11.7) 4.0 8.7 (5.9)
Movement in share of reserves of associate 10.8 1.7 8.4 0.8 (9.7)
Movement in foreign currency translation reserve (2.7) 1.7 (7.0) (3.5) (1.7)
Items that may be reclassified subsequently to income statement (13.9) (8.3) 5.4 6.0 (17.3)
Total other comprehensive income/(loss) 763.0 70.9 740.2 5.5 (16.8)
Total comprehensive income for the period, net of tax attributable to the owners of the parent 1,025.4 294.4 956.1 183.5 125.5
Group statement of changes in equity2016
$M 2015
$M2014
$M2013
$M2012
$M
At 1 July 3,042.9 2,918.7 2,499.4 2,472.7 2,467.5
Profit for the period 262.4 223.5 215.9 178.0 142.3
Other comprehensive income/(loss) 763.0 70.9 740.2 5.5 (16.8)
Total comprehensive income 1,025.4 294.4 956.1 183.5 125.5
Shares issued 0.4 – – – 11.0
Share buy-back 0.1 – – – (10.9)
Capital return and share cancellation – – (454.1) – –
Long-term incentive plan – – – – –
Dividend paid (188.1) (170.2) (82.7)1 (156.8) (120.4)
At 30 June 3,880.7 3,042.9 2,918.7 2,499.4 2,472.7
1. During the 2014 financial year, the company made a $454 million capital return to shareholders ($0.343 per share). Only a final dividend of $82.7 million was declared for the financial year.

Five-year summary68
Auckland International Airport Limited
Group balance sheet2016
$M 2015
$M 2014
$M 2013
$M 2012
$M
Non-current assets
Property, plant and equipment
Freehold land 3,418.0 2,657.7 2,649.7 1,912.1 1,908.8
Buildings and services 612.4 583.0 499.0 504.7 514.4
Infrastructure 294.0 278.8 281.5 273.2 279.9
Runways, taxiways and aprons 333.3 320.2 298.2 308.7 300.3
Vehicles, plant and equipment 50.4 44.4 33.1 21.5 18.5
4,708.1 3,884.1 3,761.5 3,020.2 3,021.9
Investment properties 1,048.9 848.1 733.4 635.9 579.8
Investment in associates 142.8 163.6 158.4 165.7 180.0
Derivative financial instruments 138.8 118.3 6.9 17.1 24.7
6,038.6 5,014.1 4,660.2 3,838.9 3,806.3
Current assets
Cash 52.6 38.5 41.4 69.2 42.8
Inventories 0.1 – – –
Trade and other receivables 42.3 36.6 29.0 26.8 23.1
Dividend receivable 3.3 2.8 2.7 3.6 3.3
Taxation receivable 3.9 9.5 – – –
Derivative financial instruments 0.7 – 0.5 – 0.1
102.9 87.4 73.6 99.6 69.3
Total assets 6,141.5 5,101.5 4,733.8 3,938.5 3,875.5
Five-year summary CONTINUEDFOR THE YEAR ENDED 30 JUNE 2016

Five
-yea
r su
mm
ary
69
Shareholders’ equity2016
$M 2015
$M 2014
$M 2013
$M 2012
$M
Issued and paid-up capital 332.7 332.3 332.3 348.8 348.8
Cancelled share reserve (609.2) (609.2) (609.2) (171.6) (171.6)
Property, plant and equipment revaluation reserve 3,730.6 2,958.5 2,880.6 2,147.7 2,148.6
Share-based payments reserve 1.0 0.9 0.9 0.9 0.9
Cash flow hedge reserve (47.7) (25.7) (14.0) (18.0) (26.6)
Share of reserves of associates 10.4 (0.4) (2.1) (10.5) (11.4)
Foreign currency translation reserve (9.5) (6.8) (8.5) (1.5) 2.0
Retained earnings 472.4 393.3 338.7 203.6 182.0
3,880.7 3,042.9 2,918.7 2,499.4 2,472.8
Non-current liabilities
Term borrowings 1,490.0 1,504.9 1,126.8 1,010.3 926.9
Derivative financial instruments 56.9 22.2 33.1 21.7 31.6
Deferred tax liability 220.4 220.3 200.2 200.2 199.2
Other term liabilities 1.3 1.3 0.7 0.7 0.7
1,768.6 1,748.7 1,360.8 1,232.9 1,158.5
Current liabilities
Accounts payable 94.3 88.8 69.5 62.2 54.4
Taxation payable – – 2.8 10.4 6.2
Derivative financial instruments 0.1 1.7 – – 1.3
Short-term borrowings 396.9 217.6 380.1 131.7 181.8
Provisions 0.9 1.8 1.9 1.9 0.5
492.2 309.9 454.3 206.2 244.2
Total equity and liabilities 6,141.5 5,101.5 4,733.8 3,938.5 3,875.5

Five-year summary70
Auckland International Airport Limited
Group statement of cash flows2016
$M 2015
$M 2014
$M 2013
$M 2012
$M
Cash flow from operating activities
Cash was provided from:
Receipts from customers 569.5 500.6 471.6 441.9 428.5
Interest received 1.7 3.3 2.1 2.8 1.6
571.2 503.9 473.7 444.7 430.1
Cash was applied to:
Payments to suppliers and employees (151.2) (116.0) (116.4) (112.1) (106.0)
Income tax paid (69.9) (79.5) (79.1) (57.3) (59.2)
Interest paid (79.6) (86.2) (66.6) (67.5) (68.2)
(300.7) (281.7) (262.0) (236.9) (233.4)
Net cash flow from operating activities 270.5 222.2 211.7 207.8 196.7
Cash flow from investing activities
Cash was provided from:
Proceeds from sale of assets 0.1 0.3 – – –
Proceeds from sale of investment property – 0.5 – – –
Dividends from associates 15.8 13.1 16.8 14.3 15.3
15.9 13.9 16.8 14.3 15.3
Cash was applied to:
Purchase of property, plant and equipment (124.4) (79.0) (60.7) (55.0) (46.5)
Interest paid – capitalised (5.5) (4.3) (3.2) (2.2) (1.8)
Expenditure on investment properties (103.7) (61.2) (55.6) (32.2) (36.3)
Other investing activities – – – – (1.0)
(233.6) (144.5) (119.5) (89.5) (85.6)
Net cash applied to investing activities (217.7) (130.6) (102.7) (75.2) (70.3)
Cash flow from financing activities
Cash was provided from:
Increase in share capital 0.4 – – – 11.0
Increase in borrowings 275.0 565.8 450.0 175.4 552.5
275.4 565.8 450.0 175.4 563.5
Cash was applied to:
Share buy-back – – (454.1) – (10.9)
Decrease in borrowings (126.0) (490.1) (50.0) (125.0) (562.0)
Dividends paid (188.1) (170.2) (82.7) (156.7) (120.3)
(314.1) (660.3) (586.8) (281.7) (693.2)
Net cash flow applied to financing activities (38.7) (94.5) (136.8) (106.3) (129.7)
Net increase/(decrease) in cash held 14.1 (2.9) (27.8) 26.3 (3.3)
Opening cash brought forward 38.5 41.4 69.2 42.8 46.1
Ending cash carried forward 52.6 38.5 41.4 69.2 42.8
Five-year summary CONTINUEDFOR THE YEAR ENDED 30 JUNE 2016

Five
-yea
r su
mm
ary
71
Capital expenditure2016
$M 2015
$M 2014
$M 2013
$M 2012
$M
Aeronautical 119.7 68.3 33.3 51.2 25.5
Retail 4.6 3.1 6.1 0.9 2.3
Property development 106.4 67.0 54.1 37.1 49.3
Infrastructure and other 8.0 4.2 22.5 3.1 3.1
Car parking 4.5 5.0 5.5 1.1 2.9
Total 243.2 147.6 121.5 93.5 83.1
Passenger, aircraft and MCTOW 2016 2015 2014 2013 2012
Passenger movements
International 9,358,290 8,618,191 8,150,396 7,755,678 7,769,207
Domestic 7,902,059 7,198,595 6,911,689 6,760,537 6,236,915
Aircraft movements
International 49,825 46,692 45,809 44,314 45,094
Domestic 107,929 104,264 107,454 110,832 110,421
MCTOW (tonnes)
International 4,909,786 4,556,051 4,339,266 4,104,679 4,167,792
Domestic 2,069,157 1,890,764 1,879,199 1,824,689 1,733,819

Corporate governance72
Auckland International Airport Limited
Corporate governance Auckland Airport’s Board of directors is responsible for the company’s corporate governance. The Board is committed to undertaking this role in accordance with internationally accepted best practice appropriate to the company’s business as well as taking account of the company’s listing on both the NZX and the ASX (Foreign Exempt Listing Category). The company’s corporate governance practices fully reflect and satisfy the ASX Corporate Governance Council’s Corporate Governance Principles and Recommendations (3rd edition) (ASX Principles), the NZX Corporate Governance Best Practice Code (NZX Code) and the Financial Markets Authority handbook Corporate Governance in New Zealand – Principles and Guidelines (FMA Handbook).
The comprehensive ASX Principles set out eight fundamental principles of good corporate governance. The structure of this corporate governance section of the annual report reflects the company’s compliance with those fundamental principles. This approach has been adopted to maximise the transparency of the company’s corporate governance practices for the benefit of shareholders and other stakeholders. This is consistent with the approach taken in previous annual reports and helps readers compare reports.
The company’s constitution and each of the charters and policies referred to in this corporate governance section are available on the corporate information section of the company’s website at corporate.aucklandairport.co.nz/governance
Principle 1: Lay solid foundations for management and oversightThe Board’s charter recognises the respective roles of the Board and management. The charter reflects the sound base the Board has developed for providing strategic guidance for the company and the effective oversight of management.
The Board’s primary governance roles are to:
• ensure there are procedures and systems in place to safeguard the health and safety of people working at or visiting Auckland Airport
• work with company management to ensure that the company’s strategic goals are clearly established and communicated and that strategies are in place to achieve them
• monitor management performance in strategy implementation
• appoint the chief executive, review his or her performance and, where necessary, terminate the chief executive’s employment
• approve the appointment of the company secretary
• approve remuneration policies applicable to senior management
• approve and monitor the company’s financial statements and other reporting, including reporting to shareholders, and ensure that the company’s obligations of continuous disclosure are met
• ensure that the company adheres to high ethical and corporate behaviour standards
• ensure the company has measurable objectives in place for achieving diversity within the business
• promote a company culture and remuneration practice that facilitates the recruitment, professional development and retention of staff
• set specific limits on management’s delegated authority for entry into new expenditure, contracts and acquisition of assets and approve commitments outside those limits
• ensure that the company has appropriate risk management and regulatory compliance policies in place, and monitor the appropriateness and implementation of those policies.
The Board has established the following standing committees to ensure efficient decision making. These are:
• audit and financial risk
• people and capability
• nominations
• safety and operational risk.
The roles of these committees are detailed later in this report.
The Board delegates the day-to-day operations of the company to management under the control of the chief executive. Day-to-day operations are required to be conducted in accordance with strategies set by the Board. The Board’s charter records this delegation and promotes clear lines of communication between the chair and the chief executive.
All directors have been issued with letters setting out the terms and conditions of their appointment. A copy of the standard form of this letter is available on the company website at corporate.aucklandairport.co.nz/governance. This letter may be changed with the agreement of the Board. The chief executive and other members of the senior management team have employment agreements setting out their roles and conditions of employment. The company has set detailed delegated authorities controlling the extent to which employees can commit the company.

Co
rpo
rate
go
vern
ance
73
Principle 2: Structure the Board to add valueThe number of directors is determined by the Board, in accordance with the company’s constitution, to ensure it is large enough to provide a range of knowledge, views and experience relevant to the company’s business. The constitution requires there to be no more than eight and no fewer than three directors.
The Board currently comprises eight directors, being Sir Henry van der Heyden, Richard Didsbury, Brett Godfrey, Michelle Guthrie, James Miller, Justine Smyth, Christine Spring and Patrick Strange. All of the directors are considered by the Board to be independent directors. In judging whether a director is independent, the Board has regard to whether or not:
• the director is a substantial product holder (as that term is defined in section 274 of the Financial Markets Conduct Act 2013) in the company or is an officer of or otherwise associated directly with a substantial product holder of the company
• the director is or has within the past three years been employed in an executive capacity by the company and there has not been a period of at least three years between ceasing such employment and serving on the Board
• the director has been within the last three years a material supplier or customer of the company or is an officer or
employee of or otherwise associated with a material supplier or customer
• the director has a material contractual or other material relationship with the company other than as a director
• the director has been within the last three years a principal of a material professional adviser or a material consultant to the company or another group member or an employee materially associated with the service provided
• the director has served on the Board for a period that, in the Board’s opinion, could or could reasonably be perceived to materially interfere with the director’s ability to act in the best interests of the company
• the director is free from any other interests or any business or other relationships (including familial) that could or could be perceived to interfere with the director’s unfettered and independent judgement and ability to act in the best interests of the company
• any associated person of the director has derived or is likely to derive in the current financial year 10% or more of that person’s annual revenue from or by virtue of a relationship (other than as a director of Auckland Airport) the director or the associated person of the director has with the company or a substantial product holder of the company.
As at the date of this annual report, the directors and the dates of their appointment are:
Sir Henry van der Heyden KNZM, BE (Hons) (Chair) 4 September 2009
Richard Didsbury BE 20 November 2007
Brett Godfrey BCom, ACA 28 October 2010
Michelle Guthrie BA, LLB (Hons) 24 October 2013
James Miller BCom, FCA, AMInstD 4 September 2009
Justine Smyth BCom, FCA 2 July 2012
Christine Spring BE, MSc Eng, MBA 23 October 2014
Patrick Strange BE (Hons), PhD 22 October 2015
The chief executive is not a member of the Board.
The Board considers that the roles of chair of the Board and chief executive must be separate. The Board charter requires that the chair of the Board is an independent, non-executive director.
The table on page 75 shows a list of each director’s Board committee memberships, the number of meetings of the Board and its committees held during the year and the number of those meetings attended by each director. Minutes are taken of all Board committee meetings.
Subject to the prior approval of the chair of the Board, any director is entitled to obtain independent professional advice relating to the affairs of the company or to the director’s responsibilities as a director, at the cost of the company.
The Board has determined that directors will hold office for an initial term of no longer than three years following their first appointment. Directors may offer themselves for re-election by shareholders at the end of each three-year term. If the
director is appointed by the Board between annual meetings, the three years applies from the date of the meeting next following that interim appointment. The Board’s charter records these requirements, which are subject to any limitations imposed by shareholders in the annual meeting and the requirements of the constitution relating to the retirement of directors by rotation. The Board’s policy is that directors shall not serve a term of longer than nine years unless the Board considers that any director serving longer than that period would be in the best interests of shareholders. The Board nominations policy can be found on the company website at corporate.aucklandairport.co.nz/governance.
The Board has established the nominations committee to focus on the selection of new directors and the induction of directors and to develop a succession plan for Board members. Appropriate checks of any potential new director are undertaken before any appointment or putting forward to security holders for election. The committee is required to comprise of a minimum of three directors, two of whom must

Corporate governance74
Auckland International Airport Limited
be independent non-executive directors, and the chair of the committee is required to be an independent director. Currently, all eight directors are members of the committee, with each member being independent and Sir Henry van der Heyden as chair. The nominations committee does not meet separately as all matters to be discussed at the committee are discussed by the full Board.
The Board seeks to ensure that it has an appropriate mix of skills, experience and diversity (including gender diversity) to ensure it is well equipped to navigate the range of issues faced by the company. The Board reviews and evaluates on a regular basis the skill mix required and identifies where gaps exist. The areas of skill and experience that the Board considers to be particularly relevant include tourism, aviation industry, retail and sales, government relations, New Zealand and international business, property and infrastructure, health and safety, finance and accounting, and legal.
The Board is strongly supportive of increasing diversity in corporate governance. The Board participates in the Future Director programme to help grow New Zealand’s pool of potential talent for governance roles. The company’s diversity policy expresses the view that diversity, encompassing differences that relate to gender, age, ethnicity, disability, religion, sexual orientation and cultural background, assists the business in developing organisational capability. The Board is also mindful of the value and contribution from people with differences in background and life experience, communication styles, interpersonal skills and education. The Board considers that it has the appropriate mix of relevant skills, experience and diversity to enable it to discharge its responsibilities.
Directors have unfettered access to the company’s records and information as required for the performance of their duties. They also receive detailed information in Board papers to facilitate decision making. New Board members take part in an induction programme to familiarise them with the company’s business and facilities.
The Board receives regular briefings on the company’s operations from senior management. Tours of the company’s facilities keep the Board abreast of developments. Directors and management are also encouraged to continue the development of their business skills and knowledge by attending relevant courses, conferences and briefings.
The company secretary is responsible and accountable to the Board for:
• ensuring that Board procedures are followed and the applicable rules and regulations for the conduct of the affairs of the Board are complied with
• ensuring the statutory functions of the Board and the company are appropriately dealt with and for bringing to the Board’s attention any failure to comply with such of which the company secretary becomes aware
• all matters associated with the maintenance of the Board or otherwise required for its efficient operation.
All directors have access to the advice and services of the company secretary for the purposes of the Board’s affairs. The appointment of the company secretary is made on the recommendation of the chief executive and must be approved by the Board.
The following table details the attendance by each director at the relevant Board, committee and strategy meetings for the period 1 July 2015 to 30 June 2016. Additional ad hoc committees, such as the aeronautical pricing committee, are established from time to time in respect of regulatory compliance and other matters relevant to the company.
Corporate governance CONTINUED

Co
rpo
rate
go
vern
ance
75
Name Status Board1Audit and financial risk
People and capability
Safety and operational risk
Mem
ber
No
of m
eetin
gs
No
of m
eetin
gs a
tten
ded
Mem
ber
No
of m
eetin
gs
No
of m
eetin
gs a
tten
ded
Mem
ber
No
of m
eetin
gs
No
of m
eetin
gs a
tten
ded
Mem
ber
No
of m
eetin
gs
No
of m
eetin
gs a
tten
ded
Sir Henry van der Heyden Independent non-executive ✓ 7 7 ✓ 4 4 ✓ 3 3 ✓ 3 2
John Brabazon Independent non-executive ✓ 7 22 ✓ 4 12 ✓ 3 12
Richard Didsbury Independent non-executive ✓ 7 7 ✓ 3 3
Brett Godfrey Independent non-executive ✓ 7 7 ✓ 3 2 ✓ 3 2
Michelle Guthrie Independent non-executive ✓ 7 7 ✓ 3 3
James Miller Independent non-executive ✓ 7 7 ✓ 4 4
Justine Smyth Independent non-executive ✓ 7 7 ✓ 4 4 ✓ 3 3
Christine Spring Independent non-executive ✓ 7 7 ✓ 3 3 ✓ 3 3
Patrick Strange Independent non-executive ✓ 7 53 ✓ 4 13 ✓ 3 23
1 Board meetings include nominations committee.2 John Brabazon retired from the Board on 22 October 2015.3 Patrick Strange was appointed to the Board on 22 October 2015.
Principle 3: Act ethically and responsiblyThe company has always required the highest standards of honesty and integrity from its directors and employees. This commitment is reflected in the company’s ethics and code of conduct policy, which can be found on the company website at corporate.aucklandairport.co.nz/governance. The ethics and code of conduct policy recognises the company’s legal and other obligations to all legitimate stakeholders. The ethics and code of conduct policy applies equally to directors and employees of the company.
The ethics and code of conduct policy deals with the company’s:
• responsibilities to shareholders including protection of confidential information, restrictions on insider trading, rules for making of public statements on behalf of the company, accounting practices and co-operation with auditors
• responsibilities to customers and suppliers of the company and other persons using the airport including rules regarding unacceptable payments and inducements, treatment of third parties’ non-discriminatory treatment and tendering obligations
• responsibilities to the community including compliance with statutory and regulatory obligations, use of assets and resources and conflicts of interest.
The ethics and code of conduct policy also sets out procedures to be followed for reporting any concerns regarding breaches of the policy and for annual review of its content by the Board.
The company also has a policy on share trading by directors, officers and employees, which can be found on the company website at corporate.aucklandairport.co.nz/governance. The policy sets out a fundamental prohibition on trading of the company’s securities and the obligation of confidentiality in
dealing with any material information. The policy applies to ordinary shares and debt securities issued by the company, any other listed securities of the company or its subsidiaries and any listed derivatives in respect of such securities. Under the policy, there is also a prohibition on directors or senior employees trading in the company’s shares during any black-out period. The company’s black-out periods are:
• the period from the close of trading on 30 June of each year until the day following the announcement to the NZX of the preliminary final statement or full-year results
• the period from the close of trading on 31 December of each year until the day following the announcement to the NZX of the half-year results.
The company’s procedure for reporting and dealing with any concerns in respect of the conduct of its directors, employees and contractors fully complies with the requirements of the Protected Disclosures Act 2000.
DIVERSITY
The company strongly values and supports diversity, ensuring that the company and its leadership, management and employees reflect the diverse range of individuals and groups within our society. The company is committed to embracing diversity in all its forms, be it gender identity, sexual orientation, age, ethnicity, disability, cultural background or religion. A copy of the diversity policy can be found on the company website at corporate.aucklandairport.co.nz/governance.
To support the implementation of the diversity policy, in 2016, the company became a founder pledge partner in the Champions for Change movement – a New Zealand-wide business-led initiative. Modelled on similar overseas movements, the over-arching objective of Champions for

Corporate governance76
Auckland International Airport Limited
Change is to radically increase diversity among New Zealand companies’ boards of directors and executive leadership teams. The company also participated in the pilot of a new cultural capability assessment tool developed in support of Champions for Change.
The people and capability committee of the Board receives an annual report from management on diversity within the company, encompassing the number of female employees, level of participation and representation by department. In addition, the senior management team receives regular reports on diversity and wider gender demographics (where available).
The following table sets out the breakdown of gender diversity across the company.
Male Female % of female
2015 2016 2015 2016 2015 2016
Board 5 5 3 3 38% 38%
Leadership team 8 7 1 2 10% 22%
Employees 264 266 121 146 31% 35%
Principle 4: Safeguard integrity in corporate reportingThe audit and financial risk committee is responsible for financial risk management oversight. This committee’s formal charter reflects this responsibility. The audit and financial risk committee’s charter can be found on the company website at corporate.aucklandairport.co.nz/governance. The committee provides general assistance to the Board in performing its responsibilities, with particular reference to the financial risk management, financial reporting and audit functions. It includes specific responsibility to review the company’s processes for identifying and managing financial risk, financial reporting processes, systems of internal control and the internal and external audit process.
The committee must have a minimum of three members, all of whom must be non-executive directors, and the majority must be independent directors. The committee is chaired by an independent chair, who must not be the chair of the Board.
The current members are James Miller (chair), Sir Henry van der Heyden, Justine Smyth and Patrick Strange, all of whom are independent non-executive directors. Their qualifications are set out on page 73 and attendance at meetings on page 75.
The external auditor is invited to attend meetings when it is considered appropriate by the committee. The committee meets with the auditor without any representatives of management present at least once per year.
The audit and financial risk committee has adopted a policy in respect of the independence of the external auditor. This policy can be found on the company website at corporate.aucklandairport.co.nz/governance. This policy places limitations on the extent of non-audit work that can be carried out by the external auditor and requires the regular rotation of the partner of the external auditor responsible for the audit of the company every five years.
Principle 5: Make timely and balanced disclosureThe company is committed to promoting investor confidence by providing forthright, timely, accurate, complete and equal access to information in accordance with the NZX and ASX Listing Rules. The company has a disclosure and communications policy designed to ensure this occurs. That policy can be found on the company website at corporate.aucklandairport.co.nz/governance.
The company secretary is the company’s market disclosure officer and is responsible for monitoring the company’s business to ensure the compliance with its disclosure obligations. Managers reporting to the chief executive are required to provide the company secretary with all relevant information
and to regularly confirm that they have done so and made all reasonable enquiries to ensure this has been achieved.
The company secretary is responsible for releasing any relevant information to the market once it has been approved. Financial information release is approved by the audit and financial risk committee, while information released on other matters is approved by the chief executive.
Directors formally consider at each Board meeting whether there is relevant material information that should be disclosed to the market.
Corporate governance CONTINUED

Co
rpo
rate
go
vern
ance
77
Principle 6: Respect the rights of security holdersThe company’s communication framework and strategy is designed to ensure that communication with shareholders and all other stakeholders is managed efficiently. This strategy forms part of the disclosure and communications policy referred to under Principle 5, which can be found on the company website at corporate.aucklandairport.co.nz/governance. It is the company’s policy that external communications will be accurate, verifiable, consistent and transparent.
The chief executive and chief financial officer are appointed as the points of contact for analysts. The chair, chief executive, chief financial officer, general counsel and company secretary and manager public affairs are appointed as the points of contact for media.
The company currently keeps shareholders informed through:
• the annual report
• the interim report
• the annual meeting of shareholders
• information provided to analysts during regular briefings
• disclosure to the NZX and ASX in accordance with the company’s disclosure and communications policy
• media releases
• the corporate section of the company website at corporate.aucklandairport.co.nz/governance.
The Board considers the annual report to be an essential opportunity for communicating with shareholders. The company publishes its annual and interim results and reports electronically on the company website at corporate.aucklandairport.co.nz/governance. Investors may also request a hard copy of the annual report by contacting the company’s share registrar, Link Market Services Limited. Contact details for the registrar appear at the end of this report.
The company’s annual meetings are well attended by shareholders, and the company considers the meetings to be a valuable element of its communications programme. The chair provides an opportunity for shareholders to raise questions for their Board and to make comments about the company’s operations and performance. The chair may ask the chief executive and any relevant manager of the company to assist in answering questions if required. The company’s external auditor also attends the annual meeting and is available to answer questions relating to the conduct of the external audit and the preparation and content of the auditor’s report.
Principle 7: Recognise and manage riskRisk management is an integral part of the company’s business. The company has systems to identify and minimise the impact of financial and operational risk on its business. These systems include a process to enable:
• significant risk identification
• risk impact quantification
• risk mitigation strategy development
• compliance monitoring to ensure the ongoing integrity of the risk management process.
The chief executive and the chief financial officer are required each year to confirm in writing to the audit and financial risk committee that:
• the company’s financial statements are presented fairly, in all material respects, and in accordance with the relevant accounting standards
• the statement given in the preceding paragraph is founded on a sound system of risk management and internal compliance and control, which implements the policies adopted by the Board
• the company’s risk management and internal compliance and control system is operating efficiently and effectively in all material respects.
The Board has received assurance from the chief executive and chief financial officer that this confirmation is founded on a sound system of risk management and internal control, which is operating effectively in all respects relating to financial reporting.
The safety and operational risk committee is responsible for oversight of the company’s safety and operational risk management programme. This committee’s formal charter
reflects this responsibility. The safety and operational risk committee’s charter and the company’s risk management policy can be found on the company website at corporate.aucklandairport.co.nz/governance.
The committee oversees and makes recommendations to the Board on the safety (including workplace health and safety), environmental and operational risk profile of the business. It also ensures that appropriate policies and procedures are adopted for the timely and accurate identification and reporting and effective management of the significant risks.
It includes specific responsibility to review and monitor the application of the company’s enterprise-wide processes for identifying and managing:
• health and safety matters
• environmental issues
• safety and operational risk
• compliance with applicable law and the company’s own policies.
The committee must have a minimum of three members, all of whom must be non-executive directors, and the majority must be independent directors. The committee is chaired by an independent chair, who must not be the chair of the Board. The current members are Richard Didsbury (chair), Brett Godfrey, Christine Spring, Sir Henry van der Heyden and Patrick Strange, all of whom are independent non-executive directors. Their qualifications are set out on page 73 and attendance at meetings on page 75.
The audit and financial risk committee continues to be delegated responsibility for oversight of financial risk.

Corporate governance78
Auckland International Airport Limited
Further details of the role of this committee are set out at Principle 4 above.
The company continues to enhance and develop its risk management process with a view to continuous improvement.
The company has established a formal internal audit function. This function is performed by Ernst & Young. Ernst & Young reports on its activities two times in each year to the audit and financial risk committee.
The company’s business is also subject to other internal and external audit and review, including in particular the regular external audit by New Zealand’s Civil Aviation Authority to ensure operational certification as well as external audits as part of the Accident Compensation Corporation’s Workplace Safety Management Practices programme.
The company operates in a commercial environment where there is always potential for economic, environmental and social sustainability risks to impact on it. As set out above, the company has in place appropriate mechanisms and controls to identify where these risks are material and to manage these as required.
Being a responsible business is part of the company’s DNA. By respecting people, the community and the environment, the company is able to grow its business sustainably and create value for all stakeholders in the long term. A copy of the company’s Corporate Social Responsibility Report 2015 is available on the company website at corporate.aucklandairport.co.nz/responsibility
Principle 8: Remunerate fairly and responsiblyThe Board’s people and capability committee has a formal charter, and all of its members are non-executive directors. The people and capability committee members are Justine Smyth (chair), Brett Godfrey, Sir Henry van der Heyden, Christine Spring and Michelle Guthrie. Each member is an independent non-executive director. The committee’s charter can be found on the company website at corporate.aucklandairport.co.nz/governance. The committee members’ attendance at meetings is set out on page 75.
Auckland Airport is committed to remuneration transparency. As a result, the company has decided to provide shareholders with more information about director and employee remuneration in this annual report than it has in previous financial years.
DIRECTOR REMUNERATION
The directors’ remuneration is paid in the form of directors’ fees. Additional fees are paid to the chair of the Board and in respect of work carried out by individual directors on various Board committees to reflect the additional responsibilities of these positions. Auckland Airport also meets directors’ reasonable travel and other costs associated with the company’s business.
ReviewEach year, the people and capability committee reviews the level of directors’ remuneration. The committee considers the skills, performance, experience and level of responsibility of directors when undertaking the review and is authorised to obtain independent advice on market conditions. After taking external advice, the committee makes recommendations to the Board on the appropriate allocation of fees to directors, and shareholders approve a fee pool for directors at the annual meeting.
Directors’ share purchase planTo align their incentives with shareholders, the directors have decided that they each will use 15% of their base fee to acquire shares in the company. In order to achieve this, the directors have entered into a share purchase plan agreement and appointed First NZ Capital to be the manager of the plan. First NZ Capital acquires the shares required for the plan on behalf of directors over the 20 business days commencing two days after the company’s half-year and full-year results
announcements. Directors remain in their share purchase plan until one year after retirement from the Board.
2016 financial yearAt the 2015 annual meeting, shareholders approved a total directors’ fee pool of $1,465,997. This was $42,699 or 3% more than the directors’ fee pool approved by shareholders at the 2014 annual meeting.
In the 2016 financial year, directors received the following remuneration for their governance of Auckland Airport.
Base fees of directors by position (from October 2015)
Name Chair Member
Board $243,2861 $113,918
Safety and operational risk committee $21,218 $10,609
Audit and financial risk committee $50,779 $25,389
People and capability committee $21,218 $10,609
Ad hoc committee work (per day) – $2,6501 The chair attends all meetings of the committees but does not receive
additional meeting fees.
Remuneration received by directors
Name Director’s fee
Sir Henry van der Heyden $241,606.72
John Brabazon $45,256.88
Richard Didsbury $140,365.70
Brett Godfrey $131,412.60
Michelle Guthrie $126,181.30
James Miller $163,560.18
Justine Smyth $193,590.70
Christine Spring $123,667.45
Patrick Strange $104,120.10
The above director remuneration includes the 15% of the base fees payable to them that they have chosen to use to acquire shares in the company under the share purchase plan.
Corporate governance CONTINUED

Co
rpo
rate
go
vern
ance
79
Future Director
Auckland Airport participates in the Institute of Directors’ Future Director programme. The programme aims to improve the quantum, quality and diversity of board-ready candidates in New Zealand. The programme operates within a well defined set of protocols at Auckland Airport:
• The Future Director participates in all Board and committee meetings but does not take part in the actual decision making.
• The term of the Future Director’s appointment is for one year.
• The Future Director is not offered a seat on the Auckland Airport Board at the end of the programme.
• An ex gratia payment may be made to the Future Director at the Board’s discretion.
Auckland Airport selected Nicola Greer to participate in the Future Director programme during the 2016 financial year.
EMPLOYEE REMUNERATION
Remuneration philosophyThe company’s remuneration philosophy is to ensure that:
• staff are fairly and equitably remunerated relative to similar companies and positions within the New Zealand market
• staff are strongly motivated to deliver shareholder value
• the company is able to attract and retain high-performing employees who will ensure the achievement of business objectives.
Performance and developmentAll employees of the company participate every six months in a formal performance and development review. The outcomes of the end-of-year review inform decisions regarding remuneration adjustments in accordance with company policy. Additionally, formal talent reviews are conducted each year that identify employees with potential to progress to more senior roles. The outputs of talent reviews form the basis of the company’s succession plans.
Annual remuneration reviewThe company’s annual remuneration review process requires ‘one over one’ approval. That means the approval of the Board is required for the implementation of changes to the chief executive’s remuneration, as recommended by the people and capability committee. Likewise, the approval of the people and capability committee is required for the implementation of changes to the remuneration of the leadership team. The total pool available for remuneration adjustments is set by the Board at the time the annual budget is approved.
The remuneration review process involves the consideration of market information obtained from specialist advisers and, in the case of employees employed under collective agreements, negotiations with unions.
Health and other insurancesThe company provides fully subsidised health insurance to all employees on a collective employment agreement. Permanent employees on an individual employment agreement are eligible to participate in the company’s group health scheme at group discount rates. The premium is paid by the employee, and the insurance covers the employee, his/her partner and any children under 21 years of age. The company’s health insurance is currently supplied by Southern Cross Health Society.
The company also provides all employees with income protection and life insurance. The company fully subsidises the cost of these insurances for employees on a collective employment agreement. Permanent employees on individual employment agreements pay the premium for their insurances. The company’s income protection and life insurance is currently supplied by AMP-AXA.
The company also provides employees with domestic and international travel insurance when the travel is work related.
SuperannuationAll employees are eligible to participate in KiwiSaver. The company contributes up to 3% of each employee’s paid remuneration. Any permanent employee who joined the company prior to 31 March 2012 was eligible to participate in either the Auckland Airport Mastertrust superannuation scheme or the Lump Sum National superannuation scheme. There is no cap on the amount that can be contributed by permanent employees on an individual employment agreement. The amount that can be contributed by permanent employees on a collective employment agreement is not capped, however the company’s total contribution is capped at 6% of base salary, inclusive of any KiwiSaver contribution already made by the company. Up to the cap, the company contributes $1.20 (less tax) for every $1.00 contributed by the employee.
Fixed annual remunerationAuckland Airport’s philosophy is to set the mid-points of fixed annual remuneration at the market median for employees who are fully competent in their role.
Short-term incentivesTwenty-eight senior Auckland Airport employees as well as all members of the leadership team were invited to participate in the company’s short-term incentive scheme during the 2016 financial year. The short-term incentive is an at-risk component of employee remuneration and is in addition to fixed annual remuneration1 and payable in cash on achievement of performance targets.
As shown below, for employees who are not on the leadership team, the short-term incentive target is 20% of the fixed annual remuneration. The short-term incentive target for members of the leadership team is 30% of fixed annual remuneration, and the chief executive’s short-term incentive target is 50% of base salary.2
For over-performance against targets, an employee’s short-term incentive payment can increase as shown in the right-hand column below.
Short-term incentive target For over-performance
Employee not on leadership team
20% of fixed annual remuneration
Up to 24% of fixed annual remuneration
Leadership team 30% of fixed annual remuneration
Up to 42% of fixed annual remuneration
Chief executive 50% of base salary Up to 70% of base salary
1. Fixed annual remuneration is the fixed sum that employees on individual employment agreements earn. The cost of insurance premiums is deducted from fixed annual remuneration, and the remaining amount is the base salary.
2. Base salary for the chief executive means the base salary after deduction from fixed annual remuneration of the cost of any health, income protection and life insurance premiums.

Corporate governance80
Auckland International Airport Limited
Individual componentHalf the short-term incentive is based on the employee achieving key performance targets relevant to his or her role. These targets are agreed with the employee’s manager at the start of the performance year or, in the case of the chief executive, agreed with the Board. Every member of the leadership team, including the chief executive, has health and safety-related short-term incentive targets.
The individual component includes stretch targets as well as baseline objectives. Each participating employee has clear measures in place to determine achievement or non-achievement in any one year.
Company componentHalf of the short-term incentive is based on the company’s achievement of annual financial targets set by the Board.
The company component has a clear measure in place to determine achievement or non-achievement in any one year – the achievement of the annual earnings before interest, taxation, depreciation, amortisation, fair value adjustments and investments in associates (EBITDAFI) target. If the company achieves a financial result that is significantly below the EBITDAFI target, no company component is paid to employees. If the company achieves a financial result that is significantly above the EBITDAFI target, payment of the company component is capped at 120% of the target for non-executive employees and 140% of the target for the leadership team and chief executive.
The Board may make one-off adjustments to the company component of the short-term incentive to guard against windfall payments as a result of financial outcomes that employees did not influence or to ensure that employees are not unfairly penalised for material one-off adverse events outside their control.
Long-term incentive
Members of Auckland Airport’s leadership team and the chief executive participate in the company’s long-term incentive plan.
Given the company’s continuing strong performance and growth in share price, the Board introduced a new long-term incentive plan in the 2016 financial year to provide greater cost certainty and market alignment. It also amended the previous long-term incentive plan – which was a phantom option plan – by capping its potential rewards. This legacy plan runs until the 2018 financial year.
The new long-term incentive plan is a share-based plan. At the end of the 2016 financial year, the total current value of all long-term incentives in place for Auckland Airport’s leadership team and chief executive was $5.4 million.
Note 23 of the financial statements on pages 62 to 64 provides full details of the number of incentives granted, lapsed and exercised.
Remuneration of employees
Below are the numbers of employees and former employees of the company, excluding directors, who received remuneration and other benefits that totalled $100,000 or more in their capacity as employees during the 2016 financial year.
Amount of remuneration Former employees
Current employees
$100,001 to $110,000 2 28
$110,001 to $120,000 28
$120,001 to $130,000 2 23
$130,001 to $140,000 15
$140,001 to $150,000 1 9
$150,001 to $160,000 6
$160,001 to $170,000 3 2
$170,001 to $180,000 7
$180,001 to $190,000 1 1
$190,001 to $200,000 2
$200,001 to $210,000 1 4
$210,001 to $220,000 3
$220,001 to $230,000 2
$230,001 to $240,000 3
$240,001 to $250,000 2
$250,001 to $260,000 1
$270,001 to $280,000 1
$290,001 to $300,000 1
$410,001 to $420,000 4
$420,001 to $430,000 1
$550,001 to $560,000 1
$1,380,001 to $1,390,000 1
$1,770,001 to $1,780,000 1
$2,130,001 to $2,140,000 1
$3,400,001 to $3,410,000 1
The above employee remuneration includes salary, short-term incentives and cash payments made under the company’s phantom option long-term incentive scheme. The company’s contributions to superannuation, health, life and income protection insurance plans and any termination payments received in their capacity as employees.
Corporate governance CONTINUED

Co
rpo
rate
go
vern
ance
81
CHIEF EXECUTIVE REMUNERATION
Base salaryOver the course of the financial year, the chief executive, Adrian Littlewood, earned a base salary of $900,990. There was no increase on the base salary he earned in the 2015 financial year.
SharesThe chief executive held 810 shares personally in the company as at 30 June 2016, and 60,139 shares were held on trust under the long-term incentive plan and have not yet vested.
Short-term incentivesThe annual value of the short-term incentive scheme for the chief executive is set at 50% of base salary if all performance targets are achieved. If a performance rating of unsatisfactory is achieved, no short-term incentive is payable. Up to a maximum 70% of base salary is payable for outstanding performance.
For the 2016 financial year, the chief executive earned a total short-term incentive payment of $546,455. In the 2015 financial year, the chief executive’s total short-term incentive payment was $454,575.
A high level summary of the chief executive’s short-term incentive targets for the 2016 financial year is provided below.
Short-term incentive Weight
Health and safety, strategy and leadership 30%
Financial and market outcomes 17.5%
Infrastructure development and operational performance
17.5%
Tourism market growth 17.5%
Non-aeronautical business 17.5%
Long-term incentivesThe chief executive participated in the Auckland Airport long-term incentive plan in the 2016 financial year. His remuneration includes both phantom options from the legacy long-term incentive plan that runs until the 2018 financial year and shares issued under the new long-term incentive plan. The exercise or vesting of these incentives are subject to achieving hurdles based on total shareholder return.
Scheme Financial year of grant Grant value Number granted Financial year exercised
Phantom options 2012 $81,2001 480,474 2015
Phantom options 2013 $260,2562 1,577,311 2016
Phantom options 2014 $429,2503 1,578,125 Exercisable from 2017 financial year
Phantom options 2015 $455,0003 1,486,929 Exercisable from 2018 financial year
Shares – based scheme 2016 $450,495 60,139 Vests in 2019 financial year1 The 2012 grant was in respect of the chief executive’s prior executive role as GM retail and commercial. 2 The 2013 grant was a blended grant based on the chief executive’s prior executive role and current position. Exercise value was capped at 2.5 times base
salary as at the grant year.3 Exercise value capped at 2 times base salary as at the grant year.
SuperannuationThe chief executive is a member of KiwiSaver. As a member of the scheme, the chief executive is eligible to receive a company contribution up to 3% of gross taxable earnings, including the short-term incentive. For the 2016 financial year, the company contribution was $98,768 compared to $65,452 in the 2015 financial year.
Notice and termination periodThe notice period for the chief executive under the terms of his employment agreement is 6 months, and his paid termination period is 12 months.
SummaryThe remuneration paid to the chief executive is summarised below.
Remuneration element2015
financial year2016
financial year
Base Salary $900,990 $900,990
Short-term incentive $454,575 $546,455
KiwiSaver $65,452 $98,768
Other benefits $9,010 $9,010
Total $1,430,027 $1,555,223
The chief executive was also eligible to exercise long-term incentive entitlements in the 2015 and 2016 financial years for phantom options granted in the 2012 and 2013 financial years.
COMPLIANCE
The company complies with all of the requirements of the ASX Principles, the NZX Code and the FMA Handbook as at the date of this annual report.

82
Auckland International Airport Limited
Shareholder information
Shareholder informationREPORTING ENTITY
The company was incorporated on 20 January 1988 under the Companies Act 1955 and commenced trading on 1 April 1988. The company was reregistered under the Companies Act 1993 on 6 June 1997. On 25 June 1998, the company adopted a revised constitution, approved as appropriate for a publicly listed company. Further revisions of the constitution were adopted on 21 November 2000, 18 November 2002 and 23 November 2004 in order to comply with NZX and ASX Listing Rules requirements.
The company was registered in Australia as a foreign company under the Corporations Law on 22 January 1999 (ARBN 085 819 156) and was granted Foreign Exempt Listing Entity status by ASX on 22 April 2016.
STOCK EXCHANGE LISTINGS
The company’s shares were quoted on the NZX on 28 July 1998. The company’s shares were quoted on the ASX effective 1 July 2002.
The company is not subject to chapters 6, 6A, 6B and 6C of the Australian Corporations Act dealing with the acquisition of shares (i.e. substantial holdings and takeovers).
WAIVERS GRANTED BY THE NZX
The company was issued with a waiver of Listing Rule 5.2.3 by NZX on 21 October 2015 (for a period of six months from 10 November 2015) in respect of the company’s November 2015 issue of $100 million of unsecured and unsubordinated fixed rate bonds.
Listing Rule 5.2.3 (as modified by NZX’s ruling on Rule 5.2.3 issued on 29 September 2015) provides that a class of securities will generally not be considered for quotation unless those securities are held by at least 100 members of the public holding at least 25% of the number of securities in the class issued, with each member holding at least a minimum holding.
The waiver was granted on the conditions that (i) the wavier and its implications were disclosed in the terms sheet for the bonds, (ii) the waiver, its conditions and their implications are disclosed in the company’s interim and annual reports, (iii) the terms sheet for the bonds disclosed liquidity in the bonds as a risk and (iv) the company is to notify NZX if there is a material reduction in the total number and/or percentage of the bonds held by members of the public holding at least a minimum holding of the bonds.
The effect of the waiver from Listing Rule 5.2.3 is that the bonds may not be widely held and there may be reduced liquidity in the bonds.
DISCIPLINARY ACTION TAKEN BY THE NZX, ASX OR THE FINANCIAL MARKETS AUTHORITY (FMA)
None of the NZX, the ASX or the FMA has taken any disciplinary action against the company during the financial year ending 30 June 2016.
REGULATORY ENVIRONMENT
The company is regulated by, amongst other things, the Airport Authorities Act 1966 and the Civil Aviation Act 1990. The company is an airport company for the purposes of the Airport Authorities Act 1966. The company has consultation and disclosure obligations under the Airport Authorities Act 1966.
The company is required to comply with the Commerce Act (Specified Airport Services Information Disclosure) Determination 2010, with disclosure financial statements required to be published in November each year.
AUDITOR
Deloitte has continued to act as auditor of the company and has undertaken the audit of the financial statements for the 30 June 2016 year. The auditor is subject to a partner rotation policy, and a new partner will be appointed for the new financial year.
INDEMNITY AND INSURANCE
In accordance with section 162 of the Companies Act 1993 and the constitution of the company, the company has continued to indemnify and insure its directors and officers against liability to other parties (except to the company or a related party to the company) that may arise from their position as directors. The insurance does not cover liabilities arising from criminal actions.
ENTRIES RECORDED IN THE INTERESTS REGISTER
Except for disclosures made elsewhere in this annual report, there have been no entries in the interests register of the company or its subsidiaries made during the year.
DONATIONS
In accordance with section 211(1)(h) of the Companies Act 1993, the company records that it donated a total of $31,904 to various charities during the year. The company also made other community contributions in the amount of $399,545. The company’s subsidiaries did not make any donations during the year.
EARNINGS PER SHARE
Earnings in cents per ordinary share were 22.05 cents in 2016 compared with 18.78 cents in 2015.
CREDIT RATING
As at 30 June 2016, the Standard & Poor’s long-term debt rating for the company was A- Stable Outlook.
SUBSIDIARY COMPANY DIRECTORS
Paul Divers and Mark Thomson held office as directors of Auckland Airport Limited as at 30 June 2016.
Phil Neutze and Scott Weenink held office as directors of Auckland Airport Holdings Limited and Auckland Airport Holdings (No. 2) Limited as at 30 June 2016.
Directors of the company’s subsidiaries do not receive any remuneration or other benefits in respect of their appointments.

Sha
reho
lder
info
rmat
ion
83
ANNUAL MEETING OF SHAREHOLDERS
The company’s annual meeting of shareholders will be held at the Vodafone Events Centre, 770 Great South Road, Manukau, on 20 October 2016 at 10.00am.
DIRECTORS’ HOLDINGS AND DISCLOSURE OF INTERESTS
Directors held interests in the following shares in the company as at 30 June 2016.
Sir Henry van der Heyden Held personally 18,993
Richard Didsbury Held personally 13,429
Held by associated persons
3,945
Brett Godfrey Held personally 12,744
Michelle Guthrie Held personally 4,913
James Miller Held personally 13,461
Justine Smyth Held personally 8,842
Held by associated persons
94,176
Christine Spring Held personally 2,295
Patrick Strange Held personally 1,302
DISCLOSURE OF INTERESTS BY DIRECTORS
The following general disclosures of interests have been made by the directors in terms of section 140(2) of the Companies Act 1993:
Sir Henry van der HeydenChair, Tainui Group Holdings LimitedChair, Manuka SADirector, Pascaro Investments LimitedDirector, Rabobank Australia LimitedDirector, Rabobank New Zealand LimitedDirector, Foodstuffs North Island Limited
Richard DidsburyDirector, Hobsonville Land Company LimitedDirector, Kiwi Property Group LimitedChair, Committee for Auckland LimitedDirector, SKYCITY Entertainment Group Limited
Brett GodfreyDirector, Westjet Airlines LimitedDirector, Tourism Australia
Michelle GuthrieDirector, Australian Broadcasting Corporation
James MillerChair, NZX LimitedDirector, Mercury NZ LimitedDirector, Accident Compensation Corporation
Justine SmythDirector, Spark New Zealand LimitedChair, New Zealand Breast Cancer Foundation
Christine SpringDirector, Holmes GP Structures Limited
Patrick StrangeChair, Chorus LimitedDirector, Mercury NZ LimitedDirector, NZX LimitedDirector, New Zealand Clearing and Depository Corporation LimitedDirector, boards of Ausgrid, Endeavour Energy and Essential Energy (Australia)

84
Auckland International Airport Limited
Shareholder information
DISTRIBUTION OF ORDINARY SHARES AND SHAREHOLDERS AS AT 30 JUNE 2016
Size of holdingNumber of
shareholders % Number of shares %
1–1,000 5,865 12.07 3,311,294 0.28
1,001–5,000 31,312 64.44 65,135,105 5.47
5,001–10,000 5,791 11.92 41,831,755 3.51
10,001–50,000 5,000 10.29 97,205,712 8.16
50,001–100,000 403 0.83 27,645,432 2.32
100,001 and over 220 0.45 955,629,301 80.25
Total 48,591 1,190,758,599
SUBSTANTIAL PRODUCT HOLDERS
Pursuant to section 280 of the Financial Markets Conduct Act 2013, the following persons had given notice as at the balance date of 30 June 2016 that they were substantial product holders in the company and held a relevant interest in the number of ordinary shares shown below.
Substantial product holderNumber of shares in which
relevant interest is heldDate of notice
Auckland Council Investments Limited 266,328,913 31.05.16
The total number of voting securities on issue as at 30 June 2016 was 1,190,758,599.
Shareholder information CONTINUED

Sha
reho
lder
info
rmat
ion
85
20 LARGEST SHAREHOLDERS AS AT 30 JUNE 2016
ShareholderNumber
of shares%
of capital
New Zealand Central Securities Depository Limited1 490,229,196 41.17
Auckland Council Investments Limited 266,328,912 22.37
Custodial Services Limited 22,492,856 1.89
JP Morgan Nominees Australia Limited 14,874,287 1.25
BNP Paribas Nominees Pty Limited 14,759,486 1.24
National Nominees Limited 13,646,454 1.15
FNZ Custodians Limited 12,367,230 1.04
HSBC Custody Nominees (Australia) Limited 9,404,370 0.79
Custodial Services Limited 8,674,830 0.73
Investment Custodial Services Limited 7,663,808 0.64
Custodial Services Limited 7,157,885 0.60
Forsyth Bar Custodians Limited 7,075,737 0.59
Custodial Services Limited 6,051,793 0.51
BNP Paribas Noms Pty Limited 3,245,625 0.27
New Zealand Depository Nominee Limited 3,211,814 0.27
FNZ Custodians Limited 2,975,222 0.25
Custodial Services Limited 2,920,897 0.25
Masfen Securities Limited 2,634,127 0.22
Custodial Services Limited 2,208,609 0.19
NZPT Custodians (Grosvenor) Limited 2,078,516 0.171 New Zealand Central Securities Depository Limited (NZCSD) is a depository system that allows electronic trading of securities to members. As at
30 June 2016, the 10 largest shareholdings in the company held through NZCSD were:
ShareholderNumber of
shares%
of capital
HSBC Nominees (New Zealand) Limited 95,439,013 8.01
HSBC Nominees (New Zealand) Limited 86,164,261 7.24
National Nominees New Zealand Limited 69,046,492 5.80
Citibank Nominees (NZ) Limited 64,278,555 5.40
JPMorgan Chase Bank 58,924,423 4.95
Accident Compensation Corporation 31,392,073 2.64
New Zealand Superannuation Fund Nominees Limited 17,499,605 1.47
TEA Custodians Limited 13,998,130 1.18
Cogent Nominees Limited 11,735,474 0.99
Private Nominees Limited 7,879,744 0.66

86
Auckland International Airport Limited
Shareholder information
INVESTOR INFORMATION
COMPANY PUBLICATIONS
The company informs investors of the company’s business and operations by issuing an annual report (with notice of meeting) and an interim report.
FINANCIAL CALENDAR Half year Full year
Results announced February August
Reports published March September
Dividends paid March October
Annual meeting – October
Disclosure financial statements – November
Please note that the annual meeting will be held at 10.00am on 20 October 2016 at the Vodafone Events Centre, 770 Great South Road, Manukau.
VOTING RIGHTS
The voting rights of shareholders are set out in the company’s constitution. Each holder of ordinary shares is entitled to vote at any annual meeting of shareholders. On a show of hands, each holder of ordinary shares is entitled to one vote. On a poll, one vote is counted for every ordinary share. A person is not entitled to vote when disqualified by virtue of the restrictions contained in the company’s constitution and the ASX and NZX Listing Rules.
ENQUIRIES
Shareholders with enquiries about transactions, changes of address or dividend payments should contact Link Market Services Limited on +64 9 375 5998. Other questions should be directed to the company’s company secretary at the registered office.
STOCK EXCHANGE
The company’s ordinary shares trade on the NZX and the ASX. The minimum marketable parcel on the NZX is 100 shares, and in Australia, a marketable parcel is a parcel of securities of more than AUD500. As at 30 June 2016, 49 shareholders on the ASX and 108 shareholders on the NZX held fewer securities than a marketable parcel under the ASX Listing Rules.
DIVIDENDS
Shareholders may elect to have their dividends direct credited to their bank account. From time to time, the company also offers shareholders the opportunity to participate in a dividend reinvestment plan. As at the date of this report, the dividend reinvestment plan is suspended.
LIMITATIONS ON THE ACQUISITION OF THE COMPANY’S SECURITIES
The company is incorporated in New Zealand. As such, it is not subject to chapters 6, 6A, 6B and 6C of the Australian Corporations Act dealing with the acquisition of shares (such as substantial holdings and takeovers). Limitations on acquisition of the securities are, however, imposed on the company under New Zealand law:
Shareholder information CONTINUED
• Securities in the company are, in general, freely transferable. The only significant restrictions or limitations in relation to the acquisition of securities are those imposed by New Zealand law relating to takeovers, overseas investment and competition.
• The Takeovers Code creates a general rule under which the acquisition of more than 20% of the voting rights in the company or the increase of an existing holding of 20% or more of the voting rights in the company can only occur in certain permitted ways. These include a full takeover offer in accordance with the Takeovers Code, a partial takeover in accordance with the Takeovers Code, an acquisition approved by an ordinary resolution, an allotment approved by an ordinary resolution, a creeping acquisition (in certain circumstances) or compulsory acquisition if a shareholder holds 90% or more of the shares in the company.
• The Overseas Investment Act 2005 and Overseas Investment Regulations 2005 regulate certain investments in New Zealand by overseas persons. In general terms, the consent of the Overseas Investment Office is likely to be required where an overseas person acquires shares or an interest in shares in the company that amount to more than 25% of the shares issued by the company or, if the overseas person already holds 25% or more, the acquisition increases that holding.
• The Commerce Act 1986 is likely to prevent a person from acquiring shares in the company if the acquisition would or would be likely to have the effect of substantially lessening competition in a market.
SHARE REGISTRARS
NEW ZEALAND
Link Market Services LimitedLevel 11, Deloitte Centre80 Queen StreetAuckland 1010PO Box 91976Auckland 1142
Phone: +64 9 375 5998Fax: +64 9 375 5900
AUSTRALIA
Link Market Services LimitedLevel 12680 George StreetSydneyNSW 2000Locked Bag A14Sydney SouthNSW 1235
Phone: +61 2 8280 7111Fax: +61 2 9287 0303

Sha
reho
lder
info
rmat
ion
87
Corporate directoryDIRECTORS
Sir Henry van der Heyden, chairRichard DidsburyBrett Godfrey Michelle GuthrieJames MillerJustine SmythChristine SpringPatrick Strange
SENIOR MANAGEMENT
Adrian Littlewood, chief executivePhilip Neutze, chief financial officerRichard Barker, general manager retail and commercialNorris Carter, general manager aeronautical commercialAnna Cassels-Brown, general manager people and safetyJason Delamore, general manager marketing and technologyGraham Matthews, general manager airport development and deliveryJudy Nicholl, general manager aeronautical operationsMark Thomson, general manager property
REGISTERED OFFICE NEW ZEALAND
4 Leonard Isitt DriveAuckland Airport Business DistrictManukau 2022New Zealand
Phone: +64 9 275 0789Freephone: 0800 Airport (0800 247 7678)Facsimile: +64 9 275 4927Email: [email protected]: www.aucklandairport.co.nz
REGISTERED OFFICE AUSTRALIA
c/o KPMG147 Collins StreetMelbourneVictoria 3000Australia
Phone: +61 3 9288 5555Facsimile: +61 3 9288 6666Website: www.kpmg.com.au
MAILING ADDRESS
Auckland International Airport LimitedPO Box 73020Auckland AirportManukau 2150New Zealand
GENERAL COUNSEL & COMPANY SECRETARY
Scott Weenink
AUDITORS
External auditor – DeloitteInternal auditor – Ernst & YoungShare registry auditor – Grant Thornton
This annual report is dated 29 August 2016 and is signed on behalf of the Board by:
Sir Henry van der Heyden James MillerChair of the Board Director
insightcreative.co.nz
A
IAL0
86

88
Auckland International Airport Limited

89

Please recycle me
Online reportView our interactive report atreport.aucklandairport.co.nzIt has been designed for ease of online use, with tablets in mind.
aucklandairport.co.nz