Embed Size (px)
Citation preview

Page 1
INITIATION ON COVERAGE REPORT
MNC Sekuritas Research Division May 09, 2018
Please see important disclaimer at the back of this report
PT Arwana Citramulia Tbk (ARNA) Building Materials
Free Float : 48,70%
Ready to Take Off!
Source : Company, MNCS (as of May 09, 2018)
Significant Financial Performance Recovery in FY16-FY17 and 1Q18 ARNA's FY15 financial performance bottomed out, and since then has exhibited steady recovery, through FY16-FY17, supported by an appropriate product mix strategy and cost efficiency. This recovery is documented by a revenue increase of 17.03%/14.62% YoY and net income growth of 29.67%/33.56% YoY for FY16/FY17. ARNA booked a 12.06% YoY increase in revenue, from IDR441.48 billion in 1Q17 to IDR495.71 billion in 1Q18 as its Uno-Digi type products were at 50% level and ASP growth of 3.26% YoY. This 1Q18 revenue is in line, representing 26.49%/24.48% of MNCS/Consensus estimate. ARNA also successfully managed operational excellence and cost efficiency, and as a result operating margins peaked at 11.32%. Along with a satisfactory top line result, net profit grew by 6.64% QoQ to IDR39.45 billion, which reflects 26.83% of MNCS estimate. 2018: Time to Take Off We believe that the positive trend evinced in FY17 will continue throughout the year, supported by several catalysts, as follows: 1) Upgrading of ‘Sejuta Rumah’ program development, with a realization target of 906 thousand units in FY18E; 2) Production capacity increased to 63.37 million sqm/year with IDR150 billion in capex available; 3) Development of appropriate product mix composition, where the UNO-DIGI product composition trend rises from 15% in FY15 to 41% in FY17, predicted to be at a 43%/45% level by FY18E/FY19F; 4) A reset downward by the Government for gas prices has the potential to increase profitability, since gas added 29.50% to total Company production expenses in FY17. Massive Product Influx from China Becomes a Threat The ASEAN-China Free Trade Agreement (ACFTA) will impact local ceramic producers as imports of ceramics from China increase, following a cut in the import duty on ceramics, from 20% in FY17 to 5%, based on Regulation of Minister of Finance 06/PMK.010/2017. Recommendation: Initiation BUY at TP IDR450 We recommend BUY for ARNA with TP: IDR450, which implies PE/PBV 22.72x/3.17x on FY18E and 17.95x/3.03x on FY19F. The Company is currently trading at a level of -1 STD (average 3-year P/E) with P/E of 20.01x. We thus conclude that a appropriate product mix development strategy, supported by efficiency in gas usage, can boost ARNA margins.
Key Financial Highlight
In Billion IDR FY15 FY16 FY17 FY18E FY19F Revenues 1,291.93 1,511.98 1,732.99 1,881.93 2,085.73 EBITDA 185.28 232.35 289.30 329.52 391.39 Net Income 69.78 90.48 120.84 147.04 186.10 ROA (%) 4.88 5.86 7.55 8.79 10.43 ROE (%) 7.80 9.54 11.74 13.96 16.86 PER (x) 36.18 27.91 20.90 17.18 13.57 PBV (x) 2.82 2.66 2.45 2.40 2.29
www.mncsekuritas.id MNC Sekuritas 1-500-899 [email protected]
Research Analyst
Victoria Venny N.S. [email protected] (021) 2980 3111 ext. 52236
PT Suprakreasi Eradinamika
: 13.98%
Tandean Rustandy : 37.32%
Public : 48.70%
BUY
Stock Data
Target Price : IDR 450
Current Price : IDR 350
52wk Range : IDR 310-500
Share Outstanding : 7,341 mn
Mkt Capitalization : 2.52 tn
Major Shareholders

Initiation of Coverage Report | MNC Sekuritas Research Division
Page 2
Please see important disclaimer at the back of this report
www.mncsekuritas.id MNC Sekuritas 1-500-899 [email protected]
The Second-largest Ceramic Tiles Company in Indonesia, with an 18% Market Share in FY17E
ARNA is the second-largest ceramic producer in Indonesia, defending an 18% market share in FY17E, with an installed production capacity of 57.37/63.87 million sqm/year in FY17/FY18E, respectively. The Company’s Arwana Ceramic and UNO Ceramic Brands helped it secure a ranking in FY17 as one of the 14 major world ceramic manufacturers. In order to realize its vision as the best company in the ceramics industry, ARNA has steadily implemented product innovations, thus qualifying it for certificates such as ISO 9001, ISO 13006 and ISO 14001.
What to Watch?
Exhibit 01. List of Global Ceramic Manufacturer Rankings in FY17
Source: ARNA
No Company Country Production (million sqm)
Installed Capacity (million sqm)
Export Share
Plant Location Main Brands
1 Mohawk Indus-tries, Inc
USA 230-250 230-250 N.A. 17 in North America, Mexico, Europe, Rus-sia
American Olean, Dal Tile, KAI, Kerama Marazzi, Ragno
2 SCG Group Thailand 201 225 12 21 in Thailand, 7 in Vietnam, 4 in Indone-sia, 1 in the Philip-pines
Cotto, Prime, Mari-wasa, Sosuco, Cam-pana, Kia, DK, Trenf
3 Grupo Lamosa Mexico 130-150 180 26 10 in Mexico, 3 in Argentina, 3 in Co-lumbia, 1 in Peru
Lamosa, Porcelanite, Firenze, Italica, San Lorenzo, Cordillera
4 Rak Ceramics PJSC
UAE 82.5 113 47 10 in UAE, 4 in Bang-ladesh, China, India, Iran
RAK, Elegance
5 Muliakeramik Indahraya
Indonesia 77.9 80 3 8 in Indonesia Mulia
6 Ceramica Car-melo Fior
Brazil 76.8 84 15 4 in Brazil Cecafi, Pisoforte, Fio-ranno, Idealle, Arielle
7 Pamesa Spain 69.5 69.5 76.5 6 in Spain Pamesa Ceramica, TAU Ceramica, CTI, Foset, Geotiles, Navarti
8 Grupo Fragnani Brazil 65.5 72 9 3 in Brazil Incefra, Incenor, Tec-nogres, In Out
9 Kajaria Ceramics India 64 68.9 1 11 in India Kajaria
10 Cersanit SA Poland 61 N.A. 6 4 in Poland, 6 in Rus-sia, Romania, Ukraine, Germany
Cersanit, Opoczno, Meissen Keramik, MEI, Mito
14 Arwana Citramulia
Indonesia 50.4 57.4 0 5 in Indonesia Arwana

Initiation of Coverage Report | MNC Sekuritas Research Division
Page 3
Please see important disclaimer at the back of this report
www.mncsekuritas.id MNC Sekuritas 1-500-899 [email protected]
Focus on UNO-Digi Product Development
In addition to continuously upgrading product quality, ARNA constantly releases new products incorporating the latest technological innovations. By 2018, ARNA will not only focus on launching new Arwana type 25 cm x 50 cm ceramic products targeting the lower/middle market, it will also produce Uno-sized ceramics measuring 20 cm x 60 cm, targeting the upper-middle class. Uno-type products launched since 2011 have received a positive response from customers. Currently ARNA produces various Uno types in marble, rustic, wood, sinking ink and embossed fancy decorative varieties. In 2018, the UNO Digi product portion is estimated to reach 40-45% of its production volume, or 41% above the 2017 figure.
Exhibit 02. Various Uno-Digi Products
Source: ARNA

Initiation of Coverage Report | MNC Sekuritas Research Division
Page 4
Please see important disclaimer at the back of this report
www.mncsekuritas.id MNC Sekuritas 1-500-899 [email protected]
Company Background PT Arwana Citramulia Tbk (ARNA) is one of the largest ceramic tiles producers in Indonesia established in 1993. ARNA currently owns five plants managed by three subsidiaries, namely, PT Arwana Nuansakeramik, PT Sinar Karya Duta Abadi, and PT Arwana Anugerah Ceramik. ARNA has an extensive distribution network operating through subsidiary PT Primagraha Keramindo as the sole distributor, with more than 46 sub-distributors and 25,728 retailers spread across Indonesia. ARNA's business strategy focuses on the lower-middle segment of the market with a variety of quality ceramic products offered at affordable prices. The Company produces various sizes and varieties of ceramics to accommodate consumer needs. In capturing middle to upper segment market opportunities, in 2011 ARNA launched ‘UNO Ceramic Tiles’ brand premium-quality ceramic products.
Exhibit 03. ARNA Milestones
Source: ARNA, MNCS
2011Company introduced
new brand “UNO Ceramic Tiles”
2016Company started to
export
2001Company listed in
IDX
1993PT Arwana Citra
Mulia established
1995Company
operate officially
2011 - 2017Company awarded
Green Industry Awards Product Gold
Level
Exhibit 04. ARNA Corporate Structure
Source: ARNA
PT Primagraha Keramindo
65,0%
PT Arwana Anugerah Keramik
99,9%
PT Sinar Karya Duta Abadi
99,9%
PT Arwana Nuansakeramik
99,9%
PT Arwana Citramulia Tbk
PT Suprakreasi Eradinamika
13,98%
Tandean Rustandy, M.B.A.
37,32%
Public
48,70%

Initiation of Coverage Report | MNC Sekuritas Research Division
Page 5
Please see important disclaimer at the back of this report
www.mncsekuritas.id MNC Sekuritas 1-500-899 [email protected]
Supported by 5 plants with 90% utilization rate and extensive distribution network
ARNA began operating commercially in 1995, with an initial installed capacity of 2.88 million sqm/year. The Company has significantly increased its installed capacity over the years, to 57.37/63.87 million sqm/year in FY17/FY18E with a FY17 utilization rate of 89.65%, as well as average plant utilization of 87.19% during FY15-FY17. Currently ARNA is able to operate at an average rate of 90% against a national average of 65%. The Company has five plants, located in Tangerang, Cikande, Gresik, Palembang and Mojokerto. Plant I and Plant II with production capacity of 3.78/19.5 million sqm/year are located in Pasar Kemis, Tangerang and Cikande, Serang and thus serve markets in Western Indonesia more efficiently. Meanwhile, Plant III and Plant V, located in Gresik and Mojokerto, have a production capacity of 18.09/8.0 million sqm/year, respectively, and are designed to engage markets in the Eastern regions of Indonesia. Additionally, Plant IV located in Indralaya, Ogan Ilir is specifically aimed to serve the ceramic market in the southern region of the island of Sumatra, with a production capacity of 8 million sqm/year. In terms of marketing, the ARNA business is also facilitated by 46 sub-distributors and 25,728 retail outlets, spread all across Indonesian archipelago.
Exhibit 05. The Five Plants Owned by ARNA are spread across several regions of Indonesia
Source: ARNA
PLANT ITangerang, Banten
PLANT IISerang, Banten
PLANT IIIGresik, East Java
PLANT IVOgal Ilir, South Sumatra
PLANT VMojokerto, East Java

Initiation of Coverage Report | MNC Sekuritas Research Division
Page 6
Please see important disclaimer at the back of this report
www.mncsekuritas.id MNC Sekuritas 1-500-899 [email protected]
Offering a Superior-Quality Product Portfolio with a Variety of Styles and Sizes
ARNA’s creative and innovative measures aim to serve consumers through quality products that are affordable and produced by means of environmentally-friendly processes, whether in terms of the technology used as well as with respect to other operational aspects of the company. ARNA currently fields three types of products: ‘best deal’, ‘regular’, and ‘UNO-digi’ lines with design variations including marble, rustic, wood, sinking ink and embossed fancy decorative. Based on composition, best-deal, regular, and UNO-digi products each contributed 42%, 17% and 41% to revenue mix in FY17. The Company's technological capability enables it to customize variants of 20x20, 20x25, 25x25, 25x40, 30x30, 40x40, 25x50, 50x50, and 20x60 cm. ARNA also continues to offer the unique sales experience program in which the customers can determine their own choice of design, or custom design, thus providing a higher level of sense of belonging for Arwana’s loyal customers.
Exhibit 06. Distributor and Retail Outlet Network in FY17
Source: ARNA, MNCS
SUMATERADistributors : 11Outlets: 4.963
JAVA & BALIDistributors : 21Outlets: 16.876
KALIMANTANDistributors : 5Outlets: 2.546 SULAWESI
Distributors : 5Outlets: 1.312
MALUKU-PAPUADistributors : 3
Outlets: 76
Exhibit 07. Some ‘Arwana’ Brand Product Types
Source: ARNA Catalogue
Fancy Model Marble Model Granite, Strata and Rustic Model

Initiation of Coverage Report | MNC Sekuritas Research Division
Page 7
Please see important disclaimer at the back of this report
www.mncsekuritas.id MNC Sekuritas 1-500-899 [email protected]
Experienced Management and Human Resource Team
In the quest to assemble a superior human resources team, ARNA Management acknowledges the importance of the role of its human resources as a Company asset. The Company emphasizes enhancement of knowledge, skills and understanding, through implementation of training programs and career development, among others.
Exhibit 08. Sample Display of ‘Uno-Digi’ Type Products
Source: ARNA Catalogue
Exhibit 09. ARNA TOP Management
Source: ARNA, MNCS
Laksamana (Purn) Dr. Marsetio, M.M.
President Commissioner
Edwin PamimpinSitumorang, S.H., M.H.
Deputy President Commissioner
Drs. H. Karsanto, M.B.A.Independent
Commissioner
Prof. Dr. Ir. Alex S.W. Retraubun M.Sc.
Independent Commissioner
Tandean Rustandy, M.B.A.Chief Executive Officer
Edy Suyanto, S.E.Chief Operating Officer
Ir. Rudy SujantoChief Financial Officer &
Corporate Secretary
Mayjen TNI (Purn) HattaSyafrudin, S.H., M.Si.Independent Director

Initiation of Coverage Report | MNC Sekuritas Research Division
Page 8
Please see important disclaimer at the back of this report
www.mncsekuritas.id MNC Sekuritas 1-500-899 [email protected]
INDUSTRY OUTLOOK
All through 1H17 the ceramic industry was faced with sluggish market demand, persisting through 3Q17; thus, ceramic producers could supply consumers from the stock available in their warehouses. According to the Company, national average production capacity is still stuck at 60-70%. Per capita ceramic consumption in Indonesia is still below 2 sqm/year, a relatively low number compared to that of neighboring ASEAN countries, such as Vietnam (4.4 sqm/year) or Thailand (2.7 sqm/year). With government infrastructure, property and housing development programs, consumption of domestic ceramics is expected to increase dramatically.
Per Capita Ceramic Consumption in Indonesia is Below 2 Sqm/Year
Ceramic Industry is Still in a Challenging Era
Through 4Q17 the Indonesian ceramic industry was still experiencing severe challenges, with several producers suffering revenue downturns in FY17. PT Keramika Indonesia Asosiasi Tbk (KIAS) reports a 6.2% YoY drop in FY17 revenue, to IDR810 billion (vs IDR863 billion in FY16). PT Intikeramik Alamasri Industri Tbk (IKAI) reported a painful 84.10% YoY decline, to IDR13 billion in FY17 (vs IDR 83 billion revenue in FY16). However, other producers, such as PT Mulia Industrindo Tbk (MLIA) managed to record a 9% YoY increase in ceramics sales, to 84.9 million sqm/year in FY17 (vs 77.9 million sqm/year in FY16). Similarly, ARNA recorded a 12% YoY increase in FY17 sales volume to 51.8 million sqm/year (vs 46.4 million sqm/year in FY16) with a 33.5% YoY increase in net profit in FY17, to IDR120 billion (vs 29.7% YoY at IDR90 billion in FY16).
Exhibit 10. Performance of Domestic Ceramic Companies in FY17
Source: ARNA, Bloomberg, MNCS
Company Market Cap (IDR bn) PER (x) PBV (x) ROA (%) ROE (%)
ARNA 2,526 20.78 2.48 7.69 12.41
IKAI 2,161 - - -4.40 -5.60
KIAS - - - -4.45 -5.65
MLIA 893 15.79 0.43 0.74 2.82
Company Revenue FY17 (IDR bn)
Revenue Growth (YoY)
Net Income FY17 (IDR bn)
Net Income Growth (YoY)
Sales Volume (Sqm Mio)
ARNA 1,733 14.62% 121 33.50% 51.80
IKAI 13 -84.13% -44 70.00% NA
KIAS 810 -6.21% -79 13.10% NA
MLIA 6,277 8.34% 48 426.00% 84.90

Initiation of Coverage Report | MNC Sekuritas Research Division
Page 9
Please see important disclaimer at the back of this report
www.mncsekuritas.id MNC Sekuritas 1-500-899 [email protected]
Products Flood in from China vs. Safeguards
The massive import of products originating from China has become a challenge for local companies, in competing for market share. From FY15 to FY17 imported products increased 46.50% (1.26 million tones in FY17) with an average 21.1%/year increase in the volume of ceramic imports over the last three years (BPS figure) or 50 million sqm according to ASAKI (Indonesian Ceramic Association). Based on an Acimac Survey Dept. report in 2016, total national ceramic production reached 360 million sqm/year, while total consumption was 369 million sqm/year. However, a bright spot from the start of safeguards by KPPI (Indonesian Trade Safeguard Committee) and WTO starting March 29, 2018 will suppress the increasing import of ceramics that threaten to flood the national ceramics market today.
GROWTH PROSPECTS
Support from ‘Sejuta Rumah’ Program, while Property Sales are Still Weak
The Indonesian Government’s ‘Sejuta Rumah’ program has been running for three years, has been realizing accumulated development of 2.49 million units, with a targeted 906 thousand units in FY18E. ARNA believes that its 46 sub-distributors and 25,728 outlets sited in various areas can boost its product sales. ARNA plans to sign a MoU to support the ‘Sejuta Rumah’ Program in FY18, starting from Sulawesi, which we consider has a good prospect, as its GDP growth in FY17 reached 6.99%, higher than Indonesia’s national GDP growth of 5.07%. The Company has adhered to the regulations governing the ceramics industry, by which TKDN amounted to >68%. We believe by continuing the Government’s program for lower-middle-class property will be paralleled with the Company product expansion, with a subsidized interest rate of 5% and 20-year repayment time on property purchases for low-income society (MBR). The current total of residential property loans increased by 11.34% YoY in January 2018, so there is still optimism in the property sector. Survey data from BI (Bank Indonesia) reveals that plans to purchase a house/building are ‘very likely’ in the next 12 months increased in FY17 by 12.69% YoY to 7.1 points (vs 6.3 points in FY16), so there is a possibility of ARNA products being absorbed in the market, along with the revival of the property sector.
Focus on Building Capacity
The courage to become a familiar ceramic company can be seen from the expansion plan that will be undertaken by the Company to expand its two plants in FY19F-FY22F (Plant IV and Plant V) with a capex budget totaling IDR750 billion and total installed capacity reaching 75.73 million Sqm/year. On FY18E, production capacity will be increased to 63.37 million sqm/year with IDR150 billion in capex available. ARNA intends to fulfill demand coming from Sumatra Island and Eastern Indonesia region, which the Company considers good prospects. We believe that ARNA sales in FY18E are potentially upgraded, supported by: 1) Indonesian GDP growth in FY18E estimated at 5.1%-5.3%; 2) per capita income up by 8.19% to IDR51.89 million/year (vs IDR47.96 million/year in FY16).

Initiation of Coverage Report | MNC Sekuritas Research Division
Page 10
Please see important disclaimer at the back of this report
www.mncsekuritas.id MNC Sekuritas 1-500-899 [email protected]
Exhibit 11.Production Capacity Trend of PT Arwana Citramulia Tbk (‘000 Sqm)
Source: ARNA
2,800
7,490
10,775
12,040
17,370
22,400
27,400
34,280
40,870
41,370
49,370
57,370
63,370
69,370
75,370
- 10,000 20,000 30,000 40,000 50,000 60,000 70,000 80,000
FY95
FY97
FY02
FY04
FY05
FY06
FY07
FY09
FY10
FY11
FY15
FY16
FY18E
FY19F
FY20F
Capex : Rp750 Miliar
Shifting Focus toward Higher-Margin Products
Since 2011, ARNA has developed a proper product mix composition, in order to survive in the midst of a sluggish national ceramic market. Currently, the Company plans to increase product composition of UNO-Digi type, with added-value, to provide a superior gross profit margin of 28%. UNO-Digi product portion of production rose from 16% in FY15 to 41% in FY17. We estimate the UNO-Digi type products will rise to 43% in FY18E, while the ‘best buy’ product contribution dropped to 37%. We estimate that a 1% increase of UNO-Digi products has resulted in a 0.86% increase in gross profit, while a 1% increase in best buy products resulted in revenue slipping by 0.26%.
Exhibit 12. Focus on Developing a Product Mix with Higher Margins
Source: ARNA, MNCS
53% 50%42%
37%32%
31%
22%
17% 20% 23%
16% 28% 41% 43% 45%
FY15 FY16 FY17 FY18E FY19E
Best Buy Regular Uno-Digi
Initiation of Coverage Report | MNC Sekuritas Research Division
Page 11
Please see important disclaimer at the back of this report
www.mncsekuritas.id MNC Sekuritas 1-500-899 [email protected]
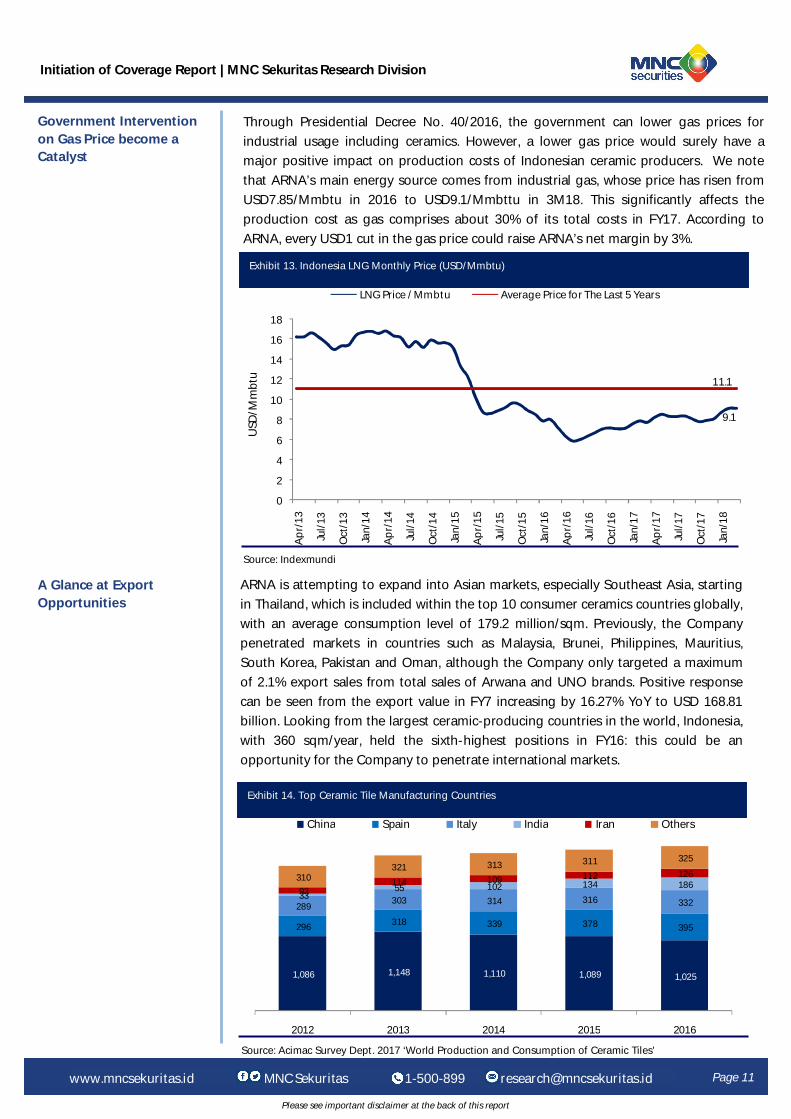
Government Intervention on Gas Price become a Catalyst
Through Presidential Decree No. 40/2016, the government can lower gas prices for industrial usage including ceramics. However, a lower gas price would surely have a major positive impact on production costs of Indonesian ceramic producers. We note that ARNA’s main energy source comes from industrial gas, whose price has risen from USD7.85/Mmbtu in 2016 to USD9.1/Mmbttu in 3M18. This significantly affects the production cost as gas comprises about 30% of its total costs in FY17. According to ARNA, every USD1 cut in the gas price could raise ARNA’s net margin by 3%.
Exhibit 13. Indonesia LNG Monthly Price (USD/Mmbtu)
Source: Indexmundi
0
2
4
6
8
10
12
14
16
18
Apr
/13
Jul/
13
Oct
/13
Jan/
14
Apr
/14
Jul/
14
Oct
/14
Jan/
15
Apr
/15
Jul/
15
Oct
/15
Jan/
16
Apr
/16
Jul/
16
Oct
/16
Jan/
17
Apr
/17
Jul/
17
Oct
/17
Jan/
18
USD
/Mm
btu
LNG Price / Mmbtu Average Price for The Last 5 Years
9.1
11.1
A Glance at Export Opportunities
ARNA is attempting to expand into Asian markets, especially Southeast Asia, starting in Thailand, which is included within the top 10 consumer ceramics countries globally, with an average consumption level of 179.2 million/sqm. Previously, the Company penetrated markets in countries such as Malaysia, Brunei, Philippines, Mauritius, South Korea, Pakistan and Oman, although the Company only targeted a maximum of 2.1% export sales from total sales of Arwana and UNO brands. Positive response can be seen from the export value in FY7 increasing by 16.27% YoY to USD 168.81 billion. Looking from the largest ceramic-producing countries in the world, Indonesia, with 360 sqm/year, held the sixth-highest positions in FY16: this could be an opportunity for the Company to penetrate international markets.
Exhibit 14. Top Ceramic Tile Manufacturing Countries
Source: Acimac Survey Dept. 2017 ‘World Production and Consumption of Ceramic Tiles’
1,086 1,148 1,110 1,089 1,025
296 318 339 378 395
289 303 314 316 332
33 55 102 134 186
93 114 109 112 126 310 321 313 311 325
2012 2013 2014 2015 2016
China Spain Italy India Iran Others

Initiation of Coverage Report | MNC Sekuritas Research Division
Page 12
Please see important disclaimer at the back of this report
www.mncsekuritas.id MNC Sekuritas 1-500-899 [email protected]
The import of ceramics is predicted to increase after the implementation of Regulation of the Minister of Finance No. 26/PMK.010/2017 concerning Stipulation of Import Duty Tariffs in the Framework of ASEAN-China Free Trade Area (ACFTA), marking just 5% and applicable from FY18E (vs 20% in FY17). Moreover, China ranks first as the largest ceramic-exporting country with 36.69% of the world's total exports in FY16. Surely this is poses threat to local ceramic producers. Meanwhile, countries in Europe are tending to impose tariffs on imports from China, Vietnam, and India, at an average of 30-40%, in order to defend the continuity of their local ceramics producers.
INVESTMENT RISK
Massive Flood of Products from China Poses a Threat
Exhibit 15. Top Ceramic Tile Exporting Countries
Source: Acimac Survey Dept. 2017 ‘World Production and Consumption of Ceramic Tiles’
5,200 5,700 6,000 5,970
6,495
691 750
825 850
955
866
871 903 899
792
404
420 425 440
492
290
300 360 440
485
367
363 382 395
416
360
390 420 370
360
500
500 410 300
340
280
340 315 320
330
231
230 230 245
267
2012 2013 2014 2015 2016
China India Brazil Spain Vietnam Italy Indonesia Iran Turkey Mexico
However, we believe that the drastically-reduced import duty on Chinese ceramics will not exert a significant impact on the sustainability of ARNA business, because: 1) Chinese imported products are ‘homogenous tiles’ that can only absorb around 1% of water, in contrast with ceramic that absorbs around 6%; 2) ARNA has a middle and lower-middle class segmentation, while middle-class Chinese products are upward; 3) Chinese types of manufactured and imported ceramic products are not similar to those of ARNA; 4) ARNA has an ASP of approximately USD2.4 while Chinese products carry a higher selling price.

Initiation of Coverage Report | MNC Sekuritas Research Division
Page 13
Please see important disclaimer at the back of this report
www.mncsekuritas.id MNC Sekuritas 1-500-899 [email protected]
The Sluggish Growth of National Property Impacts on Ceramic Demand
Property industry growth was persistently sluggish over the past 5 years, as seen in average residential property sales (BI survey) were stuck at 15.10%. 1Q16 was the most difficult, as sales were recorded at just 1.51% QoQ; they rose to 3.05% QoQ in 4Q17. We suggest the decline in sales seen in 3Q14, during the 2014 Presidential election, may occur again during the 2019 election period. Recovery from this weak trend was helped by Government policy in loosening the Loan-to-Value rule from 80% to 85%, applying low interest rates, and launching their ‘Sejuta Rumah’ Program. The level of national ceramic consumption revealed a downward trend in FY14-FY16 with 407, 357 and 369 million sqm/year, respectively, when the Indonesian ceramic consumption also decreased from 4th position to 5th in FY16.
Exhibit 16. Residential Property Sales Growth (QoQ)
Source: BI.go.id
25.63%
18.08%
39.80%
13.05%
15.33%
36.65%
33.69%
40.07%
26.62%
10.84%
7.66%6.02%
1.51%
4.02% 4.65%5.06% 4.16% 3.61%
2.58%3.05%
15.10%
0.00%
5.00%
10.00%
15.00%
20.00%
25.00%
30.00%
35.00%
40.00%
45.00%
1Q13 2Q13 3Q13 4Q13 1Q14 2Q14 3Q14 4Q14 1Q15 2Q15 3Q15 4Q15 1Q16 2Q16 3Q16 4Q16 1Q17 2Q17 3Q17 4Q17
Average Growth of Sales for All Building Types Average Growth of Sales for the Last Five (5) Years
We ascertain the Company's financial performance bottomed out in FY15, following which it recovered in FY16, amid a slowdown in the property sector. The combination of appropriate product mix composition and a successful efficiency drive enabled Company performance to start to show significant progress, as demonstrated by successful revenue growth of 17.03%/14.62% YoY to IDR1.51 trillion/IDR1.73 trillion in FY16/FY17 (vs IDR1.29 trillion in FY15). Net income grew significantly, by 29.67%/33.56% YoY to IDR90.48/IDR120.84 billion in FY16/FY17 after previously suffering a 73% YoY decrease in net profit in FY15.
FINANCIAL PERFORMANCE AND PROJECTION
FY16-FY17 Performance Shows Significant Recovery

Initiation of Coverage Report | MNC Sekuritas Research Division
Page 14
Please see important disclaimer at the back of this report
www.mncsekuritas.id MNC Sekuritas 1-500-899 [email protected]
1Q18 Performance: Revenue Increased 12.06% YoY in line with ASP
In 1Q18, the Company revenues were recorded at IDR495.71 billion, for an increase of 12.06% YoY (vs IDR441.48 billion in 1Q17), in line with increase in the percentage of Uno-Digi type products at 50%, and a 3.26 % YoY increase in ASP. This is consistent with the MNCS estimate, which represents 26.49%/24.48% of the MNCS/Consensus estimate.
ARNA also managed to maintain operational performance and cost efficiency, holding their operating margin at a level of 11.32%. Meanwhile, net income was recorded at IDR39.45 billion, an increase of 6.64% QoQ, which reflects 26.83%/15.53% of MNCS/Consensus estimates.
Exhibit 17. 1Q18 Financial Results
Source: ARNA, Bloomberg, MNCS
We look to positive growth in sales volume and ASP to sustain ARNA's performance throughout FY18E. ARNA recorded significant revenue growth in FY17, supported by the closure of several small-scale ceramic producers falling victim to higher production costs. We estimate FY18E ARNA revenue to grow by 8.59% YoY to IDR1.88 trillion, in line with the management target, at a level of 8.60%. Sales volume is predicted to increase by 5.63% to reach 54.69 million sqm/year (vs 51.78 million sqm/year in FY17). In addition, ASP/sqm is likely to rise by 2.76% YoY in FY17, in line with changes in product mix strategy. We estimate ASP/sqm will grow ~3% in FY18E, in line with management projections.
Sales Volume and ASP Growth Continue to Support the Performance in FY18E
IDR Billion 1Q17 4Q17 1Q18 QoQ YoY FY18E Consensus
FY18E MSEC
%Consensus
% MSEC
Sales 441 466 495 6% 12% 2,021 1,882 24% 26%
COGS 325 353 379 7% 16%
Gross Profit 116 113 116 3% 0% 502 468 23% 25%
Gross Profit Margin
26% 24% 23%
Income from Operations
59 56 56 0% -5%
EBIT Margin 13% 12% 11%
PBT 53 52 53 2% 0% 341 202 16% 26%
Net Profit 39 37 39 7% 0% 254 147 16% 27%
Net margin 9% 8% 8%
EBITDA 84 84 84 0% -1% 480 330 17% 25%
EBITDA Margin 19% 18% 17%
Total Sales ('000 sqm)
13,155 13,784 14,274 4% 9%

Initiation of Coverage Report | MNC Sekuritas Research Division
Page 15
Please see important disclaimer at the back of this report
www.mncsekuritas.id MNC Sekuritas 1-500-899 [email protected]
Exhibit 18. Sales Volume and Positive ASP Trend
Source: ARNA, Bloomberg, MNCS
-5.00%
0.00%
5.00%
10.00%
15.00%
20.00%
25.00%
30.00%
0
10,000
20,000
30,000
40,000
50,000
60,000
70,000
FY15 FY16 FY17 FY18E FY19E
Sales Volume ('000 sqm) ASP growth Gross Profit Margin
Efficiency of Gas Expected to Increase Profitability
We believe that the efficiency of using gas to fire kilns should increase ARNA’s profitability. ARNA has already succeeded in reducing the gas consumption rate from 1.92 Nm3/sqm in FY16 to 1.77 Nm3/sqm in FY17, supported by a decrease in defective product output, from an average of 3.54% to 1.45%, thanks to their maximum maintenance program.
1.96 1.93
1.771.71
1.76 1.74 1.73
1
1.2
1.4
1.6
1.8
2
FY15 FY16 FY17 Target FY18E
Jan-18 Feb-18 Mar-18
Exhibit 20. Reject Rate
Source: ARNA
Exhibit 19. Gas Usage Per Square Meter Production (Nm3/m2)
Source: ARNA
5.50%
3.54%
1.45% 1.57% 1.39%1.67%
0%
1%
2%
3%
4%
5%
6%
FY15 FY16 FY17 Jan-18 Feb-18 Mar-18

Initiation of Coverage Report | MNC Sekuritas Research Division
Page 16
Please see important disclaimer at the back of this report
www.mncsekuritas.id MNC Sekuritas 1-500-899 [email protected]
In the context of a besieged local ceramics industry fighting a flood of imported products, ARNA has been able to pay dividends of IDR12/share, equivalent to a dividend payout ratio of 72.90%, higher than the last three years’ average of 55.35%. The fatter dividend payout ratio stands as one of the attractions for investors to hold this stock. We believe the Company will maintain a dividend payout ratio of 73%, supported by the positive growth of ARNA business over the next few years.
Dividend Player: 55% Dividend Payout ratio for 3 years
Exhibit 22.Dividend Payout Ratio Trend FY10-FY17
Source: ARNA, Bloomberg, MNCS
38.43 38.75
46.9249.95
33.95
52.58
40.57
72.90
2010 2011 2012 2013 2014 2015 2016 2017
Expect Strong Margin in FY18E
We believe that a combination of sales volume and ASP increased, supported by the efficiency, can boost the ARNA’s bottom line. While COGS/sqm is projected to grow by 0.77% YoY, we believe ARNA is able to implement efficiency by maintaining Gross Profit Margin at 24.88% level in FY18E and 26.39% in FY19F. We estimate Operating Profit in FY18E at IDR220 billion, with a margin maintained at 11.69%. Meanwhile, EBITDA margin will still be at a level of 17.51%-18.77% in FY18E to FY19F, followed by Net Income margin held at 7.81%-8.92% in FY18E-FY19F.
0.00%
5.00%
10.00%
15.00%
20.00%
25.00%
30.00%
-
20
40
60
80
100
120
140
160
180
200
FY15 FY16 FY17 FY18E FY19E
Net Profit (IDR Billion) Gross Profit Margin Net Profit Margin
Exhibit 21. Better Performance on FY18E-FY19F
Source: ARNA, MNCS

Initiation of Coverage Report | MNC Sekuritas Research Division
Page 17
Please see important disclaimer at the back of this report
www.mncsekuritas.id MNC Sekuritas 1-500-899 [email protected]
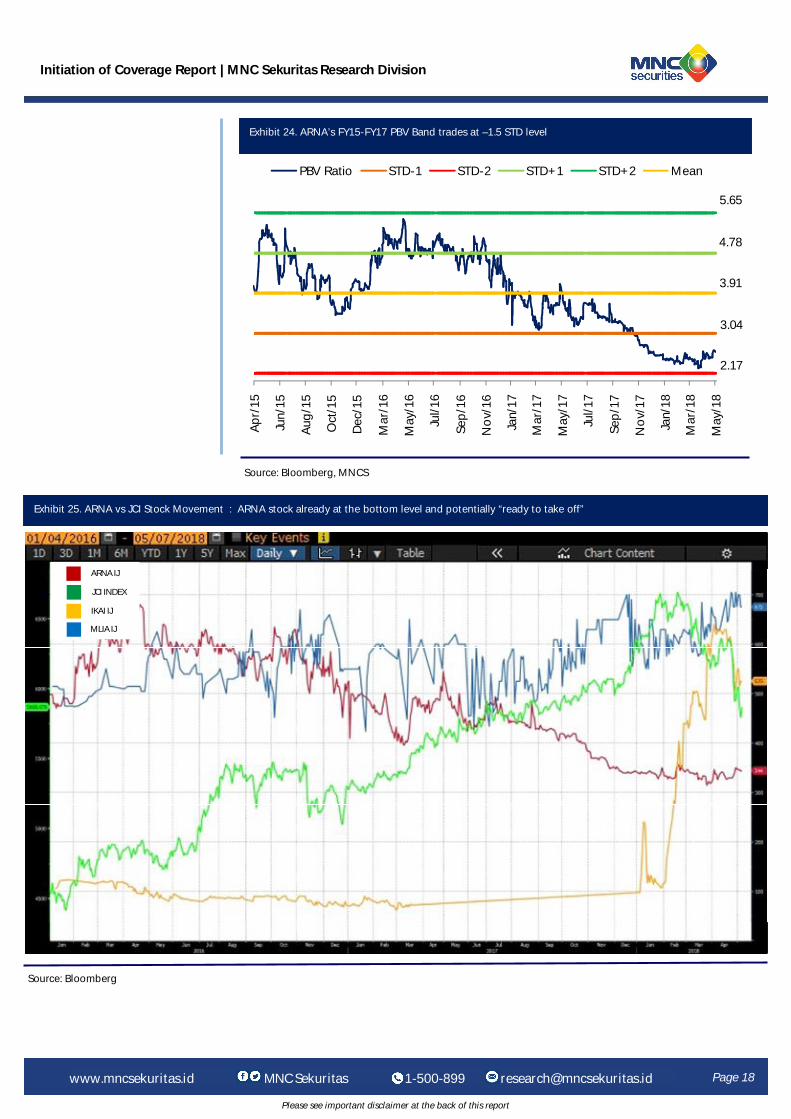
We use Discounted Cash Flow (DCF) to estimate the target price of ARNA with 2017 financial figure components as our basic assumptions of our valuation forecast. We use 3% as terminal growth and WACC at 10.44%. We recommend BUY for ARNA with TP: IDR450 which implies PE/PBV 22.72x/3.17x on FY18E and 17,95x/3.03x on FY19F. The Company is currently trading at a level of -1 STD (average 3-year P/E) with P/E of 20.01x. While PBV is trading at a level of –1.5 STD (average 3-year PBV) with PBV of 2.63x. We believe the prices offered for ARNA are based on various catalysts such as: 1)Upgrading of ‘Sejuta Rumah’ program development, with a realization target of 906 thousand units in FY18E; 2) Production capacity increased to 63.37 million sqm/year with IDR150 billion in capex available; 3) Development of appropriate product mix composition, where the UNO-DIGI product composition trend rises from 15% in FY15 to 41% in FY17, predicted to be at a 43%/45% level by FY18E/FY19F; 4) A reset downward by the Government for gas prices has the potential to increase profitability, since gas added 29.50% to total Company production expenses in FY17; 5) Better performance on FY18E with 8.59% YoY revenue growth and 21.68% YoY net profit growth
Recommendation: BUY with Target Price IDR450
Exhibit 23. ARNA’s FY15-FY17 P/E Band trades close to -1 STD level
Source: Bloomberg, MNCS
Apr/
15
Jun/
15
Aug/
15
Oct
/15
Dec
/15
Mar
/16
May
/16
Jul/1
6
Sep/
16
Nov
/16
Jan/
17
Mar
/17
May
/17
Jul/1
7
Sep/
17
Nov
/17
Jan/
18
Mar
/18
May
/18
PE Ratio Mean STD-1 STD-2 STD+1 STD+2
40.13
19.78
80.82
60.47
-0.57
Initiation of Coverage Report | MNC Sekuritas Research Division
Page 18
Please see important disclaimer at the back of this report
www.mncsekuritas.id MNC Sekuritas 1-500-899 [email protected]
Exhibit 24. ARNA’s FY15-FY17 PBV Band trades at –1.5 STD level
Source: Bloomberg, MNCS
5.65
Apr/
15
Jun/
15
Aug/
15
Oct
/15
Dec
/15
Mar
/16
May
/16
Jul/1
6
Sep/
16
Nov
/16
Jan/
17
Mar
/17
May
/17
Jul/1
7
Sep/
17
Nov
/17
Jan/
18
Mar
/18
May
/18
PBV Ratio STD-1 STD-2 STD+1 STD+2 Mean
3.91
4.78
2.17
3.04
Exhibit 25. ARNA vs JCI Stock Movement : ARNA stock already at the bottom level and potentially “ready to take off”
Source: Bloomberg
ARNA IJ
JCI INDEX
IKAI IJ
MLIA IJ

Please see important disclaimer at the back of this report
Company Visit Report | MNC Sekuritas Research Division
Page 5
Please see important disclaimer at the back of this report
www.mncsecurities.com MNC Sekuritas 1-500-899 [email protected]
Page 19
Please see important disclaimer at the back of this report
Exhibit 22. Financial Projection
Initiation of Coverage Report | MNC Sekuritas Research Division
www.mncsekuritas.id MNC Sekuritas 1-500-899 [email protected]
Income Statement Balance Sheet
Source : Company, MNCS
Cash Flow Ratios
IDR Billion FY15 FY16 FY17 FY18E FY19F
Revenues 1,291.93 1,511.98 1,732.99 1,881.93 2,085.73
COGS (1,003.84) 1,182.89) (1,328.19) (1,413.65) (1,535.38)
Gross Profit 288.09 329.09 404.80 468.28 550.35
Operating Expense (178.52) (195.03) (221.58) (248.23) (275.19)
Selling Expenses 137.71 148.24 166.01 189.23 209.39
General and Administrative 40.81 46.79 55.57 59.00 65.80
Operating Profit 109.57 134.06 183.21 220.05 275.16
EBITDA 185.28 232.35 289.30 329.52 391.39
Other Income (Expenses) - (29.31) 3.53 - -
Interest Income - - 0.20 - -
Other - (29.31) 3.53 - -
Profit Before Tax 95.51 123.84 166.22 201.85 254.98
Tax Expense (24.30) (32.46) (44.02) (53.46) (67.53)
Net Income Before MI 71.21 91.38 122.20 148.39 187.45
Minority Interest 1.43 0.89 1.35 1.35 1.35
Net Income 69.78 90.48 120.84 147.04 186.10
EPS (full amount) 9.51 12.32 16.46 20.03 25.35
IDR Billion FY15 FY16 FY17 FY18E FY19F
CFO Total 251.96 (34.24) 144.74 223.14 256.89
Net Income 69.78 90.48 120.84 147.04 186.10
Depreciation 75.71 98.29 106.09 109.47 116.24
Change in Working Capital
(0.99) (115.02) (42.24) (41.34)
(56.34)
Change in others 107.46 (107.99) (39.95) 7.96 10.89
CFI Total (244.83) (77.02)
(66.92) (52.36)
(103.23)
Change in ST Investment - - - - -
Change in LT Investment - - - - -
Capex (224.30) (72.20) (81.10) (50.00) (100.00)
Change in Others (20.54) (4.82) 14.18 (2.36) (3.23)
CFF Total 125.27 183.95 107.26 (98.22) (104.38)
Net Change in Debt 36.33 136.74 5.21 19.92 24.67
Equity financing - 0 - - -
Dividend payment 88.10 36.69 88.10 (107.19) (135.67)
Others 0.84 10.09 13.96 (10.95) 6.62
Net Cash Increase (42.13) (1.94) 56.37 72.56 49.28
Closing Balance 5.10 3.17 59.53 132.09 181.37
Ratio FY15 FY16 FY17 FY18E FY19F
Revenue Growth (%) (19.74) 17.03 14.62 8.59 10.83
Operating Profit Growth (%) (68.45) 22.35 36.67 20.11 25.04
Net Profit Growth (%) (73.59) 29.67 33.56 21.68 26.56
Current Ratio (%) 102.07 134.88 162.63 177.26 184.76
Quick Ratio (%) 85.23 99.58 129.63 144.61 152.47
Receivable Days 116.28 111.27 111.14 111.14 111.14
Inventory Days 30.54 51.92 41.28 41.28 41.28
Payable Days 18.56 48.87 43.73 44.13 44.14
Debt to Equity (x) 0.60 0.63 0.56 0.59 0.62
Net Debt to EBITDA (x) 2.89 2.56 1.98 1.88 1.74
Gross Profit Margin (%) 22.30 21.77 23.36 24.88 26.39
Operating Profit Margin (%) 8.48 8.87 10.57 11.69 13.19
EBITDA Margin (%) 14.34 15.37 16.69 17.51 18.77
Net Income Margin (%) 5.40 5.98 6.97 7.81 8.92
ROA(%) 4.88 5.86 7.55 8.79 10.43
ROE(%) 7.80 9.54 11.74 13.96 16.86
IDR Billion FY15 FY16 FY17 FY18E FY19F
Current Assets 509.18 642.89 740.19 868.00 993.43
Cash and Cash Equivalents 5.10 3.17 59.53 132.09 181.37
Trade Receivable 411.57 460.91 527.66 573.01 635.07
Inventories 83.99 168.27 150.20 159.87 173.63
Others current Assets 8.52 10.55 2.79 3.03 3.36
Non-Current Assets 921.60 900.32 861.16 804.04 791.03
Fix Asset - net 1,417.97 1,488.66 1,568.50 1,618.50 1,718.50
Other Non-Current Assets 36.81 41.63 27.45 29.81 33.04
TOTAL ASSETS 1,430.78 1,543.22 1,601.34 1,672.04 1,784.47
Current Liabilities 498.86 476.63 455.15 489.67 537.68
Account Payable 187.56 206.15 212.60 226.28 245.77
Short Term Debt 62.22 127.35 147.13 159.78 177.08
Other current liabilities 249.08 143.13 95.42 103.62 114.84
Non-Current Liabilities 37.19 118.50 116.79 128.90 142.89
Long-term Liabilities - Net 3.46 75.07 60.50 67.77 75.14
Other Non-Current Liabili-ties
33.73 43.43 56.29 61.13 67.75
TOTAL EQUITY 894.73 948.09 1,029.40 1,053.46 1,103.89
TOTAL LIABILITIES & EQUITY 1,430.78 1,543.22 1,601.34 1,672.04 1,784.47

Disclaimer This research report has been issued by PT MNC Sekuritas, It may not be reproduced or further distributed or published, in whole or in part, for any purpose. PT MNC Sekuritas has based this document on information obtained from sources it believes to be reliable but which it has not independently verified; PT MNC Sekuritas makes no guarantee, representation or warranty and accepts no responsibility to liability as to its accuracy or completeness. Expression of opinion herein are those of the research department only and are subject to change without notice. This document is not and should not be construed as an offer or the solicitation of an offer to purchase or subscribe or sell any investment. PT MNC Sekuritas and its affiliates and/or their offices, director and employees may own or have positions in any investment mentioned herein or any investment related thereto and may from time to time add to or dispose of any such investment. PT MNC Sekuritas and its affiliates may act as market maker or have assumed an underwriting position in the securities of companies discusses herein (or investment related thereto) and may sell them to or buy them from customers on a principal basis and may also perform or seek to perform investment banking or underwriting services for or relating to those companies.
Page 20
Initiation of Coverage Report | MNC Sekuritas Research Division
www.mncsekuritas.id MNC Sekuritas 1-500-899 [email protected]
MNC SEKURITAS RESEARCH TEAM
PT MNC SEKURITAS MNC Financial Center Lt. 14 – 16
Jl. Kebon Sirih No. 21 - 27, Jakarta Pusat 10340 Telp : (021) 2980 3111 Fax : (021) 3983 6899
Edwin J. Sebayang Head of Retail Research, Technical, Auto, Mining [email protected] (021) 2980 3111 ext. 52233
I Made Adi Saputra Head of Fixed Income Research [email protected] (021) 2980 3111 ext. 52117
Victoria Venny Telco, Toll Road, Logistics, Consumer, Poultry [email protected] (021) 2980 3111 ext. 52236
Rr. Nurulita Harwaningrum Banking, Auto, Plantation [email protected] (021) 2980 3111 ext. 52237
Tomy Zulfikar Research Analyst [email protected] (021) 2980 3111 ext. 52316
Krestanti Nugrahane Widhi Research Associate, Plantation, Consumer [email protected] (021) 2980 3111 ext. 52166
Thendra Crisnanda Head of Institutional Research, Strategy [email protected] (021) 2980 3111 ext. 52162
Gilang Anindito Property, Construction, Mining, Media [email protected] (021) 2980 3111 ext. 52235
Rheza Dewangga Nugraha Junior Analyst of Fixed Income [email protected] (021) 2980 3111 ext. 52294
MNC Research Investment Ratings Guidance BUY : Share price may exceed 10% over the next 12 months
HOLD : Share price may fall within the range of +/- 10% of the next 12 months SELL : Share price may fall by more than 10% over the next 12 months
Not Rated : Stock is not within regular research coverage
MNC SEKURITAS EQUITY SALES TEAM
T. Heldy Arifien Head of High Networth [email protected] (021) 2980 3111 ext. 52310
Okhy Ibrahim Senior Equity Institutional Sales [email protected] (021) 2980 3111 ext. 52180
Nesya Kharismawati Senior Equity Institutional Sales [email protected] (021) 2980 3111 ext. 52182
Harun Nurrosyid Senior Equity Institutional Sales [email protected] (021) 2980 3111 ext. 52187
Gilang Ramadhan Senior Equity Institutional Sales [email protected] (021) 2980 3111 ext. 52178
Iman Hadimulya, ST Senior Equity Institutional Sales [email protected] (021) 2980 3111 ext. 52174
Agus Eko Santoso Senior Equity Institutional Sales [email protected] (021) 2980 3111 ext. 52185
Muhamad Fauzan Saputra Junior Equity Sales [email protected] (021) 2980 3111 ext. 52150
Paksi Jaladara Junior Equity Sales [email protected] (021) 2980 3111 ext. 52173
M. Rudy Setiawan Research Associate, Construction [email protected] (021) 2980 3111 ext. 52317
Khazar Srikandi Research Associate [email protected] (021) 2980 3111 ext. 52313
Sukisnawati Puspitasari Research Associate, Cement, Mining [email protected] (021) 2980 3111 ext. 52307