Embed Size (px)
Citation preview
Journal of AI and Data Mining
Vol 5, No 1, 2017, 79-88 DOI: 10.22044/jadm.2016.782
Artificial neural networks, genetic algorithm and response surface
methods: The energy consumption of food and beverage industries in Iran
B. Hosseinzadeh Samani*, H. Houri Jafari2 and H. Zareiforoush3
1. Dept. of Mechanics of Biosystems Engineering, Faculty of Agriculture, Shahrekored University, Shahrekord, Iran.
2 .International Institute of Energy Studies, Tehran, Iran.
3. Dept. of Mechanization Engineering, Faculty of Agricultural Sciences, University of Guilan, , Rasht, Iran.
Received 16 March 2016; Accepted 10 October 2016
*Corresponding author: [email protected] (B. Hosseinzadeh Samani).
Abstract
The energy consumption in food and beverage industries in Iran was investigated. The energy consumption in
this sector was modeled using artificial neural network (ANN), response surface methodology (RSM) and
genetic algorithm (GA). First, the input data to the model were calculated according to the statistical source,
balance-sheets and the method proposed in this paper. It can be seen that diesel and liquefied petroleum gas have
respectively the highest and lowest shares of energy consumption compared with the other types of carriers. For
each of the evaluated energy carriers (diesel, kerosene, fuel oil, natural gas, electricity, liquefied petroleum gas
and gasoline), the best fitting model was selected after taking the average of runs of the developed models. At
last, the developed models, representing the energy consumption of food and beverage industries by each energy
carrier, were put into a finalized model using Simulink toolbox of Matlab software. The results indicated that
consumption of natural gas is being increased in Iranian food and beverage industries, while in the case of fuel
oil and liquefied petroleum gas a decreasing trend was estimated.
Keywords: Artificial Neural Network, Energy, Food Industry, Modeling.
1. Introduction
In all of the societies, in order to plan to supply the
required energy for the different consuming sectors,
it is necessary to predict the demand properly
according to the type of energy carriers. In this
regard, one of the issues that has become more
important nowadays is energy security. This aspect
is usually defined as reliable and adequate energy
supply at affordable prices. For many decades,
energy security has been of the most important
objectives of public policy. It has been sometimes
discussed with other important goals such as
economic development and environmental
protection, and at times, it has been a competitor for
these goals. This issue is more important than the
global economy, because energy is one of the key
factors for all of the economic projects.
Development of prediction models along with
organizing appropriate tariff structure is important
stages in macro programming for achieving
sustainable energy supply, economic development
and social welfare. Nowadays, in addition to
traditional economic view to the energy sector, the
social, political, security and environmental
considerations have raised the importance of studies
in this sector. The study of demands for energy and
energy carriers can be carried out based on various
models. Considering the importance of models in
prediction and evaluation of energy demand in
different countries, and also the importance of
surveying the demands in economic development
and optimization of energy distribution in different
sub-sectors, the study of the different models and
selection of the best method for modeling is one of
the essential parts of each management systems [1].
Hosseinzadeh et al./ Journal of AI and Data Mining, Vol 5, No 1, 2017.
80
Energy is one of the most important production
inputs in each country and plays an important role
in the world economic interactions. For this reason,
many of international institutes around the world try
to model the energy demand and supply system and
also predict their relation for the future years [2].
The first edition of OPEC World Energy Model
(OWEM) was rendered to OPEC secretariat in 1981
(about 33 years ago). This model was constructed in
University of South California (USC). The initial
complexities associated with this model caused
several problems for scientific evaluation and
gathering the required statistics. Therefore, this
model was reconsidered by the OPEC secretariat in
1984 [3].
The MESSAGE model, an alternative model for
energy supply systems, is an optimizing model that
is utilized for medium-term and long-term planning,
energy policies analysis, and scenarios
development. This model has been formed from the
energy systems program (IIASA) in 70s. The
MESSAGE model finds optimal energy flow from
first resources to final demands, which are
mathematically reasonable, and offers a
combination of possible supply choices with least
cost capable of complying energy demands. The
feasibility of achievement to choices is guaranteed
by matching the energy flow with model limitations
regarding to initial extraction of energy, energy
conversion and transportation, as well as final
consumption technologies. These energy flows are
determined in turn according to limitations that are
existed on gradual creation of new capacities,
substitution of energy carriers, and restoration of
energy resources [4-6].
Soft computing is an innovative method for
development of intelligent systems attracted
increasing interest by the scientific communities
during the past few decades. It has been stated that
utilization of the machine vision and artificial
intelligence can result in increased quality of the
product, abolish inconsistent manual evaluation, and
reduce dependence on available manpower [7].
Review of the literature indicated that ANN has
been successfully used in different branches of
medicine [8], mathematics [9], engineering, [7] etc.
ANNs have also been applied for energy prediction
and estimation purposes in different sectors of
demand and supply [10-18].
The wide application of ANNs in these areas is the
method’s ability to help researchers in designing
and developing predictive models for estimating
importance indices with high accuracy and
reliability [18].
An artificial neural network model was developed
to relate the electric energy consumption in the
Eastern Province of Saudi Arabia to the weather
data (temperature and humidity), global solar
radiation and population [10].
Azadeh et al., (2008) showed the advantage of the
ANN approach through analysis of variance
(ANOVA). Furthermore, the ANN forecast is
compared with actual data and the conventional
regression model through ANOVA to show its
superiority [16].
Ekonomou and Oikonomou (2008) described an
artificial neural network method for the forecasting
of the daily Hellenic electricity demand load. Actual
input and output data collected from the Hellenic
power network were used in the training, validation
and testing process [19].
Szoplik (2015) was presented the results of
forecasting of the gas demand obtained with the use
of artificial neural networks. Design and training of
MLP (multilayer perceptron model) was carried out
using data describing the actual natural gas
consumption in Szczecin (Poland). In the model,
calendar (month, day of month, day of week, hour)
and weather (temperature) factors, which have a
pronounced effect on gas consumption by
individual consumers and small industry, were
considered [18].
The objective of this research was to combine
artificial neural networks, response surface
methodology and Genetic algorithm as novel
approaches for modeling the energy demand in
different sectors of food and beverage industries of
Iran in dissociation of energy carriers.
2. Material and methods
2.1. Source of study
The first stage in development of the prediction
model was to assemble and calculation of input
variables. For this purpose, six sources were
utilized:
Hydrocarbure balance sheet of the Ministry of
Petroleum of Iran
Energy Balance Sheet of the Ministry of
Energy of Iran
Economic statistics and national accounts
system, Central Bank of the Islamic Republic
of Iran
Output and data table works sheets provided by
the Statistical Center of Iran (2001)
Hosseinzadeh et al./ Journal of AI and Data Mining, Vol 5, No 1, 2017.
81
Output and data table based on the supplied
energy reported by Electricity and Energy
Deputy Ministry of Energy of Iran
The census prepared by Statistical Center of
Iran for industrial workshops with 10
employees and more
In order to obtain the share of each subsector in
dissociation of carriers, Iran economy consumption
table was used in dissociation of market and non-
market purchasers. The information in dissociation
of market producers and consumers was extracted
from the table in terms of purchaser price. Then, the
share of each activity was calculated by the
following equations:
ij
j
i
ca
A (1)
1
i ij
j
A c
(2)
where ci is share of each sector of energy carrier, aij
is purchaser price of each energy carrier subsector,
Ai is total purchase price of each energy carrier
subsector.
The other source used in this study was results of
census performed by Statistical Center of Iran in the
case of industrial workshops with 10 or more than
10 labors. Since the reports on total energy
consumption values in the case of industrial sector
was not consistent with the corresponding reported
values by hydrocarbure balance sheet, only the
share of each subsector of industrial applications in
total energy consumption of industry was
considered as evaluation criterion. At last, the share
of each activity was obtained by averaging the three
values (reports of census performed in industrial
workshops with 10 employees and more, the output
and data table of 2001 and 2006). These cause to
use the three data for estimating the final share of
each activity of energy carriers. In some carriers,
the variation range of data is wide which cause the
averaging method to be not sufficient and another
condition is required for data monitoring. For
solving this problem, the standard deviation of the
three data was calculated. The differences between
the three values were obtained separately from the
average value. By comparing the differences with
the standard deviation, the data that might be larger
than standard deviation was considered as outlier
data and was deleted from the table.
Finally, the share of food and beverage industries
from energy carriers was determined. Then,
according to the hydrocarbure balance sheet of
ministry of petroleum and the consumption share of
the mentioned industries from energy carriers, the
amount of energy consumption of each activity was
determined. It is necessary to mention that since the
three resources were evaluated in three different
times. This is because the difference between the
shares for energy carriers was negligible in the case
of the three evaluated resources, it can be deduced
that the industries share of energy consumption was
approximately constant over the time.
Consequently, in this paper, the time series of
energy consumption were estimated assuming a
constant share for the mentioned industries over the
years.
2.2. Artificial neural network (ANN)
In this study, a multi-layer perceptron (MPL) in
which all of the neurons were connected to each
other was utilized. This model is widely used in
nonlinear modeling due to its simplicity and high
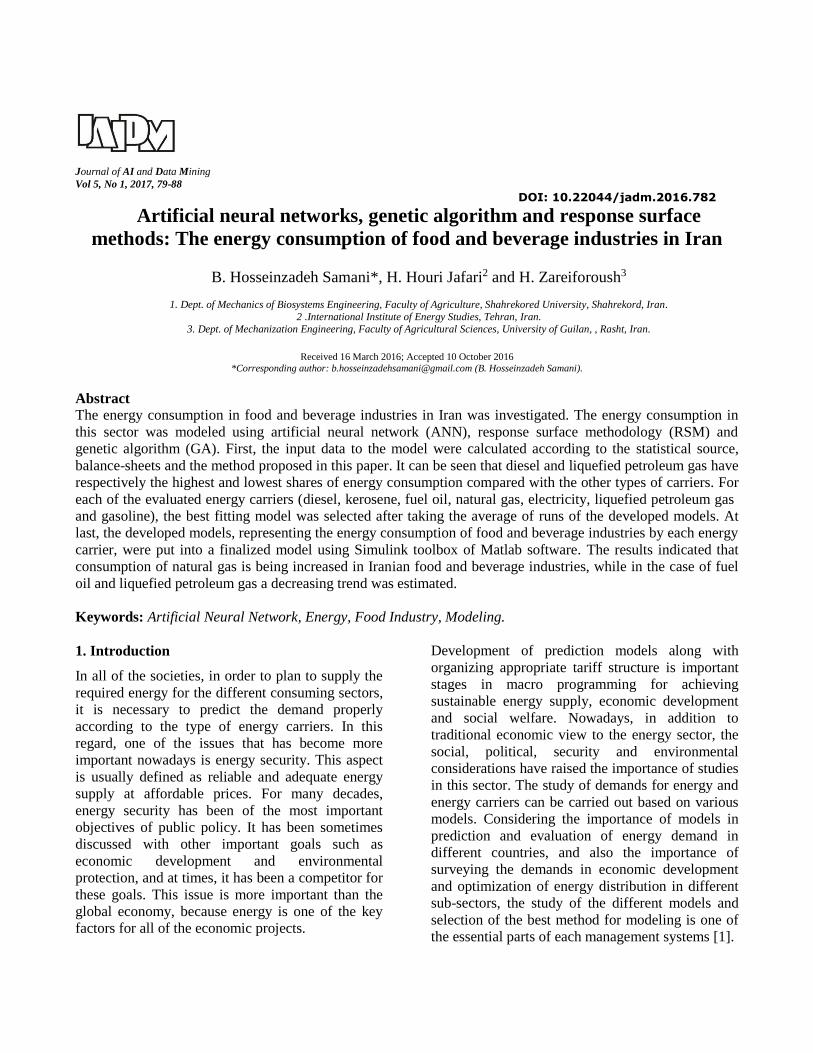
accuracy [20]. Different transfer functions such as
sigmoid (logsig), logarithm (tansig), linear (purelin)
and supervised learning algorithms, as well as Feed
Forward Back Propagation (FFBP) networks such
as Levenberg–Marquardt (trainlm) and “trainnscg”
algorithms were used and their corresponding
results were compared together (Figure 1). The
input values to the ANN were firstly normalized
and then divided randomly into three groups,
namely, train (70 %), validation (15 %) and test (15
%).
Figure 1. Transfer functions.
The required code for ANN simulation was
developed in MATLAB software version
R2013a.The best topology for the ANNs was
determined based on two criteria including
Hosseinzadeh et al./ Journal of AI and Data Mining, Vol 5, No 1, 2017.
82
coefficient of determination (R2) and Mean Squared
Error (MSE). The best fitting for estimation of
energy consumption for food and beverage
industries is one that has largest R2 and smallest
MSE. The R2 and MSE values were calculated
using the following equations:
1
22
2 1
2
1
1
n
i i
i
n
i
i
a p
R
p
(3)
n
i
ii pan
MSE1
21 (4)
where, ai is the actual value, pi the output value and
n the number of data values.
The ANNs modelling was carried out separately for
seven energy carries, namely, diesel, kerosene, fuel
oil, natural gas, electricity, liquefied petroleum gas
and gasoline. The input variable to the model was a
year of evaluation, whilst the output variable was
the amount of energy consumption in million
barrels of crude oil. The model data was between
the years 1998 and 2010 and due to lack of training
data, the model was run 20 times. Next, the mean
values of R2 and MSE for the 20 run times were
reported. The results of modeling for the evaluated
industries were obtained separately for each energy
carrier and the results were eventually related
together using the Simulink toolbox of MATLAB
software. It should be noted that the modeling was
implemented using the time series of artificial
neural networks with the time delay of 2 years.
Eight data were used for training stage and four data
were utilized for validation and test processes.
Among the source of variations in ANNs
optimization, the number of neurons in hidden
layers and transfer functions can be mentioned.
2.3. Response surface method
Response surface methodology (RSM) has an
important application in the design, development
and formulation of new products, as well as in the
improvement of existing product design. It defines
the effect of the independent variables, alone or in
combination, on processes. In addition, to analyze
the effects of the independent variables, this
experimental methodology generates a
mathematical model which describes the chemical
or biochemical processes [20-22]. In order to obtain
the optimum value for a variable, (5) is used:
2
0 iijjiijiii XXXXY (5)
where, β0, βj, βij, βjj are regression coefficients for
intercept, linear, interaction and quadratic
coefficients, respectively, while Xi and Xj are coded
independent variables and ε is the error. In the
present study, Box-Behnken design with 3 central
points was used. The coded values of the
experiment independent variables for artificial
neural networks parameters are given in table 1.
Table1. The range of artificial neural networks parameters
Parameter Down Up
X1: Number of neurons 1 15
X2: Momentum coefficient
0.05 0.95
X3: Learning rate 0.05 0.95
The variables presented in table 1 were assessed
separately for each of the transfer functions (Tansig,
Logsig) and the best transfer functions as well as the
optimum values for the variables in table 1 were
selected for the ANN.
2.4. Optimization using Genetic Algorithm
Genetic Algorithms (GAs) are adaptive heuristic
search algorithms premised on the evolutionary
ideas of natural selection and genetic. The basic
concept of GAs is designed to simulate processes in
natural systems necessary for evolution, specifically
those that follow the principles first laid down by
Charles Darwin of survival of the fittest. As such
they represent an intelligent exploitation of a
random search within a defined search space to
solve a problem [21]. In this research, GA was used
for optimization of ANN parameters. Data analysis
is responsible to obtain regression model from
experimental data, so that these models were used
for goal functions. Solving the problem needed to
adjust some parameters to reach the best answers.
Some adjustment parameters in cloud of initial
range, fitness scaling, selection function, Elicit
count, crossover fraction, Mutation function, and
migration.
3. Results and discussions
3.1. Share of energy carriers in food and
beverage industries
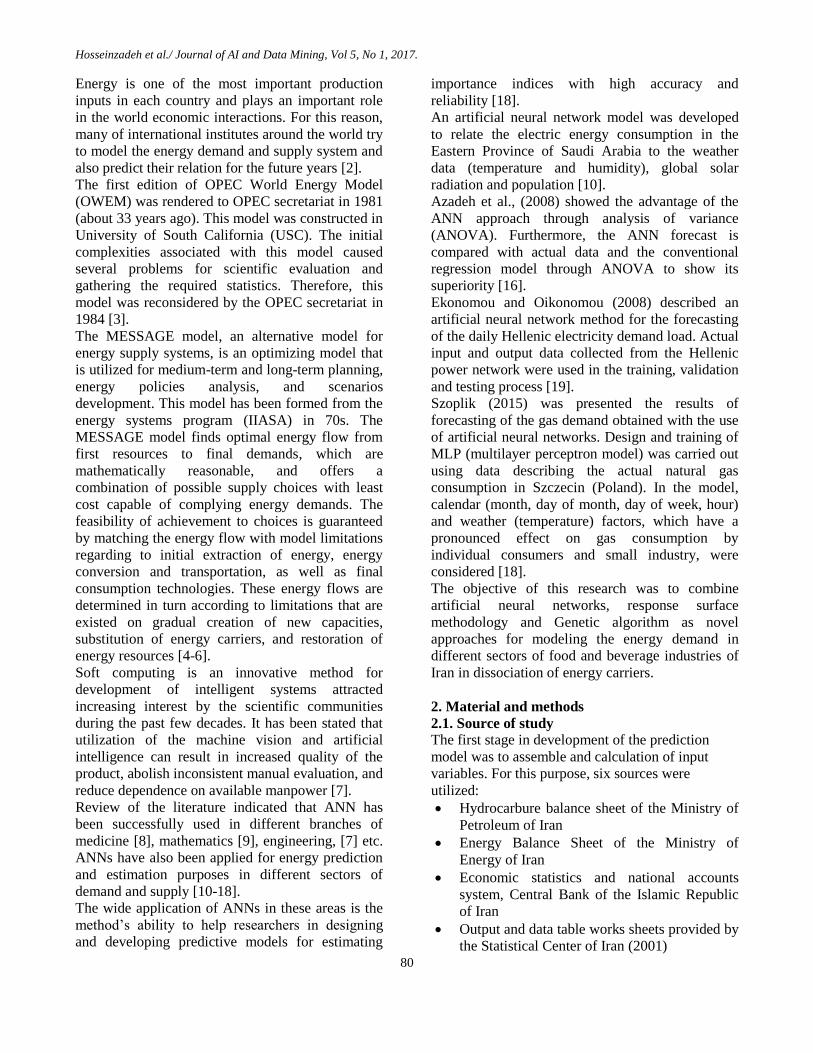
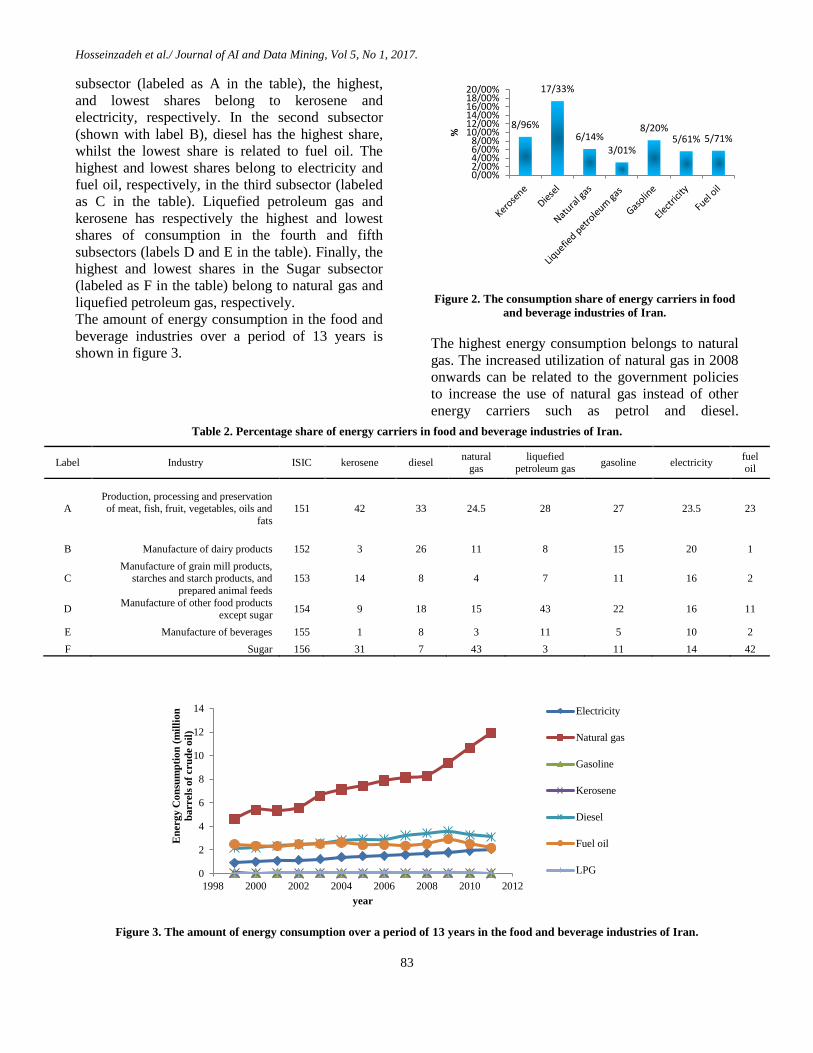
The share of consumption for different energy
carriers in food and beverage industries is shown in
figure 2. Diesel (17.33 %) and liquefied petroleum
gas (3.01 %) has respectively the highest and lowest
shares of energy consumption compared with the
other types of carriers.
The share of each activity in consumption of energy
carriers is given in table 2. As shown in the first
Hosseinzadeh et al./ Journal of AI and Data Mining, Vol 5, No 1, 2017.
83
subsector (labeled as A in the table), the highest,
and lowest shares belong to kerosene and
electricity, respectively. In the second subsector
(shown with label B), diesel has the highest share,
whilst the lowest share is related to fuel oil. The
highest and lowest shares belong to electricity and
fuel oil, respectively, in the third subsector (labeled
as C in the table). Liquefied petroleum gas and
kerosene has respectively the highest and lowest
shares of consumption in the fourth and fifth
subsectors (labels D and E in the table). Finally, the
highest and lowest shares in the Sugar subsector
(labeled as F in the table) belong to natural gas and
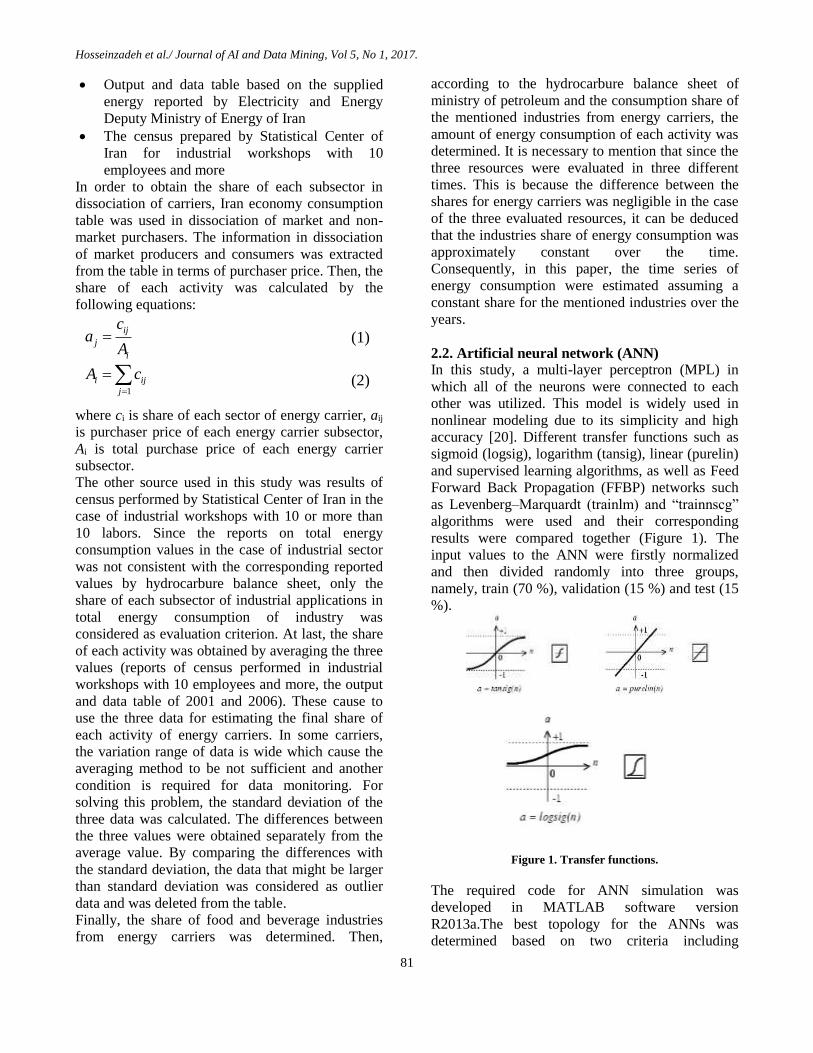
liquefied petroleum gas, respectively. The amount of energy consumption in the food and
beverage industries over a period of 13 years is
shown in figure 3.
Figure 2. The consumption share of energy carriers in food
and beverage industries of Iran.
The highest energy consumption belongs to natural
gas. The increased utilization of natural gas in 2008
onwards can be related to the government policies
to increase the use of natural gas instead of other
energy carriers such as petrol and diesel.
Table 2. Percentage share of energy carriers in food and beverage industries of Iran.
Label Industry ISIC kerosene diesel natural
gas liquefied
petroleum gas gasoline electricity
fuel oil
A Production, processing and preservation of meat, fish, fruit, vegetables, oils and
fats
151 42 33 24.5 28 27 23.5 23
B Manufacture of dairy products 152 3 26 11 8 15 20 1
C Manufacture of grain mill products,
starches and starch products, and
prepared animal feeds
153 14 8 4 7 11 16 2
D Manufacture of other food products
except sugar 154 9 18 15 43 22 16 11
E Manufacture of beverages 155 1 8 3 11 5 10 2
F Sugar 156 31 7 43 3 11 14 42
Figure 3. The amount of energy consumption over a period of 13 years in the food and beverage industries of Iran.
8/96%
17/33%
6/14%
3/01%
8/20%5/61% 5/71%
0/00%2/00%4/00%6/00%8/00%
10/00%12/00%14/00%16/00%18/00%20/00%
%
0
2
4
6
8
10
12
14
1998 2000 2002 2004 2006 2008 2010 2012
En
erg
y C
on
sum
pti
on
(m
illi
on
ba
rrels
of
cru
de o
il)
year
Electricity
Natural gas
Gasoline
Kerosene
Diesel
Fuel oil
LPG
Hosseinzadeh et al./ Journal of AI and Data Mining, Vol 5, No 1, 2017.
84
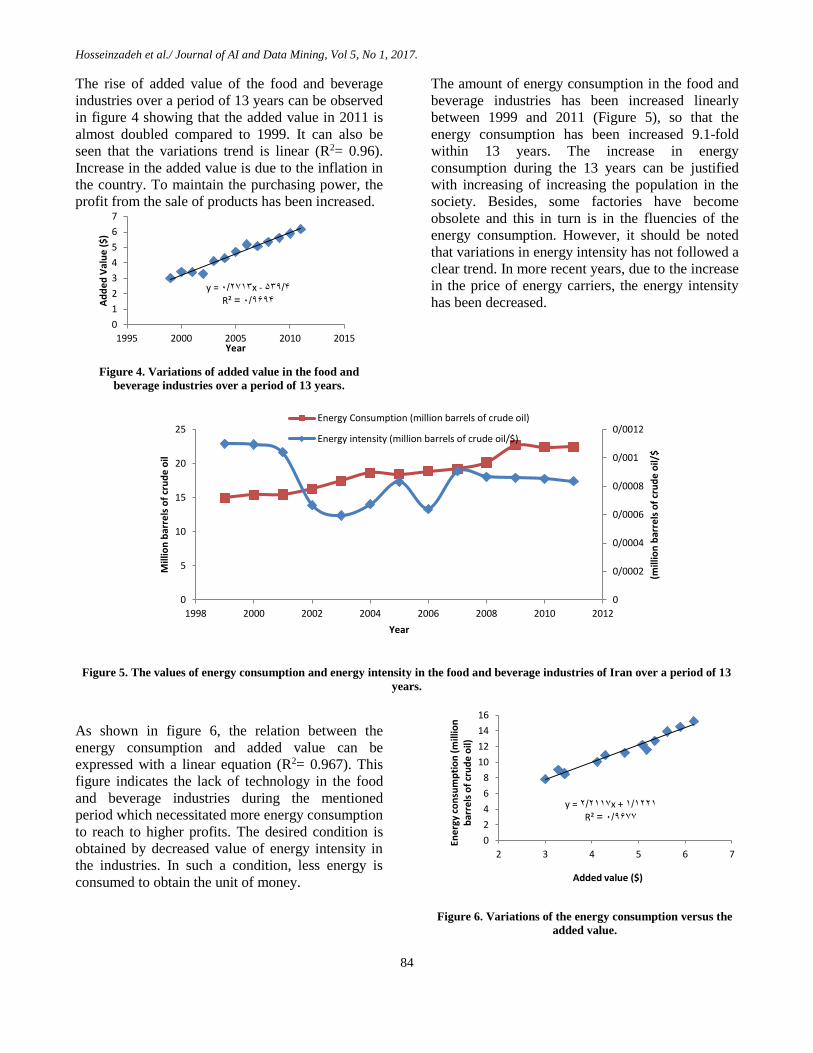
The rise of added value of the food and beverage
industries over a period of 13 years can be observed
in figure 4 showing that the added value in 2011 is
almost doubled compared to 1999. It can also be
seen that the variations trend is linear (R2= 0.96).
Increase in the added value is due to the inflation in
the country. To maintain the purchasing power, the
profit from the sale of products has been increased.
Figure 4. Variations of added value in the food and
beverage industries over a period of 13 years.
The amount of energy consumption in the food and
beverage industries has been increased linearly
between 1999 and 2011 (Figure 5), so that the
energy consumption has been increased 9.1-fold
within 13 years. The increase in energy
consumption during the 13 years can be justified
with increasing of increasing the population in the
society. Besides, some factories have become
obsolete and this in turn is in the fluencies of the
energy consumption. However, it should be noted
that variations in energy intensity has not followed a
clear trend. In more recent years, due to the increase
in the price of energy carriers, the energy intensity
has been decreased.
Figure 5. The values of energy consumption and energy intensity in the food and beverage industries of Iran over a period of 13
years.
As shown in figure 6, the relation between the
energy consumption and added value can be
expressed with a linear equation (R2= 0.967). This
figure indicates the lack of technology in the food
and beverage industries during the mentioned
period which necessitated more energy consumption
to reach to higher profits. The desired condition is
obtained by decreased value of energy intensity in
the industries. In such a condition, less energy is
consumed to obtain the unit of money.
Figure 6. Variations of the energy consumption versus the
added value.
y = 0/2713x - 539/4
R² = 0/9694
0
1
2
3
4
5
6
7
1995 2000 2005 2010 2015
Ad
de
d V
alu
e (
$)
Year
0
0/0002
0/0004
0/0006
0/0008
0/001
0/0012
0
5
10
15
20
25
1998 2000 2002 2004 2006 2008 2010 2012
(mill
ion
bar
rels
of
cru
de
oil/
$
Mill
ion
bar
rels
of
cru
de
oil
Year
Energy Consumption (million barrels of crude oil)
Energy intensity (million barrels of crude oil/$)
y = 2/2117x + 1/1221
R² = 0/9677
0
2
4
6
8
10
12
14
16
2 3 4 5 6 7
Ene
rgy
con
sum
pti
on
(m
illio
n
bar
rels
of
cru
de
oil)
Added value ($)
Hosseinzadeh et al./ Journal of AI and Data Mining, Vol 5, No 1, 2017.
85
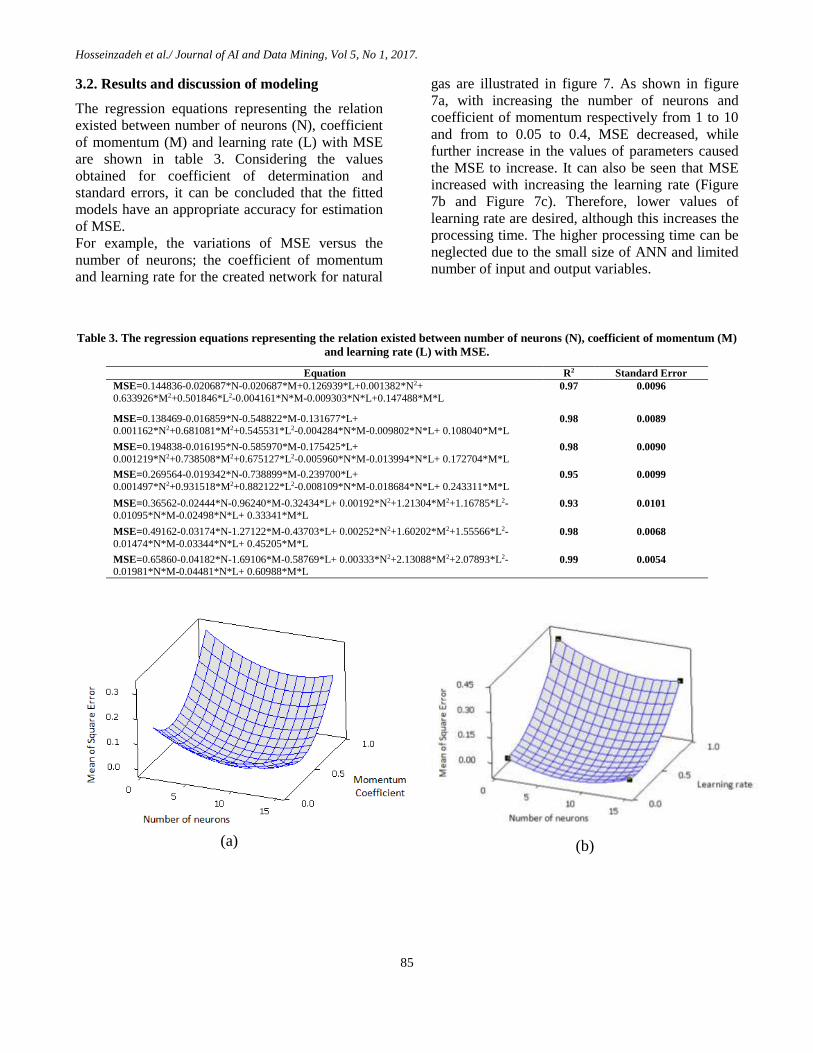
3.2. Results and discussion of modeling
The regression equations representing the relation
existed between number of neurons (N), coefficient
of momentum (M) and learning rate (L) with MSE
are shown in table 3. Considering the values
obtained for coefficient of determination and
standard errors, it can be concluded that the fitted
models have an appropriate accuracy for estimation
of MSE.
For example, the variations of MSE versus the
number of neurons; the coefficient of momentum
and learning rate for the created network for natural
gas are illustrated in figure 7. As shown in figure
7a, with increasing the number of neurons and
coefficient of momentum respectively from 1 to 10
and from to 0.05 to 0.4, MSE decreased, while
further increase in the values of parameters caused
the MSE to increase. It can also be seen that MSE
increased with increasing the learning rate (Figure
7b and Figure 7c). Therefore, lower values of
learning rate are desired, although this increases the
processing time. The higher processing time can be
neglected due to the small size of ANN and limited
number of input and output variables.
Table 3. The regression equations representing the relation existed between number of neurons (N), coefficient of momentum (M)
and learning rate (L) with MSE.
Standard Error R2 Equation
0.0096 0.97 MSE=0.144836-0.020687*N-0.020687*M+0.126939*L+0.001382*N2+
0.633926*M2+0.501846*L2-0.004161*N*M-0.009303*N*L+0.147488*M*L
0.0089 0.98 MSE=0.138469-0.016859*N-0.548822*M-0.131677*L+ 0.001162*N2+0.681081*M2+0.545531*L2-0.004284*N*M-0.009802*N*L+ 0.108040*M*L
0.0090 0.98 MSE=0.194838-0.016195*N-0.585970*M-0.175425*L+
0.001219*N2+0.738508*M2+0.675127*L2-0.005960*N*M-0.013994*N*L+ 0.172704*M*L
0.0099 0.95 MSE=0.269564-0.019342*N-0.738899*M-0.239700*L+
0.001497*N2+0.931518*M2+0.882122*L2-0.008109*N*M-0.018684*N*L+ 0.243311*M*L
0.0101 0.93 MSE=0.36562-0.02444*N-0.96240*M-0.32434*L+ 0.00192*N2+1.21304*M2+1.16785*L2-0.01095*N*M-0.02498*N*L+ 0.33341*M*L
0.0068 0.98 MSE=0.49162-0.03174*N-1.27122*M-0.43703*L+ 0.00252*N2+1.60202*M2+1.55566*L2-
0.01474*N*M-0.03344*N*L+ 0.45205*M*L
0.0054 0.99 MSE=0.65860-0.04182*N-1.69106*M-0.58769*L+ 0.00333*N2+2.13088*M2+2.07893*L2-0.01981*N*M-0.04481*N*L+ 0.60988*M*L
(a)
(b)
Hosseinzadeh et al./ Journal of AI and Data Mining, Vol 5, No 1, 2017.
86
(c)
Figure 6.Variations of MSE versus the number of neurons,
coefficient of momentum and learning rate for the created
network for natural gas
In order to determine the optimized points, two
methods including GA and RSM were used. The
goal functions were selected in the form shown in
table 4-6 with the purpose of MSE minimization.
Table 4. Optimized number of neurons for the created
networks.
Selected GA RSM Energy Carrier 9 8.89 8.51 GAS Oil
10 10.53 10.31 Kerosene 8 8.1 8.56 Fuel Oil 9 9.31 9.23 Liquid Gas
11 11.21 11.03 Electrical 9 8.46 8.87 Gasoline
10 10.02 10.12 Natural Gas
Table 5. Optimized coefficient of momentum for the created
networks.
Selected GA RSM Energy Carrier 0.32 0.36 0.32 GAS Oil
0.38 0.38 0.41 Kerosene 0.41 0.41 0.35 Fuel Oil 0.39 0.39 0.37 Liquid Gas 0.43 0.42 0.43 Electrical 0.32 0.32 0.29 Gasoline 0.48 0.44 0.48 Natural Gas
Table 6. Optimized learning ratios for the created networks.
Selected GA RSM Energy Carrier 0.08 0.10 0.08 GAS Oil
0.13 0.09 0.13 Kerosene 0.10 0.10 0.10 Fuel Oil 0.10 0.10 0.11 Liquid Gas 0.08 0.08 0.08 Electrical 0.11 0.11 0.10 Gasoline 0.13 0.13 0.16 Natural Gas
For all of the energy carriers, two-layer networks
were used with “tansig” and “purelin” transfer
functions in the first and second layers, respectively.
The mean values of R2 and MSE obtained from the
ANNs for different energy carriers are shown in
table 7.
Table 7. Mean values of R2 and MSE obtained from the
ANNs for different energy carriers
Energy carrier R2 MSE Diesel 0.96 0.031
Kerosene 0.97 0.027 Fuel Oil 0.97 0.022
Natural Gas 0.96 0.010 Electricity 0.97 0.037 Gasoline 0.97 0.028
Liquefied Gas 0.96 0.032
Other researchers have developed ANNs and the
energy consumption of industrial sectors has been
performed with high accuracy [23].
Results show the estimation and prediction trend of
ANNs on energy consumption for each energy
carrier, which is considerable. The model error and
accuracy in all the train, validation, and test points
are calculable. The final model was obtained by the
combination of ANN models using Simulink
method.
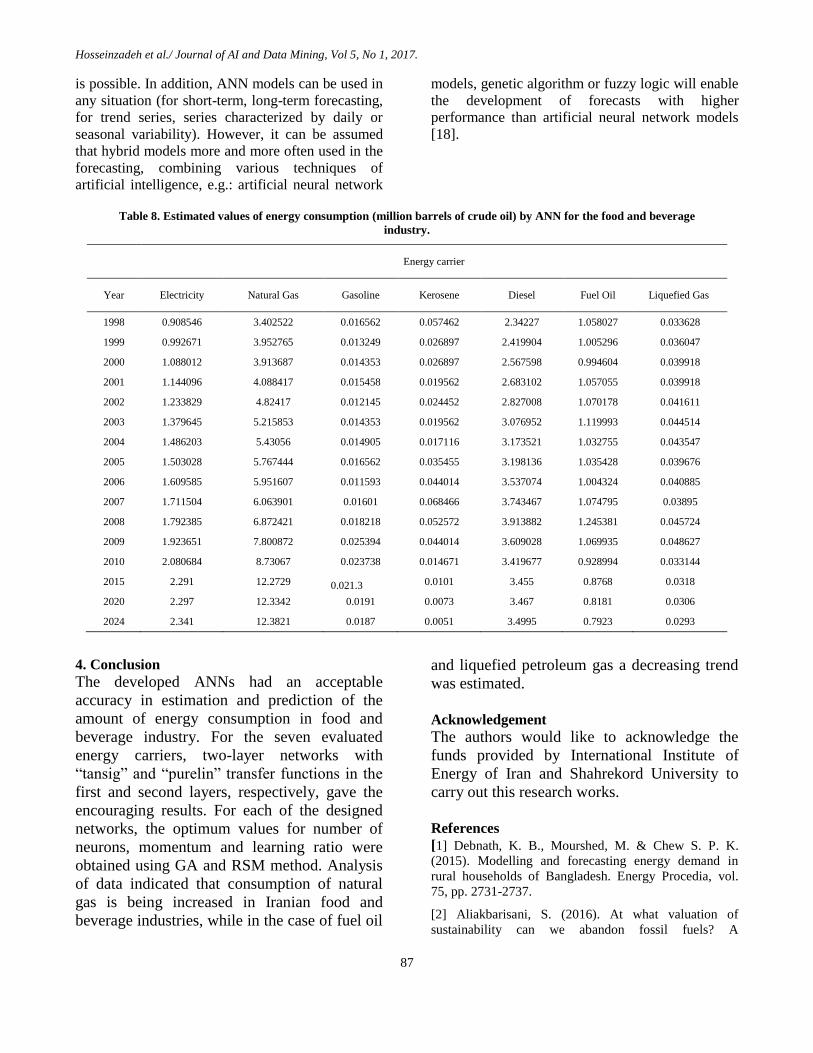
The values estimated by ANNs for energy
consumption in food and beverage industries are
given in table 8. Analysis of data in this table
indicates that the consumption of natural gas in Iran
is increasing day by day, while in the case of fuel
oil and liquefied petroleum gas, energy
consumption is going to be decreased. Table 8
shows that it is estimated that the consumption of
fuel oil and liquefied petroleum gas in 2024 will
reach 0.7923 and 0.0293 million barrels of crude
oil, respectively. The reason for this estimation is
vast reserves of natural gas in Iran which convinces
the managers and policy makers to use this energy
carrier more than the other carriers.
The literature indicate that it has been found that the
forecasting methods based on artificial neural
network models surpass the traditional models of
time series and regression models in terms of the
performance of the forecasts. The operation of the
artificial neural network is modeled on the action of
the human nervous system. Thus forecasting of gas
demand without the knowledge of the specific
relationships between variables and without
knowledge on their impact on the forecasted value
Hosseinzadeh et al./ Journal of AI and Data Mining, Vol 5, No 1, 2017.
87
is possible. In addition, ANN models can be used in
any situation (for short-term, long-term forecasting,
for trend series, series characterized by daily or
seasonal variability). However, it can be assumed
that hybrid models more and more often used in the
forecasting, combining various techniques of
artificial intelligence, e.g.: artificial neural network
models, genetic algorithm or fuzzy logic will enable
the development of forecasts with higher
performance than artificial neural network models
[18].
Table 8. Estimated values of energy consumption (million barrels of crude oil) by ANN for the food and beverage
industry.
Energy carrier
Year Electricity Natural Gas Gasoline Kerosene Diesel Fuel Oil Liquefied Gas
1998 0.908546 3.402522 0.016562 0.057462 2.34227 1.058027 0.033628
1999 0.992671 3.952765 0.013249 0.026897 2.419904 1.005296 0.036047
2000 1.088012 3.913687 0.014353 0.026897 2.567598 0.994604 0.039918
2001 1.144096 4.088417 0.015458 0.019562 2.683102 1.057055 0.039918
2002 1.233829 4.82417 0.012145 0.024452 2.827008 1.070178 0.041611
2003 1.379645 5.215853 0.014353 0.019562 3.076952 1.119993 0.044514
2004 1.486203 5.43056 0.014905 0.017116 3.173521 1.032755 0.043547
2005 1.503028 5.767444 0.016562 0.035455 3.198136 1.035428 0.039676
2006 1.609585 5.951607 0.011593 0.044014 3.537074 1.004324 0.040885
2007 1.711504 6.063901 0.01601 0.068466 3.743467 1.074795 0.03895
2008 1.792385 6.872421 0.018218 0.052572 3.913882 1.245381 0.045724
2009 1.923651 7.800872 0.025394 0.044014 3.609028 1.069935 0.048627
2010 2.080684 8.73067 0.023738 0.014671 3.419677 0.928994 0.033144
2015 2.291 12.2729 0.021.3 0.0101 3.455 0.8768 0.0318
2020 2.297 12.3342 0.0191 0.0073 3.467 0.8181 0.0306
2024 2.341 12.3821 0.0187 0.0051 3.4995 0.7923 0.0293
4. Conclusion
The developed ANNs had an acceptable
accuracy in estimation and prediction of the
amount of energy consumption in food and
beverage industry. For the seven evaluated
energy carriers, two-layer networks with
“tansig” and “purelin” transfer functions in the
first and second layers, respectively, gave the
encouraging results. For each of the designed
networks, the optimum values for number of
neurons, momentum and learning ratio were
obtained using GA and RSM method. Analysis
of data indicated that consumption of natural
gas is being increased in Iranian food and
beverage industries, while in the case of fuel oil
and liquefied petroleum gas a decreasing trend
was estimated.
Acknowledgement
The authors would like to acknowledge the
funds provided by International Institute of
Energy of Iran and Shahrekord University to
carry out this research works.
References
[1] Debnath, K. B., Mourshed, M. & Chew S. P. K.
(2015). Modelling and forecasting energy demand in
rural households of Bangladesh. Energy Procedia, vol.
75, pp. 2731-2737.
[2] Aliakbarisani, S. (2016). At what valuation of
sustainability can we abandon fossil fuels? A
Hosseinzadeh et al./ Journal of AI and Data Mining, Vol 5, No 1, 2017.
88
comprehensive multistage decision support model for
electricity planning. Energy, vol. 107, pp. 60-77.
[3] Barnett, J. (2008). The worst of friends: OPEC and
G-77 in the climate regime. Global Environmental
Politics, vol. 8, no. 4, pp. 1-8.
[4] Messner, S. & Schrattenholzer, L. (2000).
MESSAGE–MACRO: linking an energy supply model
with a macroeconomic module and solving it iteratively.
Energy, vol. 25, no. 3, pp. 267-282.
[5] Ekonomou, L. (2010). Greek long-term energy
consumption prediction using artificial neural networks.
Energy, vol. 35, no. 2, pp. 512-517.
[6] Gonzalez-Salazar, M. A., et al. (2016). A general
modeling framework to evaluate energy, economy, land-
use and GHG emissions nexus for bioenergy
exploitation. Applied Energy, pp. 223-249.
[7] Pierre, S., Said, H. & Probst, W. G. (2001). An
artificial neural network approach for routing in
distributed computer networks. Engineering Applications
of Artificial Intelligence, vol. 14, no. 1, pp. 51-60.
[8] Lisboa, P. J. & Taktak, A. F. (2006). The use of
artificial neural networks in decision support in cancer: a
systematic review. Neural networks, vol. 19, no. 4, pp.
408-415.
[9] Hernandez, G. & Salinas, L. (2004). Large scale
simulations of a neural network model for the graph
bisection problem on geometrically connected graphs.
Electronic Notes in Discrete Mathematics, vol. 18, pp.
151-156.
[10] Javeed Nizami, S. & Al-Garni, A. Z. (1995).
Forecasting electric energy consumption using neural
networks. Energy policy, vol. 23, no.12, pp. 1097-1104.
[11] Islam, S. M., Al-Alawi, S. M. & Ellithy, K. A.
(1995). Forecasting monthly electric load and energy for
a fast growing utility using an artificial neural network.
Electric Power Systems Research, vol. 34, no. 1, pp. 1-9.
[12] Nasr, G., Badr, E. & Joun, C. (2003).
Backpropagation neural networks for modeling gasoline
consumption. Energy Conversion and Management, vol.
44, no. 6, pp. 893-905.
[13] Murat, Y. S. & Ceylan, H. (2006). Use of artificial
neural networks for transport energy demand modeling.
Energy policy, vol. 34, no. 17, pp. 3165-3172.
[14] Azadeh, A., Ghaderi, S. & Sohrabkhani, S. (2007).
Forecasting electrical consumption by integration of
neural network, time series and ANOVA. Applied
Mathematics and Computation, vol. 186, no. 2, pp. 1753-
1761.
[15] Sözen, A. & Arcaklioglu, E. (2007). Prediction of
net energy consumption based on economic indicators
(GNP and GDP) in Turkey. Energy policy, vol. 35, no.
10, pp. 4981-4992.
[16] Azadeh, A., Ghaderi, S. & Sohrabkhani, S. (2008).
Annual electricity consumption forecasting by neural
network in high energy consuming industrial sectors.
Energy Conversion and Management, vol. 49, no. 8, pp.
2272-2278.
[17] Geem, Z. W. (2011). Transport energy demand
modeling of South Korea using artificial neural network.
Energy policy, vol. 39, no. 8, pp. 4644-4650.
[18] Szoplik, J. (2015) Forecasting of natural gas
consumption with artificial neural networks. Energy, vol.
85, pp. 208-220.
[19] Asghari, M. & Nematzadeh, H. (2016). Predicting
air pollution in Tehran: Genetic algorithm and back
propagation neural network. Journal of AI and Data
Mining, vol. 4, no. 1, pp. 49-54.
[20] Ekonomou, L. & Oikonomou, D. (2008).
Application and comparison of several artificial neural
networks for forecasting the Hellenic daily electricity
demand load. In Proceedings of the 7th WSEAS
International Conference on Artificial intelligence,
knowledge engineering and data bases. World Scientific
and Engineering Academy and Society (WSEAS).
[21] Harvey, R. L. (1994). Neural network principles.
Prentice-Hall, Inc.
[22] Huang, Y., et al. (2010). Development of soft
computing and applications in agricultural and biological
engineering. Computers and Electronics in Agriculture,
vol. 71, no. 2, pp. 107-127.
[23] Fayyazi, E., et al. (2015). An ultrasound-assisted
system for the optimization of biodiesel production from
chicken fat oil using a genetic algorithm and response
surface methodology. Ultrasonics sonochemistry, vol. 26,
pp. 312-320.
[24] Sözen, A. (2009). Future projection of the energy
dependency of Turkey using artificial neural network.
Energy policy, vol. 37, no. 11, pp. 4827-4833.

نشریه هوش مصنوعی و داده کاوی
های عصبی مصنوعی، الگوریتم ژنتیک و منحنی سطح پاسخ: مصرف انرژی در صنایع های شبکهروش
غذایی و آشامیدنی ایران
3حماد ذرعی فروشو 2، حامد حوری جعفری،*1بهرام حسین زاده سامانی
.بیوسیستم، دانشگاه شهرکرد، شهرکرد، ایران مهندسی مکانیک 1
.مطالعات بین الملل انرژی، تهران، ایران موسسه 2
.مهندسی مکانیزاسیون کشاورزی، دانشگاه گیلان، رشت، ایران3
63/63/6361 ؛ پذیرش61/30/6361 ارسال
چکیده:
انرژي مصرفي این بخش از صنعت مورد مطالعه قرار گرفت. در اینن ماالنه با توجه به اهميت صنایع غذایي در هر کشور، در این پژوهش مدلسازي ميزان
هنا، هاي عصبي مصنوعي، منحني سطح پاسخ و الگوریتم ژنتيک انجام پذیرفت. در اولنين گنام بنا توجنه بنه امارنامنهمدلسازي انرژي توسط روش شبکه
هاي انرژي )گازوئيل، نفت سفيد، نفنت کنوره، گناز ه گشت. براي هرکدام از حاملهاي ورودي مدل محاسبها و روش پيشنهادي در این مااله دادهترازنامه
بار اجراي برنامه براي هر مشخصه شبکه، بهترین شبکه عصبي انتخنا شند. در انتهنا بنا محنيط 63گيري از طبيعي، برق، بنزین و گاز مایع( با ميانگين
دهد روز به روز در این صنعت مصرف گناز طبيعني ها نشان ميتهيه شد. تحليل داده هفت شبکه اجرا شده در قالب مدل نهایي MATLABسيمولينک
روبه افرایش است ولي ميزان مصرف نفت کوره و گاز مایع رو به کاهش است.
ي.، شبکه عصباشاميدنيمدلسازي انرژي، انرژي مصرفي، صنایع غذایي و :کلمات کلیدی
![Index [link.springer.com]978-1-4899-3216-7/1.pdf · Canny edge detector, 79, 88-91 ... coding Huffman, 471 low and high frequencies, ... Canny, 88-91, 487 in multispectral image,](https://img.pdfslide.us/doc/110x75/5aa76de57f8b9a294b8c0d6b/index-link-978-1-4899-3216-71pdfcanny-edge-detector-79-88-91-coding.jpg)