Embed Size (px)
Citation preview
Ingenieros Consultores
PILES IN SOFT CLAY SUBJECTED TO LONG-DURATION SEISMIC ACTION
Technical Note
to
Workshop on Earthquake Geotechnical Codes
4th International Congress on Geotechnical Earthquake Engineering
Technical note no. 10 Rev. 1 Project no. A-023-001
15/06/07
PILES IN SOFT CLAY SUBJECTED TO LONG-DURATION SEISMIC ACTION
Technical Note
to
Workshop on Earthquake Geotechnical Codes
4th International Congress on Geotechnical Earthquake Engineering
Document ID: A-023-001-NOT-010
Revision: 1 Date: 15/06/07
Prepared: Revised: Approved: M.J. Crespo and J. Martí J. Rodríguez F. Martínez

Technical note no. 010 Rev. 1 PRINCIPIA
not24768.doc i
TABLE OF CONTENTS
Page
1. INTRODUCTION.............................................................................................. 4 1.1 Preamble ........................................................................................................ 4 1.2 Object ............................................................................................................ 4 1.3 Scope ............................................................................................................. 5 1.4 Layout of report............................................................................................. 5
2. DESCRIPTION OF THE PROBLEM ............................................................... 7 2.1 Site conditions ............................................................................................... 7 2.2 Seismic input ................................................................................................. 7 2.3 The pile.......................................................................................................... 9
3. CHARACTERISATION OF FREE FIELD MOTIONS ................................. 11 3.1 Initial hypotheses......................................................................................... 11 3.2 Refinement of shear moduli ........................................................................ 11 3.3 Damping at the resonant frequency............................................................. 12 3.4 Damping at other frequencies...................................................................... 12
4. KINEMATIC INTERACTION........................................................................ 23 4.1 Methodology ............................................................................................... 23 4.2 Results of the interaction............................................................................. 23
5. CONCLUSIONS .............................................................................................. 30
Appendix I. References ........................................................................................ 32
Technical note no. 010 Rev. 1 PRINCIPIA
not24768.doc ii
LIST OF FIGURES
Page
Figure 2–1 Input ground motion at a depth of 153 m ............................................8 Figure 2–2 Observed motions at ground level .......................................................8 Figure 2–3 Bending moment vs. curvature of the pile.........................................10 Figure 3–1 Degradation of shear modulus with strain level ................................14 Figure 3–2 Damping ratio as a function of strain level........................................14 Figure 3–3 Response spectra: measured and calculated ......................................15 Figure 3–4 Amplification of the calculated response spectra ..............................16 Figure 3–5 Modulus degradation: initial and corrected .......................................17 Figure 3–6 Surface spectra: measured, 1st and 2nd calculation ..........................18 Figure 3–7 Damping ratio: initial and corrected ..................................................19 Figure 3–8 Surface spectra: measured, 1st, 2nd and 3rd calculation ...................20 Figure 3–9 Comparison of stiffness and Rayleigh damping................................21 Figure 3–10 Surface spectra: measured, 1st, 2nd, 3rd and 4th calculation..........22 Figure 4–1 Model of the pile ................................................................................25 Figure 4–2 p-y curves used in the analyses for peat and clay layers....................26 Figure 4–3 p-y curves used in the analyses for the sandy silt layer .....................27 Figure 4–4 Bending moments with a free pilehead..............................................28 Figure 4–5 Bending moments with a restrained pilehead ....................................29

Technical note no. 010 Rev. 1 PRINCIPIA
not24768.doc iii
LIST OF TABLES
Page
Table 2–1 Soil characteristics.................................................................................7
Technical note no. 010 Rev. 1 PRINCIPIA
not24768.doc 4
1. INTRODUCTION
1.1 Preamble
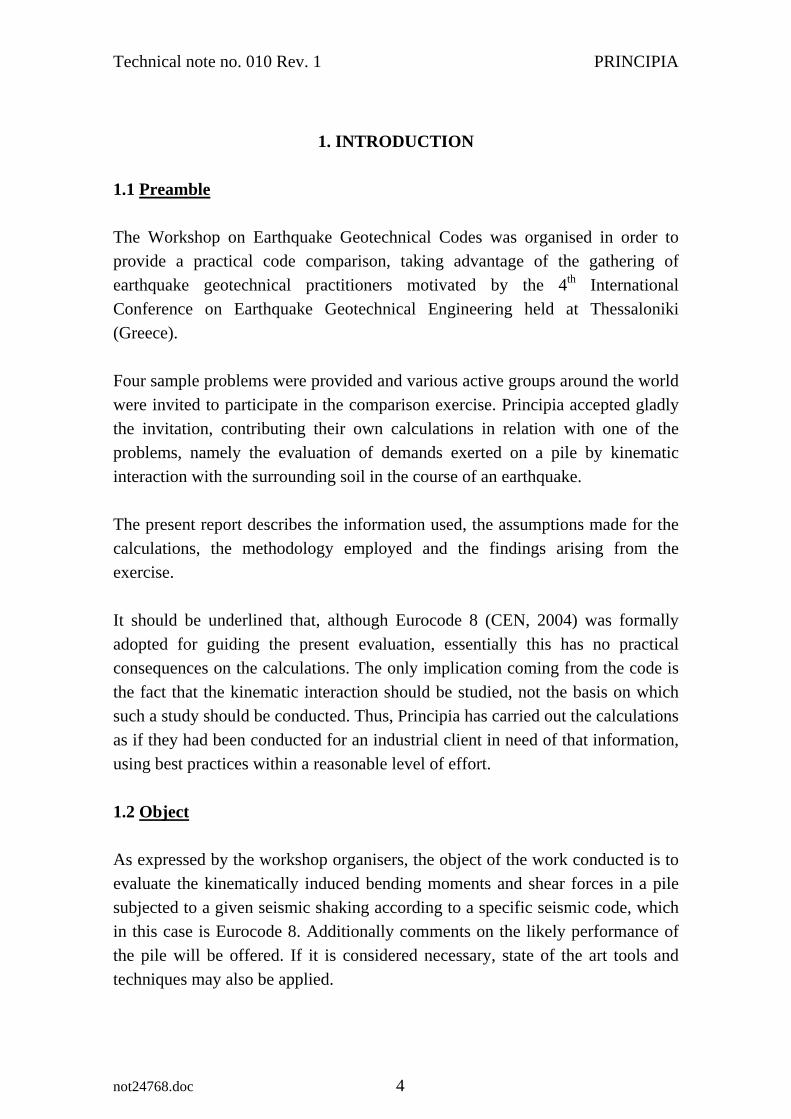
The Workshop on Earthquake Geotechnical Codes was organised in order to provide a practical code comparison, taking advantage of the gathering of earthquake geotechnical practitioners motivated by the 4th International Conference on Earthquake Geotechnical Engineering held at Thessaloniki (Greece).
Four sample problems were provided and various active groups around the world were invited to participate in the comparison exercise. Principia accepted gladly the invitation, contributing their own calculations in relation with one of the problems, namely the evaluation of demands exerted on a pile by kinematic interaction with the surrounding soil in the course of an earthquake.
The present report describes the information used, the assumptions made for the calculations, the methodology employed and the findings arising from the exercise.
It should be underlined that, although Eurocode 8 (CEN, 2004) was formally adopted for guiding the present evaluation, essentially this has no practical consequences on the calculations. The only implication coming from the code is the fact that the kinematic interaction should be studied, not the basis on which such a study should be conducted. Thus, Principia has carried out the calculations as if they had been conducted for an industrial client in need of that information, using best practices within a reasonable level of effort.
1.2 Object
As expressed by the workshop organisers, the object of the work conducted is to evaluate the kinematically induced bending moments and shear forces in a pile subjected to a given seismic shaking according to a specific seismic code, which in this case is Eurocode 8. Additionally comments on the likely performance of the pile will be offered. If it is considered necessary, state of the art tools and techniques may also be applied.
Technical note no. 010 Rev. 1 PRINCIPIA
not24768.doc 5
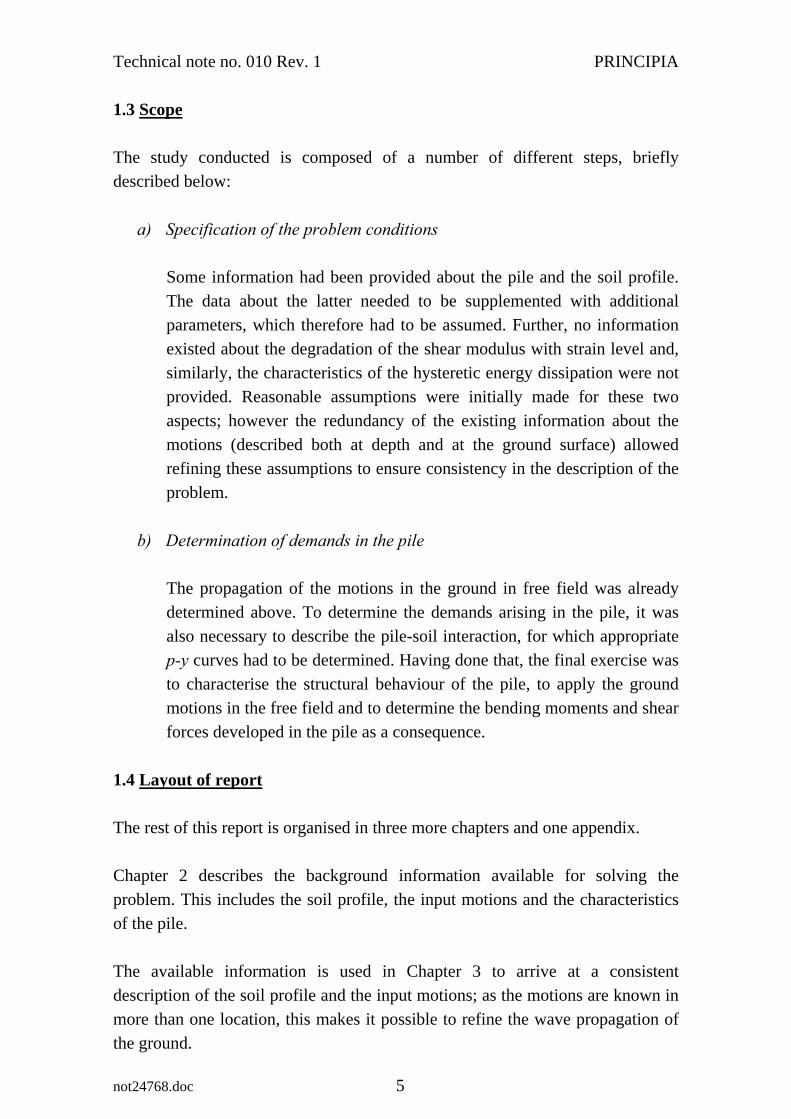
1.3 Scope
The study conducted is composed of a number of different steps, briefly described below:
a) Specification of the problem conditions
Some information had been provided about the pile and the soil profile. The data about the latter needed to be supplemented with additional parameters, which therefore had to be assumed. Further, no information existed about the degradation of the shear modulus with strain level and, similarly, the characteristics of the hysteretic energy dissipation were not provided. Reasonable assumptions were initially made for these two aspects; however the redundancy of the existing information about the motions (described both at depth and at the ground surface) allowed refining these assumptions to ensure consistency in the description of the problem.
b) Determination of demands in the pile
The propagation of the motions in the ground in free field was already determined above. To determine the demands arising in the pile, it was also necessary to describe the pile-soil interaction, for which appropriate p-y curves had to be determined. Having done that, the final exercise was to characterise the structural behaviour of the pile, to apply the ground motions in the free field and to determine the bending moments and shear forces developed in the pile as a consequence.
1.4 Layout of report
The rest of this report is organised in three more chapters and one appendix.
Chapter 2 describes the background information available for solving the problem. This includes the soil profile, the input motions and the characteristics of the pile.
The available information is used in Chapter 3 to arrive at a consistent description of the soil profile and the input motions; as the motions are known in more than one location, this makes it possible to refine the wave propagation of the ground.

Technical note no. 010 Rev. 1 PRINCIPIA
not24768.doc 6
Then a numerical model of the pile is generated and appropriate p-y curves are constructed to describe its interaction with the ground movements, thus allowing the study of the kinematic interaction sought. These analyses are all described in Chapter 4.
The final Chapter 5 summarily presents the conclusions arising from the work conducted.
The only appendix contains the list of bibliographic and documentary references mentioned in the report.
Technical note no. 010 Rev. 1 PRINCIPIA
not24768.doc 7
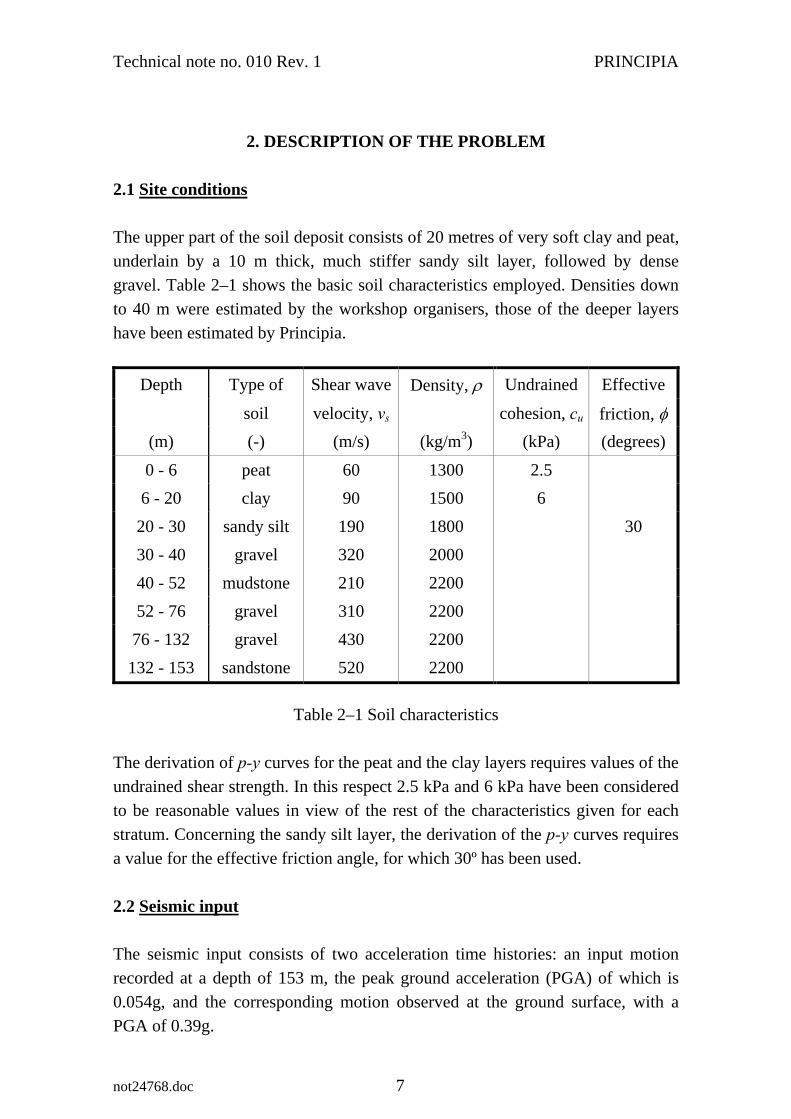
2. DESCRIPTION OF THE PROBLEM
2.1 Site conditions
The upper part of the soil deposit consists of 20 metres of very soft clay and peat, underlain by a 10 m thick, much stiffer sandy silt layer, followed by dense gravel. Table 2–1 shows the basic soil characteristics employed. Densities down to 40 m were estimated by the workshop organisers, those of the deeper layers have been estimated by Principia.
Depth Type of Shear wave Density, ρ Undrained Effective
soil velocity, vs cohesion, cu friction, φ (m) (-) (m/s) (kg/m3) (kPa) (degrees)
0 - 6 peat 60 1300 2.5 6 - 20 clay 90 1500 6
20 - 30 sandy silt 190 1800 30 30 - 40 gravel 320 2000 40 - 52 mudstone 210 2200 52 - 76 gravel 310 2200 76 - 132 gravel 430 2200
132 - 153 sandstone 520 2200
Table 2–1 Soil characteristics
The derivation of p-y curves for the peat and the clay layers requires values of the undrained shear strength. In this respect 2.5 kPa and 6 kPa have been considered to be reasonable values in view of the rest of the characteristics given for each stratum. Concerning the sandy silt layer, the derivation of the p-y curves requires a value for the effective friction angle, for which 30º has been used.
2.2 Seismic input
The seismic input consists of two acceleration time histories: an input motion recorded at a depth of 153 m, the peak ground acceleration (PGA) of which is 0.054g, and the corresponding motion observed at the ground surface, with a PGA of 0.39g.
Technical note no. 010 Rev. 1 PRINCIPIA
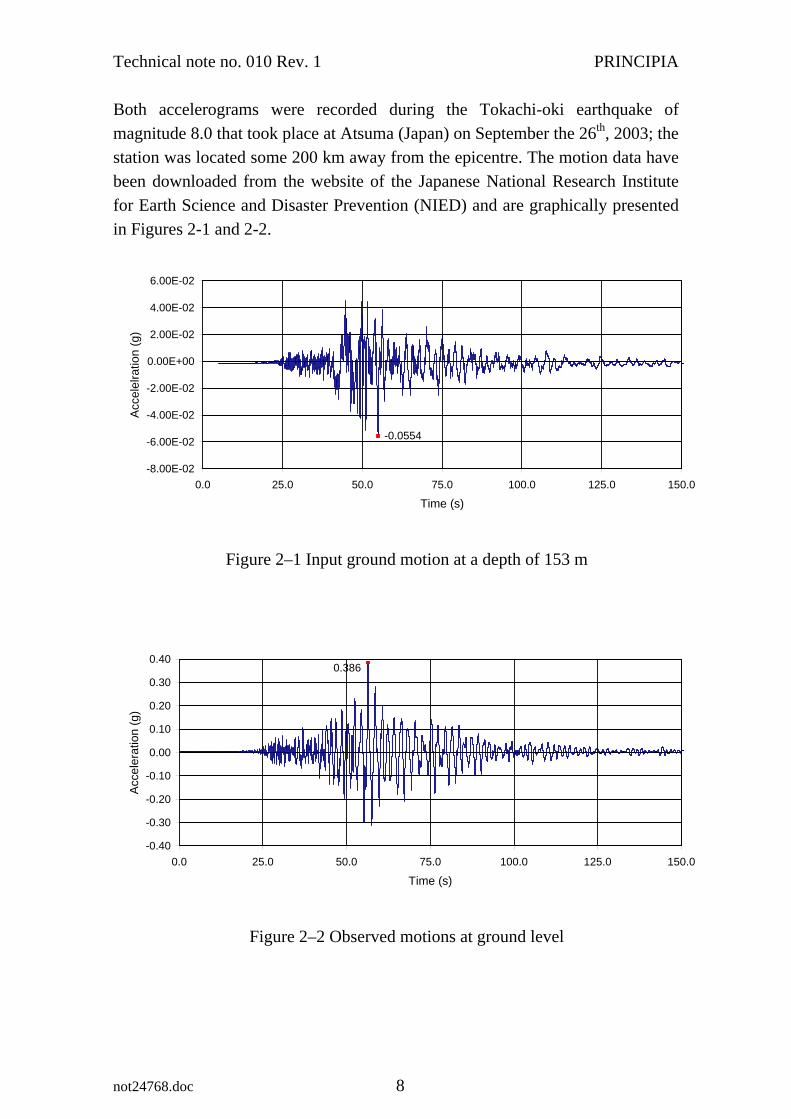
Both accelerograms were recorded during the Tokachi-oki earthquake of magnitude 8.0 that took place at Atsuma (Japan) on September the 26th, 2003; the station was located some 200 km away from the epicentre. The motion data have been downloaded from the website of the Japanese National Research Institute for Earth Science and Disaster Prevention (NIED) and are graphically presented in Figures 2-1 and 2-2.
-0.0554
-8.00E-02
-6.00E-02
-4.00E-02
-2.00E-02
0.00E+00
2.00E-02
4.00E-02
6.00E-02
0.0 25.0 50.0 75.0 100.0 125.0 150.0
Time (s)
Acc
elel
ratio
n (g
)
Figure 2–1 Input ground motion at a depth of 153 m
0.386
-0.40
-0.30
-0.20
-0.10
0.00
0.10
0.20
0.30
0.40
0.0 25.0 50.0 75.0 100.0 125.0 150.0
Time (s)
Acc
eler
atio
n (g
)
Figure 2–2 Observed motions at ground level
not24768.doc 8
Technical note no. 010 Rev. 1 PRINCIPIA
not24768.doc 9
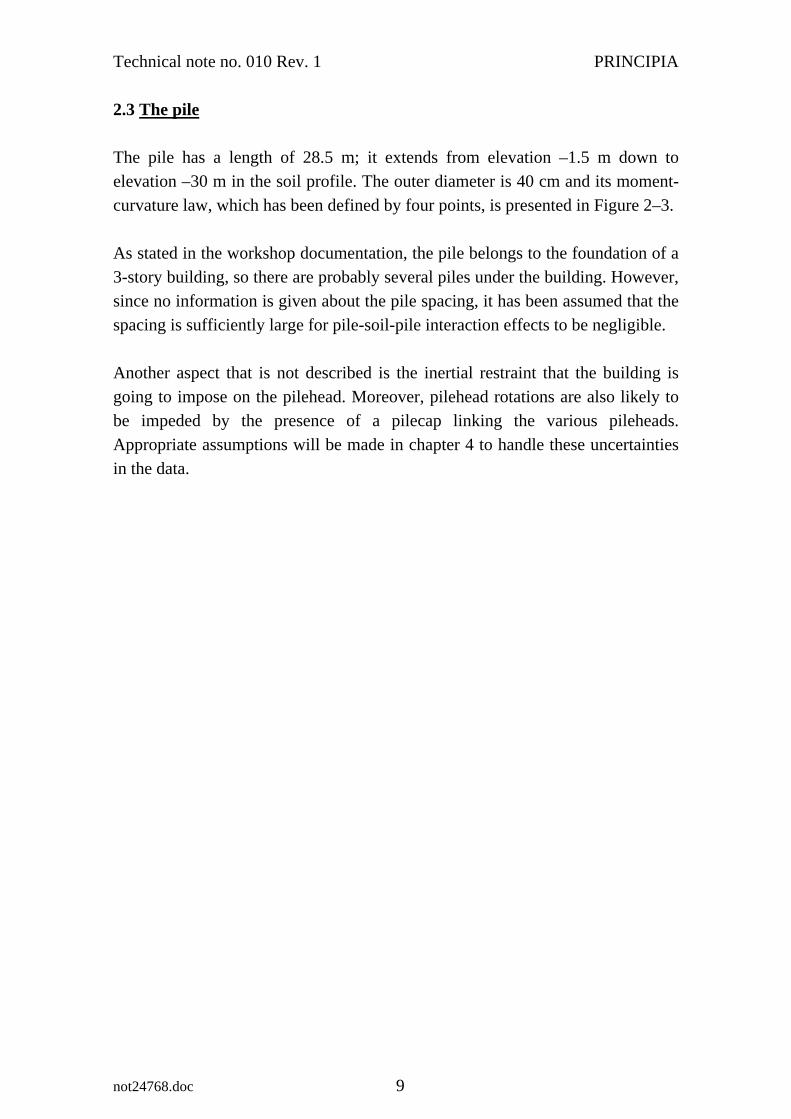
2.3 The pile
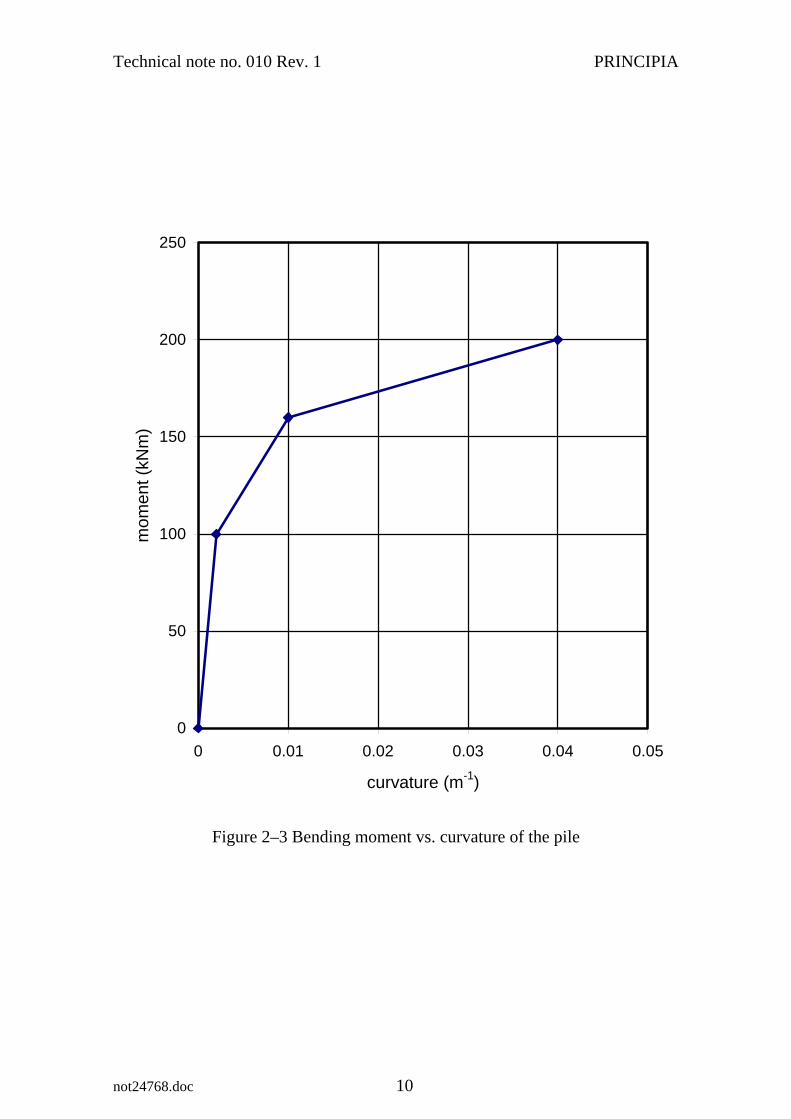
The pile has a length of 28.5 m; it extends from elevation –1.5 m down to elevation –30 m in the soil profile. The outer diameter is 40 cm and its moment-curvature law, which has been defined by four points, is presented in Figure 2–3.
As stated in the workshop documentation, the pile belongs to the foundation of a 3-story building, so there are probably several piles under the building. However, since no information is given about the pile spacing, it has been assumed that the spacing is sufficiently large for pile-soil-pile interaction effects to be negligible.
Another aspect that is not described is the inertial restraint that the building is going to impose on the pilehead. Moreover, pilehead rotations are also likely to be impeded by the presence of a pilecap linking the various pileheads. Appropriate assumptions will be made in chapter 4 to handle these uncertainties in the data.
Technical note no. 010 Rev. 1 PRINCIPIA
0
50
100
150
200
250
0 0.01 0.02 0.03 0.04 0.05
curvature (m-1)
mom
ent (
kNm
)
Figure 2–3 Bending moment vs. curvature of the pile
not24768.doc 10
Technical note no. 010 Rev. 1 PRINCIPIA
not24768.doc 11
3. CHARACTERISATION OF FREE FIELD MOTIONS
3.1 Initial hypotheses
The ground profile was described in Table 2–1 of the previous chapter. The data contained in that table allows assigning values of the small strain shear modulus Go at all depths in the profile.
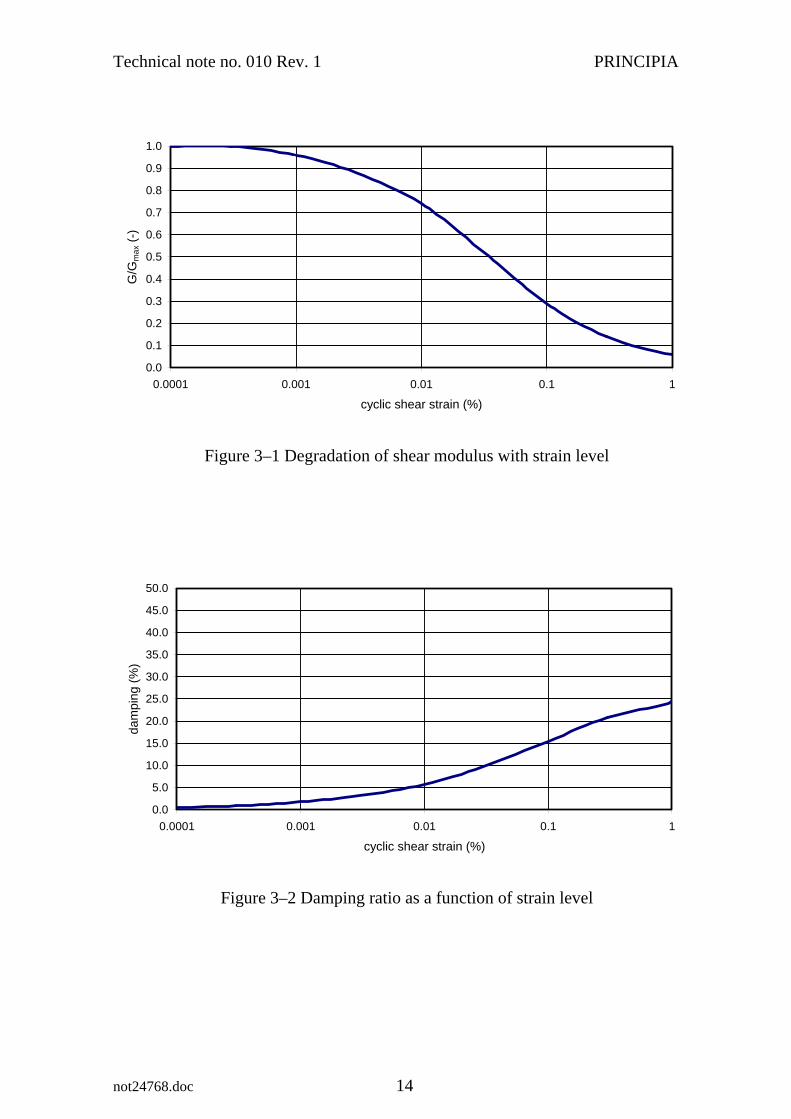
No information was provided about the effects of increasing shear strain levels on the degradation of the modulus and the associated energy dissipation characteristics. Hence, as a first approximation, both of these aspects were taken from the literature (ASCE, 1999). The curves initially adopted are the ones reflected in Figures 3–1 and 3–2.
3.2 Refinement of shear moduli
The above assumptions, together with the information provided on small strain moduli, allowed conducting an analysis of the propagation of shear waves along the profile. This was done using the computer program SHAKE (Schnabel et al, 1972).
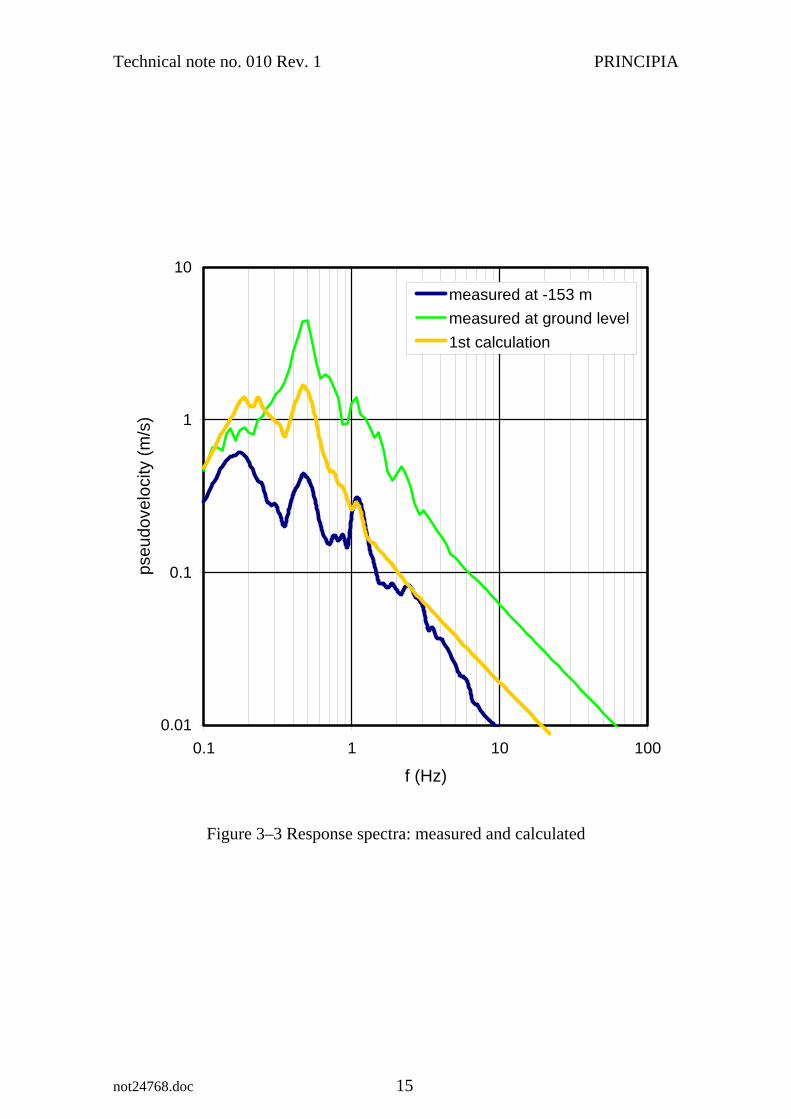
Figure 3–3 compares the response spectra of the various motions: that of the deep accelerogram recorded, that of the surface accelerogram recorded and that of the surface accelerogram computed from the deep one using the above hypotheses.
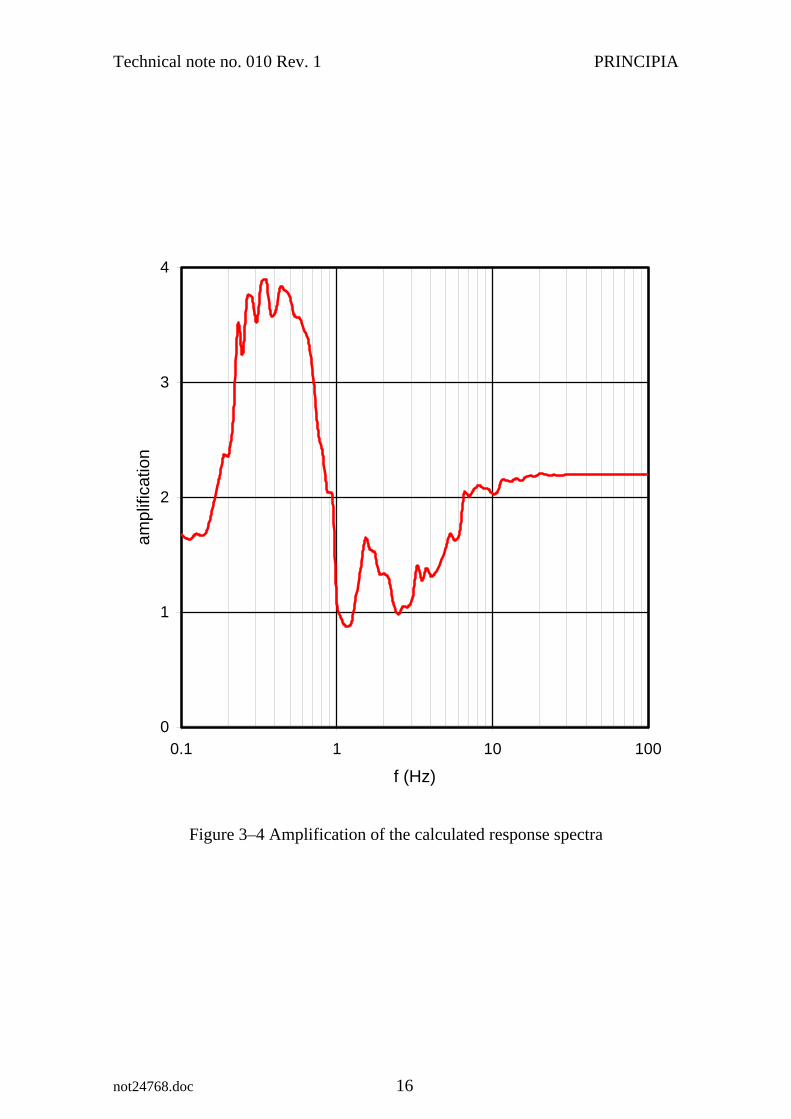
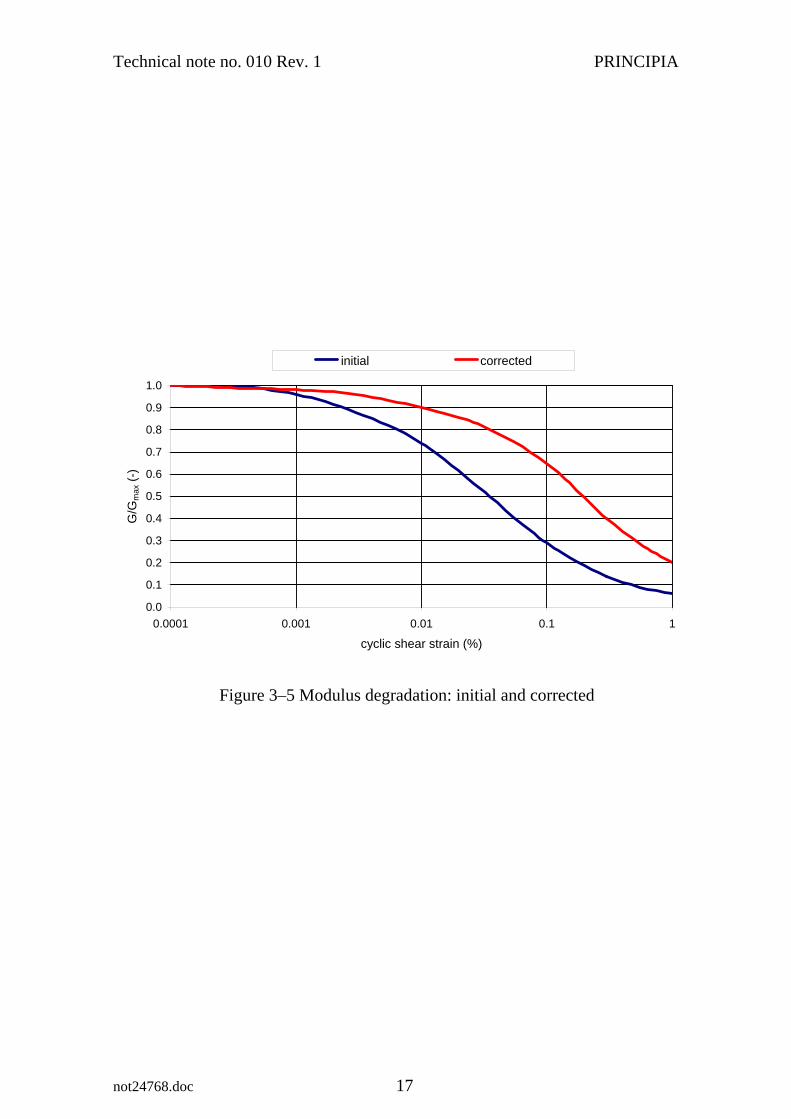
It can be seen that the calculated spectral peak moves excessively towards the low frequencies, implying that the behaviour of the ground is too flexible. This is perhaps more easily seen in Figure 3–4, which plots the ratio of the surface spectrum to the deep input motion at the various frequencies. As a consequence of this observation, the modulus degradation curve was modified to reduce the degree of strain degradation. The new degradation curve is plotted together with the old one in Figure 3–5.
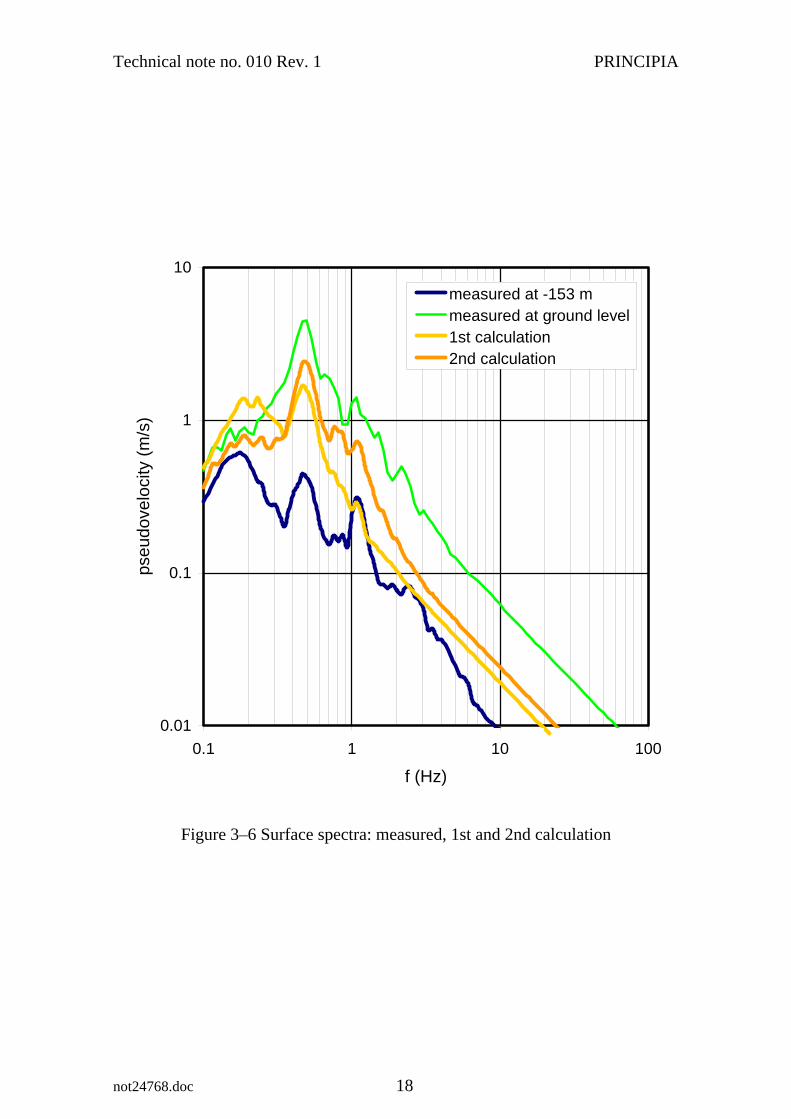
When the wave propagation analysis is repeated using the new curve, the spectral peak now occurs at the correct frequency (Figure 3–6). In this situation, the stiffness behaviour of the soil profile is taken to be approximately correct. However, it can also be seen that the spectral amplitudes are not adequate, which suggests that the damping assumed also needs to be refined.
Technical note no. 010 Rev. 1 PRINCIPIA
3.3 Damping at the resonant frequency
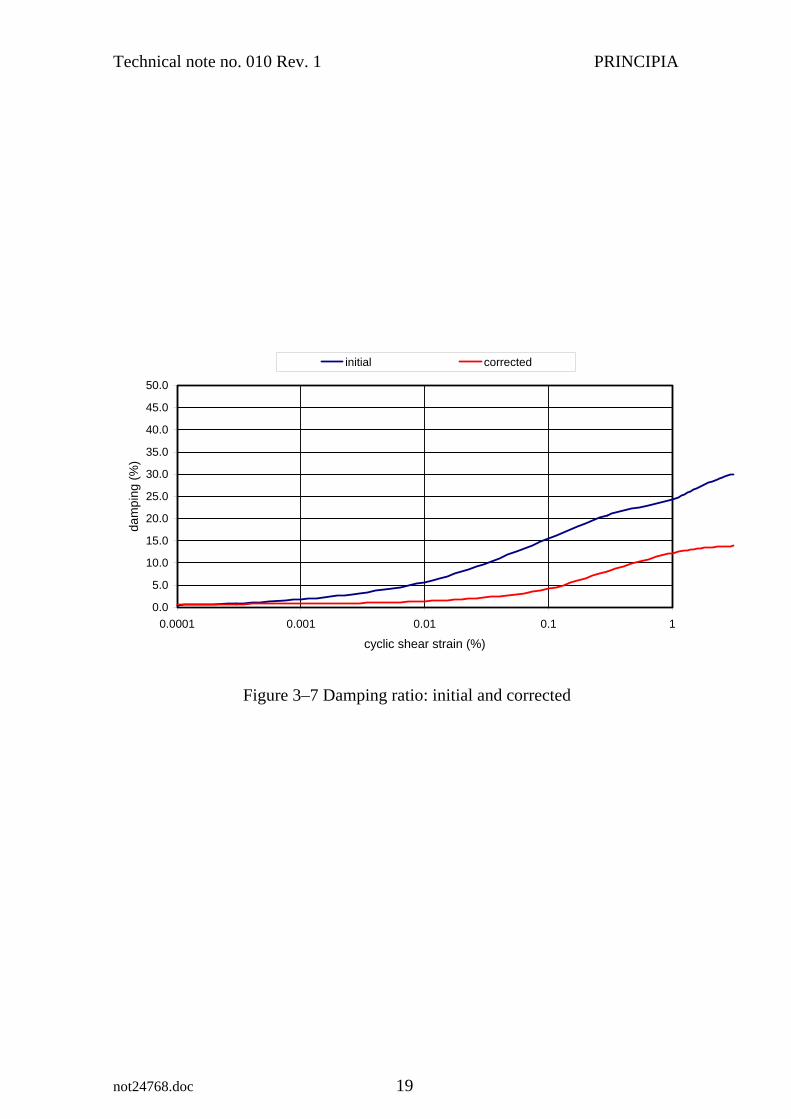
As in the previous section, the damping assigned to each strain level was modified with the goal of reproducing the spectral ordinate at the resonant peak. The new curve showing the increase in damping ratio with increasing strain level is plotted together with that initially assumed in Figure 3–7.
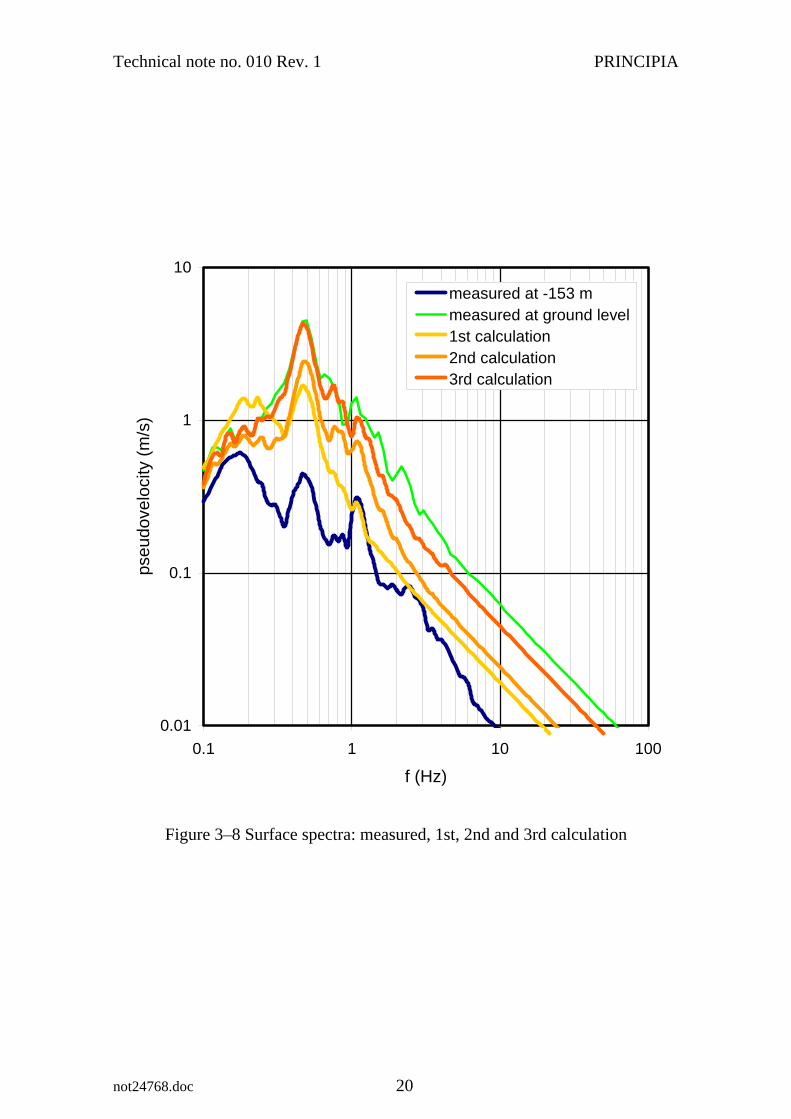
The wave propagation analysis was repeated once again using the modified damping characteristics. The results can be seen in Figure 3–8, which incorporates the newly calculated surface spectrum together with those already presented in Figure 3–6.
As evinced by the figure, the spectral peak now occurs at the right frequency and has the correct amplitude. Hence, both the stiffness characteristics of the soil profile and the energy dissipation at the natural frequency appear to be acceptable. However, this does not apply to the high frequency part of the spectrum, which the calculations seem to be overdamping.
3.4 Damping at other frequencies
The program SHAKE is a relatively standard tool for analysis of wave propagation in situations like the one studied here. The constitutive law that it uses is linearly viscoelastic:
γηγτ &+= G
where τ is the shear stress γ and γ& are the shear strain and strainrate G and η are a shear stiffness and viscosity
The values of G and η are adjusted so as to be compatible with the strain levels developed in the analysis, iterating the analysis until the necessary compatibility is achieved. This iterative methodology does not detract from the fact that, in each calculation and particularly in the final iteration, the soil behaviour is linear.
The energy dissipated during wave propagation is removed by stiffness damping, i.e.: a dashpot is introduced between any pair of nodes connected by a shear spring. From the viewpoint of the frequency dependence, the amount of damping introduced is directly proportional to the frequency of the oscillation.
not24768.doc 12
Technical note no. 010 Rev. 1 PRINCIPIA
not24768.doc 13
The above type of energy dissipation is clearly unjustified from a physical viewpoint, though this would create no problems if one had no interest in frequencies far away from that at which the damping has been calibrated. However, this is not the case here because the natural frequency of the profile is rather low, on the region of 0.5 Hz.
The actual soil response is usually fairly independent of frequency, with energy being dissipated by plastic hysteresis, not by viscosity. As a consequence, the fact that the damping ratio increases linearly with frequency can be expected to penalise the high frequencies excessively.
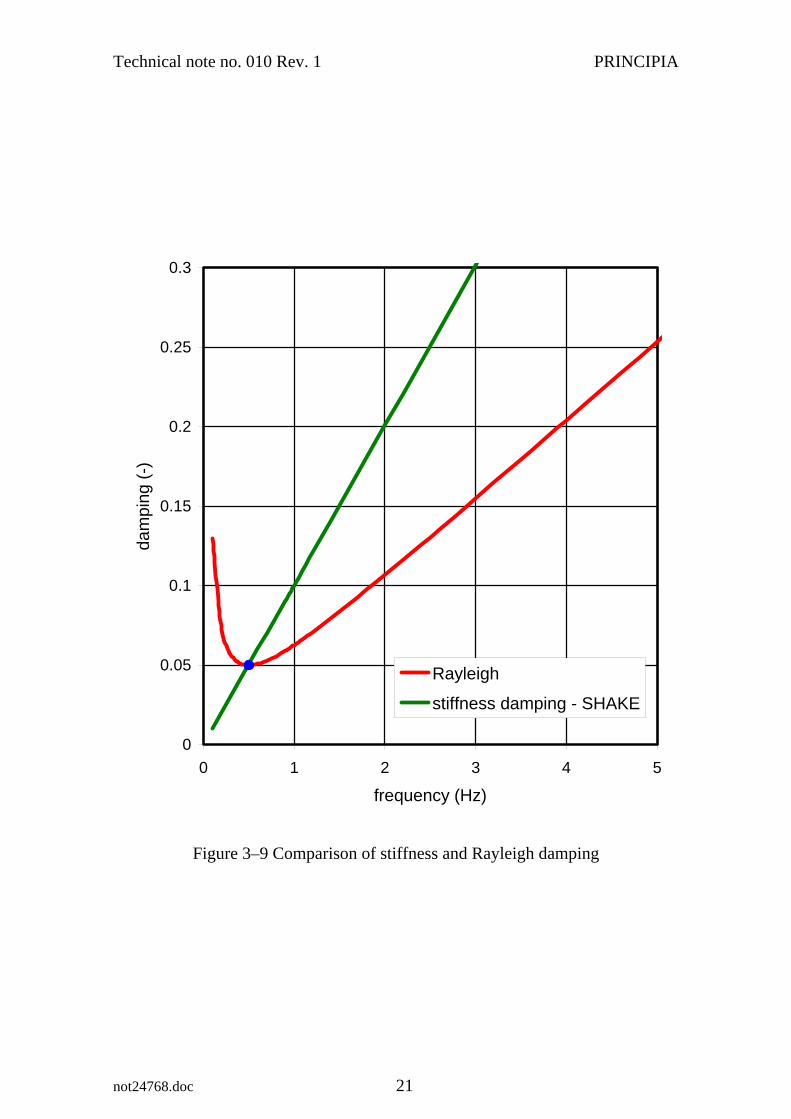
To remain within standard descriptions and methodologies, Rayleigh damping was adopted instead, including both the mass and stiffness components of the damping. This was done without modifying the damping ratio at the natural frequency of the profile. Figure 3–9 compares the damping ratio resulting at each frequency depending on whether SHAKE (only stiffness) damping was used or full Rayleigh damping was implemented while maintaining the damping ratio at the natural frequency.
The calculations can no longer be carried out with SHAKE, since it does not include Rayleigh damping in its formulation. Instead Abaqus (Simulia, 2007) was used to analyse the wave propagation.
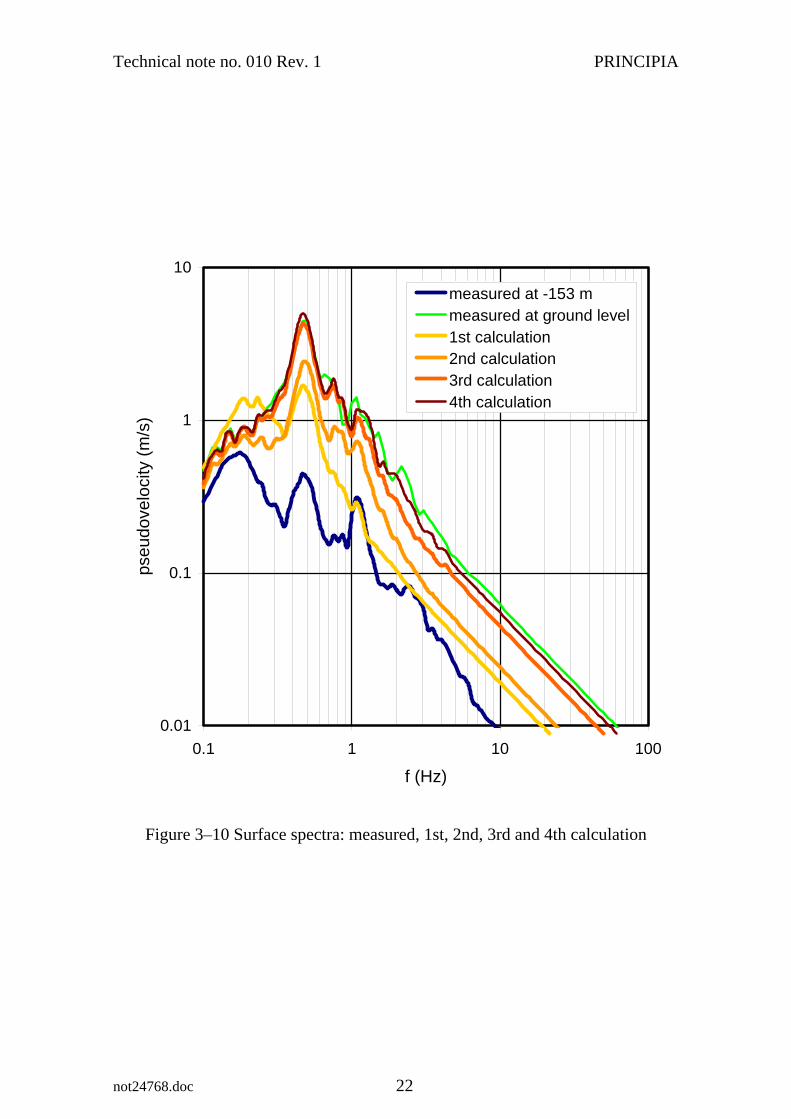
The results can be seen in Figure 3–10. A much better approximation to the recorded surface spectrum has finally been achieved. This approximation was deemed adequate for the present purposes, although a couple of important considerations are offered below.
First of all, though the calculated spectrum is now closer to that of the motions recorded at the surface, damping at high frequencies is still somewhat larger than real; a constant damping ratio would have probably given better results than Rayleigh damping.
Second, when introducing the kinematic interaction with the pile, the free field soil motions to be used will have to be those arising from the ABAQUS calculation, not the ones produced by SHAKE, which are overdamped at high frequencies.
Technical note no. 010 Rev. 1 PRINCIPIA
0.0
0.1
0.2
0.3
0.4
0.5
0.6
0.7
0.8
0.9
1.0
0.0001 0.001 0.01 0.1 1
cyclic shear strain (%)
G/G
max
(-)
Figure 3–1 Degradation of shear modulus with strain level
0.0
5.0
10.0
15.0
20.0
25.0
30.0
35.0
40.0
45.0
50.0
0.0001 0.001 0.01 0.1 1
cyclic shear strain (%)
dam
ping
(%)
Figure 3–2 Damping ratio as a function of strain level
not24768.doc 14
Technical note no. 010 Rev. 1 PRINCIPIA
0.01
0.1
1
10
0.1 1 10 100
f (Hz)
pseu
dove
loci
ty (m
/s)
measured at -153 mmeasured at ground level1st calculation
Figure 3–3 Response spectra: measured and calculated
not24768.doc 15
Technical note no. 010 Rev. 1 PRINCIPIA
0
1
2
3
4
0.1 1 10 100
f (Hz)
ampl
ifica
tion
Figure 3–4 Amplification of the calculated response spectra
not24768.doc 16
Technical note no. 010 Rev. 1 PRINCIPIA
0.0
0.1
0.2
0.3
0.4
0.5
0.6
0.7
0.8
0.9
1.0
0.0001 0.001 0.01 0.1 1
cyclic shear strain (%)
G/G
max
(-)
initial corrected
Figure 3–5 Modulus degradation: initial and corrected
not24768.doc 17
Technical note no. 010 Rev. 1 PRINCIPIA
0.01
0.1
1
10
0.1 1 10 100
f (Hz)
pseu
dove
loci
ty (m
/s)
measured at -153 mmeasured at ground level1st calculation2nd calculation
Figure 3–6 Surface spectra: measured, 1st and 2nd calculation
not24768.doc 18
Technical note no. 010 Rev. 1 PRINCIPIA
0.0
5.0
10.0
15.0
20.0
25.0
30.0
35.0
40.0
45.0
50.0
0.0001 0.001 0.01 0.1 1
cyclic shear strain (%)
dam
ping
(%)
initial corrected
Figure 3–7 Damping ratio: initial and corrected
not24768.doc 19
Technical note no. 010 Rev. 1 PRINCIPIA
0.01
0.1
1
10
0.1 1 10 100
f (Hz)
pseu
dove
loci
ty (m
/s)
measured at -153 mmeasured at ground level1st calculation2nd calculation3rd calculation
Figure 3–8 Surface spectra: measured, 1st, 2nd and 3rd calculation
not24768.doc 20
Technical note no. 010 Rev. 1 PRINCIPIA
0
0.05
0.1
0.15
0.2
0.25
0.3
0 1 2 3 4 5
frequency (Hz)
dam
ping
(-)
Rayleigh
stiffness damping - SHAKE
Figure 3–9 Comparison of stiffness and Rayleigh damping
not24768.doc 21
Technical note no. 010 Rev. 1 PRINCIPIA
0.01
0.1
1
10
0.1 1 10 100
f (Hz)
pseu
dove
loci
ty (m
/s)
measured at -153 mmeasured at ground level1st calculation2nd calculation3rd calculation4th calculation
Figure 3–10 Surface spectra: measured, 1st, 2nd, 3rd and 4th calculation
not24768.doc 22
Technical note no. 010 Rev. 1 PRINCIPIA
not24768.doc 23
4. KINEMATIC INTERACTION
4.1 Methodology
It was already mentioned that Eurocode 8 would require kinematic interaction to be considered in a situation like that described in chapter 2. However, it does not propose a specific methodology to be followed; it only clarifies the general aspects to be taken into account.
The methodology adopted here consists of two main steps:
− Seismic input and soil profile characterization, which were the object of the previous chapter.
− Interaction between the pile and the soil, analysed in the following sections.
The pile is modelled with beam elements, provided with the moment-curvature law given in section 2.3. The interaction with the soil has been assumed to be governed by p-y relations. Non-linear springs are located along the pile to represent the p-y curves: each spring has one end connected to the pile while the other undergoes the free field motions determined in the previous chapter.
The calculations are carried out by direct integration in the time domain, using an implicit integration scheme. This allows obtaining the histories of all variables at all points, as well as their peak values.
4.2 Results of the interaction
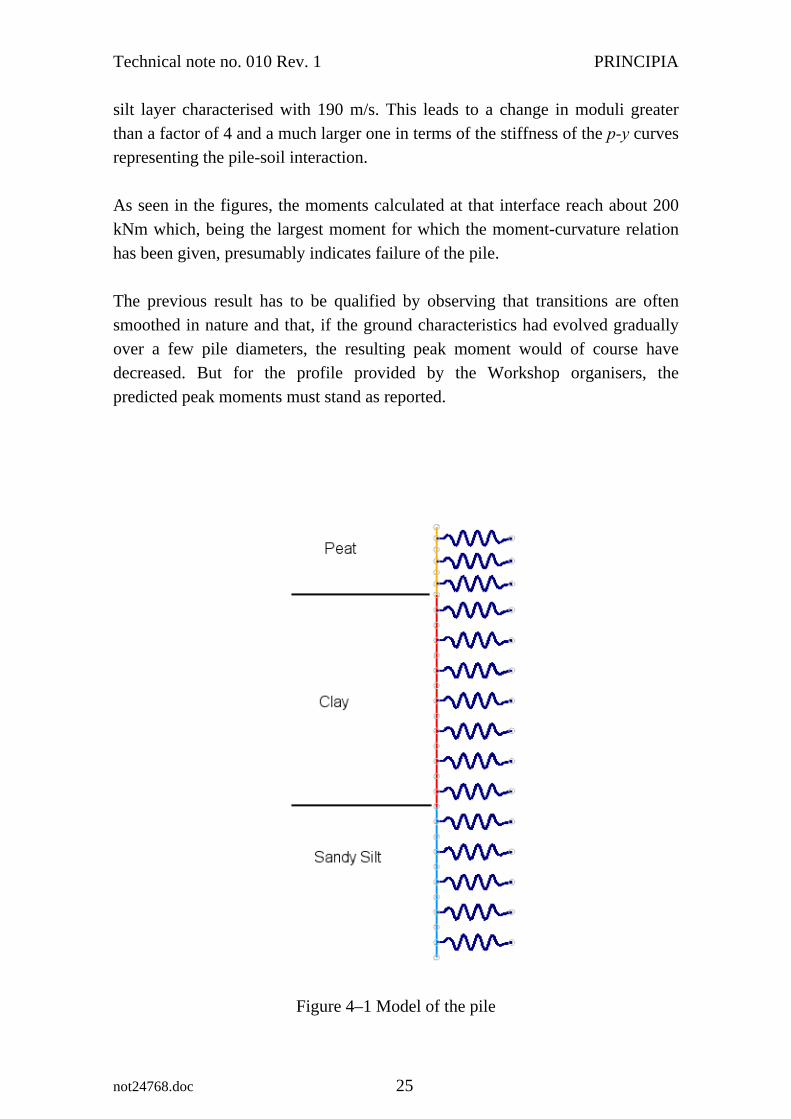
As indicated in the previous section, the pile is modelled as a series of 30 elements, with the nodes connected via p-y curves to the free field motions. The model of the pile, analysed with Abaqus, is shown in Figure 4–1.
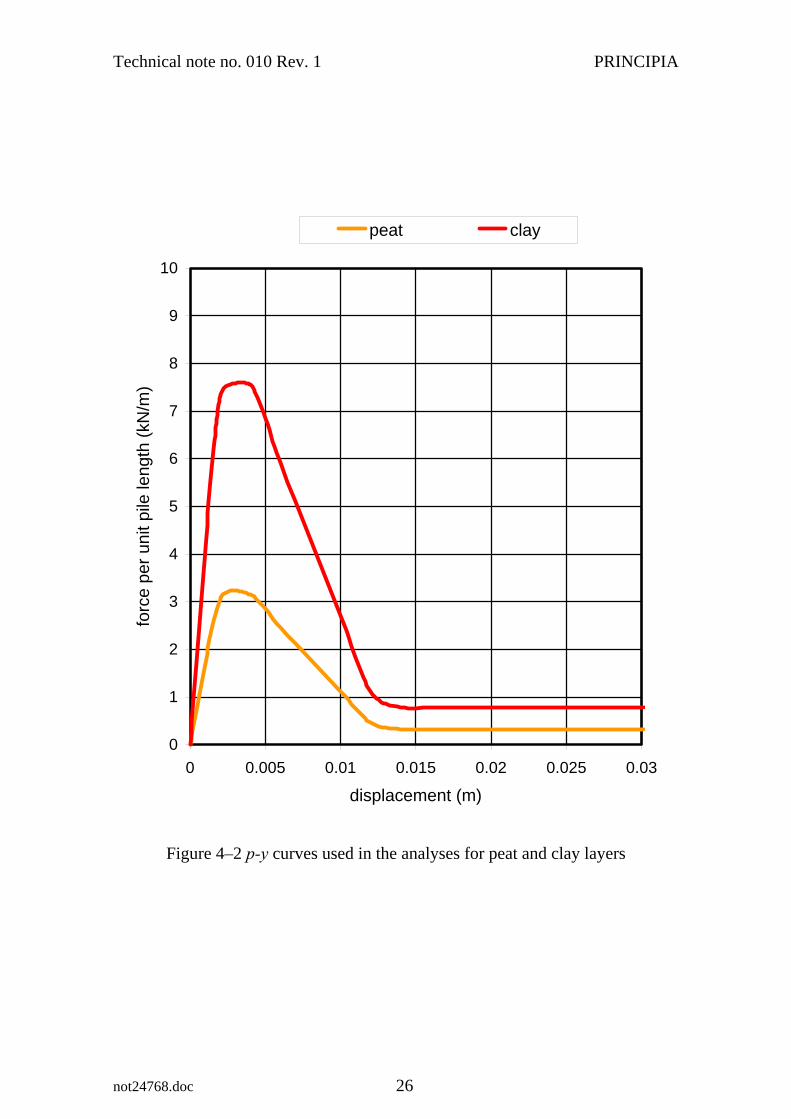
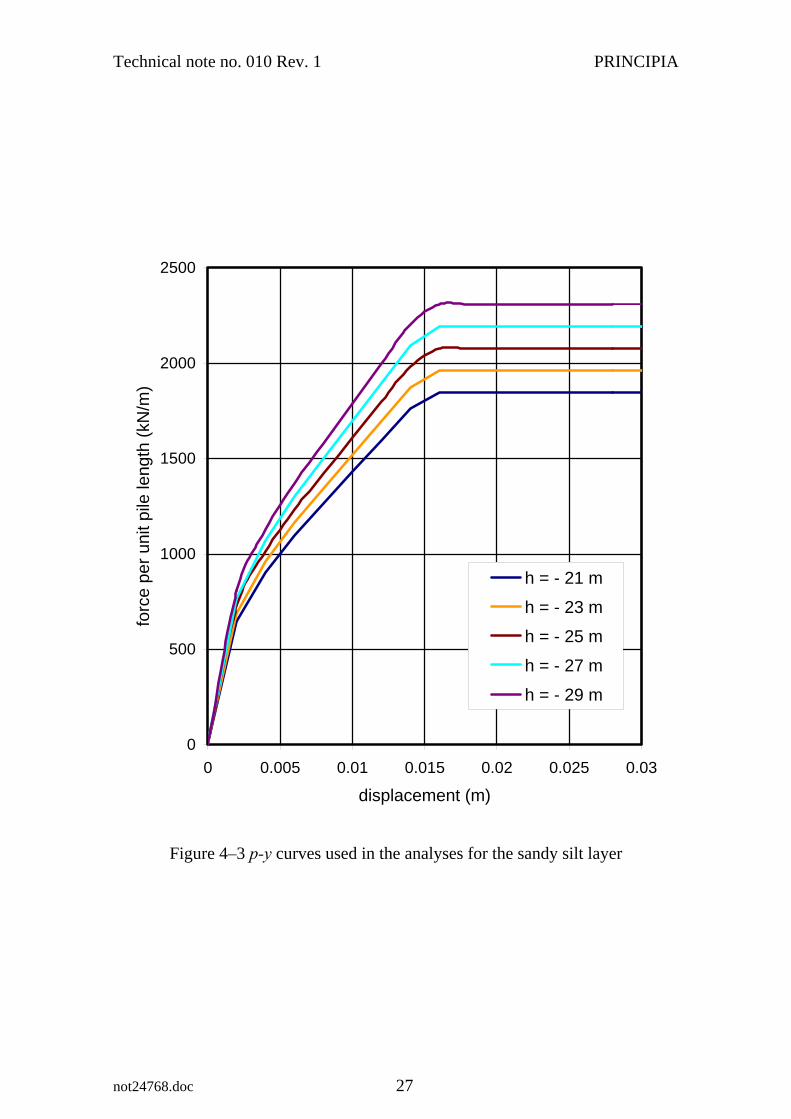
The p-y curves have been generated using the methodology given by Reese and Cox (1975) for the peat and the clayey layers and by Reese et al (1974) for the sandy silt layer. The resulting curves are shown in Figures 4-2 and 4-3 for the various materials and depths of interest. The curves are presented as force per unit pile length developed for each value of the relative displacement between the pile and the soil in free field.
Technical note no. 010 Rev. 1 PRINCIPIA
not24768.doc 24
It can be seen that there is a very large difference between the curves derived for the clay and the sand; although the size of that difference may be unrealistically large, the decision was made to remain within the commonly accepted practices. As will be seen later, that difference will have major consequences on the demands arising from kinematic interaction.
An unresolved question concerns the boundary conditions at the pilehead. In practical applications, the pilecap normally restrains the rotation of the pilehead; this, together with the inertial mass of the structure, leads to the development of large moments in the upper region of the pile.
Having a single pile and no inertial mass above, one possibility is to leave the pilehead free. The consequence would be that there are no moments at the pilehead, which is precisely the location where the moments are maximum in more realistic situations.
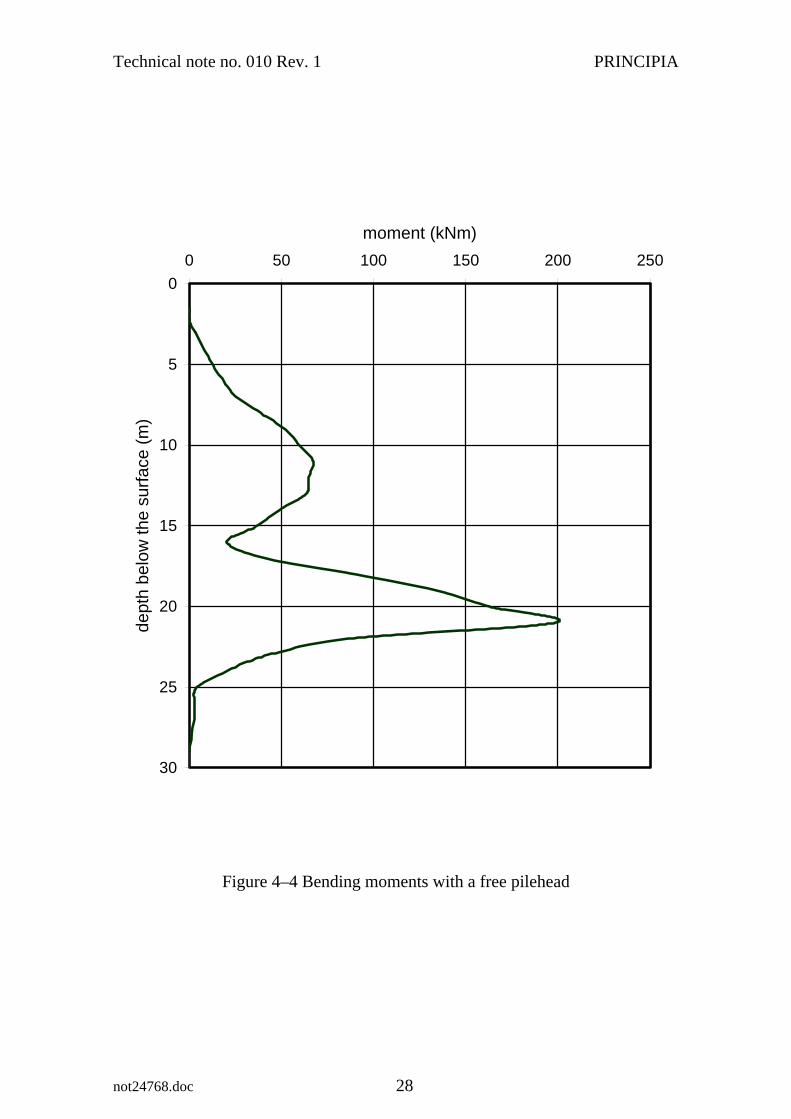
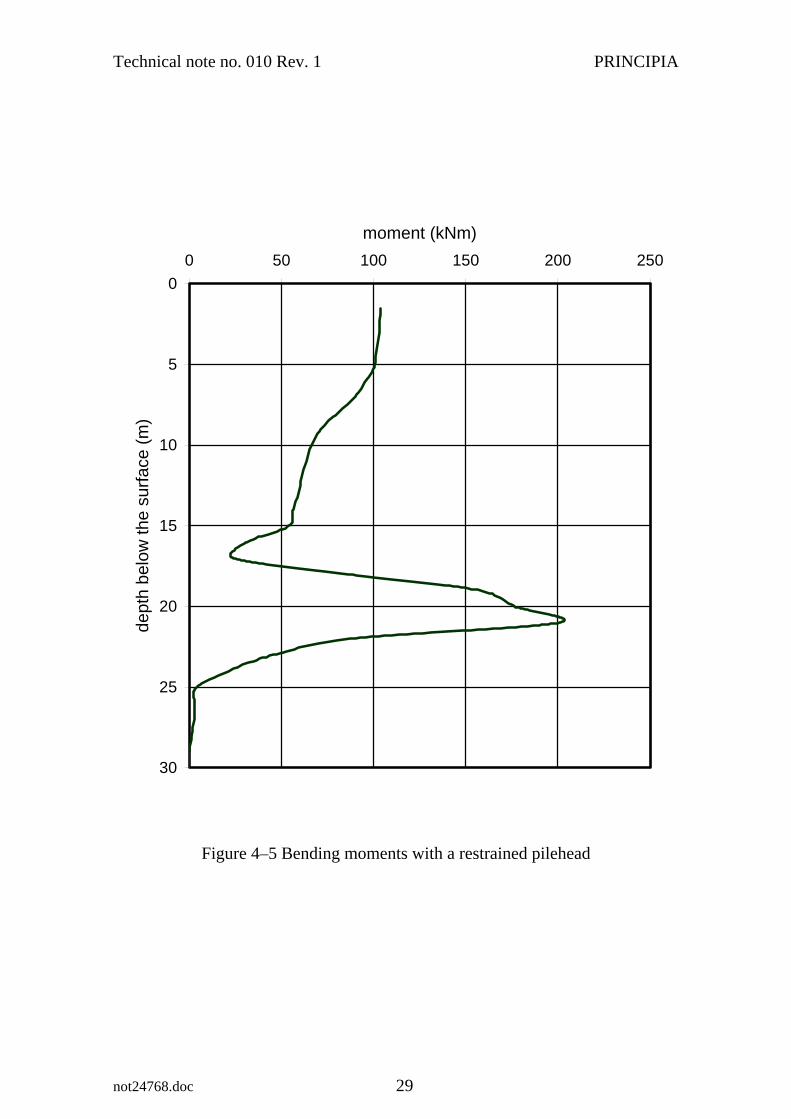
In view of these considerations, the decision was made to analyse the pile without an inertial mass above the pilehead, but with two different boundary conditions:
a) The pilehead is free to rotate and translate.
b) Rotations are fully restrained at the pilehead, though translations are not impeded.
The results obtained are shown in Figures 4–4 and 4–5, which correspond respectively to the case in which the pilehead is absolutely unrestrained and that in which no rotations are possible at the pilehead. It can immediately be seen that the influence of the boundary condition at the top affects only the upper part of the pile. However, it is not a negligible effect since the bending moment calculated at the pilehead is nearly 100 kNm, which is the point at which the moment-curvature law deviates from linearity, presumably indicating a departure from elasticity in the behaviour of the pile. The demands at the pilehead would have been greater if the inertial mass of the structure had been taken into account, which is not the case here.
From the viewpoint of kinematic interaction though, a simple perusal of Table 2–1 indicates that the worst problems must be expected at a depth of around 20 m, far below the region of the pile influenced by the superstructure. At that depth there is a transition from a clay layer with 90 m/s shear wave velocity to a sandy
Technical note no. 010 Rev. 1 PRINCIPIA
silt layer characterised with 190 m/s. This leads to a change in moduli greater than a factor of 4 and a much larger one in terms of the stiffness of the p-y curves representing the pile-soil interaction.
As seen in the figures, the moments calculated at that interface reach about 200 kNm which, being the largest moment for which the moment-curvature relation has been given, presumably indicates failure of the pile.
The previous result has to be qualified by observing that transitions are often smoothed in nature and that, if the ground characteristics had evolved gradually over a few pile diameters, the resulting peak moment would of course have decreased. But for the profile provided by the Workshop organisers, the predicted peak moments must stand as reported.
Figure 4–1 Model of the pile
not24768.doc 25
Technical note no. 010 Rev. 1 PRINCIPIA
0
1
2
3
4
5
6
7
8
9
10
0 0.005 0.01 0.015 0.02 0.025 0.03
displacement (m)
forc
e pe
r uni
t pile
leng
th (k
N/m
)
peat clay
Figure 4–2 p-y curves used in the analyses for peat and clay layers
not24768.doc 26
Technical note no. 010 Rev. 1 PRINCIPIA
0
500
1000
1500
2000
2500
0 0.005 0.01 0.015 0.02 0.025 0.03
displacement (m)
forc
e pe
r uni
t pile
leng
th (k
N/m
)
h = - 21 m
h = - 23 m
h = - 25 m
h = - 27 m
h = - 29 m
Figure 4–3 p-y curves used in the analyses for the sandy silt layer
not24768.doc 27
Technical note no. 010 Rev. 1 PRINCIPIA
0
5
10
15
20
25
30
0 50 100 150 200 250
moment (kNm)
dept
h be
low
the
surfa
ce (m
)
Figure 4–4 Bending moments with a free pilehead
not24768.doc 28
Technical note no. 010 Rev. 1 PRINCIPIA
0
5
10
15
20
25
30
0 50 100 150 200 250
moment (kNm)
dept
h be
low
the
surfa
ce (m
)
Figure 4–5 Bending moments with a restrained pilehead
not24768.doc 29
Technical note no. 010 Rev. 1 PRINCIPIA
not24768.doc 30
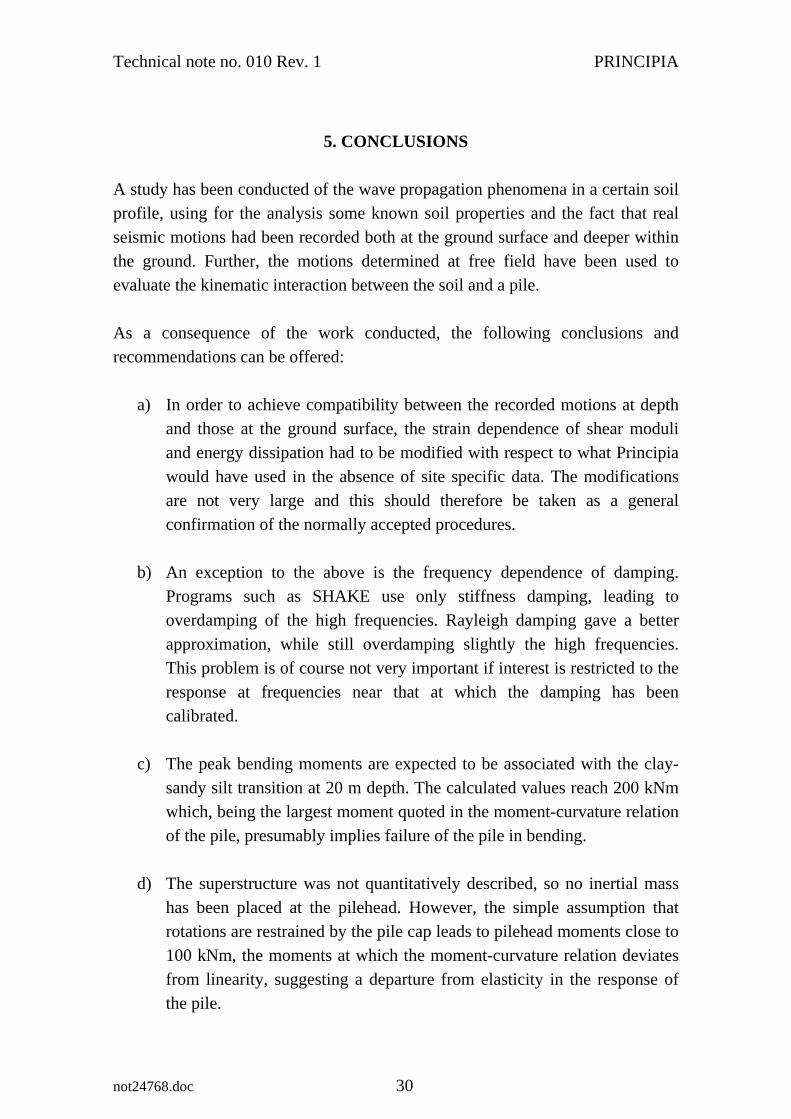
5. CONCLUSIONS
A study has been conducted of the wave propagation phenomena in a certain soil profile, using for the analysis some known soil properties and the fact that real seismic motions had been recorded both at the ground surface and deeper within the ground. Further, the motions determined at free field have been used to evaluate the kinematic interaction between the soil and a pile.
As a consequence of the work conducted, the following conclusions and recommendations can be offered:
a) In order to achieve compatibility between the recorded motions at depth and those at the ground surface, the strain dependence of shear moduli and energy dissipation had to be modified with respect to what Principia would have used in the absence of site specific data. The modifications are not very large and this should therefore be taken as a general confirmation of the normally accepted procedures.
b) An exception to the above is the frequency dependence of damping. Programs such as SHAKE use only stiffness damping, leading to overdamping of the high frequencies. Rayleigh damping gave a better approximation, while still overdamping slightly the high frequencies. This problem is of course not very important if interest is restricted to the response at frequencies near that at which the damping has been calibrated.
c) The peak bending moments are expected to be associated with the clay-sandy silt transition at 20 m depth. The calculated values reach 200 kNm which, being the largest moment quoted in the moment-curvature relation of the pile, presumably implies failure of the pile in bending.
d) The superstructure was not quantitatively described, so no inertial mass has been placed at the pilehead. However, the simple assumption that rotations are restrained by the pile cap leads to pilehead moments close to 100 kNm, the moments at which the moment-curvature relation deviates from linearity, suggesting a departure from elasticity in the response of the pile.

Technical note no. 010 Rev. 1 PRINCIPIA
not24768.doc 31
e) Had the clay-sandy silt transition at 20 m depth been gradual rather than sudden, the peak in the predicted bending moments would have probably been smaller.

Technical note no. 010 Rev. 1 PRINCIPIA
not24768.doc 32
Appendix I. References
Technical note no. 010 Rev. 1 PRINCIPIA
not24768.doc 33
ASCE - American Society of Civil Engineers (1999) “Standard 4–98. Seismic Analysis of Safety-Related Nuclear Structures and Commentary”.
CEN – European Comitee for Standarization (2004) “EN 1998-1. Eurocode 8: Design of Structures for Earthquake Resistance - Part 1: General Rules, Seismic Actions and Rules for Buildings”, European Standard, December.
Schnabel, P.B., Lysmer, J. and Seed, H.B. (1972) “SHAKE. A computer Program for Earthquake Response Analysis of Horizontally Layered Sites”, University of California Berkeley, Report no. EERC 72-12, December.
Simulia (2007) “Abaqus Analyisis User’s Manual. Version 6.7”, May.
Reese, L.R. and Cox, W.C. (1975) “Field Testing and Analysis of Laterally Loaded Piles in Stiff Clay”, Offshore Technology Conference, Dallas, Texas, paper no. 2312.
Reese, L.R., Cox, W.C. and Koop, F.D. (1974) “Analysis of Laterally Loaded Piles in Sand”, Offshore Technology Conference, Dallas, Texas, paper no. 2080.