Embed Size (px)
Citation preview

A N A B U N DA N C E O F O P P O R T U N I T Y
Infrastructure Investment in BrazilA N A B U N DA N C E O F O P P O R T U N I T Y
Infrastructure Investment in Brazil


Infrastructure Investment in Brazil: An Abundance of Opportunity
1Duff & Phelps
PreambleThis paper provides an overview of the Infrastructure sector in Brazil and assesses the current
landscape of opportunities that may be available to private capital investors. We examine Brazil’s
level of infrastructure investment relative to other emerging economies and review potential
needs by subsector. We also highlight certain actions, developments and programs that have
aimed to support private investment within the sector and review key characteristics of
infrastructure investments that attract interest in the asset class globally. Finally, we share a few
case studies demonstrating the attractiveness of infrastructure investments in Brazil.
Executive SummaryBrazil has the world’s fifth largest population, and its gross domestic product places it among
the 10 largest economies. Brazil benefits from an abundance of natural resources, and this
abundance positions the country as a global leader in the production and exportation of several
key commodities. The country also has the 10th largest industrial production in the world.
Yet, despite the country’s position in the global economy and its expanding, urban-concentrated
population, Brazil’s investment in infrastructure has lagged behind that of other large countries
and emerging economies. Brazil’s infrastructure ranks 73rd in the world, according to the World
Economic Forum’s Global Competitiveness Index. This disparity between Brazil’s infrastructure
and the country’s broader demographics and economic standing may indicate a significant
incremental opportunity for private capital investors across virtually all relevant subsectors,
including Energy, Logistics, Telecom, Sewage and Water.
Private capital investment in infrastructure continues to be supported by economic policies and
programs sponsored by the Brazilian government, and recent policy changes at Brazil’s
development bank O Banco Nacional do Desenvolvimento are expected to result in expanded
private market activity going forward.
Private investment in the Brazilian Infrastructure sector has emerged over the past couple of
decades, with several domestic and global alternative investment managers entering the market.
Given the disparity that persists in Brazil’s level of infrastructure investment today, the
opportunity for private investors within the sector may continue to accelerate going forward.

S E C T I O N 1
The Infrastructure Landscape in Brazil

Infrastructure Investment in Brazil: An Abundance of Opportunity
3Duff & Phelps
An examination of the Infrastructure sector in Brazil reveals a significant disparity between the level of infrastructure investment and the size of the country’s economy – and such disparity may present an attractive opportunity for investors.
Brazil has the fifth largest population in the world, and its gross domestic product (GDP) of
approximately $2.1 trillion1 places the country among the 10 largest economies. With more than
140 million hectares of productive land, Brazil’s abundance of natural resources positions the
country as a global leader in the production and/or export of several commodities, including
coffee, iron ore, meat, orange juice, pulp and paper, soybeans and sugar.2 Brazil’s industrial
production ranks 10th globally, and the country’s pharmaceutical and information technology
markets are the seventh and eighth largest in the world, respectively.
As Brazil emerges from a recent recession, GDP is forecasted to expand approximately 2.6%
per year, on average, between 2019 and 2022.5 The country’s population of more than 200
million, over 80% of which resides in urban areas, is expected to peak at 233 million in 2047 and
stabilize at 228 million by 2060.6 However, despite the country’s expanding population and
position in the global economy, Brazil’s investment in infrastructure has lagged behind that of
other large countries and emerging economies.
The Global Competitiveness Index (GCI), developed by the World Economic Forum, measures
the performance of 137 countries in 12 areas of competitiveness. In the World Economic
Forum’s 2017-2018 Global Competitiveness Report, Brazil’s infrastructure competitiveness, as
measured by the GCI was ranked 73rd.7
Top 10 Countries by GDP (Trillions of $) and Global Competitiveness Index Infrastructure Rank
1. World Bank, 2017.2. Folha de São Paulo. Available at https://www1.folha.uol.com.br/mercado/2018/05/brasil-assume-lideranca-mundial-na-producao-de-soja-segundo-eua.shtml.3. Overview of the Brazilian Private Equity and Venture Capital Industry.4. Overview of the Brazilian Private Equity and Venture Capital Industry.5. Brazilian Central Bank’s Market Expectation System.6. Instituto Brasileiro de Geografia e Estatística.7. World Economic Forum – The Global Competitiveness Report 2017-2018.
9
UnitedStates
Source: World Bank and Global Competitiveness Index
46
China Japan
410
11
UnitedKingdom
66
India
7
France
73
Brazil
27
Italy
16
CanadaGermany
25
20
15
10
5
0
Despite being the eighth largest economy in the world, Brazil is ranked 73rd out of 137 countries in terms of infrastructure,according to the World Economic Forum’sGlobal Competitive Index.

Infrastructure Investment in Brazil: An Abundance of Opportunity
4Duff & Phelps
A closer assessment of Brazil’s investment in infrastructure relative to other emerging economies
indicates a similar disparity. Between 2000 and 2013, Brazil’s average annual investment in
infrastructure as a percentage of GDP, approximately 2%, ranked behind other countries in the
body known as “BRICS” (Brazil, Russia, India, China and South Africa).
Between 2011 and 2016, Brazil invested an average of 2.2% of GDP in the
Infrastructure sector.8 In 2017, as Brazil’s economy began to recover from a deep
recession, infrastructure investment declined further to 1.4% of GDP, or R$87 billion.
Such a level of investment did not fully cover the annual depreciation of existing
infrastructure assets, which was estimated at R$91 billion.9 To merely return to levels
achieved between 2011 and 2016, it is estimated that investment of R$323 billion
would be required between 2018 and 2019,10 two-thirds of which would compensate
for depreciation alone.
According to the January 2018 report “Projeto Infra2018, Consulta Publica 01” (the
“Infra2018 Report”), Brazil’s infrastructure stock, a measurement of a country’s
infrastructure assets as a percentage of GDP, was approximately 36% in 2017.11 The
Infra2018 Report estimates that Brazil would need to increase its infrastructure stock
to approximately 77% over the next 20 years to rank among the top 20 according to the GCI on
infrastructure.12 To achieve such levels, it is estimated that annual infrastructure investment as a
percentage of GDP must increase to 6.5% in 2018. Such improvement would require as much
as R$8.8 trillion in incremental infrastructure investment over the next 20 years.13
Infrastructure Stock Projection by Type in Brazil (R$ billion)
Average Investment as % of GDP
From 2000 to 2013
India Russia SouthAfrica
Brazil
9%
5% 4% 4%2%
China
Source: World Bank
8. According to Infraestrutura e Regulação report by Oliver Wyman – 2018.9. Projeto Infra2018. Consulta Pública 01 – January 2018.10. Projeto Infra2018. Consulta Pública 01 – January 2018.11. Projeto Infra2018. Consulta Pública 01 – January 2018.12. Throughout this paper, we will include references to the Infra2018 Report and its estimates of the incremental investment in infrastructure required for Brazil to achieve a ranking among the top
20 countries according to the GCI on infrastructure to further illustrate the potential investment opportunity within the asset class.13. Projeto Infra2018. Consulta Pública 01 – January 2018.
0
1,000
2,000
3,000
4,000
5,000
6,000
7,000
8,000
0%
10%
20%
20162018
20202022
20242026
20282030
20322034
20362038
30%
Infrastructure Stock as % of GDP
Energy
Telecom
Water and Sewage
Logistic
40%
50%
60%
70%
80%
90%
Source: Infra2018 Report

Infrastructure Investment in Brazil: An Abundance of Opportunity
5Duff & Phelps
20172018
20192020
20212022
20232024
20252026
20272028
20292030
20312032
20332034
20352037
0%
1.00%
2.00%
3.00%
4.00%
5.00%
6.00%
7.00%
Brazil
India
China
Source: Brazil: Infra2018; China and India: Global Infrastructure Outlook
20362038
Infra
stru
ctur
e sp
endi
ng a
s %
of G
DP
During the same time period, infrastructure spending as a percentage of GDP is expected to
decline in both China and India, further underscoring the potential for a growing investment
opportunity within the sector in Brazil.
Estimated Infrastructure Investment (% of GDP)

Infrastructure by Sector
Infrastructure Investment in Brazil: An Abundance of Opportunity
6Duff & Phelps
R$2.339 billionR$1.447 billionR$942 billion R$4.101 billion
LogisticsEnergy
(excludes Oil and Gas)TelecomWater and
Sewage
40%34%
11%
15%
Total Required Investment by Sector to Achieve Top 20 Infrastructure Ranking by 2038,
According to the Global Competitiveness Index (R$ billion)
According to the Infra2018 Report, nearly three-quarters of Brazil’s infrastructure stock as of 2017 comprised assets in the Energy and Logistics sectors.
Infrastructure Stock by Sector
Source: Infra2018 Report
Source: Infra2018 Report

The Energy sector in Brazil is expected to continue to demand significant investment over the
medium to long term. Energy demand in Brazil is expected to increase by 22% over the next
eight years, with installed capacity forecasted to expand to 209.1 gigawatts by 2024 from 98
gigawatts in 2015.14
Electric Energy Matrix (%) and Installed Capacity (GW)
Brazil generates a majority of its energy through hydropower assets, and investment within this
subsector has been quite strong in recent years, as evidenced by the development of the Belo
Monte hydropower plant, the third largest of its kind in the world. The plant is estimated to have
cost more than R$30 billion.15
By 2026 renewable wind and solar generation capacity are expected to increase from 6% to
10% of total installed capacity.16
According to the Infra2018 Report, for Brazil’s infrastructure to achieve a top-20 ranking by
2038 in the World Economic Forum’s GCI, approximately R$2.339 billion in investment within
the Energy sector would be required over the next 20 years.17
Infrastructure Investment in Brazil: An Abundance of Opportunity
7Duff & Phelps
Energy
14. Empresa de Pesquisa Energética a Brazilian governmental agency.15. According to Gazeta do Povo newspaper Da índia Tuíra à Lava Jato: Belo Monte coleciona polêmicas há mais de 40 anos. Available at https://www.gazetadopovo.com.br/politica/republica/
da-india-tuira-a-lava-jato-belo-monte-coleciona-polemicas-ha-mais-de-40-anos-77or1lqx7sv4f4us0b0vvy3ic/16. Empresa de Pesquisa Energética a Brazilian governmental agency.17. According to Infra2018 Report estimates to reach rank 20 of infrastructure criteria of World Economic Forum’s Global Competitive Index by 2038.
2005 2015 2024*
76%
75.2
22%
21.8
1%
1
62%
86.8
22%
30.8
8%
11.2
5%
7
3%
4.2
62%
118
16%
33.2
9%
18.6
12%
24.8
4%
8.3
3%
6.2
Hydropower Thermal Small Hydropower Wind SolarBiomass
Source: Strategy&’s Os Desafios do Sistema Elétrico Brasileiro report
* Expected

Infrastructure Investment in Brazil: An Abundance of Opportunity
8Duff & Phelps
LogisticsLogistics infrastructure plays an important role in all countries but is of particular importance in
Brazil given the country’s growing population, geographic expanse and position as a leading
global exporter of key commodities. According to the World Bank’s Logistics Performance Index,
Brazil’s logistics infrastructure ranked 56th out of 160 countries as of 2018.
Logistics Performance Index by Performance, With Rank Displayed (2018)
The Infra2018 Report estimates that approximately R$4.1 trillion in
logistics investment would be required over the next 20 years for
Brazil’s infrastructure to achieve a top 20 ranking in the GCI18.
Total Investment Needed per Logistics Segment to be One of the Top
20 Best Countries in Infrastructure by 2038 (R$ billion)
Source: Infra2018 Report
1.764
990
816
192
339
Roadways
Railways
Ports
Airports
Mobility
Russia
Argentina
Mexico
India
Chile
South Africa
China
United States
United Kingdom
Japan
Germany
Brazil
Source: World Bank
1
9
14
26
33
34
44
51
56
61
75
5
18. According to Infra2018 Report estimates to reach rank 20 of infrastructure criteria of the World Economic Forum’s Global Competitive Index by 2038.

Infrastructure Investment in Brazil: An Abundance of Opportunity
9Duff & Phelps
R OA D WAYS
More than 60% of freight transportation in Brazil occurs over roadways.19 However, only 13% of
Brazil’s 1.6 million kilometer (km) road network is paved – a much smaller percentage compared
to that of Russia, China or the United States.20
Freight Transportation Matrix in Brazil Freight Transportation
Although the opportunity to expand and enhance Brazil’s roadway network appears to be
significant, only approximately 19,000 kilometers of the existing network are currently under
concession to the private sector21 (totaling approximately R$35 billion in investment
since 199522).
According to the Infra2018 Report, for Brazil’s infrastructure to achieve a top 20 ranking by
2038 in the World Economic Forum’s GCI, approximately R$1.764 billion in investment in the
Roadways sector would be required over the next 20 years.23
19. Pesquisa CNT de Rodovias – 2015.20. CIA’s World Factbook.21. Nexo Jornal.22. According to Brazilian Trade and Investment Promotion Agency.23. According to Infra2018 Report estimates to reach rank 20 of infrastructure criteria of the World Economic Forum’s Global Competitive Index by 2038.
Source: Confederação Nacional do Transporte
20.7%
13.5%
4.2%0.4%
61.1%
RoadwaysRail
Water
PipelinesAir
RussiaBrazil China UnitedStates
Paved Highways
Unpaved Highways
13%
1.581 1.283
4.577
6.587
65%
88%
72%
Source: CIA’s World Factbook
Total Highway Length (km thousand) and Paved
Highway Participation (%) by Country

Infrastructure Investment in Brazil: An Abundance of Opportunity
10Duff & Phelps
R AILWAYS
Brazil’s railway network of more than 29,000 kilometers is the ninth longest in the world.24 Since
1992, the Brazilian government has supported a concessions program for the development of
the railway system. There are currently 14 railways in Brazil that are under concession (equivalent
to approximately 25,000 kilometers of railway),25 and new expansions were announced in July
2018, including Ferrovia de Integração do Centro-Oeste, a 383-kilometer railway between the
states of Mato Grosso and Goiás to be built by the private sector for approximately R$4 billion.26
The Ferroanel de São Paulo, with 53 kilometers, is another railway to be built by the private
sector, for an estimated R$5 billion.27
Between 2006 and 2017, railway production28 increased by 57.4%.29
Railway Production per Year (tons transported)*
Source: Agência Nacional de Transportes Terrestres
*Railway production is a measurement of physical effort usual to the sector. It is obtained by multiplying the
weight transported by the distance.
According to the Infra2018 Report, for Brazil’s infrastructure to achieve a top 20 ranking by
2038 in the World Economic Forum’s GCI, approximately R$990 billion of railway investment
would be required over the next 20 years.
0
50
100
150
200
250
300
350
400
201720162015201420132012201120102009200820072006
R$
bill
ions
24. Ferrovias de Carga Brasileiras: Uma Análise Setorial, by BNDES.25. Agência Nacional de Transportes Terrestres.26. Agência Brasil Governo anuncia parcerias com Vale e MRS para construir ferrovias. Available at http://agenciabrasil.ebc.com.br/economia/noticia/2018-07/governo-anuncia-parcerias-com-
vale-e-mrs-para-construir-ferrovias.27. Estadão newspaper Governo Antecipa Renovação de Concessões. Available at https://economia.estadao.com.br/noticias/geral,governo-antecipa-renovacao-de-concessoes,7000238286128. Railway production is a measurement of physical effort usual to the sector. It is obtained by multiplying the weight transported by the distance.29. Agência Nacional de Transportes Terrestres.

Infrastructure Investment in Brazil: An Abundance of Opportunity
11Duff & Phelps
M O B I L I T Y
Given the completion of new subway lines in São Paulo and Rio de Janeiro, in addition to the
development of Rapid Bus Transport in Rio de Janeiro and Belo Horizonte Minas Gerais,
investment in mobility infrastructure has been quite active over the past few years. It is
anticipated that approximately R$235 billion of incremental investment in mobility infrastructure
would be required to address capacity constraints in the 15 largest metropolitan areas.30
Further, according to the Infra2018 Report, for Brazil’s infrastructure to achieve a top 20 ranking
by 2038 in the World Economic Forum’s GCI, approximately R$816 billion of mobility
infrastructure investment would be required over the next 20 years.31
P O R T S A N D A I R P O R T S
Investment in the continued development of Brazil’s ports, a significant portion of which has come
from the private sector historically, is expected to increase substantially over the next two decades.
Capacity is expected to increase by 92% between 2015 to 2042, and such expansion could
require as much as R$51.3 billion in incremental investment over this time period.32
Over the past several years, the private sector has also increased its investment in Brazil’s
airports. In 2011, the federal government made the first concession of an airport project in Natal
Rio Grande do Norte. Since then, nine additional concessions were granted, including major
projects in Brasília Distrito Federal, Galeão Rio de Janeiro and Guarulhos São Paulo. Combined,
the airport concessions have increased Brazil’s airport capacity by 71.5%.
According to the Infra2018 Report, for Brazil’s infrastructure to achieve a top 20 ranking by
2038 in the World Economic Forum’s GCI, approximately R$531 billion of investment in ports
and airports would be required over the next 20 years.
30. According to Valor Setorial magazine – June 2018.31. According to the Plano Nacional de Logística Portuária (PNLP).32. UOL Economia Após privatização, aeroportos pioraram ou melhoraram? Especialistas avaliam... Após privatização, aeroportos pioraram ou melhoraram? Especialistas avaliam.... Available at
https://todosabordo.blogosfera.uol.com.br/2017/08/31/aeroporto-privatizacao-concessao-guarulhos-confins-galeao-brasilia.

Infrastructure Investment in Brazil: An Abundance of Opportunity
12Duff & Phelps
TelecomBrazil’s Telecom sector constitutes approximately 10% of GDP.33 Investment in the sector
reached R$28 billion in 2017, which was flat relative to 2016 but below investment levels in
2013-2015.34 Investment levels for 2013-2015 were elevated due in part to Brazil’s hosting of
the FIFA World Cup in 2014 and the Summer Olympics in 2016, among other events. Such
events played an important role in the modernization of Brazil’s telecom infrastructure.
Despite Brazil’s ranking as the fourth largest internet user in the world, the country’s
average broadband speed is below that of other emerging countries in Latin America,
including Chile, Mexico and Uruguay.35
In the past five years, Brazil has seen considerable enhancements in its mobile
connectivity, as the number of cities with 4G networks grew from 119 to 4,071,
reaching 94% of the population.36 Mobile connectivity is very important in Brazil since
77.3% of households have access to the internet through mobile devices, whereas
71.4% of the households have access to fixed broadband connections.37
According to the Infra2018 Report, for Brazil’s infrastructure to achieve a top 20
ranking by 2038 in the World Economic Forum’s GCI, approximately R$1.447 billion of
investment in telecom would be required over the next 20 years.38
Average Broadband Speed (Mbps, 2017)
33. Associação Brasileira de Telecomunicações.34. Tabela Referência de Indicadores Para Análise – June 2018 from Associação Brasileira de Telecomunicações.35. According to International Telecommunication Union (UN) statistics in 2016. Available at https://www.itu.int/en/ITU-D/Statistics/Pages/stat/default.aspx36. Tabela Referência de Indicadores Para Análise – June 2018 from Associação Brasileira de Telecomunicações.37. Associação Brasileira de Internet. Available at http://www.abranet.org.br/Noticias/PNAD-IBGE:-cerca-de-70%25-dos-domicilios-tem-acesso-a-Internet-1787.html38. According to Infra2018 Report estimates to reach rank 20 of infrastructure criteria of the World Economic Forum’s Global Competitive Index by 2038.
20172016201520142013
31.4 32.6 31.028.3 28.0
Source: Telebrasil
Annual Telecom Investment
(R$ billion)
0
5
10
15
20
25
30
Paragu
ay
Colombia
Latam
and
Caribb
ean
Argen
tina
India
South
Africa
Brazil
Emerge
nts
Mexico
China
Chile
Urugu
ay
Russia
OECD
United
Stat
es
South
Kor
ea
15.4
9.5 9.37.6 7.5 7.4 6.8 6.7 6.5 6.3 6.2 5.5
1.4
11.8
18.7
28.6
Source: Infraestrutura e Regulação report by Oliver Wyman
Infrastructure Investment in Brazil: An Abundance of Opportunity
13Duff & Phelps
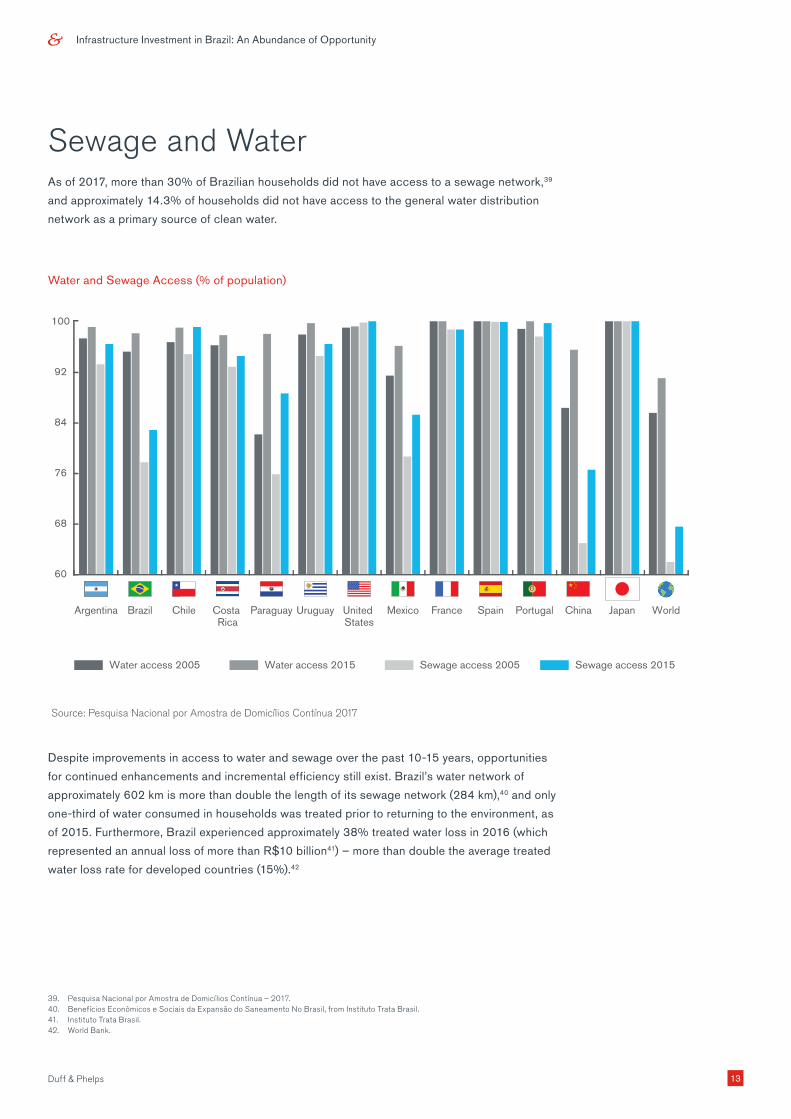
Sewage and WaterAs of 2017, more than 30% of Brazilian households did not have access to a sewage network,39
and approximately 14.3% of households did not have access to the general water distribution
network as a primary source of clean water.
Water and Sewage Access (% of population)
Despite improvements in access to water and sewage over the past 10-15 years, opportunities
for continued enhancements and incremental efficiency still exist. Brazil’s water network of
approximately 602 km is more than double the length of its sewage network (284 km),40 and only
one-third of water consumed in households was treated prior to returning to the environment, as
of 2015. Furthermore, Brazil experienced approximately 38% treated water loss in 2016 (which
represented an annual loss of more than R$10 billion41) – more than double the average treated
water loss rate for developed countries (15%).42
39. Pesquisa Nacional por Amostra de Domicílios Contínua – 2017.40. Benefícios Econômicos e Sociais da Expansão do Saneamento No Brasil, from Instituto Trata Brasil.41. Instituto Trata Brasil.42. World Bank.
60
68
76
84
92
100
WorldJapanChinaPortugalSpainFranceMexicoUnited States
UruguayParaguayCosta Rica
ChileBrazil
Water access 2005
Argentina
Source: Pesquisa Nacional por Amostra de Domicílios Contínua 2017
Water access 2015 Sewage access 2005 Sewage access 2015

Infrastructure Investment in Brazil: An Abundance of Opportunity
14Duff & Phelps
International Treated Water Loss Index (%)
According to the Infra2018 Report, for Brazil’s infrastructure to achieve a top 20 ranking by
2038 in the World Economic Forum’s GCI, approximately R$952 billion of investment in water
and sewage infrastructure would be required over the next 20 years.43
0 10 20 30 40 50 60
Denmark (2015)
Australia (2013)
Congo (2014)
Argentina (2014)
Costa Rica (2010)
Colombia (2010)
Uruguay (2011)
Norway (2016)
Honduras (2014)
Brazil (2016)
Peru (2014)
United States (2011)
South Korea (2014)
China (2012)
United Kingdom (2016)
Belgium (2015)
Mexico (2012)
South Africa (2014)
Uganda (2016)
Ethiopia (2016)
Ecuador (2010)
Senegal (2014)
Bangladesh (2017)
6.9
10.3
12.8
16.3
20.5
20.6
20.6
21.6
24.1
26.8
28.0
28.5
31.1
33.2
35.6
38.5
39.6
41.0
41.3
42.0
49.3
47.6
47.5
Source: Instituto Trata Brasil
43. According to Infraestrutura e Regulação report by Oliver Wyman – 2018.
Infrastructure Investment in Brazil: An Abundance of Opportunity
15Duff & Phelps
Potential Catalysts for Private Investment
U N D E R F U N D E D P U B L I C P R O G R A M SIn 2015, during the depths of Brazil’s recession, only 37% of mandated public infrastructure
programs were ultimately funded.44 In 2017, the funding level of such programs reached 60% of
their mandate, indicating that a significant funding gap remains.
F O R E I G N E XC H A N G E R AT E T R E N D SRecent fluctuations in the exchange rate for the Brazilian real and the resulting potentially
favorable entry point to Brazilian infrastructure investments may attract the attention of foreign
investors. By the end of 2018, the U.S. dollar was valued at 3.87 Brazilian real – approximately
20% and 70% below the five-year and 10-year median exchange rates, respectively. This
movement provides a positive, long-term background for foreign investments in infrastructure,
mitigating the devaluation risk that is frequently a consideration in cross-border transactions.
The recent depreciation of the Brazilian real has been attributed to political uncertainties both
national and abroad, including those involving upcoming Brazilian presidential election and
changing international trade policies – more specifically, those between the U.S. and China.
The Brazilian Central Bank has also reaffirmed its commitment to ease volatility in the foreign
exchange market, using multiple instruments at its disposal (including currency swaps and,
potentially, outright sales from its nearly R$400 billion foreign exchange reserves) to enhance
market liquidity and smooth exchange rate movements.
According to the Brazilian Central Bank, Brazil’s exchange rate is expected to stabilize over the
short term, at around 3.83 Brazilian real per U.S. dollar until 2020, and reach 3.80 reals to
dollars by 2023.
It is also important to highlight that given the inflation indexation of most revenue contracts in the
Infrastructure sector, and the positive correlation between foreign exchange devaluation and
inflation, it is expected that in the long run, results would converge back to original levels, even
following a moderate currency devaluation episode.
B N D E S I N T E R E S T R AT E P O L I CY C H A N G E SBrazil’s development bank, Banco Nacional de Desenvolvimento Econômico e Social (or
BNDES), has historically been a major player in the financing of large-scale infrastructure
projects within the country. In 2017, the federal government began to shift its strategy regarding
BNDES’ financing policies in an effort to narrow the disparity between bank-offered interest
rates (which were subsidized) and rates available through the private markets. Over the medium
to long term, the change in policy is expected to increase private sector financing activity for
Brazilian infrastructure projects.45 One example of such a project is the Porto de Sergipe I
Thermoelectric Complex, a gas-powered electric plant in the state of Sergipe that will be the
largest of its kind in Latin America when completed in 2020. The project’s development was
supported by investments from the International Finance Corporation, World Bank division, and
the Inter-American Development Bank and the issuance of nonconvertible debentures.
44. According to Infraestrutura e Regulação report by Oliver Wyman – 2018.45. According to Infraestrutura e Regulação report by Oliver Wyman (2018).

Infrastructure Investment in Brazil: An Abundance of Opportunity
16Duff & Phelps
A S S E T S A L E S F O L LO W I N G T H E C A R - WA S H S C A N DA LAs a consequence of the so-called car-wash scandal, an ongoing political and corporate
corruption inquiry, a number of companies involved in the investigation have pursued asset sales
to meet liquidity needs. Such asset sales have included the sale of certain infrastructure assets,
for example:
• Engevix’s sale of its stake in the Brasília airport.
• Camargo Corrêa’s sale of its share of CPFL (an electricity company) and.
• Odebrecht’s sale of its majority stake in Odebrecht Ambiental.
G OV E R N M E N T P R O G R A M SIn 2016, the Brazilian federal government launched the Programa de Parcerias de Investimentos
(PPI), an initiative aimed at increasing private investment in infrastructure. To date, 189 projects
have qualified for the program, 95 of which have already been completed. The program
estimates that since its launch, approximately R$150 billion has been invested, with an additional
R$238 billion to be invested in future projects.46 Currently, 94 projects are in development.
Source: Programa de Paerceria de Investimentos
The PPI is the third federal government program in the past seven years focused on boosting
private investment within the sector, following the Programa de Aceleração do Crescimento 2
from 2011 to 2014 and the Programa de Investimento em Logística from 2012 to 2015.
After the recent election, the new Brazilian federal government appears committed to supporting
programs that bolster incremental private sector investments in infrastructure. The new president
indicated that through privatizations, he wanted to sell almost R$1 trillion in assets, with priority
given to the Infrastructure and Energy sectors. He also intends to use the existing PPI to
generate R$133 billion in investment (57 PPI existing projects).
Highway Ports Energy Oil and Gas Airports Railway
9 in Development 13 Concluded
25 in Development
52 Concluded
22 in Development
5 Concluded
2 in Development
4 Concluded
17 in Development
10 in Development
46. PPI’s website. Available at https://www.ppi.gov.br/conheca-a-lista-dos-projetos-ja-concluidos-e-os-estao-programados-para-2018.

S E C T I O N 2
Distinct Characteristics of Private Equity Infrastructure

Infrastructure Investment in Brazil: An Abundance of Opportunity
18Duff & Phelps
Infrastructure investments are often viewed as an attractive asset class due to their ability to generate strong, risk-adjusted returns and stable cash flows; diversification; and downside protection through inflation-hedging characteristics.47
R I S K- A D J U S T E D R E T U R N S A N D S TA B L E C A S H F LO W SInfrastructure investments typically offer investors strong, risk-adjusted returns and stable cash
flows over the long term. Assets are commonly long-lived, with highly visible and predictable
cash flows that may be driven by regulation, contractual agreements or relatively unchanging
usage patterns under a wide range of economic scenarios.48
D I V E R S I F I C AT I O NInfrastructure investments are generally viewed as having lower correlation to traditional asset
classes, including equities, fixed income and real estate. Furthermore, returns on infrastructure
assets may not be as correlated to developments in the broader economy. Therefore,
infrastructure investments are typically considered to be relevant alternatives for portfolio
diversification.49
I N F L AT I O N - H E D G I N GMany infrastructure investments offer inflation-hedging characteristics, as underlying contracts
may link revenues to certain inflation-related benchmarks, thereby offering protection from
potential inflation volatility.50 Such inflation-hedging characteristics may also be driven by
concessions or regulatory provisions, among other factors.
I L L U S T R AT I V E G LO B A L I N F R A S T R U C T U R E R E T U R N S DATA• Median net Internal Rate of Return (IRR) between 7% and 12% across all vintages since
2007.51
• Unlisted infrastructure had an average net IRR of 10.1% for vintage 2004-2015 funds
behind buyouts (13.5% net IRR) and Venture Capital (10.3% net IRR).52
• In the 2014 vintage, the second highest net IRR, at 13.6% after buyouts.53
• Estimated dry powder as of June 2018 at R$36 billion.54
47. Preqin’s 2018 Global Infrastructure Report.48. Mercer – 2016.49. Preqin’s 2018 Global Infrastructure Report.50. Preqin’s 2018 Global Infrastructure Report.51. Prequin’s quarterly update: Infrastructure Q2.52. Prequin’s quarterly update: Infrastructure Q2.53. Prequin’s quarterly update: Infrastructure Q2.54. Estadão newspaper published on – September 17, 2018.

Infrastructure Investment in Brazil: An Abundance of Opportunity
19Duff & Phelps
S E C T I O N 3
Case Studies

Infrastructure Investment in Brazil: An Abundance of Opportunity
20Duff & Phelps
Case Study
Advent International: Terminal de Contêineres Paranaguá (TCP)C O M PA N Y D E S C R I P T I O NSecond-largest container terminal in Brazil and one of the largest in Latin America
M A R K E T O P P O R T U N I T YHigh-growth sector marked by 10% volume CAGR in 12 years prior to Advent’s investment
and huge bottleneck in all Brazilian ports
I N V E S T M E N T T H E S I S• Expand capacity by building third berth.
• Invest in equipment to increase productivity of the terminal.
• Pursue add-on and adjacent services.
VA L U E - A D D• Increased capacity 88%, from 800,000 Ton Equivalent Unit (TEUs) per year to 1.5
million TEUs, by building a third berth and buying more equipment.
• Grew volume by increasing market share through premium services and integrating
door-to-port logistics services.
• Tripled productivity from ~30 moves per hour in 2010 to ~90 moves per hour as of
May 2017.
• Elevated TCP’s position from 10th most productive terminal to the second most
productive terminal in Brazil.
Investment Date: July 2011
Exit Date: February 2018
Status: Realized
Sector: Infrastructure
Type: Growth
Head Office: Curitiba
Website: www.tcp.com.br

Infrastructure Investment in Brazil: An Abundance of Opportunity
21Duff & Phelps
K E Y O P E R AT I N G A N D F I N A N C I A L DATA
Performance summary
0
100
200
300
400
500
600
700
2010 2016201320122011 20152014 2017
R$ millions
11%CAGR
Advent Investment
271
312
356
412436
480 493
576
Revenue
Infrastructure Investment in Brazil: An Abundance of Opportunity
22Duff & Phelps
Case Study
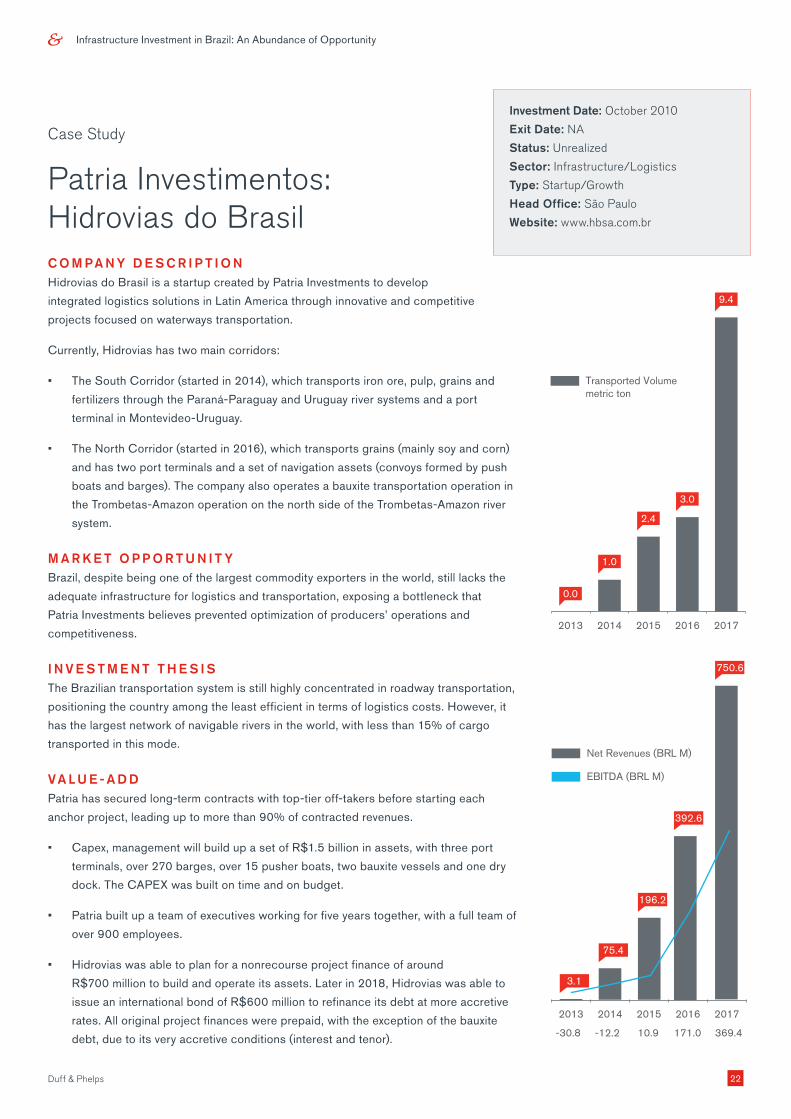
Patria Investimentos: Hidrovias do BrasilC O M PA N Y D E S C R I P T I O NHidrovias do Brasil is a startup created by Patria Investments to develop
integrated logistics solutions in Latin America through innovative and competitive
projects focused on waterways transportation.
Currently, Hidrovias has two main corridors:
• The South Corridor (started in 2014), which transports iron ore, pulp, grains and
fertilizers through the Paraná-Paraguay and Uruguay river systems and a port
terminal in Montevideo-Uruguay.
• The North Corridor (started in 2016), which transports grains (mainly soy and corn)
and has two port terminals and a set of navigation assets (convoys formed by push
boats and barges). The company also operates a bauxite transportation operation in
the Trombetas-Amazon operation on the north side of the Trombetas-Amazon river
system.
M A R K E T O P P O R T U N I T YBrazil, despite being one of the largest commodity exporters in the world, still lacks the
adequate infrastructure for logistics and transportation, exposing a bottleneck that
Patria Investments believes prevented optimization of producers’ operations and
competitiveness.
I N V E S T M E N T T H E S I SThe Brazilian transportation system is still highly concentrated in roadway transportation,
positioning the country among the least efficient in terms of logistics costs. However, it
has the largest network of navigable rivers in the world, with less than 15% of cargo
transported in this mode.
VA L U E - A D D Patria has secured long-term contracts with top-tier off-takers before starting each
anchor project, leading up to more than 90% of contracted revenues.
• Capex, management will build up a set of R$1.5 billion in assets, with three port
terminals, over 270 barges, over 15 pusher boats, two bauxite vessels and one dry
dock. The CAPEX was built on time and on budget.
• Patria built up a team of executives working for five years together, with a full team of
over 900 employees.
• Hidrovias was able to plan for a nonrecourse project finance of around
R$700 million to build and operate its assets. Later in 2018, Hidrovias was able to
issue an international bond of R$600 million to refinance its debt at more accretive
rates. All original project finances were prepaid, with the exception of the bauxite
debt, due to its very accretive conditions (interest and tenor).
Investment Date: October 2010
Exit Date: NA
Status: Unrealized
Sector: Infrastructure/Logistics
Type: Startup/Growth
Head Office: São Paulo
Website: www.hbsa.com.br
9.4
2.4
3.0
1.0
0.0
20172016201520142013
Transported Volumemetric ton
Net Revenues (BRL M)
369.4
EBITDA (BRL M)
392.6
750.6
3.1
75.4
196.2
20172016201520142013
-30.8 -12.2 10.9 171.0

Infrastructure Investment in Brazil: An Abundance of Opportunity
23Duff & Phelps
Case Study
Vinci Partners: Equatorial EnergiaC O M PA N Y D E S C R I P T I O NEquatorial Energia S.A. (“Equatorial Energia”) is a holding company of energy
assets focused on distribution and power generation in Brazil. The company is listed in the
Novo Mercado segment of the Bovespa. Equatorial Energia currently controls four
companies: Companhia Energética do Maranhão (“CEMAR”), Geranorte, Celpa and
Sol Energias.
• CEMAR (65% owned): sole electric power distributor in the state of Maranhão and
second largest distributor in Brazil’s Northeast region, serving approximately 6.2
million people (3.3% of the country’s population).
• Geranorte (25% owned): operator of two thermoelectric plants in the state of Maranhão,
with joint installed capacity of 330 megawatts.
• Sol Energia (51% owned): energy trading company.
• Celpa (96% owned): electric power distributor in the state of Pará.
M A R K E T O P P O R T U N I T Y• Core asset in severe financial distress, offering a clear turnaround opportunity for a
buyer with experience in the Electricity sector.
• Opportunity to invest at a discounted entry price, as most strategic and financial buyers
were discouraged by the complexity of the deal and the hurdles of the regulated energy
industry in Brazil.
• Opportunity for further financial optimization during second phase of restructuring
process, following the privatization of the company.
I N V E S T M E N T T H E S I S• Build a portfolio of diversified energy assets.
• Target state-owned and private companies with poor management or inadequate
capital structures.
• Create value through organizational and financial restructuring, as well as
operational improvements.
• Implement a return-oriented business model.
• Institutionalize management.
• Leverage deep regulatory understanding of the Energy sector to identify opportunities
and mitigate risks.
Investment Date: March 2006
Exit Date: May 2015
Status: Realized
Sector: Electricity Distribution
Type: Turnaround/Restructuring
Head Office: Maranhão
Website: www.equatorialenergia.com.br

Infrastructure Investment in Brazil: An Abundance of Opportunity
24Duff & Phelps
VA L U E - A D DFrom 2004 to 2006, Vinci Partners led the implementation of a substantial restructuring
program that included the renegotiation of R$300 million in debt from Eletrobras, the
write-off of R$300 million in other debts and a reduction in nonfixed expenses from 37%
of revenues in 2004 to 18% in 2006.
• Vinci Partners purchased general partner’s entire stake in Equatorial Energia in
December 2007 through the issuance of R$200 million of debt at the
controlling company.
• From 2006 to 2009, Vinci Partners led the second phase of Equatorial Energia’s
restructuring program, focused primarily on operational improvements. Upon
completion, nontechnical energy losses, which represented Equatorial Energia’s main
operating challenge, decreased from over 30% to 21%.
• Improved relationship with the regulator and proactively conducted a tariff revision
process in 2006, which increased annual EBITDA by approximately R$80 million.
• Executed a major reorganization of management: 90% of the workforce was
dismissed and 80% rehired, management interests were re-aligned through direct
ownership in the company, and clear objectives and accountability were instituted for
each professional.
• Led acquisition of the Geranorte asset in September 2008, representing Equatorial
Energia’s entry into the attractive power generation segment.
• Executed acquisition of a 51% stake in Sol Energia in November 2011, completing
Equatorial’s portfolio with an energy trading company.
• In November 2012, continued the strategy of consolidating the distribution segment,
leading to the acquisition of Disco Celpa (Pará State’s energy distribution company)
out of bankruptcy. Equatorial now controls 96.2% of Celpa.
• Concluded a successful follow-on offering in December 2012, raising R$1.4 billion to
help strengthen Equatorial’s balance sheet and providing R$368 million of gross
realized proceeds to Fund I.
KE Y OPER ATING AND F INANCIAL DATA• Equatorial Energia’s EBITDA more than doubled from 2005 to 2008.
• In April 2006, following the company’s financial turnaround, Equatorial Energia was
listed on the Bovespa. In April 2008, with solid governance, controls and operations
in place, the company was successfully migrated to the Novo Mercado segment of
the Bovespa.
• In 2014, according to the regulatory agency, Equatorial Energia was one of the most
efficient companies in its sector, often outperforming industry benchmarks and
serving as a reference for tariff policies.


C O N TAC T S
Robert J. (Joey) Malagon
Managing Director
+1 212 871 6989
Alexandre Pierantoni
Managing Director
+55 11 3192 8103
Nicolas Ballian
Managing Director
+55 11 3192 8125
About Duff & Phelps
Duff & Phelps is the global advisor that protects, restores and maximizes value for
clients in the areas of valuation, corporate finance, investigations, disputes, cyber
security, compliance and regulatory matters, and other governance-related issues.
We work with clients across diverse sectors, mitigating risk to assets, operations
and people. With Kroll, a division of Duff & Phelps since 2018, our firm has nearly
3,500 professionals in 28 countries around the world. For more information, visit
www.duffandphelps.com.
© 2019 Duff & Phelps, LLC. All rights reserved. DP190126
M&A advisory, capital raising and secondary market advisory services in the United
States are provided by Duff & Phelps Securities, LLC. Member FINRA/SIPC.
Pagemill Partners is a Division of Duff & Phelps Securities, LLC. M&A advisory,
capital raising and secondary market advisory services in the United Kingdom are
provided by Duff & Phelps Securities Ltd. (DPSL), which is authorized and
regulated by the Financial Conduct Authority. M&A advisory and capital raising
services in Germany are provided by Duff & Phelps GmbH, which is a Tied Agent of
DPSL. Valuation Advisory Services in India are provided by Duff & Phelps India
Private Limited under a category 1 merchant banker license issued by the Securities
and Exchange Board of India.