Embed Size (px)
Citation preview

ANNUAL REPORT 2013I N F R A S T R U C T U R E F I N A N C E C O R P O R AT I O N L I M I T E D
www.inca.co.za
INCA TIMESPROTECTING THE INTERESTS OF ALL STAKEHOLDERS

1 financialhighlights
2 directorate
3 chairman’sstatement
4 corporategovernance
6 portfoliomanager’sreport
10 financialstatements
// CONTENTS
THE BOARD OF DIRECTORS REMAIN COMMITTED TO MAINTAINING
INCA’S OvERALL RISK PROFILE AND FINANCIAL ROBUSTNESS.
1
l INCA l Annual Report 2013
GroupAudited
12 monthsJune 2013
GroupAudited
12 monthsJune 2012
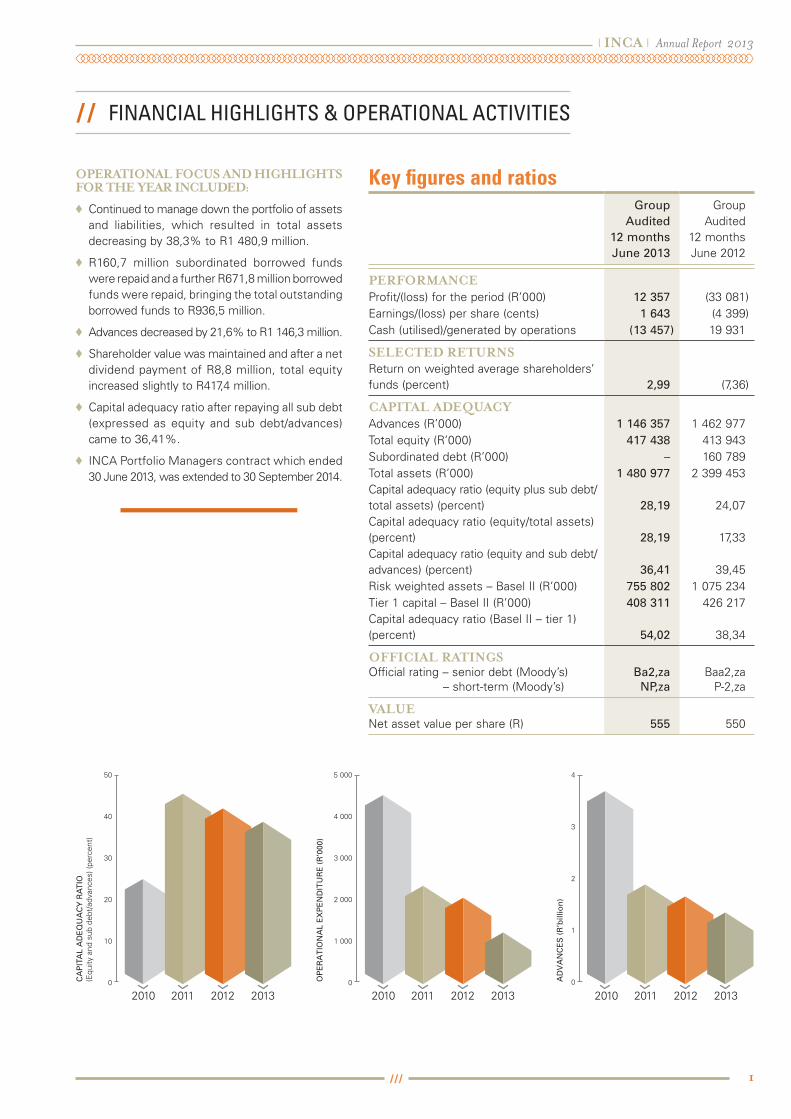
PERFORMANCEProfit/(loss) for the period (R’000) 12 357 (33 081)Earnings/(loss) per share (cents) 1 643 (4 399)Cash (utilised)/generated by operations (13 457) 19 931
SELECTED RETURNSReturn on weighted average shareholders’ funds (percent) 2,99 (7,36)
CAPITAL ADEQUACYAdvances (R’000) 1 146 357 1 462 977Total equity (R’000) 417 438 413 943Subordinated debt (R’000) – 160 789Total assets (R’000) 1 480 977 2 399 453Capital adequacy ratio (equity plus sub debt/total assets) (percent) 28,19 24,07Capital adequacy ratio (equity/total assets) (percent) 28,19 17,33Capital adequacy ratio (equity and sub debt/advances) (percent) 36,41 39,45Risk weighted assets – Basel II (R’000) 755 802 1 075 234Tier 1 capital – Basel II (R’000) 408 311 426 217Capital adequacy ratio (Basel II – tier 1) (percent) 54,02 38,34
OFFICIAL RATINGSOfficial rating – senior debt (Moody’s) Ba2,za Baa2,za – short-term (Moody’s) NP,za P-2,za
vALUENet asset value per share (R) 555 550
Key figures and ratios
// fiNaNCial highlighTS & OPERaTiONal aCTiViTiES
OPERATIONAL FOCUS AND HIGHLIGHTS FOR THE YEAR INCLUDED:
♦♦ Continued to manage down the portfolio of assets and liabilities, which resulted in total assets decreasing by 38,3% to R1 480,9 million.
♦♦ R160,7 million subordinated borrowed funds were repaid and a further R671,8 million borrowed funds were repaid, bringing the total outstanding borrowed funds to R936,5 million.
♦♦ Advances decreased by 21,6% to R1 146,3 million.
♦♦ Shareholder value was maintained and after a net dividend payment of R8,8 million, total equity increased slightly to R417,4 million.
♦♦ Capital adequacy ratio after repaying all sub debt (expressed as equity and sub debt/advances) came to 36,41%.
♦♦ INCA Portfolio Managers contract which ended 30 June 2013, was extended to 30 September 2014.
50
40
30
20
10
0
2010 2011 2012
CA
PIT
AL
AD
EQ
UA
CY
RA
TIO
(Equ
ity a
nd s
ub d
ebt/
adva
nces
) (pe
rcen
t)
5 000
4 000
3 000
2 000
1 000
0OP
ER
AT
ION
AL
EX
PE
ND
ITU
RE
(R
’000
)
4
3
2
1
0AD
VA
NC
ES
(R
’bill
ion
)
2013 2010 2011 2012 2013 2010 2011 2012 2013
l INCA l Annual Report 2013
2
* Member of Asset Liability Committee
◊ Member of Market Value Verification Committee
# Member of Investment and Review Committee l † Member of Audit, Risk and Compliance Committee l
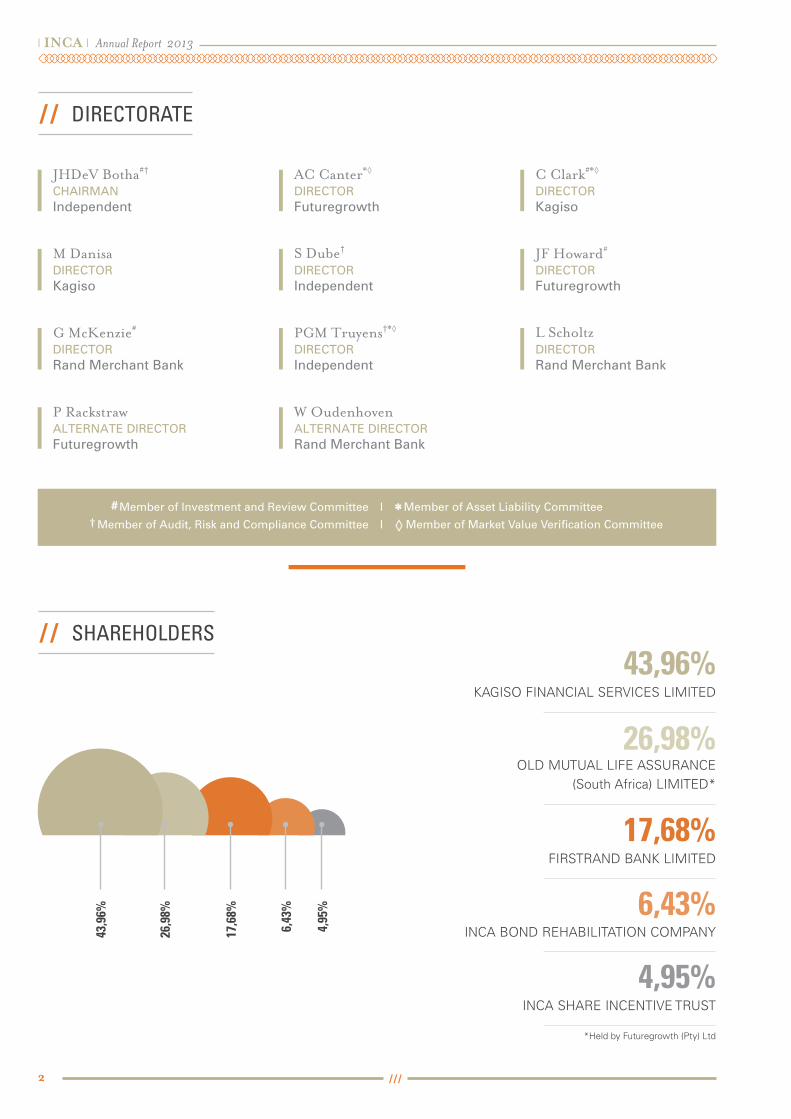
// DiRECTORaTE
// ShaREhOlDERS
JHDeV Botha#†
ChAIRMANIndependent
AC Canter*◊
DIRECTORFuturegrowth
C Clark#*◊
DIRECTORKagiso
M DanisaDIRECTORKagiso
S Dube†
DIRECTORIndependent
JF Howard#
DIRECTORFuturegrowth
G McKenzie#
DIRECTORRand Merchant Bank
PGM Truyens†*◊
DIRECTORIndependent
L ScholtzDIRECTORRand Merchant Bank
P RackstrawALTERNATE DIRECTORFuturegrowth
W OudenhovenALTERNATE DIRECTORRand Merchant Bank
43,96% KAGISO FINANCIAl SERvICES lIMITEd
26,98% Old MuTuAl lIFE ASSuRANCE
(South Africa) lIMITEd*
17,68%FIRSTRANd BANK lIMITEd
4,95%INCA SHARE INCENTIvE TRuST
6,43%INCA BONd REHABIlITATION COMPANY
*Held by Futuregrowth (Pty) ltd
43,9
6%
26,9
8%
17,6
8%
6,43
%
4,95
%

3
l INCA l Annual Report 2013
A TOTAL OF R832,6 MILLION OF BORROwED FUNDS wERE REPAID, INCLUDING R160,7
MILLION SUBORDINATED DEBT.
// ChaiRMaN’S STaTEMENT
The process of managing down the INCA portfolio of assets and liabilities continued during the year, with the value of total assets decreasing by 38,3% to R1 481,0 million. For the year in review, to 30 June 2013, advances decreased by 21,6% to R1 146,3 million and a total of R832,6 million of borrowed funds were repaid, including R160,7 million subordinated debt.
Total borrowed funds amounted to R936,5 million. INCA’s advances portfolio continues to perform well, resulting in a R2,6 million impairment reversal. Net asset value increased slightly to R417,4 million, notwithstanding a dividend distribution of R8,8 million during the year and the much reduced portfolio.
The Board of directors remain committed to maintaining INCA’s overall risk profile and financial robustness. This is underpinned by a consistently applied impairment policy, as well as a dividend philosophy that contributes to maintaining the high capital adequacy ratios reflected in this consolidated statement for the year in review.
The initial contract with INCA Portfolio Managers (Pty) ltd, to manage the portfolio on behalf of shareholders and the Board, and which ended on 30 June 2013, was extended to 30 September 2014, and I would like to acknowledge the proficient way in which IPM is managing this portfolio. I also wish to express my appreciation to my co-directors, especially the independent directors, for their guidance and for maintaining the high standard of governance during the year.
JHDeV BOTHAChairman
CHAIRMANJhDeV BOThA

l INCA l Annual Report 2013
4
INTRODUCTIONINCA continued to maintain its high level of corporate discipline and transparency during the year ended 30 June 2013, notwithstanding a much reduced and simplified portfolio.
ANNUAL FINANCIAL STATEMENTSIt is the directors’ responsibility to ensure that the financial statements fairly represent the financial position of the Group and its operations, including its cash flows. The external auditors are responsible for independently reviewing and reporting on the financial statements.
INCA Portfolio Managers (Pty) ltd (IPM) prepared the annual financial statements set out in this report. The Board has contracted IPM to manage the Company, including preparing the annual financial statements in accordance with International Financial Reporting Standards (IFRS). IPM has consistently applied appropriate accounting policies and exercised reasonable and prudent judgments and estimates in preparing the 2013 financial statements.
BOARD OF DIRECTORSThe Board retains full and effective control of the Group, monitors the performance of IPM and ensures that material matters are subject to Board approval. IPM reports to the Board and the relevant Board sub-committees.
All directors are entitled to access the services and advice of the Company Secretary. In addition, directors are entitled to seek independent professional advice about the Group’s affairs at the expense of the Company.
The Company has appointed three independent non-executive directors, who provide balance and independence to the Board. In line with the new Companies Act, No 71 of 2008, the Audit, Risk and Compliance Committee consists only of independent directors.
details of the Group’s executive and non-executive directors are provided on page 2 of this report.
AUDIT, RISK AND COMPLIANCE COMMITTEEThe Audit, Risk and Compliance Committee is composed entirely of independent directors. IPM and the external auditors attend all meetings of the committee. External audit provides comment on the fair presentation of the financial statements, the application of accounting policies and the effectiveness of risk management processes, management information systems and other systems of internal control.
Shareholders appoint the auditors each year at the annual general meeting, based on the recommendations of the Audit, Risk and Compliance Committee. For this reporting period Sizwe Ntsaluba Gobodo were the auditors, with Nhlanhla Sigasa as the audit partner.
INvESTMENT AND REvIEw COMMITTEEThe primary responsibility of the Investment and Review Committee is to control the extent of credit exposure to any entity or related group of entities, and consider the recommended credit quality of the entities in the portfolio on an ongoing basis. The selling of any advances in the portfolio is also approved by the committee. The committee meets a minimum of four times a year and consists of four non-executive directors, including the chairman of the Board. IPM attends all Investment and Review Committee meetings.
ASSET LIABILITY COMMITTEEThe Asset liability Committee (AlCO) meets quarterly and is chaired by a non-executive director. The committee further comprises a non-executive director and an independent director. IPM attends all AlCO meetings.
// CORPORaTE gOVERNaNCE
THE BOARD RETAINS FULL AND EFFECTIvE CONTROL OF THE GROUP, MONITORS THE PERFORMANCE OF
IPM AND ENSURES THAT MATERIAL MATTERS ARE SUBjECT TO BOARD APPROvAL.

5
l INCA l Annual Report 2013
AlCO is mandated to ensure that liquidity risks, interest rate risks and currency risks to the Group are identified, measured, managed and appropriately reported on in a prudent manner. The Company’s detailed cash management process and funding strategy is also tabled at the quarterly AlCO meetings.
MARKET vALUE vERIFICATION COMMITTEEThe Market value verification Committee addresses market valuation issues emanating from the implementation of IFRS7 and IAS39. The committee consists of two non-executive directors and one independent director, with IPM also attending meetings. A member is drawn from the Investment and Review Committee, the Audit, Risk and Compliance Committee, and AlCO.
The committee meets twice a year before the finalisation of interim results and the annual financial statements.
The committee is mandated to:
� review and approve IPM’s procedure of generating discount rates for use in determining fair values of non-listed assets and liabilities;
� ensure that the abovementioned procedure is properly documented and consistently applied;
� ensure that any changes required to the procedures (due to changes in market conventions, benchmarks, the “passing of time”, the use of new instruments, etc.) have been considered and implemented appropriately;
� ensure that any subjectivity within the procedure is kept to a minimum; and
�ensure that the application of the procedure, as approved, has been audited by the external auditors. The external auditors review the procedure independently to determine fair values of non-listed assets and liabilities.
INTERNAL CONTROLThe directors are responsible for maintaining an effective system of internal control, which provides reasonable assurance of effective and efficient operations and sound financial management.
Risk management is dealt with in an integrated way by the chief executive officer and the executive team of IPM, and is reported on and discussed at each Audit, Risk and Compliance Committee and Board meeting. Monthly meetings between IPM and the chairperson of the Audit, Risk and Compliance Committee (in his capacity as Board liaison Consultant) are also held.
GOING CONCERNThe annual financial statements are prepared on a going concern basis. during the year, nothing came to the attention of the Board to indicate that the Company or its subsidiaries are not a going concern or will not remain a going concern during the next financial year.

l INCA l Annual Report 2013
6
THE IPM TEAM AND I ARE SATISFIED THAT wE HAvE PROTECTED THE INTERESTS OF ALL STAKEHOLDERS
IN MANAGING DOwN INCA’S PORTFOLIO.
// PORTfOliO MaNagER’S REPORT
Three years ago, INCA Portfolio Managers (Pty) ltd (IPM) was appointed by the INCA Board of directors with a specific mandate to manage down the portfolio of assets and liabilities. IPM was also instructed to manage the portfolio to serve the interest of all stakeholders, maintain its overall risk profile and ensure that shareholder value is protected as far as possible.
IPM is pleased to report that we have delivered successfully on our mandate in the period under review.
The value of the original R5 037,8 million portfolio (as reported at 30 June 2010) has reduced to R1 473,0 million at 30 June 2013, a reduction of 70,76%. For the financial year under review (ending 30 June 2013), the value of the portfolio decreased by 38,6%. Total shareholder value was R417,4 million – a slight increase on the previous year, notwithstanding an R8,8 million dividend distribution. This compares to R517,1 million shareholder value at the beginning of the IPM contract on 30 June 2010. The capital adequacy ratio (equity/advances) at 30 June 2013 was high at 36,41%, compared to 28,29% in the 2012 financial year and 14,89% at the beginning of the IPM contract.
IPM is pleased with the manner in which the team has managed down the portfolio and will continue to execute this mandate during the extension of its contract, to 30 September 2014.
Key operational activities during the 12 months ending 30 June 2013:
♦♦ A total of R832,6 million of borrowed funds were repaid. This includes the redemption of two INCA bonds at maturity (IN08 on 20 November 2012 and IN07 on 16 May 2013), the early redemption of the INJ02 subordinated debt (that was only redeemable on 30 April 2015), and the normal repayment of capital due on loans from the European Investment Bank (EIB).
♦♦ As detailed in note 11 of the financial statements, total borrowed funds were valued at R936,5 million at 30 June 2013. As part of the strategy to accelerate the managing down of the portfolio, an EIB loan with a face value of R134,1 million that was to end on 15 March 2020 was repaid early on 16 September 2013.
CHIEF EXECUTIVE OFFICERAJ VAN ZYL
7
l INCA l Annual Report 2013
♦♦ Cash and cash equivalents of R180,2 million and investments amounting to R123,7 million were held at 30 June 2013. Throughout the year, high levels of liquidity were maintained as part of the strategy to prepare for repaying borrowed funds well in advance. liquidity held was also in excess of INCA’s liquidity policy. This policy stipulates that sufficient cash and near cash should be held to cover:
� Operational expenditure for six months.� Plus interest and capital payable over the next six months.� Minus interest and capital received over the next six
months for:– capital secured by zero coupon bonds;
– 100% of category 1 assets;– 82% of category 2 assets;– 70% of category 3 assets;– 50% of category 4 assets;– 0% of category 5 assets.
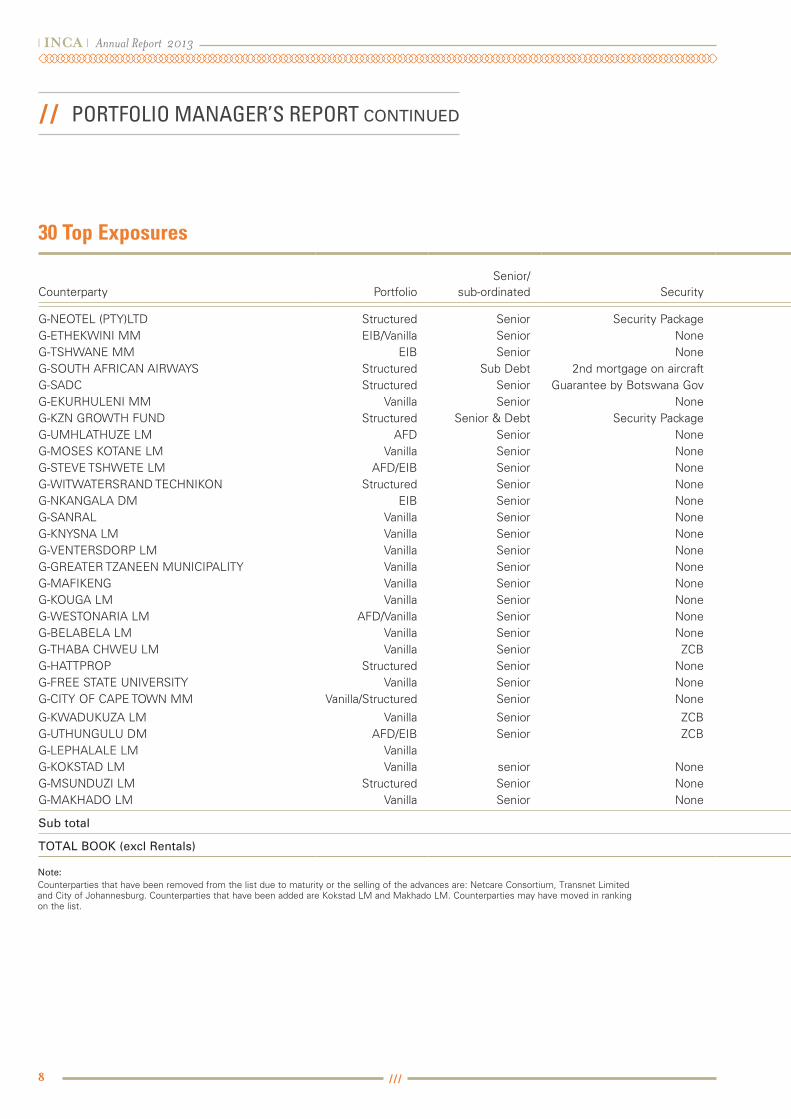
during the year, we continued to review all credits in the portfolio and apply the standard shadow rating approach utilised since INCA’s inception. According to IPM, whose credit assessment closely mirrors the ratings available for municipalities and other entities in the portfolio, 75,5% of the portfolio of advances were of investment grade and higher. The high percentage of advances regarded as non-investment grade is mainly due to IPM’s recommendation that the single largest advance in the portfolio (Neotel – R202,9 million at 30 June 2013) should be regarded as below investment grade. Note that at the time of publishing this report, Neotel has met all its repayment commitments to INCA on time.
The table below reflects the changes in the risk composition of INCA’s advance portfolio as per IPM’s credit assessment and as agreed to by INCA’s Investment and Review Committee.
Risk categoryFace value
(millions)% at
30 June 2013% at
30 June 2012
Category 1 (AA- to AAA)Category 2 (A- to A+)Category 3 (BBB- to BBB+)
R253,7R245,4R335,3
23,022,230,3
301835
Below BBB- or non-investment grade R272,1 24,5 17
Total R1 106,5 100 100
At year end, only R13,6 million (1,2%) of payments due on term loan advances were outstanding.
As the portfolio of advances is being managed down, concentration in the portfolio increased during the year. As reflected in note 6.6 of the financial statements, the top 10 advances at 30 June 2013 represents 76,8% of the value of the portfolio. The table of the top 30 long term advances indicates that these advances represent 99% of the value of the portfolio.
during the year, IPM paid special attention to the rental discount portfolio to collect outstanding funds. The value at cost of this portfolio at 30 June 2013 came to R34,7 million, with impairments on lease receivables at R28,7 million. Collection of arrear payments on this portfolio has proven to be challenging, and impairments to the value of R11,2 million were utilised during the year.
A total dividend of R8,8 million was paid in the year in review, net of the subsidiary and Share Trust. This capital outflow was covered by comprehensive income for the year of R12,3 million, resulting in a slight increase in INCA’s net asset value.
It is IPM’s intention, as mandated by INCA’s Board of directors, to further manage the portfolio down. We will continue to utilise excess liquidity generated from the liquidation of advances to settle loans from the EIB early and buy back IN04 and IN09 bonds in the market when opportunities arise.
Operational costs to manage the much smaller portfolio will also be reduced in the next financial year, assisting in our efforts to maintain shareholder value.
The IPM team and I are satisfied that we have protected the interests of all stakeholders in managing down INCA’s portfolio. We also thank INCA’s Board for its continued support and wish to voice our appreciation for the extension of the management contract.
AJ VAn ZyLChief Executive Officer
l INCA l Annual Report 2013
8
// portfolio manager’s report CONTINUED
Counterparty PortfolioSenior/
sub-ordinated Security Official rating Credit rating30June 2013
Face value % of
total book30 June 2012
Face value % of
total book
G-NEOTEL (PTY)LTD Structured Senior Security Package 4 202 947 136,36 18% 206 079 545,45 13%G-ETHEKWINI MM EIB/Vanilla Senior None AA- GCR 2012 1 167 008 323,00 15% 174 663 050,00 11%G-TSHWANE MM EIB Senior None A1 Moodys 2012 2 141 409 024,78 13% 155 100 721,08 10%G-SOUTH AFRICAN AIRWAYS Structured Sub Debt 2nd mortgage on aircraft 3 84 371 909,50 8% 106 871 120,94 7%G-SADC Structured Senior Guarantee by Botswana Gov 3 79 787 896,36 7% 68 710 630,30 4%G-EKURHULENI MM Vanilla Senior None Aa3 Moodys 2012 1 60 871 977,25 6% 78 090 702,68 5%G-KZN GROWTH FUND Structured Senior & Debt Security Package 3 51 824 448,12 5% 32 401 108,30 2%G-UMHLATHUZE LM AFD Senior None 3 30 733 059,87 3% 34 489 110,80 2%G-MOSES KOTANE LM Vanilla Senior None 3 31 147 988,70 3% 32 413 954,79 2%G-STEVE TSHWETE LM AFD/EIB Senior None A- GCR 2012 2 29 607 018,13 3% 33 711 551,62 2%G-WITWATERSRAND TECHNIKON Structured Senior None Aa3 Moodys 2010 2 29 095 724,16 3% 30 456 242,51 2%G-NKANGALA DM EIB Senior None BBB+ Fitch 2013 2 19 768 571,49 2% 22 167 650,99 1%G-SANRAL Vanilla Senior None Baa2 Moodys 2012 1 19 000 000,00 2% 19 000 000,00 1%G-KNYSNA LM Vanilla Senior None Baa2 Moodys 2012 3 16 335 912,80 1% 17 881 185,31 1%G-VENTERSDORP LM Vanilla Senior None 5 16 181 544,85 1% 16 895 382,87 1%G-GREATER TZANEEN MUNICIPALITY Vanilla Senior None Baa2 Moodys 2012 3 16 163 105,87 1% 18 110 311,71 1%G-MAFIKENG Vanilla Senior None 4 14 821 022,17 1% 16 119 295,58 1%G-KOUGA LM Vanilla Senior None Withdrawn 4 12 957 700,56 1% 8 521 307,00 1%G-WESTONARIA LM AFD/Vanilla Senior None Baa2 Moodys 2012 4 11 738 238,09 1% 18 233 242,54 1%G-BELABELA LM Vanilla Senior None 3 11 471 421,24 1% 11 809 430,17 1%G-THABA CHWEU LM Vanilla Senior ZCB 4 9 177 937,99 1% 9 762 634,98 1%G-HATTPROP Structured Senior None 2 7 564 355,45 1% 6 662 874,94 0%G-FREE STATE UNIVERSITY Vanilla Senior None 2 7 223 869,25 1% 8 804 068,40 1%G-CITY OF CAPE TOWN MM Vanilla/Structured Senior None Aa3 Moodys 2012 1 6 800 000,00 1% 106 800 000,00 7%
G-KWADUKUZA LM Vanilla Senior ZCB Baa1 Moodys 2012 2 5 669 574,77 1% 8 196 671,82 1%G-UTHUNGULU DM AFD/EIB Senior ZCB A- GCR 2009 2 5 050 020,38 0% 26 302 693,86 2%G-LEPHALALE LM Vanilla Baa1 Moodys 2012 3 3 395 404,91 0% 6 668 820,78 0%G-KOKSTAD LM Vanilla senior None 3 2 890 980,45 0% 3 808 220,19 0%G-MSUNDUZI LM Structured Senior None BBB GCR 2012 3 2 444 882,40 0% 6 939 374,80 0%G-MAKHADO LM Vanilla Senior None 4 2 020 667,51 0% 4 659 875,56 0%
Sub total 1 099 479 716,41 99% 1 290 330 779,97
TOTAL BOOK (excl Rentals) 1 106 587 364,05 100% 1 596 495 933,23
30 Top Exposures
Note:Counterparties that have been removed from the list due to maturity or the selling of the advances are: Netcare Consortium, Transnet Limited and City of Johannesburg. Counterparties that have been added are Kokstad LM and Makhado LM. Counterparties may have moved in ranking on the list.
9
l INCA l Annual Report 2013
Counterparty PortfolioSenior/
sub-ordinated Security Official rating Credit rating30June 2013
Face value % of
total book30 June 2012
Face value % of
total book
G-NEOTEL (PTY)LTD Structured Senior Security Package 4 202 947 136,36 18% 206 079 545,45 13%G-ETHEKWINI MM EIB/Vanilla Senior None AA- GCR 2012 1 167 008 323,00 15% 174 663 050,00 11%G-TSHWANE MM EIB Senior None A1 Moodys 2012 2 141 409 024,78 13% 155 100 721,08 10%G-SOUTH AFRICAN AIRWAYS Structured Sub Debt 2nd mortgage on aircraft 3 84 371 909,50 8% 106 871 120,94 7%G-SADC Structured Senior Guarantee by Botswana Gov 3 79 787 896,36 7% 68 710 630,30 4%G-EKURHULENI MM Vanilla Senior None Aa3 Moodys 2012 1 60 871 977,25 6% 78 090 702,68 5%G-KZN GROWTH FUND Structured Senior & Debt Security Package 3 51 824 448,12 5% 32 401 108,30 2%G-UMHLATHUZE LM AFD Senior None 3 30 733 059,87 3% 34 489 110,80 2%G-MOSES KOTANE LM Vanilla Senior None 3 31 147 988,70 3% 32 413 954,79 2%G-STEVE TSHWETE LM AFD/EIB Senior None A- GCR 2012 2 29 607 018,13 3% 33 711 551,62 2%G-WITWATERSRAND TECHNIKON Structured Senior None Aa3 Moodys 2010 2 29 095 724,16 3% 30 456 242,51 2%G-NKANGALA DM EIB Senior None BBB+ Fitch 2013 2 19 768 571,49 2% 22 167 650,99 1%G-SANRAL Vanilla Senior None Baa2 Moodys 2012 1 19 000 000,00 2% 19 000 000,00 1%G-KNYSNA LM Vanilla Senior None Baa2 Moodys 2012 3 16 335 912,80 1% 17 881 185,31 1%G-VENTERSDORP LM Vanilla Senior None 5 16 181 544,85 1% 16 895 382,87 1%G-GREATER TZANEEN MUNICIPALITY Vanilla Senior None Baa2 Moodys 2012 3 16 163 105,87 1% 18 110 311,71 1%G-MAFIKENG Vanilla Senior None 4 14 821 022,17 1% 16 119 295,58 1%G-KOUGA LM Vanilla Senior None Withdrawn 4 12 957 700,56 1% 8 521 307,00 1%G-WESTONARIA LM AFD/Vanilla Senior None Baa2 Moodys 2012 4 11 738 238,09 1% 18 233 242,54 1%G-BELABELA LM Vanilla Senior None 3 11 471 421,24 1% 11 809 430,17 1%G-THABA CHWEU LM Vanilla Senior ZCB 4 9 177 937,99 1% 9 762 634,98 1%G-HATTPROP Structured Senior None 2 7 564 355,45 1% 6 662 874,94 0%G-FREE STATE UNIVERSITY Vanilla Senior None 2 7 223 869,25 1% 8 804 068,40 1%G-CITY OF CAPE TOWN MM Vanilla/Structured Senior None Aa3 Moodys 2012 1 6 800 000,00 1% 106 800 000,00 7%
G-KWADUKUZA LM Vanilla Senior ZCB Baa1 Moodys 2012 2 5 669 574,77 1% 8 196 671,82 1%G-UTHUNGULU DM AFD/EIB Senior ZCB A- GCR 2009 2 5 050 020,38 0% 26 302 693,86 2%G-LEPHALALE LM Vanilla Baa1 Moodys 2012 3 3 395 404,91 0% 6 668 820,78 0%G-KOKSTAD LM Vanilla senior None 3 2 890 980,45 0% 3 808 220,19 0%G-MSUNDUZI LM Structured Senior None BBB GCR 2012 3 2 444 882,40 0% 6 939 374,80 0%G-MAKHADO LM Vanilla Senior None 4 2 020 667,51 0% 4 659 875,56 0%
Sub total 1 099 479 716,41 99% 1 290 330 779,97
TOTAL BOOK (excl Rentals) 1 106 587 364,05 100% 1 596 495 933,23
Prepared by:
andries C Jansen van Vuuren Ca(Sa)
11 Directors’ responsibility statement and approval of annual financial statements
11 Certification by the company secretary
12 Independent auditor’s report
13 Directors’ report
14 Audit, Risk and Compliance Committee report
15 Consolidated statements of financial position
16 Consolidated statements of comprehensive income
17 Consolidated statements of changes in equity
18 Consolidated cash flow statements
19 notes to the consolidated cash flow statements
21 notes to the consolidated annual financial statements
// CONTENTS
// aUDiTED aNNUal fiNaNCial STaTEMENTS
l INCA l Annual Report 2013
10

11
l INCA l Annual Report 2013
The directors are responsible for the preparation and fair presentation of the Company and Group annual financial statements, comprising the consolidated statements of financial position at 30 June 2013, the consolidated statements of comprehensive income, the consolidated statements of changes in equity and the consolidated statements of cash flows for the year then ended, notes to the consolidated cash flow statements and the notes to the annual financial statements, which include a summary of significant consolidated accounting policies and other explanatory notes, and the directors’ report, in accordance with International Financial Reporting Standards and in the manner required by the Companies Act of South Africa.
The directors’ responsibility includes: designing, implementing and maintaining internal controls relevant to the preparation and fair presentation of these financial statements that are free from material misstatement, whether due to fraud or error; selecting and applying appropriate accounting policies; and making accounting estimates that are reasonable under the circumstances.
The directors’ responsibility also includes maintaining adequate accounting records and an effective system of risk management.
The external auditor is responsible for reporting on whether the Company and Group annual financial statements are fairly presented in accordance with the applicable financial reporting framework.
APPROvAL OF ANNUAL FINANCIAL STATEMENTSThe Company and Group annual financial statements set out on pages 13 to 52 were considered by the Audit, Risk and Compliance Committee on 2 October 2013 and subsequently approved by the Board of directors on 3 October 2013 and are signed on its behalf by:
JHDeV BOTHA P TRUyEnSChairperson of Board of Directors Chairperson: Audit, Risk and Compliance Committee
THE DIRECTORS HAvE MADE AN ASSESSMENT OF THE COMPANY AND GROUP’S ABILITY TO CONTINUE AS A
GOING CONCERN AND HAvE NO REASON TO BELIEvE THE BUSINESSES wILL NOT BE A GOING CONCERN FOR THE
FORESEEABLE FUTURE.
// DiRECTORS’ RESPONSibiliTy STaTEMENT
In terms of section 88(2)(e) of the Companies Act, 71 of 2008 as amended, I certify that, to the best of my knowledge and belief, the Company has lodged with the Registrar of Companies, for the financial year ended 30 June 2013, all such returns as are required by a public company in terms of the Companies Act, and that all such returns are, to the best of my knowledge and belief, true, correct and up to date.
JM POULTER
3 October 2013
// CERTifiCaTiON by ThE COMPaNy SECRETaRy

l INCA l Annual Report 2013
12
We have audited the Group annual financial statements and annual financial statements of Infrastructure Finance Corporation limited, which comprise the consolidated and separate statements of financial position at 30 June 2013, and the consolidated and separate statements of comprehensive income, the consolidated and separate statements of changes in equity and consolidated and separate cash flow statements for the year then ended, and a summary of significant accounting policies and other explanatory notes, and the directors’ report, as set out on pages 16 to 52.
DIRECTORS’ RESPONSIBILITY FOR THE FINANCIAL STATEMENTSThe directors are responsible for the preparation and fair presentation of these financial statements in accordance with International Financial Reporting Standards and the requirements of the Companies Act of South Africa, and for such internal control as the directors determine is necessary to enable the preparation of financial statements that are free from material misstatement, whether due to fraud or error.
AUDITOR’S RESPONSIBILITYOur responsibility is to express an opinion on these financial statements based on our audit. We conducted our audit in accordance with International Standards on Auditing. Those standards require that we comply with ethical requirements and plan and perform the audit to obtain reasonable assurance about whether the financial statements are free from material misstatement.
An audit involves performing procedures to obtain audit evidence about the amounts and disclosures in the financial statements. The procedures selected depend on the auditor’s judgment, including the assessment of the risks of material misstatement
// iNDEPENDENT aUDiTOR’S REPORT
To the shareholders of Infrastructure Finance Corporation Limitedof the financial statements, whether due to fraud or error. In making those risk assessments, the auditor considers internal control relevant to the entity’s preparation and fair presentation of the financial statements in order to design audit procedures that are appropriate in the circumstances, but not for the purpose of expressing an opinion on the effectiveness of the entity’s internal control. An audit also includes evaluating the appropriateness of accounting policies used and the reasonableness of accounting estimates made by management, as well as evaluating the overall presentation of the financial statements.
We believe that the audit evidence we have obtained is sufficient and appropriate to provide a basis for our audit opinion.
OPINIONIn our opinion, these financial statements present fairly, in all material respects, the consolidated and separate financial position of Infrastructure Finance Corporation limited as at 30 June 2013, and its consolidated and separate financial performance and consolidated and separate cash flows for the year then ended in accordance with International Financial Reporting Standards, and in the manner required by the Companies Act of South Africa.
SIZWE NTSALUBA GOBODO INC.
Per: Nhlanhla SigasaPartner
3 October 2013

13
l INCA l Annual Report 2013
NATURE OF BUSINESSThe main business of Infrastructure Finance Corporation limited (“INCA” or “the Company”) remains that of providing largely unsecured debt finance to infrastructure providers.
OPERATING RESULTSThe INCA Group (inclusive of subsidiaries listed in note 5) reflected a profit after tax of R12,4 million (2012: R33,1 million loss) and the Company reported a profit after tax of R88,5 million (2012: R35,3 million loss) for the financial year under review. Excluding unrealised fair value adjustments, the Group reflected a loss after tax of R9,0 million (2012: R3,5 million loss) and the Company reported a profit after tax of R67,1 million (2011: R5,8 million loss).
AUTHORISED AND ISSUED SHARE CAPITALThe Company’s authorised and issued share capital remained unchanged in the year under review (2012 – no change).
// DiRECTORS’ REPORT
Treasury shares held by INCA Bond Rehabilitation Company Proprietary limited (“IBRC”) and the INCA Share Incentive Trust (“the Trust”) are cancelled on consolidation. Neither IBRC or the Trust purchased or disposed of any of the shares during the financial year.
SUBORDINATED LIABILITIESAll subordinated liabilities were settled during the financial year and no amounts are outstanding at financial year end. (2012: R160,8 million).
DIvIDENDSA dividend of R10,0 million based on the results of the 2012 financial year (2012: R10,0 million) was declared, of which R8,9 million (2012: R8,9 million) (net of dividend to Group companies and the Trust) was distributed to shareholders in October 2012 (2011 dividend declared and distributed in October 2011).
DIRECTORSThe Board of directors during the year under review and up to the date of publishing this report consists of:
Appointed Resigned
d Botha (Chairman) 1 August 2011A Canter 24 February 1999C Clark 1 November 2011M danisi 1 November 2011S dube 27 September 2012R de Korte 15 August 2000 27 September 2012J Howard 28 September 2007G McKenzie 12 April 2010P Rackstraw (Alternate) 8 June 2010l Scholtz 28 May 2008W Oudenhove (Alternate) 8 June 2010P Truyens 11 August 1999
SECRETARY AND REGISTERED OFFICEThe address of the Company Secretary, JM Poulter, and of the registered office of the Company is:
unit F14, Pinewood Square Postal Address: Pinewood Office Park PO Box 1847 33 Riley Road GAllO MANOR Woodmead, Ext 3 2052 SANdTON 2052
SUBSIDIARY COMPANIESINCA’s 100% holding of the issued shares in INCA Bond Rehabilitation Company (Proprietary) limited and INCA Asset Finance (Proprietary) limited did not change during the year under review. details relating to INCA’s subsidiary companies are reflected in note 5 of the annual financial statements. The interest of INCA in the after tax profits of its subsidiary companies for the year is R2,7 million (2012: R3,3 million). This profit was derived from INCA Bond Rehabilitation Company (Proprietary) limited (IBRC) as all other subsidiaries are dormant. IBRC declared a dividend of R75,9 million to INCA during the year.
l INCA l Annual Report 2013
14
The committee is satisfied that the external auditors are independent of Infrastructure Finance Corporation limited (INCA) and its subsidiaries and confirms that it has carried out those functions and responsibilities required in terms of the Companies Act of South Africa as set out below. The committee concurs with and accepts the external auditors’ conclusion on the annual financial statements and has recommended the approval thereof to the Board of directors. The Board has subsequently approved these annual financial statements.
THE KEY FUNCTIONS AND RESPONSIBILITIES OF THE COMMITTEE ARE TO:
♦♦ assist the Board of directors in its evaluation of the adequacy and efficiency of the internal control systems, accounting practices, information systems and monitoring processes applied within the Group in the day-to-day management of its business;
♦♦ facilitate and promote communication between the Board, management and the external auditors;
♦♦ introduce such measures as in the committee’s opinion may serve to enhance the credibility and objectivity of financial statements and reports prepared with reference to the affairs of the Group;
// aUDiT, RiSk aND COMPliaNCE COMMiTTEE REPORT
// DiRECTORS’ REPORT CONTINUED
♦♦ nominate for appointment as auditors of the Company and its subsidiaries registered auditors who, in the opinion of the committee, are independent of the Group;
♦♦ determine the fees to be paid to the auditors and the auditors’ terms of engagement;
♦♦ ensure that the appointment of the auditors complies with the Companies Act and any other legislation relating to the appointment of auditors;
♦♦ determine the nature and extent of any non-audit services that the auditors may provide to the Group and confirm their independence;
♦♦ review and discuss the audited annual financial statements included in the annual report with the external auditors and the Portfolio Managers responsible for the daily management of the INCA business; and
♦♦ review significant adjustments resulting from external audit queries and accept immaterial unadjusted audit differences.
Chairperson: Audit, Risk and Compliance Committee3 October 2013
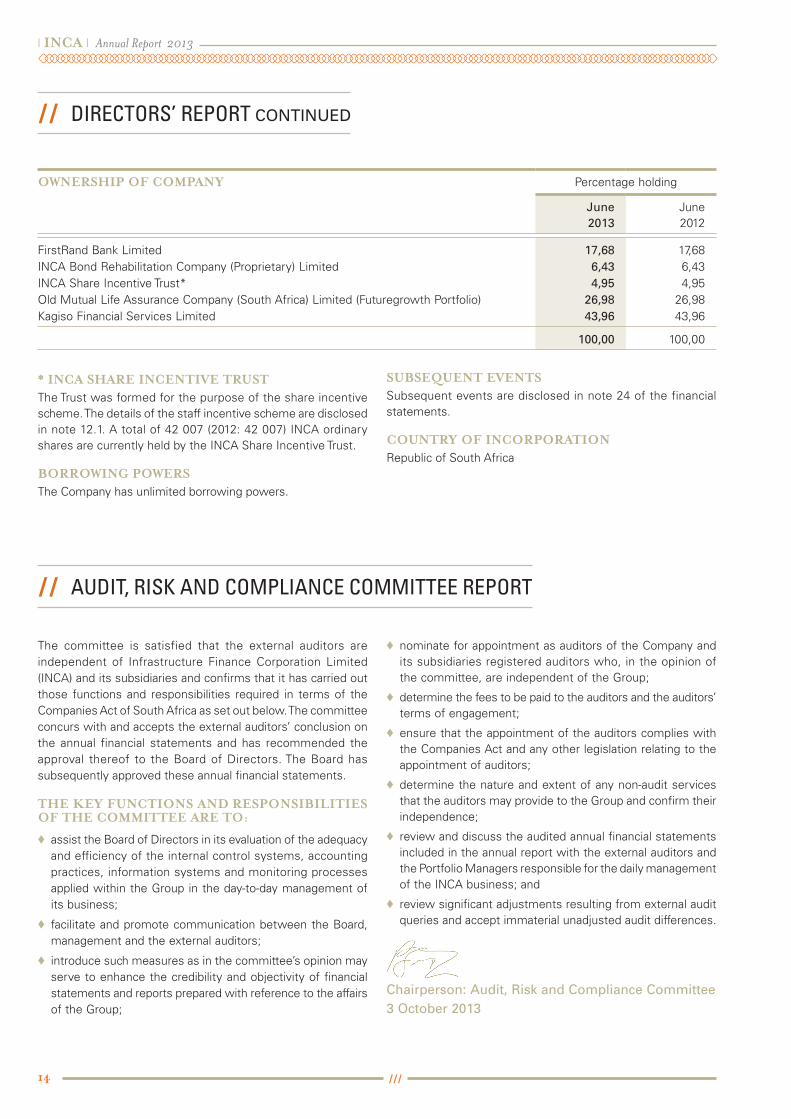
OwNERSHIP OF COMPANY Percentage holding
June2013
June2012
FirstRand Bank limited 17,68 17,68 INCA Bond Rehabilitation Company (Proprietary) limited 6,43 6,43 INCA Share Incentive Trust* 4,95 4,95 Old Mutual life Assurance Company (South Africa) limited (Futuregrowth Portfolio) 26,98 26,98 Kagiso Financial Services limited 43,96 43,96
100,00 100,00
* INCA SHARE INCENTIvE TRUSTThe Trust was formed for the purpose of the share incentive scheme. The details of the staff incentive scheme are disclosed in note 12.1. A total of 42 007 (2012: 42 007) INCA ordinary shares are currently held by the INCA Share Incentive Trust.
BORROwING POwERSThe Company has unlimited borrowing powers.
SUBSEQUENT EvENTSSubsequent events are disclosed in note 24 of the financial statements.
COUNTRY OF INCORPORATIONRepublic of South Africa

15
l INCA l Annual Report 2013
// CONSOliDaTED STaTEMENTS Of fiNaNCial POSiTiONAS AT JUNE 2013
Group Company
Notes
30 June2013
R’000
30 June2012
R’000
30 June2013
R’000
30 June2012
R’000
ASSETSCash and cash equivalents 3 180 287 282 080 180 265 282 038 Other assets 4 22 996 29 316 22 990 29 253 Investments 5 123 704 600 758 160 923 568 306 derivative financial instruments 13 – 12 685 – 12 685 Advances 6 1 146 357 1 462 977 1 145 375 1 455 593 deferred taxation 19.3 7 543 11 341 7 696 12 413 Property, plant and equipment 7 90 296 90 296
Total assets 1 480 977 2 399 453 1 517 339 2 360 584
EQUITY AND LIABILITIESCapital and reservesShare capital 8 752 752 849 849 Share premium 9 92 241 92 241 105 988 105 988 unrealised fair value reserve 9 127 (12 274) 624 (20 797)Retained earnings 315 318 333 224 346 359 289 232
Total equity 417 438 413 943 453 820 375 272
LiabilitiesSubordinated borrowed funds 10 – 160 789 – 160 789 Borrowed funds 11 936 572 1 608 444 936 572 1 608 444 Trade and other payables 12 21 399 40 877 21 397 40 542 Taxation payable 36 692 35 270 36 674 35 407 derivative financial instruments 13 68 876 140 130 68 876 140 130
Total liabilities 1 063 539 1 985 510 1 063 519 1 985 312
Total equity and liabilities 1 480 977 2 399 453 1 517 339 2 360 584
Approximate rates of exchange ruling at the end of the year:uSd 9.9388 8.1600EuR 12.9159 10.3291GBP 15.0816 12.8161
l INCA l Annual Report 2013
16
Group Company
Notes
30 June2013
R’000
30 June2012
R’000
30 June2013
R’000
30 June2012
R’000
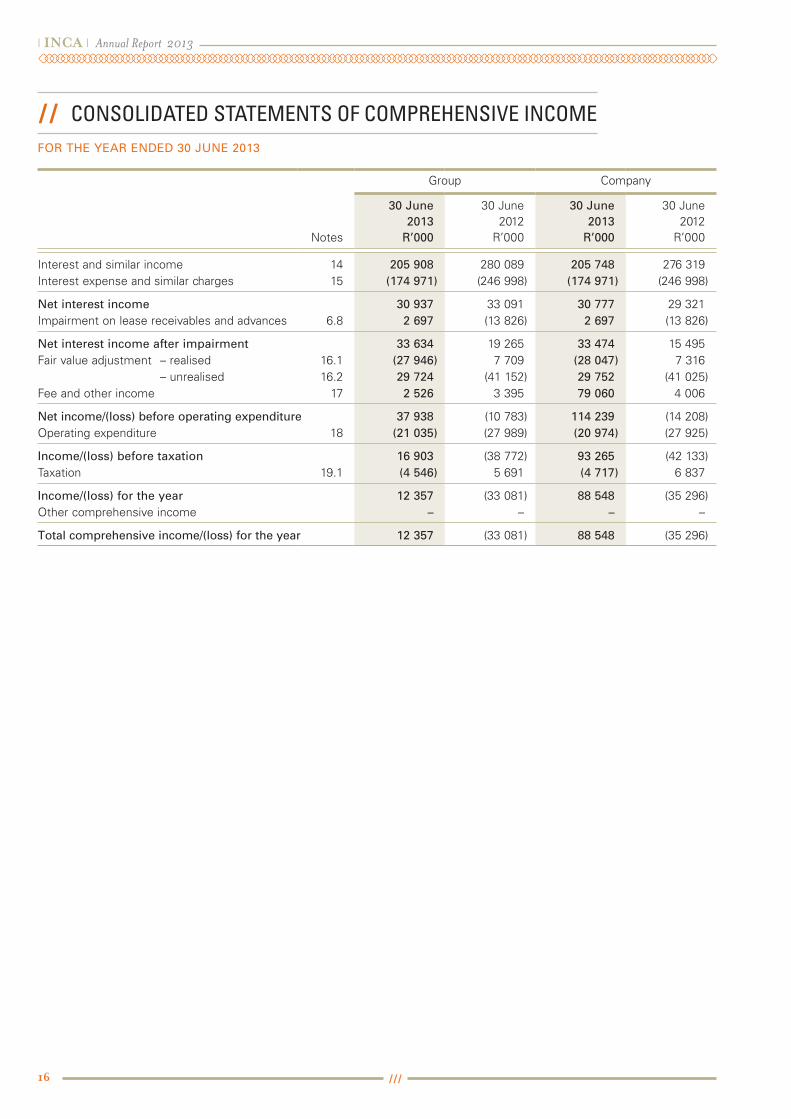
Interest and similar income 14 205 908 280 089 205 748 276 319 Interest expense and similar charges 15 (174 971) (246 998) (174 971) (246 998)
Net interest income 30 937 33 091 30 777 29 321 Impairment on lease receivables and advances 6.8 2 697 (13 826) 2 697 (13 826)
Net interest income after impairment 33 634 19 265 33 474 15 495 Fair value adjustment – realised 16.1 (27 946) 7 709 (28 047) 7 316 – unrealised 16.2 29 724 (41 152) 29 752 (41 025)Fee and other income 17 2 526 3 395 79 060 4 006
Net income/(loss) before operating expenditure 37 938 (10 783) 114 239 (14 208)Operating expenditure 18 (21 035) (27 989) (20 974) (27 925)
Income/(loss) before taxation 16 903 (38 772) 93 265 (42 133)Taxation 19.1 (4 546) 5 691 (4 717) 6 837
Income/(loss) for the year 12 357 (33 081) 88 548 (35 296)Other comprehensive income – – – –
Total comprehensive income/(loss) for the year 12 357 (33 081) 88 548 (35 296)
// CONSOliDaTED STaTEMENTS Of COMPREhENSiVE iNCOMEFOR ThE YEAR ENDED 30 JUNE 2013
17
l INCA l Annual Report 2013
// CONSOliDaTED STaTEMENTS Of ChaNgES iN EQUiTyFOR ThE YEAR ENDED 30 JUNE 2013
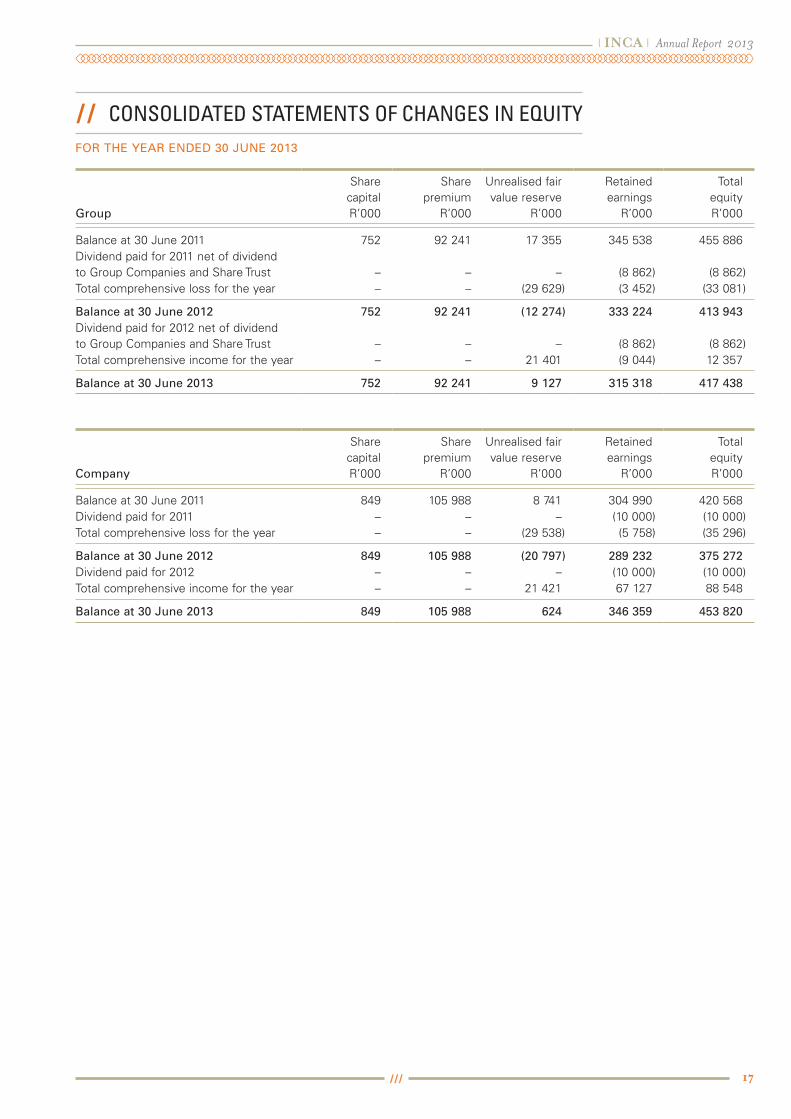
Group
SharecapitalR’000
Sharepremium
R’000
unrealised fairvalue reserve
R’000
Retainedearnings
R’000
TotalequityR’000
Balance at 30 June 2011 752 92 241 17 355 345 538 455 886dividend paid for 2011 net of dividend to Group Companies and Share Trust – – – (8 862) (8 862)Total comprehensive loss for the year – – (29 629) (3 452) (33 081)
Balance at 30 June 2012 752 92 241 (12 274) 333 224 413 943 dividend paid for 2012 net of dividend to Group Companies and Share Trust – – – (8 862) (8 862)Total comprehensive income for the year – – 21 401 (9 044) 12 357
Balance at 30 June 2013 752 92 241 9 127 315 318 417 438
Company
Share capital R’000
Share premium
R’000
unrealised fairvalue reserve
R’000
Retained earnings
R’000
Total equity R’000
Balance at 30 June 2011 849 105 988 8 741 304 990 420 568dividend paid for 2011 – – – (10 000) (10 000)Total comprehensive loss for the year – – (29 538) (5 758) (35 296)
Balance at 30 June 2012 849 105 988 (20 797) 289 232 375 272dividend paid for 2012 – – – (10 000) (10 000)Total comprehensive income for the year – – 21 421 67 127 88 548
Balance at 30 June 2013 849 105 988 624 346 359 453 820

l INCA l Annual Report 2013
18
// CONSOliDaTED CaSh flOW STaTEMENTSFOR ThE YEAR ENDED 30 JUNE 2013
Group Company
Notes
30 June2013
R’000
30 June2012
R’000
30 June2013
R’000
30 June2012
R’000
CASH FLOwS FROM OPERATING ACTIvITIESCash receipts from borrowers and customers A.1 106 860 158 441 109 320 158 236 Cash paid to lenders, employees and suppliers A.2 (195 547) (271 929) (195 486) (271 865)Cash receipts from investments and cash balances A.3 75 230 133 419 149 159 130 188
Cash (utilised in)/generated from operations A.5 (13 457) 19 931 62 993 16 559 Normal taxation refund A.4 674 15 274 1 267 18 098 dividends paid (8 862) (8 862) (10 000) (10 000)CHANGES IN OPERATING FUNDSdecrease in income earning assets A.6 850 578 333 152 774 417 334 533 decrease/(increase) in non-income earning assets A.7 6 320 (3 771) 6 263 (3 734)decrease in borrowings, derivatives and other payables A.8 (937 271) (318 879) (936 938) (318 643)
Net change in operating funds (80 373) 10 502 (156 258) 12 156
Net cash (outflow)/inflow from operating activities (102 018) 36 845 (101 998) 36 813 CASH FLOwS FROM INvESTING ACTIvITIESPayments for property, plant and equipment – (14) – (14)Proceeds from disposal of property, plant and equipment 225 – 225 –
Net cash inflow/(outflow) from investing activities 225 (14) 225 (14)
(decrease)/increase in cash and cash equivalents (101 793) 36 831 (101 773) 36 799 Cash and cash equivalents at the beginning of the year 282 080 245 249 282 038 245 239
Cash and cash equivalents at the end of the year 180 287 282 080 180 265 282 038
19
l INCA l Annual Report 2013
// NOTES TO ThE CONSOliDaTED CaSh flOW STaTEMENTSFOR ThE YEAR ENDED 30 JUNE 2013
Group Company
30 June2013
R’000
30 June2012
R’000
30 June2013
R’000
30 June2012
R’000
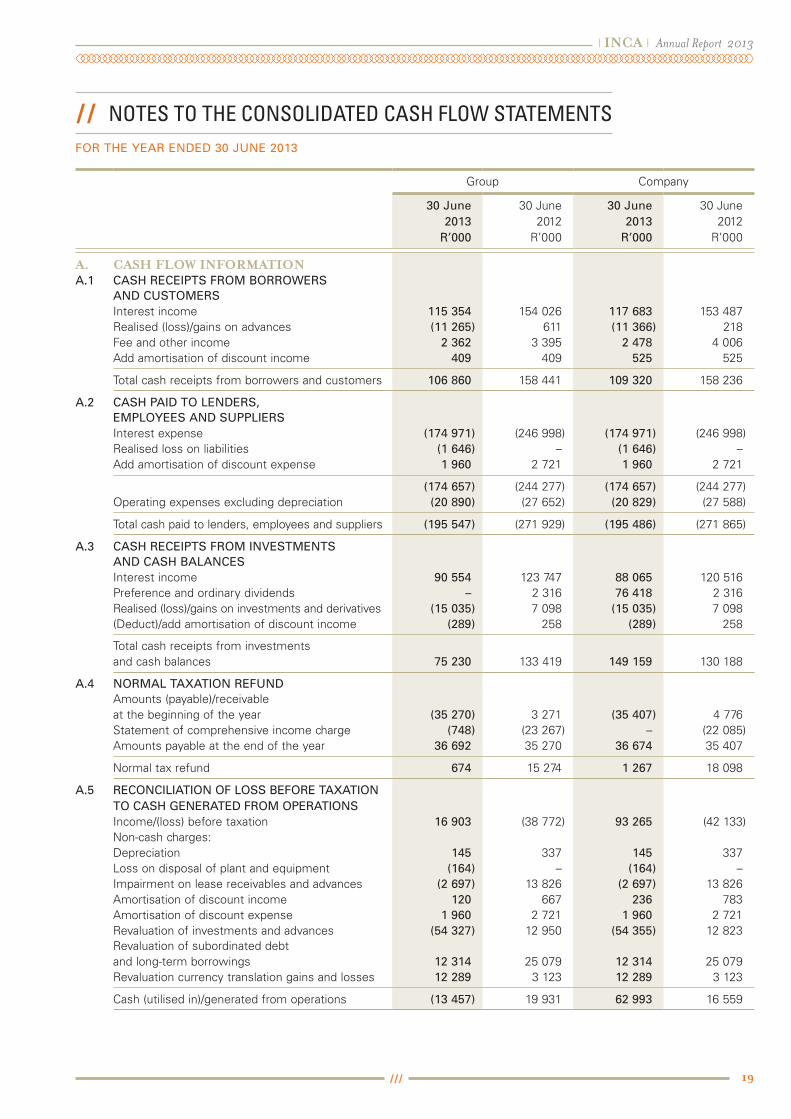
A. CASH FLOw INFORMATIONA.1 CASh RECEIPTS FROM BORROWERS
AND CUSTOMERSInterest income 115 354 154 026 117 683 153 487 Realised (loss)/gains on advances (11 265) 611 (11 366) 218 Fee and other income 2 362 3 395 2 478 4 006 Add amortisation of discount income 409 409 525 525
Total cash receipts from borrowers and customers 106 860 158 441 109 320 158 236
A.2 CASh PAID TO LENDERS, EMPLOYEES AND SUPPLIERSInterest expense (174 971) (246 998) (174 971) (246 998)Realised loss on liabilities (1 646) – (1 646) – Add amortisation of discount expense 1 960 2 721 1 960 2 721
(174 657) (244 277) (174 657) (244 277)Operating expenses excluding depreciation (20 890) (27 652) (20 829) (27 588)
Total cash paid to lenders, employees and suppliers (195 547) (271 929) (195 486) (271 865)
A.3 CASh RECEIPTS FROM INVESTMENTS AND CASh BALANCESInterest income 90 554 123 747 88 065 120 516 Preference and ordinary dividends – 2 316 76 418 2 316 Realised (loss)/gains on investments and derivatives (15 035) 7 098 (15 035) 7 098 (deduct)/add amortisation of discount income (289) 258 (289) 258
Total cash receipts from investments and cash balances 75 230 133 419 149 159 130 188
A.4 NORMAL TAxATION REFUNDAmounts (payable)/receivable at the beginning of the year (35 270) 3 271 (35 407) 4 776 Statement of comprehensive income charge (748) (23 267) – (22 085)Amounts payable at the end of the year 36 692 35 270 36 674 35 407
Normal tax refund 674 15 274 1 267 18 098
A.5 RECONCILIATION OF LOSS BEFORE TAxATION TO CASh GENERATED FROM OPERATIONSIncome/(loss) before taxation 16 903 (38 772) 93 265 (42 133)Non-cash charges:depreciation 145 337 145 337 loss on disposal of plant and equipment (164) – (164) – Impairment on lease receivables and advances (2 697) 13 826 (2 697) 13 826 Amortisation of discount income 120 667 236 783 Amortisation of discount expense 1 960 2 721 1 960 2 721 Revaluation of investments and advances (54 327) 12 950 (54 355) 12 823 Revaluation of subordinated debt and long-term borrowings 12 314 25 079 12 314 25 079 Revaluation currency translation gains and losses 12 289 3 123 12 289 3 123
Cash (utilised in)/generated from operations (13 457) 19 931 62 993 16 559
l INCA l Annual Report 2013
20
Group Company
30 June2013
R’000
30 June2012
R’000
30 June2013
R’000
30 June2012
R’000
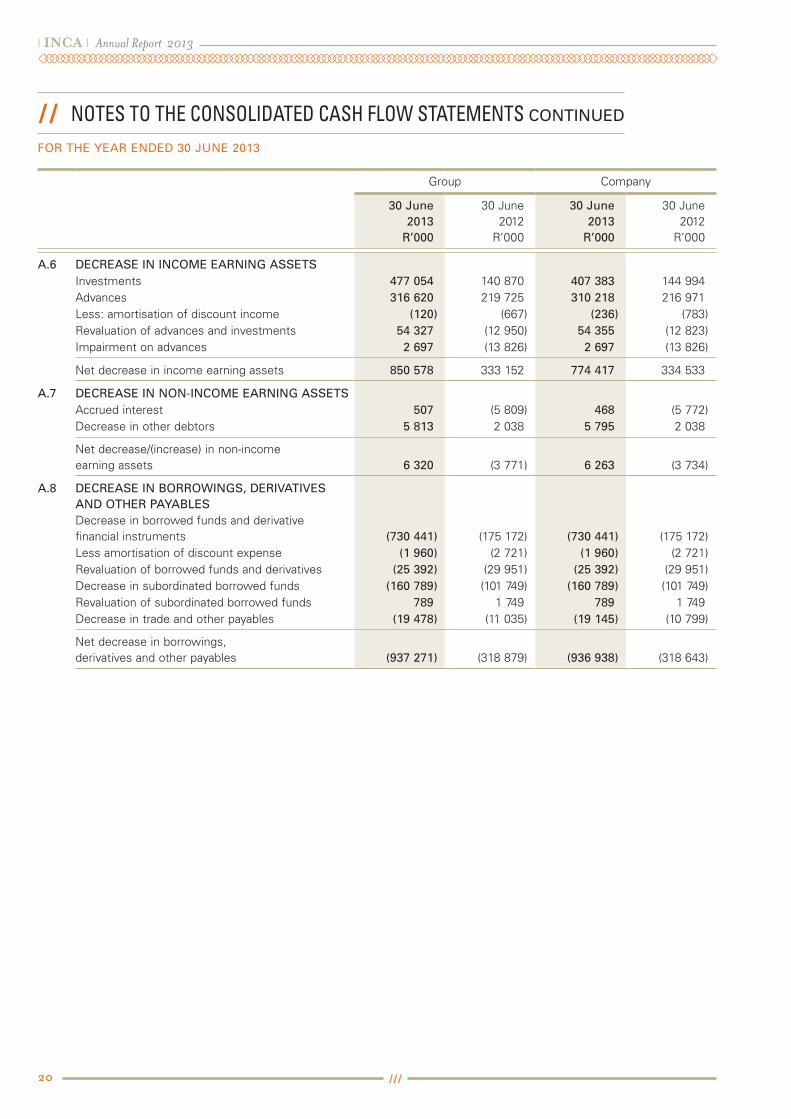
A.6 DECREASE IN INCOME EARNING ASSETSInvestments 477 054 140 870 407 383 144 994 Advances 316 620 219 725 310 218 216 971 less: amortisation of discount income (120) (667) (236) (783)Revaluation of advances and investments 54 327 (12 950) 54 355 (12 823)Impairment on advances 2 697 (13 826) 2 697 (13 826)
Net decrease in income earning assets 850 578 333 152 774 417 334 533
A.7 DECREASE IN NON-INCOME EARNING ASSETSAccrued interest 507 (5 809) 468 (5 772)decrease in other debtors 5 813 2 038 5 795 2 038
Net decrease/(increase) in non-income earning assets 6 320 (3 771) 6 263 (3 734)
A.8 DECREASE IN BORROWINGS, DERIVATIVES AND OThER PAYABLESdecrease in borrowed funds and derivative financial instruments (730 441) (175 172) (730 441) (175 172)less amortisation of discount expense (1 960) (2 721) (1 960) (2 721)Revaluation of borrowed funds and derivatives (25 392) (29 951) (25 392) (29 951)decrease in subordinated borrowed funds (160 789) (101 749) (160 789) (101 749)Revaluation of subordinated borrowed funds 789 1 749 789 1 749 decrease in trade and other payables (19 478) (11 035) (19 145) (10 799)
Net decrease in borrowings, derivatives and other payables (937 271) (318 879) (936 938) (318 643)
// NOTES TO ThE CONSOliDaTED CaSh flOW STaTEMENTS CONTINUED
FOR ThE YEAR ENDED 30 JUNE 2013

21
l INCA l Annual Report 2013
// NOTES TO ThE CONSOliDaTED aNNUal fiNaNCial STaTEMENTSFOR ThE YEAR ENDED 30 JUNE 2013
1 ACCOUNTING POLICIES The Group adopts the following accounting policies in
preparing its consolidated annual financial statements.
ADOPTION OF NEW AND REVISED STANDARDS
Standards and Interpretations effective in the current period
The following revised Standards have been adopted in the current period. Their adoption did not have any significant impact on the amounts reported and were more focused on the presentation and disclosure made in these annual financial statements.
♦♦ IAS 1, Presentation of financial statements – Amendments effective for annual periods beginning on or after 1 January 2012.
♦♦ IAS 12, Income Taxes – Amendments effective for annual periods beginning on or after 1 January 2012.
Standards and Interpretations in issue not yet adopted
At the date of authorisation of these annual financial statements, the following relevant Standards were in issue but not yet effective:
♦♦ IFRS 1, First time adoption IFRS Government loans – Amendments effective for annual periods beginning on or after 1 January 2013.
♦♦ IFRS 7, Financial Instruments: disclosures – Amendmends effective for annual periods beginning on or after 1 January 2013.
♦♦ IFRS 9, Financial Instruments: Classification and measurement – New standard effective for annual periods beginning on or after 1 January 2015.
♦♦ IFRS 10, Consolidated Financial Statements – New standard effective for annual periods beginning on or after 1 January 2013.
♦♦ IFRS 11, Joint arrangements – New standard effective for annual periods beginning on or after 1 January 2013.
♦♦ IFRS 12, disclosure of Interests in Other Entities – New standard effective for annual periods beginning on or after 1 January 2013.
♦♦ IFRS 13, Fair value Measurement – New standard effective for annual periods beginning on or after 1 January 2013.
♦♦ IAS 1, Presentation of Financial Statements – Amendments effective for annual periods beginning on or after 1 January 2013.
♦♦ IAS 16, Property, Plant and Equipment – Amendments effective for annual periods beginning on or after 1 January 2013.
♦♦ IAS 19, Employee Benefits – Amendments effective for annual periods beginning on or after 1 January 2013.
♦♦ IAS 27, Consolidated and Separate Financial statements – Amendments effective for annual periods beginning on or after 1 January 2013.
♦♦ IAS 28, Investment in Associates and Joint ventures – Amendments effective for annual periods beginning on or after 1 January 2013.
♦♦ IAS 32, Financial instruments: Presentation – Amendments effective for annual periods beginning on or after 1 January 2013.
♦♦ IAS 34, Interim financial reporting – Amendments effective for annual periods beginning on or after 1 January 2013.
The directors anticipate that the adoption of these Standards in future years will have no material impact on the annual financial statements of the Group, other than significant disclosure and additional effort and resources.
1.1 BASIS OF PRESENTATION
The Group’s consolidated annual financial statements have been prepared in accordance with the International Financial Reporting Standards (IFRS) adopted by the International Accounting Standards Board (IASB) and interpretations issued by the International Financial Reporting Interpretations Committee (IFRIC) of the IASB, and the requirements of the Companies Act of South Africa.
The consolidated annual financial statements are prepared on the historical cost basis, except for the following assets and liabilities that are stated at fair value:
♦♦ derivative financial instruments; and
♦♦ Financial assets and financial liabilities designated at fair value through profit or loss.
1.2 CONSOLIDATION The consolidated annual financial statements include
the assets, liabilities and results of the operations of the holding company and its subsidiaries. Subsidiaries are companies in which the Group, directly or indirectly, has a long-term interest and the power to exercise control over the operations. The Group considers the existence and effect of potential voting rights that are presently exercisable or convertible in determining control.
The Group uses the purchase method of accounting to account for the acquisition of subsidiaries. Subsidiaries are consolidated from the date on which the Group acquires effective control. Consolidation is discontinued from the effective date of disposal. The Group recognises assets and liabilities acquired in its statement of financial position at their estimated fair values at the date of acquisition. It eliminates all intercompany transactions, balances and unrealised surpluses and deficits on transactions between Group companies.

l INCA l Annual Report 2013
22
1.3 REVENUE RECOGNITION
1.3.1 Interest income and expense
The Group recognises interest income and expense on an accrual basis in profit or loss using the effective interest method taking into account the expected timing and amount of cash flows. The effective interest method is a method of calculating the amortised cost of a financial asset or financial liability and of allocating the interest income or expense over the relevant period. Interest income and expense include the amortisation of any discount or premium or other differences between the initial carrying amount of an interest-bearing instrument and its amount at maturity calculated on an effective interest rate basis.
1.3.2 Fair value adjustments (realised and unrealised) The Group includes profits, losses and fair value
adjustments on financial instruments, both realised and unrealised, in income as earned.
1.3.3 Fee and other income
The Group recognises fee and other income on an accrual basis when the service is rendered to clients and the amount of revenue from the transaction or service can be reliably measured. The Group recognises revenue for services rendered to customers based on the estimated outcome of the transactions. When the outcome can be reliably estimated, transaction revenue is recognised by reference to the stage of completion of the transaction at the date of the statement of financial position. The stage of completion is measured based on the amount of work performed. When the outcome cannot be reliably estimated, revenue is recognised only to the extent of the expenses incurred that are recoverable.
1.3.4 Dividends
The Group recognises dividends on the date of declaration for unlisted shares. dividend income includes scrip dividends, irrespective of whether there is an option to receive cash instead of shares.
1.4 FOREIGN CURRENCY TRANSACTIONS
The Group converts transactions in foreign currencies to South African Rand at the spot rate on the transaction date. Monetary assets and liabilities in foreign currencies are translated to South African Rand using the rates of exchange ruling at the date of the statement of financial position. Exchange differences on monetary financial assets and liabilities measured at fair value are included in the statement of comprehensive income for the year.
1.5 TAxATION
1.5.1 Current taxation assets and liabilities
The tax currently payable is based on taxable profit for the year. Taxable profit differs from profit as reported in
// NOTES TO ThE CONSOliDaTED aNNUal fiNaNCial STaTEMENTS CONTINUED
FOR ThE YEAR ENDED 30 JUNE 2013
the statement of comprehensive income because of items of income or expense that are taxable or deductible in other years and items that are never taxable or deductible.
Current tax liabilities (assets) for the current and prior periods are measured at the amount expected to be paid to (recovered from) the tax authorities, using the tax rates enacted or substantively enacted at the balance sheet date.
Current and deferred taxes are recognised as income or an expense and included in profit or loss for the period, except to the extent that the tax arises from:
♦♦ A transaction or event which is recognised, in the same or a different period, directly in equity, or
♦♦ A business combination.
Current tax and deferred taxes are charged or credited directly to equity if the tax relates to items that are credited or charged, in the same or a different period, directly to equity.
1.5.2 Deferred taxation assets and liabilities
deferred tax is recognised on temporary differences between the carrying amounts of assets and liabilities in the financial statements and the corresponding tax bases used in the computation of taxable profit. Such deferred tax assets and liabilities are not recognised if the temporary difference arises from goodwill or from the initial recognition (other than in a business combination) of other assets and liabilities in a transaction that affects neither the taxable profit nor the accounting profit.
A deferred taxation liability is recognised for all taxable temporary differences.
deferred tax assets arising from deductible temporary differences associated with such investments and interests are only recognised to the extent that it is probable that there will be sufficient taxable profits against which to utilise the benefits of the temporary differences and they are expected to reverse in the foreseeable future.
A deferred tax asset is recognised for the carry forward of unused tax losses to the extent that it is probable that future taxable profit will be available against which the unused tax losses can be utilised.
The carrying amount of deferred tax assets is reviewed at the end of each reporting period and reduced to the extent that it is no longer probable that sufficient taxable profits will be available to allow all or part of the asset to be recovered.
23
l INCA l Annual Report 2013
deferred tax assets and liabilities are measured at the tax rates that are expected to apply in the period in which the liability is settled or the asset realised, based on tax rates (and tax laws) that have been enacted or substantively enacted by the end of the reporting period. The measurement of deferred tax liabilities and assets reflects the tax consequences that would follow from the manner in which the Group expects, at the end of the reporting period, to recover or settle the carrying amount of its assets and liabilities.
deferred tax assets and liabilities are offset when there is a legally enforceable right to set off current tax assets against current tax liabilities and when they relate to income taxes levied by the same taxation authority and the Group intends to settle its current tax assets and liabilities on a net basis.
1.5.3 Current and deferred taxation for the period
Current and deferred tax are recognised as an expense or income in profit or loss, except when they relate to items that are recognised outside profit or loss (whether in other comprehensive income or directly in equity), in which case the tax is also recognised outside profit or loss, or where they arise from the initial accounting for a business combination. In the case of a business combination, the tax effect is taken into account in the accounting for the business combination.
1.6 RECOGNITION OF ASSETS, LIABILITIES AND PROVISIONS
1.6.1 Assets
The Group recognises assets when it obtains control of a resource as a result of past events, and from which future economic benefits are expected to flow to the enterprise.
1.6.2 Contingent assets
The Group discloses a contingent asset where, as a result of past events, it is highly likely that economic benefits will flow to it, but this will only be confirmed by the occurrence or non-occurrence of one or more uncertain future events which are not wholly within the Group’s control.
1.6.3 Liabilities and provisions
The Group recognises liabilities, including provisions when:
♦♦ it has a present legal or constructive obligation as a result of past events; and
♦♦ it is probable that an outflow of resources embodying economic benefits will be required to settle the obligation; and
♦♦ a reliable estimate of the amount of the obligation can be made.
1.6.4 Contingent liabilities
The Group discloses a contingent liability where:
♦♦ it has a possible obligation arising from past events, the existence of which will be confirmed only by the occurrence or non-occurrence of one or more uncertain future events not wholly within the control of the enterprise; or
♦♦ it is not probable that an outflow of resources will be required to settle an obligation; or
♦♦ the amount of the obligation cannot be measured with sufficient reliability.
1.6.5 Sale and repurchase agreements
The Group annual financial statements reflect securities sold subject to a linked repurchase agreement (“repos”) as trading or investment stock. These instruments are measured at fair value, with changes in fair value reported in the statement of comprehensive income. The counterparty liability is included in long-term liabilities at fair value on the date of the statement of financial position.
Securities purchased under agreements to resell (“reverse repos”) are recorded in other assets. The difference between sale and repurchase price is treated as interest and accrued over the life of repo agreements using the effective yield method.
The Group recognises all sale and repurchase agreements on trade date.
1.7 OFFSETTING FINANCIAL INSTRUMENTS
The Group offsets financial assets and liabilities and reports the net balance in the statement of financial position where:
♦♦ there is a legally enforceable right to set off; and
♦♦ there is an intention to settle on a net basis or to realise the asset and settle the liability simultaneously; and
♦♦ the maturity date for the financial asset and liability is the same; and
♦♦ the financial asset and liability is denominated in the same currency.
1.8 CASh AND CASh EqUIVALENTS
In the cash flow statement, cash and cash equivalents comprise:
♦♦ coins and bank notes; and
♦♦ money at call and short notice.
l INCA l Annual Report 2013
24
1.9 FINANCIAL ASSETS
Investments are recognised and derecognised on trade date where the purchase or sale of an investment is under a contract whose terms require delivery of the investment within the timeframe established by the market concerned, and are initially measured at fair value, plus transaction costs, except for those financial assets classified as at fair value through profit or loss, which are initially measured at fair value.
Financial assets are classified into the following specified categories: financial assets ‘at fair value through profit or loss’ (FvTPl), ‘held for trading’ financial assets and ‘loans and receivables’. The classification depends on the nature and purpose of the financial assets and is determined at the time of initial recognition.
1.9.1 Effective interest method
The effective interest method is a method of calculating the amortised cost of a financial asset and of allocating interest income over the relevant period. The effective interest rate is the rate that exactly discounts estimated future cash receipts (including all fees on points paid or received that form an integral part of the effective interest rate, transaction costs and other premiums or discounts) through the expected life of the financial asset, or, where appropriate, a shorter period. Income is recognised on an effective interest basis for debt instruments other than those financial assets designated as at FvTPl.
1.9.2 Financial assets held for trading A financial asset is classified as held for trading if:
♦♦ it has been acquired principally for the purpose of selling in the near future; or
♦♦ it is a part of an identified portfolio of financial instruments that the Group manages together and has a recent actual pattern of short-term profit-taking; or
♦♦ it is a derivative that is not designated and effective as a hedging instrument.
1.9.3 Financial assets at FVTPL A financial asset other than a financial asset held for
trading may be designated as at FvTPl upon initial recognition if:
♦♦ such designation eliminates or significantly reduces a measurement or recognition inconsistency that would otherwise arise; or
♦♦ the financial asset forms part of a group of financial assets or financial liabilities or both, which is managed and its performance is evaluated on a fair value basis, in accordance with the Group’s documented risk management or investment strategy, and information about the grouping is provided internally on that basis; or
// NOTES TO ThE CONSOliDaTED aNNUal fiNaNCial STaTEMENTS CONTINUED
FOR ThE YEAR ENDED 30 JUNE 2013
♦♦ it forms part of a contract containing one or more embedded derivatives, and IAS 39 Financial Instruments: Recognition and Measurement permits the entire combined contract (asset or liability) to be designated as at FvTPl.
various instruments are designated as at FvTPl which is consistent with the Groups documented valuation policy. The risk of the portfolio is managed on a fair value basis. Performance measurement of the portfolio is based on the fair value method and is reported to key management staff on a regular basis.
Consistent with the criteria above, the funding of the Group is largely raised on the debt capital market and thus exposed to fair value movements, thus to avoid a possible valuation mismatch, related assets are designated as at FvTPl.
Financial assets at FvTPl are stated at fair value, with any resultant gain or loss recognised in profit or loss. The net gain or loss recognised in profit or loss incorporates any dividend or interest earned on the financial asset. Fair value is determined in the manner described in note 23.
1.9.4 Loans and receivables
Trade receivables, loans, and other receivables that have fixed or determinable payments that are not quoted in an active market are classified as loans and receivables. loans and receivables are measured at amortised cost using the effective interest method, less any impairment. Interest income is recognised by applying the effective interest rate, except for short-term receivables when the recognition of interest would be immaterial.
1.9.5 Impairment of financial assets Financial assets, other than those at FvTPl, are assessed
for indicators of impairment at each date of the statement of financial position. Financial assets are impaired where there is objective evidence that, as a result of one or more events that occurred after the initial recognition of the financial asset, the estimated future cash flows of the investment have been impacted.
For all other financial assets, including finance lease receivables, objective evidence of impairment could include:
♦♦ significant financial difficulty of the issuer or counterparty; or
♦♦ default or delinquency in interest or principal payments; or
♦♦ it becoming probable that the borrower will enter bankruptcy or financial re-organisation.
For certain categories of financial asset, such as trade receivables, assets that are assessed not to be impaired individually are subsequently assessed for impairment

25
l INCA l Annual Report 2013
on a collective basis. Objective evidence of impairment for a portfolio of receivables could include the Group’s past experience of collecting payments, an increase in the number of delayed payments in the portfolio past the average credit period of 60 days, as well as observable changes in national or local economic conditions that correlate with default on receivables.
For financial assets carried at amortised cost, the amount of the impairment is the difference between the asset’s carrying amount and the present value of estimated future cash flows, discounted at the financial asset’s original effective interest rate.
The carrying amount of the financial asset is reduced by the impairment loss directly for all financial assets with the exception of rentals where the carrying amount is reduced through the use of an allowance account. Changes in the carrying amount of the allowance account are recognised in profit or loss.
Should the amount of the impairment loss decrease in a subsequent period and the decrease can be related objectively to an event occurring after the impairment was recognised, the previously recognised impairment loss is reversed through profit or loss to the extent that the carrying amount of the investment at the date the impairment is reversed does not exceed what the amortised cost would have been had the impairment not been recognised.
1.9.6 Derecognition of financial assets
The Group derecognises a financial asset only when the contractual rights to the cash flows from the asset expire; or it transfers the financial asset and substantially all the risks and rewards of ownership of the asset to another entity. If the Group neither transfers nor retains substantially all the risks and rewards of ownership and continues to control the transferred asset, the Group recognises its retained interest in the asset and an associated liability for amounts it may have to pay. If the Group retains substantially all the risks and rewards of ownership of a transferred financial asset, the Group continues to recognise the financial asset and also recognises a collateralised borrowing for the proceeds received.
1.10 FINANCIAL LIABILITIES ISSUED BY ThE GROUP
1.10.1 Financial guarantee contract liabilities
Financial guarantee contract liabilities are measured initially at their fair values and are subsequently measured at the higher of:
♦♦ the amount of the obligation under the contract, as determined in accordance with IAS 37 Provisions, Contingent liabilities and Contingent Assets; and
♦♦ the amount initially recognised less, where appropriate, cumulative amortisation recognised in accordance with the revenue recognition policies set out at 1.3 above.
1.10.2 Financial liabilities Financial liabilities are classified as either financial
liabilities ‘at FvTPl’ or ‘other financial liabilities’.
1.10.3 Financial liabilities at FVTPL Financial liabilities are classified as at FvTPl where the
financial liability is either held for trading or it is designated as at FvTPl.
A financial liability is classified as held for trading if:
♦♦ it has been incurred principally for the purpose of repurchasing in the near future; or
♦♦ it is a part of an identified portfolio of financial instruments that the Group manages together and has a recent actual pattern of short-term profit-taking; or
♦♦ it is a derivative that is not designated and effective as a hedging instrument.
A financial liability other than a financial liability held for trading may be designated as at FvTPl upon initial recognition if:
♦♦ such designation eliminates or significantly reduces a measurement or recognition inconsistency that would otherwise arise; or
♦♦ the financial liability forms part of a group of financial assets or financial liabilities or both, which is managed and its performance is evaluated on a fair value basis, in accordance with the Group’s documented risk management or investment strategy, and information about the grouping is provided internally on that basis; or
♦♦ it forms part of a contract containing one or more embedded derivatives, and IAS 39 Financial Instruments: Recognition and Measurement permits the entire combined contract (asset or liability) to be designated as at FvTPl.
Financial liabilities at FvTPl are stated at fair value, with any resultant gain or loss recognised in profit or loss. The net gain or loss recognised in profit or loss incorporates any interest paid on the financial liability. Fair value is determined in the manner described in note 23.
l INCA l Annual Report 2013
26
1.10.4 Other financial liabilities
Other financial liabilities are initially measured at fair value, net of transaction costs.
Other financial liabilities are subsequently measured at amortised cost using the effective interest method, with interest expense recognised on an effective yield basis.
The effective interest method is a method of calculating the amortised cost of a financial liability and of allocating interest expense over the relevant period. The effective interest rate is the rate that exactly discounts estimated future cash payments through the expected life of the financial liability, or, where appropriate, a shorter period.
1.10.5 Derecognition of financial liabilities
The Group derecognises financial liabilities when, and only when, the Group’s obligations are discharged, cancelled or they expire.
1.11 DERIVATIVE FINANCIAL INSTRUMENTS
The Group enters into a variety of derivative financial instruments to manage its exposure to interest rate and foreign exchange rate risk, including foreign exchange forward contracts, interest rate swaps and cross currency swaps.
Further details of derivative financial instruments are disclosed in note 13.
derivatives are initially recognised at fair value at the date a derivative contract is entered into and are subsequently re-measured to their fair value at each date of the statement of financial position. The resulting gain or loss is recognised in profit or loss immediately. Thus the Group elected not to do hedge accounting.
1.12 PROPERTY, PLANT AND EqUIPMENT
The Group carries property and equipment at cost less accumulated depreciation.
It depreciates equipment on a straight-line basis at rates calculated to reduce the book value of these assets to estimated residual values over their expected useful lives. Management reviews useful lives periodically to evaluate their appropriateness and current and future depreciation charges are adjusted accordingly.
The periods of depreciation used are as follows:
Computer equipment 2 – 6 years
Furniture and fittings 3 – 25 years
leasehold improvements 3 years
Generators 5 years
// NOTES TO ThE CONSOliDaTED aNNUal fiNaNCial STaTEMENTS CONTINUED
FOR ThE YEAR ENDED 30 JUNE 2013
The Group impairs an asset to its estimated recoverable amount where there is a permanent diminution in the carrying value of an asset. Repairs and maintenance costs are charged to the statement of comprehensive income as they are incurred. Gains or losses on disposals are determined by reference to the carrying amount of the asset and the net proceeds received, and is recognised in the statement of comprehensive income in the year of the disposal.
1.13 INTANGIBLE ASSETS
The Group does not attribute value to internally developed trademarks, concessions, patents and similar rights and assets, including franchises and management contracts. It charges costs incurred on trademarks, concessions, patents and similar rights and assets, whether purchased or created by it, to the statement of comprehensive income in the year in which the costs are incurred.
1.14 EMPLOYEE BENEFITS
1.14.1 Share appreciation rights obligation
The Group recognises the liability at fair value on date of the statement of financial position and the movement for the year is expensed in the statement of comprehensive income.
1.15 RELATED PARTY TRANSACTIONS
All related party transactions are at arm’s length and incurred in the ordinary course of business, except for the interest free loan to the INCA Share Incentive Trust.
1.16 FIDUCIARY ACTIVITIES
The Group excludes assets and the income thereon, together with related undertakings to return such assets to customers, from these annual financial statements where it acts in a fiduciary capacity such as nominee, trustee or agent.
1.17 BORROWING COSTS
Borrowing costs are recognised in profit or loss in the year in which they are incurred.
1.18 COMPARATIVES
Where appropriate, the comparative figures of change in Advances and change in Other Assets have been reclassified to achieve fair presentation. Further details are contained in note 26.

27
l INCA l Annual Report 2013
2 CRITICAL ACCOUNTING jUDGEMENTS AND KEY SOURCES OF ESTIMATION UNCERTAINTY
2.1 USE OF ESTIMATES, ASSUMPTION AND JUDGEMENTS
The preparation of the annual financial statements necessitates the use of estimates, assumptions and judgements. These estimates and assumptions affected the reported amounts of assets, liabilities and contingent liabilities at the date of the statement of financial position as well as affecting the reported income and expenses for the year. Although estimates are based on management’s best knowledge and judgement of current facts as at the date of the statement of financial position, the actual outcome may differ from those estimates.
2.2 KEY SOURCES OF ESTIMATION UNCERTAINTY
The following are the key assumptions concerning the future, and other key sources of estimation uncertainty at the date of the statement of financial position, that have a significant risk of causing a material adjustment to the carrying amounts of assets and liabilities within the next financial year.
2.2.1 Useful lives of property, plant and equipment
As described at 1.12 above, the Group reviews the estimated useful lives of property, plant and equipment at the end of each annual reporting period.
2.2.2 Fair value of derivatives and other financial instruments
The fair value of financial instruments that are not quoted in active markets are determined using valuation techniques. Where valuation techniques are used to determine fair values, they are validated and periodically reviewed by qualified personnel independent of the area that created them. The fair values are determined according to the valuation policy approved by the Market value verification Committee. To the extent practical, valuation models only use observable data, however areas such as credit risk, volatilities and correlations require management to make estimates. Changes in assumptions about these factors could affect reported fair value of financial instruments.
l INCA l Annual Report 2013
28
// NOTES TO ThE CONSOliDaTED aNNUal fiNaNCial STaTEMENTS CONTINUED
FOR ThE YEAR ENDED 30 JUNE 2013
Group Company
30 June2013
R’000
30 June2012
R’000
30 June2013
R’000
30 June2012
R’000
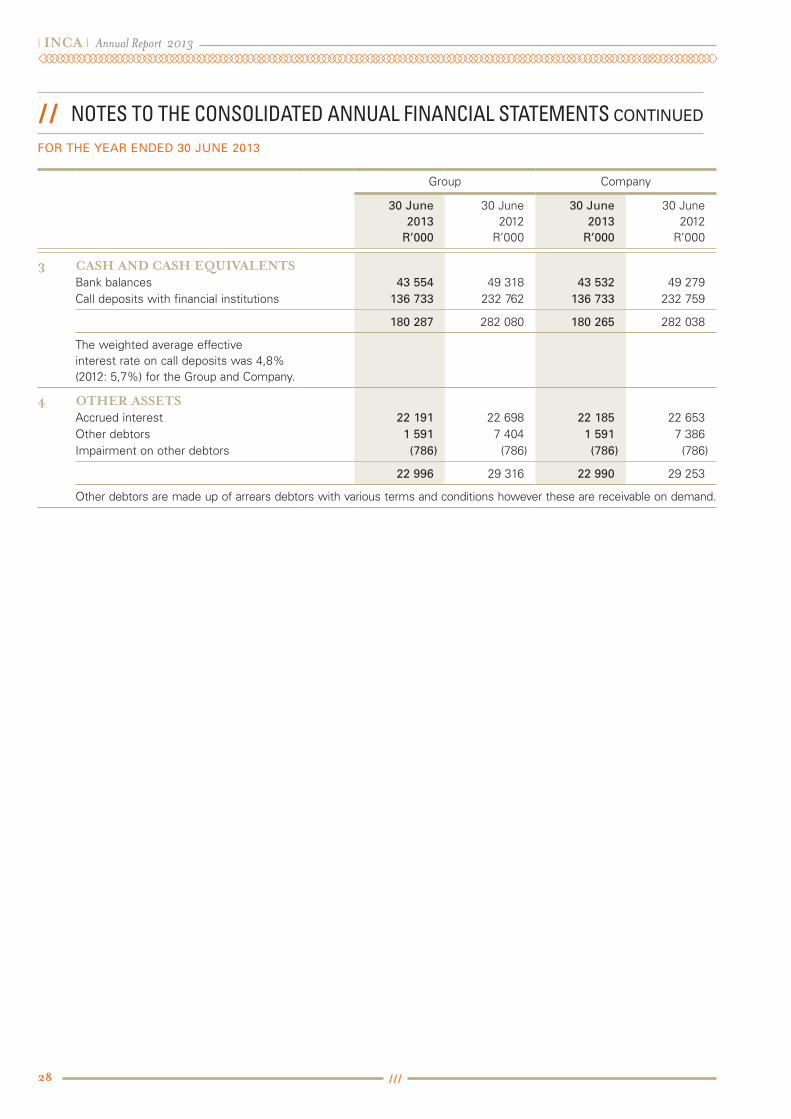
3 CASH AND CASH EQUIvALENTSBank balances 43 554 49 318 43 532 49 279 Call deposits with financial institutions 136 733 232 762 136 733 232 759
180 287 282 080 180 265 282 038
The weighted average effective interest rate on call deposits was 4,8% (2012: 5,7%) for the Group and Company.
4 OTHER ASSETSAccrued interest 22 191 22 698 22 185 22 653 Other debtors 1 591 7 404 1 591 7 386 Impairment on other debtors (786) (786) (786) (786)
22 996 29 316 22 990 29 253
Other debtors are made up of arrears debtors with various terms and conditions however these are receivable on demand.
29
l INCA l Annual Report 2013
Group Company
Notes
30 June2013
R’000
30 June2012
R’000
30 June2013
R’000
30 June2012
R’000
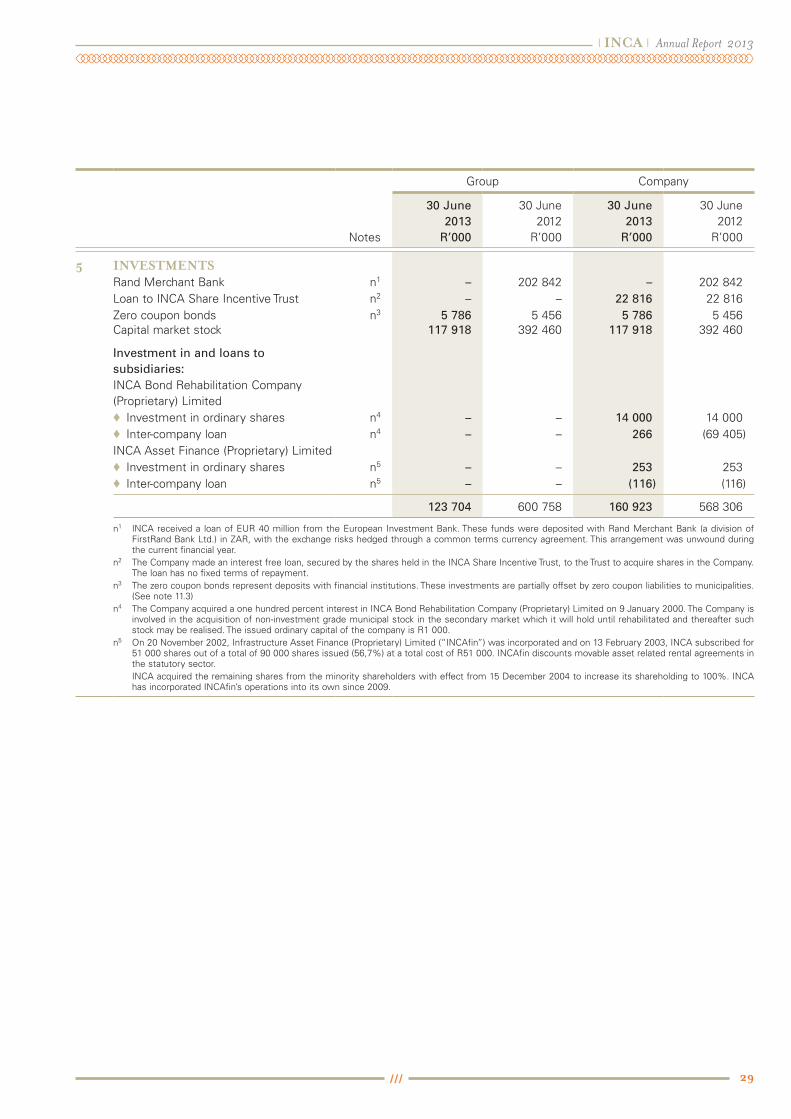
5 INvESTMENTSRand Merchant Bank n1 – 202 842 – 202 842 loan to INCA Share Incentive Trust n2 – – 22 816 22 816 Zero coupon bonds n3 5 786 5 456 5 786 5 456 Capital market stock 117 918 392 460 117 918 392 460
Investment in and loans to subsidiaries:INCA Bond Rehabilitation Company (Proprietary) limited
♦♦ Investment in ordinary shares n4 – – 14 000 14 000 ♦♦ Inter-company loan n4 – – 266 (69 405)
INCA Asset Finance (Proprietary) limited♦♦ Investment in ordinary shares n5 – – 253 253 ♦♦ Inter-company loan n5 – – (116) (116)
123 704 600 758 160 923 568 306
n1 INCA received a loan of EuR 40 million from the European Investment Bank. These funds were deposited with Rand Merchant Bank (a division of FirstRand Bank ltd.) in ZAR, with the exchange risks hedged through a common terms currency agreement. This arrangement was unwound during the current financial year.
n2 The Company made an interest free loan, secured by the shares held in the INCA Share Incentive Trust, to the Trust to acquire shares in the Company. The loan has no fixed terms of repayment.
n3 The zero coupon bonds represent deposits with financial institutions. These investments are partially offset by zero coupon liabilities to municipalities. (See note 11.3)
n4 The Company acquired a one hundred percent interest in INCA Bond Rehabilitation Company (Proprietary) limited on 9 January 2000. The Company is involved in the acquisition of non-investment grade municipal stock in the secondary market which it will hold until rehabilitated and thereafter such stock may be realised. The issued ordinary capital of the company is R1 000.
n5 On 20 November 2002, Infrastructure Asset Finance (Proprietary) limited (“INCAfin”) was incorporated and on 13 February 2003, INCA subscribed for 51 000 shares out of a total of 90 000 shares issued (56,7%) at a total cost of R51 000. INCAfin discounts movable asset related rental agreements in the statutory sector.
INCA acquired the remaining shares from the minority shareholders with effect from 15 december 2004 to increase its shareholding to 100%. INCA has incorporated INCAfin’s operations into its own since 2009.
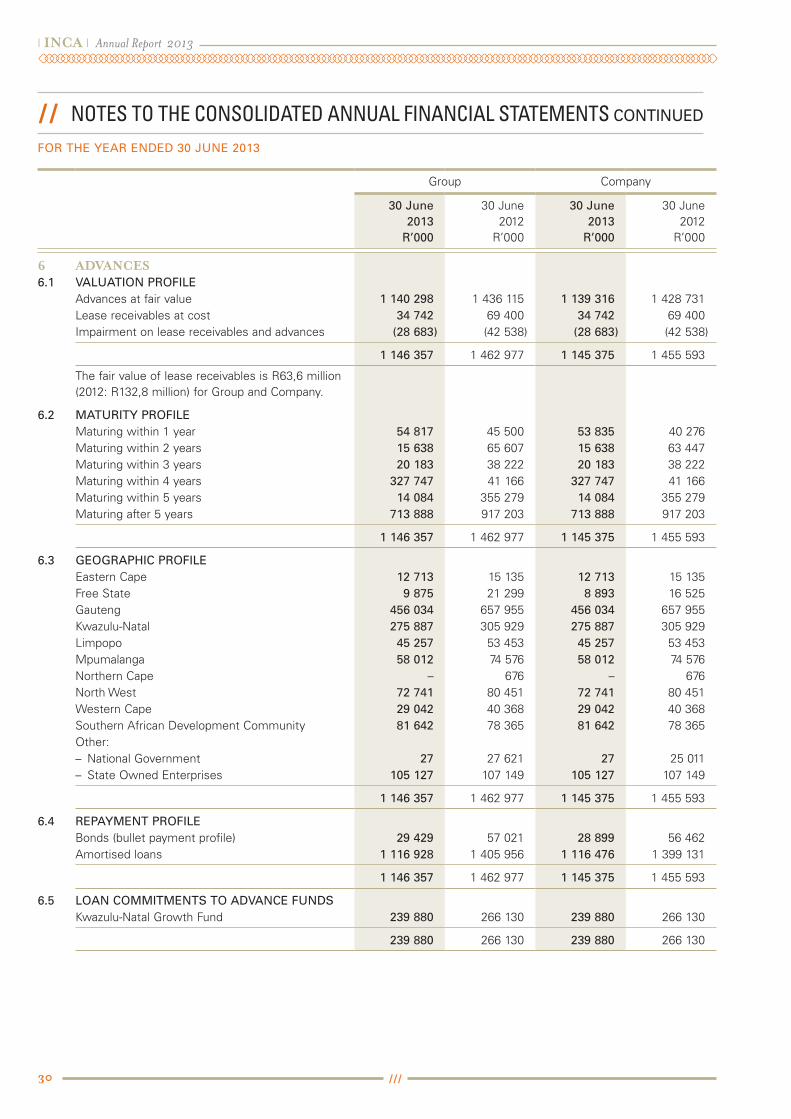
l INCA l Annual Report 2013
30
Group Company
30 June2013
R’000
30 June2012
R’000
30 June2013
R’000
30 June2012
R’000
6 ADvANCES6.1 VALUATION PROFILE
Advances at fair value 1 140 298 1 436 115 1 139 316 1 428 731 lease receivables at cost 34 742 69 400 34 742 69 400 Impairment on lease receivables and advances (28 683) (42 538) (28 683) (42 538)
1 146 357 1 462 977 1 145 375 1 455 593
The fair value of lease receivables is R63,6 million (2012: R132,8 million) for Group and Company.
6.2 MATURITY PROFILEMaturing within 1 year 54 817 45 500 53 835 40 276 Maturing within 2 years 15 638 65 607 15 638 63 447 Maturing within 3 years 20 183 38 222 20 183 38 222 Maturing within 4 years 327 747 41 166 327 747 41 166 Maturing within 5 years 14 084 355 279 14 084 355 279 Maturing after 5 years 713 888 917 203 713 888 917 203
1 146 357 1 462 977 1 145 375 1 455 593
6.3 GEOGRAPhIC PROFILEEastern Cape 12 713 15 135 12 713 15 135 Free State 9 875 21 299 8 893 16 525 Gauteng 456 034 657 955 456 034 657 955 Kwazulu-Natal 275 887 305 929 275 887 305 929 limpopo 45 257 53 453 45 257 53 453 Mpumalanga 58 012 74 576 58 012 74 576 Northern Cape – 676 – 676 North West 72 741 80 451 72 741 80 451 Western Cape 29 042 40 368 29 042 40 368 Southern African development Community 81 642 78 365 81 642 78 365 Other:– National Government 27 27 621 27 25 011 – State Owned Enterprises 105 127 107 149 105 127 107 149
1 146 357 1 462 977 1 145 375 1 455 593
6.4 REPAYMENT PROFILEBonds (bullet payment profile) 29 429 57 021 28 899 56 462 Amortised loans 1 116 928 1 405 956 1 116 476 1 399 131
1 146 357 1 462 977 1 145 375 1 455 593
6.5 LOAN COMMITMENTS TO ADVANCE FUNDSKwazulu-Natal Growth Fund 239 880 266 130 239 880 266 130
239 880 266 130 239 880 266 130
// NOTES TO ThE CONSOliDaTED aNNUal fiNaNCial STaTEMENTS CONTINUED
FOR ThE YEAR ENDED 30 JUNE 2013

31
l INCA l Annual Report 2013
Officialrating
30 June2013
R’000% of
advances
30 June2012
R’000% of
advances
6 ADvANCES (continued)6.6 CONCENTRATION PROFILE
(GROUP)Ten largest exposures (face value)Neotel (Proprietary) limited Not rated 202 947 17,7 206 080 14,1 eThekwini Municipality AA- GCR 2012 167 048 14,6 174 663 12,0 Tshwane Metropolitan Municipality A1 Moody’s 2012 141 409 12,3 155 101 10,6 South African Airways Not rated 84 372 7,4 106 871 7,3 South African development Community Not rated 79 788 7,0 68 711 4,7 Ekurhuleni Metropolitan Council Aa3 Moody’s 2012 60 872 5,3 78 091 5,4 Kwazulu-Natal Growth Fund Not rated 51 824 4,5 n1 – Moses Kotane Municipality Not rated 31 148 2,7 32 414 2,2 umhlathuze Municipality Not rated 30 733 2,7 34 489 2,4 Steve Tshwete Municipality A- GCR 2012 29 607 2,6 33 712 2,3 Nalitemba Provincial Hospital A- GCR 2010 n1 – – 187 857 12,9
Total 879 748 76,8 1 077 989 73,9
Capital secured – – – –
Net exposure 879 748 76,8 1 077 989 73,9
n1 This exposure did not qualify under the ten largest exposures in the relevant year.
Group Company
30 June2013
R’000
30 June2012
R’000
30 June2013
R’000
30 June2012
R’000
6.7 CAPITAL REPAYMENTS SECUREDSecured by cession of a zero coupon bond or set off against a deposit with the Company 25 210 25 210 25 210 25 210Percentage of total book value before impairment 2,1% 1,7% 2,1% 1,7%
The Company ceded advances to the European Investment Bank with a face value of R141,4 million (2012: R155,1 million) and R167 million (2012: R181,7 million) made to the Tshwane Metropolitan Municipality and eThekwini Metropolitan Municipality respectively. (See note 11.2)
6.8 IMPAIRMENT ON LEASE RECEIVABLES AND ADVANCES AND OThER ASSETSBalance beginning of the year 42 538 28 712 42 538 28 712 Impairment(reversal)/charge for the year (2 697) 13 826 (2 697) 13 826 Impairment utilised for the year (11 158) – (11 158) –
Balance end of the year 28 683 42 538 28 683 42 538
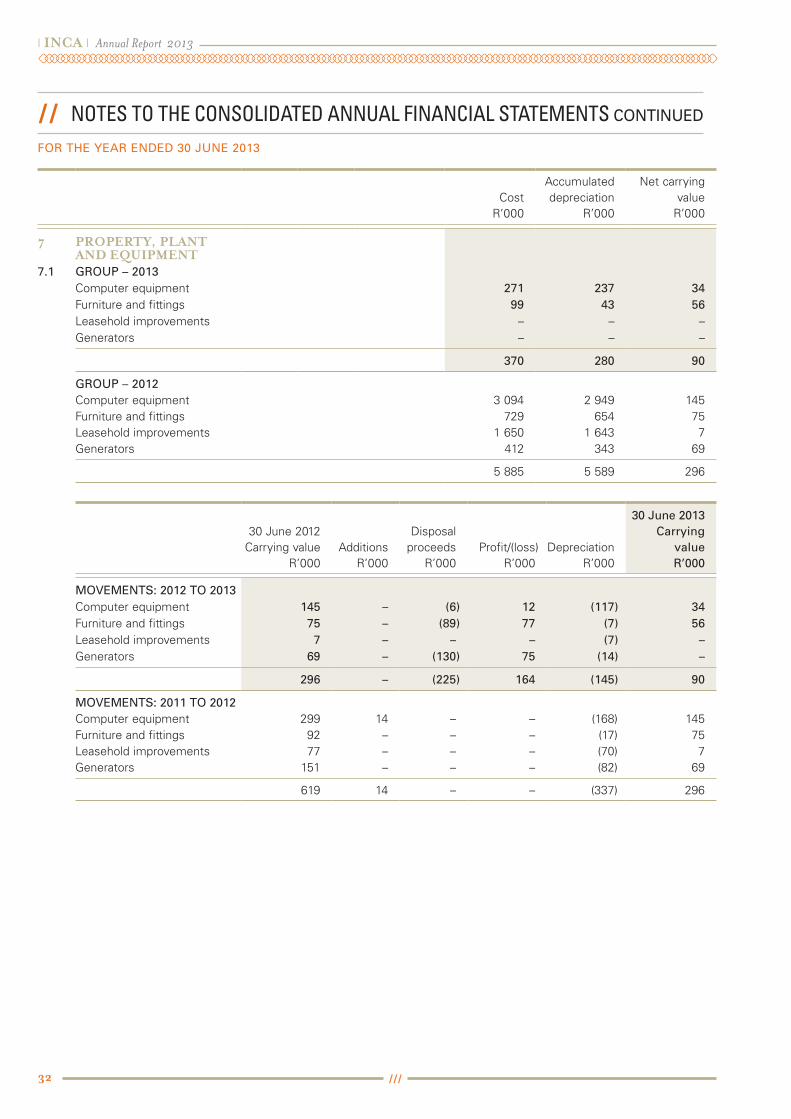
l INCA l Annual Report 2013
32
Cost R’000
Accumulated depreciation
R’000
Net carrying value
R’000
7 PROPERTY, PLANT AND EQUIPMENT
7.1 GROUP – 2013Computer equipment 271 237 34 Furniture and fittings 99 43 56 leasehold improvements – – – Generators – – –
370 280 90
GROUP – 2012Computer equipment 3 094 2 949 145 Furniture and fittings 729 654 75 leasehold improvements 1 650 1 643 7 Generators 412 343 69
5 885 5 589 296
30 June 2012 Carrying value
R’000Additions
R’000
disposalproceeds
R’000 Profit/(loss)
R’000depreciation
R’000
30 June 2013Carrying
valueR’000
MOVEMENTS: 2012 TO 2013Computer equipment 145 – (6) 12 (117) 34 Furniture and fittings 75 – (89) 77 (7) 56 leasehold improvements 7 – – – (7) – Generators 69 – (130) 75 (14) –
296 – (225) 164 (145) 90
MOVEMENTS: 2011 TO 2012Computer equipment 299 14 – – (168) 145 Furniture and fittings 92 – – – (17) 75 leasehold improvements 77 – – – (70) 7 Generators 151 – – – (82) 69
619 14 – – (337) 296
// NOTES TO ThE CONSOliDaTED aNNUal fiNaNCial STaTEMENTS CONTINUED
FOR ThE YEAR ENDED 30 JUNE 2013
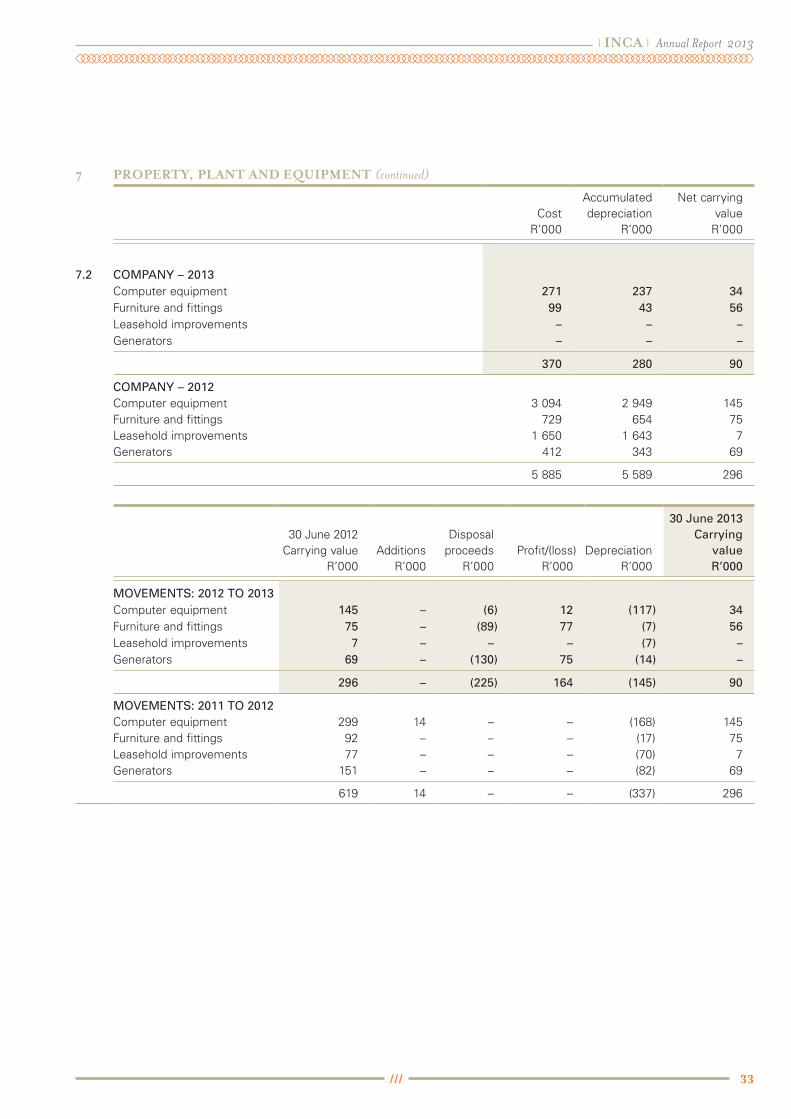
33
l INCA l Annual Report 2013
7 PROPERTY, PLANT AND EQUIPMENT (continued)
Cost R’000
Accumulated depreciation
R’000
Net carrying value
R’000
7.2 COMPANY – 2013Computer equipment 271 237 34 Furniture and fittings 99 43 56 leasehold improvements – – – Generators – – –
370 280 90
COMPANY – 2012Computer equipment 3 094 2 949 145 Furniture and fittings 729 654 75 leasehold improvements 1 650 1 643 7 Generators 412 343 69
5 885 5 589 296
30 June 2012 Carrying value
R’000Additions
R’000
disposalproceeds
R’000 Profit/(loss)
R’000depreciation
R’000
30 June 2013Carrying
valueR’000
MOVEMENTS: 2012 TO 2013Computer equipment 145 – (6) 12 (117) 34 Furniture and fittings 75 – (89) 77 (7) 56 leasehold improvements 7 – – – (7) – Generators 69 – (130) 75 (14) –
296 – (225) 164 (145) 90
MOVEMENTS: 2011 TO 2012Computer equipment 299 14 – – (168) 145 Furniture and fittings 92 – – – (17) 75 leasehold improvements 77 – – – (70) 7 Generators 151 – – – (82) 69
619 14 – – (337) 296
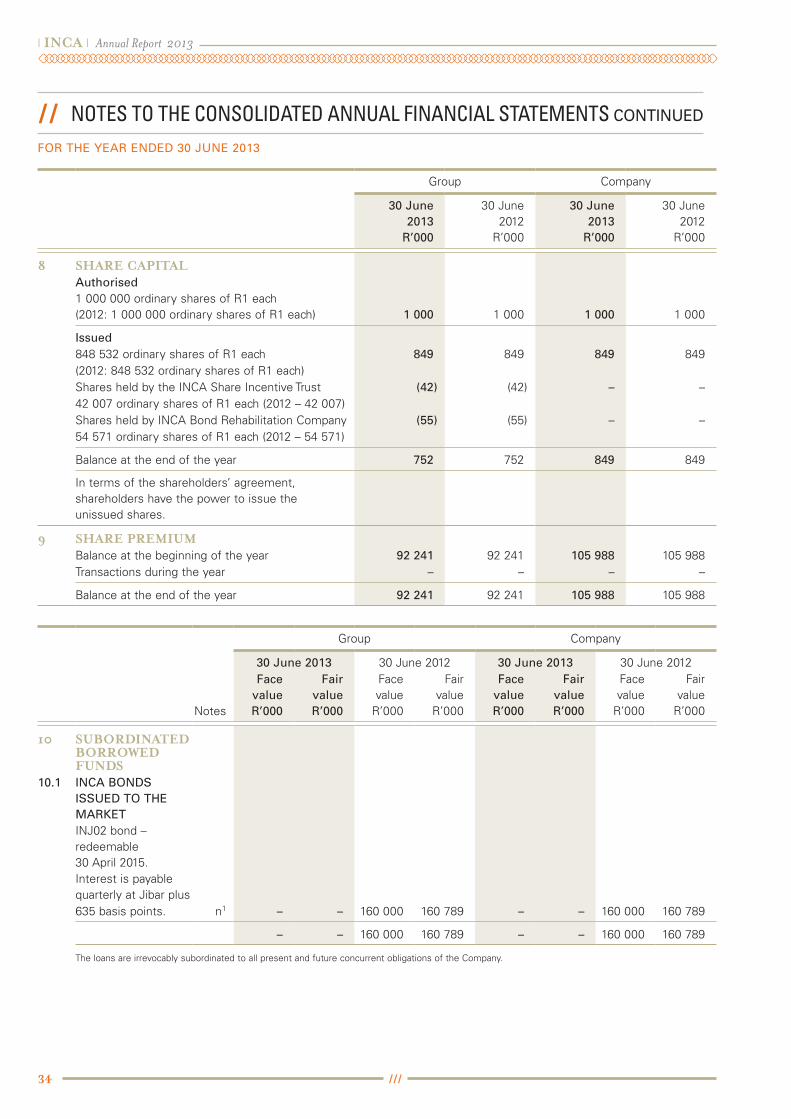
l INCA l Annual Report 2013
34
Group Company
30 June2013
R’000
30 June2012
R’000
30 June2013
R’000
30 June2012
R’000
8 SHARE CAPITALAuthorised1 000 000 ordinary shares of R1 each(2012: 1 000 000 ordinary shares of R1 each) 1 000 1 000 1 000 1 000
Issued848 532 ordinary shares of R1 each 849 849 849 849 (2012: 848 532 ordinary shares of R1 each)Shares held by the INCA Share Incentive Trust (42) (42) – – 42 007 ordinary shares of R1 each (2012 – 42 007)Shares held by INCA Bond Rehabilitation Company (55) (55) – – 54 571 ordinary shares of R1 each (2012 – 54 571)
Balance at the end of the year 752 752 849 849
In terms of the shareholders’ agreement, shareholders have the power to issue the unissued shares.
9 SHARE PREMIUMBalance at the beginning of the year 92 241 92 241 105 988 105 988 Transactions during the year – – – –
Balance at the end of the year 92 241 92 241 105 988 105 988
Group Company
Notes
30 June 2013 30 June 2012 30 June 2013 30 June 2012Face
valueR’000
FairvalueR’000
Facevalue
R’000
Fairvalue
R’000
FacevalueR’000
FairvalueR’000
Facevalue
R’000
Fairvalue
R’000
10 SUBORDINATED BORROwED FUNDS
10.1 INCA BONDS ISSUED TO ThE MARKETINJ02 bond – redeemable 30 April 2015.Interest is payable quarterly at Jibar plus635 basis points. n1 – – 160 000 160 789 – – 160 000 160 789
– – 160 000 160 789 – – 160 000 160 789
The loans are irrevocably subordinated to all present and future concurrent obligations of the Company.
// NOTES TO ThE CONSOliDaTED aNNUal fiNaNCial STaTEMENTS CONTINUED
FOR ThE YEAR ENDED 30 JUNE 2013
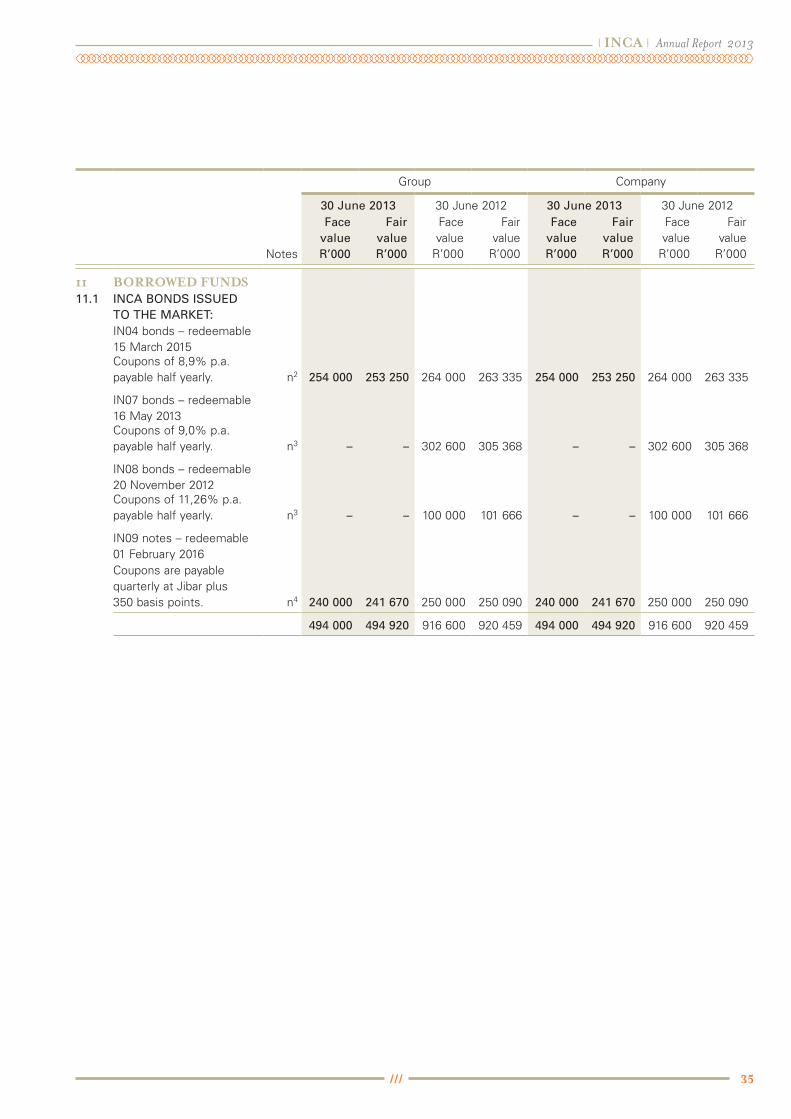
35
l INCA l Annual Report 2013
Group Company
Notes
30 June 2013 30 June 2012 30 June 2013 30 June 2012Face
valueR’000
FairvalueR’000
Facevalue
R’000
Fairvalue
R’000
FacevalueR’000
FairvalueR’000
Facevalue
R’000
Fairvalue
R’000
11 BORROwED FUNDS11.1 INCA BONDS ISSUED
TO ThE MARKET:IN04 bonds – redeemable 15 March 2015Coupons of 8,9% p.a. payable half yearly. n2 254 000 253 250 264 000 263 335 254 000 253 250 264 000 263 335
IN07 bonds – redeemable 16 May 2013Coupons of 9,0% p.a. payable half yearly. n3 – – 302 600 305 368 – – 302 600 305 368
IN08 bonds – redeemable 20 November 2012Coupons of 11,26% p.a. payable half yearly. n3 – – 100 000 101 666 – – 100 000 101 666
IN09 notes – redeemable 01 February 2016Coupons are payable quarterly at Jibar plus350 basis points. n4 240 000 241 670 250 000 250 090 240 000 241 670 250 000 250 090
494 000 494 920 916 600 920 459 494 000 494 920 916 600 920 459

l INCA l Annual Report 2013
36
Group Company
Notes
30 June 2013 30 June 2012 30 June 2013 30 June 2012Face
valueR’000
FairvalueR’000
Facevalue
R’000
Fairvalue
R’000
FacevalueR’000
FairvalueR’000
Facevalue
R’000
Fairvalue
R’000
11 BORROwED FUNDS(continued)
11.2 LONG-TERM FOREIGN LOANS �European Investment
Bank Euro 40 million interest at Eibor payable semi-annually, the capital is repayable in semi- annual instalments commencing on 15 September 2009 and ending on 15 September 2017. n5 – – 211 127 211 603 – – 211 127 211 603
�European Investment Bank R238 230 000 interest at Jibar payable semi-annually, the capital is repayable in equal semi-annual instalments commencing on 15 September 2009 and ending on 15 March 2019. n6 142 938 142 938 166 761 161 820 142 938 142 938 166 761 161 820
�European Investment Bank R225 000 000 interest at Jibar payable semi-annually, the capital is repayable in semi annual instalments commencing on 15 September 2005 and ending on 15 March 2020. n7 141 409 141 409 155 101 149 392 141 409 141 409 155 101 149 392
�European Investment Bank R238 419 000 interest at Jibar payable semi-annually, the capital is repayable in semi annual instalments commencing on 15 december 2005 and ending on 15 June 2020. n8 151 694 151 694 166 381 159 968 151 694 151 694 166 381 159 968
436 041 436 041 699 370 682 783 436 041 436 041 699 370 682 783
// NOTES TO ThE CONSOliDaTED aNNUal fiNaNCial STaTEMENTS CONTINUED
FOR ThE YEAR ENDED 30 JUNE 2013
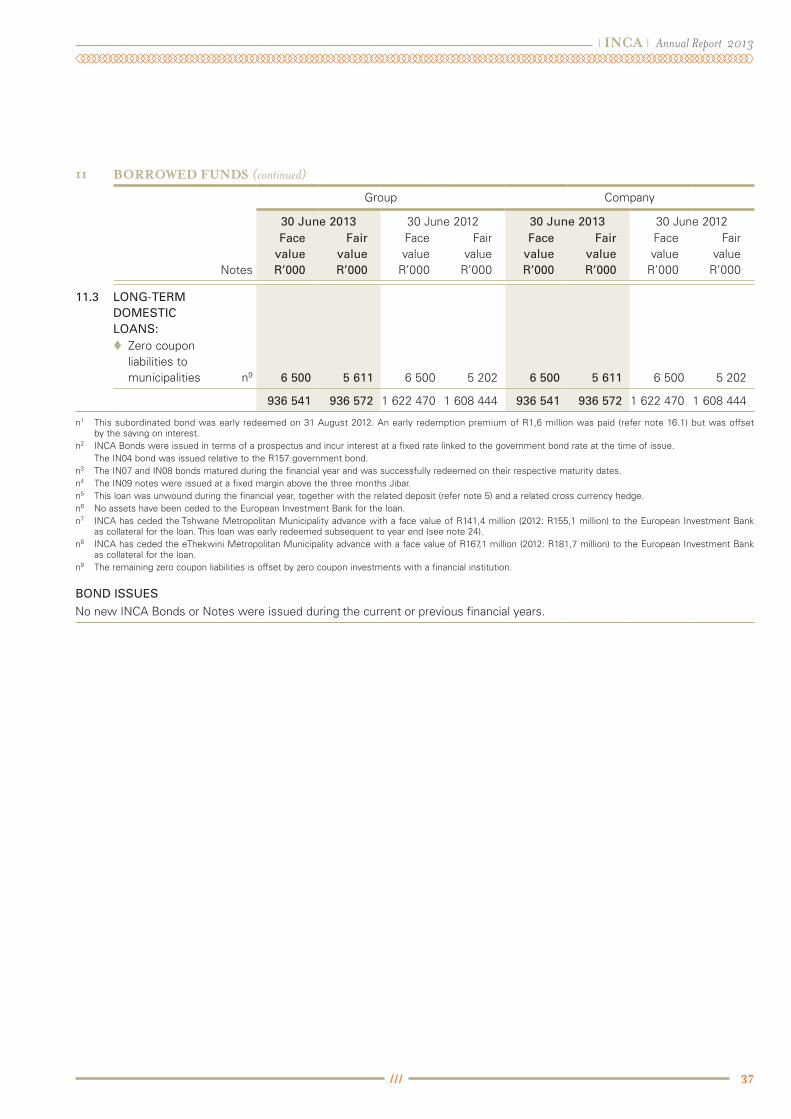
37
l INCA l Annual Report 2013
11 BORROwED FUNDS (continued)
Group Company
Notes
30 June 2013 30 June 2012 30 June 2013 30 June 2012Face
valueR’000
FairvalueR’000
Facevalue
R’000
Fairvalue
R’000
FacevalueR’000
FairvalueR’000
Facevalue
R’000
Fairvalue
R’000
11.3 LONG-TERM DOMESTIC LOANS:�Zero coupon
liabilities to municipalities n9 6 500 5 611 6 500 5 202 6 500 5 611 6 500 5 202
936 541 936 572 1 622 470 1 608 444 936 541 936 572 1 622 470 1 608 444
n1 This subordinated bond was early redeemed on 31 August 2012. An early redemption premium of R1,6 million was paid (refer note 16.1) but was offset by the saving on interest.
n2 INCA Bonds were issued in terms of a prospectus and incur interest at a fixed rate linked to the government bond rate at the time of issue. The IN04 bond was issued relative to the R157 government bond.n3 The IN07 and IN08 bonds matured during the financial year and was successfully redeemed on their respective maturity dates.n4 The IN09 notes were issued at a fixed margin above the three months Jibar.n5 This loan was unwound during the financial year, together with the related deposit (refer note 5) and a related cross currency hedge.n6 No assets have been ceded to the European Investment Bank for the loan.n7 INCA has ceded the Tshwane Metropolitan Municipality advance with a face value of R141,4 million (2012: R155,1 million) to the European Investment Bank
as collateral for the loan. This loan was early redeemed subsequent to year end (see note 24).n8 INCA has ceded the eThekwini Metropolitan Municipality advance with a face value of R167,1 million (2012: R181,7 million) to the European Investment Bank
as collateral for the loan.n9 The remaining zero coupon liabilities is offset by zero coupon investments with a financial institution.
BOND ISSUES
No new INCA Bonds or Notes were issued during the current or previous financial years.
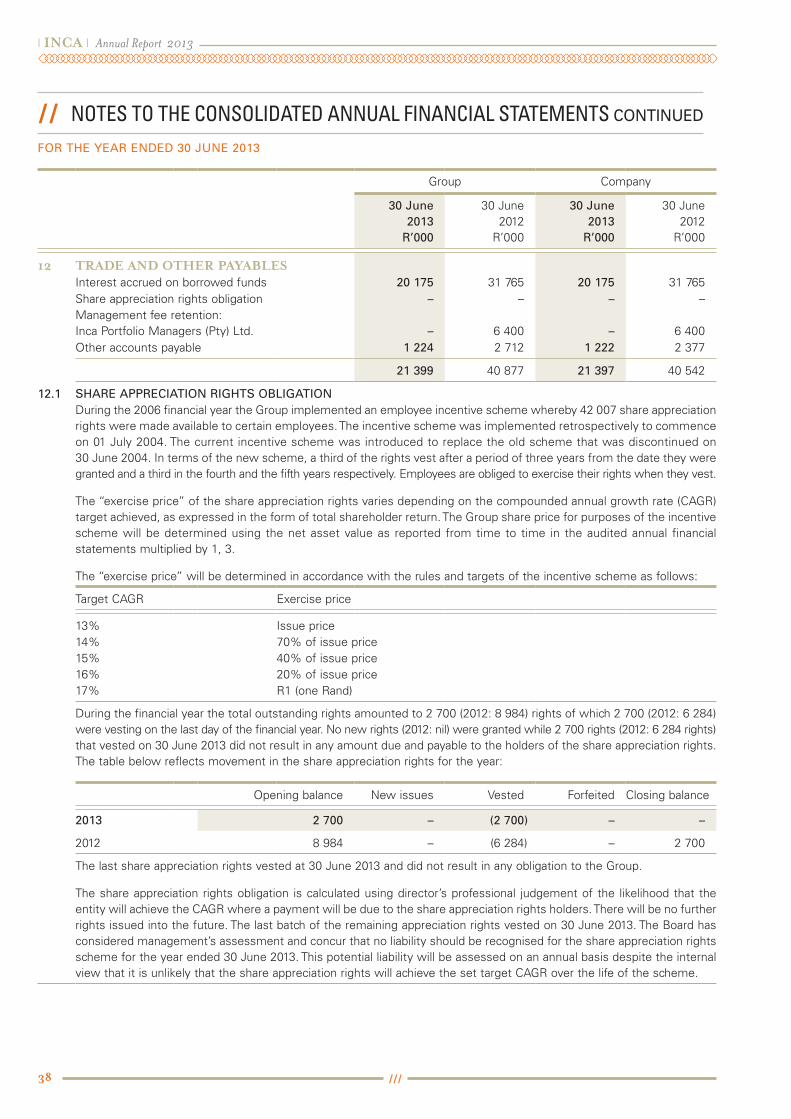
l INCA l Annual Report 2013
38
Group Company
30 June2013
R’000
30 June2012
R’000
30 June2013
R’000
30 June2012
R’000
12 TRADE AND OTHER PAYABLESInterest accrued on borrowed funds 20 175 31 765 20 175 31 765 Share appreciation rights obligation – – – – Management fee retention: Inca Portfolio Managers (Pty) ltd. – 6 400 – 6 400 Other accounts payable 1 224 2 712 1 222 2 377
21 399 40 877 21 397 40 542
12.1 ShARE APPRECIATION RIGhTS OBLIGATIONduring the 2006 financial year the Group implemented an employee incentive scheme whereby 42 007 share appreciation rights were made available to certain employees. The incentive scheme was implemented retrospectively to commence on 01 July 2004. The current incentive scheme was introduced to replace the old scheme that was discontinued on 30 June 2004. In terms of the new scheme, a third of the rights vest after a period of three years from the date they were granted and a third in the fourth and the fifth years respectively. Employees are obliged to exercise their rights when they vest.
The “exercise price” of the share appreciation rights varies depending on the compounded annual growth rate (CAGR) target achieved, as expressed in the form of total shareholder return. The Group share price for purposes of the incentive scheme will be determined using the net asset value as reported from time to time in the audited annual financial statements multiplied by 1, 3.
The “exercise price” will be determined in accordance with the rules and targets of the incentive scheme as follows:
Target CAGR Exercise price
13% Issue price14% 70% of issue price15% 40% of issue price16% 20% of issue price17% R1 (one Rand)
during the financial year the total outstanding rights amounted to 2 700 (2012: 8 984) rights of which 2 700 (2012: 6 284) were vesting on the last day of the financial year. No new rights (2012: nil) were granted while 2 700 rights (2012: 6 284 rights) that vested on 30 June 2013 did not result in any amount due and payable to the holders of the share appreciation rights. The table below reflects movement in the share appreciation rights for the year:
Opening balance New issues vested Forfeited Closing balance
2013 2 700 – (2 700) – –
2012 8 984 – (6 284) – 2 700
The last share appreciation rights vested at 30 June 2013 and did not result in any obligation to the Group.
The share appreciation rights obligation is calculated using director’s professional judgement of the likelihood that the entity will achieve the CAGR where a payment will be due to the share appreciation rights holders. There will be no further rights issued into the future. The last batch of the remaining appreciation rights vested on 30 June 2013. The Board has considered management’s assessment and concur that no liability should be recognised for the share appreciation rights scheme for the year ended 30 June 2013. This potential liability will be assessed on an annual basis despite the internal view that it is unlikely that the share appreciation rights will achieve the set target CAGR over the life of the scheme.
// NOTES TO ThE CONSOliDaTED aNNUal fiNaNCial STaTEMENTS CONTINUED
FOR ThE YEAR ENDED 30 JUNE 2013
39
l INCA l Annual Report 2013
Notional 30 June
2013R’000
Notional 30 June
2012R’000
Group Company
Fair value 30 June
2013R’000
Fair value 30 June
2012R’000
Fair value 30 June
2013R’000
Fair value 30 June
2012R’000
13 DERIvATIvE FINANCIAL INSTRUMENTSDerivative assetsCurrency swaps – 200 663 – 12 685 – 12 685
– 200 663 – 12 685 – 12 685
Derivative liabilitiesCurrency swaps 54 354 57 012 41 709 29 280 41 709 29 280 Interest rate swaps 368 166 705 642 27 167 110 691 27 167 110 691 Foreign exchange contracts – 533 – 159 – 159
422 520 763 187 68 876 140 130 68 876 140 130
The notional principal gives an indication on the Group’s and Company’s activity in the derivative market and represents the aggregate size of total outstanding contracts at period end. This figure cannot be used in assessing the market risk associated with positions.
Group Company
30 June2013
R’000
30 June2012
R’000
30 June2013
R’000
30 June2012
R’000
14 INTEREST AND SIMILAR INCOMEAdvances 115 354 154 026 117 683 153 487 Investments 37 431 51 691 34 944 48 461 Cash and short-term funds 12 977 13 287 12 975 13 286 Preference share dividends – 2 316 – 2 316 Repurchase agreements – 49 – 49 derivative financial instruments 40 146 58 720 40 146 58 720
205 908 280 089 205 748 276 319
Attributable to:Financial assets held for trading 72 309 96 193 72 308 96 193 Financial assets designated as FvTPl 119 257 165 215 119 100 161 447 loans and receivables (including cash and bank balances) 14 342 18 681 14 340 18 679
205 908 280 089 205 748 276 319

l INCA l Annual Report 2013
40
Group Company
Notes
30 June2013
R’000
30 June2012
R’000
30 June2013
R’000
30 June2012
R’000
15 INTEREST EXPENSE AND SIMILAR CHARGESINCA bonds 73 644 92 255 73 644 92 255 long-term loans 26 498 35 923 26 498 35 923 Subordinated liabilities 3 124 21 590 3 124 21 590 Repurchase agreements – 1 245 – 1 245 derivative financial instruments 71 705 95 985 71 705 95 985
174 971 246 998 174 971 246 998
Attributable to:loans and receivables (including cash and bank balances) – – – – Financial liabilities held for trading 71 706 97 230 71 706 97 230 Financial liabilities designated as FvTPl 103 265 149 768 103 265 149 768
174 971 246 998 174 971 246 998
16 FAIR vALUE ADjUSTMENT16.1 FAIR VALUE ADJUSTMENT
– REALISEDAdvances n1 (11 265) 611 (11 366) 218 Investments n2 58 904 2 349 58 904 2 349 long-term loans (46) – (46) – Subordinated liabilities n3 (1 600) – (1 600) – derivative financial instruments n4 (73 939) 4 749 (73 939) 4 749
(27 946) 7 709 (28 047) 7 316
Attributable to:Financial assets held for trading (23 158) 7 071 (23 158) 7 071 Financial assets designated as FvTPl (11 265) 611 (11 366) 218 Financial liabilities designated as FvTPl 6 477 27 6 477 27
(27 946) 7 709 (28 047) 7 316
// NOTES TO ThE CONSOliDaTED aNNUal fiNaNCial STaTEMENTS CONTINUED
FOR ThE YEAR ENDED 30 JUNE 2013
41
l INCA l Annual Report 2013
16 FAIR vALUE ADjUSTMENT (continued)
Group Company
Notes
30 June2013
R’000
30 June2012
R’000
30 June2013
R’000
30 June2012
R’000
16.2 FAIR VALUE ADJUSTMENT – UNREALISEDAdvances n5 2 212 10 064 2 283 10 159 Investments n2 (36 168) 20 882 (36 211) 20 914 INCA bonds* n6 4 424 (24 574) 4 424 (24 574)long-term loans* n7 (17 527) (2 254) (17 527) (2 254)Subordinated liabilities* n3 789 1 749 789 1 749 derivative financial instruments n4 75 994 (47 019) 75 994 (47 019)
29 724 (41 152) 29 752 (41 025)
Attributable to:Financial assets held for trading 42 044 (26 661) 42 044 (26 661)Financial assets designated as FvTPl (5) 10 588 67 10 683 loans and receivables (including cash and bank balances) – – (44) 32 Financial liabilities designated as FvTPl (12 315) (25 079) (12 315) (25 079)
29 724 (41 152) 29 752 (41 025)
* Fair value on liabilitiesThe total fair value adjustments resulting from liabilities amounted to R12,3 million loss (2012: R25,1 million loss). The unrealised fair value adjustments are attributable mainly to a change in the valuation method of long-term loans, where the market value is now deemed to be equal to the face value adjusted for accrued interest, due to trading restrictions.
n1 Realised fair value adjustments on advances include the effects of the early settlement of certain advances. These amounts include breakage costs to compensate for the early settlement as well as the credit spread and base rate movement observed on these advances.
n2 The realised fair value adjustments on investments relate primarily to capital market stock that was liquidated during the year in preparation for the redemption of the IN07 end IN08 bonds. The previously recognised unrealised profit reversed, resulting in a net profit of R22,7 million mainly caused by the decrease in base rates.
n3 The subordinated liability was early redeemed during the financial year resulting in an early redemption premium.n4 The realised loss on derivative financial instruments stems from the unwinding of interest rate swaps to manage the interest rate risk position. This loss
was previously recognised as unrealised, resulting in a net profit of R2 million. The remaining derivative financial instruments are used to hedge general market movements (movements in the credit spreads of assets and liabilities are not hedged). The fair value adjustments largely reflect the changes in exchange rates, interest rates and the passing of time.
n5 The base interest rates decreased significantly during the year under review and the credit spreads on similar assets largely stayed the same, which lead to a positive fair value adjustment.
n6 The unrealised fair value profit on the INCA bonds is mainly caused by a reversal of previously recognised valuation loss on the IN07 and IN08 bonds of R7,1 million on maturity. This is offset by a valuation loss on bonds in issue of R2,7 million attributable mainly to the decrease in base rates, but also by the “pull-to-par” effect (i.e. passing of time).
n7 long-term loans are valued at the deemed market value. Previously this was the level at which the general market would obtain funding but subsequently the funder indicated that all loans will have to be redeemed at face value on a normal repayment date and that no cessions would be allowed. The loans are now valued accordingly.
l INCA l Annual Report 2013
42
Group Company
30 June2013
R’000
30 June2012
R’000
30 June2013
R’000
30 June2012
R’000
17 FEE AND OTHER INCOMEFair value through profit and lossFacility and commitment fees 1 439 2 585 1 439 2 585
Non-financial incomeAdministrative fees 8 – 124 116 dividends received (Group Companies) – – 76 418 495 Profit on disposal of property, plant and equipment 164 – 164 – Other income 915 810 915 810
2 526 3 395 79 060 4 006
18 OPERATING EXPENDITUREOperating expenditure includes the following items:
18.1 AUDITORS’ REMUNERATIONAudit fees 963 950 873 905 Prior year over accrual (12) – (12) – Other services 49 – 49 –
1 000 950 910 905
18.2 DEPRECIATIONComputer equipment 117 168 117 168 Furniture and fittings 7 17 7 17 leasehold improvements 7 70 7 70 Generators 14 82 14 82
145 337 145 337
18.3 LEASE ExPENSESOffice premises 973 1 903 973 1 903 Computer software 254 727 254 727
1 227 2 630 1 227 2 630
18.4 PROFESSIONAL FEESManagement fee 15 414 20 305 15 414 20 305 Technical and other services 1 006 2 031 1 006 2 031
16 420 22 336 16 420 22 336
// NOTES TO ThE CONSOliDaTED aNNUal fiNaNCial STaTEMENTS CONTINUED
FOR ThE YEAR ENDED 30 JUNE 2013
43
l INCA l Annual Report 2013
18 OPERATING EXPENDITURE (continued)
Group Company
Notes
30 June2013
R’000
30 June2012
R’000
30 June2013
R’000
30 June2012
R’000
18.5 DIRECTORS’ EMOLUMENTSNon-executive directors’ fees 351 438 351 438
d Botha 60 67 60 67 A Canter 46 48 46 48 C Clarke 65 48 65 48 M danisi 14 13 14 13 R de Korte 13 37 13 37 S dube 14 14 J Howard 27 37 27 37 G McKenzie 20 37 20 37 l Scholtz 20 19 20 19 R Kalaichelvan n1 – 6 – 6 P Truyens 72 89 72 89 H van Wyk n1 – 37 – 37
Non-executive directors – other feesP Truyens 360 360 360 360
711 798 711 798
n1 These directors resigned during financial year, and remuneration only reflects the period that they served as directors.
18.6 OThEROther sundry expenditure 1 532 938 1 561 919
Total expenditure 21 035 27 989 20 974 27 925
19 TAXATION19.1 TAxATION ChARGE FOR ThE YEAR
South African current taxationNormal Current year 759 1 182 – – Prior year (11) 22 085 – 22 085
748 23 267 – 22 085 deferred Current year 3 973 (28 958) 4 717 (28 922) Prior year (175) – – –
Total taxation 4 546 (5 691) 4 717 (6 837)
19.2 TAx RATE RECONCILIATION % % % % Effective tax rate 26,9 (3,0) 5,1 – Adjusted for:Tax loss carried forward – 15,8 – 14,6 disallowed expenditure – 17,5 – 16,0 Prior year 1,1 – – – Non-taxable income – (2,3) 22,9 (2,6)
Standard tax rate 28,0 28,0 28,0 28,0
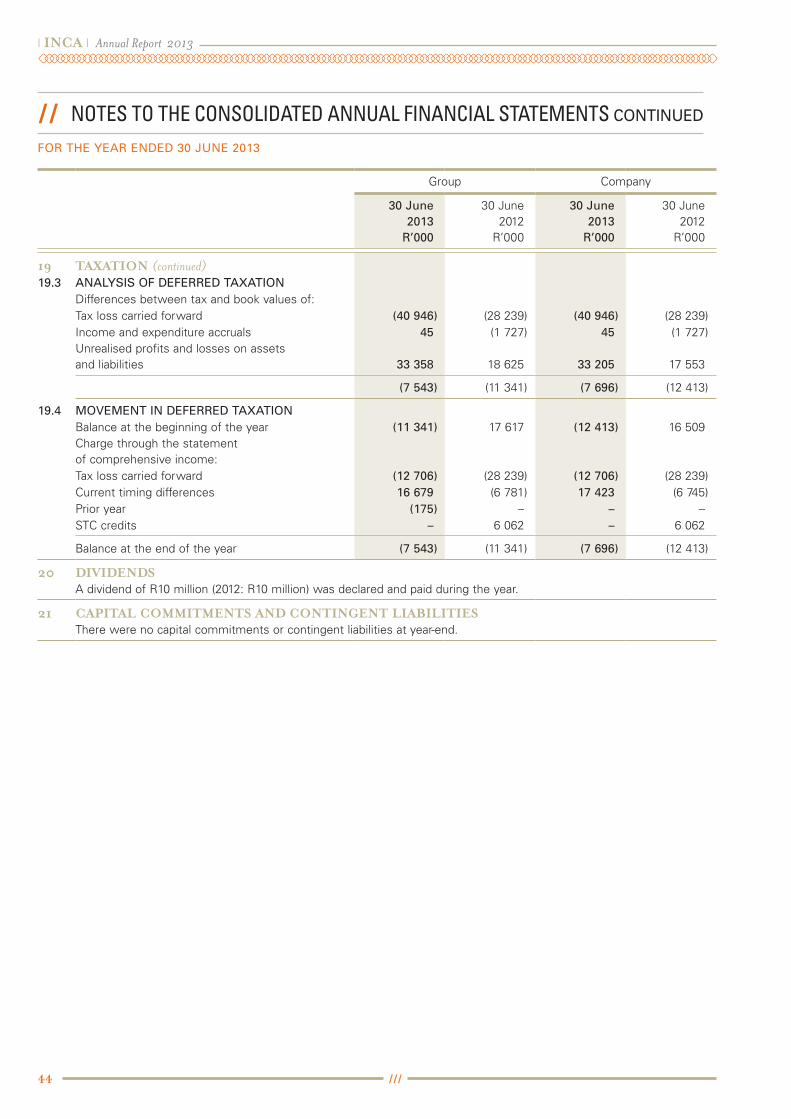
l INCA l Annual Report 2013
44
// NOTES TO ThE CONSOliDaTED aNNUal fiNaNCial STaTEMENTS CONTINUED
FOR ThE YEAR ENDED 30 JUNE 2013
Group Company
30 June2013
R’000
30 June2012
R’000
30 June2013
R’000
30 June2012
R’000
19 TAXATION (continued)19.3 ANALYSIS OF DEFERRED TAxATION
differences between tax and book values of:Tax loss carried forward (40 946) (28 239) (40 946) (28 239)Income and expenditure accruals 45 (1 727) 45 (1 727)unrealised profits and losses on assets and liabilities 33 358 18 625 33 205 17 553
(7 543) (11 341) (7 696) (12 413)
19.4 MOVEMENT IN DEFERRED TAxATIONBalance at the beginning of the year (11 341) 17 617 (12 413) 16 509 Charge through the statement of comprehensive income:Tax loss carried forward (12 706) (28 239) (12 706) (28 239)Current timing differences 16 679 (6 781) 17 423 (6 745)Prior year (175) – – –STC credits – 6 062 – 6 062
Balance at the end of the year (7 543) (11 341) (7 696) (12 413)
20 DIvIDENDSA dividend of R10 million (2012: R10 million) was declared and paid during the year.
21 CAPITAL COMMITMENTS AND CONTINGENT LIABILITIESThere were no capital commitments or contingent liabilities at year-end.

45
l INCA l Annual Report 2013
Group Company
30 June2013
R’000
30 June2012
R’000
30 June2013
R’000
30 June2012
R’000
22 RELATED PARTY TRANSACTIONSDeposit with shareholdersRand Merchant Bank a division of FirstRand Bank limited – 202 844 – 202 844
– 202 844 – 202 844
Transactions with shareholdersRand Merchant Bank a division of FirstRand Bank limiteddisposal of advances – – – –
– – – –
Transactions with Group CompaniesINCA Bond Rehabilitation Company (Pty) ltdInterest expense – – 2 486 3 230 dividend income – – 75 923 – Management fee income – – 116 116
– – 78 525 3 346
Management by a third partyINCA Portfolio Managers (Proprietary) limited (“IPM”) is an independent company established by former executive management of Infrastructure Finance Corporation limited (“INCA”) with the intent to offer portfolio management services to the market including INCA. The agreement to provide portfolio management services to INCA came into effect on 1 July 2010 and the executive directors of INCA resigned on 30 April 2012 when all the suspensive conditions in the agreement were met.
Other intercompany balances are reflected under Investments (note 5) and Trade and Other payables (note 12).
Key management personnelRemuneration paid to directors is disclosed in note 18.5. No further remuneration was paid to former executive management for the financial year under review (2012: Rnil). There were no payments in respect share appreciation rights, no new share appreciation rights (2012: nil) were granted, during or subsequent to year-end and no rights (2012: nil) were forfeited. The details of the share appreciation rights are disclosed in note 12.1.
ContractsFirstRand Bank limited also acts as bankers to the Group. All of these related party transactions were concluded on an arm’s length basis. At no stage during the financial year were any contracts concluded by the Group in which a director had an interest except as disclosed above.
The Group identifies related party transactions at the conclusion of each transaction. Significant related party transactions are reviewed by the Board or its subcommittees prior to conclusion.
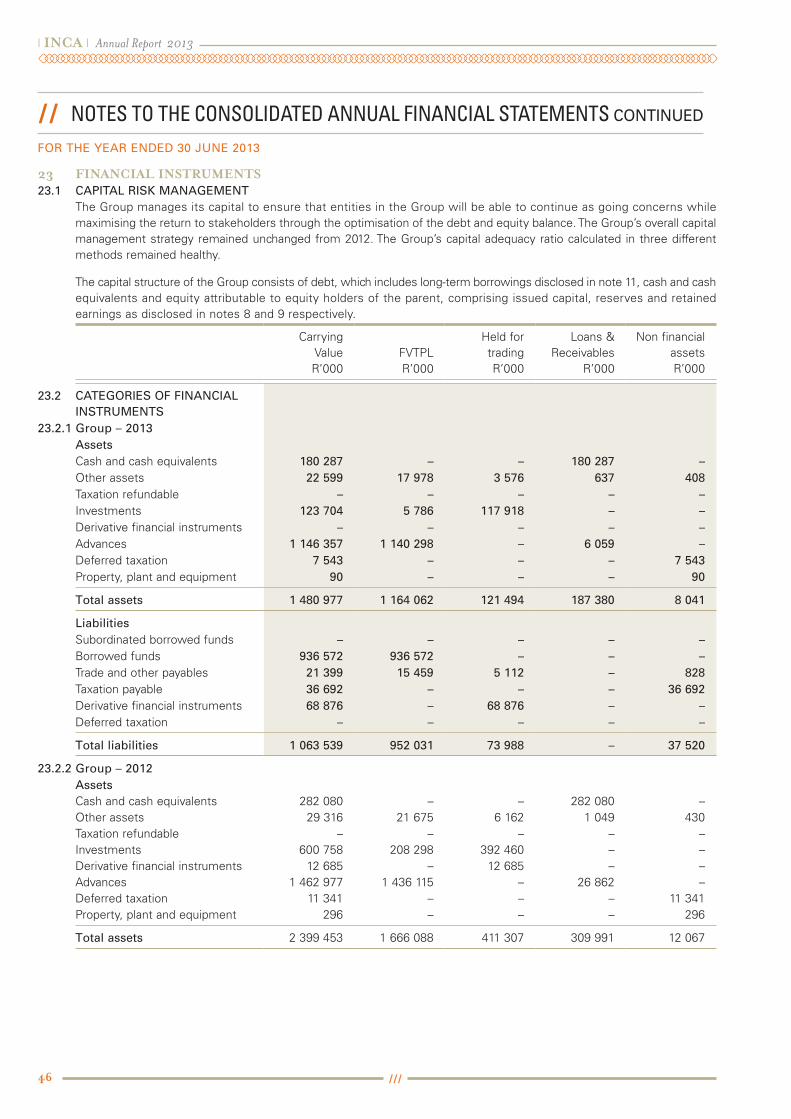
l INCA l Annual Report 2013
46
// NOTES TO ThE CONSOliDaTED aNNUal fiNaNCial STaTEMENTS CONTINUED
FOR ThE YEAR ENDED 30 JUNE 2013
23 FINANCIAL INSTRUMENTS23.1 CAPITAL RISK MANAGEMENT
The Group manages its capital to ensure that entities in the Group will be able to continue as going concerns while maximising the return to stakeholders through the optimisation of the debt and equity balance. The Group’s overall capital management strategy remained unchanged from 2012. The Group’s capital adequacy ratio calculated in three different methods remained healthy.
The capital structure of the Group consists of debt, which includes long-term borrowings disclosed in note 11, cash and cash equivalents and equity attributable to equity holders of the parent, comprising issued capital, reserves and retained earnings as disclosed in notes 8 and 9 respectively.
CarryingvalueR’000
FvTPlR’000
Held fortradingR’000
loans &Receivables
R’000
Non financialassetsR’000
23.2 CATEGORIES OF FINANCIAL INSTRUMENTS
23.2.1 Group – 2013AssetsCash and cash equivalents 180 287 – – 180 287 – Other assets 22 599 17 978 3 576 637 408 Taxation refundable – – – – – Investments 123 704 5 786 117 918 – – derivative financial instruments – – – – – Advances 1 146 357 1 140 298 – 6 059 – deferred taxation 7 543 – – – 7 543 Property, plant and equipment 90 – – – 90
Total assets 1 480 977 1 164 062 121 494 187 380 8 041
LiabilitiesSubordinated borrowed funds – – – – – Borrowed funds 936 572 936 572 – – – Trade and other payables 21 399 15 459 5 112 – 828 Taxation payable 36 692 – – – 36 692 derivative financial instruments 68 876 – 68 876 – – deferred taxation – – – – –
Total liabilities 1 063 539 952 031 73 988 – 37 520
23.2.2 Group – 2012AssetsCash and cash equivalents 282 080 – – 282 080 – Other assets 29 316 21 675 6 162 1 049 430 Taxation refundable – – – – – Investments 600 758 208 298 392 460 – – derivative financial instruments 12 685 – 12 685 – – Advances 1 462 977 1 436 115 – 26 862 – deferred taxation 11 341 – – – 11 341 Property, plant and equipment 296 – – – 296
Total assets 2 399 453 1 666 088 411 307 309 991 12 067
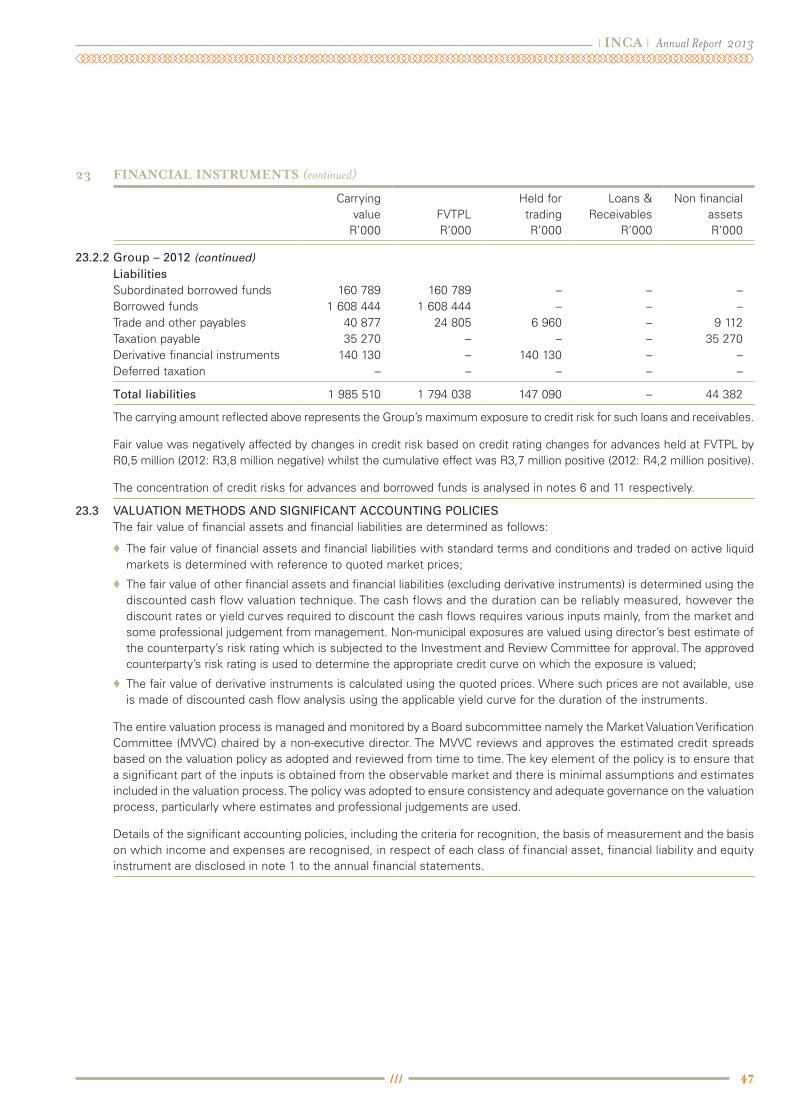
47
l INCA l Annual Report 2013
23 FINANCIAL INSTRUMENTS (continued)
Carryingvalue
R’000FvTPlR’000
Held fortradingR’000
loans &Receivables
R’000
Non financialassetsR’000
23.2.2 Group – 2012 (continued)LiabilitiesSubordinated borrowed funds 160 789 160 789 – – – Borrowed funds 1 608 444 1 608 444 – – – Trade and other payables 40 877 24 805 6 960 – 9 112 Taxation payable 35 270 – – – 35 270 derivative financial instruments 140 130 – 140 130 – – deferred taxation – – – – –
Total liabilities 1 985 510 1 794 038 147 090 – 44 382
The carrying amount reflected above represents the Group’s maximum exposure to credit risk for such loans and receivables.
Fair value was negatively affected by changes in credit risk based on credit rating changes for advances held at FvTPl by R0,5 million (2012: R3,8 million negative) whilst the cumulative effect was R3,7 million positive (2012: R4,2 million positive).
The concentration of credit risks for advances and borrowed funds is analysed in notes 6 and 11 respectively.
23.3 VALUATION METhODS AND SIGNIFICANT ACCOUNTING POLICIESThe fair value of financial assets and financial liabilities are determined as follows:
♦♦ The fair value of financial assets and financial liabilities with standard terms and conditions and traded on active liquid markets is determined with reference to quoted market prices;
♦♦ The fair value of other financial assets and financial liabilities (excluding derivative instruments) is determined using the discounted cash flow valuation technique. The cash flows and the duration can be reliably measured, however the discount rates or yield curves required to discount the cash flows requires various inputs mainly, from the market and some professional judgement from management. Non-municipal exposures are valued using director’s best estimate of the counterparty’s risk rating which is subjected to the Investment and Review Committee for approval. The approved counterparty’s risk rating is used to determine the appropriate credit curve on which the exposure is valued;
♦♦ The fair value of derivative instruments is calculated using the quoted prices. Where such prices are not available, use is made of discounted cash flow analysis using the applicable yield curve for the duration of the instruments.
The entire valuation process is managed and monitored by a Board subcommittee namely the Market valuation verification Committee (MvvC) chaired by a non-executive director. The MvvC reviews and approves the estimated credit spreads based on the valuation policy as adopted and reviewed from time to time. The key element of the policy is to ensure that a significant part of the inputs is obtained from the observable market and there is minimal assumptions and estimates included in the valuation process. The policy was adopted to ensure consistency and adequate governance on the valuation process, particularly where estimates and professional judgements are used.
details of the significant accounting policies, including the criteria for recognition, the basis of measurement and the basis on which income and expenses are recognised, in respect of each class of financial asset, financial liability and equity instrument are disclosed in note 1 to the annual financial statements.
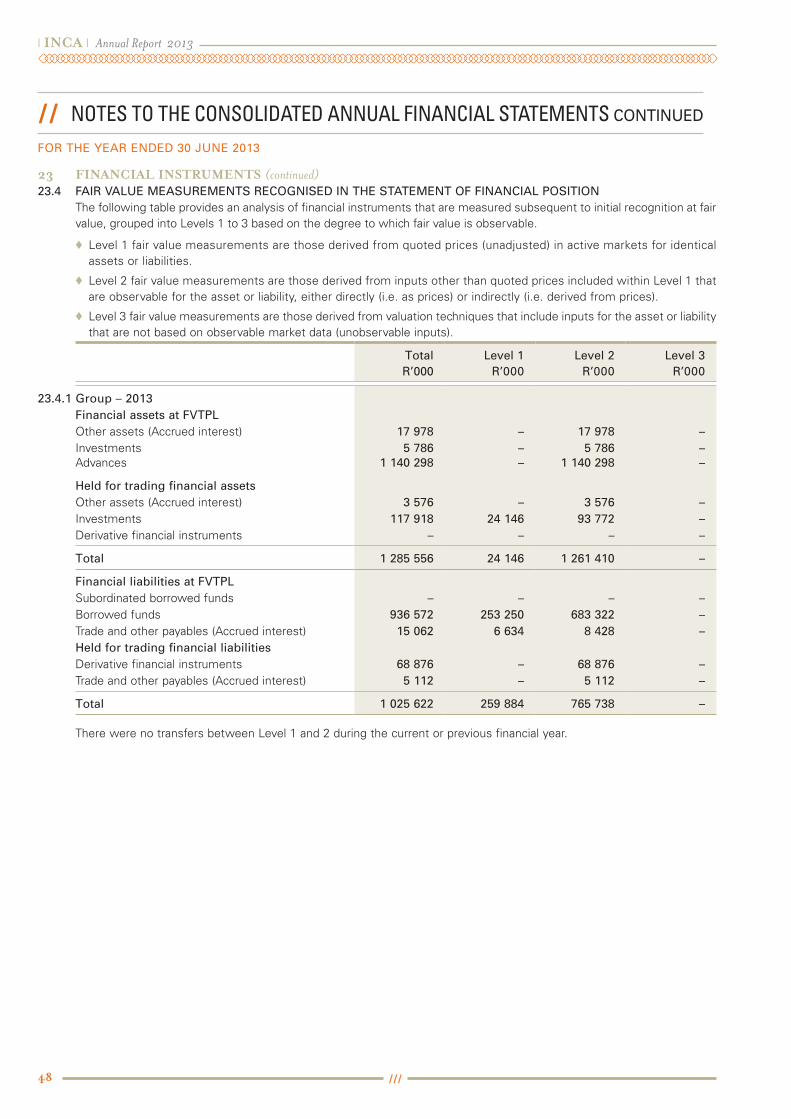
l INCA l Annual Report 2013
48
23 FINANCIAL INSTRUMENTS (continued)23.4 FAIR VALUE MEASUREMENTS RECOGNISED IN ThE STATEMENT OF FINANCIAL POSITION
The following table provides an analysis of financial instruments that are measured subsequent to initial recognition at fair value, grouped into levels 1 to 3 based on the degree to which fair value is observable.
♦♦ level 1 fair value measurements are those derived from quoted prices (unadjusted) in active markets for identical assets or liabilities.
♦♦ level 2 fair value measurements are those derived from inputs other than quoted prices included within level 1 that are observable for the asset or liability, either directly (i.e. as prices) or indirectly (i.e. derived from prices).
♦♦ level 3 fair value measurements are those derived from valuation techniques that include inputs for the asset or liability that are not based on observable market data (unobservable inputs).
TotalR’000
Level 1R’000
Level 2R’000
Level 3R’000
23.4.1 Group – 2013Financial assets at FVTPLOther assets (Accrued interest) 17 978 – 17 978 – Investments 5 786 – 5 786 – Advances 1 140 298 – 1 140 298 –
held for trading financial assetsOther assets (Accrued interest) 3 576 – 3 576 – Investments 117 918 24 146 93 772 – derivative financial instruments – – – –
Total 1 285 556 24 146 1 261 410 –
Financial liabilities at FVTPLSubordinated borrowed funds – – – – Borrowed funds 936 572 253 250 683 322 – Trade and other payables (Accrued interest) 15 062 6 634 8 428 – held for trading financial liabilitiesderivative financial instruments 68 876 – 68 876 – Trade and other payables (Accrued interest) 5 112 – 5 112 –
Total 1 025 622 259 884 765 738 –
There were no transfers between level 1 and 2 during the current or previous financial year.
// NOTES TO ThE CONSOliDaTED aNNUal fiNaNCial STaTEMENTS CONTINUED
FOR ThE YEAR ENDED 30 JUNE 2013
49
l INCA l Annual Report 2013
23 FINANCIAL INSTRUMENTS (continued)
TotalR’000
level 1R’000
level 2R’000
level 3R’000
23.4.2 Group – 2012Financial assets at FVTPLOther assets (Accrued interest) 21 675 – 21 675 – Investments 208 298 – 208 298 – Advances 1 436 115 – 1 436 115 – Held for trading financial assetsOther assets (Accrued interest) 6 162 – 6 162 – Investments 392 460 300 174 92 286 – derivative financial instruments 12 685 – 12 685 –
Total 2 077 395 300 174 1 777 221 –
Financial liabilities at FVTPLSubordinated borrowings 160 789 – 160 789 – long-term borrowings 1 608 444 818 793 789 651 – Trade and other payables (Accrued interest) 24 805 14 040 10 765 – Held for trading financial liabilitiesderivative financial instruments 140 130 – 140 130 – Trade and other payables (Accrued interest) 6 960 – 6 960 –
Total 1 941 128 832 833 1 108 295 –
23.5 FINANCIAL RISK MANAGEMENT OBJECTIVESThe Group’s Treasury function provides services to the business, coordinates access to domestic and international financial markets, monitors and manages the financial risks relating to the operations of the Group through internal risk reports which analyse exposures by degree and magnitude of risks. These risks include currency risk, liquidity risk and interest rate risk.
The Group seeks to minimise the effects of these risks by using derivative financial instruments to hedge these risk exposures. The use of derivative financial instruments is governed by the Group’s asset and liability management policies approved by the Board of directors, which provide written principles on foreign currency risk, interest rate risk, credit risk, the use of financial derivatives and non-derivative financial instruments, and the investment of excess liquidity. The Group does not enter into or trade in financial instruments, including derivative financial instruments, for speculative purposes. The Treasury function reports quarterly to Asset and liability Committee (AlCO).
23.6 MARKET RISKAlCO independently reviews and monitors the market risk reports used by management for the day-to-day market risk management. Significant market risks decisions are reported to AlCO and all market risk limits are recommended by AlCO to the Board for approval.
23.7 SENSITIVITY ANALYSISRealised fair value adjustments relate primarily to the sale or early settlement of some advances and capital market stock as well as the unwinding of some derivative financial instruments for treasury reasons. unrealised fair value adjustments represent the annual mark-to-market revaluation movement of financial assets and financial liabilities that are measured at fair value in the statement of financial position. The unrealised fair value adjustments also include the transfer of prior years unrealised fair value adjustments to realised fair value adjustments as a result of early settlements and disposal during the current financial year. The Group hedges its portfolio for interest rates movements in terms of the AlCO policy, however, credit spread movements are not hedged. The fair value adjustments generally result from interest rate movements, the basis risk, the passing of time and credit spread movements. Because the Group does not hedge itself for credit spread movements, any unequal credit spread movement on the financial assets and financial liabilities result in positive or negative fair value adjustments. The Group managed its interest rate movement hedge according to the AlCO limits.

l INCA l Annual Report 2013
50
23 FINANCIAL INSTRUMENTS (continued)23.7 SENSITIVITY ANALYSIS (continued)
Historically a significant increase in credit spreads of the financial assets of the Group, without a corresponding increase in the credit spreads of the financial liabilities, will result in significant volatility on the income statement. The following scenario illustrates the sensitivity for such an event, utilising the figures as at year-end.
Credit spreads on a substantial part of the advances portfolio were increased by 25 basis points whilst credit spreads on liabilities were kept constant. In the event of such occurrence, a negative unrealised loss before tax of R4 million (2012: R8,7 million) is observed. The Group is most sensitive for credit spread movements of advances in Metropolitan municipalities as illustrated below. A 25 basis points credit spread movement on the advances per risk category has the following outcome:
Fair ValueAdjustment
2013(R’000)
Fair valueAdjustment
2012(R’000)
INCA Credit Rating CategoryCategory 1 (AA- to AAA) 23 59Category 2 (A- to A+) 778 1 145Category 3 (BBB) 918 1 267Metropolitan municipalities (A to AA) 2 283 6 268
Total 4 002 8 739
details of the fair value adjustments that arose during the year under review are disclosed in note 16.
The interest rate sensitivity performed at year end on the entire portfolio, including all financial assets and liabilities, was based on an increase or decrease of 200 basis points. The impact to the pre-tax profit/(loss) of the Group would have been an increase of R0,8 million or a decrease of R1,3 million. In both scenarios the Group would have remained within the limit set by AlCO.
The Group does not have any foreign exchange exposure, hence no sensitivity analysis was performed based on the possible currency movements.
23.8 FOREIGN CURRENCY MANAGEMENTForeign liabilities and advances are hedged on a back-to-back basis with foreign assets or are swapped using cross currency interest rate swaps, which effectively eliminate any currency exposure. According to a policy approved by the Board of directors, INCA may not be exposed to foreign currency risk and therefore all these risks are hedged.
23.9 INTEREST RATE RISKThe Group manages its interest rate risk for all financial assets and liabilities with standard analytical techniques to measure interest rate sensitivity on a consolidated portfolio basis. This includes position reports and point-in-time interest income stress test for parallel interest rate moves. In addition, “twists” scenarios are used to focus on the impact on the value of the portfolio caused by changes to the shape of the yield curve. Interest rate risk is hedged based on the delta of the transaction. Treasury closely monitors the delta in each of the annual time buckets. All hedging activities and balance sheet mismatches are monitored by the AlCO, chaired by a non-executive director.
23.10 CREDIT RISKFinancial assets, which potentially subject the Group to concentrations of credit risk, consist principally of cash, short-term deposits and advances. The Group’s cash equivalents and short-term deposits are placed with high credit quality financial institutions.
The INCA credit evaluation model, which has been specifically developed to provide a shadow rating of each potential borrower prior to investment, provides the primary technique for mitigating against credit risk. The model focuses on all the major components that impact on the ability of the borrower to meet its commitments to the Group. The shadow rating provided by the INCA credit evaluation model is continuously compared and where necessary adjusted to the observable official credit ratings in the market.
// NOTES TO ThE CONSOliDaTED aNNUal fiNaNCial STaTEMENTS CONTINUED
FOR ThE YEAR ENDED 30 JUNE 2013
51
l INCA l Annual Report 2013
23 FINANCIAL INSTRUMENTS (continued)Credit risk is minimised through the diversification of the lending portfolio. The carrying amounts of financial assets included in the balance sheet represents the Group’s exposure to credit risk in relation to these assets but excludes any potential reduction for collateral security.
The Investment and Review Committee chaired by a non-executive director, oversees the annual credit reviews and approves the credit policy as well as reviewing credit portfolios and impairments.
Impairment on lease receivables and advances are analysed in note 6.8. Amounts past due but not impaired can be analysed as follows:
Ageing2013
R’000 2012
R’000
less than 30 days 1 661 3 074 30 to 60 days 167 1 141 60 to 180 days 1 160 5 754 More than 180 days 11 097 13 279
Total 14 085 23 248
This analysis is inclusive of lease receivables and long-term advances. lease receivables are secured by the underlying assets being leased.
23.11 LIqUIDITY RISKThe Group has a policy of retaining liquidity equivalent to six months operational costs plus interest, coupon and capital payments due over the next six months less the risk-adjusted cash inflows from advances for the next six months. In addition, the Group holds sufficient cash, short-term assets and readily marketable liquid assets and maintains credit lines with various major banks.
Liquidity Maturity AnalysisAnalysis as at 30 June 2013
PeriodFromTo
6 monthsJuly 2013
December 2013R’000
1 yearJanuary 2014
december 2014R’000
2 yearsJanuary 2015
december 2016R’000
3 yearsJanuary 2017
december 2019R’000
AfterJanuary 2020
R’000
Financial assetsInterest receivable 64 054 109 112 150 789 133 654 104 463 Capital receivable 364 690 172 675 360 482 295 469 187 312
428 744 281 787 511 271 429 123 291 775
Financial liabilitiesInterest payable (51 777) (97 792) (125 945) (78 442) (82 307)Capital payable (27 047) (56 459) (623 213) (201 980) (43 459)
(78 824) (154 251) (749 158) (280 422) (125 766)
Net cash flow 349 920 127 536 (237 887) 148 701 166 009
Cumulative net cash flow 349 920 477 456 239 569 388 270 554 279
The cash flow analysis above refer to Financial assets, as all Cash and cash equivalents, Advances, Investment and derivative financial instruments receivable and Financial liabilities refer to all Borrowings and derivative financial instruments payable.
The Group’s cash and short-term investments are reflected in the december 2013 bracket. The large amount of capital payable during 2015 to 2016 bracket includes the redemption of the Company’s IN04 and IN09 senior bonds. The maturity analysis reflects the Group’s cash flows and not the fair values as reported in the Group’s balance sheet.
The treasury function’s focus remains on the bond and loan redemptions. The Group still holds an unencumbered liquidity reserve of R117,9 million (refer to note 5, Capital market stock) as at year end.

l INCA l Annual Report 2013
52
24 SUBSEQUENT EvENTSThe Company settled a long-term loan received from the European Investment Bank on 16 September 2013, early. The settlement amount inclusive of accrued interest was R145,4 million and no penalty was paid (see note 11.2). The loan was settled from own funds generated.
25 EARNINGS PER SHAREThe earnings/(loss) per share has been calculated based on the total comprehensive income attributable to owners of the Company of R12 357 000 (2012: R33 081 000 loss) and the weighted average number of issued ordinary shares during the period of 751 954 shares (2012: 751 954 shares). Prior to the consolidation of IBRC and the INCA Share Incentive Trust 848 532 shares were used in the calculation.
26 RECLASSIFICATION OF ADvANCESWhere appropriate, the comparative figures of change in Advances and change in Other assets have been reclassified to achieve fair presentation.
Previouslyreported
R’000
Currently reported
R’000Net change
R’000
2012Consolidated statement of financial positionChange in advances: 1 449 405 1 455 593 6 188
– gross amount 1 449 405 1 455 593 6 188
Change in other assets: 35 441 29 253 (6 188)
– gross amount 35 441 29 253 (6 188)
Total –
2012Company statement of financial positionChange in advances: 1 449 405 1 455 593 6 188
– gross amount 1 449 405 1 455 593 6 188
Change in other assets: 35 441 29 253 (6 188)
– gross amount 35 441 29 253 (6 188)
Total –
// NOTES TO ThE CONSOliDaTED aNNUal fiNaNCial STaTEMENTS CONTINUED
FOR ThE YEAR ENDED 30 JUNE 2013

REGISTERED NAME
REG NO
REGISTERED OFFICE
POSTAL ADDRESS
TELEPHONE
TELEFAX
BANKERS
TRUSTEE
SECRETARY
AUDITORS
INCA TREASURY
TELEPHONE
INF
RA
ST
RU
CT
UR
E F
INA
NC
E C
OR
PO
RA
TIO
N L
IMIT
ED
/ A
NN
UA
L R
EP
OR
T 2
01
3
www.inca.co.za
Infrastructure Finance Corporation Limited (Trading as INCA)
1996/001482/06
Unit F14, Pinewood Square, Pinewood Office Park, 33 Riley Road, Woodmead, Sandton, South Africa
PO Box 1847, Gallo Manor, 2052, South Africa
+27 (11) 202 2200
+27 (11) 202 2232
FNB Corporate
Maitland Trust Limited
JM Poulter
Sizwe Ntsaluba Gobodo, 20 Morris Street East, Woodmead, 2191
Zee Martinho
+27 (11) 202 2205
ADMINISTRATION