Embed Size (px)
Citation preview
Organic Lecture Series
1
InfraredInfrared
SpectroscopySpectroscopy(Chapter 12)(Chapter 12)
Organic Lecture Series
2
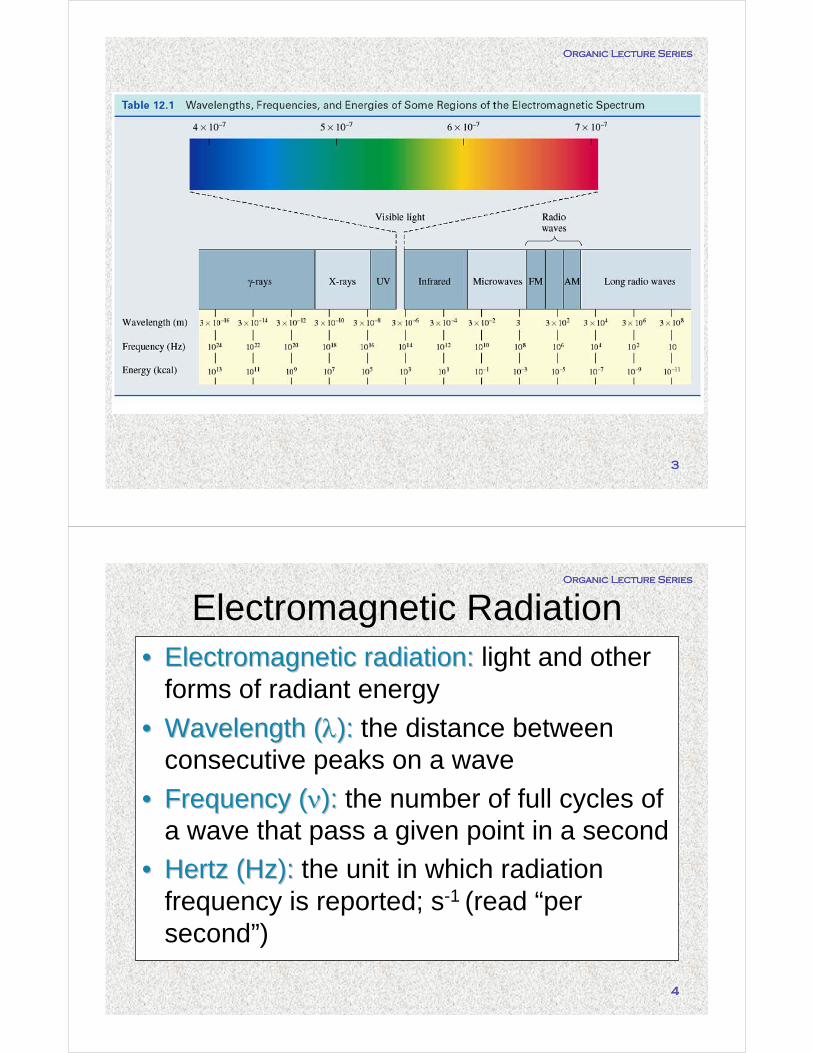
This reaction from Ochem 1
How do we know if it worked? The reactant is cyclohexene; the product is cyclohexanol. How can we tell the difference?
Infrared Spectroscopy (IR) is Infrared Spectroscopy (IR) is an easy way to do it.an easy way to do it.
Organic Lecture Series
3
Organic Lecture Series
4
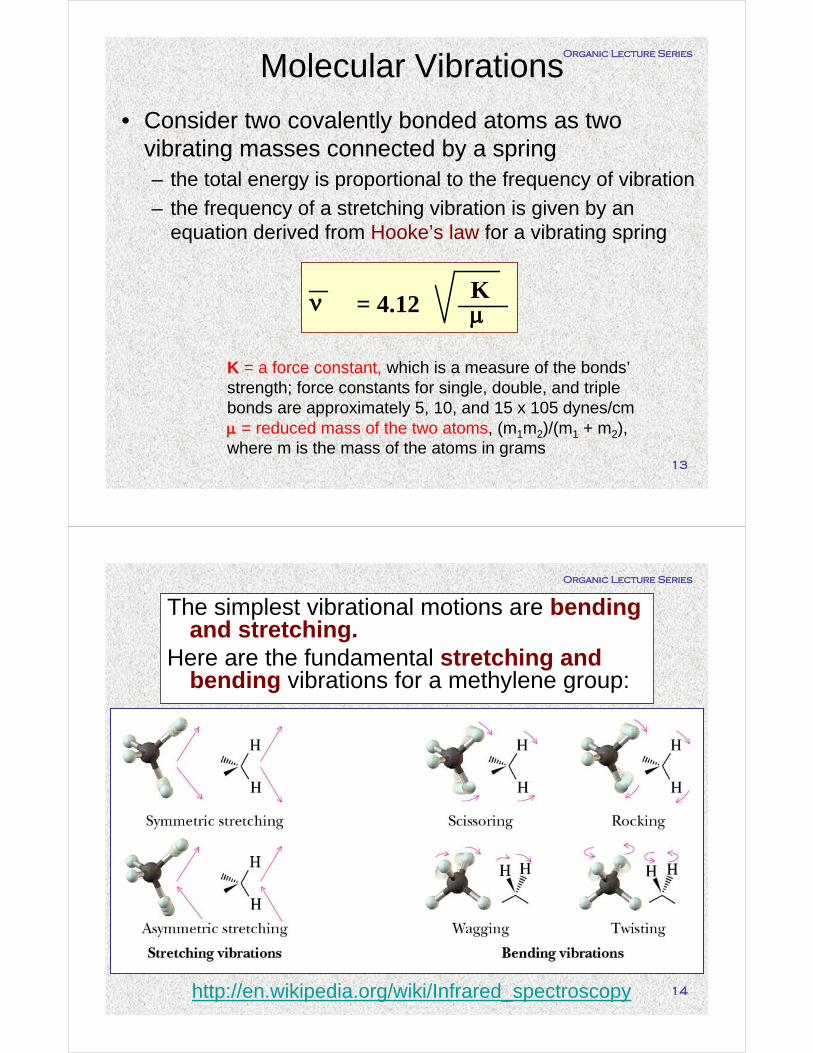
•• Electromagnetic radiation:Electromagnetic radiation: light and other forms of radiant energy
•• Wavelength (Wavelength (λλ):): the distance between consecutive peaks on a wave
•• Frequency (Frequency (νν):): the number of full cycles of a wave that pass a given point in a second
•• Hertz (Hz):Hertz (Hz): the unit in which radiation frequency is reported; s-1 (read “per second”)
Electromagnetic Radiation

Organic Lecture Series
5
Electromagnetic Radiation
• Common units used to express wavelength λ
Angstrom (Å) 1 Å = 10-10 m
Relationto MeterUnit
1 mm = 10-3 m
1 nm = 10-9 m1 μm = 10-6 m
Nanometer (nm)Micrometer (μm)
Millimeter (mm)Meter (m) ----
E = hνE is kJ/mol
h= 3.99 X 10⁻¹³ kJ s mol-1
ν = frequency in Hz
c = λν
Organic Lecture Series
6
E=hν

Organic Lecture Series
7
Infrared Spectroscopy• The vibrational IR extends from 2.5 x 10⁻⁶ m (2.5
μm) to 2.5 x 10⁻⁵ m (25 μm)– the frequency of IR radiation is commonly expressed in
wavenumbers
–– Wavenumber Wavenumber νν:: the number of waves per centimeter, with units cm-1 (read reciprocal centimeters)
– expressed in wavenumbers, the vibrational IR extends from 4000 cm-1 to 400 cm -1
ν = = 400 cm-1
= 4000 cm-1
ν = 10-2 m•cm -1
2.5 x 10⁻⁶ m
10-2 m•cm -1
2.5 x 10⁻⁵ m
25 μm to 2.5 μm
Organic Lecture Series
8
Sections of an IR Spectrum
This is the most common scale.

Organic Lecture Series
9
• IR spectrum of 3-methyl-2-butanone
Strong absorption
Organic Lecture Series
10
• IR spectrum of 3-methyl-2-butanone
C=OStretch
C-HStretch

Organic Lecture Series
11
Molecular Vibrations–atoms joined by covalent bonds undergo continual
vibrations relative to each other
–the energies associated with these vibrations are
quantized; within a molecule, only specific
vibrational energy levels are allowed
–the energies associated with transitions between
vibrational energy levels correspond to
frequencies in the infrared region:
4000 to 400 cm-1
Organic Lecture Series
12
• For a molecule to absorb IR radiation– the bond undergoing vibration must be polar and
– its vibration must cause a periodic change in the bond dipole moment
• Covalent bonds which do not meet these criteria are said to be IR inactive– the C-C double and triple bonds of symmetrically
substituted alkenes and alkynes, for example, are IR inactive because they are not polarized bonds
H3 C
C C
CH3
H3 C CH3
H3 C-C C-CH3
2,3-Dimethyl-2-butene 2-Butyne
Organic Lecture Series
13
Molecular Vibrations
• Consider two covalently bonded atoms as two vibrating masses connected by a spring– the total energy is proportional to the frequency of vibration
– the frequency of a stretching vibration is given by an equation derived from Hooke’s law for a vibrating spring
K = a force constant, which is a measure of the bonds’strength; force constants for single, double, and triple bonds are approximately 5, 10, and 15 x 105 dynes/cmμ = reduced mass of the two atoms, (m1m2)/(m1 + m2), where m is the mass of the atoms in grams
Kν = 4.12 μ
Organic Lecture Series
14
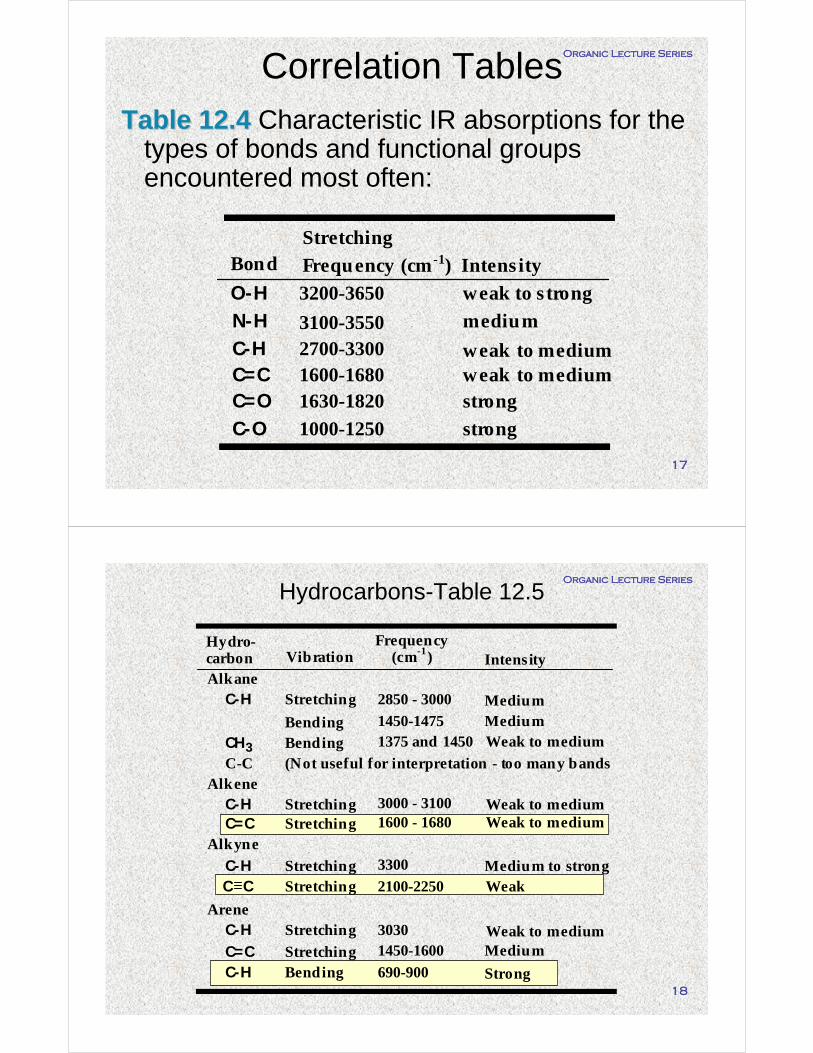
The simplest vibrational motions are bending and stretching.
Here are the fundamental stretching and bending vibrations for a methylene group:
http://en.wikipedia.org/wiki/Infrared_spectroscopy

Organic Lecture Series
15
Symmetric Asymmetric Scissoring
Rotation Wagging Twisting
Organic Lecture Series
16
Molecular Vibrations
• From this equation, we see that the positionposition(i.e. wavenumber) of a stretching vibration:– is proportional to the strength of the vibrating bond– is inversely proportional the masses of the atoms
connected by the bond
• The intensity intensity (i.e. weak, s, m) of absorption depends primarily on the polarity of the vibrating bond
Kν = 4.12 μ
Organic Lecture Series
17
Correlation Tables
Table 12.4Table 12.4 Characteristic IR absorptions for the types of bonds and functional groups encountered most often:
C-H
N-H
O-H
C=OC=C
C-O 1000-1250 strong
weak to medium1600-16801630-1820 strong
2700-3300 weak to medium
weak to s trong3200-3650
medium3100-3550
Intens ity
Stretching
Frequency (cm-1)Bond
Organic Lecture Series
18
Hydrocarbons-Table 12.5
C-H
CH3
C=CC-H
C-HC C
C-C
C-H
C=CC-H
Intensity
2850 - 3000 Medium
Stretching 3300 Medium to strongStretching 2100-2250 Weak
Weak to medium1600 - 1680StretchingWeak to medium3000 - 3100Stretching
Alkyne
Alkene
Alkane
Vibration
Stretching
Hydro-carbon
Frequency(cm-1)
Bending 1450-1475 Medium
Bending 1375 and 1450 Weak to medium
(Not useful for interpretation - too many bands
AreneStretching 3030 Weak to medium
Medium1450-1600StretchingBending 690-900 Strong
Organic Lecture Series
19
Alkanes
• IR spectrum of decane (Fig 12.4)
3000
Organic Lecture Series
20
Alkenes
• IR spectrum of cyclohexene (Fig 12.5)
3000
Organic Lecture Series
21
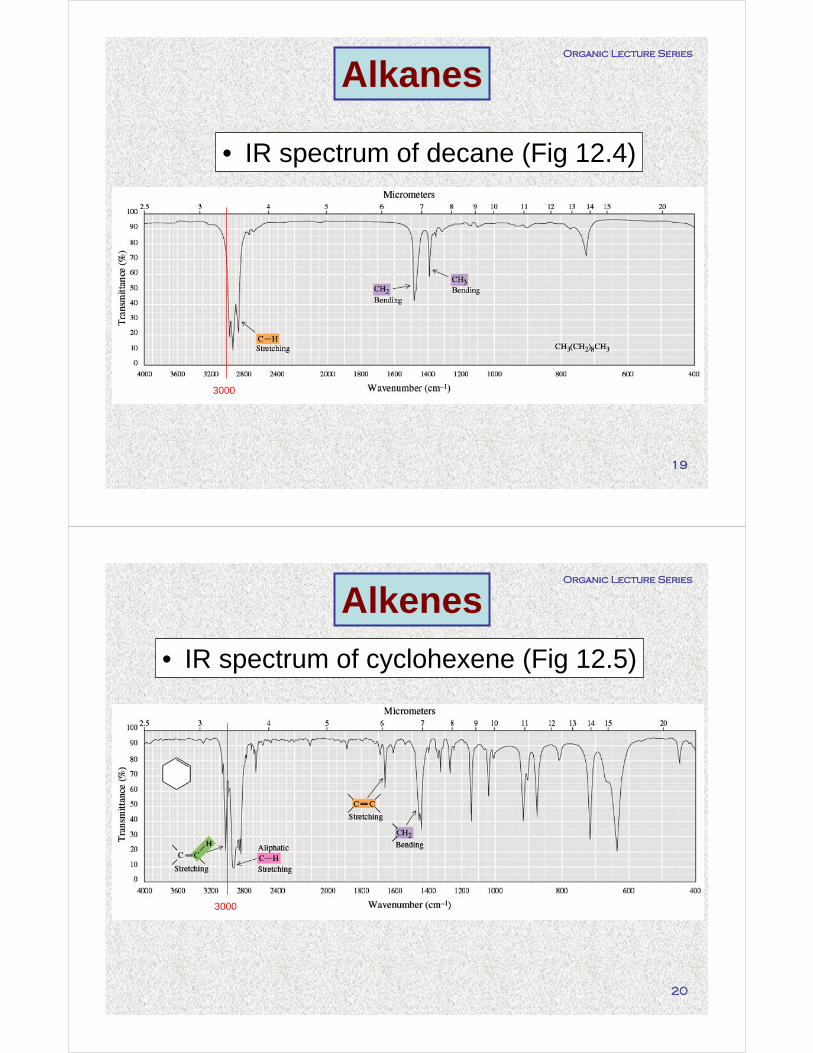
Alkynes
• IR spectrum of 1-octyne (Fig 12.6)
3000
Organic Lecture Series
22
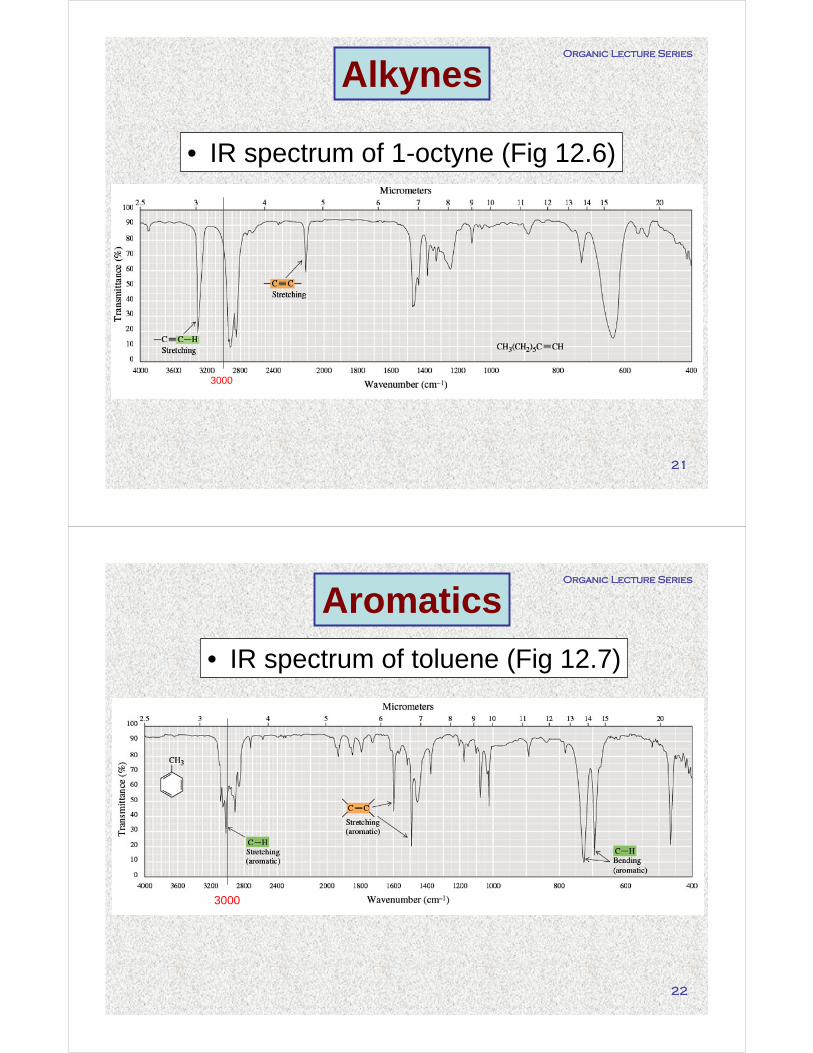
Aromatics
• IR spectrum of toluene (Fig 12.7)
3000

Organic Lecture Series
23
Alcohols
O-H (free)
O-H (H bonded)
C-O
Bond IntensityFrequency, cm-1
Medium1000 - 1250
Medium, broad3200 - 3500
3600-3650 Weak
Organic Lecture Series
24
Effect of Concentration Upon Hydrogen Bonding
Organic Lecture Series
25
Effect of Concentration Upon Hydrogen Bonding
Organic Lecture Series
26
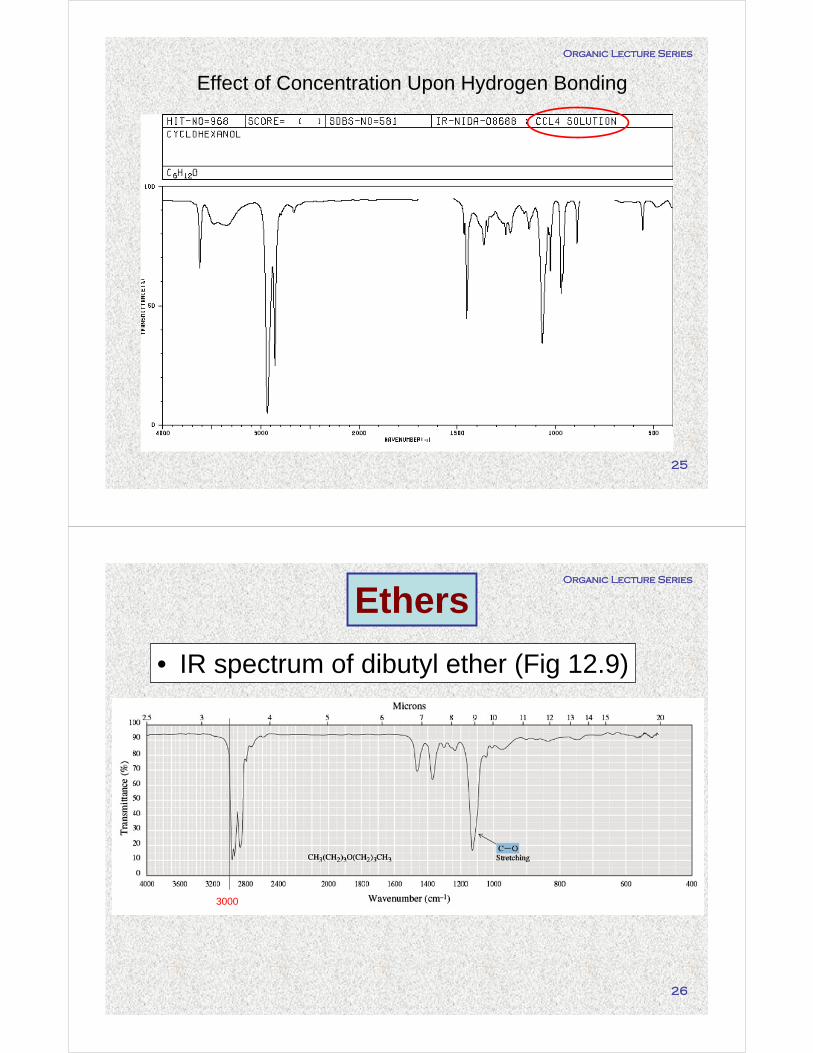
Ethers
• IR spectrum of dibutyl ether (Fig 12.9)
3000
Organic Lecture Series
27
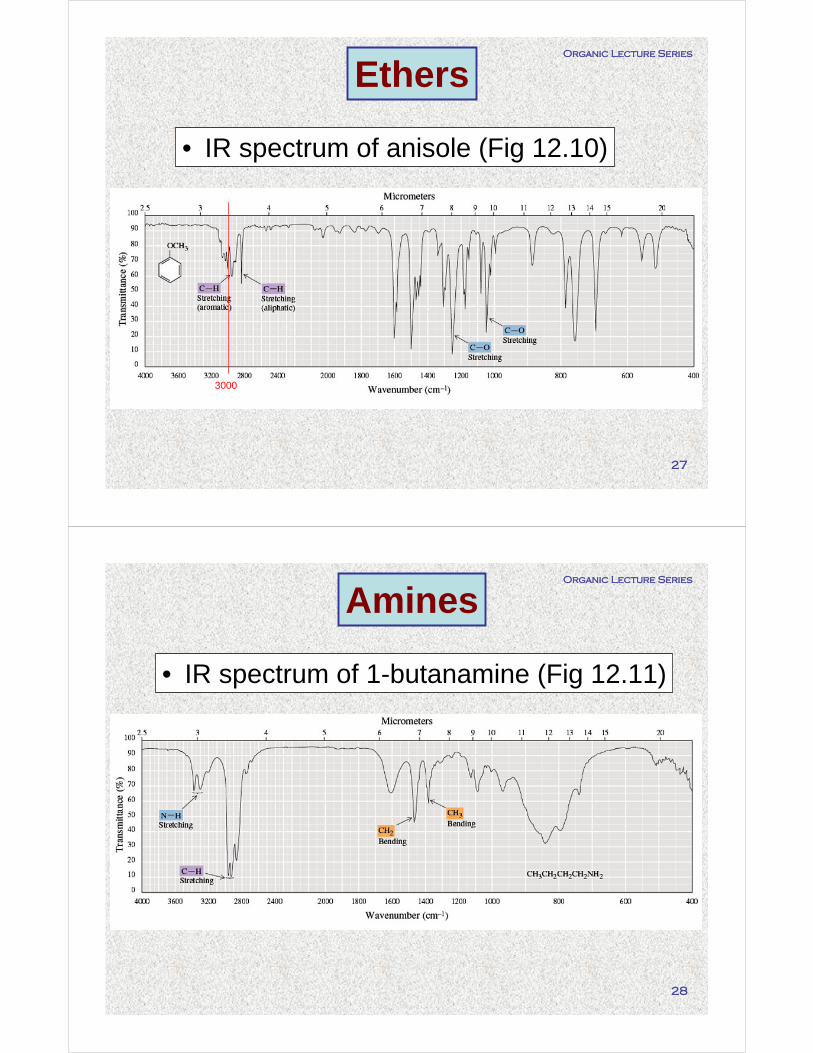
• IR spectrum of anisole (Fig 12.10)
Ethers
3000
Organic Lecture Series
28
Amines
• IR spectrum of 1-butanamine (Fig 12.11)

Organic Lecture Series
29
IR of Molecules with C=O Groups
C=O
C=O
C-H
O HRCOHO
RCHO
RCR'O
C=O
Strong1700-1725StretchingCarboxylic acids
Aldehydes
VibrationCarbonyl GroupFrequency
(cm-1) Intensity
Stretching 1630-1820 StrongStretching 2720 Weak
Stretching 2500-3300 Strong (broad)
KetonesStretching 1630-1820 Strong
Organic Lecture Series
30
C=O
sp3 C O
sp2 C O
C=O
C=O
N H
C≡NRC N
RCOCRO O
RCOR'O
RCNH2
O
C O Stretching 900-1300 Strong
Strong1735-1800Stretching
Carboxylic esters
Stretching 1000-1100 Strong
Stretching 1200-1250 Strong
Acid anhydrides
Stretching 1740-1760 and1800-1850
Strong
Strong1630-1680StretchingAmides
Stretching 3200, 3400 Medium(1° amides have two N-H stretches)(2° amides have one N-H stretch)
NitrilesStretching 2200-2250 Medium
IR of Molecules with C=O Groups
Organic Lecture Series
31
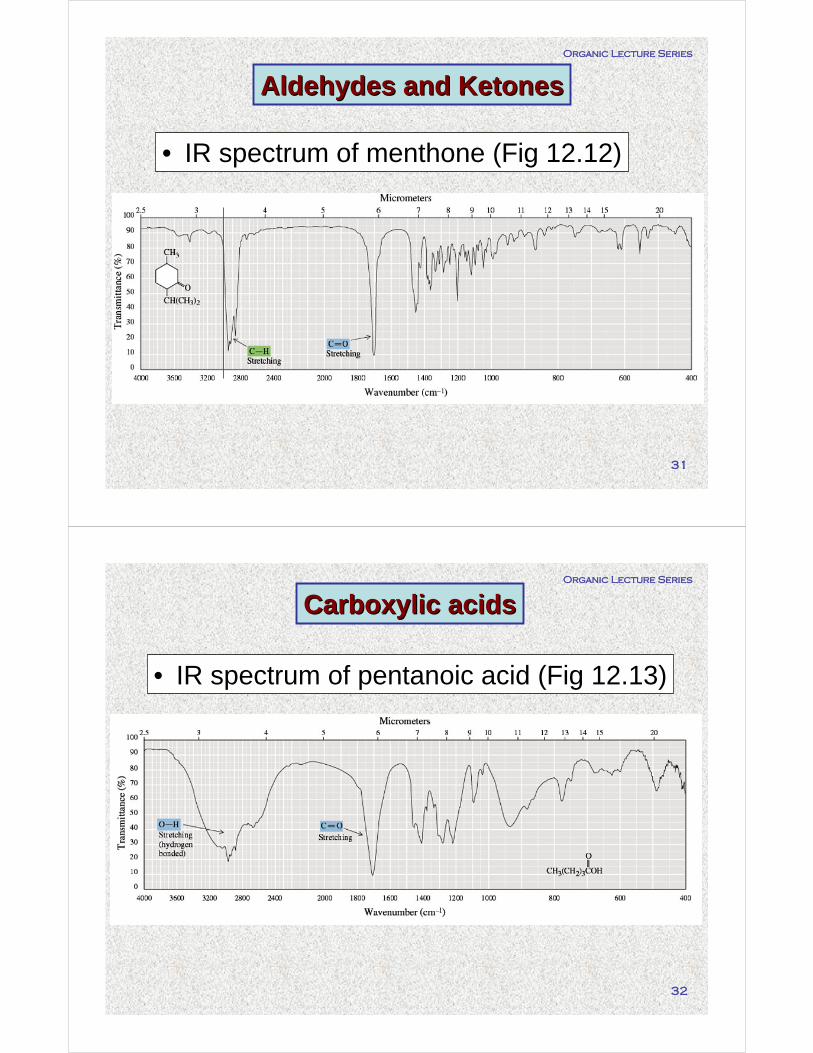
Aldehydes and KetonesAldehydes and Ketones
• IR spectrum of menthone (Fig 12.12)
Organic Lecture Series
32
Carboxylic acidsCarboxylic acids
• IR spectrum of pentanoic acid (Fig 12.13)

Organic Lecture Series
33
AmideAmide
• IR of N-methylpropanamide (Fig 12.14)
Organic Lecture Series
34
EstersEsters
• IR of Ethyl butanoate (Fig 12.15)
Organic Lecture Series
35
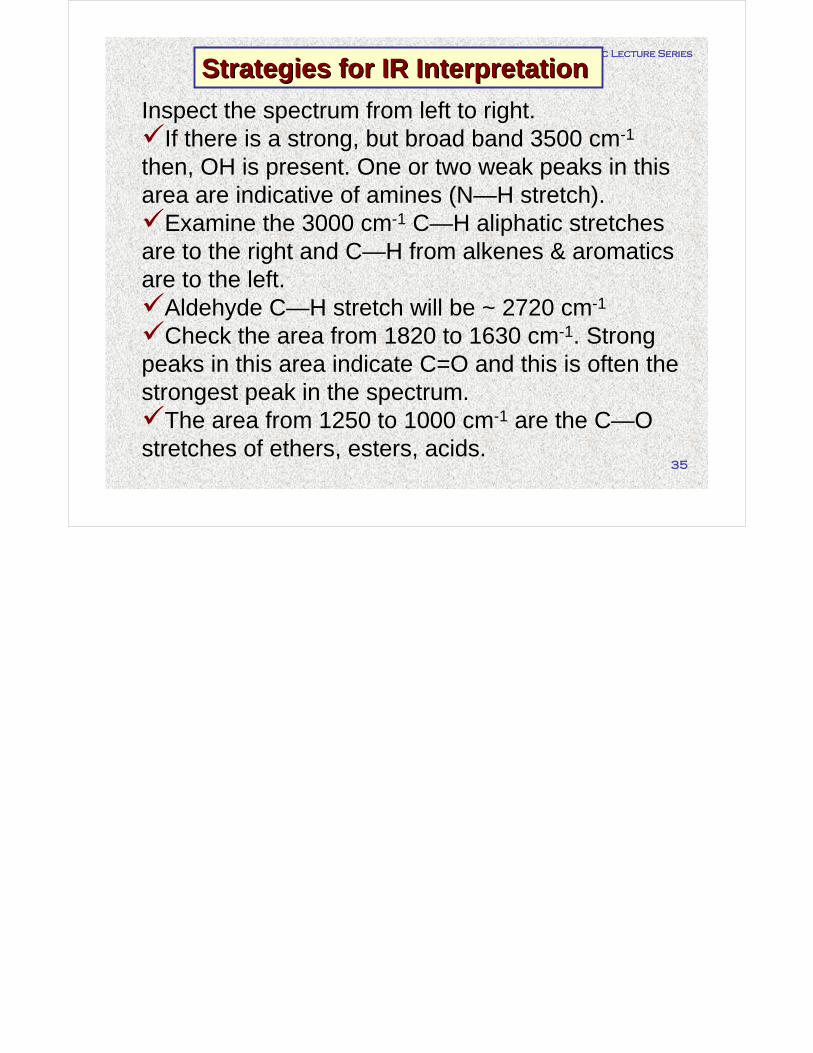
Strategies for IR Interpretation Strategies for IR Interpretation
Inspect the spectrum from left to right. If there is a strong, but broad band 3500 cm-1
then, OH is present. One or two weak peaks in this area are indicative of amines (N—H stretch).
Examine the 3000 cm-1 C—H aliphatic stretches are to the right and C—H from alkenes & aromatics are to the left.
Aldehyde C—H stretch will be ~ 2720 cm-1
Check the area from 1820 to 1630 cm-1. Strong peaks in this area indicate C=O and this is often the strongest peak in the spectrum.
The area from 1250 to 1000 cm-1 are the C—O stretches of ethers, esters, acids.