Embed Size (px)
Citation preview
Spectroscopy 16 (2002) 289–296 289IOS Press
Infrared spectra of some fructans
M. Grube∗, M. Bekers, D. Upite and E. KaminskaInstitute of Microbiology and Biotechnology, University of Latvia, Kronvalda blvd. 4, LV 1586 Riga,Latvia
Abstract. The FT-IR spectra of fructan – inulin (RAFTILINE), widely applied in the food industry and crystalline fructoseas the main component of fructans, were studied. Special interest was to study the spectra of the levan precipitate and fructansyrup – produced byZymomonas mobilisduring the fermentation on sucrose-based medium.
It was shown that levan precipitate and fructose syrup does not contain lipids and nucleic acids. Levan precipitate consists of∼93% of fructose and admixture of glucose, mannan and enzyme – levansucrase. Fructan polymer inulin consists principallyof linear chains of fructosyl units linked by aβ(2-1) bonds ended by a glycosyl unit. The links between the molecules areof a very special type: theβ(2-1) form (2) [8]. The bacterial fructans of the levan type are high molecular weight polymers,i.e., they are composed ofβ-(2,6)-fructosyl-fructose linked molecules and side chains [17]. The FT-IR spectra of levan, apartfrom inulin’s, in the carbohydrate region 900–1200 cm−1, shows overlapping broad band with maximum at∼1030 cm−1 andstronger absorption at∼940 cm−1. The differences in both spectra could be caused by different structure and glucose, sucroseand mannan influence.Keywords: IR-spectroscopy, levan, fructose syrup, inulin
1. Introduction
Fructose or fruit sugar, is a simple sugar found in honey, fruit and different plants. It is sweeter thanglucose and sucrose. Chemically it is a monosaccharide with the empirical formula C6H12O6 – the sameas glucose but differs from it in structure. It is best obtained by hydrolysis of polyfructose – inulin that iscarbohydrate of plant origin naturally occuring in significant amounts [8].
Inulin is a polymer of fructans and consists principally of linear chains of fructosyl units linked byβ(2-1) bonds ended by a glycosyl unit [9]. Native inulin is a mixture of poly- and oligosaccharides whichalmost all have the chemical structure GFn (G= glucose, F= fructose, and n= number of fructose unitslinked to one another). The links between the molecules are of a very special type: theβ(2-1) form (2),which makes these molecules indigestible for all higher animals [8] and has significant “dietary fibereffects” often comparable to pectins. The concept of dietary fiber, first described in the context of the hy-pothesis developed by Burkitt and Trowell in 1975, covers actually a series of complex compounds whichare, according to the current most widely accepted physiological definition, “the sum of polysaccharidesand lignins that are not hydrolyzed by the endogenous secretion of the human digestive tract” [1].
Fructans are a diverse group of polysaccharides that contains two or moreβ-linked fructose units.Fructans containing from 2 to 9 fructose units are named fructooligosaccharides (FOS). In the mostprominent structural polymer types, inulin and levan, the fructose chain emerges from the fructose partof a sucrose molecule, proceeding viaβ2 → 1 andβ2 → 6 linkages, respectively [10]. Fructans are nat-urally found not only in plants, but also in bacteria and fungi, probably serving very different functions.Most bacterial fructans are high molecular weight polymers of the levan type, i.e., they are composed
* Corresponding author. Tel.: +371 703 4886; Fax: +371 703 4885; E-mail: [email protected].
0712-4813/02/$8.00 2002 – IOS Press. All rights reserved

290 M. Grube et al. / Infrared spectra of some fructans
of β-(2,6)-fructosyl-fructose linked molecules and side chains [17]. Levans are part of the exopolysac-charide that protects the cells from desiccation, helps in surface attachment, and is – in some plantpathogenic species – involved in preventing the invading bacteria from being recognized by the hostdefense system [13,14]. Levan is extracellulary produced by different bacteriaBacillus subtilis, Erwiniaherbicola [7] andZymomonas mobilis[20]. Z. mobilisis a unique bacterium among the microbial evo-lutionary world and it’s taxonomic position has not been fully established. In a sucrose-based mediumthis gram-negative, ethanol-producing bacterium produces various by-products: levan of high molecularmass [4], sorbitol, gluconic acid, and FOS [19]. Levan is viscous, biologically active, non-toxic and canbe used as thickener or stabilizer in the food, pharmaceutical and cosmetic industries and is a good rawmaterial for fructose production, acts as immunomodulator, and is applied as blood plasma substitute,prolongator of medicine, and a cholesterol lowering agent [22].
FOS are known as sweeteners with reduced energetic value, stimulators of probiotics [23]. In ourlaboratory has been developed a new product – fructan syrup [3] obtained fromZ. mobilissucrose fer-mentation. Fructan syrup has a pleasant honey-like taste, serves as a source of prebiotics, and solublefiber – levan, and is of interest as potential ingredient in foods because of their effects on intestinal flora,functionality, and reduced caloric value.
The aim of our work was to study the IR spectra of our products: levan precipitate and fructan syrupas well as in the food industry widely applied inulin – RAFTILINE, and fructose as the main componentof fructans.
2. Materials and methods
2.1. Microorganisms and preparation of the samples
The levan-producing strainZymomonas mobilis 113 “S”and a two-stage fermentation process wasused as described previously [5]. The culture liquid, containing ethanol, levan, and gluconic acid, wascentrifuged at 28 600g, after the second stage of fermentation. The cell-free supernatant (100 ml) wastreated with ethanol (1 : 2.5) and the obtained sediment is a crude levan suitable for application in thefood industry.
Fructan syrup was prepared from sucrose syrup (65%) using as biocatalyst 5 g/100 g levan-levansucrase sediment at incubation temperature 45◦C during 48 h.
Inulin was obtained from ORAFTI (Belgium) as a commercial food additive RAFTILINE.
2.2. Analytical methods
The cell mass in the culture liquid was determined after centrifugation for 15 min (at 5000g) anddrying at 105◦C. The optical density of a 10 time diluted culture was measured at 590 nm. The ethanolconcentration was determined by GLC (Chrom 4, the column Inerton AW-HHDS+ 5% PEG,Tt = 80◦C,TS = 200◦C). The gluconic acid concentration was determined by HPLC (Shimadzu LC-4A, the columnShimadzu SCR 101 (H), spectrophotometer SPD-2AS,λ = 210 nm, the mobile phase 0.01 N H2SO4, theflow 1.2 ml/min at 40◦C). Levan was precipitated by ethanol (65 v%) and determined as fructose afterhydrolysis of polysaccharide [20]. The glucose, fructose, and sucrose concentrations were determinedby HPLC (the column Pinacle Amino 5µm, 250× 4.6 with a mobile phase, acetonitryle : water 75 : 25,refractive index detector). The yield of FOS was calculated from the estimated sugar content in thelevan-free solution before and after hydrolysis.
M. Grube et al. / Infrared spectra of some fructans 291
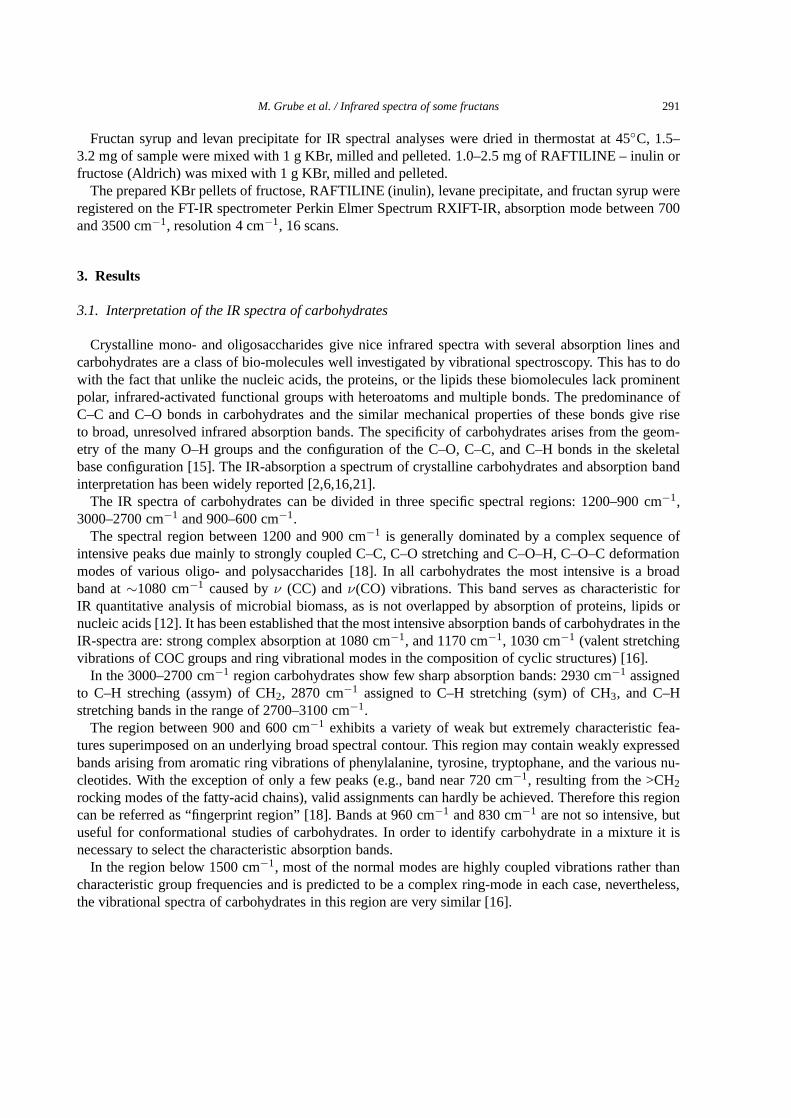
Fructan syrup and levan precipitate for IR spectral analyses were dried in thermostat at 45◦C, 1.5–3.2 mg of sample were mixed with 1 g KBr, milled and pelleted. 1.0–2.5 mg of RAFTILINE – inulin orfructose (Aldrich) was mixed with 1 g KBr, milled and pelleted.
The prepared KBr pellets of fructose, RAFTILINE (inulin), levane precipitate, and fructan syrup wereregistered on the FT-IR spectrometer Perkin Elmer Spectrum RXIFT-IR, absorption mode between 700and 3500 cm−1, resolution 4 cm−1, 16 scans.
3. Results
3.1. Interpretation of the IR spectra of carbohydrates
Crystalline mono- and oligosaccharides give nice infrared spectra with several absorption lines andcarbohydrates are a class of bio-molecules well investigated by vibrational spectroscopy. This has to dowith the fact that unlike the nucleic acids, the proteins, or the lipids these biomolecules lack prominentpolar, infrared-activated functional groups with heteroatoms and multiple bonds. The predominance ofC–C and C–O bonds in carbohydrates and the similar mechanical properties of these bonds give riseto broad, unresolved infrared absorption bands. The specificity of carbohydrates arises from the geom-etry of the many O–H groups and the configuration of the C–O, C–C, and C–H bonds in the skeletalbase configuration [15]. The IR-absorption a spectrum of crystalline carbohydrates and absorption bandinterpretation has been widely reported [2,6,16,21].
The IR spectra of carbohydrates can be divided in three specific spectral regions: 1200–900 cm−1,3000–2700 cm−1 and 900–600 cm−1.
The spectral region between 1200 and 900 cm−1 is generally dominated by a complex sequence ofintensive peaks due mainly to strongly coupled C–C, C–O stretching and C–O–H, C–O–C deformationmodes of various oligo- and polysaccharides [18]. In all carbohydrates the most intensive is a broadband at∼1080 cm−1 caused byν (CC) andν(CO) vibrations. This band serves as characteristic forIR quantitative analysis of microbial biomass, as is not overlapped by absorption of proteins, lipids ornucleic acids [12]. It has been established that the most intensive absorption bands of carbohydrates in theIR-spectra are: strong complex absorption at 1080 cm−1, and 1170 cm−1, 1030 cm−1 (valent stretchingvibrations of COC groups and ring vibrational modes in the composition of cyclic structures) [16].
In the 3000–2700 cm−1 region carbohydrates show few sharp absorption bands: 2930 cm−1 assignedto C–H streching (assym) of CH2, 2870 cm−1 assigned to C–H stretching (sym) of CH3, and C–Hstretching bands in the range of 2700–3100 cm−1.
The region between 900 and 600 cm−1 exhibits a variety of weak but extremely characteristic fea-tures superimposed on an underlying broad spectral contour. This region may contain weakly expressedbands arising from aromatic ring vibrations of phenylalanine, tyrosine, tryptophane, and the various nu-cleotides. With the exception of only a few peaks (e.g., band near 720 cm−1, resulting from the >CH2rocking modes of the fatty-acid chains), valid assignments can hardly be achieved. Therefore this regioncan be referred as “fingerprint region” [18]. Bands at 960 cm−1 and 830 cm−1 are not so intensive, butuseful for conformational studies of carbohydrates. In order to identify carbohydrate in a mixture it isnecessary to select the characteristic absorption bands.
In the region below 1500 cm−1, most of the normal modes are highly coupled vibrations rather thancharacteristic group frequencies and is predicted to be a complex ring-mode in each case, nevertheless,the vibrational spectra of carbohydrates in this region are very similar [16].
292 M. Grube et al. / Infrared spectra of some fructans
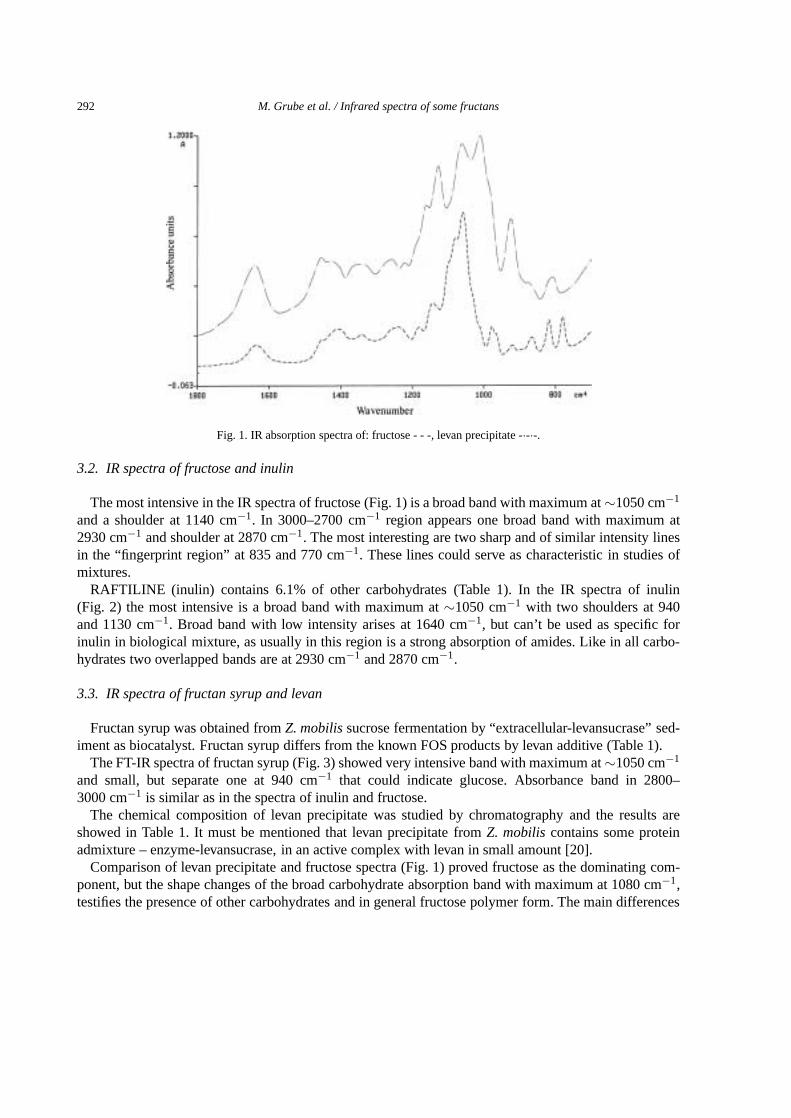
Fig. 1. IR absorption spectra of: fructose - - -, levan precipitate -·-·-.
3.2. IR spectra of fructose and inulin
The most intensive in the IR spectra of fructose (Fig. 1) is a broad band with maximum at∼1050 cm−1
and a shoulder at 1140 cm−1. In 3000–2700 cm−1 region appears one broad band with maximum at2930 cm−1 and shoulder at 2870 cm−1. The most interesting are two sharp and of similar intensity linesin the “fingerprint region” at 835 and 770 cm−1. These lines could serve as characteristic in studies ofmixtures.
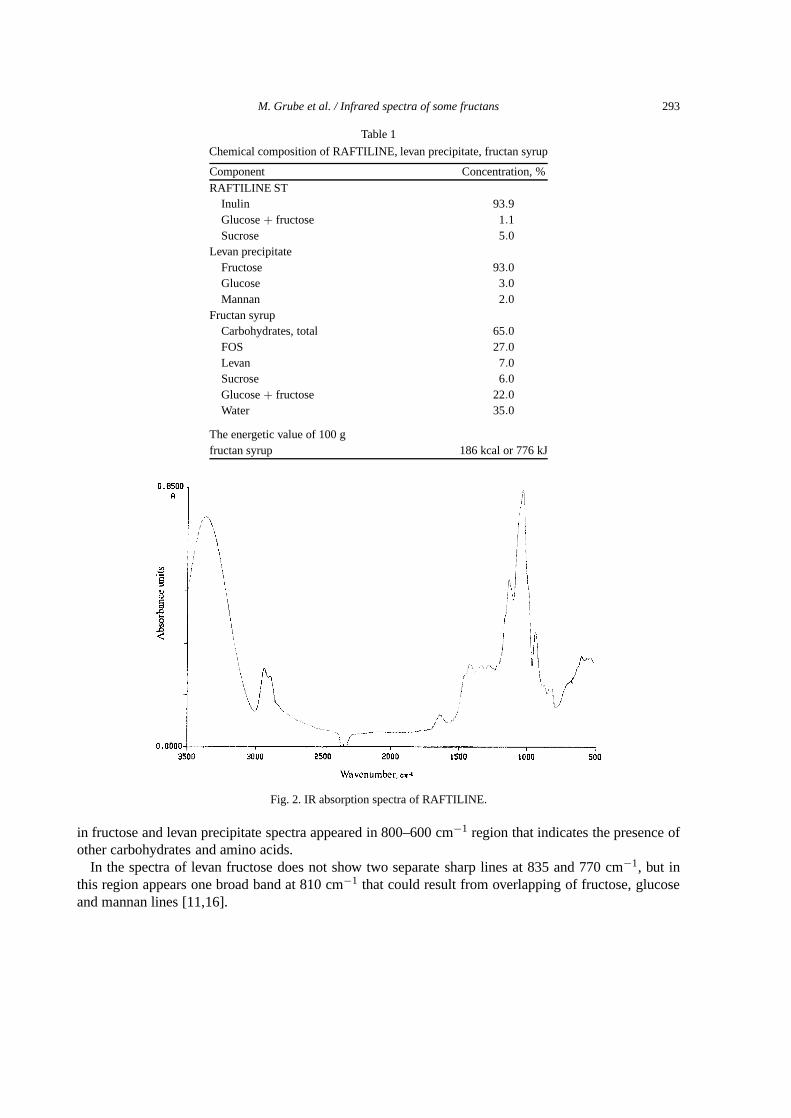
RAFTILINE (inulin) contains 6.1% of other carbohydrates (Table 1). In the IR spectra of inulin(Fig. 2) the most intensive is a broad band with maximum at∼1050 cm−1 with two shoulders at 940and 1130 cm−1. Broad band with low intensity arises at 1640 cm−1, but can’t be used as specific forinulin in biological mixture, as usually in this region is a strong absorption of amides. Like in all carbo-hydrates two overlapped bands are at 2930 cm−1 and 2870 cm−1.
3.3. IR spectra of fructan syrup and levan
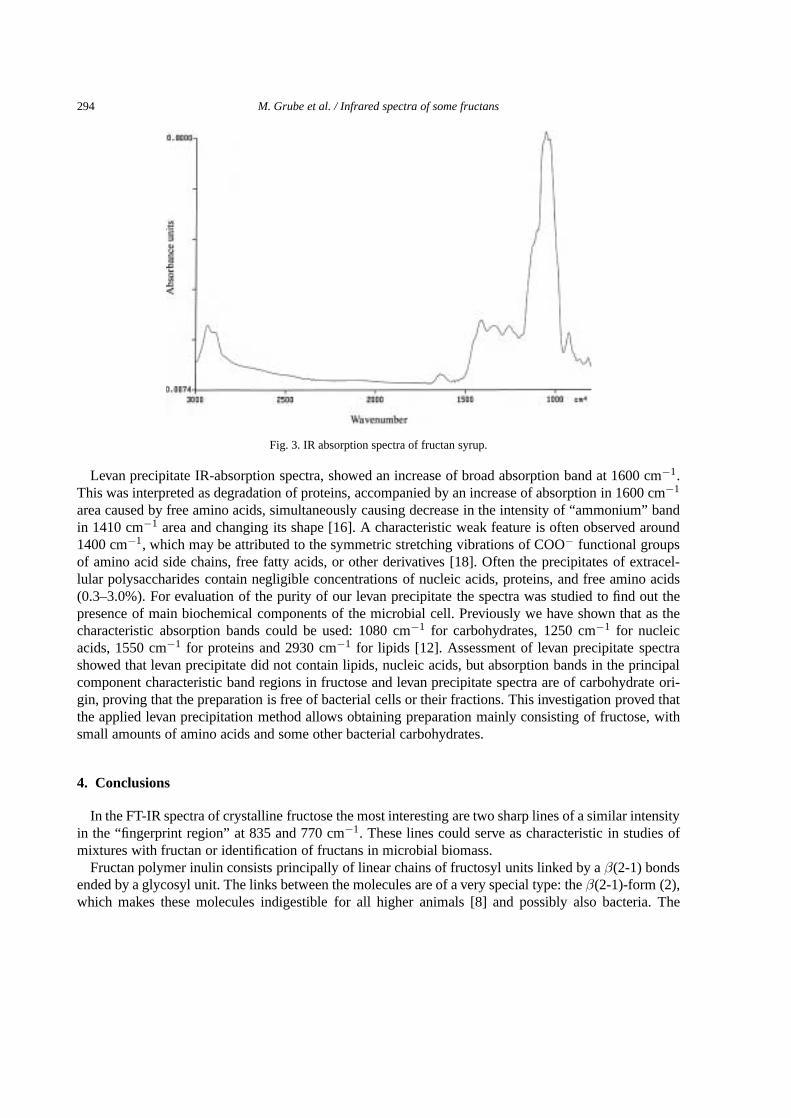
Fructan syrup was obtained fromZ. mobilissucrose fermentation by “extracellular-levansucrase” sed-iment as biocatalyst. Fructan syrup differs from the known FOS products by levan additive (Table 1).
The FT-IR spectra of fructan syrup (Fig. 3) showed very intensive band with maximum at∼1050 cm−1
and small, but separate one at 940 cm−1 that could indicate glucose. Absorbance band in 2800–3000 cm−1 is similar as in the spectra of inulin and fructose.
The chemical composition of levan precipitate was studied by chromatography and the results areshowed in Table 1. It must be mentioned that levan precipitate fromZ. mobiliscontains some proteinadmixture – enzyme-levansucrase, in an active complex with levan in small amount [20].
Comparison of levan precipitate and fructose spectra (Fig. 1) proved fructose as the dominating com-ponent, but the shape changes of the broad carbohydrate absorption band with maximum at 1080 cm−1,testifies the presence of other carbohydrates and in general fructose polymer form. The main differences
M. Grube et al. / Infrared spectra of some fructans 293
Table 1
Chemical composition of RAFTILINE, levan precipitate, fructan syrup
Component Concentration, %RAFTILINE ST
Inulin 93.9Glucose+ fructose 1.1Sucrose 5.0
Levan precipitateFructose 93.0Glucose 3.0Mannan 2.0
Fructan syrupCarbohydrates, total 65.0FOS 27.0Levan 7.0Sucrose 6.0Glucose+ fructose 22.0Water 35.0
The energetic value of 100 gfructan syrup 186 kcal or 776 kJ
Fig. 2. IR absorption spectra of RAFTILINE.
in fructose and levan precipitate spectra appeared in 800–600 cm−1 region that indicates the presence ofother carbohydrates and amino acids.
In the spectra of levan fructose does not show two separate sharp lines at 835 and 770 cm−1, but inthis region appears one broad band at 810 cm−1 that could result from overlapping of fructose, glucoseand mannan lines [11,16].
294 M. Grube et al. / Infrared spectra of some fructans
Fig. 3. IR absorption spectra of fructan syrup.
Levan precipitate IR-absorption spectra, showed an increase of broad absorption band at 1600 cm−1.This was interpreted as degradation of proteins, accompanied by an increase of absorption in 1600 cm−1
area caused by free amino acids, simultaneously causing decrease in the intensity of “ammonium” bandin 1410 cm−1 area and changing its shape [16]. A characteristic weak feature is often observed around1400 cm−1, which may be attributed to the symmetric stretching vibrations of COO− functional groupsof amino acid side chains, free fatty acids, or other derivatives [18]. Often the precipitates of extracel-lular polysaccharides contain negligible concentrations of nucleic acids, proteins, and free amino acids(0.3–3.0%). For evaluation of the purity of our levan precipitate the spectra was studied to find out thepresence of main biochemical components of the microbial cell. Previously we have shown that as thecharacteristic absorption bands could be used: 1080 cm−1 for carbohydrates, 1250 cm−1 for nucleicacids, 1550 cm−1 for proteins and 2930 cm−1 for lipids [12]. Assessment of levan precipitate spectrashowed that levan precipitate did not contain lipids, nucleic acids, but absorption bands in the principalcomponent characteristic band regions in fructose and levan precipitate spectra are of carbohydrate ori-gin, proving that the preparation is free of bacterial cells or their fractions. This investigation proved thatthe applied levan precipitation method allows obtaining preparation mainly consisting of fructose, withsmall amounts of amino acids and some other bacterial carbohydrates.
4. Conclusions
In the FT-IR spectra of crystalline fructose the most interesting are two sharp lines of a similar intensityin the “fingerprint region” at 835 and 770 cm−1. These lines could serve as characteristic in studies ofmixtures with fructan or identification of fructans in microbial biomass.
Fructan polymer inulin consists principally of linear chains of fructosyl units linked by aβ(2-1) bondsended by a glycosyl unit. The links between the molecules are of a very special type: theβ(2-1)-form (2),which makes these molecules indigestible for all higher animals [8] and possibly also bacteria. The
M. Grube et al. / Infrared spectra of some fructans 295
bacterial fructans of the levan type are high molecular weight polymers, i.e., they are composed ofβ-(2,6)-fructosyl-fructose linked molecules and side chains [17]. Bacteria can utilize levan apart frominulin. The FT-IR spectra of levan, apart from inulin’s, in the carbohydrate region 900–1200 cm−1,shows overlapping broad band with maximum at∼1030 cm−1 and stronger absorption at∼940 cm−1.The differences in both spectra could be caused by the structure and influence of glucose, sucrose andmannan.
It was shown that levan precipitate and fructose syrup does not contain lipids and nucleic acids andthe applied precipitation method allows obtaining a preparation mainly consisting of fructose. It wasshown that levan precipitate consists of 93% of fructose and admixture of glucose, mannan and enzyme-levansucrase. This admixture does not influence the value of the product and applicability in the func-tional foods.
References
[1] N.-G.L. Asp, Classification and methodology of food carbohydrates as related to nutritional effects,Amer. J. Clin. Nut.61(Suppl.) (1995), 930–937S.
[2] D.M. Back and P.L. Polavarapu, Fourier-transform Infrared spectroscopy of sugars. Structural changes in aqueous solu-tions,Carbohydrate Res.121 (1983), 308–311.
[3] M. Bekers, J. Laukevics, D. Upite, E. Kaminska, A. Vigants and U. Viesturs, Method for obtaining fructans from sucrose,Application of Latvian Patent P-00-173, 2000 (in Latvian).
[4] M. Bekers, J. Shvinka, J. Raipulis, M. Laivenieks, L. Pankova and I. Mezbarde, StrainZymomonas mobilis– producer oflevan, Patent of Latvia LV 5709, 1993 (in Latvian).
[5] M. Bekers, J. Shvinka, L. Pankova, M. Laivenieks and I. Mezbarde, Simultaneous sucrose bioconversion into ethanol andlevan byZymomonas mobilis, Appl. Biochem. Biotechnol.24/25 (1990), 265–274.
[6] J.J. Cael, J.L. Koenig and J. Blackwell, Infrared and Raman spectroscopy of carbohydrates,Carbohydr. Res.32 (1974),79–91.
[7] L.G. Cote and J. Ahlgren, Metabolism in microorganisms. Part I: Levan and levansucrase, in:Science and Technology ofFructans, M. Suzuki and N.J. Chatterton, eds, CRC Press, Boca Raton, 1993, pp. 141–168.
[8] P. Coussement, inulin and oligofructose as dietary fiber: analytical, nutritional and legal aspects, in:Complex Carbohy-drates in Foods, S.S. Cho, L. Prosky and M. Dreher, eds, Marcel Dekker, Inc., New York, 1999, pp. 203–212.
[9] P. Dysseler, D. Hoffem, J. Fockedey, B. Quemener, J.-F. Thibault and P. Coussement, Determination of inulin andoligofructose in food products, in:Complex Carbohydrates in Foods, S.S. Cho, L. Prosky and M. Dreher, eds, MarcelDekker, Inc., New York, 1999, pp. 213–227.
[10] M. Ernst, N.J. Chatterton, P. A. Harrison and G. Matitschka, Characterization of fructan oligomers from species of thegenusAllium L., Journal of Plant Physiology153 (1998), 53–60.
[11] M. Grube, M. Bekers, D. Upite and E. Kaminska, IR-spectroscopic studies ofZymomonas mobilisand levan precipitate,Vibrational Spectroscopy28 (2002), 277–285.
[12] M. Grube, J. Zagreba, E. Gromozova and M. Fomina, Comparative investigation of the macromolecular composition ofmycelia formsThielavia terrestrisby infrared spectroscopy,Vibrational Spectroscopy19 (1999), 301–306.
[13] U. Hettwer, M. Gross and K. Rudolph, Purification and characterization of an extracellular levansucrase fromPseudomonas syringae pv. Phaseolicola, Journal of Bacteriology177 (1995), 2834–2839.
[14] S. Kasapis, E.R. Morris, M. Gross and K. Rudolph, Solution properties of levan polysaccharide fromPseudomonas sy-ringae pv. phaseolicola, and its possible primary role as a blocker of recognition during pathogenesis,Carbohydr. Polymers23 (1994), 55–64.
[15] H.H. Mantsch, Historical survey of Infrared and Raman spectroscopy of biological materials, in:Infrared and RamanSpectroscopy of Biological Materials, H.U. Gremlich and B. Yan, eds, Marcel Dekker, Inc., NY, Basel, 2000, pp. 1–14.
[16] R.H. Marchessault, Application of infrared spectroscopy to cellulose and wood polysaccharides,Pure Appl. Chem.5(1962), 107–129.
[17] S.P. Marx, S. Winkler and W. Hartmeier, Fermentation of levan-oligosaccharides by differentBifidobacteriumspaces,Med. Fac. Landbouww. Univ. Gent 64/5a, 1999, 335–338.
[18] D. Naumann, FT-Infrared and FT-Raman spectroscopy in biomedical research, in:Infrared and Raman Spectroscopy ofBiological Materials, H.U. Gremlich and B. Yan, eds, Marcel Dekker, Inc., NY, Basel, 2000, pp. 323–377.
[19] L. Viikari, Carbohydrate metabolism inZymomonas, Crit. Rew. Biotechnol.7(3) (1988), 237–261.
296 M. Grube et al. / Infrared spectra of some fructans
[20] L. Viikari, Formation of levan and sorbitol from sucrose byZymomonas mobilis, Appl. Microbiol. Biotechnol.19 (1984),252–255.
[21] J.W. White, C.R. Eddy, J. Petty and N. Hoban, Infrared identification of disaccharides,Anal. Chem.20(4) (1958), 506–510.[22] Y. Yamamoto, Y. Takashi, M. Kawano, M. Jizuka, T. Matsumoti, S. Seiki and H. Yamaguchi,In vitro digestibility and
fermentability of levan and its hypocholesterolic effects in rats,J. Nutr. Biochem.10 (1999), 13–18.[23] J. Yun, Fructooligosaccharides – occurrence, preparation and application,Enzyme Microbiol. Technol.19 (1996), 107–117.

Submit your manuscripts athttp://www.hindawi.com
Hindawi Publishing Corporationhttp://www.hindawi.com Volume 2014
Inorganic ChemistryInternational Journal of
Hindawi Publishing Corporation http://www.hindawi.com Volume 2014
International Journal ofPhotoenergy
Hindawi Publishing Corporationhttp://www.hindawi.com Volume 2014
Carbohydrate Chemistry
International Journal of
Hindawi Publishing Corporationhttp://www.hindawi.com Volume 2014
Journal of
Chemistry
Hindawi Publishing Corporationhttp://www.hindawi.com Volume 2014
Advances in
Physical Chemistry
Hindawi Publishing Corporationhttp://www.hindawi.com
Analytical Methods in Chemistry
Journal of
Volume 2014
Bioinorganic Chemistry and ApplicationsHindawi Publishing Corporationhttp://www.hindawi.com Volume 2014
SpectroscopyInternational Journal of
Hindawi Publishing Corporationhttp://www.hindawi.com Volume 2014
The Scientific World JournalHindawi Publishing Corporation http://www.hindawi.com Volume 2014
Medicinal ChemistryInternational Journal of
Hindawi Publishing Corporationhttp://www.hindawi.com Volume 2014
Chromatography Research International
Hindawi Publishing Corporationhttp://www.hindawi.com Volume 2014
Applied ChemistryJournal of
Hindawi Publishing Corporationhttp://www.hindawi.com Volume 2014
Hindawi Publishing Corporationhttp://www.hindawi.com Volume 2014
Theoretical ChemistryJournal of
Hindawi Publishing Corporationhttp://www.hindawi.com Volume 2014
Journal of
Spectroscopy
Analytical ChemistryInternational Journal of
Hindawi Publishing Corporationhttp://www.hindawi.com Volume 2014
Journal of
Hindawi Publishing Corporationhttp://www.hindawi.com Volume 2014
Quantum Chemistry
Hindawi Publishing Corporationhttp://www.hindawi.com Volume 2014
Organic Chemistry International
ElectrochemistryInternational Journal of
Hindawi Publishing Corporation http://www.hindawi.com Volume 2014
Hindawi Publishing Corporationhttp://www.hindawi.com Volume 2014
CatalystsJournal of