Embed Size (px)
Citation preview

Information Visualization for Medical Informatics: Overview, Search & Summary for Electronic Health Records
Ben Shneiderman [email protected]
Catherine Plaisant [email protected]
Human-Computer Interaction Lab,
Institute for Advanced Computer Studies
Interdisciplinary research community
- Computer Science & Info Studies
- Psych, Socio, Poli Sci & MITH
(www.cs.umd.edu/hcil)
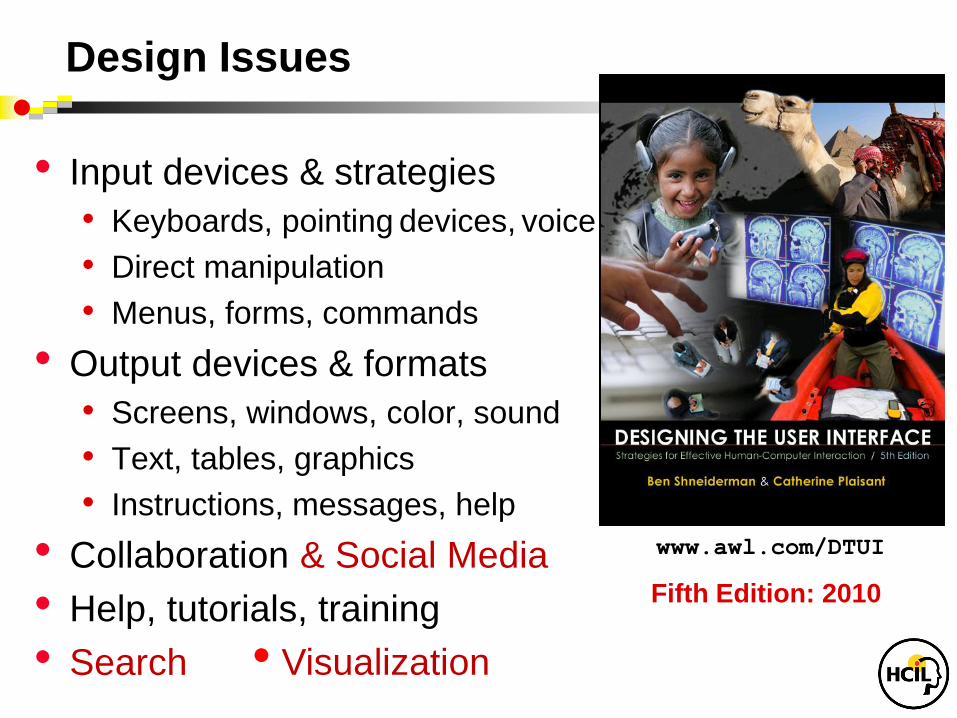
Design Issues
• Input devices & strategies
• Keyboards, pointing devices, voice
• Direct manipulation
• Menus, forms, commands
• Output devices & formats
• Screens, windows, color, sound
• Text, tables, graphics
• Instructions, messages, help
• Collaboration & Social Media
• Help, tutorials, training
• Search
www.awl.com/DTUI
Fifth Edition: 2010
• Visualization
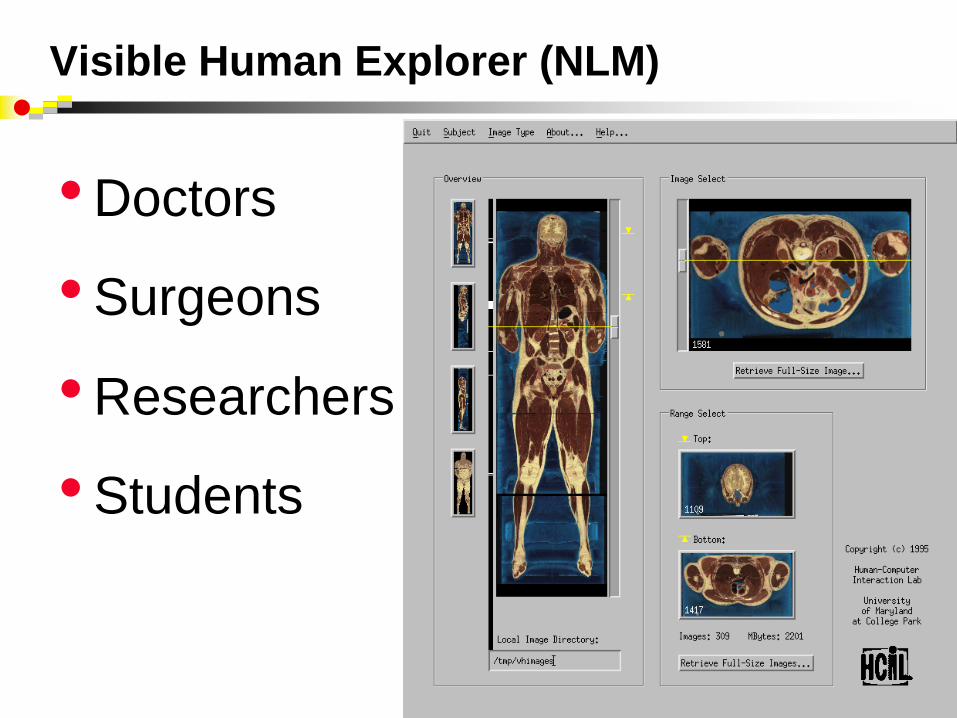
Visible Human Explorer (NLM)
• Doctors
• Surgeons
• Researchers
• Students
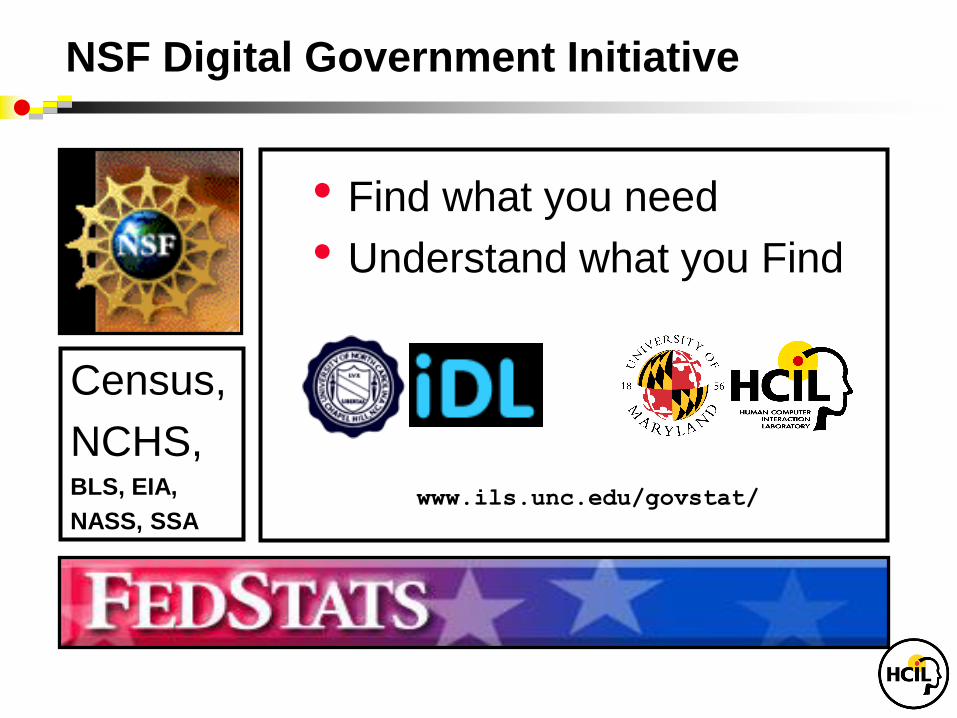
NSF Digital Government Initiative
• Find what you need
• Understand what you Find
www.ils.unc.edu/govstat/
Census,
NCHS, BLS, EIA,
NASS, SSA
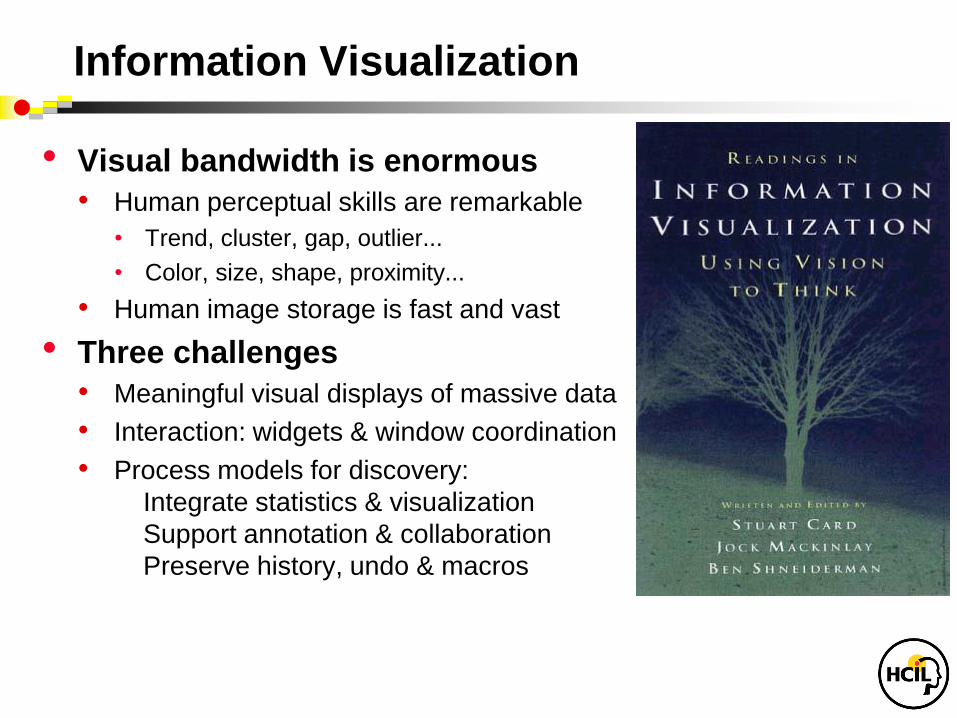
Information Visualization
• Visual bandwidth is enormous
• Human perceptual skills are remarkable
• Trend, cluster, gap, outlier...
• Color, size, shape, proximity...
• Human image storage is fast and vast
• Three challenges
• Meaningful visual displays of massive data
• Interaction: widgets & window coordination
• Process models for discovery:
Integrate statistics & visualization
Support annotation & collaboration
Preserve history, undo & macros

Anscombe’s Quartet
1 2 3 4
x y x y x y x y
10.0 8.04 10.0 9.14 10.0 7.46 8.0 6.58
8.0 6.95 8.0 8.14 8.0 6.77 8.0 5.76
13.0 7.58 13.0 8.74 13.0 12.74 8.0 7.71
9.0 8.81 9.0 8.77 9.0 7.11 8.0 8.84
11.0 8.33 11.0 9.26 11.0 7.81 8.0 8.47
14.0 9.96 14.0 8.10 14.0 8.84 8.0 7.04
6.0 7.24 6.0 6.13 6.0 6.08 8.0 5.25
4.0 4.26 4.0 3.10 4.0 5.39 19.0 12.50
12.0 10.84 12.0 9.13 12.0 8.15 8.0 5.56
7.0 4.82 7.0 7.26 7.0 6.42 8.0 7.91
5.0 5.68 5.0 4.74 5.0 5.73 8.0 6.89
Property Value
Mean of x 9.0
Variance of x 11.0
Mean of y 7.5
Variance of y 4.12
Correlation 0.816
Linear regression y = 3 + 0.5x
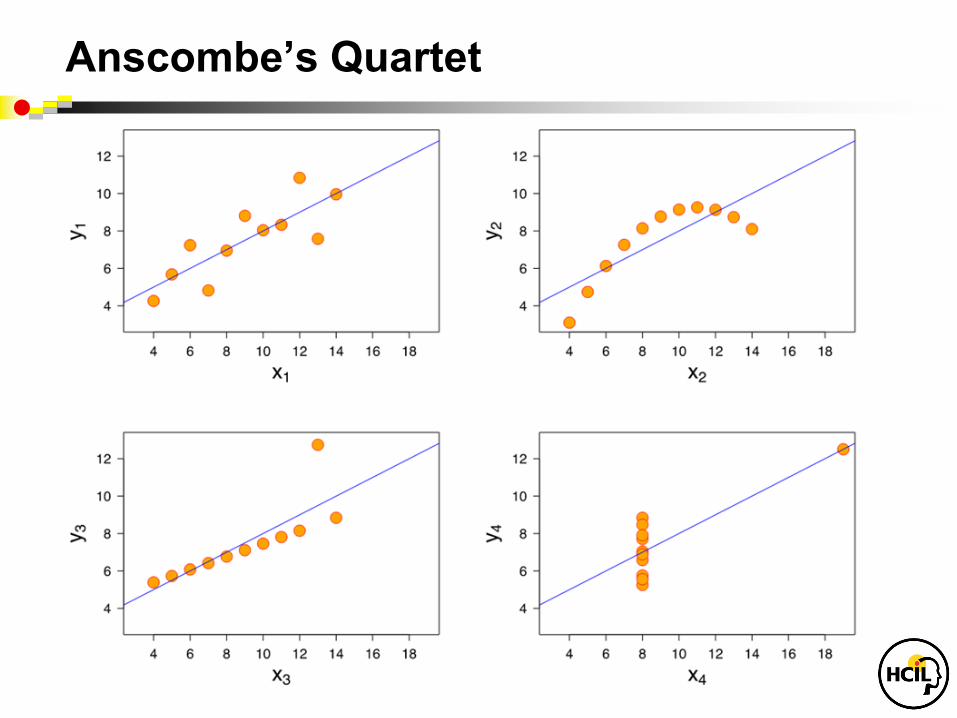
Anscombe’s Quartet
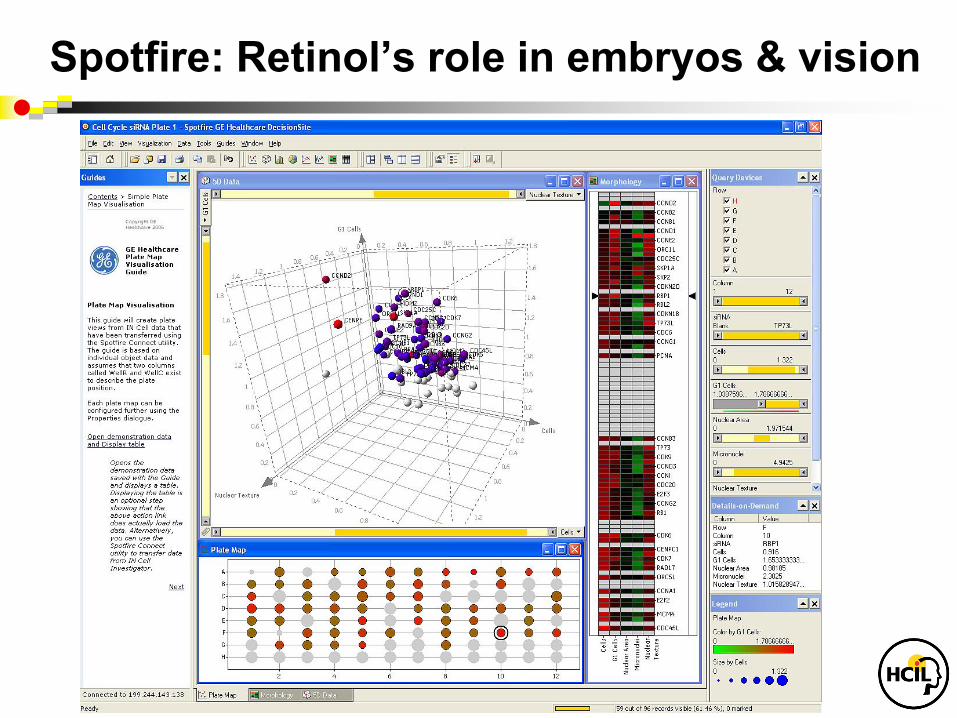
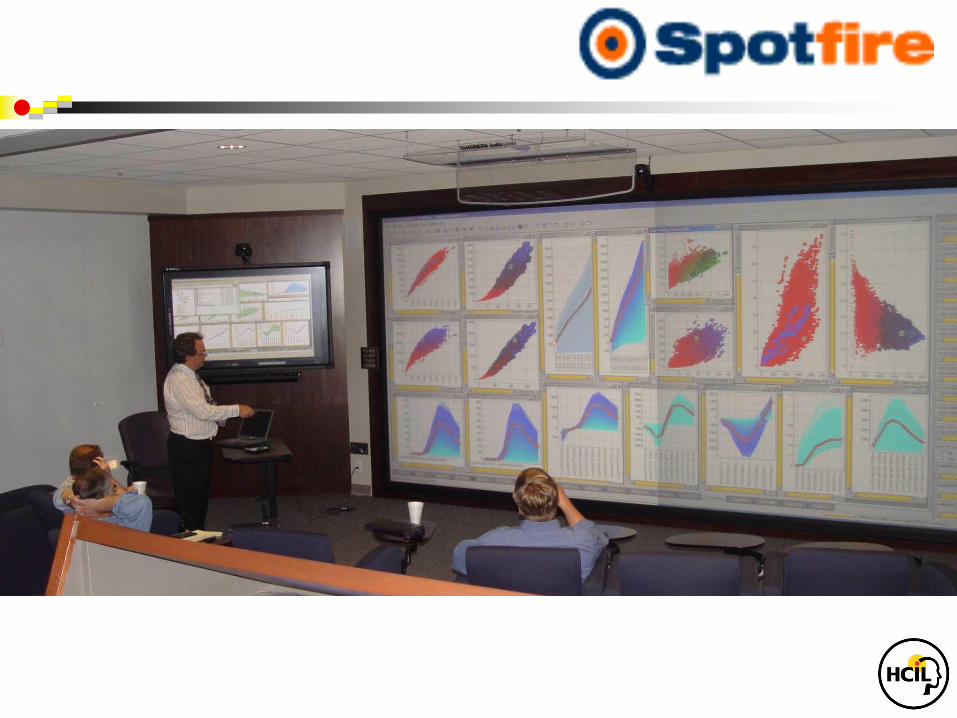
Spotfire: Retinol’s role in embryos & vision

Spotfire: DC natality data
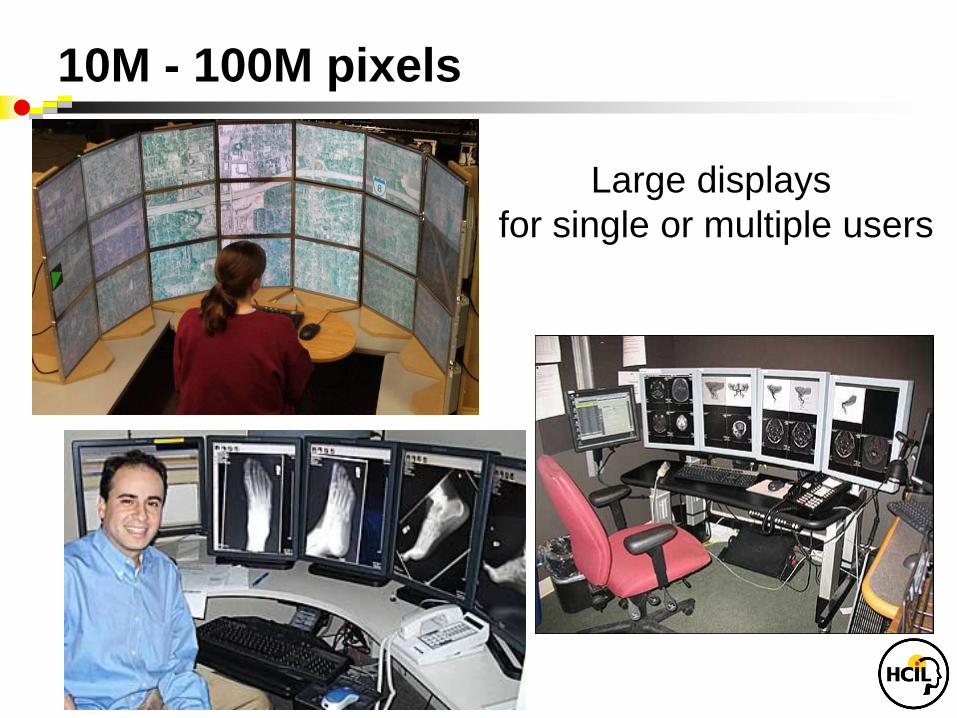
10M - 100M pixels
Large displays
for single or multiple users
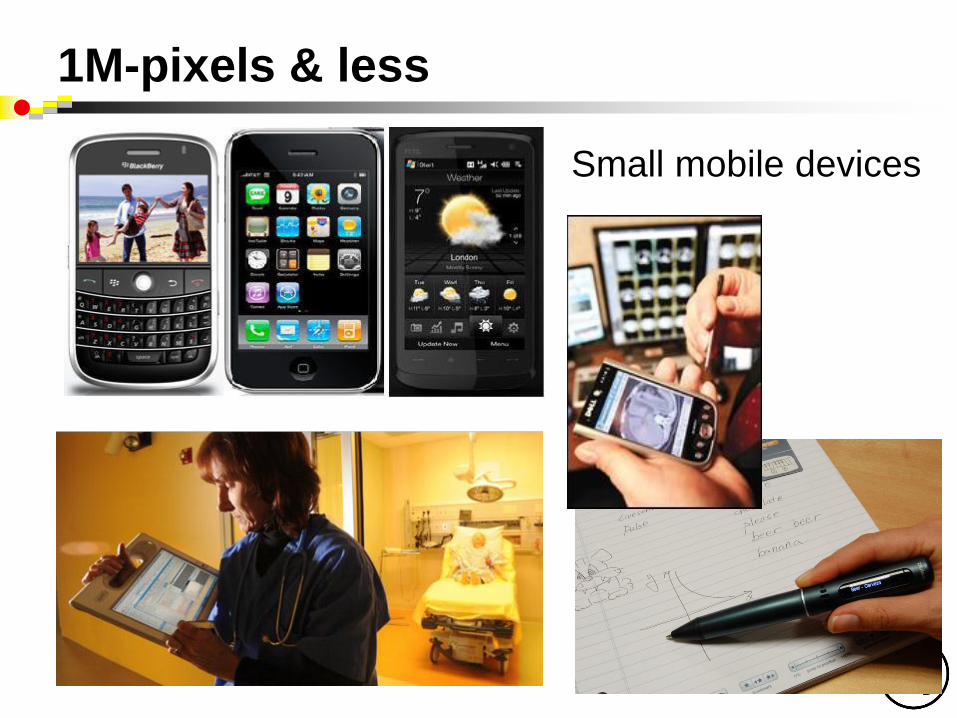
1M-pixels & less
Small mobile devices
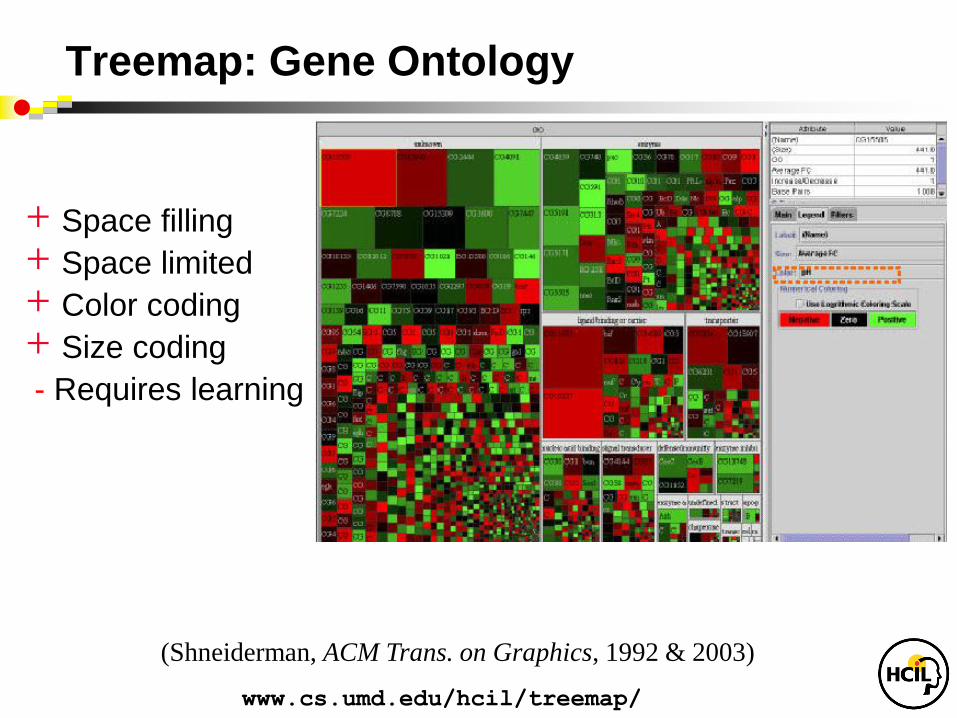
Treemap: Gene Ontology
www.cs.umd.edu/hcil/treemap/
+ Space filling
+ Space limited
+ Color coding
+ Size coding
- Requires learning
(Shneiderman, ACM Trans. on Graphics, 1992 & 2003)

Treemap: WHC Emergency Room (6304 patients in Jan2006)
Group by Admissions/MF, size by service time, color by age

Treemap: WHC Emergency Room (6304 patients in Jan2006) (only those service time >12 hours)
Group by Admissions/MF, size by service time, color by age
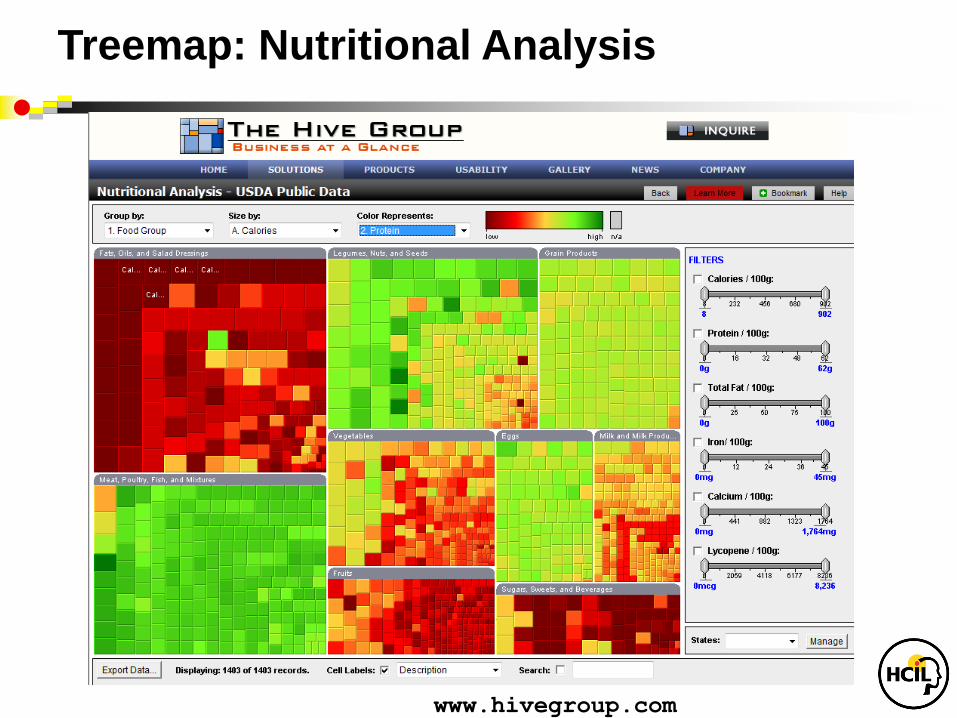
www.hivegroup.com
Treemap: Nutritional Analysis
newsmap.jp
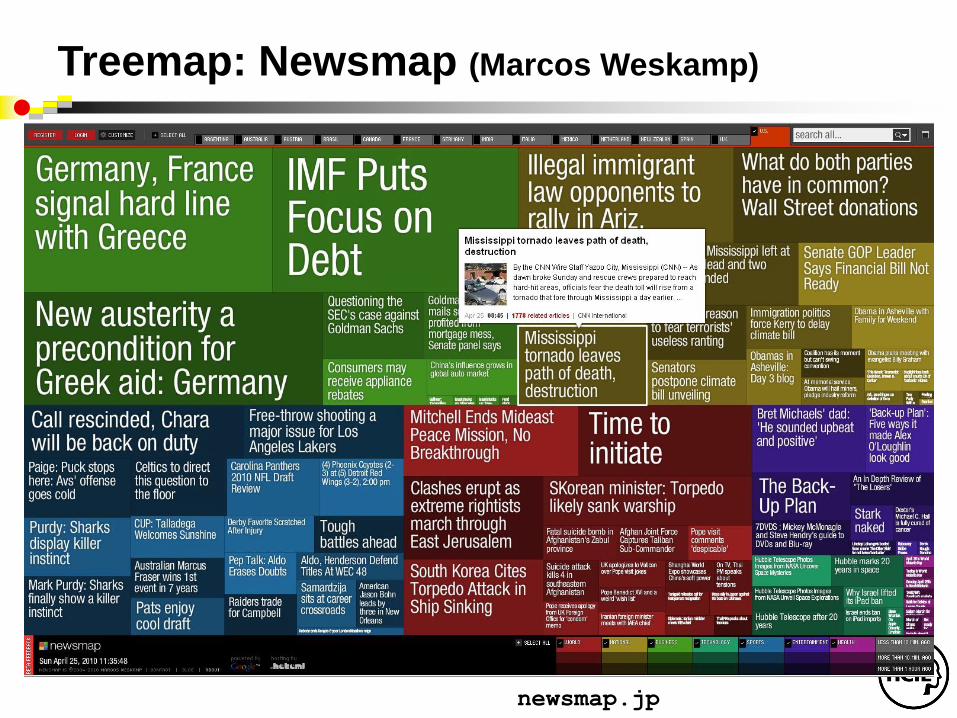
Treemap: Newsmap (Marcos Weskamp)
newsmap.jp
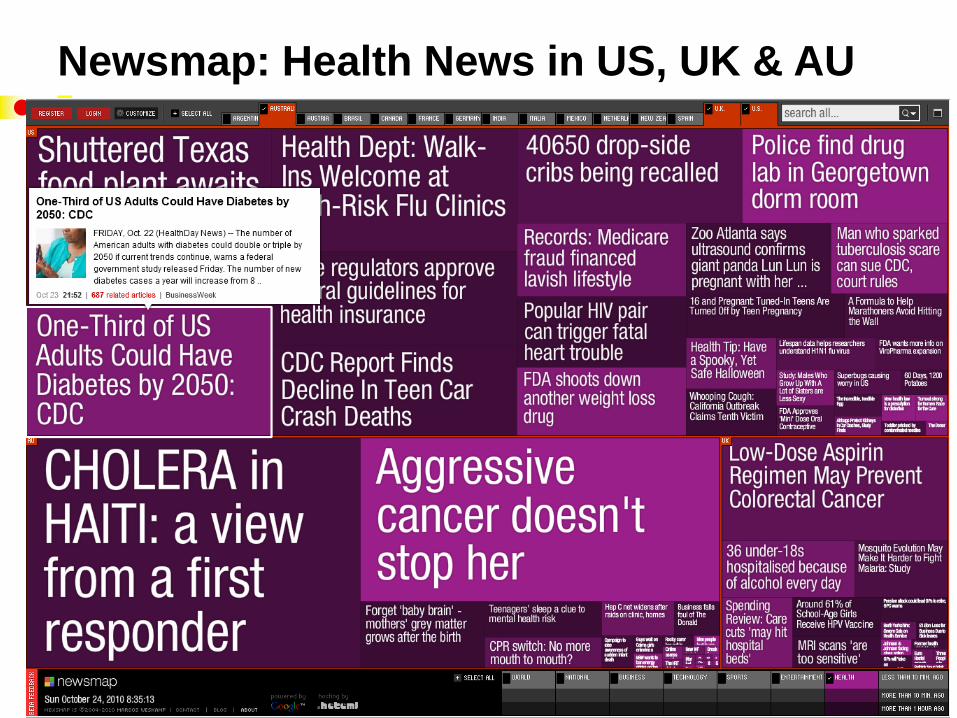
Newsmap: Health News in US, UK & AU
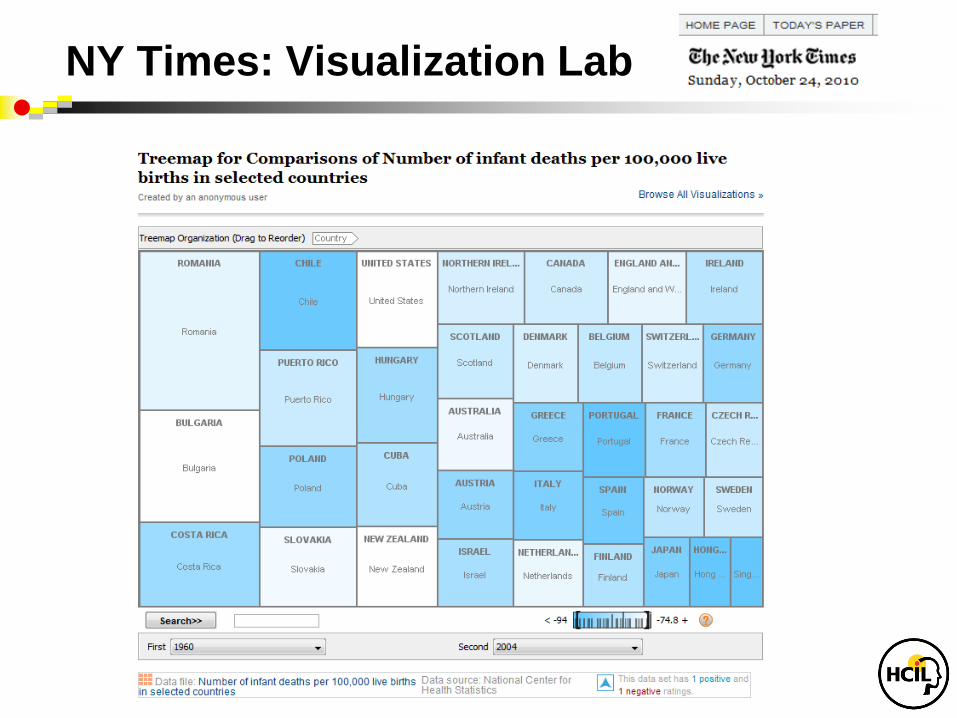
NY Times: Visualization Lab
www.cs.umd.edu/hcil/treemap/
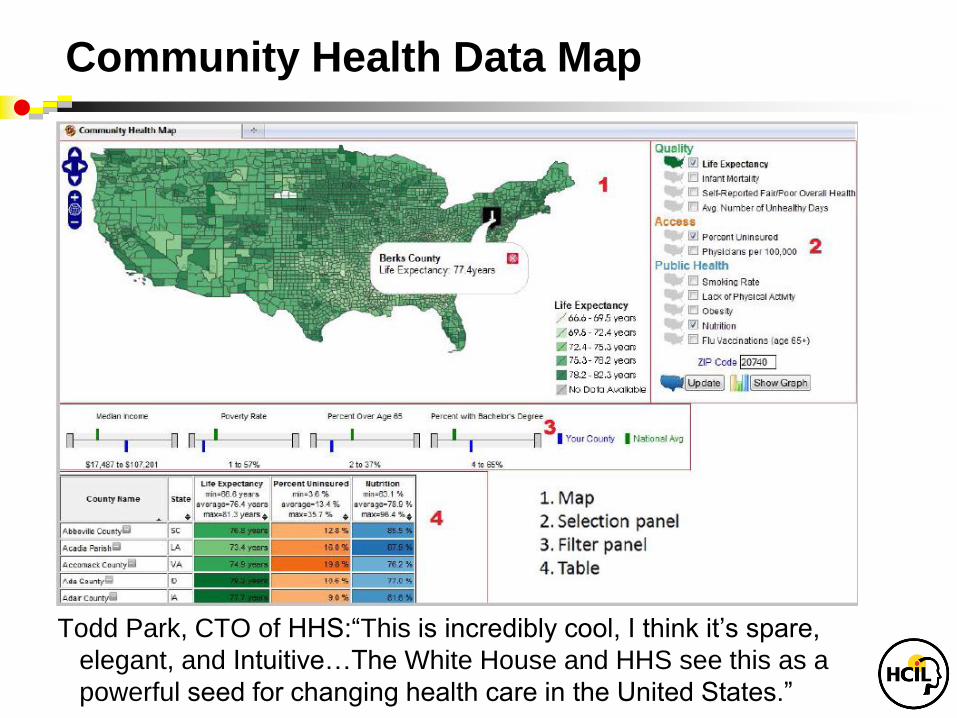
Community Health Data Map
Todd Park, CTO of HHS:“This is incredibly cool, I think it’s spare,
elegant, and Intuitive…The White House and HHS see this as a
powerful seed for changing health care in the United States.”

Temporal Data: TimeSearcher 1.3
• Time series
• Stocks
• Weather
• Genes
• User-specified
patterns
• Rapid search

Temporal Data: TimeSearcher 2.0
• Long Time series (>10,000 time points)
• Multiple variables
• Controlled precision in match
(Linear, offset, noise, amplitude)
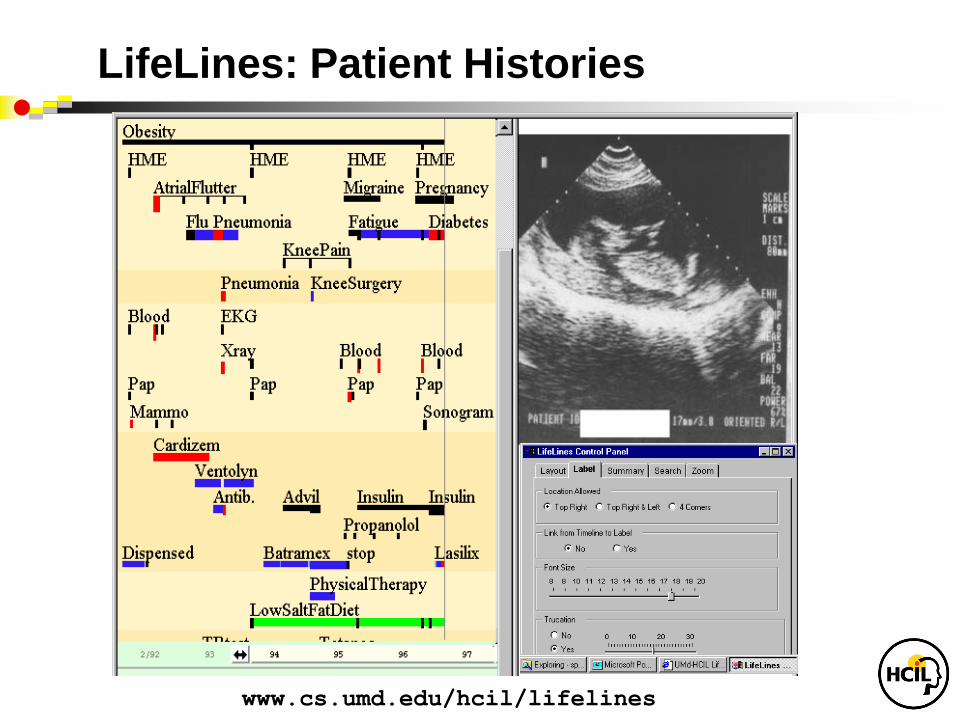
LifeLines: Patient Histories
www.cs.umd.edu/hcil/lifelines

LifeLines2: Contrast+Creatine
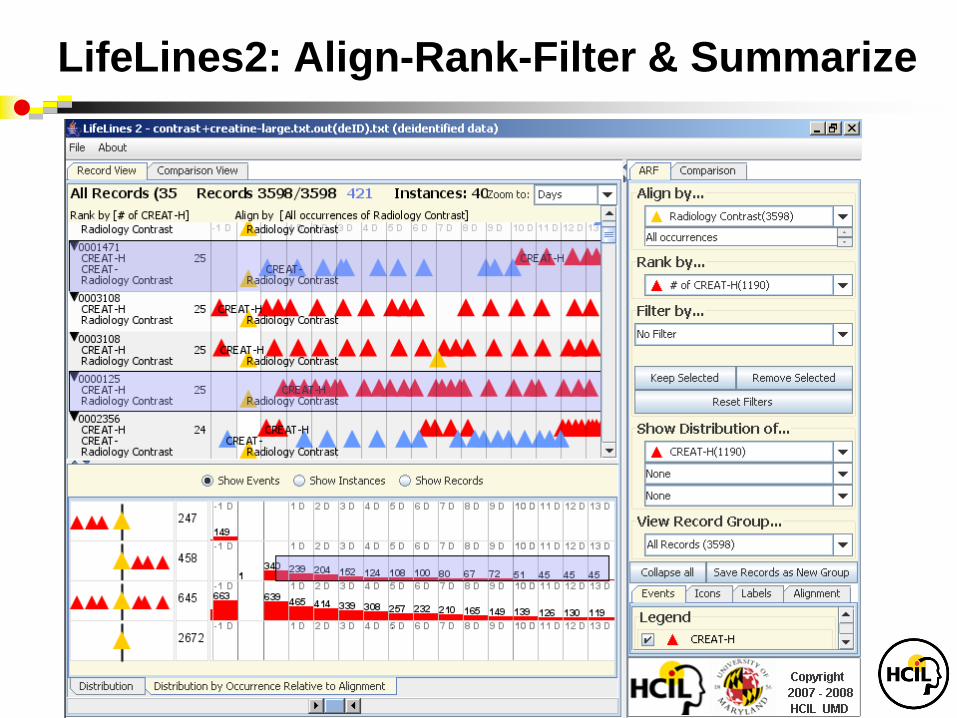
LifeLines2: Align-Rank-Filter & Summarize
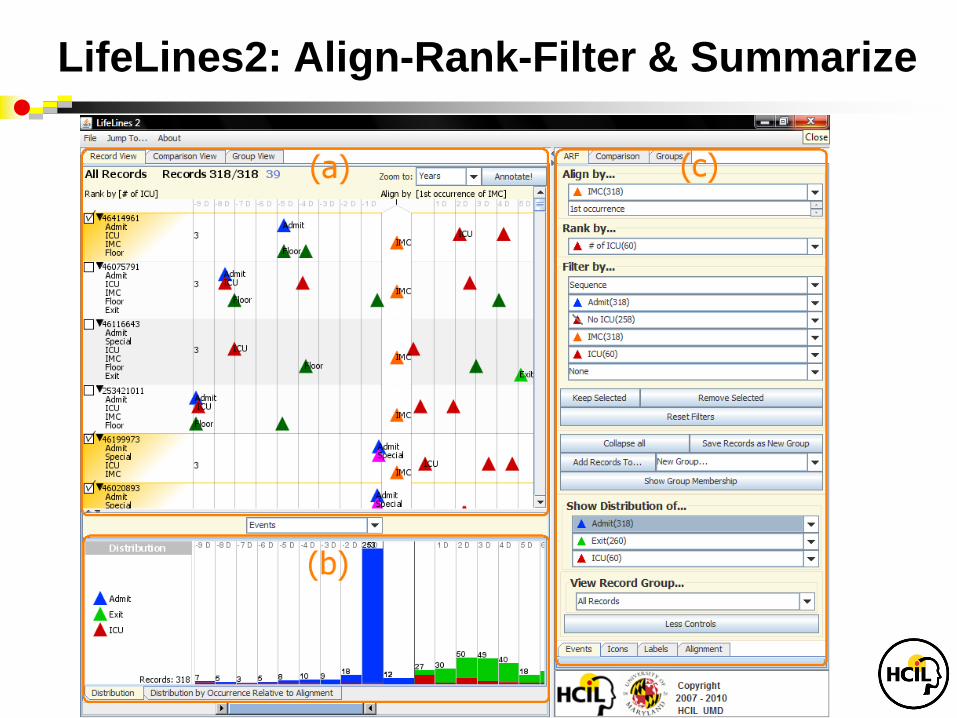
LifeLines2: Align-Rank-Filter & Summarize
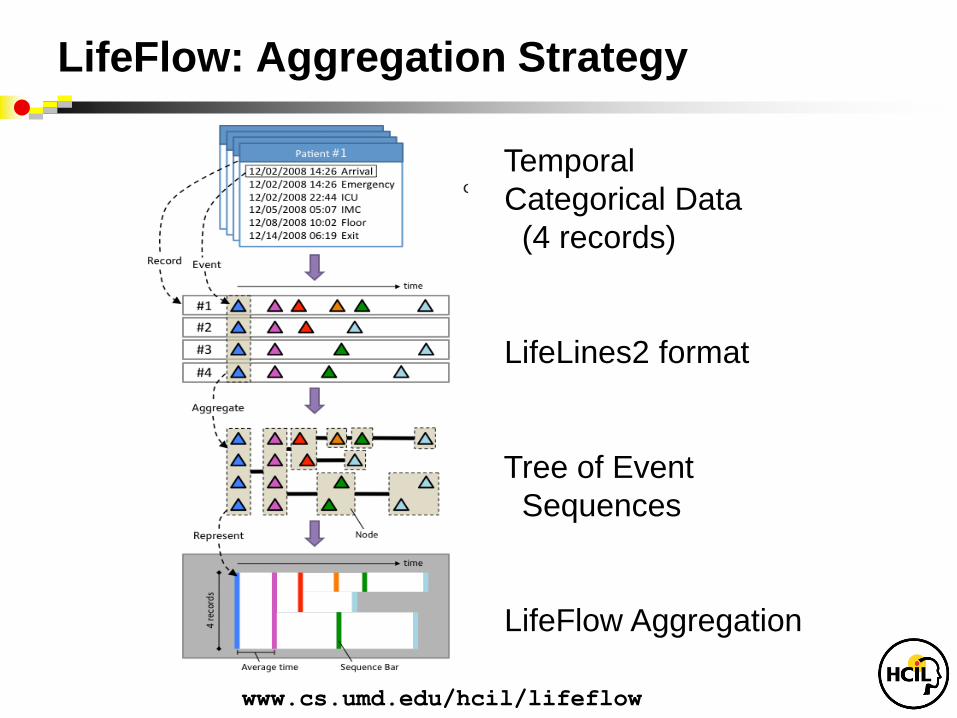
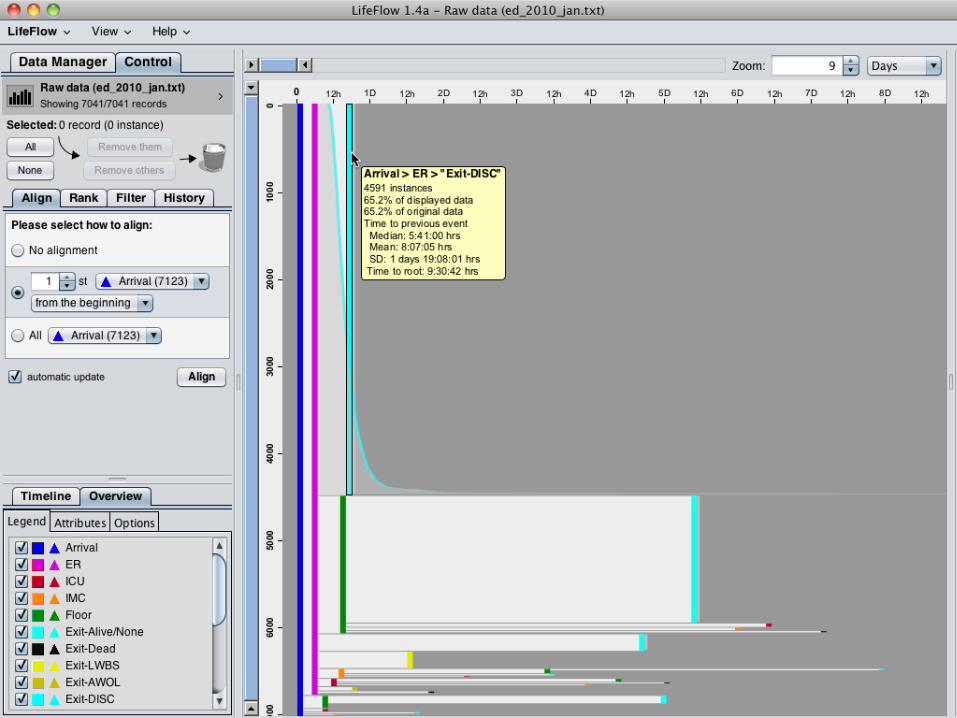
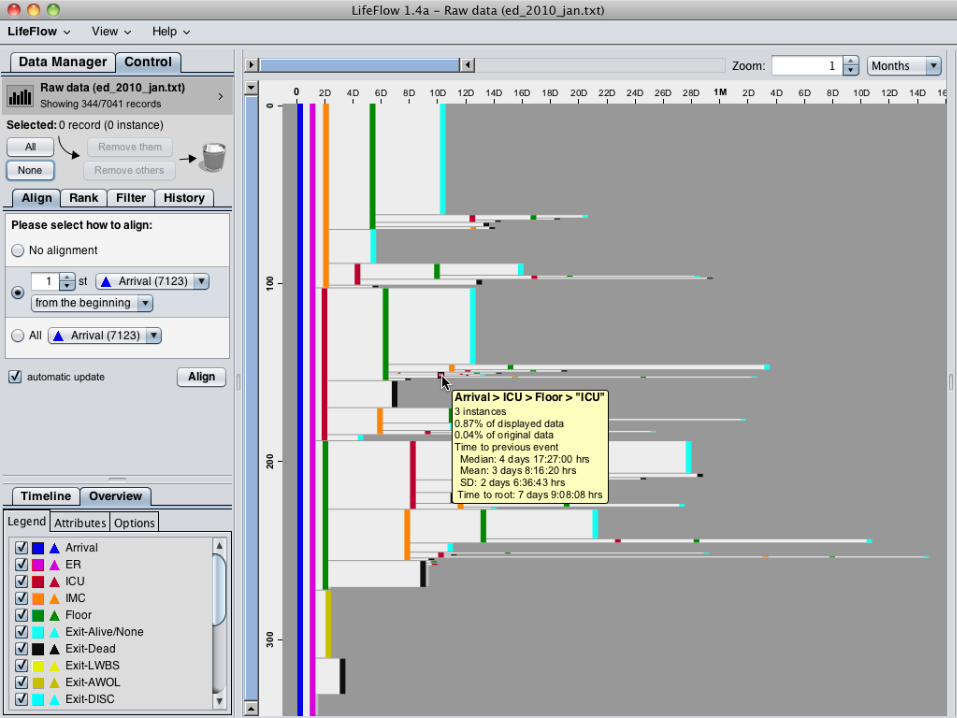
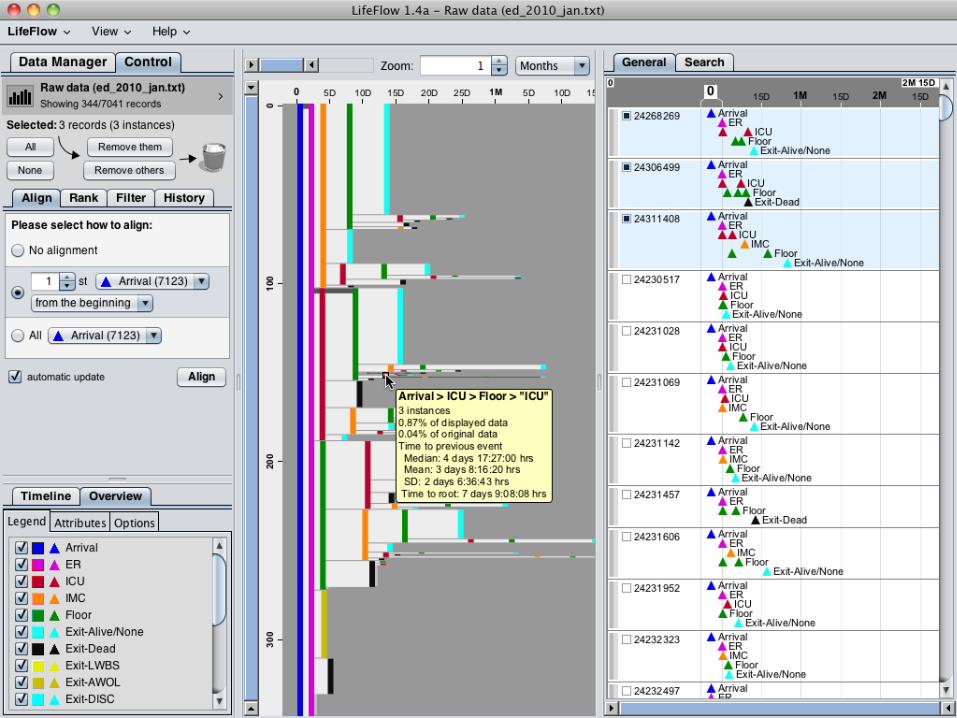
LifeFlow: Aggregation Strategy
Temporal
Categorical Data
(4 records)
LifeLines2 format
Tree of Event
Sequences
LifeFlow Aggregation
www.cs.umd.edu/hcil/lifeflow
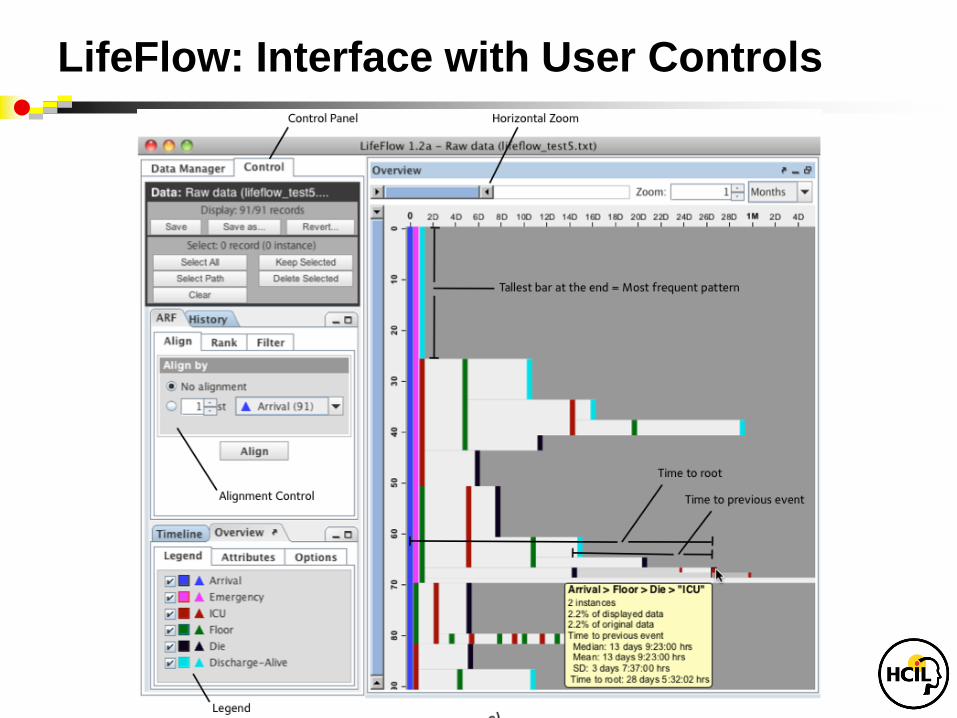
LifeFlow: Interface with User Controls
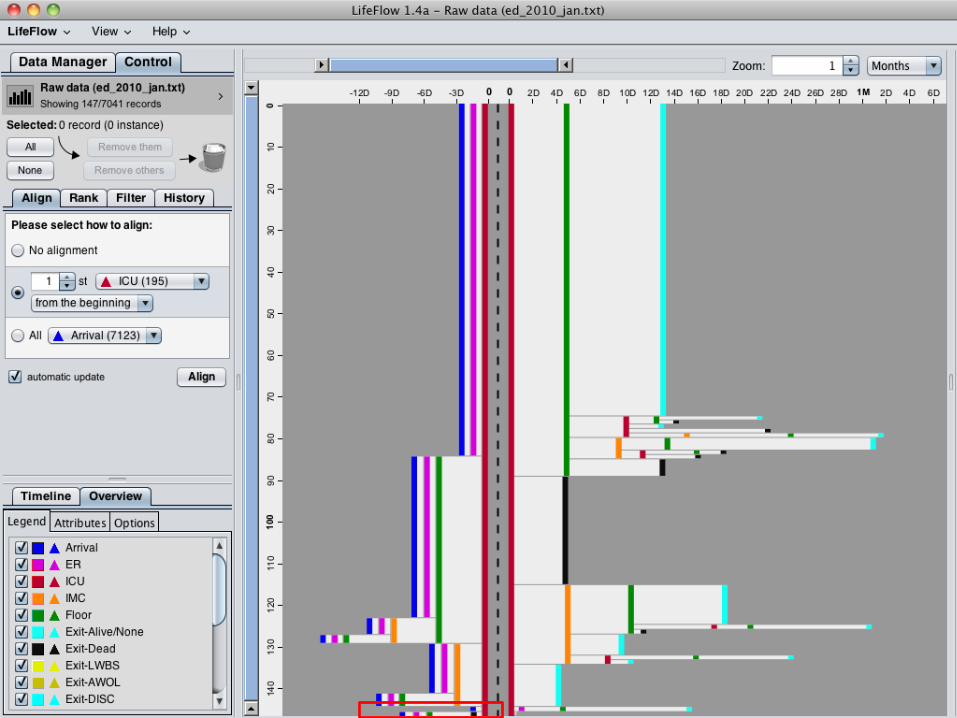
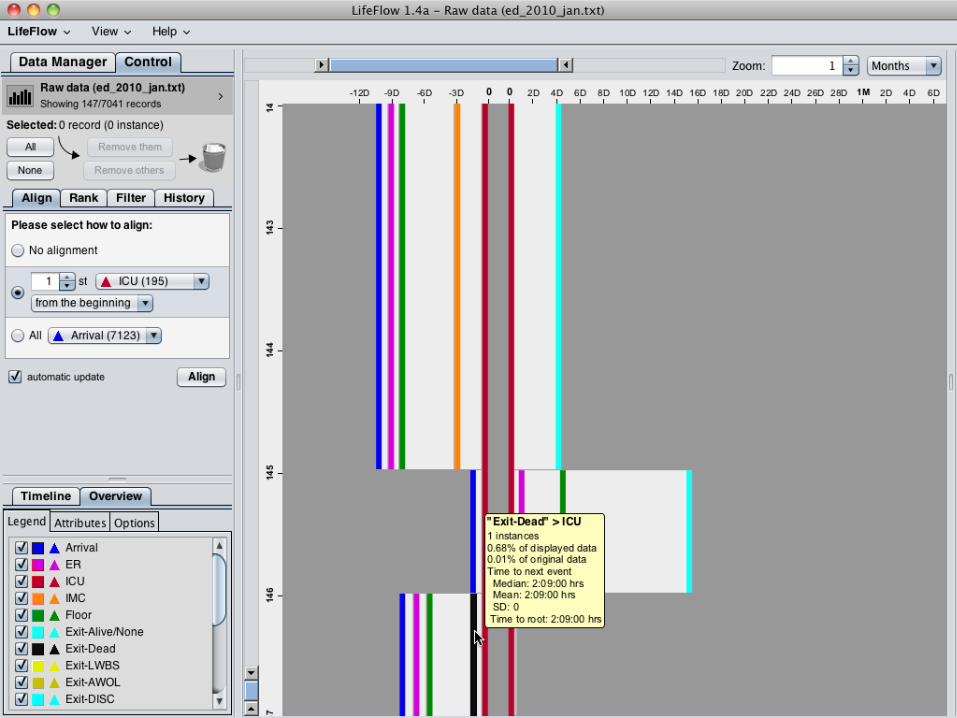

Process Model: Temporal Event Analysis
• Data acquisition, wrangling & cleaning
• Examine data in visualization
• Exploratory Search
• Systematically, yet flexibly apply visual operators
• Deal with unexpected findings
• Analysis & Explanation
• Determine to what extent the questions are answered
• System & data limitations
• Refine existing questions
• Report to colleagues
• Document discoveries & disseminate results
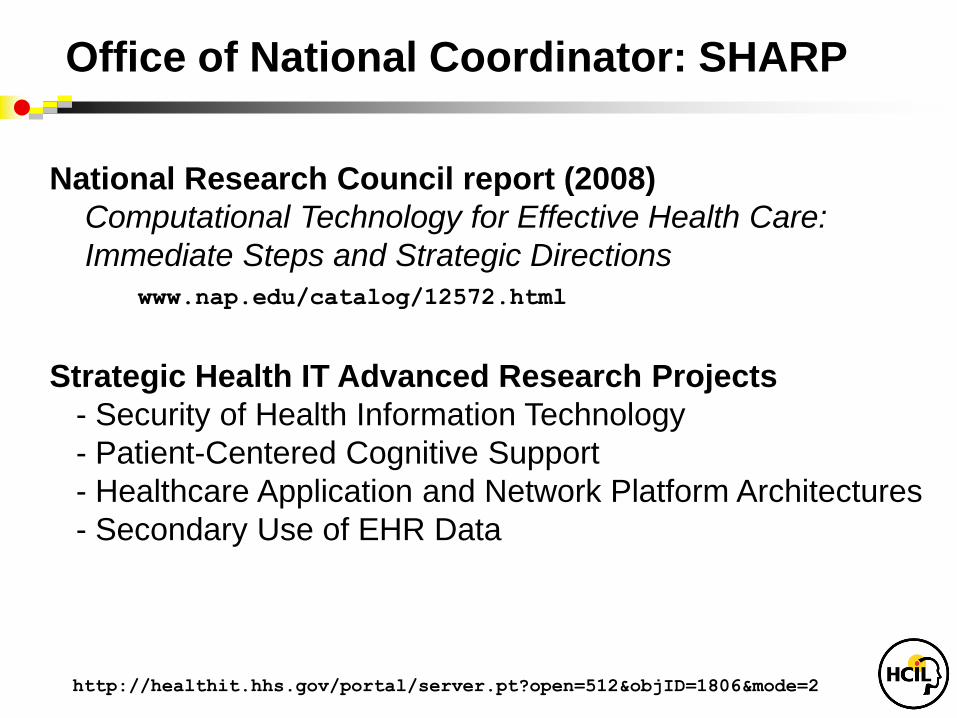
Office of National Coordinator: SHARP
http://healthit.hhs.gov/portal/server.pt?open=512&objID=1806&mode=2
Strategic Health IT Advanced Research Projects
- Security of Health Information Technology
- Patient-Centered Cognitive Support
- Healthcare Application and Network Platform Architectures
- Secondary Use of EHR Data
National Research Council report (2008)
Computational Technology for Effective Health Care:
Immediate Steps and Strategic Directions
www.nap.edu/catalog/12572.html

National Center for Cognitive Informatics &
Decision Making in Healthcare
Sharpc.org
Work-Centered Design of Care Process Improvements in HIT
Cognitive Foundations for Decision Making: Implications for Decision Support
Modeling of Setting-Specific Factors to Enhance Clinical Decision Support
Adaptation
Automated Model-Based Clinical Summarization of Key Patient Data
Cognitive Information Design and Visualization: Enhancing Accessibility and
Understanding of Patient Data : Construct an interface which supports the integration of clinical understanding,
decision making, and problem solving. This project will also provide metrics
to evaluate and compare the efficacy of this open-source interface as compared
to commercial interfaces
UMD HCIL Early Directions
Missing Laboratory Reports
Medication Reconciliation
Alarms and Alerts Management
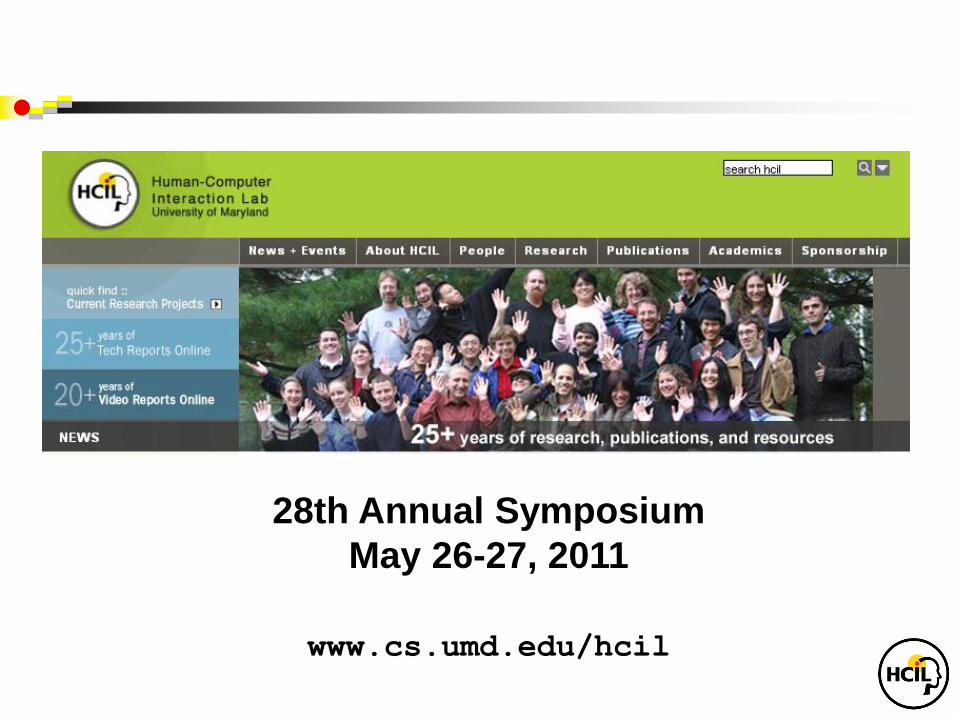
28th Annual Symposium
May 26-27, 2011
www.cs.umd.edu/hcil
For More Information
• Visit the HCIL website for 400 papers & info on videos
www.cs.umd.edu/hcil
• Conferences & resources: www.infovis.org
• See Chapter 14 on Info Visualization
Shneiderman, B. and Plaisant, C., Designing the User Interface:
Strategies for Effective Human-Computer Interaction:
Fifth Edition (March 2009) www.awl.com/DTUI
• Edited Collections:
Card, S., Mackinlay, J., and Shneiderman, B. (1999)
Readings in Information Visualization: Using Vision to Think
Bederson, B. and Shneiderman, B. (2003)
The Craft of Information Visualization: Readings and Reflections
For More Information
• Treemaps • HiveGroup: www.hivegroup.com
• Smartmoney: www.smartmoney.com/marketmap
• HCIL Treemap 4.0: www.cs.umd.edu/hcil/treemap
• Spotfire: www.spotfire.com
• TimeSearcher: www.cs.umd.edu/hcil/timesearcher
• NodeXL: nodexl.codeplex.com
• Hierarchical Clustering Explorer: www.cs.umd.edu/hcil/hce
• LifeLines2: www.cs.umd.edu/hcil/lifelines2
• Similan: www.cs.umd.edu/hcil/similan