Embed Size (px)
Citation preview
Information TechnologyInformation Technology
Presented by (in order of presentation):José Coutinho
João SilvaAna PaivaInês Costa
Marco Bravo
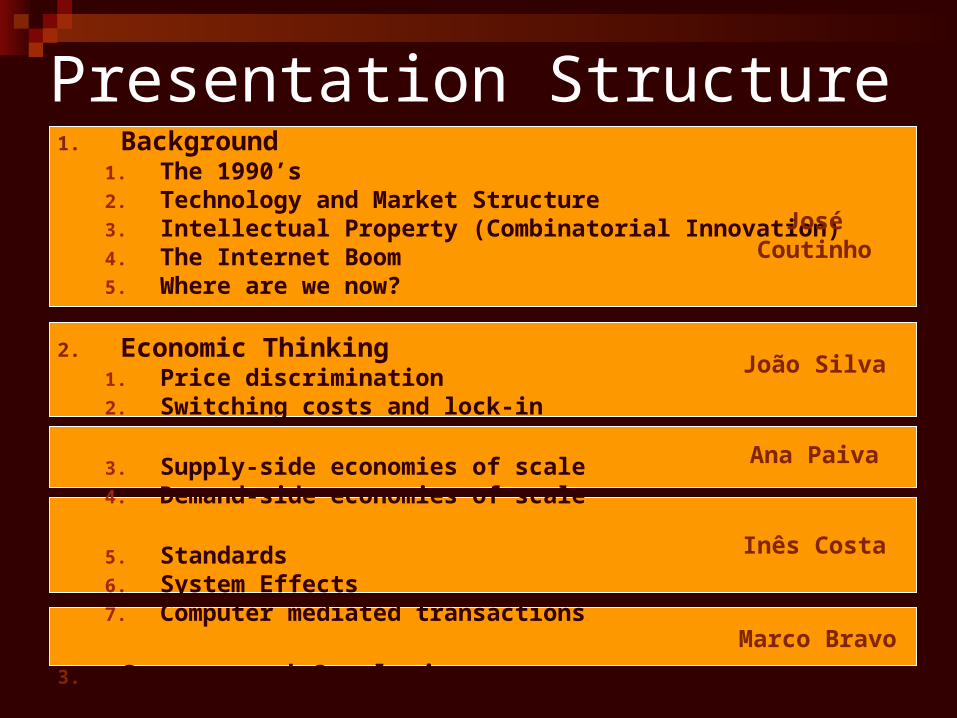
Presentation Structure1. Background
1. The 1990’s2. Technology and Market Structure3. Intellectual Property (Combinatorial Innovation)4. The Internet Boom5. Where are we now?
2. Economic Thinking1. Price discrimination2. Switching costs and lock-in
3. Supply-side economies of scale4. Demand-side economies of scale
5. Standards6. System Effects7. Computer mediated transactions
3. Summary and Conclusions
José Coutinho
João Silva
Ana Paiva
Inês Costa
Marco Bravo
1. BackgroundProgress
1
1.1
1.2
1.3
1.4
1.5
2.
2.1
2.2
2.3
2.4
2.5
2.6
2.7
3
1990s Technology and Market Structure Combinatorial innovation The Internet Boom Where are we now?
The 1990’sProgress
1
1.1
1.2
1.3
1.4
1.5
2
2.1
2.2
2.3
2.4
2.5
2.6
2.7
3
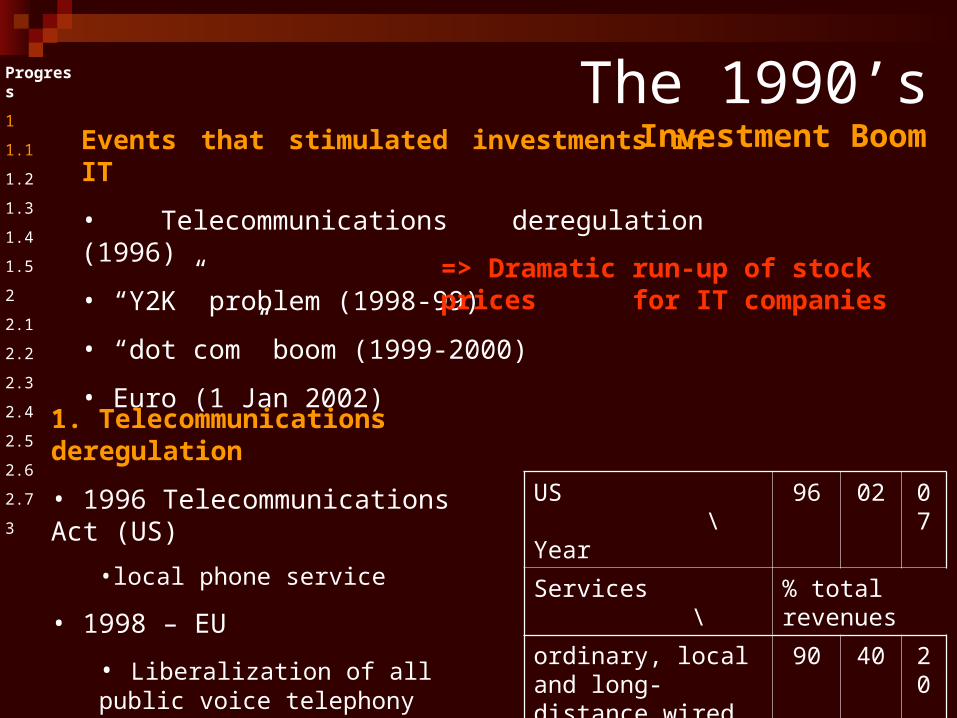
Events that stimulated investments in IT
• Telecommunications deregulation (1996)
• “Y2K” problem (1998-99)
• “dot com” boom (1999-2000)
• Euro (1 Jan 2002)
Investment Boom
US \ Year 96 02 07
Services \ % total revenues
ordinary, local and long-distance wired voice calls
90 40 20
wireless 30 40
data 30 40
1. Telecommunications deregulation
• 1996 Telecommunications Act (US)
•local phone service
• 1998 – EU
• Liberalization of all public voice telephony services
• 2000 – Portugal
=> Dramatic run-up of stock prices for IT companies
The 1990’sProgress
1
1.1
1.2
1.3
1.4
1.5
2
2.1
2.2
2.3
2.4
2.5
2.6
2.7
3
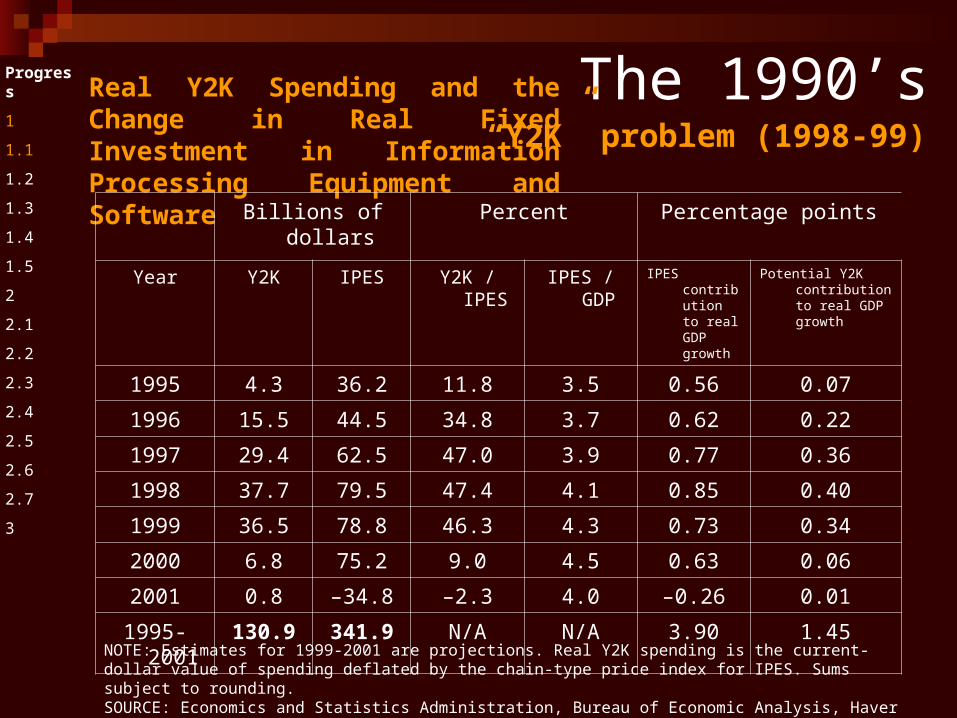
Real Y2K Spending and the Change in Real Fixed Investment in Information Processing Equipment and Software
“Y2K” problem (1998-99)
Billions of dollars Percent Percentage points
Year Y2K IPES Y2K / IPES IPES / GDP IPES contribution to real GDP growth
Potential Y2K contribution to real GDP growth
1995 4.3 36.2 11.8 3.5 0.56 0.07
1996 15.5 44.5 34.8 3.7 0.62 0.22
1997 29.4 62.5 47.0 3.9 0.77 0.36
1998 37.7 79.5 47.4 4.1 0.85 0.40
1999 36.5 78.8 46.3 4.3 0.73 0.34
2000 6.8 75.2 9.0 4.5 0.63 0.06
2001 0.8 –34.8 –2.3 4.0 –0.26 0.01
1995-2001 130.9 341.9 N/A N/A 3.90 1.45NOTE: Estimates for 1999-2001 are projections. Real Y2K spending is the current-dollar value of spending deflated by the chain-type price index for IPES. Sums subject to rounding.SOURCE: Economics and Statistics Administration, Bureau of Economic Analysis, Haver Analytics, and the author’s calculations (final column).
The 1990’sProgress
1
1.1
1.2
1.3
1.4
1.5
2
2.1
2.2
2.3
2.4
2.5
2.6
2.7
3
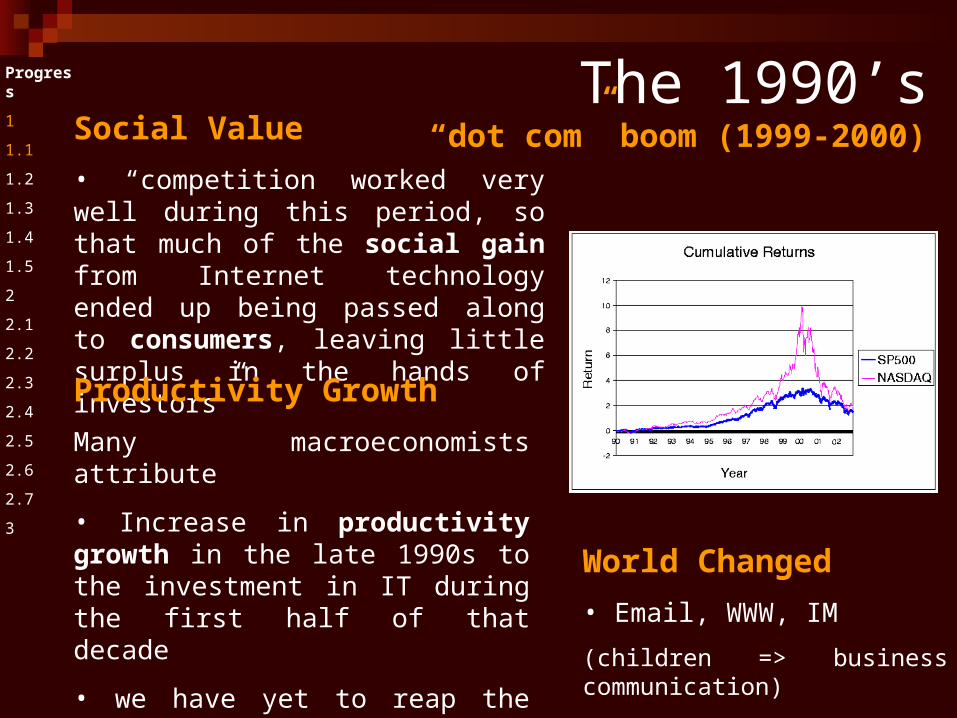
Social Value• “competition worked very well during this period, so that much of the social gain from Internet technology ended up being passed along to consumers, leaving little surplus in the hands of investors”
“dot com” boom (1999-2000)
Productivity Growth
Many macroeconomists attribute
• Increase in productivity growth in the late 1990s to the investment in IT during the first half of that decade
• we have yet to reap the benefits of the IT investment of the late 1990s
World Changed• Email, WWW, IM
(children => business communication)
Technologyand Market Structure
Progress
1
1.1
1.2
1.3
1.4
1.5
2
2.1
2.2
2.3
2.4
2.5
2.6
2.7
3
THE SAME MARKET FORCES
• High-technology industries
• Other industries
Some are particularly important• Network industries in 1990s• Telephone and wireless in the 1890s
Minor => industrial economy
Critical => Information economy
Other Qt / Intellectual property
Copyright law
Patent law
Policy issues
Security, and Privacy
Ex: Cost Structures
• Constant fixed costs
• Zero marginal costs
Rarely observed for physical products
• Capacity constraints in nearly every production process
Very common for information goods
(indeed it is the baseline)
• Information goods
• Physical goods - Chips
Combinatorial innovationProgress
1
1.1
1.2
1.3
1.4
1.5
2
2.1
2.2
2.3
2.4
2.5
2.6
2.7
3
“Every now and then a technology, or set of technologies, comes along that offers a rich set of components that can be combined and recombined to create new products. The arrival of these components then sets off a technology boom as innovators work through the possibilities.”
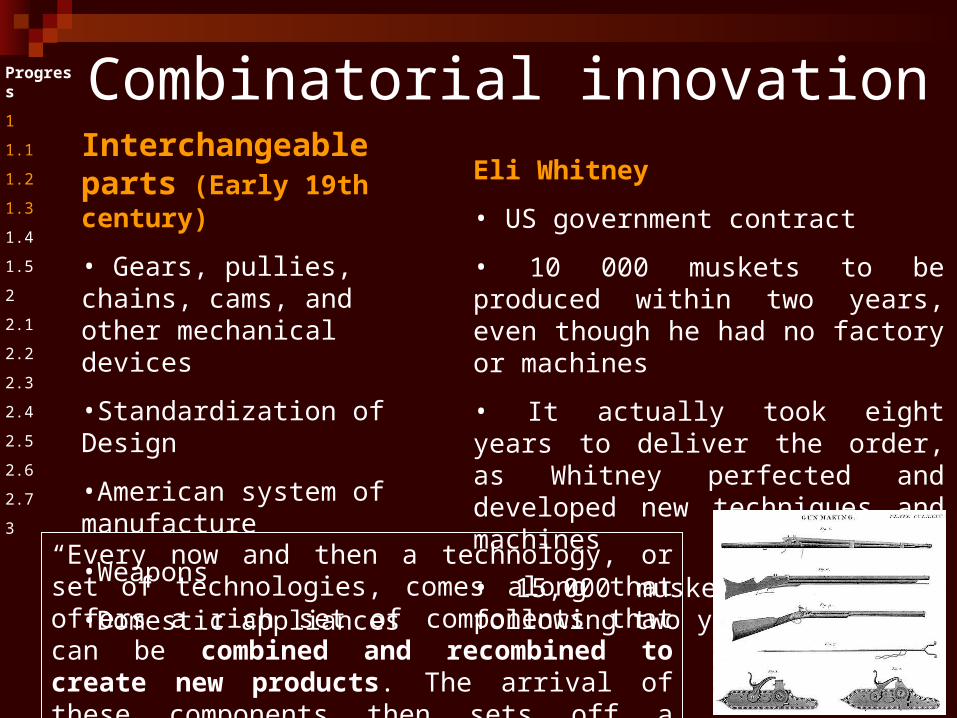
Interchangeable parts (Early 19th century)
• Gears, pullies, chains, cams, and other mechanical devices
•Standardization of Design
•American system of manufacture
•Weapons
•Domestic appliances
Eli Whitney
• US government contract
• 10 000 muskets to be produced within two years, even though he had no factory or machines
• It actually took eight years to deliver the order, as Whitney perfected and developed new techniques and machines
• 15,000 muskets within the following two years
Combinatorial innovationProgress
1
1.1
1.2
1.3
1.4
1.5
2
2.1
2.2
2.3
2.4
2.5
2.6
2.7
3
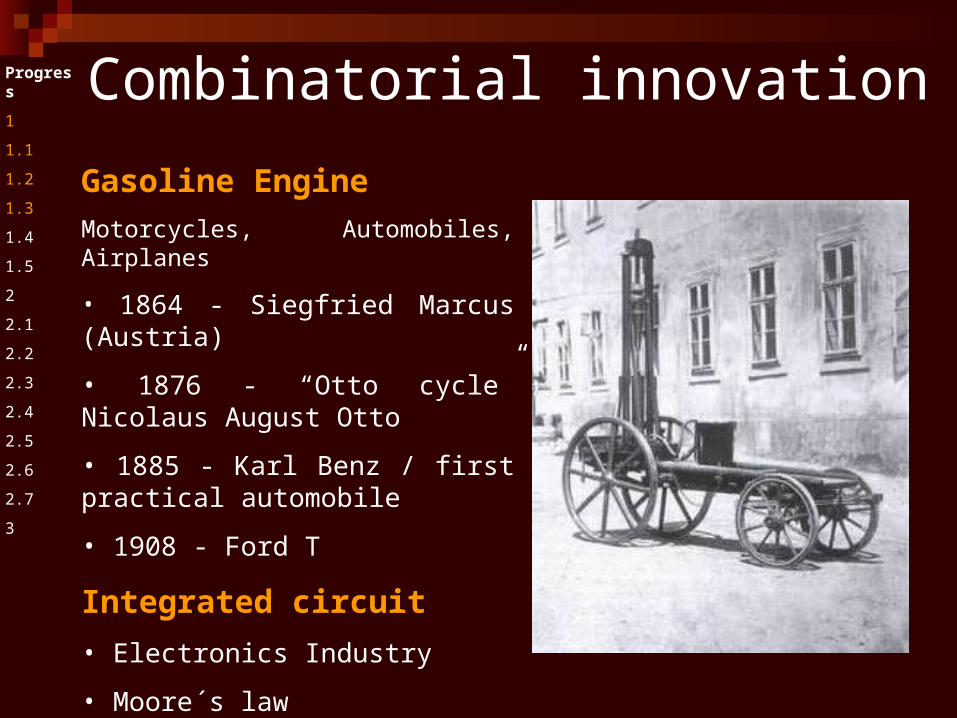
Gasoline EngineMotorcycles, Automobiles, Airplanes
• 1864 - Siegfried Marcus (Austria)
• 1876 - “Otto cycle” Nicolaus August Otto
• 1885 - Karl Benz / first practical automobile
• 1908 - Ford T
Integrated circuit• Electronics Industry
• Moore´s law
Microprocessor (1971)• Routers, Servers, PCs
Combinatorial innovationProgress
1
1.1
1.2
1.3
1.4
1.5
2
2.1
2.2
2.3
2.4
2.5
2.6
2.7
3
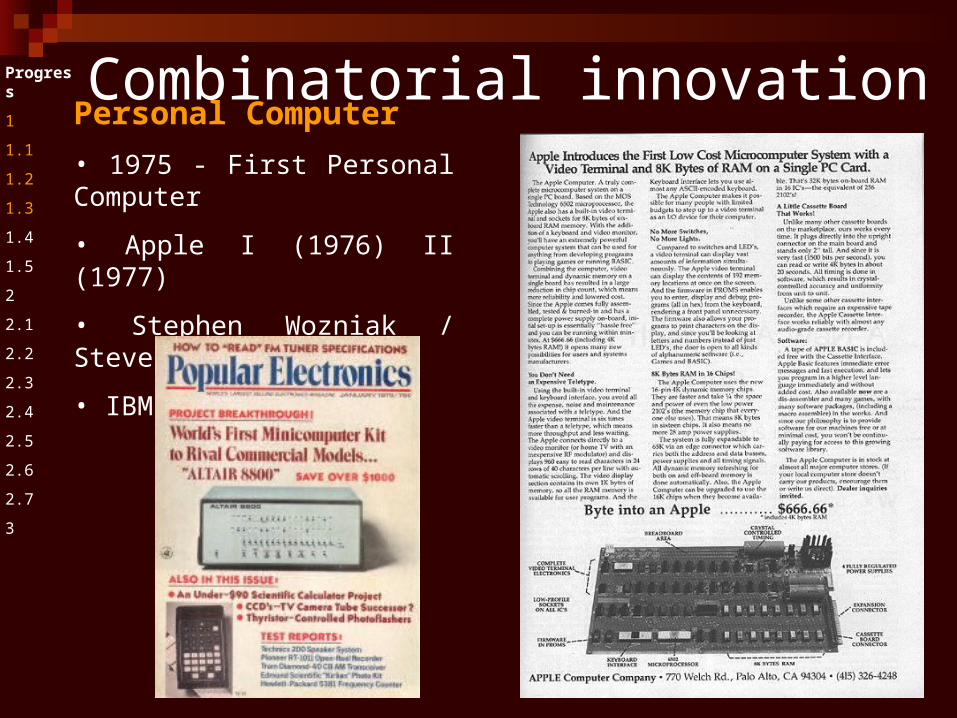
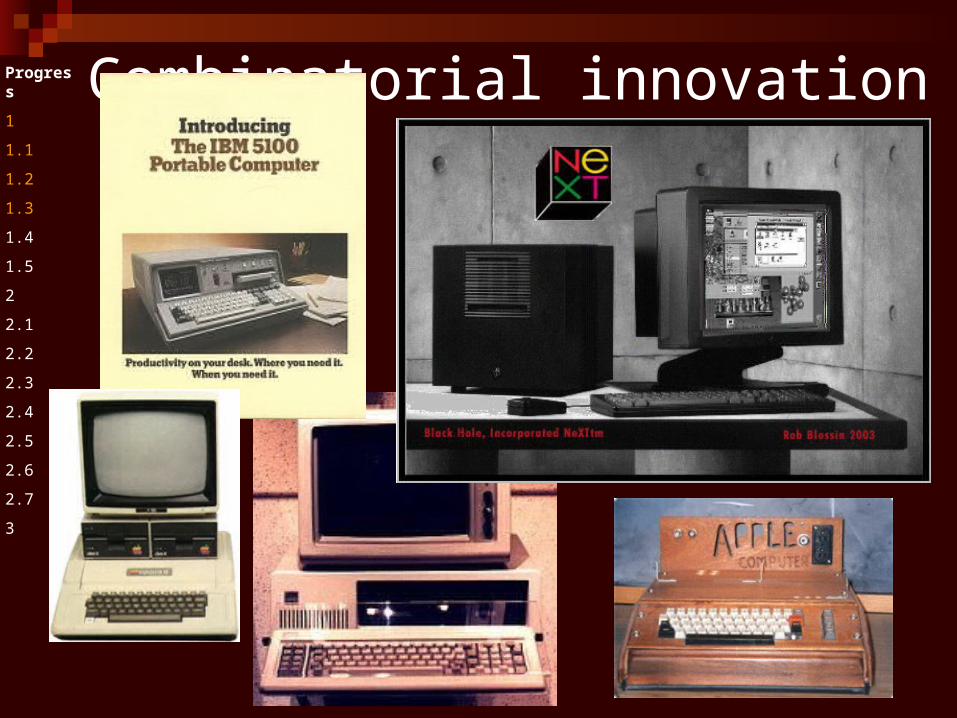
Personal Computer• 1975 - First Personal Computer
• Apple I (1976) II (1977)
• Stephen Wozniak / Steve Jobs
• IBM PC (1981)
Combinatorial innovationProgress
1
1.1
1.2
1.3
1.4
1.5
2
2.1
2.2
2.3
2.4
2.5
2.6
2.7
3
Combinatorial innovationProgress
1
1.1
1.2
1.3
1.4
1.5
2
2.1
2.2
2.3
2.4
2.5
2.6
2.7
3
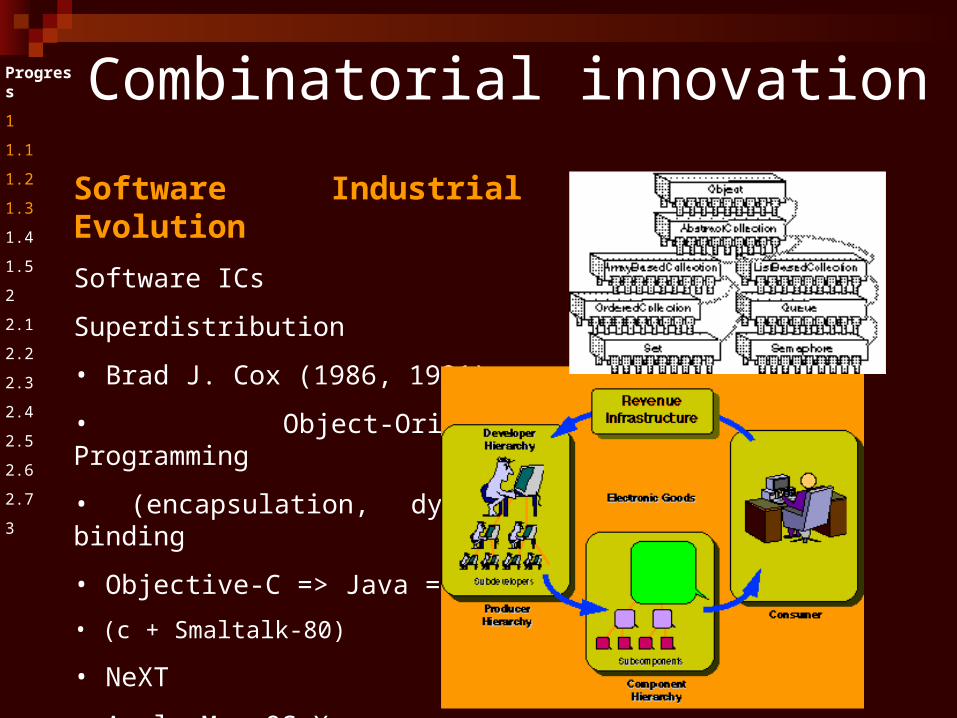
Software Industrial Evolution
Software ICs
Superdistribution
• Brad J. Cox (1986, 1991)
• Object-Oriented Programming
• (encapsulation, dynamic binding
• Objective-C => Java => C#
• (c + Smaltalk-80)
• NeXT
• Apple Mac OS X
Combinatorial innovationProgress
1
1.1
1.2
1.3
1.4
1.5
2
2.1
2.2
2.3
2.4
2.5
2.6
2.7
3
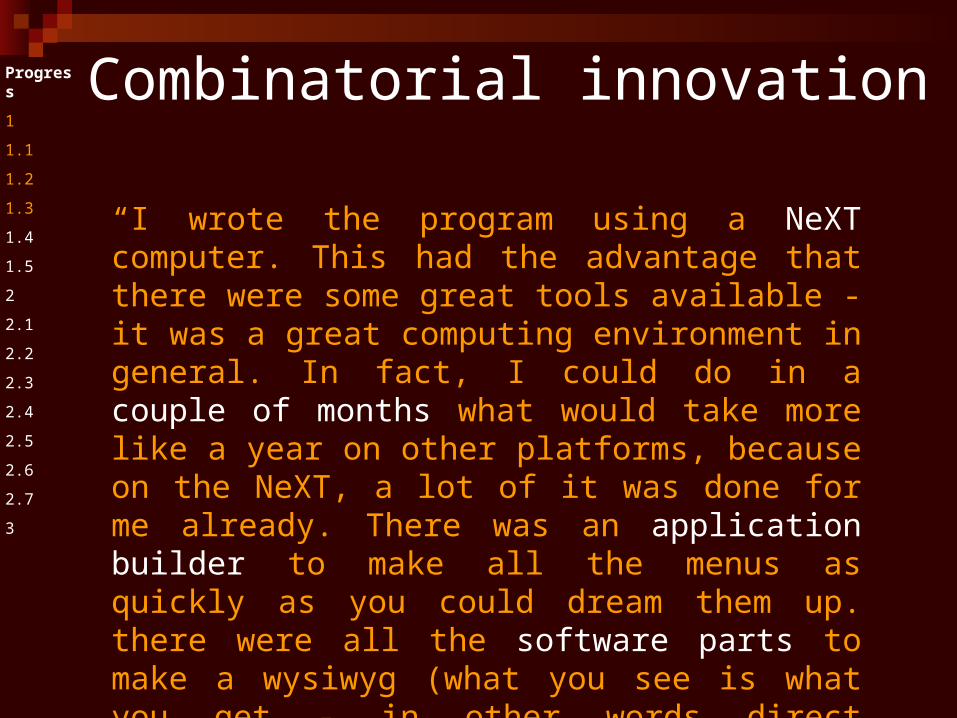
“I wrote the program using a NeXT computer. This had the advantage that there were some great tools available - it was a great computing environment in general. In fact, I could do in a couple of months what would take more like a year on other platforms, because on the NeXT, a lot of it was done for me already. There was an application builder to make all the menus as quickly as you could dream them up. there were all the software parts to make a wysiwyg (what you see is what you get - in other words direct manipulation of text on screen as on the printed - or browsed page) word processor. I just had to add hypertext, (by subclassing the Text object)”
Combinatorial innovationProgress
1
1.1
1.2
1.3
1.4
1.5
2
2.1
2.2
2.3
2.4
2.5
2.6
2.7
3
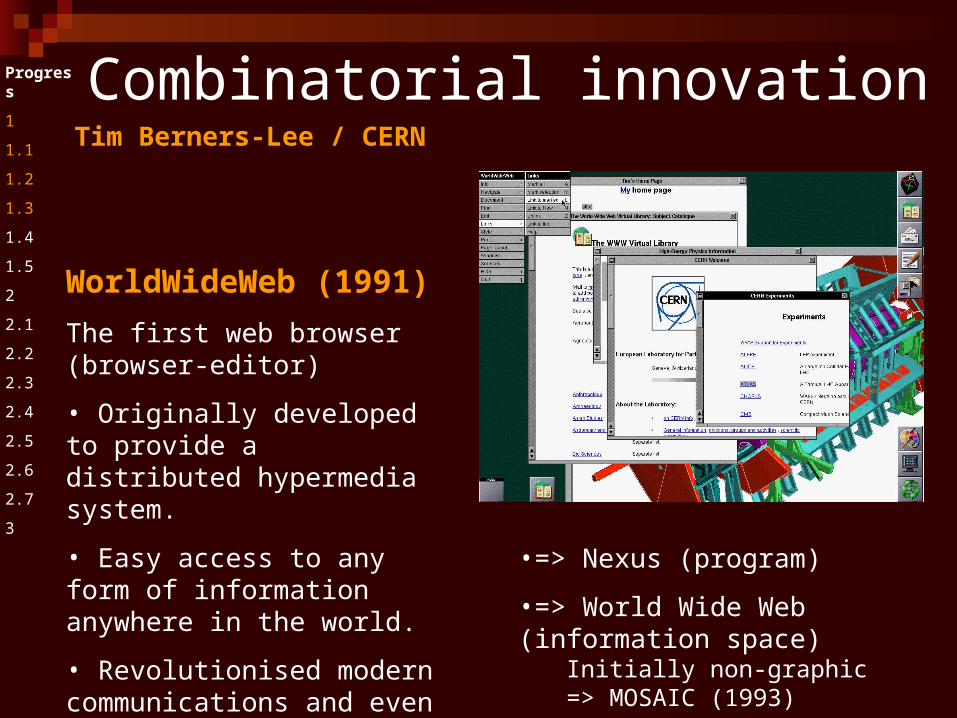
WorldWideWeb (1991)
The first web browser (browser-editor)
• Originally developed to provide a distributed hypermedia system.
• Easy access to any form of information anywhere in the world.
• Revolutionised modern communications and even our, way of life (?)
• Parts: HTML, HTTP, URL
•=> Nexus (program)
•=> World Wide Web (information space)Initially non-graphic=> MOSAIC (1993)
Tim Berners-Lee / CERN
Combinatorial innovationProgress
1
1.1
1.2
1.3
1.4
1.5
2
2.1
2.2
2.3
2.4
2.5
2.6
2.7
3
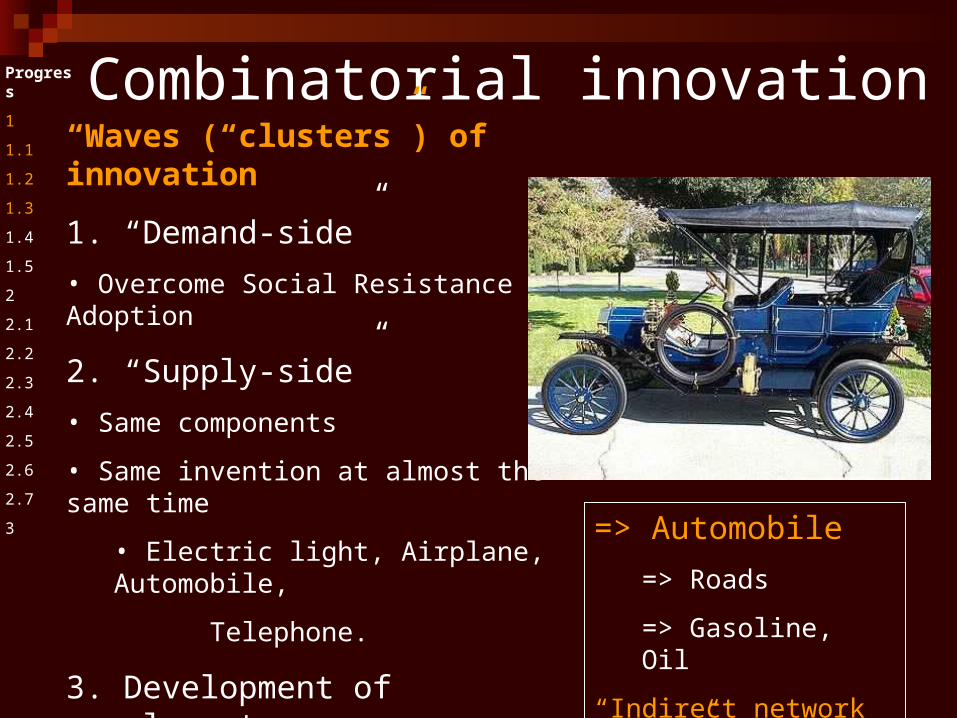
“Waves (“clusters”) of innovation
1. “Demand-side”• Overcome Social Resistance / Adoption
2. “Supply-side”• Same components
• Same invention at almost the same time
• Electric light, Airplane, Automobile,
Telephone.
3. Development of complements• Paved roads (Bicycle boom)
• Gasoline => fuel stationary engines used on farms
• Others (Pneumatic Tires, ...)
=> Automobile
=> Roads
=> Gasoline, Oil
“Indirect network effect”
Combinatorial innovationProgress
1
1.1
1.2
1.3
1.4
1.5
2
2.1
2.2
2.3
2.4
2.5
2.6
2.7
3
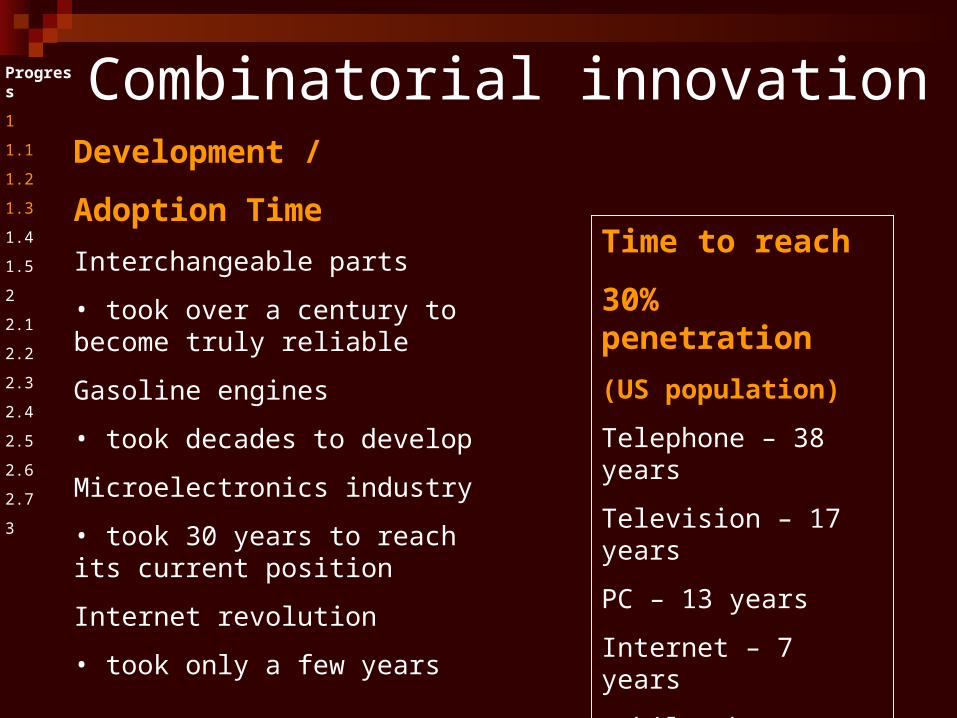
Development /
Adoption Time
Interchangeable parts
• took over a century to become truly reliable
Gasoline engines
• took decades to develop
Microelectronics industry
• took 30 years to reach its current position
Internet revolution
• took only a few years
Time to reach
30% penetration
(US population)
Telephone – 38 years
Television – 17 years
PC – 13 years
Internet – 7 years
Mobile Phone - …
The Internet BoomProgress
1
1.1
1.2
1.3
1.4
1.5
2
2.1
2.2
2.3
2.4
2.5
2.6
2.7
3
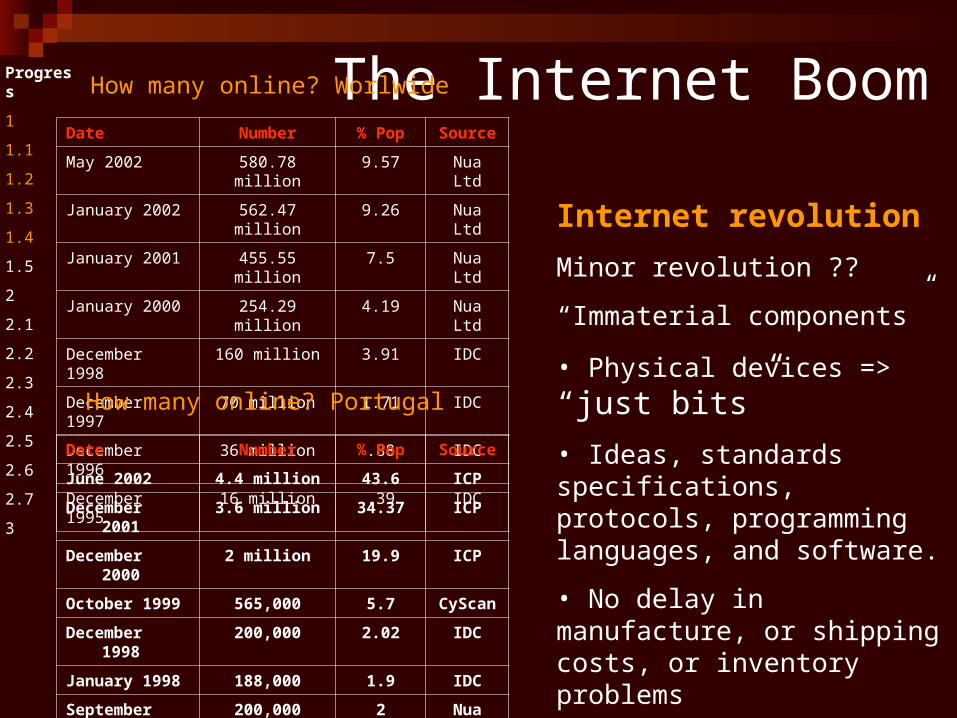
Internet revolution
Minor revolution ??
“Immaterial components”
• Physical devices => “just bits”• Ideas, standards specifications, protocols, programming languages, and software.
• No delay in manufacture, or shipping costs, or inventory problems
• Never run out of HTML!
Date Number % Pop Source
May 2002 580.78 million 9.57 Nua Ltd
January 2002 562.47 million 9.26 Nua Ltd
January 2001 455.55 million 7.5 Nua Ltd
January 2000 254.29 million 4.19 Nua Ltd
December 1998 160 million 3.91 IDC
December 1997 70 million 1.71 IDC
December 1996 36 million .88 IDC
December 1995 16 million .39 IDC
How many online? Worlwide
Date Number % Pop Source
June 2002 4.4 million 43.6 ICP
December 2001 3.6 million 34.37 ICP
December 2000 2 million 19.9 ICP
October 1999 565,000 5.7 CyScan
December 1998 200,000 2.02 IDC
January 1998 188,000 1.9 IDC
September 1997 200,000 2 Nua est.
How many online? Portugal
The Internet BoomProgress
1
1.1
1.2
1.3
1.4
1.5
2
2.1
2.2
2.3
2.4
2.5
2.6
2.7
3
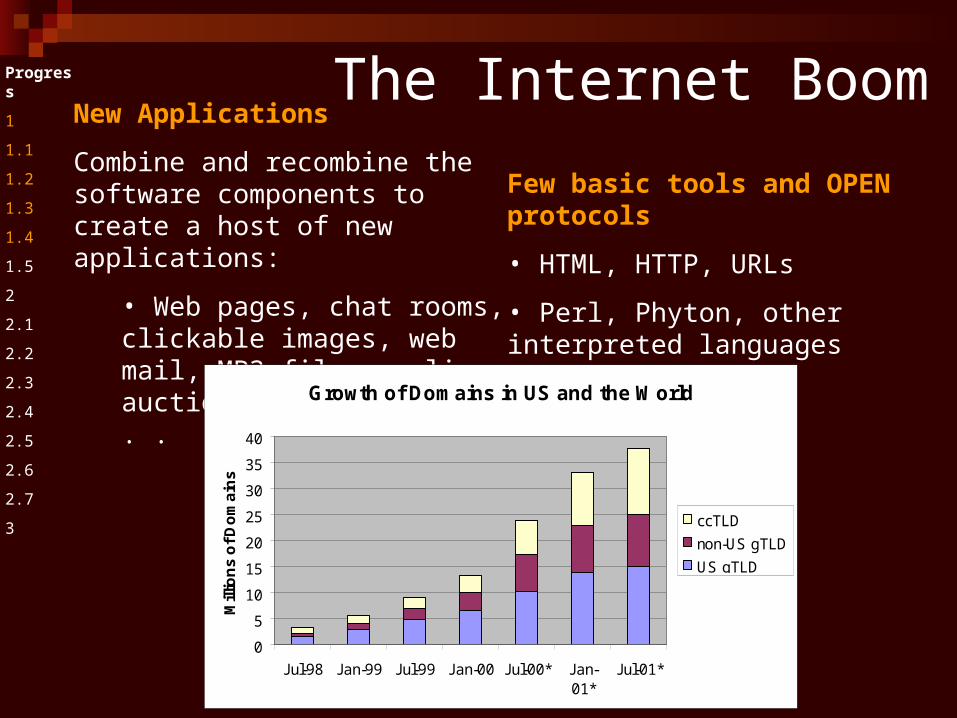
New Applications
Combine and recombine the software components to create a host of new applications:
• Web pages, chat rooms, clickable images, web mail, MP3 files, online auctions and exchanges . . .
Growth of Domains in US and the World
0
5
10
15
20
25
30
35
40
Jul-98 Jan-99 Jul-99 Jan-00 Jul-00* Jan-01*
Jul-01*
Mill
ion
s o
f D
om
ain
s
ccTLD
non-US gTLD
US gTLD
Few basic tools and OPEN protocols
• HTML, HTTP, URLs
• Perl, Phyton, other interpreted languages
The Internet BoomProgress
1
1.1
1.2
1.3
1.4
1.5
2
2.1
2.2
2.3
2.4
2.5
2.6
2.7
3
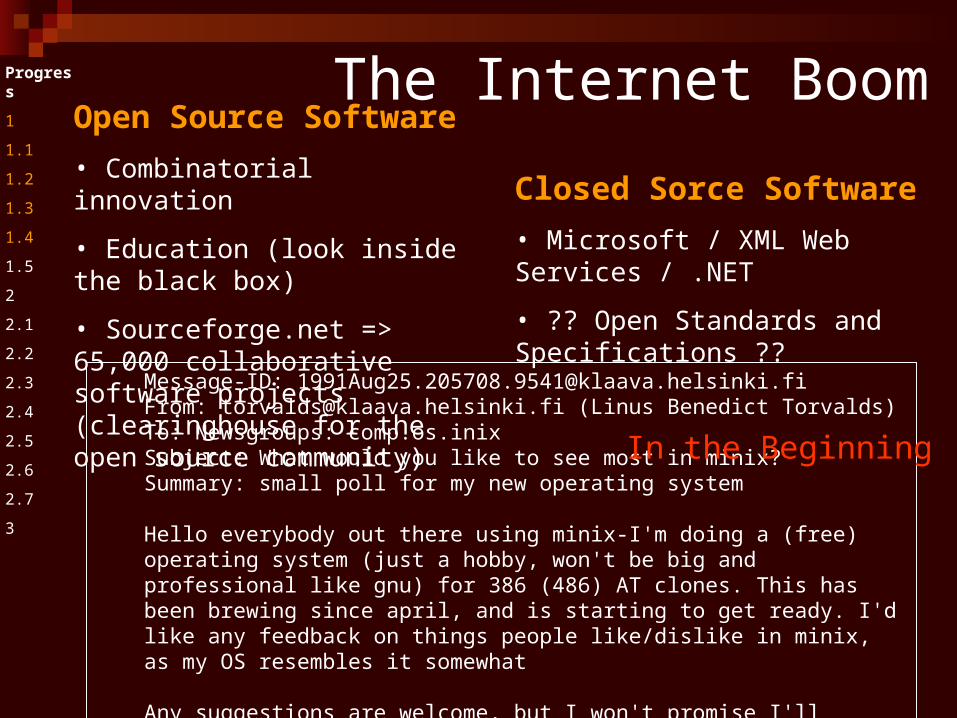
Open Source Software• Combinatorial innovation
• Education (look inside the black box)
• Sourceforge.net => 65,000 collaborative software projects (clearinghouse for the open source community)
Closed Sorce Software• Microsoft / XML Web Services / .NET
• ?? Open Standards and Specifications ??
Message-ID: [email protected]: [email protected] (Linus Benedict Torvalds)To: Newsgroups: comp.os.inixSubject: What would you like to see most in minix?Summary: small poll for my new operating system
Hello everybody out there using minix-I'm doing a (free) operating system (just a hobby, won't be big and professional like gnu) for 386 (486) AT clones. This has been brewing since april, and is starting to get ready. I'd like any feedback on things people like/dislike in minix, as my OS resembles it somewhat
Any suggestions are welcome, but I won't promise I'll implement them :-)Linus
In the Beginning
The Internet BoomProgress
1
1.1
1.2
1.3
1.4
1.5
2
2.1
2.2
2.3
2.4
2.5
2.6
2.7
3
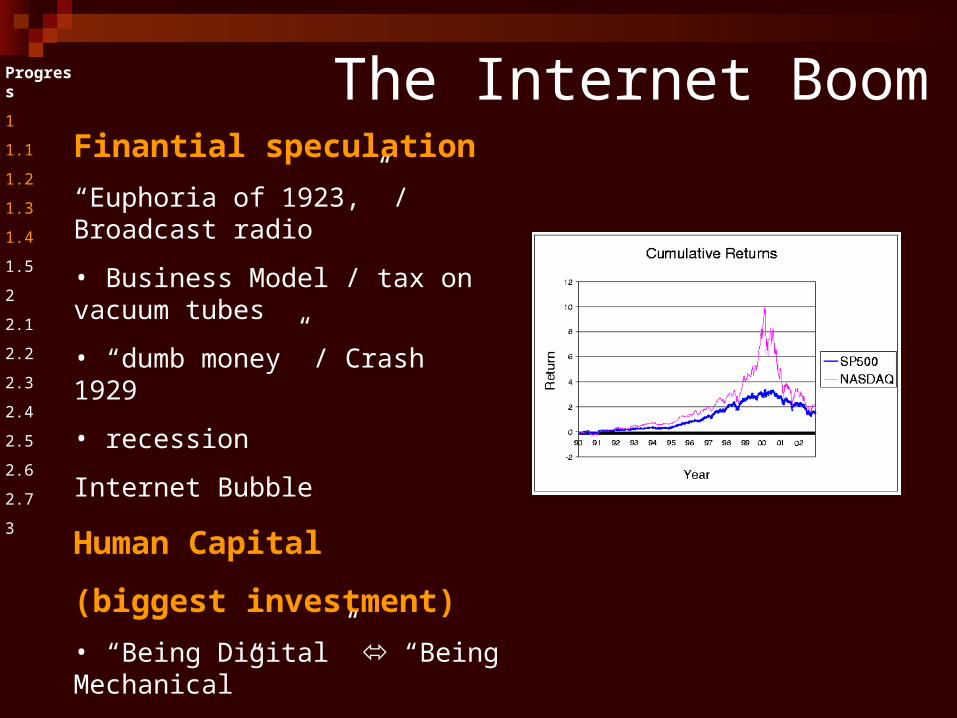
Finantial speculation
“Euphoria of 1923,” / Broadcast radio
• Business Model / tax on vacuum tubes
• “dumb money” / Crash 1929
• recession
Internet Bubble
Human Capital
(biggest investment)• “Being Digital” “Being Mechanical”
• Productivity
Where are we now?Progress
1
1.1
1.2
1.3
1.4
1.5
2
2.1
2.2
2.3
2.4
2.5
2.6
2.7
3
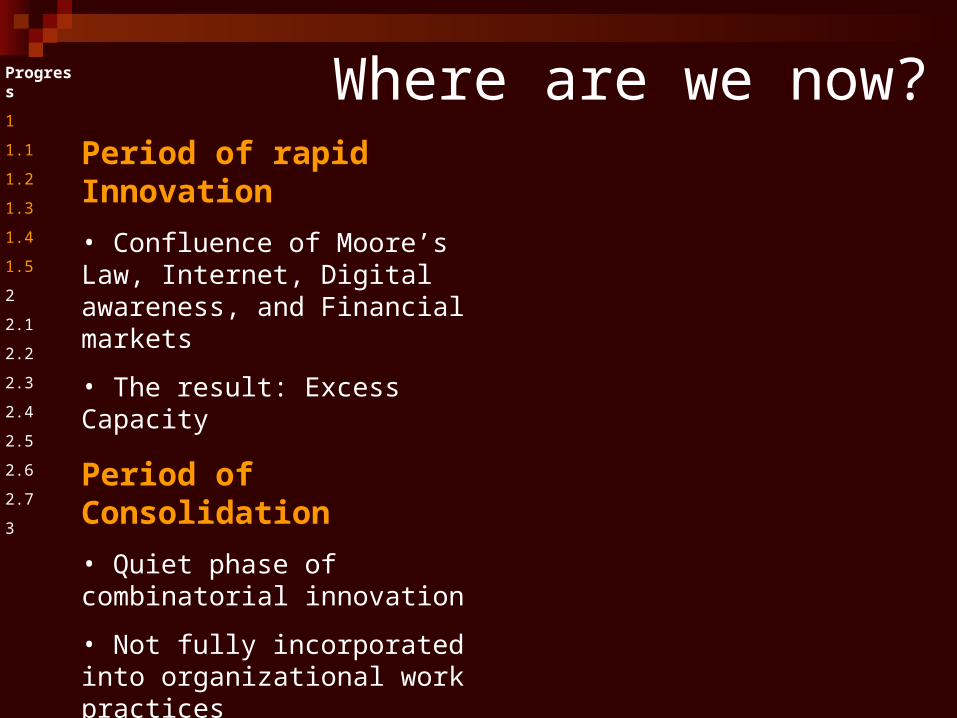
Period of rapid Innovation• Confluence of Moore’s Law, Internet, Digital awareness, and Financial markets
• The result: Excess Capacity
Period of Consolidation• Quiet phase of combinatorial innovation
• Not fully incorporated into organizational work practices
Challenge• Re-enginner the flow of information over the entire value chain
• Michael Dell / Mass Customization
Where are we now?Progress
1
1.1
1.2
1.3
1.4
1.5
2
2.1
2.2
2.3
2.4
2.5
2.6
2.7
3
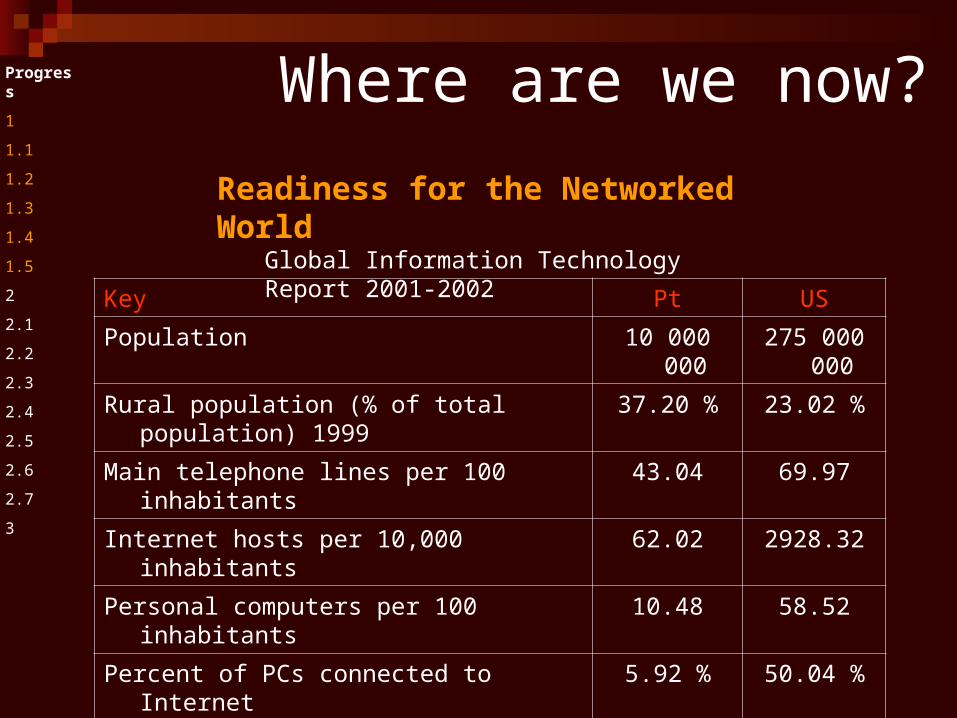
Key Pt US
Population 10 000 000 275 000 000
Rural population (% of total population) 1999 37.20 % 23.02 %
Main telephone lines per 100 inhabitants 43.04 69.97
Internet hosts per 10,000 inhabitants 62.02 2928.32
Personal computers per 100 inhabitants 10.48 58.52
Percent of PCs connected to Internet 5.92 % 50.04 %
Internet users per host 35.90 2.04
Internet users per 100 inhabitants 22.27 59.75
Cell phone subscribers per 100 inhabitants 66.51 39.79
Readiness for the Networked World
Global Information Technology Report 2001-2002
Where are we now?Progress
1
1.1
1.2
1.3
1.4
1.5
2
2.1
2.2
2.3
2.4
2.5
2.6
2.7
3
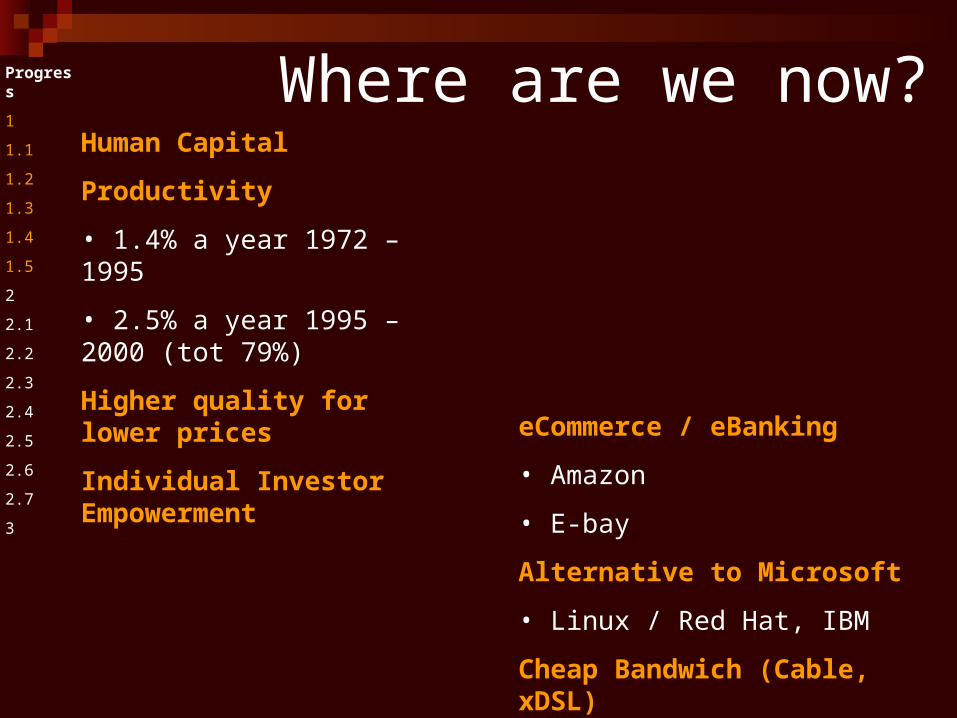
Human Capital
Productivity
• 1.4% a year 1972 – 1995
• 2.5% a year 1995 – 2000 (tot 79%)
Higher quality for lower prices
Individual Investor Empowerment
eCommerce / eBanking
• Amazon
• E-bay
Alternative to Microsoft
• Linux / Red Hat, IBM
Cheap Bandwich (Cable, xDSL)
2. Economic Thinking Differentiation of products and prices
Progress
1
1.1
1.2
1.3
1.4
1.5
2.
2.1
2.2
2.3
2.4
2.5
2.6
2.7
3
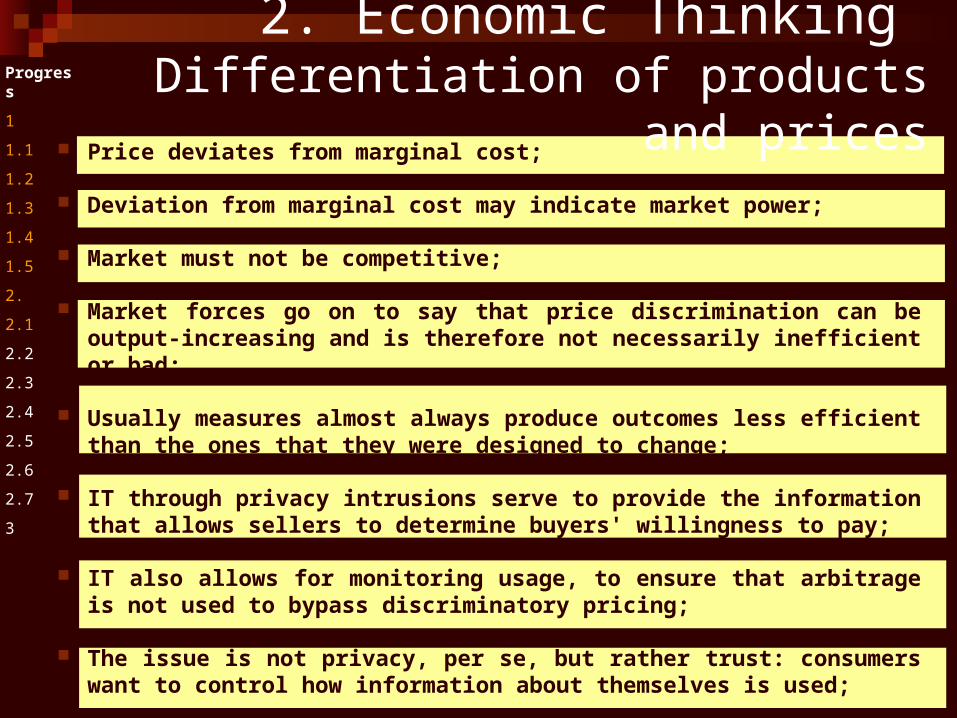
Price deviates from marginal cost;
Deviation from marginal cost may indicate market power;
Market must not be competitive;
Market forces go on to say that price discrimination can be output-increasing and is therefore not necessarily inefficient or bad;
Usually measures almost always produce outcomes less efficient than the ones that they were designed to change;
IT through privacy intrusions serve to provide the information that allows sellers to determine buyers' willingness to pay;
IT also allows for monitoring usage, to ensure that arbitrage is not used to bypass discriminatory pricing;
The issue is not privacy, per se, but rather trust: consumers want to control how information about themselves is used;
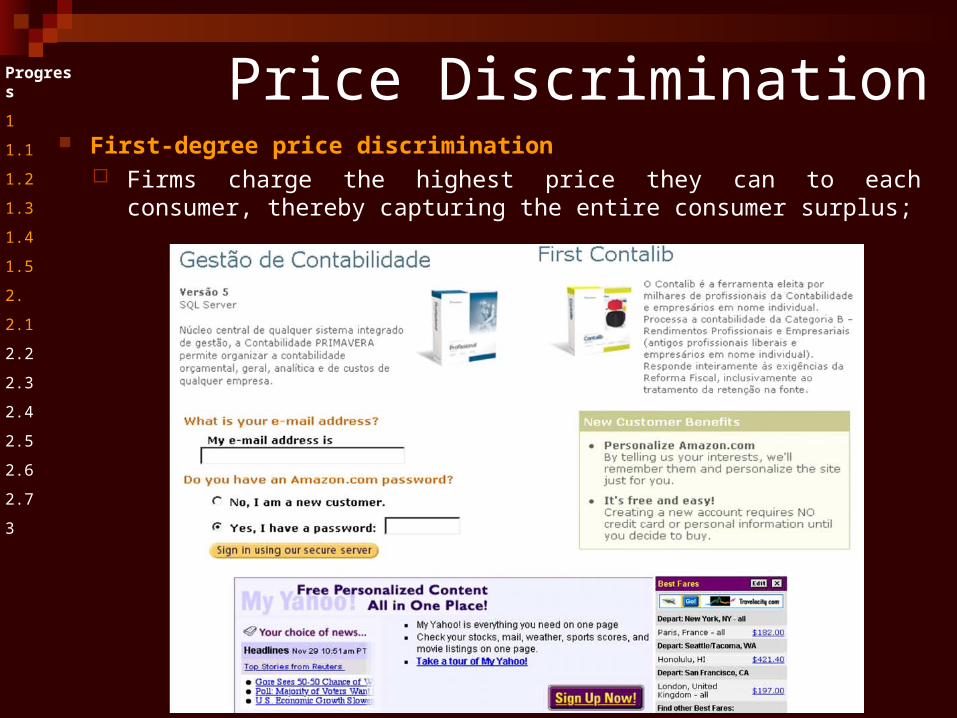
First-degree price discrimination Firms charge the highest price they can to each consumer, thereby capturing the
entire consumer surplus;
Progress
1
1.1
1.2
1.3
1.4
1.5
2.
2.1
2.2
2.3
2.4
2.5
2.6
2.7
3
Price Discrimination
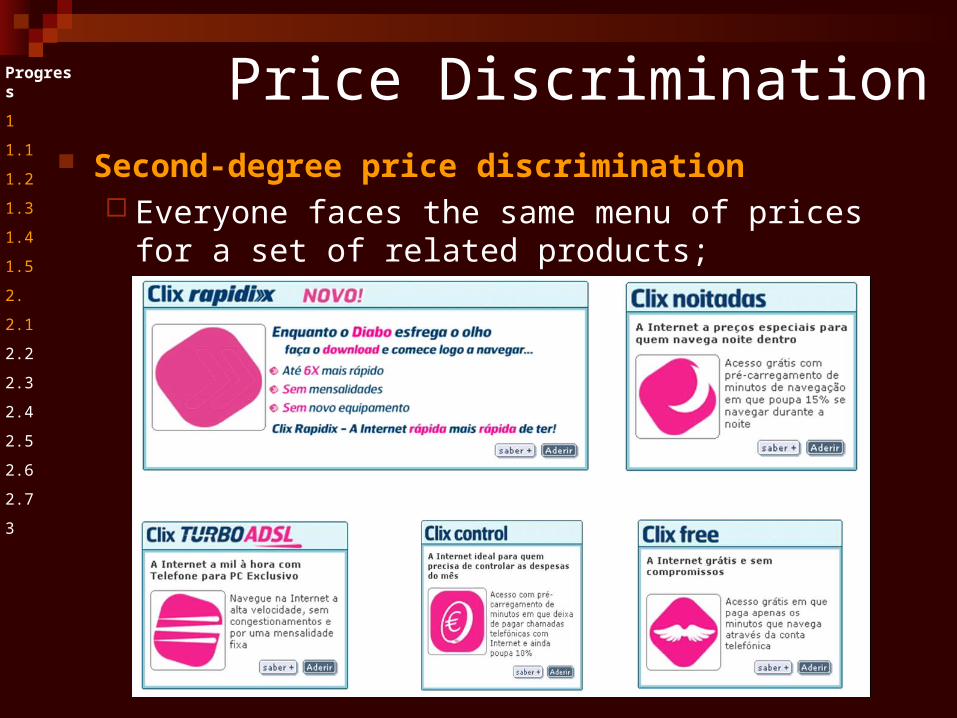
Second-degree price discrimination Everyone faces the same menu of prices for a set of related
products;
Progress
1
1.1
1.2
1.3
1.4
1.5
2.
2.1
2.2
2.3
2.4
2.5
2.6
2.7
3
Price Discrimination
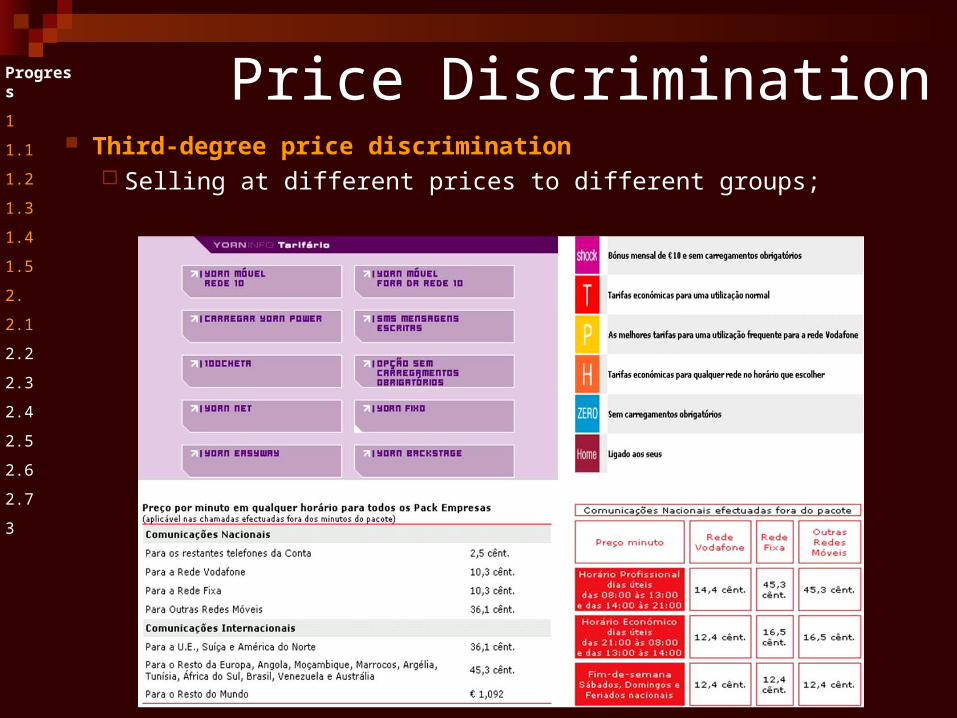
Third-degree price discrimination Selling at different prices to different groups;
Progress
1
1.1
1.2
1.3
1.4
1.5
2.
2.1
2.2
2.3
2.4
2.5
2.6
2.7
3
Price Discrimination
Progress
1
1.1
1.2
1.3
1.4
1.5
2.
2.1
2.2
2.3
2.4
2.5
2.6
2.7
3
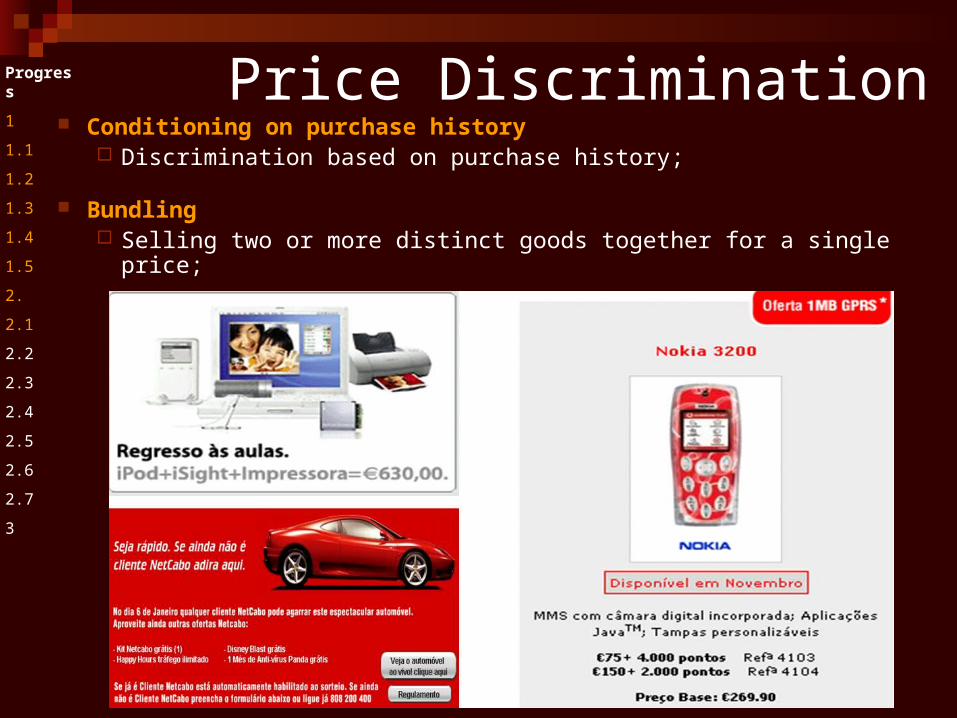
Price Discrimination Conditioning on purchase history
Discrimination based on purchase history;
Bundling Selling two or more distinct goods together for a single price;
Progress
1
1.1
1.2
1.3
1.4
1.5
2.
2.1
2.2
2.3
2.4
2.5
2.6
2.7
3
Price Discrimination
The public's dislike for price discrimination will be combined with new tools for detecting price discrimination;
New tools are products of the same technologies that enable sellers to practice differential pricing;
The result is likely to be that price discrimination will grow, but in a concealed form;
Switching costs and lock-inProgress
1
1.1
1.2
1.3
1.4
1.5
2.
2.1
2.2
2.3
2.4
2.5
2.6
2.7
3
Consumer Switching costs make consumers reluctant to move to completely
new solutions;
Supplier Switching costs or cannibalisation of existing products make
suppliers reluctant to pursue new product opportunities;
High difficulty of market penetration unless products on offer are compatible with existing complementary solutions;
Switching costs and lock-inProgress
1
1.1
1.2
1.3
1.4
1.5
2.
2.1
2.2
2.3
2.4
2.5
2.6
2.7
3
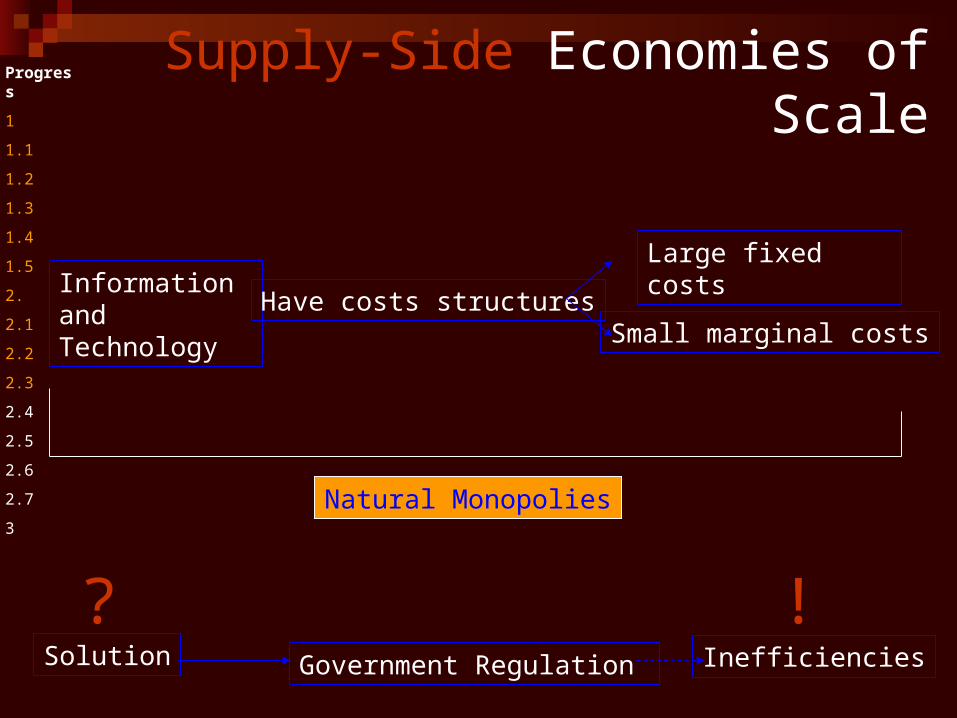
Information and Technology
Large fixed costs
Small marginal costs
Natural Monopolies
Have costs structures
Solution Government Regulation Inefficiencies
!?
Supply-Side Economies of ScaleProgress
1
1.1
1.2
1.3
1.4
1.5
2.
2.1
2.2
2.3
2.4
2.5
2.6
2.7
3
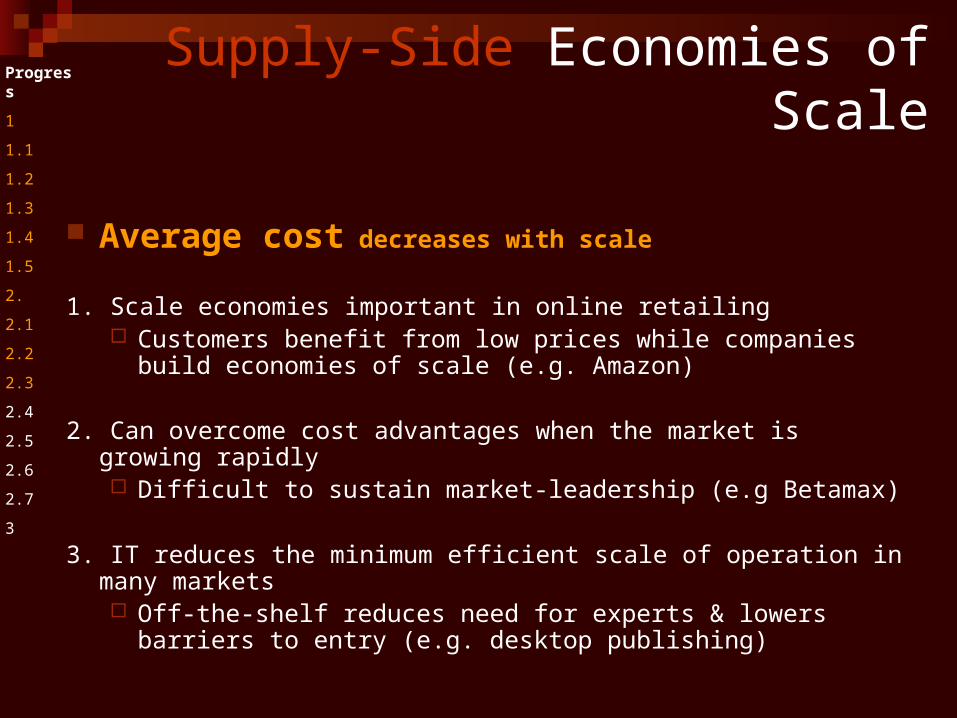
Supply-Side Economies of Scale
Average cost decreases with scale
1. Scale economies important in online retailing Customers benefit from low prices while companies build
economies of scale (e.g. Amazon)
2. Can overcome cost advantages when the market is growing rapidly Difficult to sustain market-leadership (e.g Betamax)
3. IT reduces the minimum efficient scale of operation in many markets Off-the-shelf reduces need for experts & lowers barriers to entry
(e.g. desktop publishing)
Progress
1
1.1
1.2
1.3
1.4
1.5
2.
2.1
2.2
2.3
2.4
2.5
2.6
2.7
3
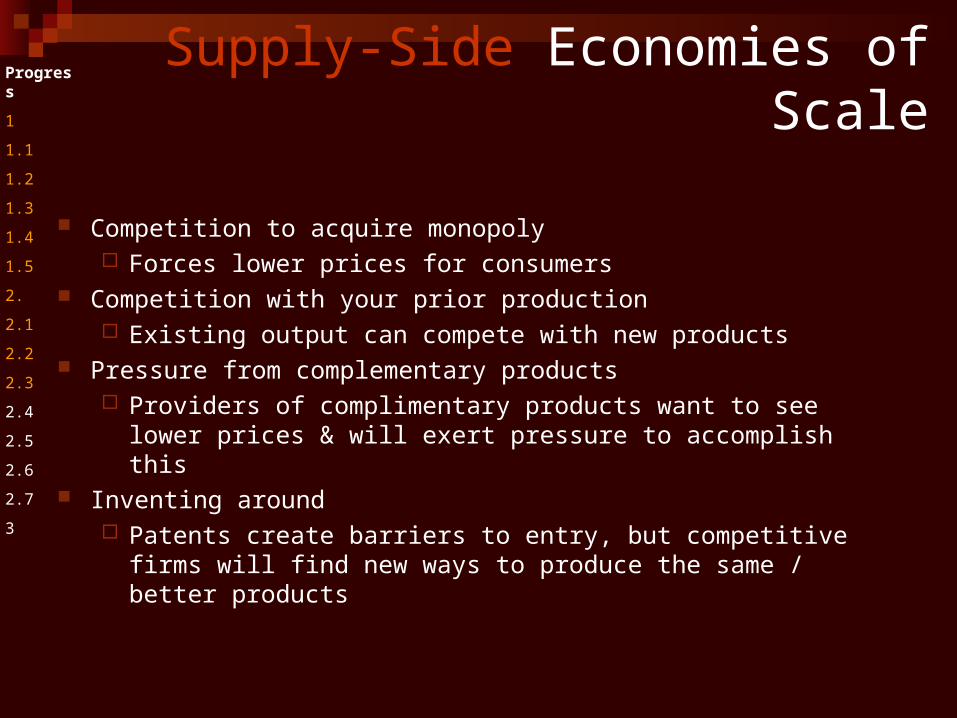
Supply-Side Economies of Scale
Competition to acquire monopoly Forces lower prices for consumers
Competition with your prior production Existing output can compete with new products
Pressure from complementary products Providers of complimentary products want to see lower prices &
will exert pressure to accomplish this Inventing around
Patents create barriers to entry, but competitive firms will find new ways to produce the same / better products
Progress
1
1.1
1.2
1.3
1.4
1.5
2.
2.1
2.2
2.3
2.4
2.5
2.6
2.7
3
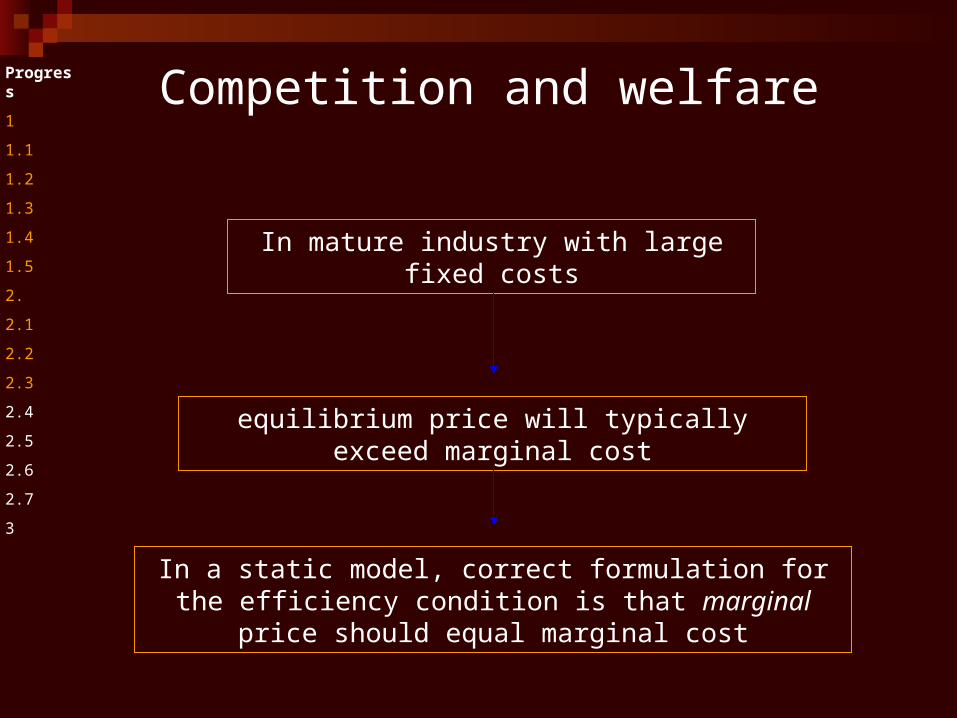
Competition and welfare
In mature industry with large fixed costs
equilibrium price will typically exceed marginal cost
In a static model, correct formulation for the efficiency condition is that marginal price should equal marginal cost
Progress
1
1.1
1.2
1.3
1.4
1.5
2.
2.1
2.2
2.3
2.4
2.5
2.6
2.7
3
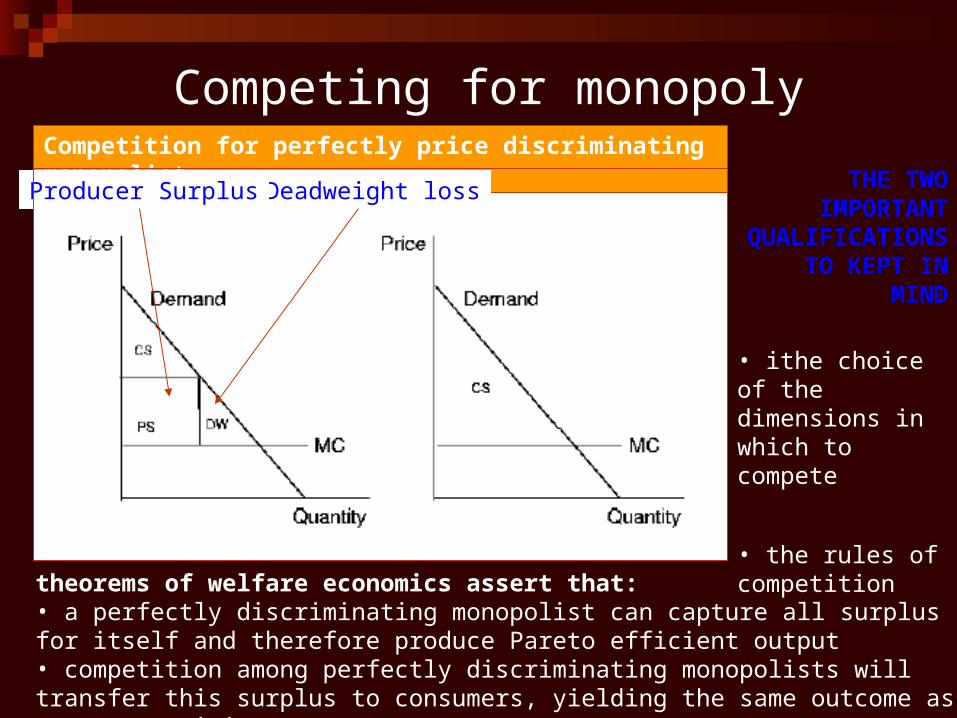
Competing for monopoly
theorems of welfare economics assert that:• a perfectly discriminating monopolist can capture all surplus for itself and therefore produce Pareto efficient output• competition among perfectly discriminating monopolists will transfer this surplus to consumers, yielding the same outcome as pure competition
THE TWO IMPORTANT
QUALIFICATIONS TO KEPT IN MIND
• ithe choice of the dimensions in which to compete
• the rules of competition
Competition for perfectly price discriminating monopolist
Deadweight lossProducer Surplus

The currency of competitionProgress
1
1.1
1.2
1.3
1.4
1.5
2.
2.1
2.2
2.3
2.4
2.5
2.6
2.7
3
competition is good, but regulation may be required to make sure that competition takes socially beneficial forms
strategic variables:for the firms: are pricestend to benefit consumers:Innovation and quality choice
environmental:attractive policy goals
but firms also compete in other dimensions:political lobbying accumulation of excess capacity premature entry…
Demand-side economies of scale
Average revenue increases with scale
Known as “network externalities” or “network effects” since they occur in network industries:
When demand for a good depends on how many other people purchase it
Usual example is of a fax machine ( more picture phones and email)
Recent e.g.: availability of Playstation v. Xbox games
If market gets above critical mass, positive feedback kicks in & product becomes successful
Progress
1
1.1
1.2
1.3
1.4
1.5
2.
2.1
2.2
2.3
2.4
2.5
2.6
2.7
3
In each case, the demand for the infrastructure depends on the availability of applications, and vice versa
Indirect network effects are endemic in high-tech products
The cure for the current slump, according to industry pundits, is a new killer app.Movies on demand,
interactive TV, mobile commerce-there are plenty of candidates, but investors are wary, and for good reason: there are very substantial risks involved
Current challenges include residential broadband and applications, and 3G wireless and applications
Demand-side economies of scaleProgress
1
1.1
1.2
1.3
1.4
1.5
2.
2.1
2.2
2.3
2.4
2.5
2.6
2.7
3
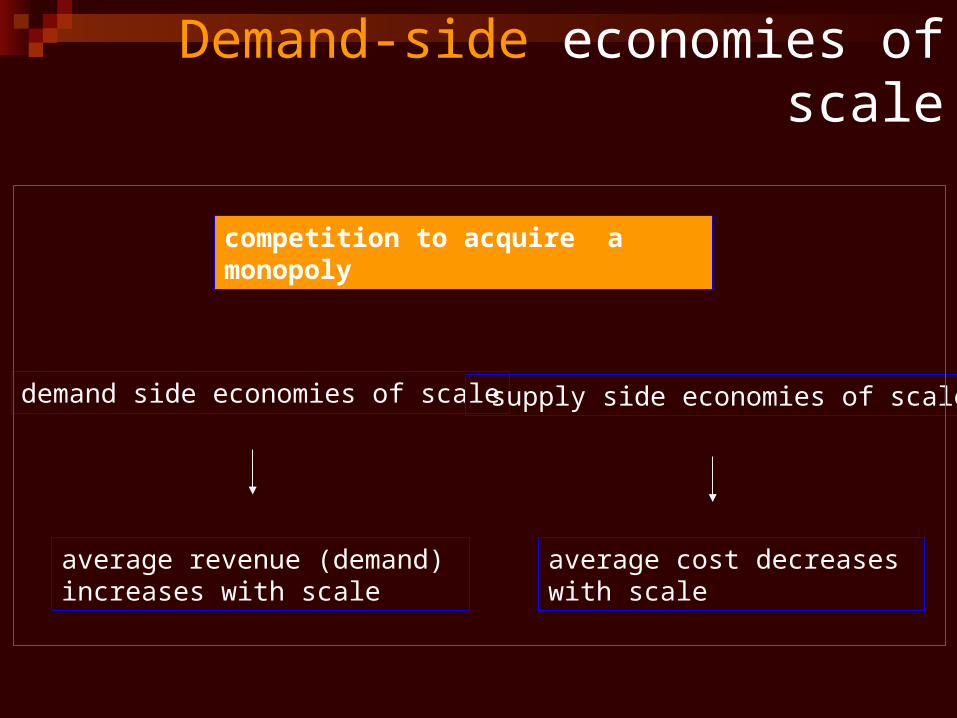
demand side economies of scale supply side economies of scale
average cost decreases with scale
average revenue (demand) increases with scale
competition to acquire a monopoly
Demand-side economies of scale
Network effects clearly prominent in some hi-tech industries Customers choose software that everyone else is using so that file-
sharing, working on common documents (…more valuable), etc is easier
Network effects & price discrimination Early adopters normally pay more than later users
Network effects & lock-in If everyone is using a particular product, the cost of switching to an
alternative one can be high
Demand-side economies of scaleProgress
1
1.1
1.2
1.3
1.4
1.5
2.
2.1
2.2
2.3
2.4
2.5
2.6
2.7
3
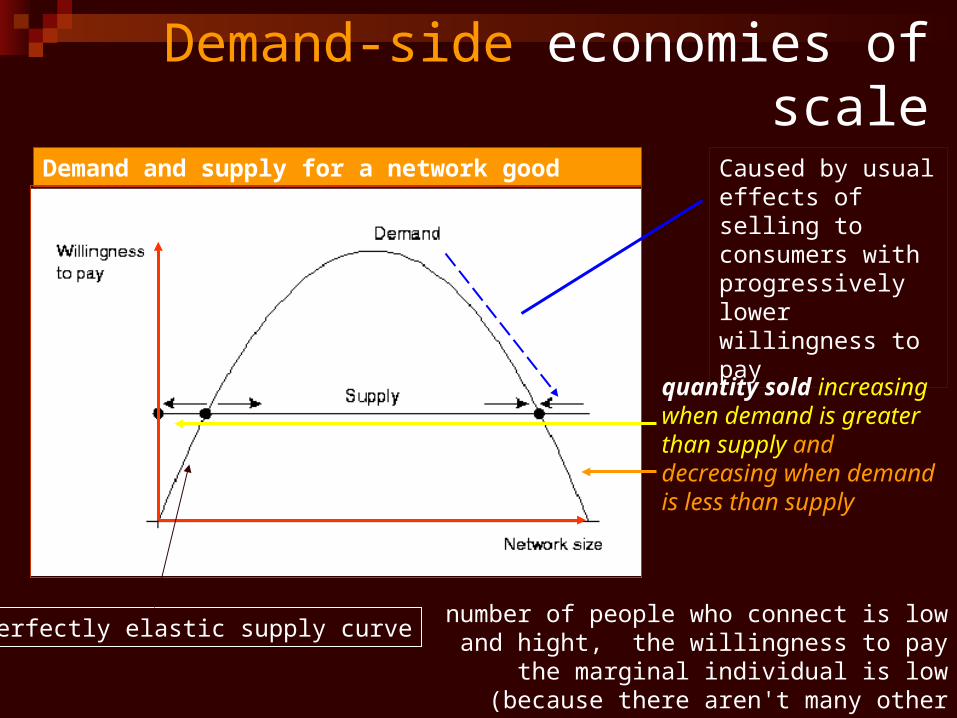
Demand and supply for a network good Caused by usual effects of selling to consumers with progressively lower willingness to pay
quantity sold increasing when demand is greater than supply and decreasing when demand is less than supply
perfectly elastic supply curve
Demand-side economies of scale
number of people who connect is low and hight, the willingness to pay the marginal individual is low (because there aren't many other people out there
that he can communicate with)
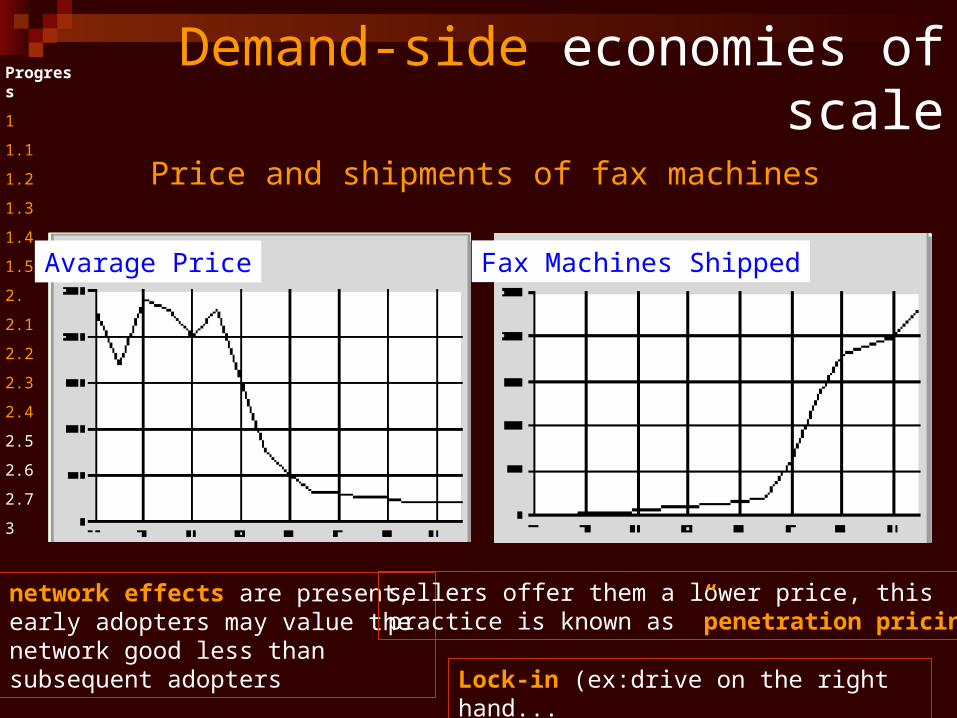
Price and shipments of fax machines
Avarage Price Fax Machines Shipped
network effects are present, early adopters may value thenetwork good less thansubsequent adopters
sellers offer them a lower price, this practice is known as ”penetration pricing”
Lock-in (ex:drive on the right hand...
Demand-side economies of scaleProgress
1
1.1
1.2
1.3
1.4
1.5
2.
2.1
2.2
2.3
2.4
2.5
2.6
2.7
3
StandardsProgress
1
1.1
1.2
1.3
1.4
1.5
2.
2.1
2.2
2.3
2.4
2.5
2.6
2.7
3
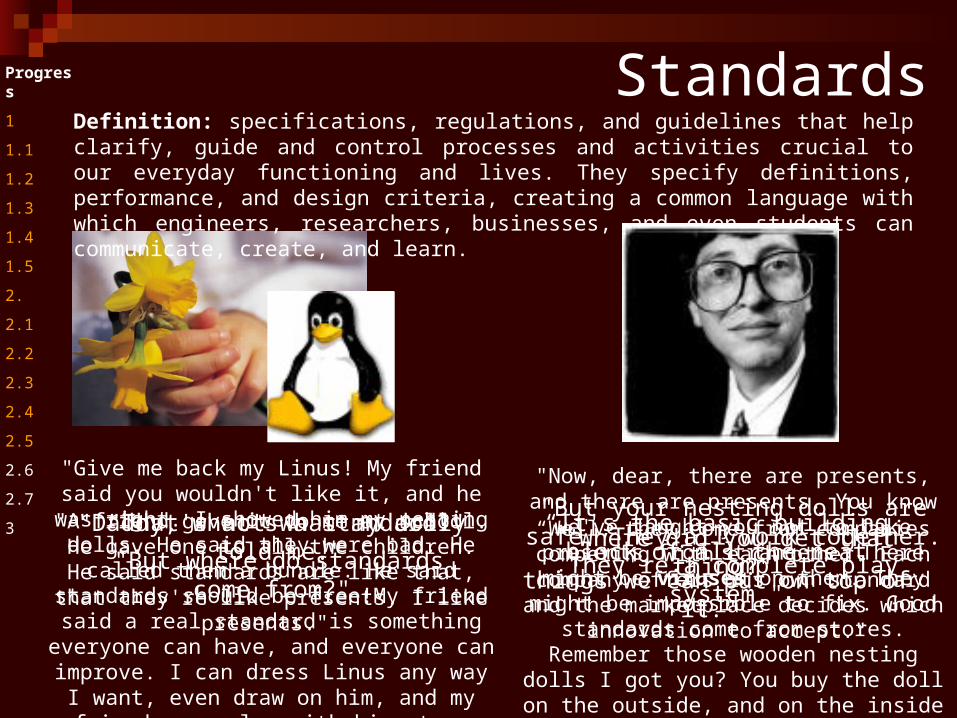
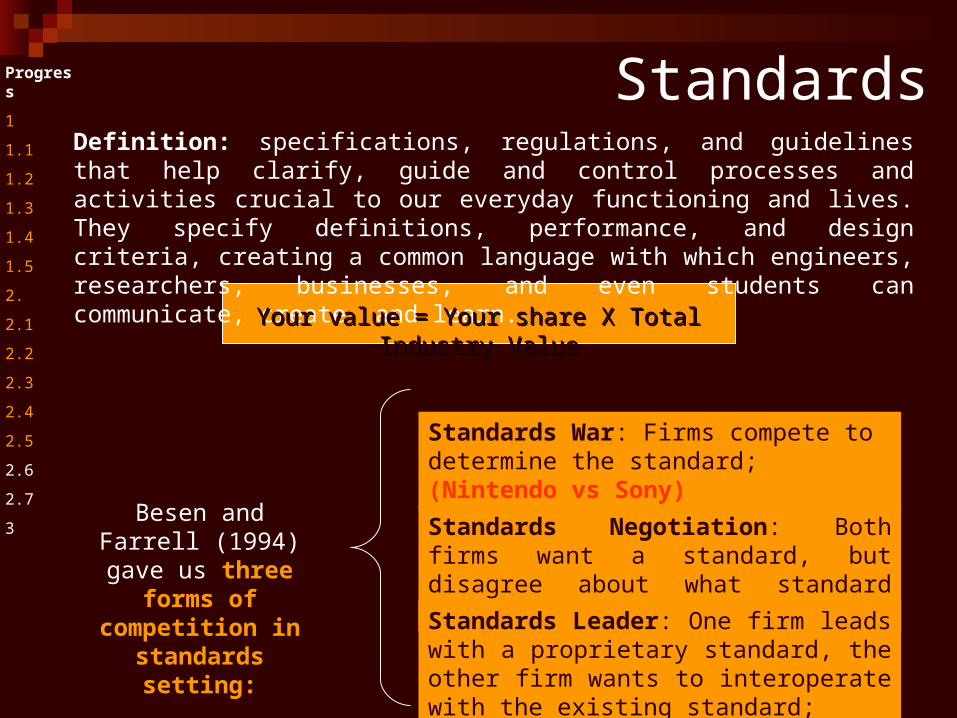
Definition: specifications, regulations, and guidelines that help clarify, guide and control processes and activities crucial to our everyday functioning and lives. They specify definitions, performance, and design criteria, creating a common language with which engineers, researchers, businesses, and even students can communicate, create, and learn.
"Daddy, what's a standard?" “It's the basic building block of all the neat things we can put on top of it." "But where do standards come
from?"
“Well, they come from companies competing with each other. Each company offers its own standard and the marketplace decides which
innovation to accept."
"That's not what my dolly told me." "Where did you get that thing?"
"A friend gave it to me at school. He gave one to all the children. He said standards are like
that, that they're like presents. I like presents."
"Now, dear, there are presents, and there are presents. You know we've taught you not to
take presents from strangers. There might be viruses on them. They might be impossible
to fix. Good standards come from stores. Remember those wooden nesting dolls I got you? You buy the doll on the outside, and on
the inside are presents and presents and more presents."
"Give me back my Linus! My friend said you wouldn't like it, and he was right. I showed him my nesting dolls. He said they were bad. He
called them a bundle. He said standards should be free!My friend said a real standard is
something everyone can have, and everyone can improve. I can dress Linus any way I want, even draw on him, and my friends can play with him, too. They can't really play with my nesting
dolls."
"But your nesting dolls are safe. They all work together. They're a complete play
system."
StandardsProgress
1
1.1
1.2
1.3
1.4
1.5
2.
2.1
2.2
2.3
2.4
2.5
2.6
2.7
3
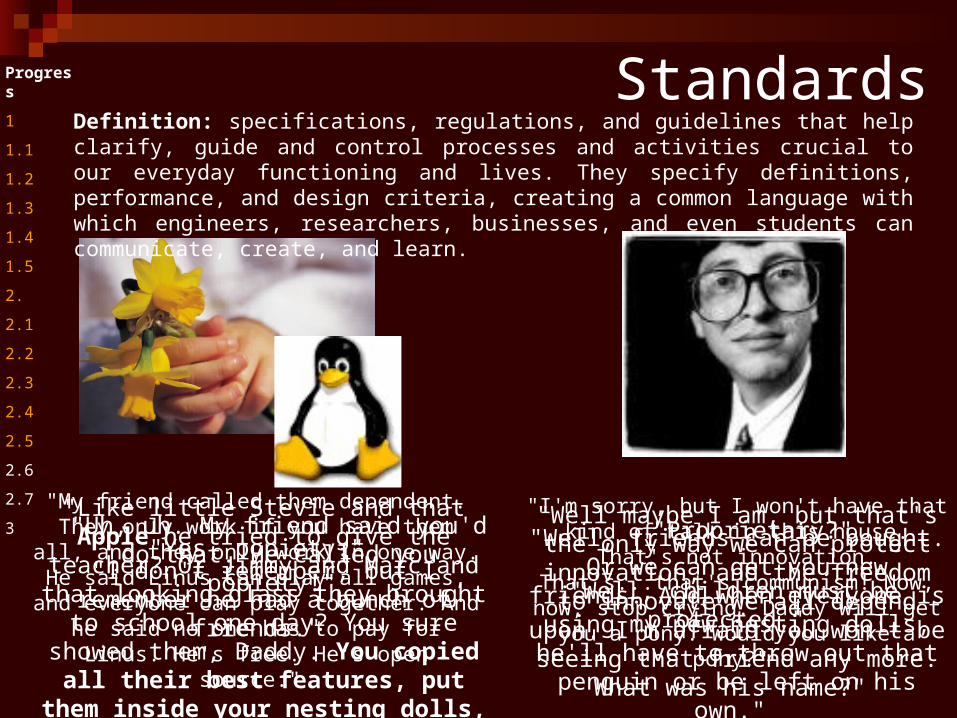
Definition: specifications, regulations, and guidelines that help clarify, guide and control processes and activities crucial to our everyday functioning and lives. They specify definitions, performance, and design criteria, creating a common language with which engineers, researchers, businesses, and even students can communicate, create, and learn.
"I'm sorry, but I won't have that kind of talk in this house. That's not innovation.
That's...that's communism! Now, now, stop crying. Daddy will get you a pony. Would you
like a pony?"
"My friend called them dependent. They only work if you have them all, and they only work in one way. He said Linus can play all games, and everyone can play together. And he said no one
has to pay for Linus. He's free. He's open source."
"Proprietary?" "Uh, uh. My friend said you'd do that. He called you popiety!"
"Well maybe I am, but that's the only way we can protect innovation, and the
freedom to innovate we all depend upon. I'm afraid you won't be seeing that friend any more. What was his name?"
"Yes, popiety." "Well, friends can be bought. Or we can get you new friends. And when
everyone is using my new nesting dolls, he'll have to throw out that penguin or
be left on his own."
"I don't remember, but I remember he had a bunch of friends." "Well, children must be protected."
"Like little Stevie and that Apple he tried to give the teacher? Or Jimmy and Marc and that looking glass they brought to school one day? You sure showed them, Daddy. You copied all their best features, put them inside your nesting dolls, and made them cry. I love you, daddy."
StandardsProgress
1
1.1
1.2
1.3
1.4
1.5
2.
2.1
2.2
2.3
2.4
2.5
2.6
2.7
3
Definition: specifications, regulations, and guidelines that help clarify, guide and control processes and activities crucial to our everyday functioning and lives. They specify definitions, performance, and design criteria, creating a common language with which engineers, researchers, businesses, and even students can communicate, create, and learn.
Your value = Your share X Total Industry ValueYour value = Your share X Total Industry Value
Besen and Farrell (1994) gave us three
forms of competition in
standards setting:
Standards War: Firms compete to determine the standard; (Nintendo vs Sony)
Standards Negotiation: Both firms want a standard, but disagree about what standard should be;
Standards Leader: One firm leads with a proprietary standard, the other firm wants to interoperate with the existing standard;
Standards Progress
1
1.1
1.2
1.3
1.4
1.5
2.
2.1
2.2
2.3
2.4
2.5
2.6
2.7
3
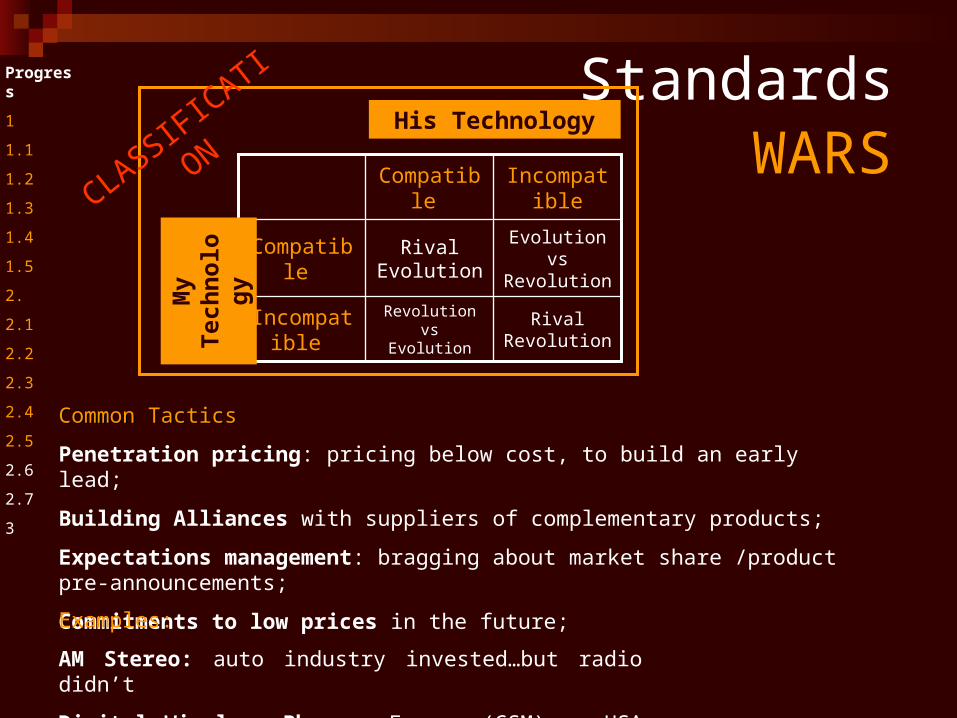
Common TacticsCommon Tactics
Penetration pricing: pricing below cost, to build an early lead;
Building Alliances with suppliers of complementary products;
Expectations management: bragging about market share /product pre-announcements;
Commitments to low prices in the future;
WARS
Examples:
AM Stereo: auto industry invested…but radio didn’t
Digital Wireless Phones: Europe (GSM) vs USA (GSM, TDMA,CDMA)
Rival Revolution
Revolution vs EvolutionIncompatible
Evolution vs Revolution
Rival EvolutionCompatible
IncompatibleCompatible M
y Te
chno
logy
His Technology
CLASSIFI
CATI
ON
Standards Progress
1
1.1
1.2
1.3
1.4
1.5
2.
2.1
2.2
2.3
2.4
2.5
2.6
2.7
3
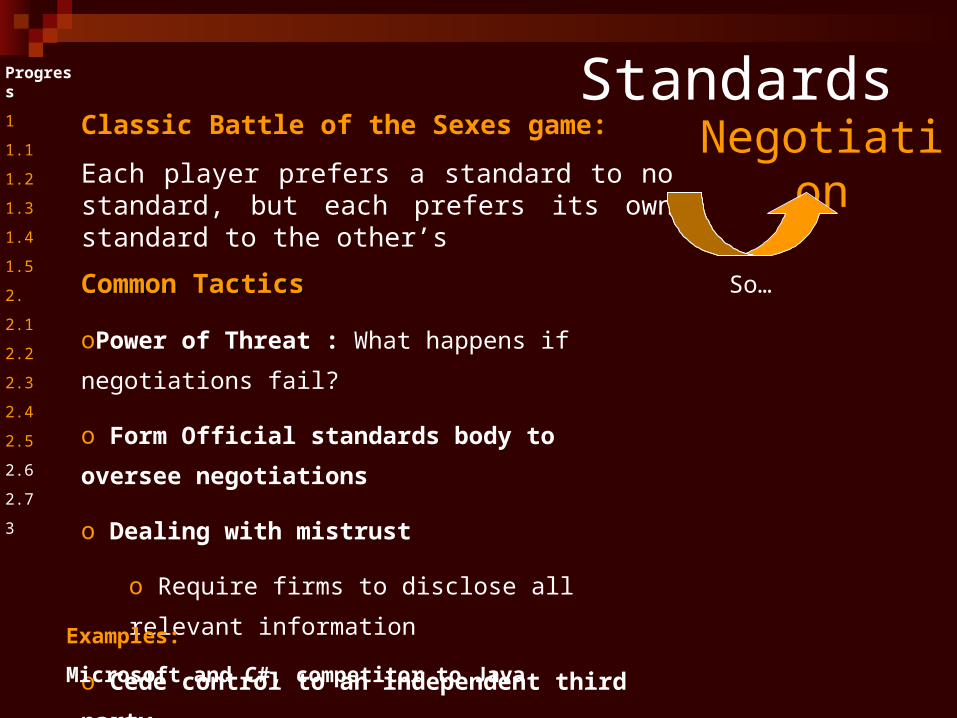
Negotiation
Classic Battle of the Sexes game:
Each player prefers a standard to no standard, but each prefers its own standard to the other’s
So…Common TacticsCommon Tactics
oPower of Threat : What happens if negotiations fail?
o Form Official standards body to oversee negotiations
o Dealing with mistrust
o Require firms to disclose all relevant information
o Cede control to an independent third party
Examples:
Microsoft and C#, competitor to Java
FOLLOWERS
LEADERS
Standards Progress
1
1.1
1.2
1.3
1.4
1.5
2.
2.1
2.2
2.3
2.4
2.5
2.6
2.7
3
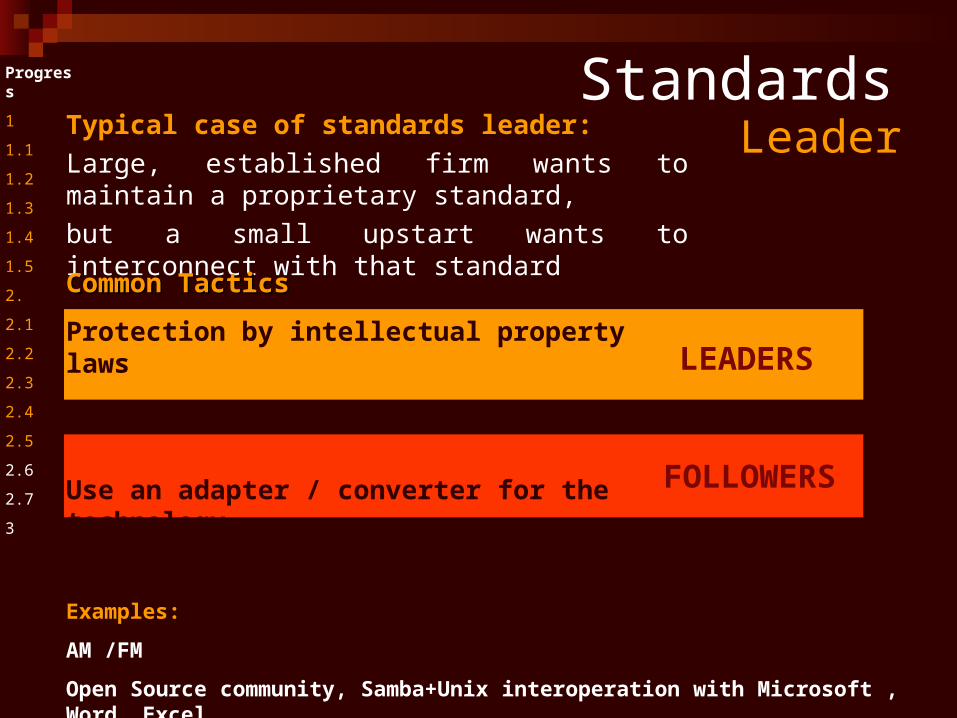
LeaderTypical case of standards leader:Large, established firm wants to maintain a proprietary standard,but a small upstart wants to interconnect with that standard
Common TacticsCommon Tactics
Protection by intellectual property laws
Leader changes technology frequently
Use an adapter / converter for the technologyCan be done with / without leader’s permission
Examples:
AM /FM
Open Source community, Samba+Unix interoperation with Microsoft , Word, Excel
Standards Progress
1
1.1
1.2
1.3
1.4
1.5
2.
2.1
2.2
2.3
2.4
2.5
2.6
2.7
3
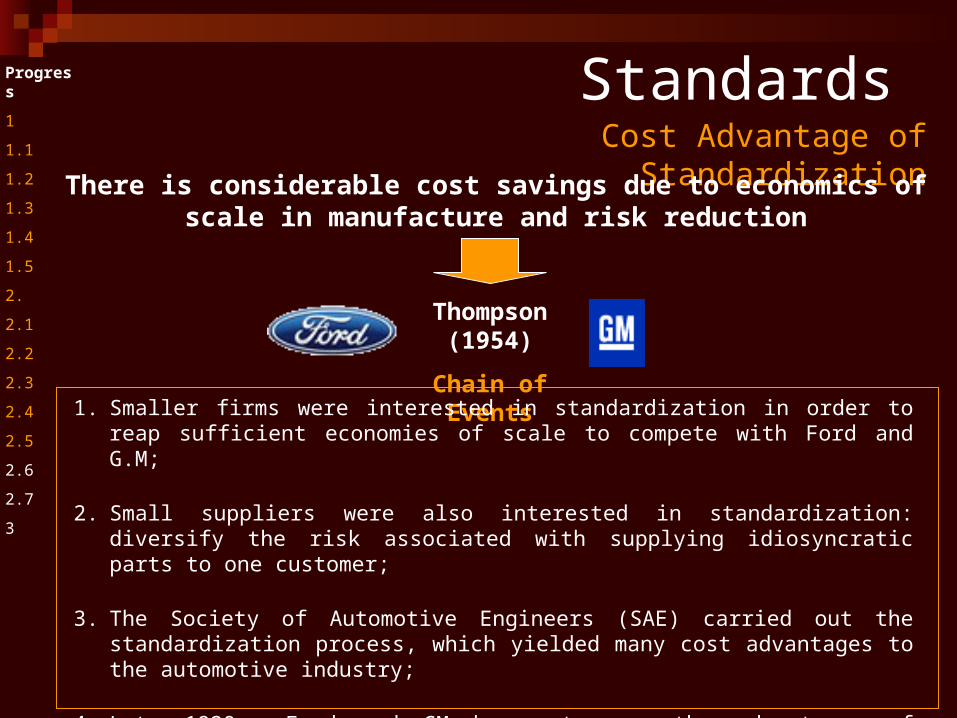
Cost Advantage of StandardizationThere is considerable cost savings due to economics of scale in manufacture and risk
reduction
Thompson (1954)
Chain of Events
1. Smaller firms were interested in standardization in order to reap sufficient economies of scale to compete with Ford and G.M;
2. Small suppliers were also interested in standardization: diversify the risk associated with supplying idiosyncratic parts to one customer;
3. The Society of Automotive Engineers (SAE) carried out the standardization process, which yielded many cost advantages to the automotive industry;
4. Late 1920s: Ford and GM began to see the advantages of standardization, at first focusing on the products of complementors (tires, petroleum products, and the like) but eventually playing a significant role in automobile parts standardization;
System EffectsProgress
1
1.1
1.2
1.3
1.4
1.5
2.
2.1
2.2
2.3
2.4
2.5
2.6
2.7
3
+
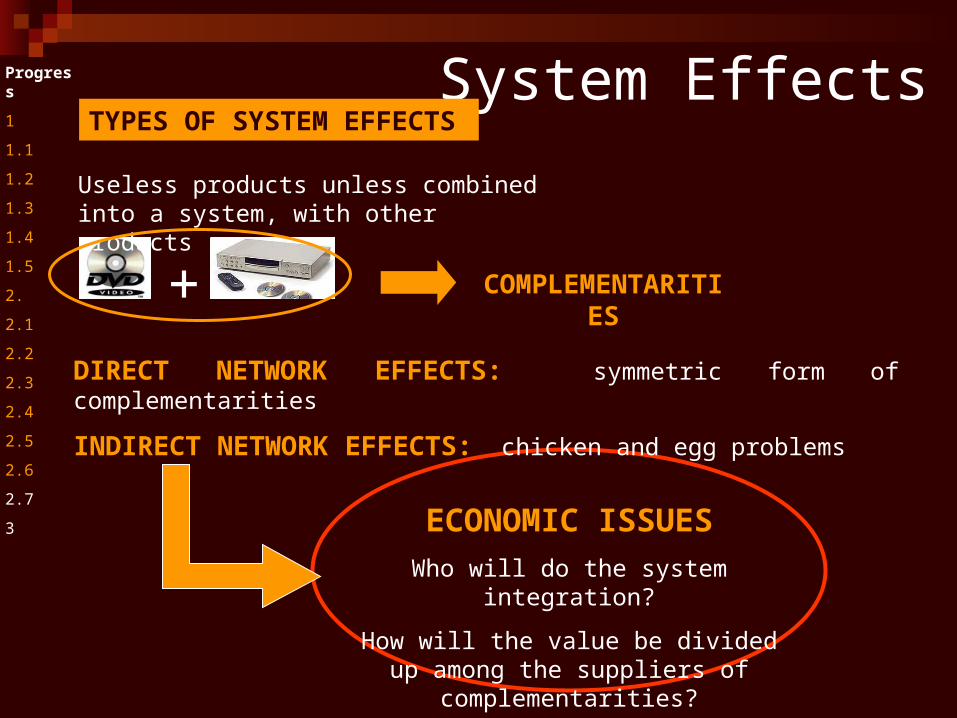
Useless products unless combined into a system, with other products
COMPLEMENTARITIES
DIRECT NETWORK EFFECTS: symmetric form of complementarities
INDIRECT NETWORK EFFECTS: chicken and egg problems
TYPES OF SYSTEM EFFECTS
ECONOMIC ISSUES
Who will do the system integration?
How will the value be divided up among the suppliers of complementarities?
System EffectsProgress
1
1.1
1.2
1.3
1.4
1.5
2.
2.1
2.2
2.3
2.4
2.5
2.6
2.7
3
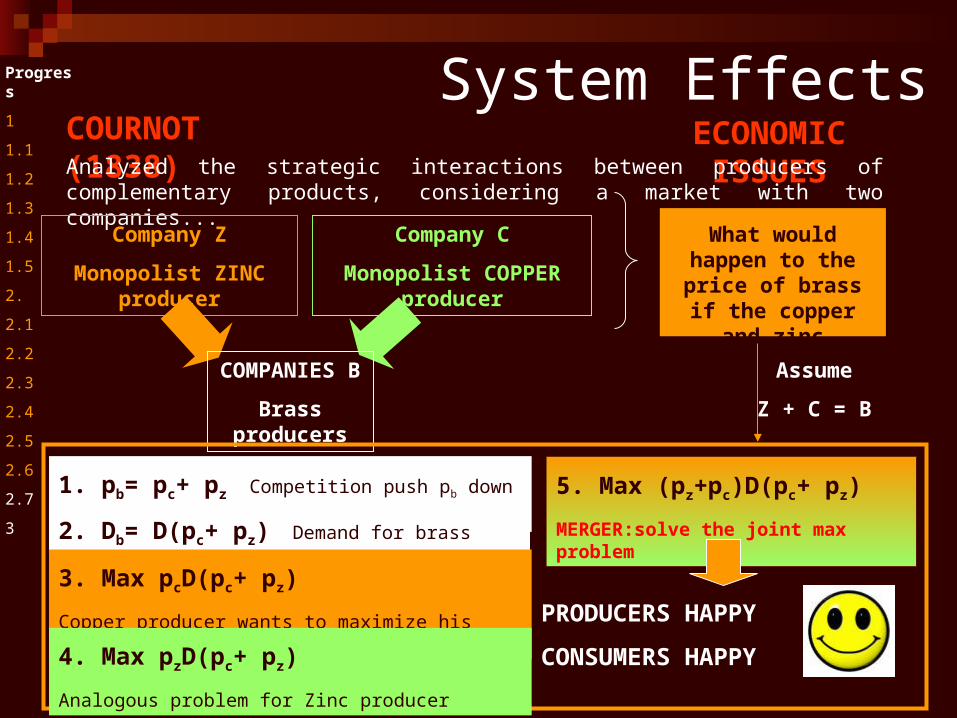
ECONOMIC ISSUESCOURNOT (1838)Analyzed the strategic interactions between producers of complementary products, considering a market with two companies...
Company Z
Monopolist ZINC producer
Company C
Monopolist COPPER producer
COMPANIES B
Brass producers
What would happen to the price of brass if the
copper and zinc producers merged?
Assume
Z + C = B
1. pb= pc+ pz Competition push pb down to it’s cost
2. Db= D(pc+ pz) Demand for brass
3. Max pcD(pc+ pz)
Copper producer wants to maximize his profits
4. Max pzD(pc+ pz)
Analogous problem for Zinc producer
5. Max (pz+pc)D(pc+ pz)
MERGER:solve the joint max problem
PRODUCERS HAPPY
CONSUMERS HAPPY
System EffectsProgress
1
1.1
1.2
1.3
1.4
1.5
2.
2.1
2.2
2.3
2.4
2.5
2.6
2.7
3
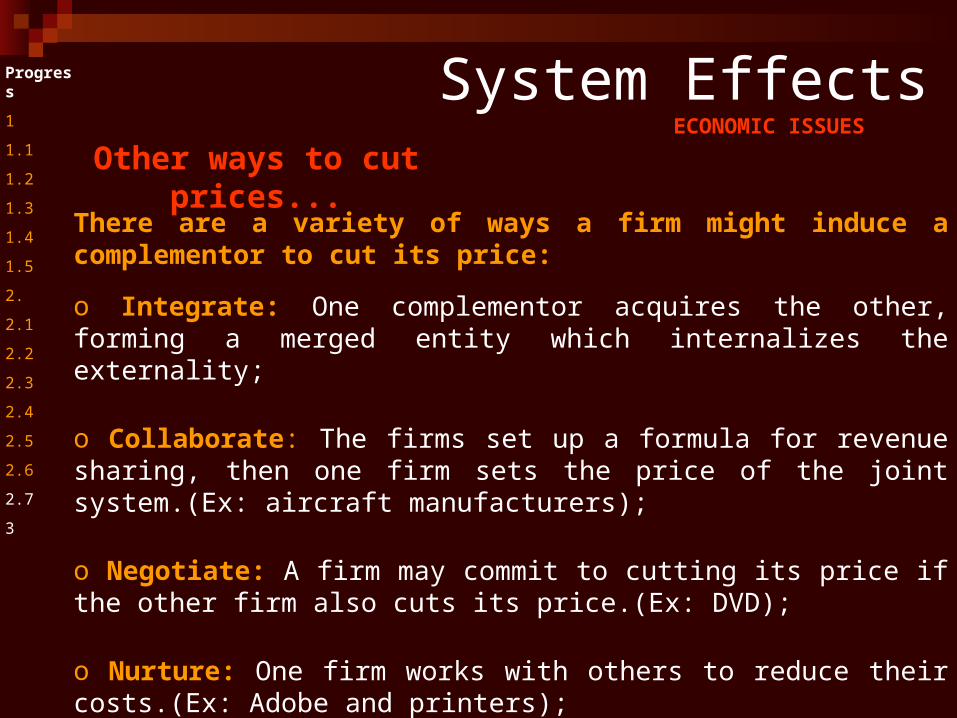
ECONOMIC ISSUES
There are a variety of ways a firm might induce a complementor to cut its price:
o Integrate: One complementor acquires the other, forming a merged entity which internalizes the externality;
o Collaborate: The firms set up a formula for revenue sharing, then one firm sets the price of the joint system.(Ex: aircraft manufacturers);
o Negotiate: A firm may commit to cutting its price if the other firm also cuts its price.(Ex: DVD);
o Nurture: One firm works with others to reduce their costs.(Ex: Adobe and printers);
o Commoditize: One firm attempts to stimulate competition in the other's market, thereby pushing down prices. (Ex: Microsoft)
Other ways to cut prices...
Computer mediated transactionsProgress
1
1.1
1.2
1.3
1.4
1.5
2.
2.1
2.2
2.3
2.4
2.5
2.6
2.7
3
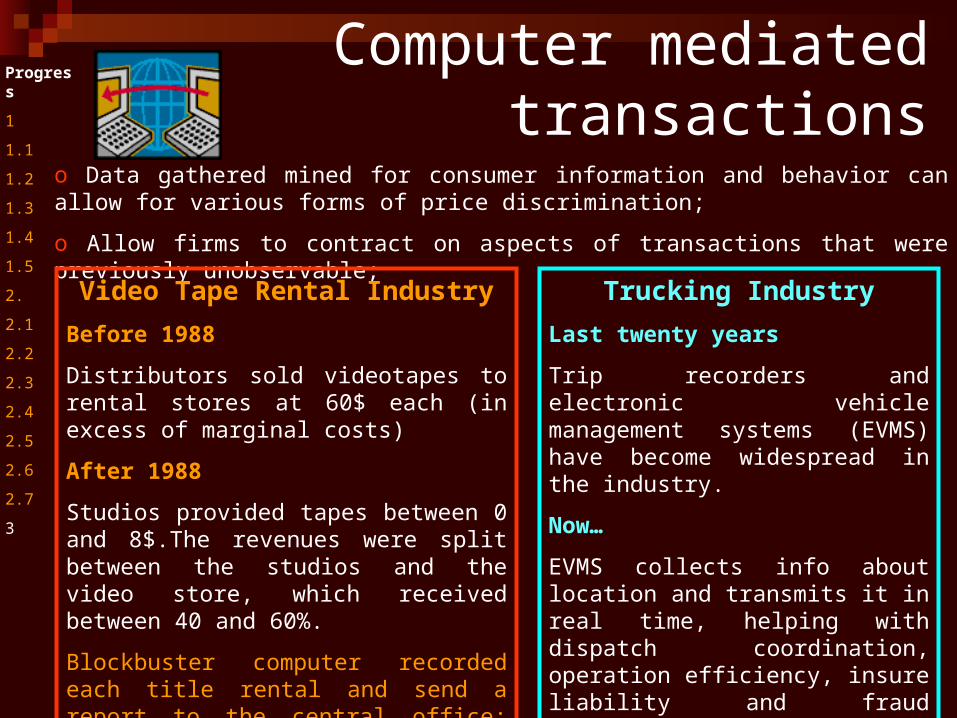
o Data gathered mined for consumer information and behavior can allow for various forms of price discrimination;
o Allow firms to contract on aspects of transactions that were previously unobservable;
Video Tape Rental Industry
Before 1988
Distributors sold videotapes to rental stores at 60$ each (in excess of marginal costs)
After 1988
Studios provided tapes between 0 and 8$.The revenues were split between the studios and the video store, which received between 40 and 60%.
Blockbuster computer recorded each title rental and send a report to the central office: all parties in transaction were able to verify the revenues were being shared in the agreed-upon way.
Trucking Industry
Last twenty years
Trip recorders and electronic vehicle management systems (EVMS) have become widespread in the industry.
Now…
EVMS collects info about location and transmits it in real time, helping with dispatch coordination, operation efficiency, insure liability and fraud detection, making the industry more cost effective.
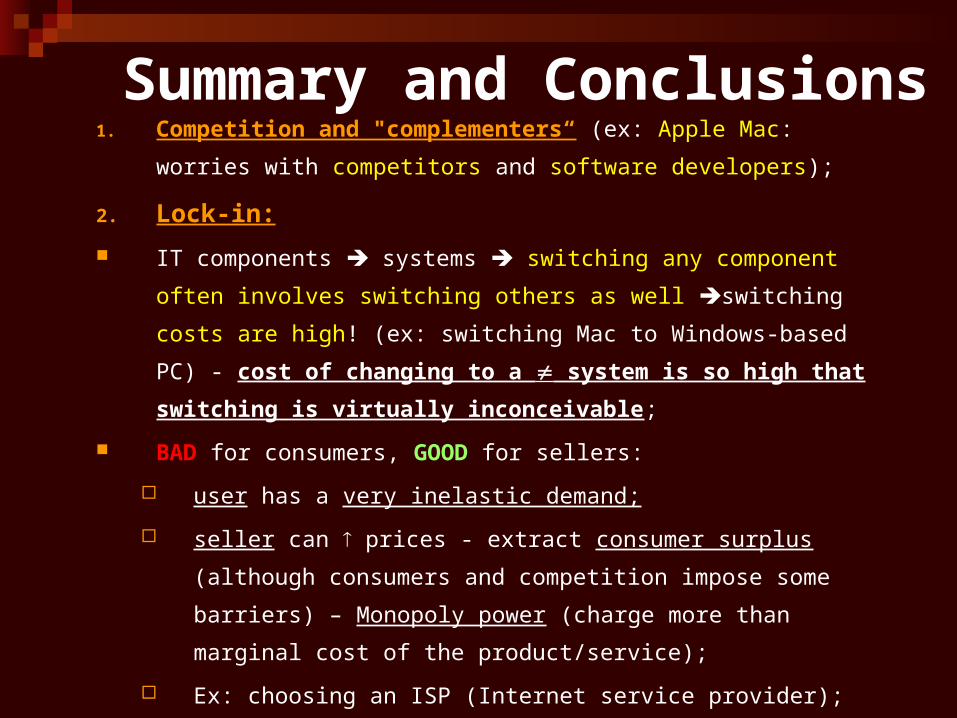
Summary and Conclusions1. Competition and "complementers“ (ex: Apple Mac: worries with competitors and
software developers);
2. Lock-in:
IT components systems switching any component often involves switching
others as well switching costs are high! (ex: switching Mac to Windows-based
PC) - cost of changing to a system is so high that switching is virtually
inconceivable;
BAD for consumers, GOOD for sellers:
user has a very inelastic demand;
seller can prices - extract consumer surplus (although consumers and
competition impose some barriers) – Monopoly power (charge more than
marginal cost of the product/service);
Ex: choosing an ISP (Internet service provider);
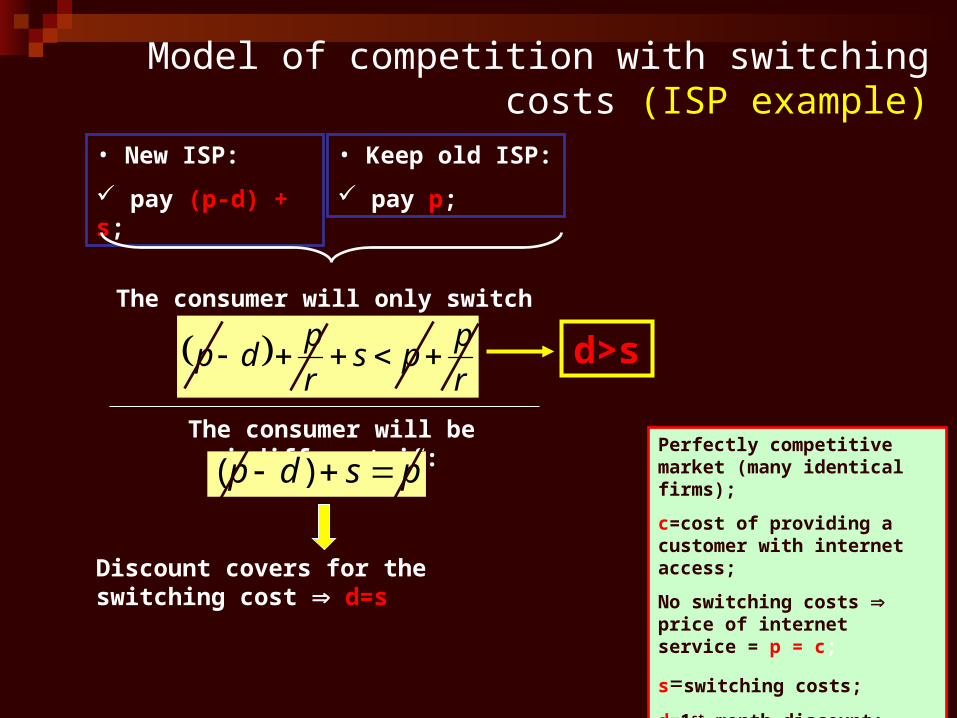
Model of competition with switching costs (ISP example)
Perfectly competitive market (many identical firms);
c=cost of providing a customer with internet access;
No switching costs price of internet service = p = c;
s=switching costs;
d=1st month discount;
r=monthly interest rate;
• New ISP:
pay (p-d) + s;
• Keep old ISP:
pay p;
The consumer will only switch if:
r
pps
r
pdp
The consumer will be indifferent if:
psdp )(
Discount covers for the switching cost d=s
d>s
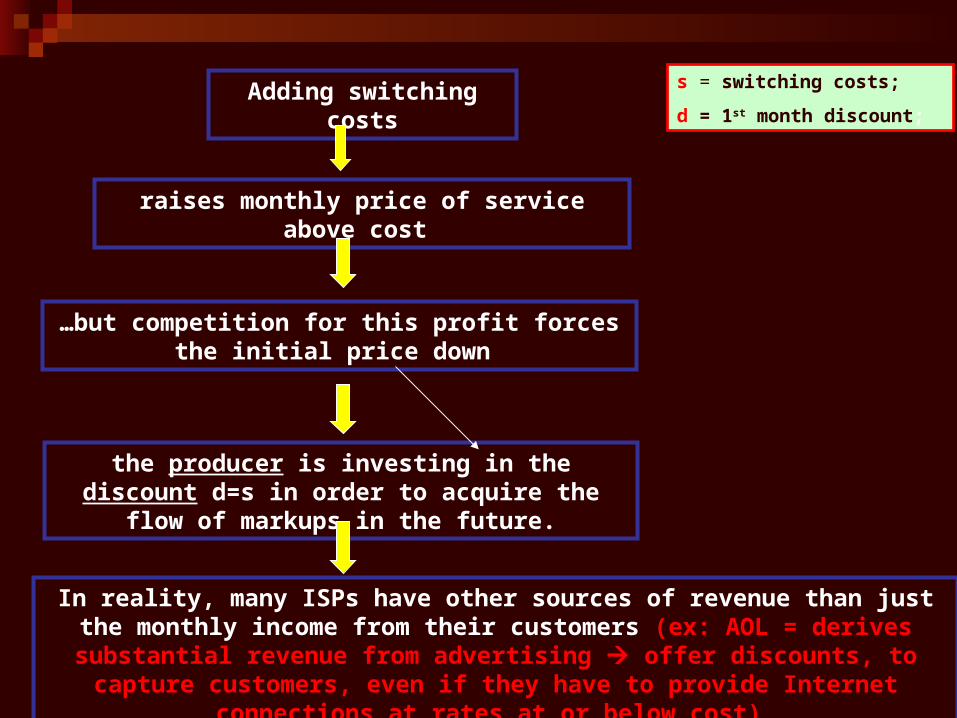
s = switching costs;
d = 1st month discount;Adding switching costs
raises monthly price of service above cost
…but competition for this profit forces the initial price down
the producer is investing in the discount d=s in order to acquire the flow of markups in the future.
In reality, many ISPs have other sources of revenue than just the monthly income from their customers (ex: AOL = derives substantial revenue from advertising offer discounts, to capture customers, even if they have to
provide Internet connections at rates at or below cost)
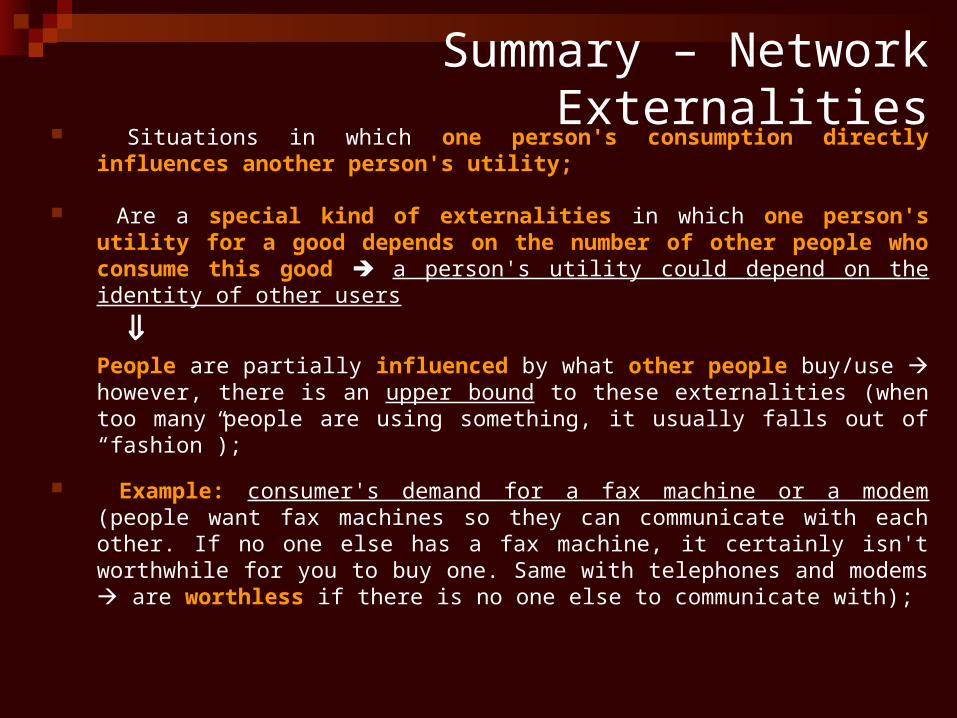
Summary – Network Externalities Situations in which one person's consumption directly influences another
person's utility;
Are a special kind of externalities in which one person's utility for a good depends on the number of other people who consume this good a person's utility could depend on the identity of other users
People are partially influenced by what other people buy/use however, there is an upper bound to these externalities (when too many people are using something, it usually falls out of “fashion”);
Example: consumer's demand for a fax machine or a modem (people want fax machines so they can communicate with each other. If no one else has a fax machine, it certainly isn't worthwhile for you to buy one. Same with telephones and modems are worthless if there is no one else to communicate with);
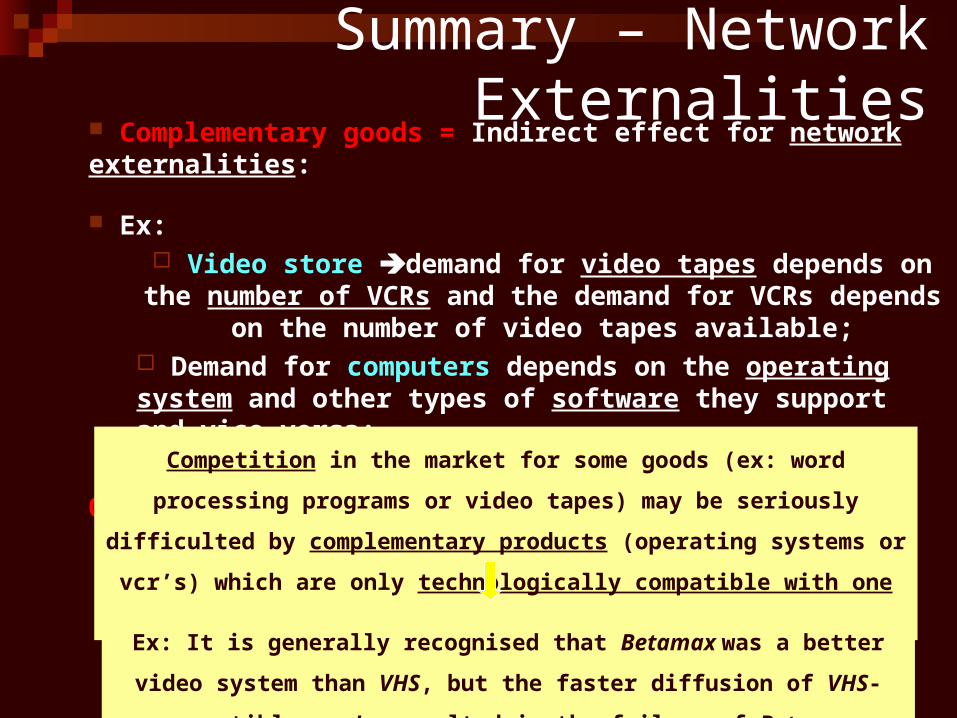
Complementary goods = Indirect effect for network externalities:
Ex: Video store demand for video tapes depends on the number of VCRs
and the demand for VCRs depends on the number of video tapes available; Demand for computers depends on the operating system and other types of software they support and vice-versa;
Question of compatibility:
Competition in the market for some goods (ex: word processing programs or video tapes)
may be seriously difficulted by complementary products (operating systems or vcr’s)
which are only technologically compatible with one of the competitors
Ex: It is generally recognised that Betamax was a better video system than VHS, but the
faster diffusion of VHS-compatible vcr’s resulted in the failure of Betamax
Summary – Network Externalities
Summary – Network Externalities
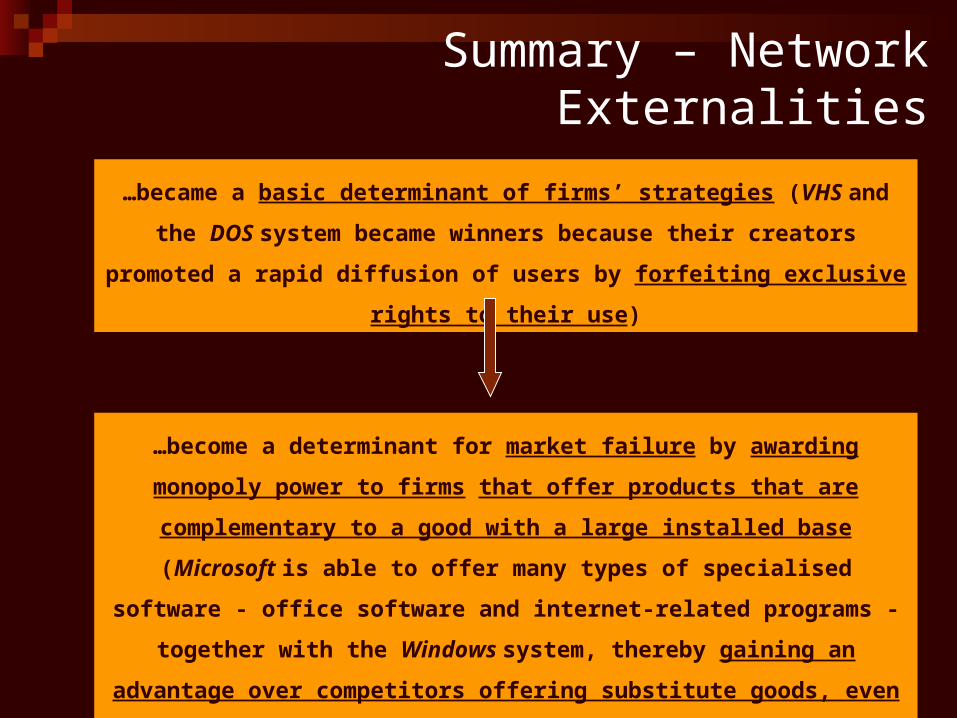
…became a basic determinant of firms’ strategies (VHS and the DOS
system became winners because their creators promoted a rapid diffusion
of users by forfeiting exclusive rights to their use)
…become a determinant for market failure by awarding monopoly power
to firms that offer products that are complementary to a good with a large
installed base (Microsoft is able to offer many types of specialised
software - office software and internet-related programs - together with the
Windows system, thereby gaining an advantage over competitors offering
substitute goods, even if these goods can also work with Windows)
Demand curve
Supply curve
SIZE OF NETWORK
WILLINGLESS TO PAY
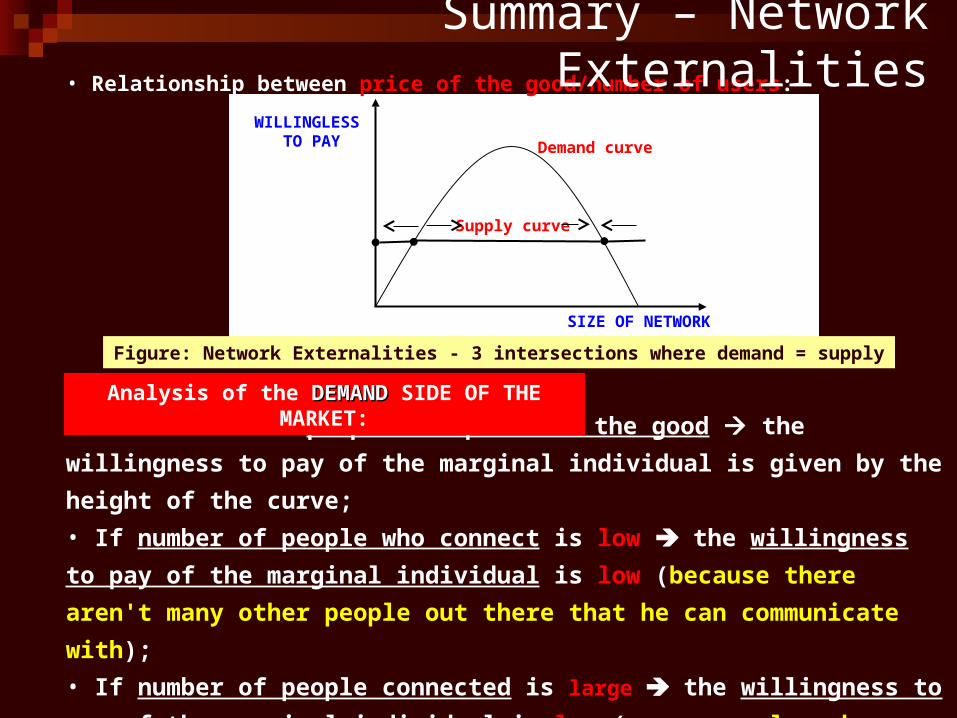
• Relationship between price of the good/number of users:
• If there are n people who purchase the good the willingness to pay of the marginal
individual is given by the height of the curve;
• If number of people who connect is low the willingness to pay of the marginal individual is
low (because there aren't many other people out there that he can communicate with);
• If number of people connected is large the willingness to pay of the marginal individual is
low (everyone else who valued it more highly has already connected);
• Plausible to assume: when people are willing to pay more than the cost of the good - market
. When people are willing to pay less than the cost of the good - market .
Figure: Network Externalities - 3 intersections where demand = supply
Analysis of the DEMANDDEMAND SIDE OF THE MARKET:
Summary – Network Externalities
Demand curve
Supply curve
SIZE OF NETWORK
WILLINGLESS TO PAY
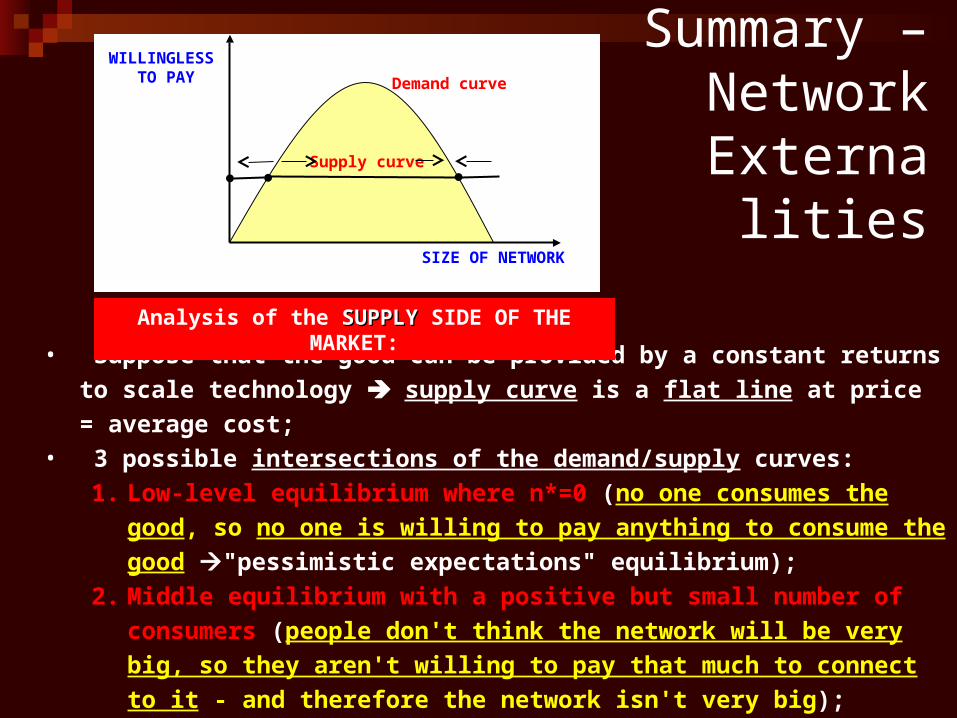
• Suppose that the good can be provided by a constant returns to scale technology supply
curve is a flat line at price = average cost;• 3 possible intersections of the demand/supply curves:
1. Low-level equilibrium where n*=0 (no one consumes the good, so no one is willing to
pay anything to consume the good "pessimistic expectations" equilibrium);
2. Middle equilibrium with a positive but small number of consumers (people don't think
the network will be very big, so they aren't willing to pay that much to connect to it - and
therefore the network isn't very big);
3. Large number of people equilibrium – nH (price is small because the marginal person
who purchases the good doesn't value it very highly, even though the market is very
large).
Analysis of the SUPPLYSUPPLY SIDE OF THE MARKET:
Summary – Network
Externalities
Demand curve
Low cost
SIZE OF NETWORK
WILLINGLESS TO PAY
High cost
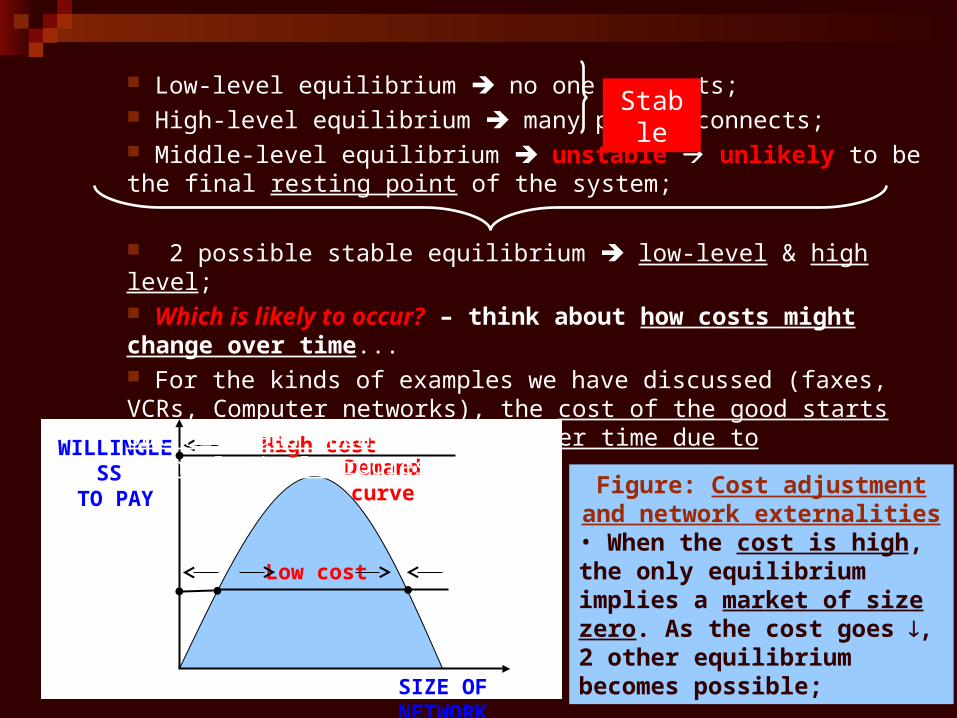
Low-level equilibrium no one connects; High-level equilibrium many people connects; Middle-level equilibrium unstable unlikely to be the final resting point of the system;
2 possible stable equilibrium low-level & high level; Which is likely to occur? – think about how costs might change over time... For the kinds of examples we have discussed (faxes, VCRs, Computer networks), the cost of the good starts out high and then decreases over time due to technological progress:
Stable
Figure: Cost adjustment and network externalities
• When the cost is high, the only equilibrium implies a market of size zero. As the cost goes , 2 other equilibrium becomes possible;
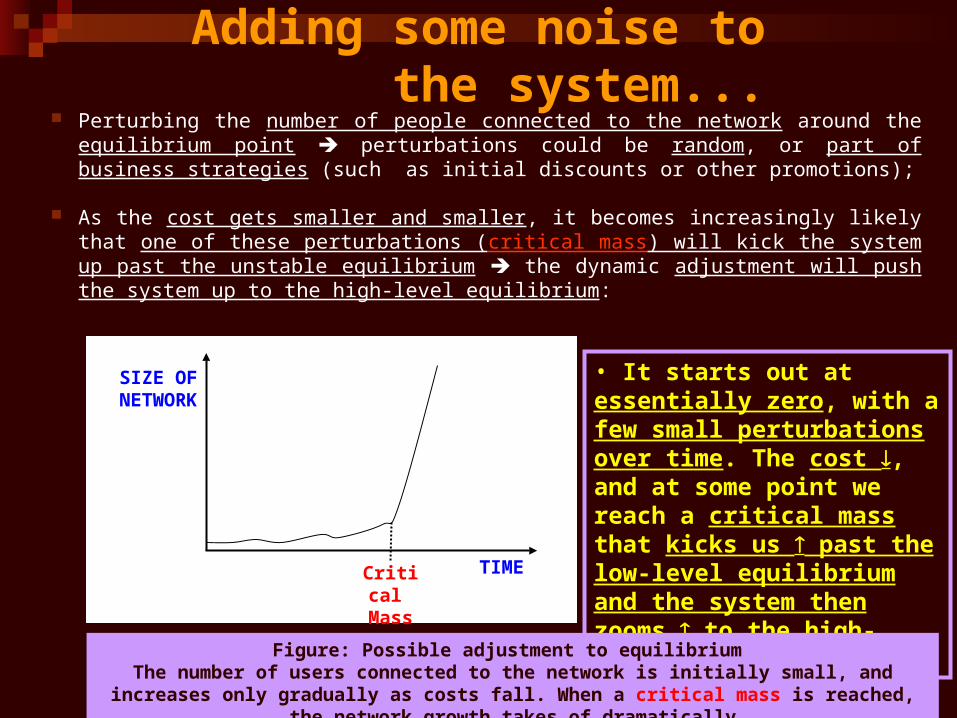
Adding some noise to the system... Perturbing the number of people connected to the network around the equilibrium
point perturbations could be random, or part of business strategies (such as initial discounts or other promotions);
As the cost gets smaller and smaller, it becomes increasingly likely that one of these perturbations (critical mass) will kick the system up past the unstable equilibrium the dynamic adjustment will push the system up to the high-level equilibrium:
• It starts out at essentially zero, with a few small perturbations over time. The cost , and at some point we reach a critical mass that kicks us past the low-level equilibrium and the system then zooms to the high-level equilibrium
Critical Mass
TIME
SIZE OFNETWORK
Figure: Possible adjustment to equilibrium The number of users connected to the network is initially small, and increases only gradually as costs fall. When
a critical mass is reached, the network growth takes of dramatically
Summary – Implications of Network Externalities
Critical mass issue is very important: if one user's demand depends on how many other users exist, it is very important to try to stimulate
growth early in the life cycle of a product;
Nowadays it is quite common to see producers offering very cheap access to a piece of software or a communications service in order to
"create a market" where none existed before;
For the increasing returns to be fully exploited, the network has to reach a particular critical mass;
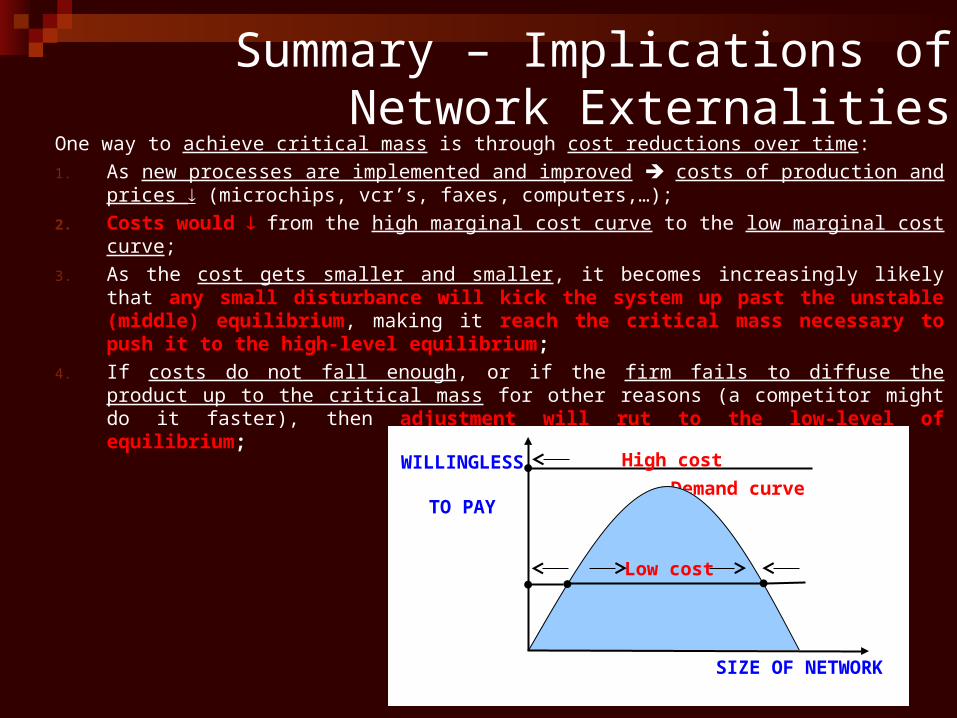
Summary – Implications of Network ExternalitiesOne way to achieve critical mass is through cost reductions over time:1. As new processes are implemented and improved costs of production and prices
(microchips, vcr’s, faxes, computers,…);2. Costs would from the high marginal cost curve to the low marginal cost curve;3. As the cost gets smaller and smaller, it becomes increasingly likely that any small
disturbance will kick the system up past the unstable (middle) equilibrium, making it reach the critical mass necessary to push it to the high-level equilibrium;
4. If costs do not fall enough, or if the firm fails to diffuse the product up to the critical mass for other reasons (a competitor might do it faster), then adjustment will rut to the low-level of equilibrium;
Demand curve
Low cost
SIZE OF NETWORK
WILLINGLESS TO PAY
High cost
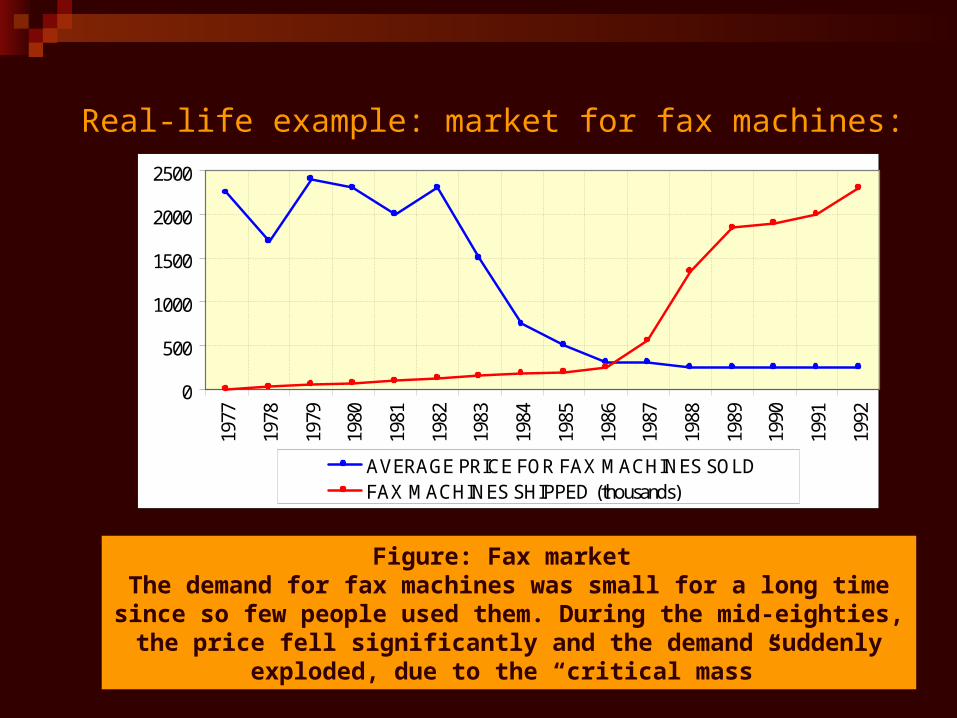
Real-life example: market for fax machines:
0
500
1000
1500
2000
2500
1977
1978
1979
1980
1981
1982
1983
1984
1985
1986
1987
1988
1989
1990
1991
1992
AVERAGE PRICE FOR FAX MACHINES SOLDFAX MACHINES SHIPPED (thousands)
Figure: Fax market The demand for fax machines was small for a long time since so few people used
them. During the mid-eighties, the price fell significantly and the demand suddenly exploded, due to the “critical mass”
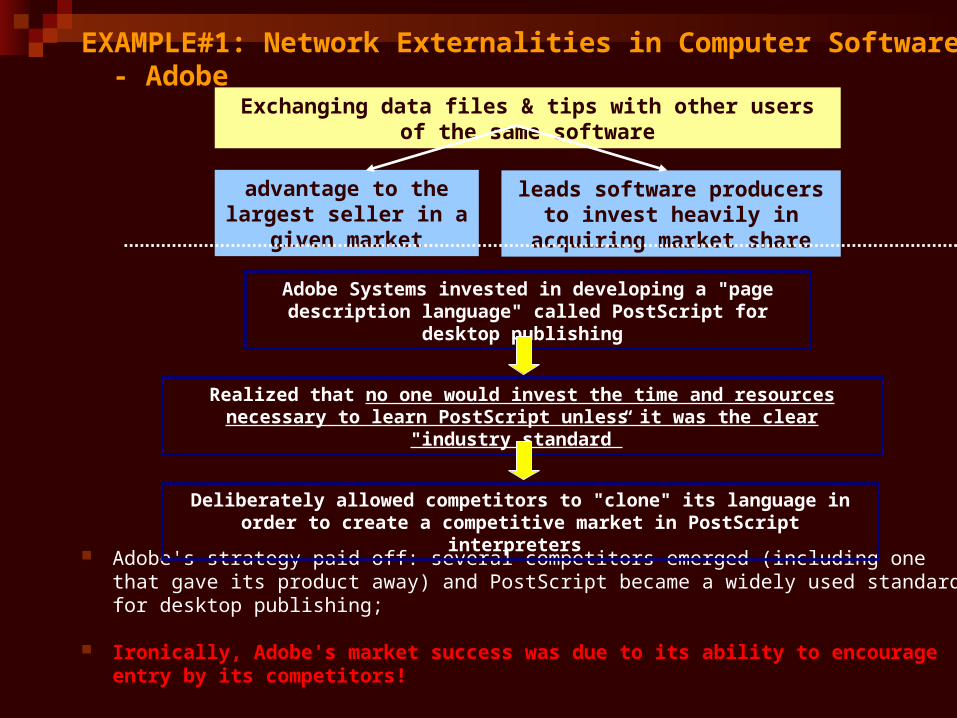
EXAMPLE#1: Network Externalities in Computer Software - Adobe
Adobe's strategy paid off: several competitors emerged (including one that gave its product away) and PostScript became a widely used standard for desktop publishing;
Ironically, Adobe's market success was due to its ability to encourage entry by its competitors!
Exchanging data files & tips with other users of the same software
advantage to the largest seller in a given market
leads software producers to invest heavily in acquiring market share
Adobe Systems invested in developing a "page description language" called PostScript for desktop publishing
Realized that no one would invest the time and resources necessary to learn PostScript unless it was the clear "industry standard”
Deliberately allowed competitors to "clone" its language in order to create a competitive market in PostScript interpreters
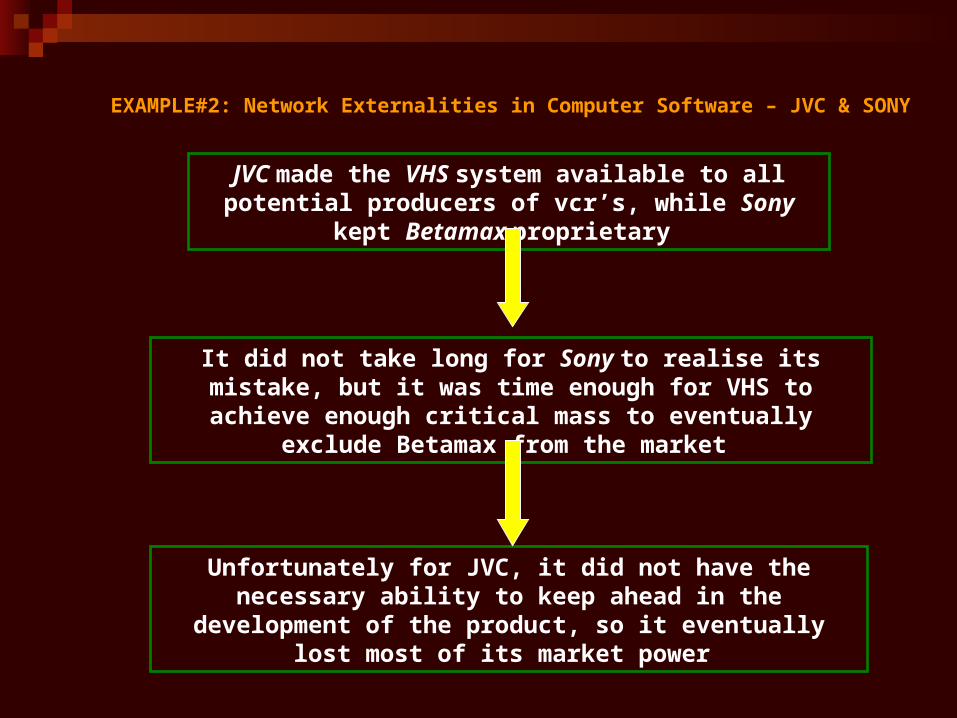
EXAMPLE#2: Network Externalities in Computer Software – JVC & SONY
JVC made the VHS system available to all potential producers of vcr’s, while Sony kept Betamax proprietary
It did not take long for Sony to realise its mistake, but it was time enough for VHS to achieve enough critical mass to eventually exclude Betamax
from the market
Unfortunately for JVC, it did not have the necessary ability to keep ahead in the development of the product, so it eventually lost most of its market
power
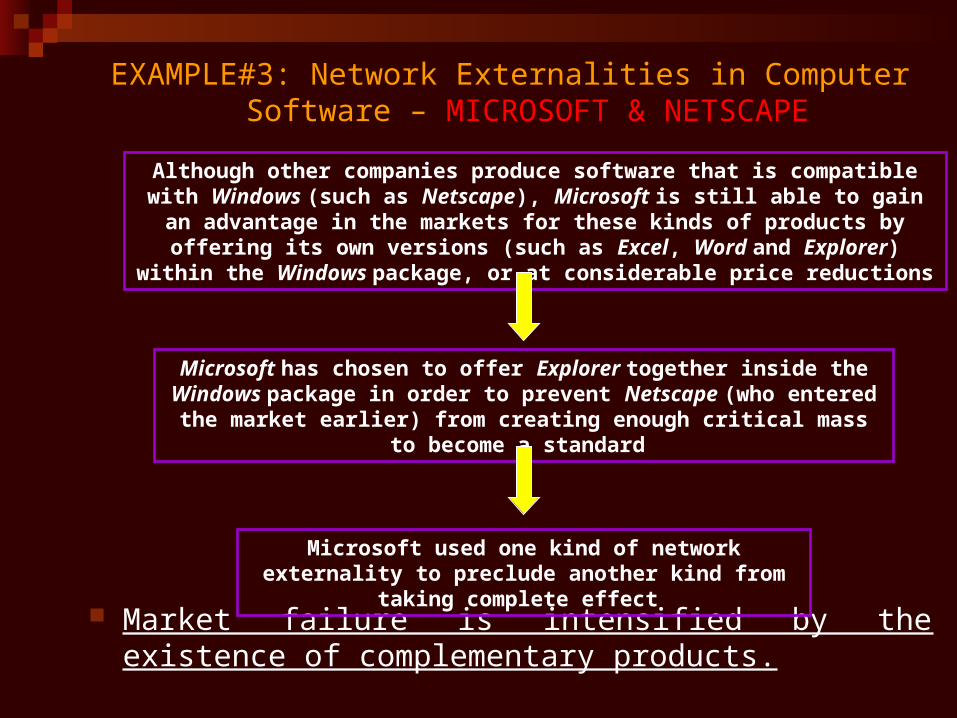
EXAMPLE#3: Network Externalities in Computer Software – MICROSOFT & NETSCAPE
Market failure is intensified by the existence of complementary products.
Although other companies produce software that is compatible with Windows (such as Netscape), Microsoft is still able to gain an advantage in the markets for these kinds of products by offering its own versions (such as Excel, Word and Explorer) within the Windows package, or
at considerable price reductions
Microsoft has chosen to offer Explorer together inside the Windows package in order to prevent Netscape (who entered the market earlier) from creating enough critical
mass to become a standard
Microsoft used one kind of network externality to preclude another kind from taking complete effect
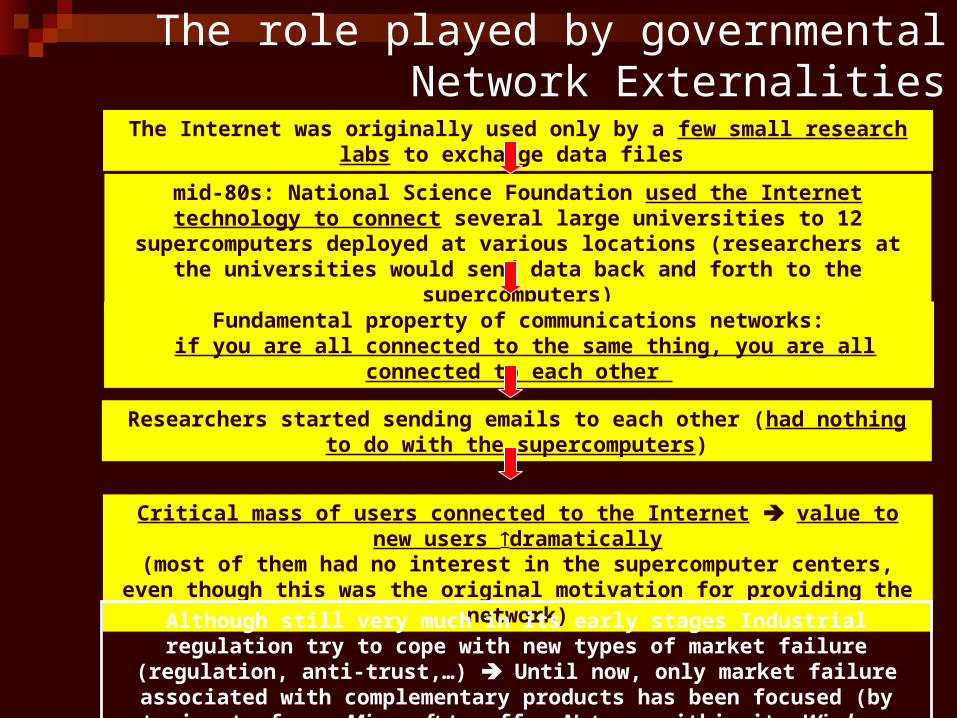
The role played by governmental Network Externalities
The Internet was originally used only by a few small research labs to exchange data files
mid-80s: National Science Foundation used the Internet technology to connect several large universities to 12 supercomputers deployed at various locations (researchers at the universities
would send data back and forth to the supercomputers)
Fundamental property of communications networks: if you are all connected to the same thing, you are all connected to each other
Researchers started sending emails to each other (had nothing to do with the supercomputers)
Critical mass of users connected to the Internet value to new users dramatically(most of them had no interest in the supercomputer centers, even though this was the original
motivation for providing the network)
Although still very much in its early stages Industrial regulation try to cope with new types of market failure (regulation, anti-trust,…) Until now, only market failure associated with
complementary products has been focused (by trying to force Microsoft to offer Netscape within its Windows package, as it does with Explorer)
Summary: Rights Management• Intelectual Property transactions take a variety of forms:
1. Books are sold outright and also borrowed from libraries;2. Textbooks (are shared among students from one term to the next via
the resale market;3. Videos can either be sold or rented;4. Some software is licensed for particular uses. Other software is sold
outright;5. Shareware is a form of software in which payment is voluntary.
Librarians established the "rule of five" for interlibrary loan: an item may be loaned out up to five times before additional royalty payments should be made to the publisher Publishers and authors are unenthusiastic about the resale market for books;
Digital information can be perfectly reproduced, and "sharing" can be taken to new extremes;CDs do not deteriorate with replay and it is possible to buy a CD, record it, and then sell it to
the used-CD store;
• Critical Business Decision = Choosing the terms and conditions under which a piece of intellectual property is offered:
1. Should you use copy protection? 2. Should you encourage users to share a new item with a friend?3. Should you sell to individuals or use site license?
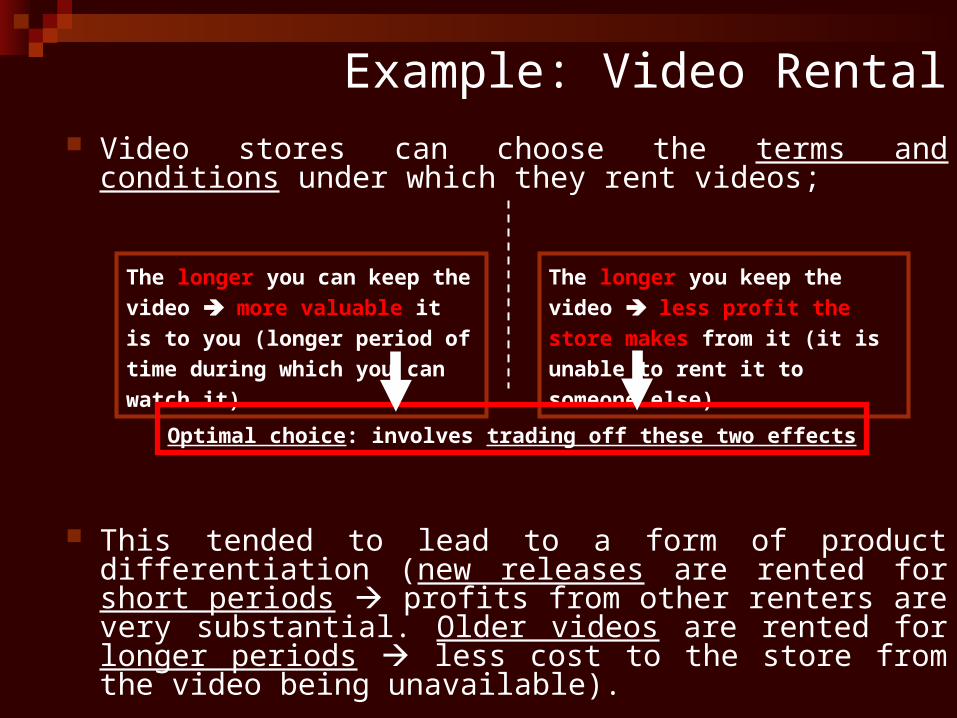
Example: Video Rental Video stores can choose the terms and conditions under which they rent
videos;
This tended to lead to a form of product differentiation (new releases are rented for short periods profits from other renters are very substantial. Older videos are rented for longer periods less cost to the store from the video being unavailable).
The longer you can keep the video
more valuable it is to you (longer period
of time during which you can watch it)
The longer you keep the video less
profit the store makes from it (it is unable
to rent it to someone else)
Optimal choice: involves trading off these two effects
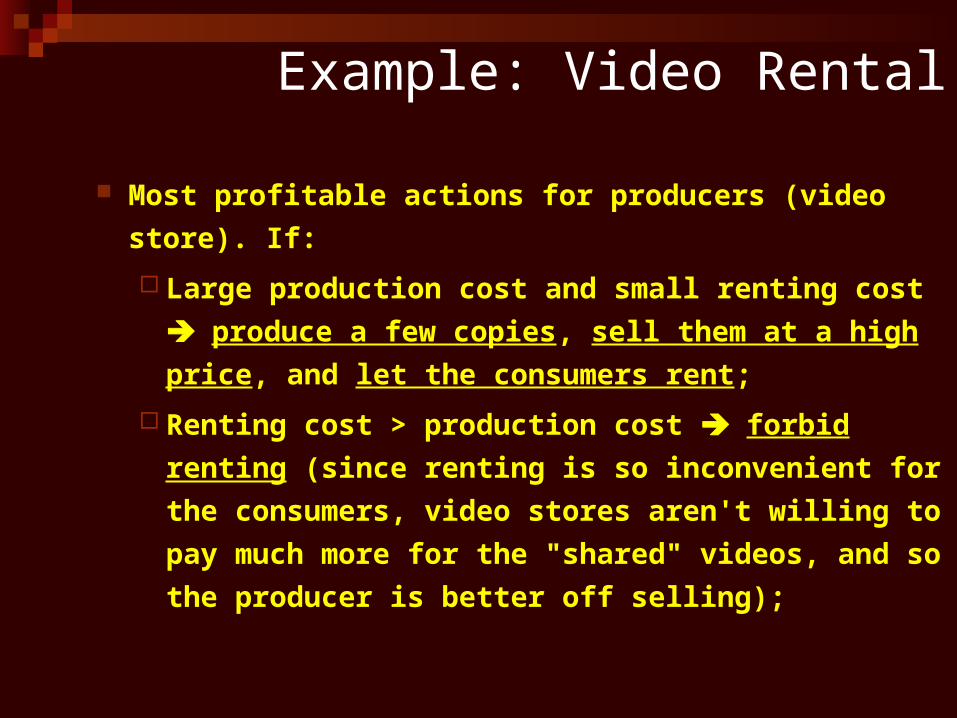
Most profitable actions for producers (video store). If:
Large production cost and small renting cost produce a
few copies, sell them at a high price, and let the consumers
rent;
Renting cost > production cost forbid renting (since
renting is so inconvenient for the consumers, video stores
aren't willing to pay much more for the "shared" videos, and
so the producer is better off selling);
Example: Video Rental
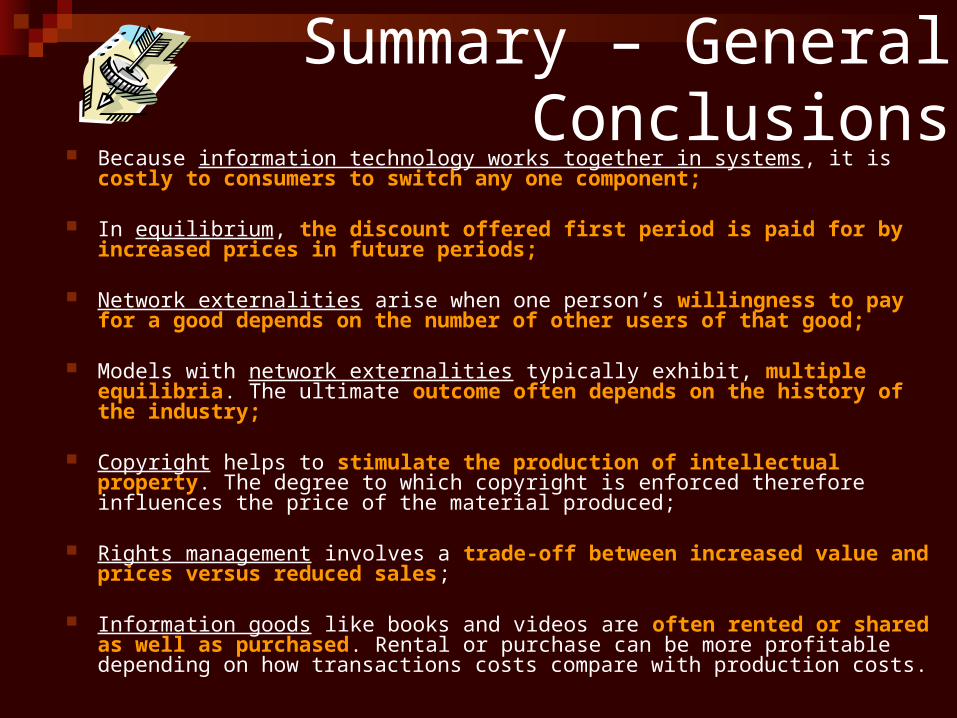
Because information technology works together in systems, it is costly to consumers to switch any one component;
In equilibrium, the discount offered first period is paid for by increased prices in future periods;
Network externalities arise when one person’s willingness to pay for a good depends on the number of other users of that good;
Models with network externalities typically exhibit, multiple equilibria. The ultimate outcome often depends on the history of the industry;
Copyright helps to stimulate the production of intellectual property. The degree to which copyright is enforced therefore influences the price of the material produced;
Rights management involves a trade-off between increased value and prices versus reduced sales;
Information goods like books and videos are often rented or shared as well as purchased. Rental or purchase can be more profitable depending on how transactions costs compare with production costs.
Summary – General Conclusions
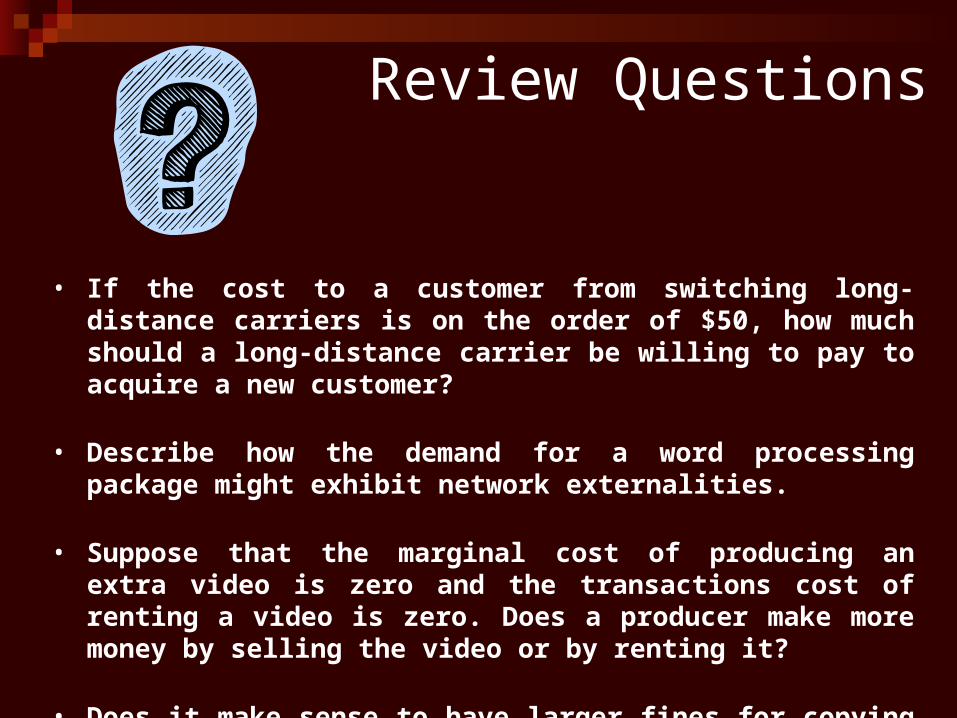
Review Questions
• If the cost to a customer from switching long-distance carriers is on the order of $50, how much should a long-distance carrier be willing to pay to acquire a new customer?
• Describe how the demand for a word processing package might exhibit network externalities.
• Suppose that the marginal cost of producing an extra video is zero and the transactions cost of renting a video is zero. Does a producer make more money by selling the video or by renting it?
• Does it make sense to have larger fines for copying products with larger development costs?
References and Links
III. The Economics of the Internet, Information Goods, Intellectual Property and Related Issues Compiled by Hal R. Varian
IV. www.sims.berkeley.edu/resources/infoecon/
V. World Wide Web Consortium
VI. www.w3c.org
VII. CID - Center for International Development at Harvard University
VIII. www.cid.harvard.edu/cr/profiles.html
IX. Magazines
X. www.fastcompany.com
XI. www.redherring.com
XII. www.wired.com
I. Economics of the Information Technology, Hal R. Varian
II. Intermediate Microeconomics, Hal R. Varian, 5th edition