Embed Size (px)
Citation preview

INFORMATION TECHNOLOGY IN BUSINESS AND SOCIETYSESSION 25 – REVIEW AND WRAP UP
SEAN J. TAYLOR

ADMINISTRATIVIA
• G1: Submit group feedback forms
• G2:
• You do not need to dress up.• Bring slides on a USB drive or bring a laptop.• 15 minutes total. Optionally end 2-3 minutes
early to take questions.• Not everyone needs to present, but make it
clear to me who did what!
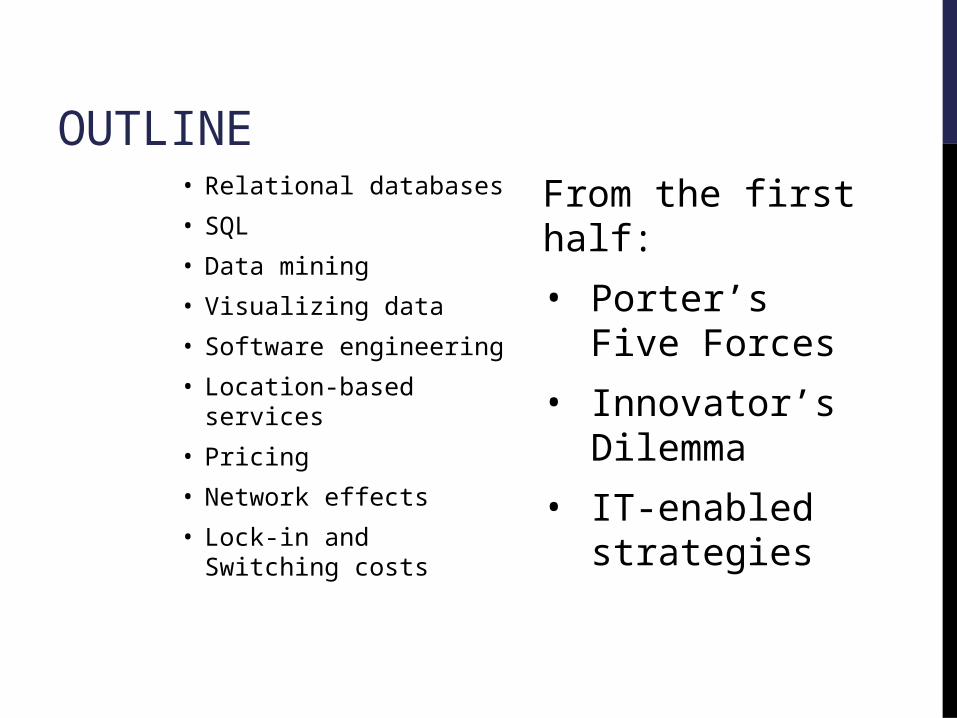
OUTLINE• Relational databases
• SQL
• Data mining
• Visualizing data
• Software engineering
• Location-based services
• Pricing
• Network effects
• Lock-in and Switching costs
From the first half:
• Porter’s Five Forces
• Innovator’s Dilemma
• IT-enabled strategies

THE FIVE COMPETITIVE FORCES
Industry that you are analyzing
(focal industry)Bargaining Power
of Suppliers
The bargaining power of the firms that sell
inputs to the firms in the focal industry
Bargaining Powerof Buyers
The bargaining power of the customers that buythe finished products of
the firms in the focal industry
Barriers to Entry, orThreat of new Entrants
The threat of entryby potential entrants
(new firms) into the focal industry
Threat of SubstituteProducts or Services
The threat of products/services that could substitute (be used
instead of) the finished products made by the firms in the focal industry
Rivalry AmongExisting Competitors
The extent of rivalry between the existing firms
in the focal industry
firm = company = organization = business = competitor

SUSTAINING VS. DISRUPTIVEINNOVATIONS

FOUR KEY INTERNET-ENABLED STRATEGIES4 Key Internet-enabled Strategies for Competitive Advantage:
1. Disintermediation
2. Mass Customization
3. Personalization
4. Global Reach
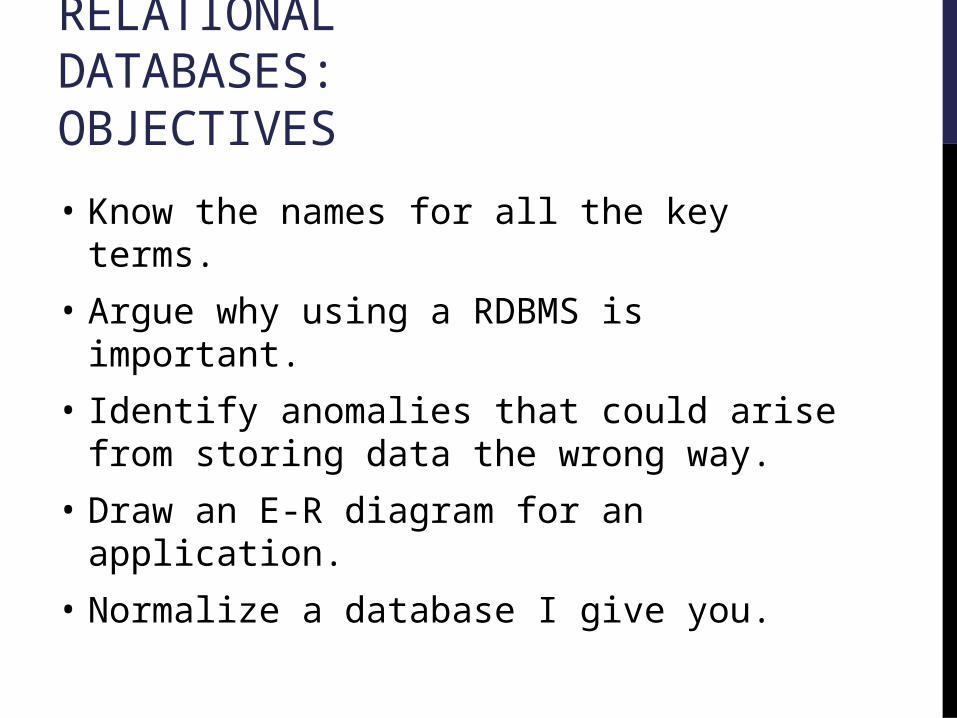
RELATIONAL DATABASES:OBJECTIVES
• Know the names for all the key terms.
• Argue why using a RDBMS is important.
• Identify anomalies that could arise from storing data the wrong way.
• Draw an E-R diagram for an application.
• Normalize a database I give you.
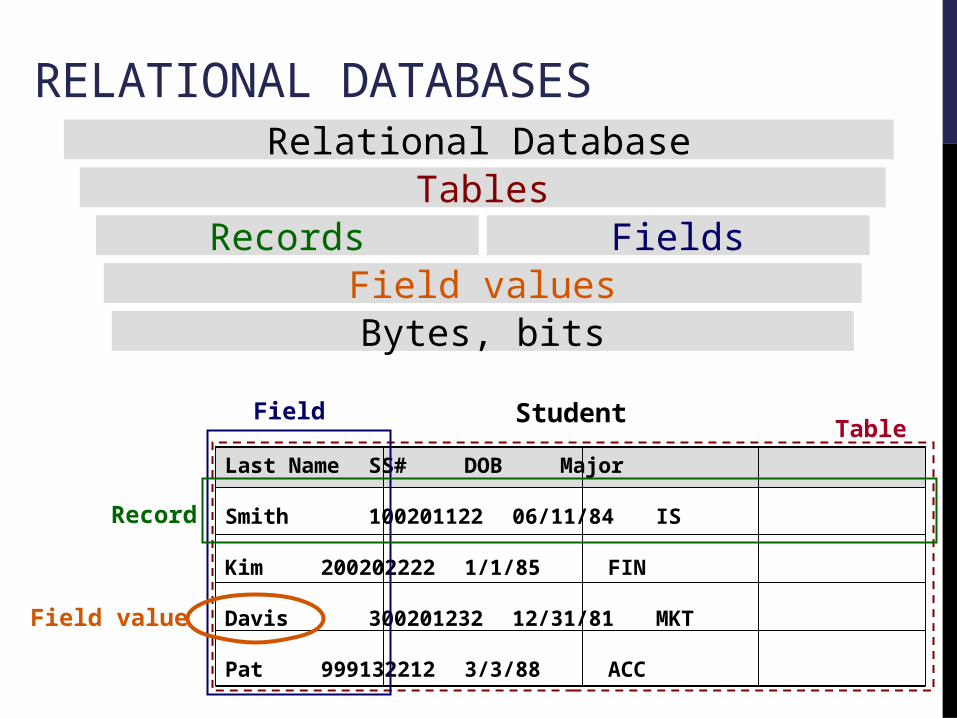
Relational DatabaseTables
Records FieldsField valuesBytes, bits
Last Name SS# DOB Major
Smith 100201122 06/11/84 IS
Kim 200202222 1/1/85 FIN
Davis 300201232 12/31/81 MKT
Pat 999132212 3/3/88 ACC
StudentTable
Field
Record
Field value
RELATIONAL DATABASES

ADVANTAGES1. Consistency
• We can restrict the values of certain fields (e.g. dates, integers)
• We can impose other kinds of constraints (all costs must be positive, last names must be included, orders must have addresses)
• Data look the same to all users at the same time.2. Centralization
• Many different users can edit and view the data simultaneously. Efficient sharing of information.
3. Efficient Querying
• SQL and other query languages can be used to create complex reports quickly

PROBLEMS WITH EXCEL?
When should you use a database instead of Excel?
– Insertion anomalies
– Deletion anomalies
– Update anomalies}Data Quality Problems
Should we just create multiple workbooks in Excel?
– The real power of a database: Querying
– How would you answer the following question in Excel?
– Find customers that spend on average $50 per book order, that live on West Coast or on the East Coast (but not in Midwest) and whose annual income is at least $150K

SIMPLE HOSPITAL SYSTEM ERD
WARD
NURSE PATIENT
DOCTOR
treatsaccommodateshas
assigned
caresfor

NORMALIZING AMAZON’S DATA• The process of assuring that a database can be implemented
effectively as a set of two-dimensional tables
• Unlike Excel though, the tables are connected
• Prevents insertion, deletion and update anomalies

SQL:OBJECTIVES
• Given a query, describe in words what result it would give you.
• Given a business question and a set of tables/fields, write a query that answers that question.
• Correct a query that has an error in the syntax or otherwise will not run.

COMPLETE QUERY EXAMPLE
SELECT ISBN, BookName, Price, Publisher
FROM Book
WHERE
BookName like '*Information Systems*'
AND PubDate > #1/1/2002#
AND Price < 100
ORDER BY Price

TABLE JOIN EXAMPLE
SELECT BookName, Date FROM Book, Order
Where Book.ISBN = Order.ISBN
Order By Book.ISBN, Order.Date
Joining/matching criteria: very important, don’t forget!
Use “table.column” format to avoid ambiguity
ISBN is a Foreign Key here

MULTIPLE JOINSWITH WHERE AND GROUP BY
SELECT FavoriteMovie, count(*)
FROM Profiles, FavoriteBooks, FavoriteMovies
WHERE
FavoriteMovies.ProfileId = Profiles.ProfileId
and FavoriteBooks.ProfileID = Profiles.ProfileID
and FavoriteBook = "The Great Gatsby"
GROUP BY FavoriteMovie ORDER BY count(*) desc;

DATA MINING:OBJECTIVES
• Explain how competitive advantages can result from data-driven decision making.
• What obstacles are there to implementing a data-driven strategy?
• Given an application, is it appropriate to use classification? Regression? Clustering?
• Why do we need to reduce dimensionality of our features?
• Why do we keep hold-out data and how does cross-validation work?

THE DATA-DRIVEN FIRM
Why do we see these changes now?
• Collect: easier to collect, store information about consumers, technologies, markets
• Respond: Fast internal communication means that firms are agile enough to respond to external information
• Process: Firms can process large volumes of data to make intelligent decisions

DATA-DRIVENCHALLENGES
1. MeasurementWhat should be measured and how?
2. IncentivesHow can we design incentives around these measures without creating adverse consequences?
3. InfrastructureDo we have the right infrastructure (servers, software, etc) in place to measure and analyze the data we have?
4. SkillsDo we have the skills we need to accomplish these tasks?

WHAT IS DATA MINING?• Data Mining – process of discovering new (non-
obvious) patterns from large data sets (databases) • artificial intelligence• machine learning• statistics
• Data mining is an automatic or semi-automatic process• Types of data mining tasks:
• classification – classify new data into existing structure (categories or “classes”) e.g., email as “spam” or “not spam”
• regression – model the shape of the data with least error
• cluster analysis – discover groups or structures in the data
• anomaly detection – find unusual or outlier data records
• association rule mining – discover relationships between data variables

DATA MINING AS A PROCESS• Cross Industry Standard Process for Data Mining (CRISP-DM)
1) Business Understanding2) Data Understanding3) Data Preparation4) Modeling5) Evaluation6) Deployment
• Practically, the data mining process involves:• Pre-processing – compile a large enough data set and get it “ready”
for analysis e.g., “Data Warehousing”• Can involve integration of various databases within a business• sanitization/cleaning of data
• Data mining task
• Validation of results• Is the output “predictive” , i.e., how good is the process when
applied to new data that was not in the training set?

HOLDOUT & CROSS-VALIDATION
Data consists of sets of: where x are covariates, y outcomes
Data
ModelingAlgorithm
(input)data
(output)models
holdout
M1
{𝑥h1; 𝑦h1 }𝑥h1 �̂� h2 ,𝑚1(the y of the 1st holdout data
as predicted by model 1)
How does compare to ?
How much does this depend on exactly which data we held out?

VISUALIZATION:OBJECTIVES
• What is Anscombe’s quartet and why does it matter?
• What are the benefits of exploratory data analysis (EDA)?
• Interpret a histogram, scatter plot, density plot, or box-plot. Tell me what you see and why it’s important.
• Given a data set and a general question, which visualization technique would you use and why?
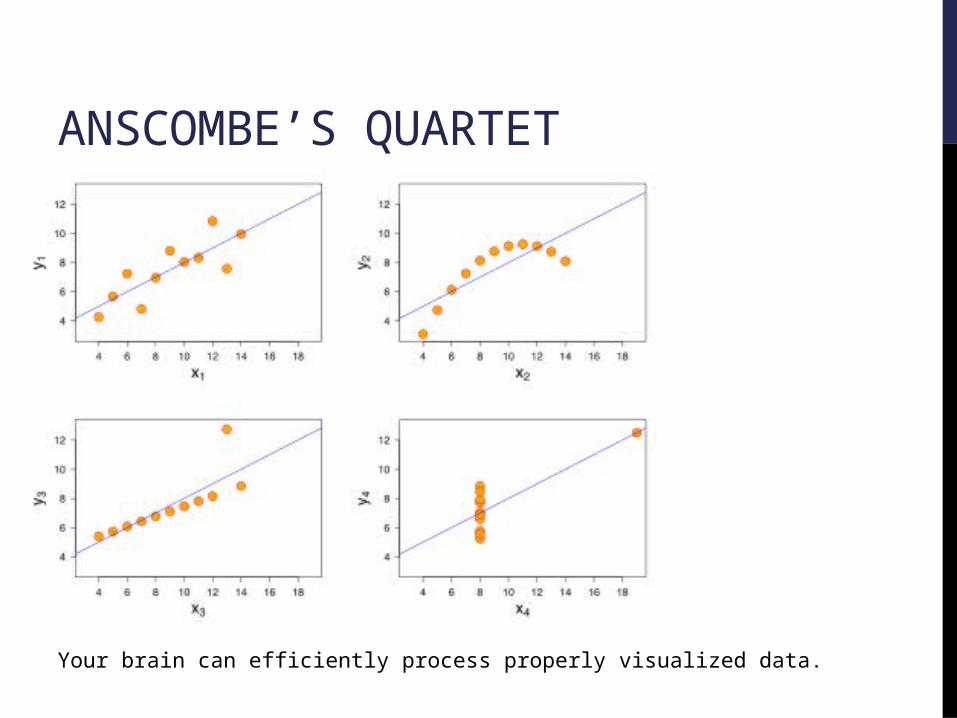
ANSCOMBE’S QUARTET
Your brain can efficiently process properly visualized data.

EDA:EXPLORATORY DATA ANALYSIS
• An approach to analyzing data sets to summarize their main characteristics in easy-to-understand form.
• Often with visual graphs, without using a statistical model or having formulated a hypothesis.
• Helps to formulate hypotheses that could be tested on new data-sets.

SOFTWARE ENGINEERING:OBJECTIVES
• Why is software engineering difficult?
• Discuss the essential difficulties of software engineering.
• Explain each stage of the waterfall model.
• How does the agile methodology change the way software is built compared to the waterfall model?

ESSENTIAL DIFFICULTIES
1. Complexity
• Hard to manage large teams• Hard to understand system, side-effects
2. Conformity
• Software is expected to meet all users’ needs3. Changeability
• Pressure/ability to change4. Invisibility
• No way to see it all at once, visually

BUILD OR BUY?
WHY BUY?
• Time to use
• External support
• No risk of project failure
• Upgrades
• Network effects
WHY BUILD?
• Customized, all requirements met

WATERFALL MODEL

“AGILE” METHODOLOGY

LOCATION-BASED SERVICES:OBJECTIVES
• Identify the components and participants in LBS applications
• Describe the interaction of the components
• Types of context awareness
• Adaption in LBS apps
• Push vs. Pull
• Latency vs. Bandwidth

LBS: AN INTERSECTION OF TECHNOLOGIES
GIS / Spatial databases
Mobile DevicesInternet
MobileGIS
Mobile Internet
Web GIS
LBS

CONTEXTUAL ADAPTION1. Information level: the content of the
information presented is adapted. (e.g. filtering based on proximity)
2. User interface level: the interface is adapted to suit small screens, on-the-go users.
3. Presentation level: the visualization of the info is adapted.

PRICING:OBJECTIVES
• Unique properties of digital goods.
• Cost leadership vs. product differentiation.
• Consumer surplus, producer surplus, dead-weight loss.
• Personalized pricing (1st degree PD).
• Group pricing (3rd degree PD).
• Versioning (2nd degree PD), versioning dimensions.
• Bundling.
• For a given set of consumers, I expect you to be able to tell me what revenue a firm will earn given different pricing regimes.

q
p
REVENUEREVENUE
q
p
PRICE
DEMAND
vs.
• The idealized economic scenario (ideal for the seller)• Find out what each customer is willing to pay, and charge
them as close as possible to this • Can work in conjunction with increasing product fit• Made more easily feasible by a web-based sales channel
PERSONALIZED PRICING

q
p
GROUP PRICING
REVENUE
q
p
PRICE
DEMAND DEMAND
REVENUE
SEGMENT 1 SEGMENT 2
PRICE 1
PRICE 2
vs.
Same product, different prices for different groups
• Identify groups willing to pay less, offer them lower prices
• Need to be able to identify group membership easily
• What types of groups are systematically willing to pay less?

q
p
REVENUE
q
p
PRICE
DEMAND DEMAND
PRICE 1
PRICE 2
vs.
Single version
High-end version
Low-end version
REVENUE
• Different versions, different prices• Segmentation based on self-selection based on
willingness to pay for different versions
VERSIONING

BUNDLING: A SIMPLE EXAMPLE
Alice
Bob
Product 1Word Processor
Product 2Spreadsheet
$60
$40
$40
$60
Optimal prices
• $40 for product 1
• $40 for product 2
• $100 for the bundle of product 1 and product 2

NETWORK EFFECTS: LEARNING OBJECTIVES• Understand the idea of positive feedback and describe the role it has
played in some prior technology industries (railroad, electricity, telephony)
• Define network effects (demand-side economies of scale) and understand how they lead to positive feedback
• Describe the difference between supply-side and demand-side economies of scale
• Understand the typical sources of network effects in information technology industries
• Be able to recognize these sources for specific technology products or in specific business contexts
• Understand the trade-offs between performance and compatibility, and between openness and proprietary control of a technology

POSITIVE FEEDBACK: OVERVIEW
Historical examples • Railroad gauges, AC versus DC power, telephone networks
What is positive feedback?
• when a firm becomes successful, its past and current success make it more likely to succeed in the future
• ‘…success feeds on itself, the strong get stronger…’
When does this happen?
• More customers lower unit cost (supply-side economies of scale)• More customers larger ‘network’ more valuable product (demand-side
economies of scale caused by network effects)
Possible consequences of positive feedback
• Dominance of a single firm or technology• Dominance of an inferior technology that got an early lead • Critical Mass: below the critical mass, few are willing to buy (inertia);
beyond the critical mass, the market takes off.• Introducing a new product is difficult because of collective switching costs

SOURCES OF POSITIVE FEEDBACKSupply-side economies of scale (Traditional markets)
• More customers more units produced lower average cost per unit
• Marginal cost less than average cost • Spreading fixed costs across more units
• Manufacturing efficiencies, learning by doing
Demand-side economies of scale (Digital markets)
• More units consumed higher value per unit
• The value of the good comes from the network of consumers who use it (at least in part)
• Most commonly caused by network effects (Microsoft, Playstation, Facebook)
• Positive relationship between popularity and valueConsumer expectations are key!

SWITCHING COSTS:LEARNING OBJECTIVES
1. Explain switching costs, technological lock-in and how switching costs lead to technological lock-in.
2. Understand how switching costs affect industry competition.
3. Understand the sources of lock-in and switching costs:• durable purchases
• brand-specific training
• information and databases
• contracts
4. Be able to identify and analyze sources of lock-in for specific products or in specific business contexts.
5. Explain strategies for firms to create lock-in and for consumers to mitigate the consequences of lock-in.
• specialized suppliers
• search costs
• loyalty programs

NEXT CLASS:GROUP PRESENTATIONS
• Group 7
• Group 1
• Group 5
• Group 2