Embed Size (px)
Citation preview

219
7
This chapter considers three channels through which globalization of
information technology (IT) products may affect economic growth:
• Terms of trade. The fall in quality-adjusted prices of IT products
favors IT consumers, so net importers (whose consumption exceeds
production) experience faster economic growth. But given the frag-
mentation of IT production into a global supply chain, it is not so
simple to measure terms of trade.
• Economies of scale. IT production exhibits important economies of
scale. For example, a country could specialize in a segment of the
supply chain by importing a narrow set of imports (to exploit the
terms-of-trade gain) and then exporting a narrow set of IT prod-
ucts (to exploit economies of scale in production). So concentrated
trade patterns—and being a net exporter by producing more than
consuming—could yield faster growth.
• Variety. Availability of a wide variety of IT products is also a potential
source of economic gain. Greater variety means that more domestic
Catherine L. Mann
Information Technology, Globalization, and Growth: The
Roles of Scale Economies, Terms of Trade, and Variety

220 Ascent after Decline
users fi nd good matches between products and needs, which increases
productivity and growth. The variety of exports might further sup-
port growth to the extent that variety increases prices and profi ts.
Several empirical questions are relevant for policy makers: What are
the relative magnitudes of these channels? What data relate economic
growth to production, consumption, and international trade in IT prod-
ucts? To catalyze economic growth and enhance performance, should
policy makers promote IT exports to exploit economies of scale in pro-
duction? Or should they promote imports and domestic consumption
of a variety of IT products to gain from falling IT prices, get more vari-
ety, and through these channels support faster total factor productivity
(TFP)?
The chapter explores some of the issues, research, and metrics
that can better inform policy makers’ approach to these questions, as
follows:
• Measuring Economic Growth: Getting to the Social Surplus Concept
addresses measurement issues and describes a metric and appara-
tus—“social surplus”—with which to evaluate, in general terms, the
relationships between production and consumption of a transforma-
tive innovation, and economywide productivity and growth.
• Data and the Literature on IT and Economic Growth presents an
overview of patterns of IT production, consumption, and trade and
reviews the literature on the relationship between IT and growth.
• International IT Trade and the Social Surplus Measure of Economic
Growth takes the social surplus apparatus to the data on IT produc-
tion, consumption, and trade to consider the relative importance of
economies of scale, variety, and terms of trade for economic well-
being and as foundations for growth.
• Variety and the Dispersion of Country Experience discusses the cor-
relation of social surplus to the diversity of countries’ use of IT
and thereby to economic growth relative to peer IT-exporting
or IT-importing economies. The analysis suggests that gains to vari-
ety in consumption can outweigh gains from economies of scale in
production.
• Policy Implications sums up the fi ndings’ implications for an IT-based
economic growth strategy.

Information Technology, Globalization, and Growth 221
Measuring Economic Growth: Getting to the Social Surplus Concept
Productivity and productivity growth are standard ways to measure the
foundation of economic growth. A more productive economy is one
where resources are allocated effi ciently so as to generate the highest
amount of output without infl ationary strain, resource waste, or envi-
ronmental degradation. In the long run, a more productive economy can
generate more possibilities for consumption and business investment.
Productivity Measures: Labor versus TFP Labor productivity is output per unit of labor input and is often a key
measure of the foundations for economic growth. Increased labor pro-
ductivity can be achieved without innovation but through increases in
the capital stock. Diminishing marginal returns to capital inputs, how-
ever, suggest that labor productivity is an incomplete measure of the
foundations for economic well-being and growth.
Total factor productivity (also called multifactor productivity) mea-
sures the extent to which an economy can generate more output using
the same resources. By defi nition, increased TFP implies innovation
and transformation in how resources are combined—observable as new
products, changes in business processes, or new workplace practices.
Increased TFP also implies increased growth in the sense that the econ-
omy can produce more output to allocate toward fi nal demand.
GDP versus GNI and the Role for Terms of Trade and TFP Gross domestic product (GDP) and GDP per capita are standard mea-
sures of economic performance and growth. They incorporate increases
in resources and production of new products as well as innovations
in business process and workplace practices. But, being aggregates,
these measures do not distinguish between components of economic
growth—as, for example, between consumption, investment, and net
exports.
In a globalized economy with international trade and in an environ-
ment of rapid innovation in new products, processes, and practices,
the aggregate GDP measure may mask important sources of economic
growth that infl uence the economic well-being of the population.
That is, if there is a structural trend in a country’s terms of trade, gross

222 Ascent after Decline
national income (GNI) may be a better measure of economic growth.
For example, if a country has substantial imports of a product whose
international price is falling—which implies that its terms of trade are
improving—then real GDP understates the country’s real domestic
income, its purchasing power, and the economic growth that domestic
residents can enjoy.1 Similarly, if an economy has a structural balance
of payments surplus, GDP overstates the extent to which domestic resi-
dents enjoy the fruits of economic growth.2
Trends in the terms of trade are relevant from the standpoint not
only of purchasing power but also of measuring productivity growth.
Specifi cally, there is a mathematical isomorphism between changes in
the terms of trade and changes in TFP: an improvement in the terms of
trade is equivalent to an innovation that increases TFP and economic
growth.3
Social Surplus, Transformative Technology, and Economic GrowthTFP is diffi cult to measure. Social surplus is another way to account
for the accumulated gain and economic growth that a country gets as
more and more buyers take advantage of a transformative technology
( Bayoumi and Haacker 2002, 11–12; Feenstra et al. 2007; Kohli 2004,
2006). From the fi nal consumer’s standpoint, innovations that reduce
prices yield direct gains, measured as consumer surplus. But purchasing
innovative products with falling prices yields indirect gains as well,
through cheaper intermediates and changes in production processes.
Collectively, the spending power and investment decisions induced by
the innovation fall on other parts of the economy, accentuating the
value of the transformative technology for overall TFP and growth.
The calculation of how much the overall economy gains from the
falling prices associated with an innovation is called “social surplus.”
Figure 7.1 shows an example of the social surplus apparatus for a trans-
formative technology.
As fi gure 7.1 illustrates, Social surplus (A + B + C) is larger under the
following conditions:
• Higher income elasticity of demand for transformative technology
(TT)
• Higher price elasticity of demand for TT

Information Technology, Globalization, and Growth 223
• Bigger fall in TT price
• Larger initial TT expenditure
• More TT used as intermediates and TT externalities.
The next section reviews the empirical evidence underpinning the facts
of IT globalization and the assertions that diffusion of IT products
enhances TFP and economic growth. Later, “International IT Trade and
the Social Surplus Measure of Economic Growth” calculates social sur-
plus for a set of countries and considers (a) the relationship between
social surplus and the extent to which the economy may gain through
direct demand for IT, and (b) how the economy may gain through indi-
rect demand for IT.
Data and the Literature on IT and Economic Growth
There is a vast literature on the relationship between IT and measures of
economic growth.4 This paper highlights a small subset of the literature
that focuses, fi rst, on the relationship between economies of scale in
Social surplus = A + B + C
real expenditure on TT
P0
AB
C
P1
ETT0/PTT
0 ETT1 /PTT
1
direct demandTT
total demandTT
TT
pri
ce
Figure 7.1 Transformative Technology and Social Surplus
Source: Author.
Note: TT = transformative technology. P = price. E = expenditure.

224 Ascent after Decline
IT production and economic growth and, second, on diffusion of variety
of IT and economic growth. To give a frame of reference for the litera-
ture, we start with some observations based on data on the globaliza-
tion of IT production and trade. The data have bearing on the issues of
economies of scale and variety of IT products in international trade.
Changing Patterns of International Trade and Domestic Expenditure That the IT industries are greatly globalized in production, invest-
ment, and cross-border trade goes without saying. The Organisation
for Economic Co-operation and Development’s (OECD) Information
Technology Outlook addresses and quantifi es numerous measures of the
globalization of the IT industry, for both goods and services. Additional
assessments, predominantly for emerging markets and developing econ-
omies, can be found in the Information Economy Report and the World
Investment Report, both published by the United Nations Conference on
Trade and Development (UNCTAD).5
Although the global production of IT goods is highly fragmented,
with production sites all over the world, some indicators suggest that
production has become more concentrated over time as key producers
squeeze the maximum economies of scale in production from facto-
ries in the lowest-cost locations.6 In addition, an increase in exporters’
revealed comparative advantage for information and communication
technology (ICT) goods during the 1990s (OECD 2008, 94–95) also
points to some concentration of global production of specifi c parts and
components, even as the production process of a wider variety of “fi nal”
ICT goods remains highly fragmented.
IT Exporters. Data on the IT goods trade, as table 7.1 shows, exhibit
both rapid changes in ranking among the top exporters and importers
and changes in trade concentration. The bottom line is that the sum
of China and Hong Kong SAR, China, exploded from 2 percent of
global exports (ranked 14th) in 1990 to 15 percent of global exports
(ranked 1st) in 2004. On the import side, China and Hong Kong SAR,
China, moved from 9th-ranked, with 4 percent of global imports, to
top-ranked with 20 percent of global imports.

Information Technology, Globalization, and Growth 225
Table 7.1 Global IT Trade Patterns, by Economy, 1990–2004
Rank Economy
Share of world trade
(percent)
Cumulative share
(percent)
a. 1990
Exports 1 Japan 20.4 20.4
2 United States 19.3 39.7
3 United Kingdom 7.7 47.4
4 Germany, Federal Rep. 7.4 54.8
5 Singapore 6.7 61.5
14 China and Hong Kong
SAR, China 1.7 n.a.
Imports 1 United States 20.6 20.6
2 Germany, Federal Rep. 9.7 30.3
3 United Kingdom 9.0 39.3
4 France 6.5 45.8
5 Italy 4.5 50.3
9 China and Hong Kong
SAR, China 3.9 n.a.
b. 2000
Exports 1 United States 17.0 17.0
2 Japan 14.1 31.1
3 Singapore 9.8 40.9
4 Korea, Rep. 6.6 47.5
5 Taiwan, China 6.4 53.9
9 China and Hong Kong
SAR, China 4.2 n.a.
Imports 1 United States 20.3 20.3
2 China and Hong Kong
SAR, China 10.0 30.3
3 Japan 6.7 37.0
4 Singapore 6.7 43.7
5 Germany 5.9 49.6
(continued next page)

226 Ascent after Decline
Table 7.1 (continued)
Rank Economy
Share of world trade
(percent)
Cumulative share
(percent)
c. 2004
Exports 1 China and Hong Kong
SAR, China 15.2 15.2
2 United States 11.0 26.2
3 Singapore 8.7 34.9
4 Japan 7.9 42.8
5 Germany 6.9 49.7
6 Taiwan, China 6.4 n.a.
Imports 1 China and Hong Kong
SAR, China 20.1 20.1
2 United States 14.8 34.9
3 Germany 6.5 41.4
4 Singapore 6.2 47.6
5 Japan 5.8 53.4
Sources: Mann 2006, table 2.2a; original data from the United Nations Commodity Trade Statistics Database (Comtrade).
Note: n.a. = not applicable.
There were other changes in the trade landscape, even if not so dra-
matic. Between 1990 and 2004, the cumulative share of the top three
exporters fell from 47 percent to 35 percent, suggesting less trade
concentration.
The top three IT-exporting economies also changed over the 1990–
2004 period: Japan dropped from being the top exporter (with 20 per-
cent of world exports) in 1990 to fourth (with 8 percent) in 2004. China
and Hong Kong SAR, China, rose from 14th (with 1.7 percent of world
exports) in 1990 to fi rst (with 15 percent) in 2004. The United States
remained the second-largest exporter (with 19 percent of world exports)
in 1990 but with only 11 percent in 2004. The United Kingdom was the
third-largest exporter in 1990 but dropped to 10th in 2004. Singapore
rose from fi fth-largest in 1990 to third-largest in 2004.
IT Importers. On the import side, concentration has changed little,
but the rankings have changed. The top-three importers accounted for
about 40 percent of world imports from 1990 through 2004. The United

Information Technology, Globalization, and Growth 227
States was the top-ranked importer in 1990, accounting for about 20
percent of world imports—about the same as what China and Hong
Kong SAR, China, accounted for with its top ranking in 2004. China and
Hong Kong SAR, China, doubled its share of global imports from only
4 percent of imports in 1990 to 10 percent by 2000, and then doubled
its share again to reach 20 percent in 2004. The United States slipped
to second by 2004 with 15 percent of world imports. Among the other
top-ranking importers, Germany, Japan, and Singapore rounded out the
top-fi ve list in both 2000 and 2004, albeit in changing order.
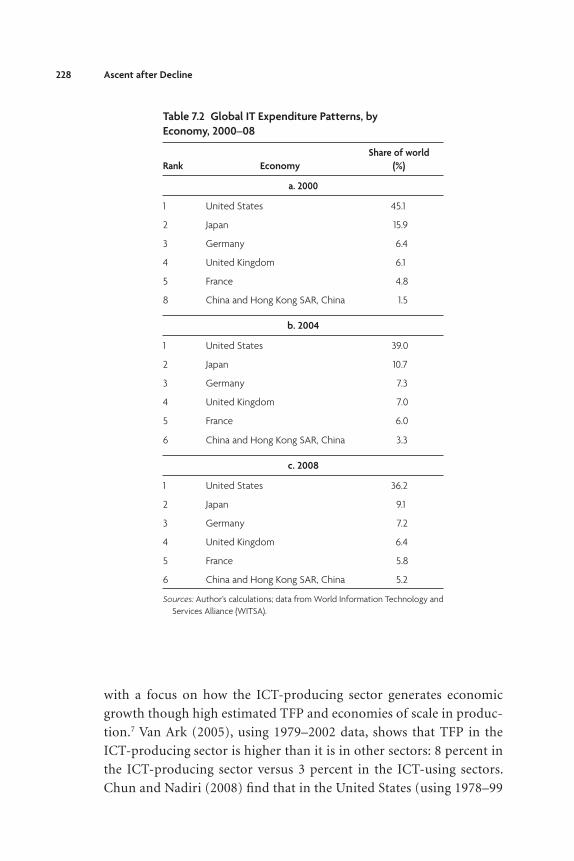
IT Expenditures. An interesting question is whether countries that
rank highly in global trade also rank highly in domestic expenditure
on IT. A quick look at the data in table 7.2 indicates that deep involve-
ment in global production and international trade in IT does not nec-
essarily correlate with a country’s domestic spending on IT.
For example, the United States accounted for 45 percent of global
expenditure on IT in 2000, shrinking to 36 percent by 2008. Both
shares, though, were substantially larger than the U.S. share of global
IT trade. Germany’s and Japan’s shares of global IT trade, however, were
somewhat closer to their shares of domestic IT expenditure. China and
Hong Kong SAR, China, quadrupled its share of global expenditure
between 2000 and 2008, ranking sixth in global expenditure by 2008,
but its share of expenditure remained quite small relative to that econo-
my’s importance in global trade.
If an economy’s share of world trade and its share of global expen-
diture were the same, it would suggest a balanced expansion path
for that economy overall. When economies have higher shares of
global trade than of global expenditure, that suggests that IT is rela-
tively more important as a production platform for growth through
international trade than through domestic use. On the other hand, if
the share of expenditure is greater than the share of trade, that sug-
gests that domestic business use of IT in the economy is the basis for
growth.
Gains from Producing IT versus Using ITWe turn now to a review of selected empirical studies on the relation-
ship between IT and economic growth. The research agenda started
228 Ascent after Decline
with a focus on how the ICT-producing sector generates economic
growth though high estimated TFP and economies of scale in produc-
tion.7 Van Ark (2005), using 1979–2002 data, shows that TFP in the
ICT-producing sector is higher than it is in other sectors: 8 percent in
the ICT-producing sector versus 3 percent in the ICT-using sectors.
Chun and Nadiri (2008) fi nd that in the United States (using 1978–99
Table 7.2 Global IT Expenditure Patterns, by
Economy, 2000–08
Rank Economy
Share of world
(%)
a. 2000
1 United States 45.1
2 Japan 15.9
3 Germany 6.4
4 United Kingdom 6.1
5 France 4.8
8 China and Hong Kong SAR, China 1.5
b. 2004
1 United States 39.0
2 Japan 10.7
3 Germany 7.3
4 United Kingdom 7.0
5 France 6.0
6 China and Hong Kong SAR, China 3.3
c. 2008
1 United States 36.2
2 Japan 9.1
3 Germany 7.2
4 United Kingdom 6.4
5 France 5.8
6 China and Hong Kong SAR, China 5.2
Sources: Author’s calculations; data from World Information Technology and
Services Alliance (WITSA).

Information Technology, Globalization, and Growth 229
data), economies of scale in ICT production account for 30 percent of
TFP in the ICT-producing sector.
From a policy-making perspective, however, looking to the ICT-
producing sector for growth creates some problems. First, if the source
of growth is production of ICT, then the sector must keep growing as
a share of the economy to continue the overall expansion of economic
activity. Second, if economies of scale in production are that impor-
tant for TFP, any small country must produce primarily a narrow set
of products for export because domestic demand is unlikely to absorb
all that is produced. Globalization of ICT production—and the rising
share of the production complex of China and Hong Kong SAR, China,
as noted in the previous statistics—means tough competition in export
markets. Finally, if growth from ICT comes only from producing ICT,
then any country without an ICT sector would appear to be doomed to
slow growth.
These conundrums encouraged researchers to look more deeply into
how ICT was being used in an economy. Van Ark’s (2005) closer exami-
nation of the ICT-producing versus ICT-using sectors reveals that TFP
in ICT-using industries increased 250 percent versus only 30 percent in
ICT-producing industries (comparing data from 1979–95 and 1995–
2002, respectively). Mun and Nadiri’s (2002) research using U.S. data
shows that networked IT deployed in an ICT-using sector (particularly
in services) that linked forward to customers and backward to suppli-
ers contributed importantly to cost reductions and TFP gains for the
ICT-using sectors.
The research on ICT-using sectors found quite a bit of variation
across countries in the TFP growth associated with ICT use. Explaining
this variation can inform policy making. One line of research looked
at domestic institutions, human capital, and competition. Several
research papers suggest that fl exible labor markets enhance the impact
of ICT on productivity growth, with more product-market competi-
tion having a similar and complementary result (Gust and Marquez
2000; OECD 2003b; and van Ark, Inklaar, and McGuckin 2003 focus
on continental Europe). If businesses cannot (or have no incentive to)
change product mix or change what workers do, then buying IT is just
an additional cost of doing business rather than an enhancement to
the business (see case examples in Mann, Eckert, and Knight 2000).

230 Ascent after Decline
Further, if ICT investment takes place in a business environment lack-
ing in strong international competition, productivity growth also lags
(Shih, Kraemer, and Dedrick 2007).
Another line of research, particularly relevant for developing coun-
tries, fi nds that there needs to be a balance between human capital and
investment in ICT before domestic use of ICT yields higher productiv-
ity and growth (Dewan and Kraemer 2000; Pohjola 2001; Sciadas 2005;
Seo and Lee 2006).
A different direction for research focuses on how variety in products
relates to TFP. Research on all types of products (not just ICT) fi nds that
increased export variety is associated with 40 percent of the difference
in measured TFP across countries. Feenstra and Kee (2008) attribute
the bulk of this fi nding to variety in trade in electronics products.
On the import side, a higher variety of all types of imports accounts
for about 25 percent of TFP growth in developing countries (Broda,
Greenfi eld, and Weinstein 2006). The way this works is that, with an
insuffi cient variety of ICT products, the business community may fi nd
only poor matches to its needs and would use less ICT, resulting in lower
productivity and growth.
In sum, even though TFP is higher in the ICT-producing sector
and economies of scale in production are quite important, the results
of research on the relationship between ICT and economic growth
increasingly point away from production of ICT and more toward how
ICT is used by businesses in an economy and what features of the econ-
omy are most conducive to that use. With globalized production of
ICT, where quality-adjusted prices are falling, international trade offers
a more compelling avenue to buy ICT. Thus, international trade in ICT
may play a particularly important role in TFP growth in the ICT-using
sectors.
International IT Trade and the Social Surplus Measure of Economic Growth
Despite the obvious relationships, little of the literature on IT and growth
addresses the nexus of international IT trade and economic growth.
However, just as the domestic focus shifted from the IT-producing

Information Technology, Globalization, and Growth 231
sector to the IT-using sectors, this section shifts the focus from the
domestic sources of growth to the global sources of growth from inter-
national IT trade.
With increased globalization of production and international trade,
the decline in quality-adjusted prices of IT products has different impli-
cations for producers of exported IT versus consumers of imported
IT. But this fragmentation of production around the world enables
some countries to establish signifi cant economies of scale in produc-
tion of certain IT products. How do the terms of trade balance against
the economies of scale, and what role is there for variety in supporting
economic growth?
International IT Trade and Social Surplus: The Hypothesis Information technology is a transformative technology. Its quality-
adjusted global price is falling, which should promote imports and
greater use of the technology—resulting in gains to social surplus, pro-
ductivity, and economic growth. Yet special economic zones in some
countries focus on production for export rather than domestic use.
Whereas production and export of IT products obviously should
not directly harm an economy,8 declining prices for IT products means
that the terms of trade (export prices compared to prices of imported
products) are moving against these producers. Thus, the gains to the
domestic economy that do come from producing IT for export (through
economies of scale, for example) are partly offset by the opportunity
cost of not using those resources to produce IT (or other) products with
increasing value in domestic markets or in international trade. How
important is production versus consumption for getting the gains from
IT, considering the trade dimension?
The apparatus of social surplus is a crucial ingredient to investigating
the relationship between economic growth and being an IT producer
versus an IT buyer (or falling somewhere in between, as do most econo-
mies). The fi rst step estimates social surplus for a set of countries. The
second step uses the net of production and expenditure as a measure
of international IT trade. The fi nal step considers why countries differ
from each other beyond being net producers (exporters) or net con-
sumers (importers) of IT.

232 Ascent after Decline
Figure 7.2 sets out the hypotheses, based on the previous literature, con-
cerning the roles of the following factors:
• Terms of trade. The quality-adjusted falling prices of IT favor IT con-
sumers and importers. Based on terms of trade alone, social surplus
should be negatively correlated with the difference between produc-
tion and expenditure (or imports), as shown by the negative sloped
dash line.
• Economies of scale. However, economies of scale favor high-volume
IT producers, who are probably also exporters. TFP is positively asso-
ciated with the scale of production of IT products. So social surplus
may be higher for high-volume producers and exporters, which tilts
the solid black line up, creating a U-shaped relationship between
social surplus and the production − expenditure (trade) balance.
• Variety. Research suggests that greater variety of IT products, includ-
ing imports, used by business supports TFP and social surplus.
Figure 7.2 Growth and International IT Trade: The Hypotheses
production < expenditure
(imports)
international trade = production – expenditure
TFP
an
d g
row
th (
me
asu
red
as
soci
al s
urp
lus)
production > expenditure
(exports)
economies of scale
offset terms of trade
variety increases TFP
relationship between social surplus and trade, accounting for terms of trade and variety
relationship between social surplus and trade, given increased variety balance
relationship between social surplus and terms of trade alone
Source: Author.
Note: TFP = total factor productivity. Social surplus is the calculation of overall economic gain from the
falling prices associated with an innovation.

Information Technology, Globalization, and Growth 233
A greater variety of exports likely achieves relatively higher prices
(fewer of the products are low-margin commodities), which offsets
the otherwise deleterious terms-of-trade effect for exporters. There-
fore, all else equal, increased variety would tend to shift the U-shaped
curve further upward.
Given this set of hypotheses, what do the data reveal?
Patterns of IT Trade and Social Surplus: The EvidenceThe fi rst step is to calculate social surplus. Following the previous dis-
cussion in the Measuring Economic Growth section, the main ingredi-
ents to this calculation are data for each economy’s (a) real GDP, (b) real
IT prices, (c) real production of IT, and (d) real domestic expenditure
on IT. The estimated price and income elasticities of demand for IT also
are needed.9 Social surplus is calculated as the average for 2000–07 for 36 econo-
mies, as shown in fi gure 7.3. The fi gure shows the relationship between
Figure 7.3 Growth and International Trade in IT: The Calculations
net IT trade (production – expenditure) as % of GDP
eco
no
mic
gro
wth
(ch
ange
in s
oci
al s
urp
lus
as %
of
GD
P)
hypothesis
calculations for individual economies
–1.5 –1.0 –0.5 0 0.5 1.0 1.5
trend (regression) relationship for IT importers
trend (regression) relationship for IT exporters
correlation between social surplus and IT international trade
Source: Mann 2009.

234 Ascent after Decline
this metric of economic growth (social surplus as a share of GDP) and
trade in IT products (measured as production less expenditure, as a share
of GDP for the years 2003–06, averaged). The linear segments show the
linear trend (regression) relationship for importers taken alone and for
exporters taken alone.
Overall, the collection of estimated data points for individual econo-
mies matches the basic hypothesis that importers of IT (production <
expenditure) enjoy relatively higher social surplus (TFP and growth) than
economies that are exporters of IT (production > expenditure). But the
signifi cant dispersion of the economies around the average regression
relationship bears further examination.
Figure 7.4 shows the two sides of the previous diagram along with
more economy-specifi c detail. These calculations reveal several impor-
tant points that bolster the empirical research already cited and partly
support the hypothesis that social surplus and imports of IT products
are positively related through the terms of trade.
IT Importers. First, consider the importers (see fi gure 7.4, panel a) to
be those economies where IT expenditure exceeds IT production. For
these economies, falling IT prices increase social surplus because more
consumers accumulate the benefi ts of falling IT prices, both directly and
indirectly, as IT diffuses through the economy.
The trend line in fi gure 7.4, panel a, reveals the positive relationship
between social surplus and imports of IT: the larger the (negative) gap
between production and expenditure on IT hardware (for example,
imports), the greater the increase in social surplus (for example, accu-
mulated gain to buyers from declining IT hardware prices). The trend
relationship is somewhat greater than unity (–1.5), indicating that a 1
percent increase in IT imports (production less expenditure) is associated
with a 1.5 percent increase in social surplus. This greater-than-unitary
association is consistent with other research already cited on the pro-
ductivity-enhancing diffusion benefi ts and externalities associated with
using IT.
These estimates of social surplus use data from the 2000s and can be
compared to Bayoumi and Haacker’s (2002) estimates using data from
the 1990s as discussed in Mann (2009). First, the relationship between
social surplus and imports is stronger in the 2000s than in the 1990s

Information Technology, Globalization, and Growth 235
Figure 7.4 Social Surplus and IT Trade in Selected Economies, 2000–07
Source: Author.
b. IT exporters
a. IT importers
soci
al s
urp
lus,
as
% o
f G
DP,
20
00
–0
7so
cial
su
rplu
s, a
s %
of
GD
P, 2
00
0–
07
IT production – IT expenditure, as % of GDP, 2003–06
IT production – IT expenditure, as % of GDP, 2003–06
Egypt, Arab Rep.GreeceIndia
ItalyPortugal
SpainTurkey
Ireland
Korea, Rep.
Singapore
Malaysia
y = 0.0157x + 0.7545
R2 = 0.0423
China
Israel
MexicoThailand
Philippines
Indonesia
Brazil
FranceAustria
GermanyChina and Hong Kong SAR, China
Bulgaria
NetherlandsSwitzerland
y = –1.4728x – 0.0227
R2 = 0.2665
–1.5–0.5
0
0.5
1.0
1.5
2.0
2.5
–0.5
0
–1.5 3.5 8.5 13.5 18.5 23.5 28.5 32.5 38.5 43.5
0.5
1.0
1.5
2.0
2.5
–1.3 –1.1 –0.9 –0.7 –0.5 –0.3 –0.1 0.10
FinlandCanada
Australia United StatesNew Zealand
United Kingdom
Norway
Sweden
South Africa
Denmark
VenezuelaJapan
(for example, a steeper slope of –1.5 versus –0.9). This implies that the
translation of IT imports into social surplus, productivity, and eco-
nomic growth has been stronger in the recent decade than during the
1990s. This is a bit surprising because the quality-adjusted decline in
IT prices actually slowed in the 2000s compared with the 1990s (from

236 Ascent after Decline
about 11 percent per year to about 8.5 percent per year).10 That the
relationship is strengthening suggests that more economies are getting
greater social surplus gains from their IT expenditures and imports. In
other words, economies on average are experiencing greater changes in
products, processes, and practices by using IT over the past decade than
during the dot-com decade.
Second, around the trend line is quite a dispersion of experience of
individual economies. Some of the dispersion could be due to greater
variety of imports or IT expenditures, which accentuates social surplus
gains. Some dispersion could also be due to institutional and business
environment factors that affect the relationship between IT diffusion
and productivity growth, as discussed in the literature. The next section
will address these points further.
IT Exporters. Now consider the exporters, where IT production exceeds
IT expenditure (see fi gure 7.4, panel b). For these economies, two forces
directly infl uence the underlying IT prices associated with the social sur-
plus calculation. On the one hand, the terms of trade should worsen for
exporters of IT hardware, reducing social surplus. On the other hand,
cost effi ciencies from economies of scale in production may offset the
terms-of-trade effect and increase social surplus.
In fact, the estimated trend coeffi cient near zero (0.0157) suggests
that there is virtually no relationship between being an exporter and
social surplus, which was also the case using data from the 1990s.11
However, the observation that the trend line cuts the y-axis at around
0.76 percent indicates that an economy does gain social surplus from
being a producer and exporter; it is just that there is not a strong rela-
tionship between the magnitude of production, exports, and social sur-
plus. Therefore, the hypothesized negative relationship between social
surplus and just the terms of trade is not, on average, supported by the
data for exporters. As suspected, it appears that economies of scale do
offset the pure terms-of-trade effect.
As was the case for importers, for exporters as well there is quite a bit
of dispersion around the trend line, including some economies where
a high production share of GDP appear to be associated with substan-
tial economies-of-scale gains that outweigh terms-of-trade losses from
exports (Malaysia). But for others (Indonesia), the terms-of-trade loss

Information Technology, Globalization, and Growth 237
appears to outweigh any economies-of-scale gain, in that social surplus
for Indonesia is estimated to be negative.
Finally, considering both panels a and b of fi gure 7.4 together sug-
gests that many importers and exporters have similar estimated social
surplus (between 0 and 0.5). Clearly net production (production less
expenditure) as a proxy for international trade cannot be the whole
story. The next section considers the role for variety in IT trade.
Variety and the Dispersion of Country Experience
In both panels of fi gure 7.4, the trend regression line shows the aver-
age social surplus and trade relationship for a particular set of econ-
omies. Those above the regression line have a greater-than-average
calculated social surplus from IT production less expenditure (whether
an importer or exporter), whereas those below the trend line have a
less-than-average calculated social surplus from their production and
expenditures on IT.
Earlier research on the roles for institutions and for labor and prod-
uct market fl exibility found that countries with more-rigid markets
(such as the continental European economies) tended to have lower
TFP growth associated with ICT; these economies lie below the regres-
sion line in fi gure 7.4, panel a. Countries that tended to have faster TFP
growth from ICT investments lie above the regression trend line (for
example, Australia, Finland, and the United States). The social surplus
calculation appears to map well to the diversity of country experiences
in using ICT.
For exporters (see fi gure 7.4, panel b), countries such as China, Ire-
land, Israel, the Republic of Korea, and Singapore are high-TFP coun-
tries where calculated social surplus is more than the average among
IT exporters. Other exporters (such as Brazil, Mexico, the Philippines,
and Thailand), while still enjoying positive social surplus, are growing
less quickly than the average within their peer group of exporters. For
at least some of these countries, previous research points to diffi cul-
ties with the infrastructural environment, which is less supportive of
domestic use of IT.
Research indicated that, in addition to institutional factors, labor and
product market competition, and infrastructure, variety could be an

238 Ascent after Decline
important factor relating to social surplus. How much can variety in IT
trade explain the dispersion of country experience around the trends?
Variety: Measurement and Country Experience Variety can be measured in several ways. This work uses the Herfi ndahl
(H) index.12 For each country, the value of 178 varieties of IT exports
and imports from the United Nations Comtrade database are allocated
to fi ve larger groups based on the OECD (2003a) categorization: other
ICT, computers, components, telecommunication, and audio-visual.
For example, the components category includes 62 varieties of compo-
nents. The Herfi ndahl index for components measures whether a coun-
try’s export (import) trade fl ows are about equally distributed among all
62 individual varieties (H close to 0) or whether one particular variety
of export (import) accounts for nearly all of the trade (H close to 1).
What might the H index reveal about a country’s pattern of trade?
Hs close to 1 for one or more of the fi ve categories suggest that imports
(exports) of a particular IT variety account for nearly the whole value
of trade in that category. Systematically high Hs in the computer and
component categories may point to the country being part of the glo-
bal value chain rather than having much production designed to satisfy
domestic demand. Export Hs close to 1 might be associated with delete-
rious terms of trade, whereas import Hs close to 1 would be associated
with positive terms-of-trade effects, especially if trade is concentrated in
a few intermediate inputs.
Systematically low Hs in the “other ICT” and audio-visual categories
may be associated with a greater variety of products that have embed-
ded ICT (such as medical devices, control instruments, and set-top
boxes). Greater variety may support innovation in business processes
and workplace practices in that business consumers are more likely to
fi nd products to meet their needs and to use in order to change business
processes and workplace practices.
Figure 7.5 shows Herfi ndahl indexes for three countries with differ-
ent patterns of trade and social surplus:
• Indonesia is an exporter with lower-than-average social surplus
(lying below the trend line) for exporters and a high concentration
of trade in computer exports. A concentrated export pattern with

other ICT
0.6
0.5
0.4
0.3
0.2
0.1
0other ICT other ICTcomputers
Indonesia
net exporter, lower growth
computers
United States
net importer, highest growth
China
net exporter, higher growth
computerscomponents components components
exportsimports
Figure 7.5 Variety vs. Concentration in Product Trade, Selected Countries
average of 1999 and 2006 Herfi ndahl indexes
Source: Author.
Note: EOS = economies of scale. TOT = terms of trade. ICT = information and communication technology. Overall, tall bars designate concentrated product space; short bars designate
variety in product space. The tallest export bars designate EOS gains but negative TOT. The shortest import and export bars designate variety gains and TOT gains.
239

240 Ascent after Decline
lower-than-average social surplus suggests that economies of scale
in production do not outweigh the terms-of-trade effect.
• China is also an exporter but with higher-than-average social surplus
(lying above the trend line) for exporters. Although China’s compu-
ter exports are somewhat concentrated, it has an even greater con-
centration of component imports. Therefore, China is more likely to
achieve higher-than-average social surplus by importing and getting
the benefi ts of the terms of trade on components than by producing
at economies of scale for export.
• The United States is an importer with higher-than-average social
surplus (lying above the trend line) for importers and a moderate
concentration of both exports and imports in computers and com-
ponents. Notably, however, it has a lot of variety (low H) of both
imports and exports of “other ICT” products. On the import side,
greater variety may meet more business needs and support TFP. On
the export side, greater variety is consistent with some market power
in trade associated with an ability to price above cost, therefore off-
setting the otherwise deteriorating terms of trade.
A systematic assessment of how variety is related to the dispersion of
countries around the mean, thus a comparison with their peers, involves
an econometric estimation. Table 7.3 reports on a simple regression
relating the deviation of countries’ experience from the average of their
peer group and the Herfi ndahl measures of variety.
The difference between the individual country data points and the
trend regression lines in the previous charts represents the country-
specifi c deviation from the average relationship for all the countries
measured. Positive (negative) residuals represent countries above
(below) the social surplus average, whether importers or exporters. Are
these residuals related to variety in exports and imports of the fi ve cat-
egories of ICT trade?
This simple evidence regarding the role for variety is stronger for
countries that have negative residuals—those with below-average
social surplus, whether as exporters or imports. On the import side, a
high import concentration (particularly of components and telecom-
munications) reduces the negative residuals, which is consistent with
the countries benefi ting from terms of trade. However, a high export

Table 7.3 Country Deviation from Trend Line and Export and Import Concentration
a. Countries below average (negative residuals) b. Countries above average (positive residuals)
Coeffi cients Standard error T-stat Coeffi cients Standard error T-stat
Intercept 1.97848375 0.47832930 4.136238 Intercept 0.302610986 0.8974011 0.337208
Import concentration Import concentration
Computers –0.06804930 0.37851722 –0.179780 Computers 0.082895698 1.4377481 0.057657
Components –8.80131440 2.55014584 –3.451300 Components –0.547320875 1.9650254 –0.278530
Telecoms –1.36409183 0.71022729 –1.920640 Telecoms –0.447041594 1.2689741 –0.352290
Audio-visual –0.41073959 0.77676283 –0.528780 Audio-visual 0.748854012 3.1948530 0.234394
Export concentration Export concentration
Computers 0.23293815 0.47546042 0.489921 Computers 0.355216222 0.8466289 0.419565
Components 3.38250904 1.34515425 2.514588 Components 1.436379223 0.9121335 1.574747
Telecoms –0.15029666 0.34159160 –0.439990 Telecoms 0.449863745 0.6655635 0.675914
Audio-visual 0.82114370 0.28915735 2.839782 Audio-visual –1.250264029 1.0623114 –1.176930
Source: Author.
241

242 Ascent after Decline
concentration (particularly components and audio-visual) increases
the residuals, moving the country further away from the average social
surplus. This fi nding suggests that the economies of scale do not out-
weigh terms of trade and variety. For countries with positive residuals
(social surplus above average), the extent of variety in trade does not
seem to be an important factor in explaining how a country differs from
its peers. This may be because many of these countries already have a
relatively high variety of both imports and exports.
Policy Implications
What are the implications of these fi ndings for economic growth?
First, becoming part of the global supply chain of IT production to
gain economies of scale may be a jumping-off point for higher growth.
Countries that neither produce nor consume much IT are the least well-
off in terms of social surplus and growth.
Second, a growth strategy that focuses on production mainly for
export in the international supply chain gives up the potential gains to
growth that come from importing, consuming, or producing domes-
tically a wide variety of IT products. Therefore, for most countries, a
high variety of traded IT products (both exports and imports) is asso-
ciated with higher TFP and therefore higher growth. This variety of
IT products, as used in the domestic economy, is associated with more-
widespread diffusion of IT throughout the economy—and with higher
TFP, higher GDP per capita, and growth.
Therefore, an IT-based growth strategy might start with being a part
of the international supply chain to gain economy-of-scale benefi ts and
later mature to import and produce the variety of products appropriate
for domestic needs. Appropriate infrastructure and institutions—and
a domestic business environment that is conducive to transformation
of economic activities—enhances the likelihood that this variety of
IT products yields higher growth.
Notes 1. See United Nations (2008) for general discussion of the terms-of-trade effect on
GDP versus GNI. See also Feenstra et al. (2007) for a further discussion of real
production versus real expenditure measures and their implications for welfare
Information Technology, Globalization, and Growth 243
analysis. Kohli estimates overall terms-of-trade effects for 26 countries (2004)
and Canada (2006).
2. The balance of payments surplus presumably is invested and thus there is an
intertemporal trade-off between the generation today and future generations.
3. See Crafts (2004) and Diewert and Morrison (1986) for mathematical details
of this isomorphism, and see Morrison and Diewert (1991) for examples using
Japanese and U.S. data.
4. The term “information technology” can include any combination of hard-
ware, software, services, and communications. In specifi c empirical analysis,
the included set can infl uence the results. Where it does, the text will be more
explicit; otherwise the generic term IT will be used.
5. Global fragmentation of production of IT services has begun relatively
recently, and has started out more concentrated (India), but promises to
become more globally disbursed. See, for example, the discussions in the
Information Technology Outlook (OECD 2008, 87) and Information Technology
Report (UNCTAD 2007).
6. See Mann (2006, 33)—on apparent concentration of production by U.S. multi-
nationals in low-cost locations—and Reed Electronics Research data.
7. Herein, much of the extant research includes telecommunications (C) as well as
information technology (IT) products, thus ICT.
8. Assuming that the targeting of certain sectors does not lead to corruption or
other ineffi cient activities.
9. Mann (2011) gives more details on the construction of the data and calculation
of each country’s social surplus. Among important points in the construction
of social surplus: Calculations consider only IT hardware, not communications
and not software. Communications is not addressed primarily because many
countries still have publicly owned communications networks, making market
forces less important in production, spending, and pricing decisions. Data on
international trade in software products and associated prices are not avail-
able. Moreover, calculations in Bayoumi and Haacker (2002) show, for the time
period of their study, that the main contributor to social surplus is the price
and expenditure dynamic for IT hardware. 10. The calculations for net price decline for each economy incorporate domestic
price changes and exchange rate changes, but the dominant feature driving the
data is the IT price decline in the U.S. data.
11. Removing Malaysia from the sample changes the trend coeffi cient to 0.093, so it
does not alter the overall observation.
12. The Herfi ndahl index is often used in industrial-organization investigations
to assess the extent of market competition among several fi rms—for example,
“four-fi rm concentration ratio.” Here one can use it to assess the extent to which
a country imports or exports a wide variety of detailed products or is special-
ized in importing or exporting just a few products. For more details on the
construction of the Herfi ndahl indexes, see Mann (2011).
244 Ascent after Decline
References Bayoumi, Tamim, and Markus Haacker. 2002. “It’s Not What You Make, It’s How
You Use IT: Measuring the Welfare Benefi ts of the IT Revolution across Coun-
tries.” Working Paper 02/117, International Monetary Fund, Washington, DC.
Broda, Christian, Joshua Greenfi eld, and David E. Weinstein. 2006. “From Ground-
nuts to Globalization: A Structural Estimate of Trade and Growth.” Working
Paper 2512, National Bureau of Economic Research, Cambridge, MA.
Chun, Hyunbae, and M. Ishaq Nadiri. 2008. “Decomposing Productivity Growth
in the U.S. Computer Industry.” Review of Economics and Statistics 90 (1):
174–80.
Comtrade (United Nations Commodity Trade Statistics Database). United Nations,
New York. http://comtrade.un.org/db.
Crafts, Nicholas F. R. 2004. “Social Savings as a Measure of the Contribution of a
New Technology to Economic Growth.” Working Paper in Large-Scale Techno-
logical Change 06/04, London School of Economics, London.
Diewert, W. Erwin, and Catherine J. Morrison. 1986. “Adjusting Output and Pro-
ductivity Indexes for Changes in the Terms of Trade.” Economic Journal 96
(383): 659–79.
Dewan, Sanjay, and Kenneth L. Kraemer. 2000. “Information Technology and Pro-
ductivity: Evidence from Country-Level Data.” Management Science 46 (4):
548–62.
Feenstra, Robert C., Alan Heston, Marcel P. Timmer, and Haiyeng Deng. 2007.
“Estimating Real Production and Expenditures across Nations: A Proposal
for Improving the Penn World Tables.” Policy Research Working Paper 4166,
World Bank, Washington, DC.
Feenstra, Robert, and Hiau Looi Kee. 2008. “Export Variety and Country Productiv-
ity: Estimating the Monopolistic Competition Model with Endogenous Pro-
ductivity.” Journal of International Economics 74 (2): 500–18.
Gust, Christopher, and Jaime Marquez. 2000. “Productivity Development Abroad.”
Federal Reserve Bulletin 86 (October): 665–81.
Kohli, Ulrich. 2004. “Real GDP, Real Domestic Income, and Terms-of-Trade
Changes.” Journal of International Economics 62 (1): 83–106.
———. 2006. “Real GDP, Real GDI, and Trading Gains: Canada 1981–2005.” Inter-
national Productivity Monitor 13 (Fall): 46–56.
Mann, Catherine L. 2006. Accelerating the Globalization of America: The Role for
Information Technology. Washington, DC: Peterson Institute for International
Economics.
———. 2009. “ICT, Trade, and Innovation: The Channels of Contribution.” Pre-
pared for the OECD Working Party of the Trade Committee, June 2009.
———. 2011. “Information Technology, Globalization, and Growth: Role for Scale
Economies, Terms of Trade, and Variety. Working Paper 27, Department of

Information Technology, Globalization, and Growth 245
Economics and International Business School, Brandeis University, Waltham,
Mass.
Mann, Catherine L., Sue E. Eckert, and Sarah Cleeland Knight. 2000. Global Electronic
Commerce: A Policy Primer. Institute for International Economics: Washington,
DC.
Morrison, Catherine, and Erwin Diewert. 1991. “Productivity Growth and Changes
in the Terms of Trade in Japan and the United States.” In Productivity Growth in
Japan and the United States. National Bureau of Economic Research Studies in
Income and Wealth Series, ed. Charles R. Hulten, 201–27. Chicago: University
of Chicago Press.
Mun, Sung-Bae, and M. Ishaq Nadiri. 2002. “Information Technology Externalities:
Empirical Evidence from 42 U.S. Industries.” Working Paper 9272, National
Bureau of Economic Research, Cambridge, MA.
OECD (Organisation for Economic Co-operation and Development). 2003a. “A Pro-
posed Classifi cation of ICT Goods.” Paper of the Working Party on Indicators
for the Information Society, DSTI/ICCP/IIS(2003)1/Rev 2, OECD, Paris.
———. 2003b. The Source of Economic Growth in OECD Countries. Paris: OECD.
———. 2008. Information Technology Outlook 2008. Paris: OECD.
Reed Electronics Research (database). RER (Reed Electronics Research), Oxon, U.K.
http://www.rer.co.uk/.
Pohjola, Matti. 2001. “Information Technology and Economic Growth: A Cross-
Country Analysis.” In Information Technology, Productivity, and Economic
Growth: International Evidence and Implications for Economic Development, ed.
Matti Pohjola. Oxford, U.K.: Oxford University Press.
Sciadas, George, ed. 2005. From the Digital Divide to Digital Opportunities: Measuring
Infostates for Development. Publication prepared by Orbicom (International Net-
work of UNESCO Chairs in Communications) and ITU (International Telecom-
munication Union). Montreal: Claude-Yves Charron and NRC Press Canada.
Seo, Hwan-Joo, and Young Soo Lee. 2006. “Contribution of Information and Com-
munication Technology to Total Factor Productivity and Externalities Effects.”
Information Technology for Development 12 (2): 159–73.
Shih, Eric, Kenneth L. Kraemer, and Jason Dedrick. 2007. “Research Note: Determi-
nants of Country-Level Investment in Information Technology.” Management
Science 53 (3): 521–28.
UN (United Nations). 2008. “Price and Volume Measures.” In System of National
Accounts, 2008, 295–323. New York: European Commission, International
Monetary Fund, Organisation for Economic Co-operation and Development,
United Nations, and World Bank.
UNCTAD (United Nations Conference on Trade and Development). 2000–08.
World Investment Report. New York and Geneva: UNCTAD.
———. 2007. Information Economy Report 2007–2008. New York and Geneva:
UNCTAD.

246 Ascent after Decline
van Ark, Bart. 2005. “Does the European Union Need to Revive Productivity
Growth?” Groningen Growth and Development Centre Research Memoran-
dum GD-75, University of Groningen, Netherlands.
van Ark, Bart, Robert Inklaar, and Robert McGuckin. 2003. “‘Changing Gear’—Pro-
ductivity, ICT, and Service Industries: Europe and the United States.” In The
Industrial Dyanmics of the New Digital Economy, ed. Jens Froslev Christensen
and Peter Maskell, 56–100. Cheltenham, U.K.: Edward Elgar.
WITSA (World Information Technology and Services Alliance). 2000–08. “Digital
Planet.” Biennial report, WITSA, Selangor, Malaysia.