Embed Size (px)
Citation preview

Perspectives on Growth:A Political-Economy
FrameworkLessons from the Singapore Experience
Tan Yin YingAlvin Eng
Edward Robinson
WORKING PAPER NO.1
www.growthcommission.org
Commission on Growth and Development Montek AhluwaliaEdmar BachaDr. BoedionoLord John Browne Kemal DervisAlejandro FoxleyGoh Chok TongHan Duck-sooDanuta HübnerCarin JämtinPedro-Pablo KuczynskiDanny Leipziger, Vice ChairTrevor ManuelMahmoud MohieldinNgozi N. Okonjo-IwealaRobert RubinRobert SolowMichael Spence, ChairSir K. Dwight VennerErnesto ZedilloZhou Xiaochuan
The mandate of the Commission on Growth and Development is to gather the best understanding there is about the policies and strategies that underlie rapid economic growth and poverty reduction.
The Commission’s audience is the leaders of developing countries. The Commission is supported by the governments of Australia, Sweden, the Netherlands, and United Kingdom, The William and Flora Hewlett Foundation, and The World Bank Group.
With the evolution of neoclassical growth models, it became increasingly evi-dent that factor accumulation alone was insuffi cient for sustained growth.
Empirically, the growth experience of many countries and the numerous extensive cross-country regressions provided evidence that good policies and sound institu-tions were important factors in explaining divergent economic outcomes. These factors were playing a signifi cant role in building and sustaining the momentum for growth.
This paper attempts to develop a framework that matches a country’s growth performance to a set of qualitative variables, with particular emphasis on political-economy variables covering institutions and geography. We fi nd that rich natural endowments do not guarantee prosperity; rather, indicators measuring institution-al and leadership quality matter to growth performance. Political ideologies and systems notwithstanding, strong institutions and capable leaders are relevant in (a) formulating good, pro-growth policies, (b) implementing these policies, and (c) building social consensus, which allows a country’s population to be aligned with pro-growth policies. Taken together, these factors shed some insights into the art of policy making for pro-growth outcomes. The paper also illustrates the rele-vance of these factors in Singapore’s own growth development experience over the past 40 years.
Tan Yin Ying, Senior Economist, Economic Policy Department, Monetary Authority of Singapore
Alvin Eng, Senior Economist, Monetary Authority of Singapore and Advisor to the Executive Director (Southeast Asia Voting Group), IMF
Edward Robinson, Executive Director, Economic Policy Department, Monetary Authority of Singapore
Cover_WP001.indd 2Cover_WP001.indd 2 3/4/2008 9:37:37 AM3/4/2008 9:37:37 AM

WORKING PAPER NO. 1
Perspectives on Growth: A Political-Economy
Framework Lessons from the Singapore Experience
Tan Yin Ying Alvin Eng
Edward Robinson
© 2008 The Monetary Authority of Singapore JEL Classification Number: O10, O20, O57, E61 Keywords: Growth, Development, Institutions, Leadership The views in this paper are solely those of the authors and should not be attributed to the Monetary Authority of Singapore. This paper was originally released as “Perspectives on Growth: A Political-Economy Framework,” MAS Staff Paper No. 47 (Aug 2007). Published by The International Bank for Reconstruction and Development / The World Bank on behalf of the Commission on Growth and Development 1818 H Street NW Washington, DC 20433 Telephone: 202-473-1000 Internet: www.worldbank.org www.growthcommission.org E-mail: [email protected] [email protected] All rights reserved 1 2 3 4 5 11 10 09 08 The Commission on Growth and Development is sponsored by the following organizations: Australian Agency for International Development (AusAID) Dutch Ministry of Foreign Affairs Swedish International Development Cooperation Agency (SIDA) U.K. Department of International Development (DFID) The William and Flora Hewlett Foundation The World Bank Group The findings, interpretations, and conclusions expressed herein do not necessarily reflect the views of the sponsoring organizations or the governments they represent. The sponsoring organizations do not guarantee the accuracy of the data included in this work. The boundaries, colors, denominations, and other information shown on any map in this work do not imply any judgment on the part of the sponsoring organizations concerning the legal status of any territory or the endorsement or acceptance of such boundaries. All queries on rights and licenses, including subsidiary rights, should be addressed to the Office of the Publisher, The World Bank, 1818 H Street NW, Washington, DC 20433, USA; fax: 202-522-2422; e-mail: [email protected]. Cover design: Naylor Design
Perspectives on Growth: A Political-Economy Framework iii
About the Series
The Commission on Growth and Development led by Nobel Laureate Mike Spence was established in April 2006 as a response to two insights. First, poverty cannot be reduced in isolation from economic growth—an observation that has been overlooked in the thinking and strategies of many practitioners. Second, there is growing awareness that knowledge about economic growth is much less definitive than commonly thought. Consequently, the Commission’s mandate is to “take stock of the state of theoretical and empirical knowledge on economic growth with a view to drawing implications for policy for the current and next generation of policy makers.”
To help explore the state of knowledge, the Commission invited leading academics and policy makers from developing and industrialized countries to explore and discuss economic issues it thought relevant for growth and development, including controversial ideas. Thematic papers assessed knowledge in areas such as monetary and fiscal policies, climate change, and equity and growth and highlighted ongoing debates. Additionally, 25 country case studies were commissioned to explore the dynamics of growth and change in the context of specific countries.
Working papers in this series were presented and reviewed at Commission workshops, which were held in 2007–08 in Washington, D.C., New York City, and New Haven, Connecticut. Each paper benefited from comments by workshop participants, including academics, policy makers, development practitioners, representatives of bilateral and multilateral institutions, and Commission members.
The working papers, and all thematic papers and case studies written as contributions to the work of the Commission, were made possible by support from the Australian Agency for International Development (AusAID), the Dutch Ministry of Foreign Affairs, the Swedish International Development Cooperation Agency (SIDA), the U.K. Department of International Development (DFID), the William and Flora Hewlett Foundation, and the World Bank Group.
The working paper series was produced under the general guidance of Mike Spence and Danny Leipziger, Chair and Vice Chair of the Commission, and the Commission's Secretariat, which is based in the Poverty Reduction and Economic Management Network of the World Bank. Papers in this series represent the independent view of the authors.
iv Tan Yin Ying, Alvin Eng, and Edward Robinson
Acknowledgments
The authors acknowledge Senior Minister Goh Chok Tong’s insights, which have formed the basis of the analytical framework developed in this paper. We have also benefitted from useful comments from Albert Chua, Khor Hoe Ee, and Celine Sia, as well as inputs provided by Ang Eng Siong, Edwin Heng, Ji Gang, Aloysius Lim, Carol Lye, Ng Yi Ping, Saktiandi Supaat, Tan Siang Meng, and Tu Suh Ping.
This paper was originally prepared for the second meeting of the Commission on Growth and Development, September 17, 2006. The views in this paper are solely those of the authors and should not be attributed to the Monetary Authority of Singapore.
Perspectives on Growth: A Political-Economy Framework v
Abstract
With the evolution of neoclassical growth models, it became increasingly evident that factor accumulation alone was insufficient for sustained growth. Empirically, the growth experience of many countries and the numerous extensive cross-country regressions provided evidence that good policies and sound institutions were important factors in explaining divergent economic outcomes. These factors were playing a significant role in building and sustaining the momentum for growth.
This paper attempts to develop a framework that matches a country’s growth performance to a set of qualitative variables, with particular emphasis on political-economy variables covering institutions and geography. We find that rich natural endowments do not guarantee prosperity; rather, indicators measuring institutional and leadership quality matter to growth performance. Political ideologies and systems notwithstanding, strong institutions and capable leaders are relevant in (a) formulating good, pro-growth policies, (b) implementing these policies, and (c) building social consensus, which allows a country’s population to be aligned with pro-growth policies. Taken together, these factors shed some insights into the art of policy making for pro-growth outcomes. The paper also illustrates the relevance of these factors in Singapore’s own growth development experience over the past 40 years.

Perspectives on Growth: A Political-Economy Framework vii
Contents About the Series .................................................................................................. iii Acknowledgments .............................................................................................. iv Abstract.................................................................................................................. v Introduction .......................................................................................................... 1 The Global Growth Experience Since 1960 ...................................................... 2 A Conceptual Political-Economy Framework ................................................. 9 Singapore’s Development Experience ............................................................ 14 Natural Endowments, Institutions, Leadership, and People ..................... 26 Policy Lessons and Conclusion........................................................................ 31 References ........................................................................................................... 35 Appendix 1: Method for Sampling PWT6.2................................................... 37 Appendix 2: Data Sources and Interpretation ............................................... 38 Appendix 3a: Indicator Scores for Growth Outperformers......................... 42 Appendix 3b: Indicator Scores for Average Performers .............................. 43 Appendix 3c: Indicator Scores for Growth Underperformers..................... 44

Perspectives on Growth: A Political-Economy Framework 1
Perspectives on Growth: A Political-Economy Framework Lessons from the Singapore Experience Tan Yin Ying Alvin Eng Edward Robinson1
Introduction
Until the 1970s, traditional neoclassical growth models emphasized differences in factor accumulation to explain differences in income per capita across countries. These models found factors such as saving rates (Solow, 1956), preferences (Cass, 1965; Koopmans, 1965), or other exogenous parameters, such as total factor productivity growth, to be important. More recent strands of growth theory, following Romer (1986) and Lucas (1988), are similar in this approach but endogenize steady-state growth and technical progress.
Throughout the 1990s, it became increasingly evident that factor accumulation alone was insufficient for sustained growth. The growth experience of many countries in the 1990s and numerous extensive cross-country regressions provided evidence that good policies and sound institutions play an equally, if not more, important role in building and sustaining the momentum for growth. While a consensus has yet to be reached on the impact that policies and institutions have on growth, a far greater deal of attention has been paid in an attempt to understand their roles in the growth story.
This paper attempts to match a country’s growth performance to a set of qualitative variables, with particular emphasis on political-economy variables covering institutions and geography. We draw extensively on data from Penn World Table 6.2 2 (PWT6.2) to create a comparable database of growth performance for countries across the time period 1960 to 2003. Appendix 1 elaborates on the methodology used to sample PWT6.2.
1 Tan Yin Ying is a Senior Economist at the Economic Policy Department, Monetary Authority of Singapore. Alvin Eng is a Senior Economist with the Monetary Authority of Singapore. He is currently seconded to the International Monetary Fund as Advisor to the Executive Director (Southeast Asia Voting Group). Edward Robinson is Executive Director of the Economic Policy Department, Monetary Authority of Singapore. 2 Heston, Summers, and Aten (2006).

2 Tan Yin Ying, Alvin Eng, and Edward Robinson
The Global Growth Experience Since 1960
An examination of the data dating back to 1960 throws up some interesting observations on the global growth experience. Notably, the median chain-weighted PPP-adjusted per capita GDP (henceforth real per capita GDP) of countries has increased steadily over the years, rising from US$2,463 in 1960 to US$6,025 in 2003 (Figure 1a). The income gap between countries has also widened considerably, especially over the last decade or so. This can be seen from the increased income range, which was measured as the difference between the real per capita GDP of the wealthiest and poorest country (Figure 1b). What this clearly shows is that the growth process over the last 43 years has benefited some countries more than others, and that this differential has persisted, contrary to theoretical predictions of (absolute) growth convergence models.
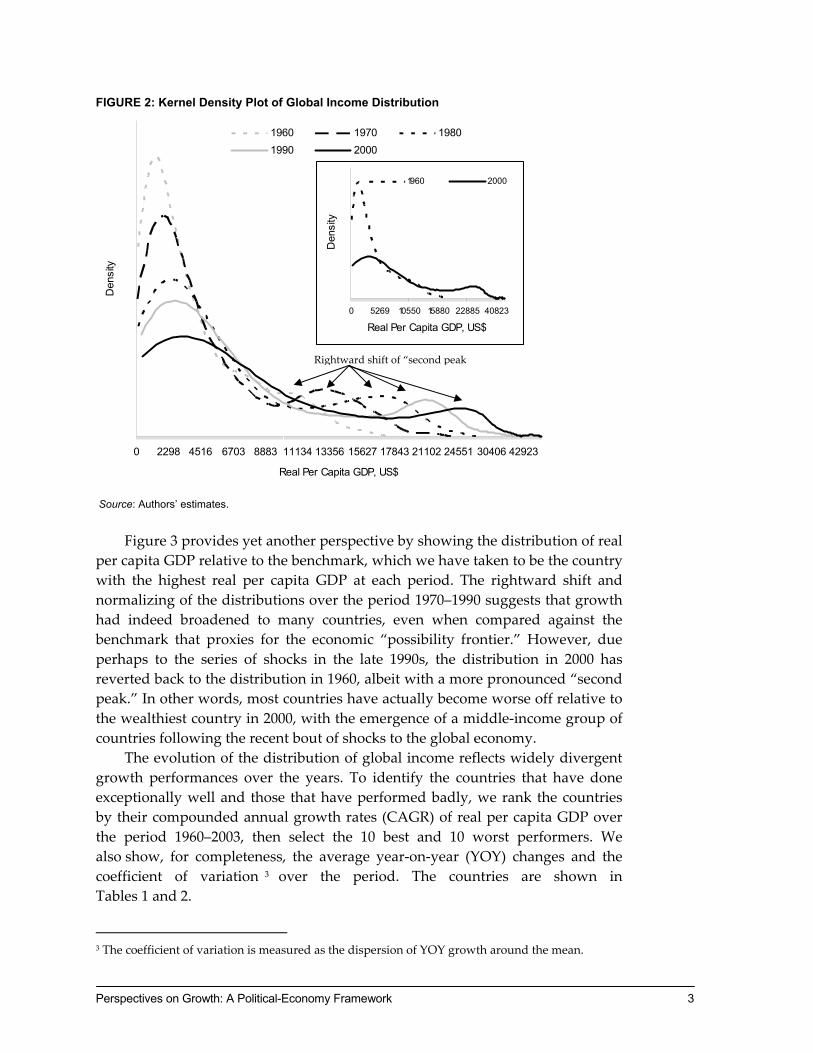
Following Durlauf et al. (2005), we next examine the global distribution of income at 10-year intervals from 1960 to 2000 using kernel density plots. Figure 2 shows the estimated distribution functions for GDP per capita growth across countries, with the rightward shift reflecting the growth that took place since 1960. Noticeably, the distribution has become more “normal” (less peaked), suggesting a broadening of growth to more countries over the years. Nonetheless, the rightward shift of the “second peak” in the distribution across the time period corroborates our earlier observation that the income gap across countries has increased over time.
FIGURE 1a: Real Per Capita GDP (1960–2000)
FIGURE 1b: Range of Real Per Capita GDP (1960–2000)
0
2,000
4,000
6,000
8,000
10,000
12,000
1960
1965
1970
1975
1980
1985
1990
1995
2000
US$
Median Mean
0
10,000
20,000
30,000
40,000
50,000
60,000
1960
1965
1970
1975
1980
1985
1990
1995
2000
US$
Note: Data in charts 1(a) and (b) are denominated in international PPP-dollars. This is equivalent to the purchasing power of a US$ in a given year.
Perspectives on Growth: A Political-Economy Framework 3
FIGURE 2: Kernel Density Plot of Global Income Distribution
Source: Authors’ estimates.
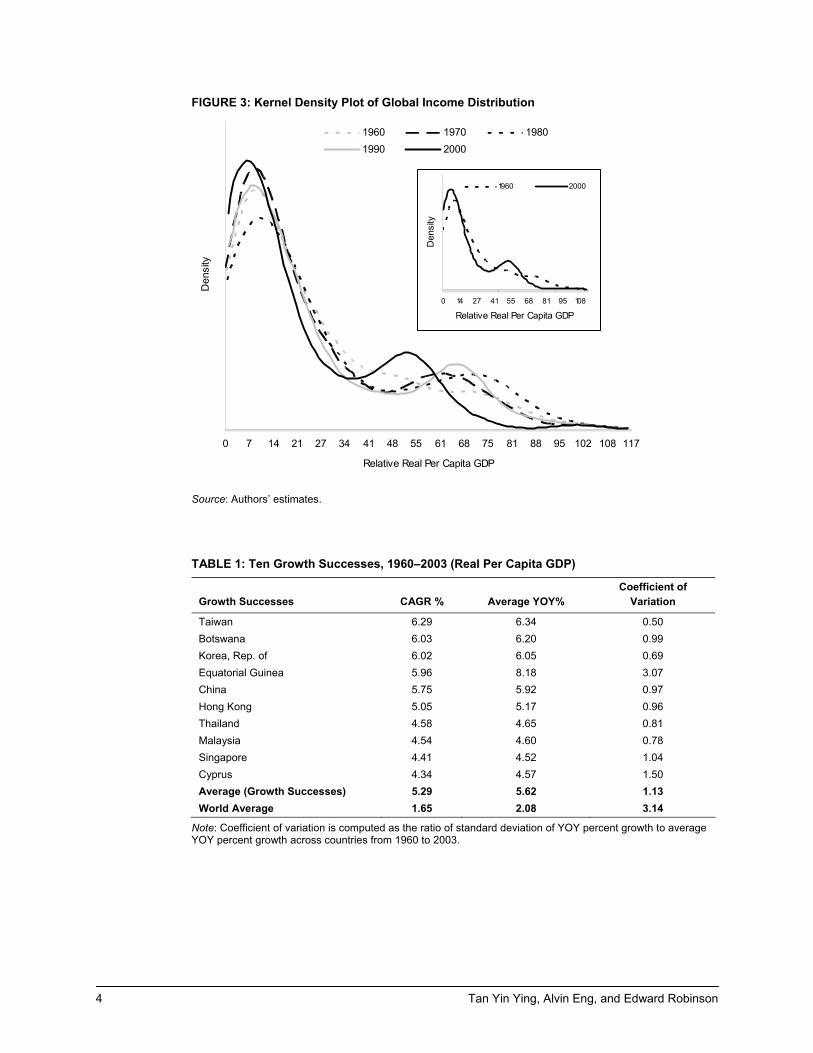
Figure 3 provides yet another perspective by showing the distribution of real
per capita GDP relative to the benchmark, which we have taken to be the country with the highest real per capita GDP at each period. The rightward shift and normalizing of the distributions over the period 1970–1990 suggests that growth had indeed broadened to many countries, even when compared against the benchmark that proxies for the economic “possibility frontier.” However, due perhaps to the series of shocks in the late 1990s, the distribution in 2000 has reverted back to the distribution in 1960, albeit with a more pronounced “second peak.” In other words, most countries have actually become worse off relative to the wealthiest country in 2000, with the emergence of a middle-income group of countries following the recent bout of shocks to the global economy.
The evolution of the distribution of global income reflects widely divergent growth performances over the years. To identify the countries that have done exceptionally well and those that have performed badly, we rank the countries by their compounded annual growth rates (CAGR) of real per capita GDP over the period 1960–2003, then select the 10 best and 10 worst performers. We also show, for completeness, the average year-on-year (YOY) changes and the coefficient of variation 3 over the period. The countries are shown in Tables 1 and 2.
3 The coefficient of variation is measured as the dispersion of YOY growth around the mean.
0 2298 4516 6703 8883 11134 13356 15627 17843 21102 24551 30406 42923
Real Per Capita GDP, US$
Den
sity
1960 1970 19801990 2000
Rightward shift of “second peak
0 5269 10550 15880 22885 40823
Real Per Capita GDP, US$D
ensi
ty
1960 2000
4 Tan Yin Ying, Alvin Eng, and Edward Robinson
FIGURE 3: Kernel Density Plot of Global Income Distribution
Source: Authors’ estimates.
TABLE 1: Ten Growth Successes, 1960–2003 (Real Per Capita GDP)
Growth Successes CAGR % Average YOY% Coefficient of
Variation
Taiwan 6.29 6.34 0.50 Botswana 6.03 6.20 0.99 Korea, Rep. of 6.02 6.05 0.69 Equatorial Guinea 5.96 8.18 3.07 China 5.75 5.92 0.97 Hong Kong 5.05 5.17 0.96 Thailand 4.58 4.65 0.81 Malaysia 4.54 4.60 0.78 Singapore 4.41 4.52 1.04 Cyprus 4.34 4.57 1.50 Average (Growth Successes) 5.29 5.62 1.13 World Average 1.65 2.08 3.14
Note: Coefficient of variation is computed as the ratio of standard deviation of YOY percent growth to average YOY percent growth across countries from 1960 to 2003.
0 7 14 21 27 34 41 48 55 61 68 75 81 88 95 102 108 117
Relative Real Per Capita GDP
Den
sity
1960 1970 19801990 2000
0 14 27 41 55 68 81 95 108
Relative Real Per Capita GDP
Den
sity
1960 2000
Perspectives on Growth: A Political-Economy Framework 5
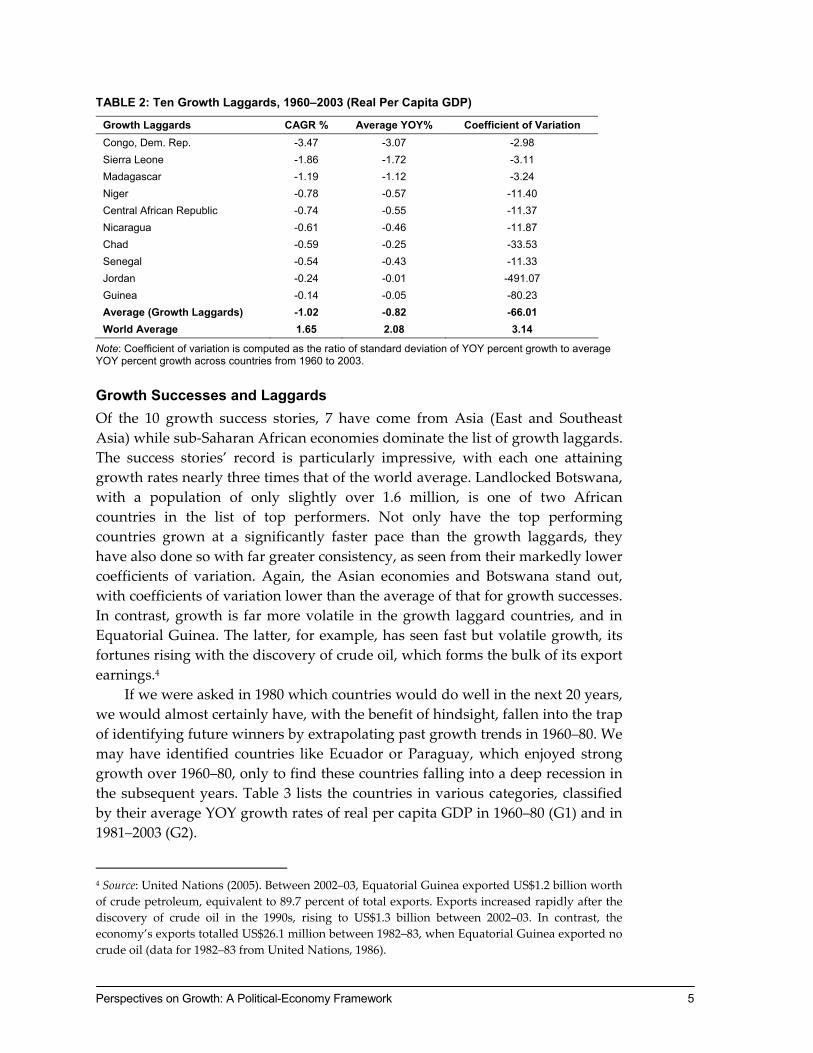
TABLE 2: Ten Growth Laggards, 1960–2003 (Real Per Capita GDP)
Growth Laggards CAGR % Average YOY% Coefficient of Variation Congo, Dem. Rep. -3.47 -3.07 -2.98 Sierra Leone -1.86 -1.72 -3.11 Madagascar -1.19 -1.12 -3.24 Niger -0.78 -0.57 -11.40 Central African Republic -0.74 -0.55 -11.37 Nicaragua -0.61 -0.46 -11.87 Chad -0.59 -0.25 -33.53 Senegal -0.54 -0.43 -11.33 Jordan -0.24 -0.01 -491.07 Guinea -0.14 -0.05 -80.23 Average (Growth Laggards) -1.02 -0.82 -66.01 World Average 1.65 2.08 3.14
Note: Coefficient of variation is computed as the ratio of standard deviation of YOY percent growth to average YOY percent growth across countries from 1960 to 2003.
Growth Successes and Laggards Of the 10 growth success stories, 7 have come from Asia (East and Southeast Asia) while sub-Saharan African economies dominate the list of growth laggards. The success stories’ record is particularly impressive, with each one attaining growth rates nearly three times that of the world average. Landlocked Botswana, with a population of only slightly over 1.6 million, is one of two African countries in the list of top performers. Not only have the top performing countries grown at a significantly faster pace than the growth laggards, they have also done so with far greater consistency, as seen from their markedly lower coefficients of variation. Again, the Asian economies and Botswana stand out, with coefficients of variation lower than the average of that for growth successes. In contrast, growth is far more volatile in the growth laggard countries, and in Equatorial Guinea. The latter, for example, has seen fast but volatile growth, its fortunes rising with the discovery of crude oil, which forms the bulk of its export earnings.4
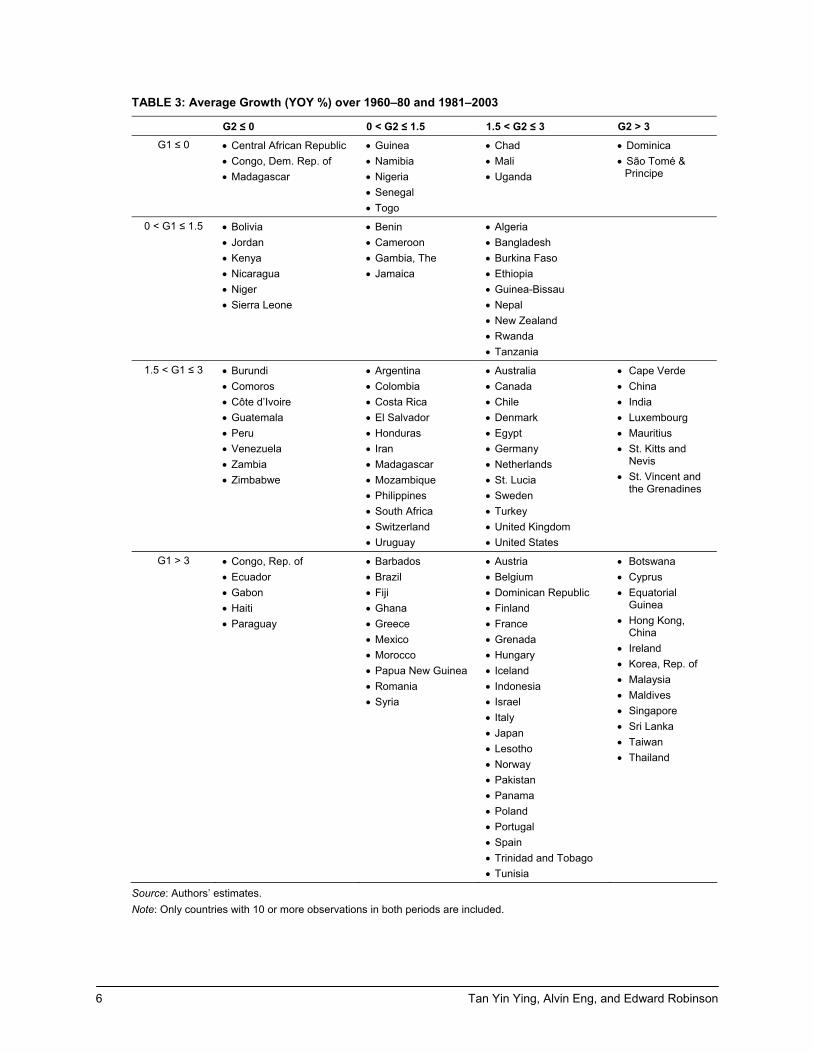
If we were asked in 1980 which countries would do well in the next 20 years, we would almost certainly have, with the benefit of hindsight, fallen into the trap of identifying future winners by extrapolating past growth trends in 1960–80. We may have identified countries like Ecuador or Paraguay, which enjoyed strong growth over 1960–80, only to find these countries falling into a deep recession in the subsequent years. Table 3 lists the countries in various categories, classified by their average YOY growth rates of real per capita GDP in 1960–80 (G1) and in 1981–2003 (G2).
4 Source: United Nations (2005). Between 2002–03, Equatorial Guinea exported US$1.2 billion worth of crude petroleum, equivalent to 89.7 percent of total exports. Exports increased rapidly after the discovery of crude oil in the 1990s, rising to US$1.3 billion between 2002–03. In contrast, the economy’s exports totalled US$26.1 million between 1982–83, when Equatorial Guinea exported no crude oil (data for 1982–83 from United Nations, 1986).
6 Tan Yin Ying, Alvin Eng, and Edward Robinson
TABLE 3: Average Growth (YOY %) over 1960–80 and 1981–2003
G2 ≤ 0 0 < G2 ≤ 1.5 1.5 < G2 ≤ 3 G2 > 3 G1 ≤ 0 • Central African Republic
• Congo, Dem. Rep. of • Madagascar
• Guinea • Namibia • Nigeria • Senegal • Togo
• Chad • Mali • Uganda
• Dominica • São Tomé &
Principe
0 < G1 ≤ 1.5 • Bolivia • Jordan • Kenya • Nicaragua • Niger • Sierra Leone
• Benin • Cameroon • Gambia, The • Jamaica
• Algeria • Bangladesh • Burkina Faso • Ethiopia • Guinea-Bissau • Nepal • New Zealand • Rwanda • Tanzania
1.5 < G1 ≤ 3 • Burundi • Comoros • Côte d’Ivoire • Guatemala • Peru • Venezuela • Zambia • Zimbabwe
• Argentina • Colombia • Costa Rica • El Salvador • Honduras • Iran • Madagascar • Mozambique • Philippines • South Africa • Switzerland • Uruguay
• Australia • Canada • Chile • Denmark • Egypt • Germany • Netherlands • St. Lucia • Sweden • Turkey • United Kingdom • United States
• Cape Verde • China • India • Luxembourg • Mauritius • St. Kitts and
Nevis • St. Vincent and
the Grenadines
G1 > 3 • Congo, Rep. of • Ecuador • Gabon • Haiti • Paraguay
• Barbados • Brazil • Fiji • Ghana • Greece • Mexico • Morocco • Papua New Guinea • Romania • Syria
• Austria • Belgium • Dominican Republic • Finland • France • Grenada • Hungary • Iceland • Indonesia • Israel • Italy • Japan • Lesotho • Norway • Pakistan • Panama • Poland • Portugal • Spain • Trinidad and Tobago • Tunisia
• Botswana • Cyprus • Equatorial
Guinea • Hong Kong,
China • Ireland • Korea, Rep. of • Malaysia • Maldives • Singapore • Sri Lanka • Taiwan • Thailand
Source: Authors’ estimates. Note: Only countries with 10 or more observations in both periods are included.
Perspectives on Growth: A Political-Economy Framework 7
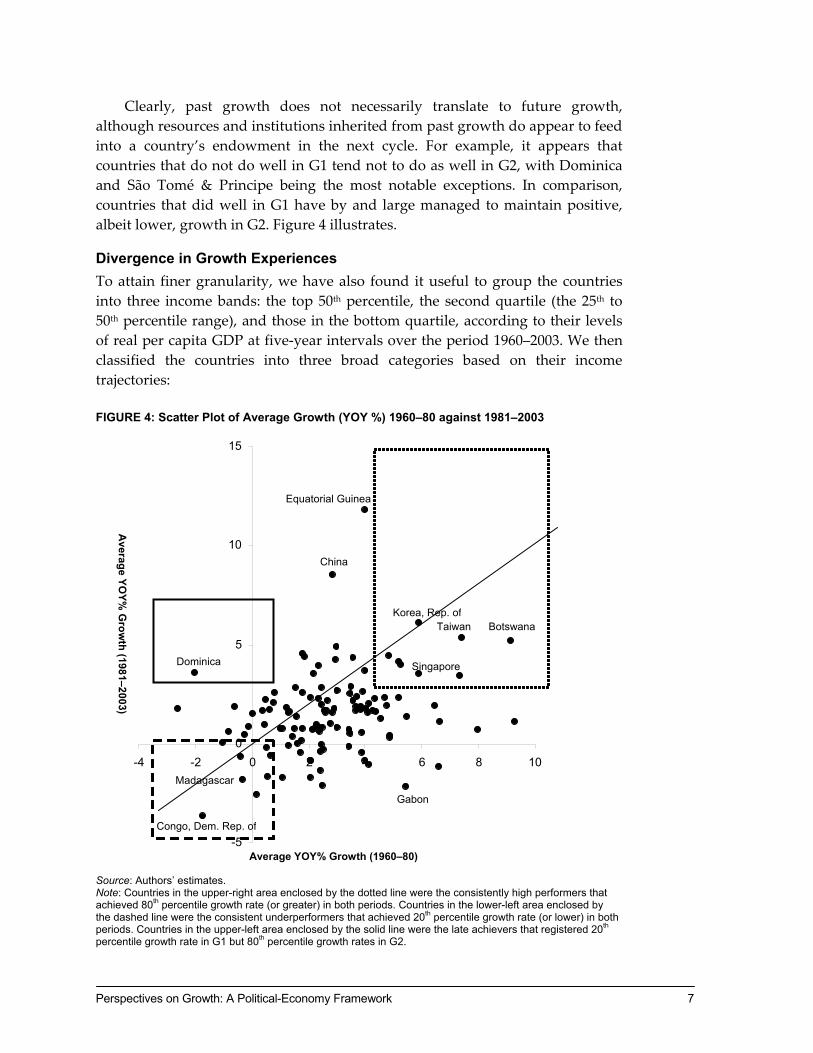
Clearly, past growth does not necessarily translate to future growth, although resources and institutions inherited from past growth do appear to feed into a country’s endowment in the next cycle. For example, it appears that countries that do not do well in G1 tend not to do as well in G2, with Dominica and São Tomé & Principe being the most notable exceptions. In comparison, countries that did well in G1 have by and large managed to maintain positive, albeit lower, growth in G2. Figure 4 illustrates.
Divergence in Growth Experiences To attain finer granularity, we have also found it useful to group the countries into three income bands: the top 50th percentile, the second quartile (the 25th to 50th percentile range), and those in the bottom quartile, according to their levels of real per capita GDP at five-year intervals over the period 1960–2003. We then classified the countries into three broad categories based on their income trajectories: FIGURE 4: Scatter Plot of Average Growth (YOY %) 1960–80 against 1981–2003
Source: Authors’ estimates. Note: Countries in the upper-right area enclosed by the dotted line were the consistently high performers that achieved 80th percentile growth rate (or greater) in both periods. Countries in the lower-left area enclosed by the dashed line were the consistent underperformers that achieved 20th percentile growth rate (or lower) in both periods. Countries in the upper-left area enclosed by the solid line were the late achievers that registered 20th percentile growth rate in G1 but 80th percentile growth rates in G2.
-5
0
5
10
15
-4 -2 0 2 4 6 8 10
Average YOY% Growth (1960–80)
Average YO
Y% G
rowth (1981–2003)
Taiwan Botswana
Singapore
Korea, Rep. of
Equatorial Guinea
China
Congo, Dem. Rep. of
Madagascar Gabon
Dominica
8 Tan Yin Ying, Alvin Eng, and Edward Robinson
i. Advancers—Countries that rose from one income band into a higher one for three consecutive observations or more, without slipping back to their original band. This would include a country rising from the bottom quartile into the second, or a country rising into the top 50th percentile from the income bands below.
ii. Average Performers—Countries that remained in the income band between the bottom quartile and the 50th percentile.
iii. Underperformers—Countries that fell from an income band into the ones below for three consecutive observations or more. This would include a country regressing into the lowest quartile from the second, or a country falling from the top 50th percentile into the income bands below. By grouping these countries this way, we have effectively filtered out
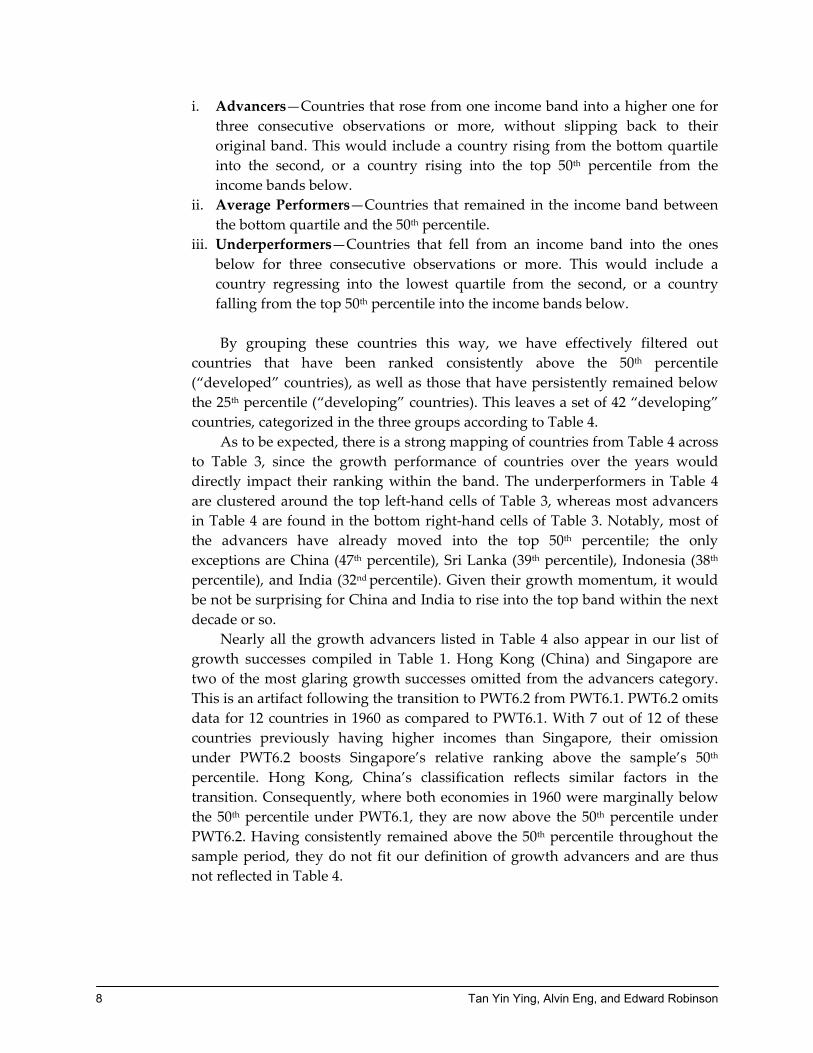
countries that have been ranked consistently above the 50th percentile (“developed” countries), as well as those that have persistently remained below the 25th percentile (“developing” countries). This leaves a set of 42 “developing” countries, categorized in the three groups according to Table 4.
As to be expected, there is a strong mapping of countries from Table 4 across to Table 3, since the growth performance of countries over the years would directly impact their ranking within the band. The underperformers in Table 4 are clustered around the top left-hand cells of Table 3, whereas most advancers in Table 4 are found in the bottom right-hand cells of Table 3. Notably, most of the advancers have already moved into the top 50th percentile; the only exceptions are China (47th percentile), Sri Lanka (39th percentile), Indonesia (38th percentile), and India (32nd percentile). Given their growth momentum, it would be not be surprising for China and India to rise into the top band within the next decade or so.
Nearly all the growth advancers listed in Table 4 also appear in our list of growth successes compiled in Table 1. Hong Kong (China) and Singapore are two of the most glaring growth successes omitted from the advancers category. This is an artifact following the transition to PWT6.2 from PWT6.1. PWT6.2 omits data for 12 countries in 1960 as compared to PWT6.1. With 7 out of 12 of these countries previously having higher incomes than Singapore, their omission under PWT6.2 boosts Singapore’s relative ranking above the sample’s 50th percentile. Hong Kong, China’s classification reflects similar factors in the transition. Consequently, where both economies in 1960 were marginally below the 50th percentile under PWT6.1, they are now above the 50th percentile under PWT6.2. Having consistently remained above the 50th percentile throughout the sample period, they do not fit our definition of growth advancers and are thus not reflected in Table 4.
Perspectives on Growth: A Political-Economy Framework 9
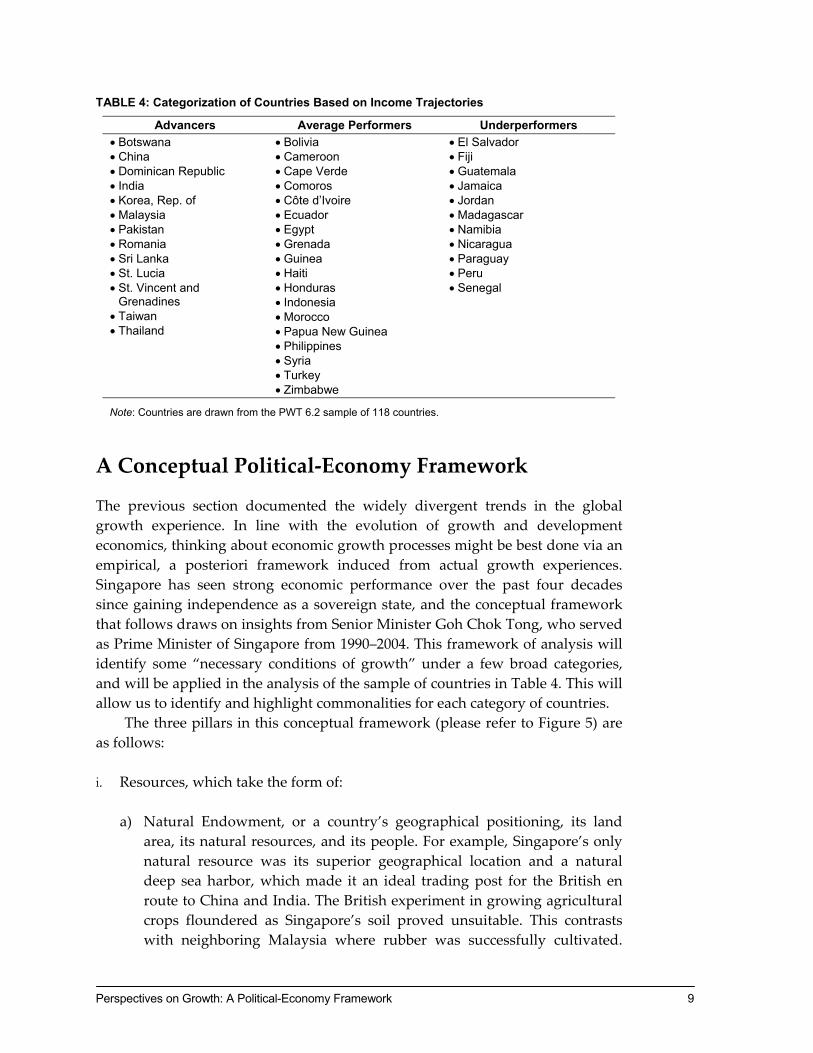
TABLE 4: Categorization of Countries Based on Income Trajectories
Advancers Average Performers Underperformers • Botswana • China • Dominican Republic • India • Korea, Rep. of • Malaysia • Pakistan • Romania • Sri Lanka • St. Lucia • St. Vincent and
Grenadines • Taiwan • Thailand
• Bolivia • Cameroon • Cape Verde • Comoros • Côte d’Ivoire • Ecuador • Egypt • Grenada • Guinea • Haiti • Honduras • Indonesia • Morocco • Papua New Guinea • Philippines • Syria • Turkey • Zimbabwe
• El Salvador • Fiji • Guatemala • Jamaica • Jordan • Madagascar • Namibia • Nicaragua • Paraguay • Peru • Senegal
Note: Countries are drawn from the PWT 6.2 sample of 118 countries.
A Conceptual Political-Economy Framework
The previous section documented the widely divergent trends in the global growth experience. In line with the evolution of growth and development economics, thinking about economic growth processes might be best done via an empirical, a posteriori framework induced from actual growth experiences. Singapore has seen strong economic performance over the past four decades since gaining independence as a sovereign state, and the conceptual framework that follows draws on insights from Senior Minister Goh Chok Tong, who served as Prime Minister of Singapore from 1990–2004. This framework of analysis will identify some “necessary conditions of growth” under a few broad categories, and will be applied in the analysis of the sample of countries in Table 4. This will allow us to identify and highlight commonalities for each category of countries.
The three pillars in this conceptual framework (please refer to Figure 5) are as follows: i. Resources, which take the form of:
a) Natural Endowment, or a country’s geographical positioning, its land
area, its natural resources, and its people. For example, Singapore’s only natural resource was its superior geographical location and a natural deep sea harbor, which made it an ideal trading post for the British en route to China and India. The British experiment in growing agricultural crops floundered as Singapore’s soil proved unsuitable. This contrasts with neighboring Malaysia where rubber was successfully cultivated.
10 Tan Yin Ying, Alvin Eng, and Edward Robinson
Malaysia also had ample tin reserves, and was once the world’s largest producer of tin.
b) Inheritance, or the institutions of bureaucracy and government, and the political and legal systems in a country. These are artifacts of history, handed down from previous generations, whether through monarchic rule, or the outcome of revolutions and colonialism.
c) Accumulation, or the cyclical process that affects an economy’s stock of resources. Economic growth, changes in government, or natural disasters all affect a country’s stock of endowed or inherited resources. Resources accumulated from successful growth will feed into a country’s inheritance in the next cycle, whereas shocks may deplete a country’s endowment or destroy its inherited resources.
Resource availability will condition the growth paradigms that can be
usefully applied to any economy. However, some caveats are necessary. First, the initial resource endowment of a country is not necessarily reflective of its future developmental potential. While natural endowments may be less susceptible to change, inherited resources can change, and sometimes fairly quickly. Countries are thus, at times, able to make up for a shortfall in natural endowments by building on their inherited resources, such as reforming their institutions. When robust institutions are in place, they become valuable inherited resources that reduce the constraints on future growth. Similarly, countries with rich natural endowments could have very poor inherited resources, and losses on the latter may outweigh gains arising from the former. Second, being resource-rich reduces the constraints to economic activity, but does not create growth per se. The pragmatic assessment of growth paradigms, alongside an economy’s resources and constraints, will enable the creation of good, tailored policies to boost growth, with more options available to economies that are richer in resources.
ii. Ideas, or the prevailing growth paradigms/concepts of the day.
Ideas cover a wide spectrum ranging from desired outcomes (such as growth as economic progress or a broader definition to include measures of well-being), desired paths (such as Marxist dialectic or capital accumulation), to requisite preconditions (such as trade liberalization or quality of institutions). Ideas are fluid and varied, and there is thus no single yellow brick road to prosperity. A paradigm that is fashionable in one decade falls out of favor in the next, and may yet be resurrected in a third.
Experience has also demonstrated that a wholesale application of ideas to an economy is no recipe for growth. The idea needs to be applied to its local context. A pragmatic assessment of the resources, constraints, and other structural peculiarities associated with the domestic economy is thus
Perspectives on Growth: A Political-Economy Framework 11
necessary for any growth practitioner seeking to understand how certain growth paradigms may actually work out in an economy.
iii. Implementation, or formulating the right policies and effectively executing
them. The review channel then allows for feedback as to whether policies were correctly crafted and well-implemented. Policy makers must constantly review the policy phase using appropriate performance indicators to determine (a) whether the idea has worked in the local context; (b) whether and how implementation and formulation could be improved; or more fundamentally, (c) whether one should rethink the original growth paradigm in light of possible changes in the operating environment.
Policy review is important, as sustained growth is often the result of persistent fine-tuning of policies. The discipline accorded by financial markets can sometimes be a useful yardstick for policy review, where international market response is positive. For example, this could manifest through foreign investors’ willingness to invest, or the successful export of a country’s output; efforts can then be directed to refining policies along this track.
In a set-up where institutions are meant to enhance, not undermine each other, and where politics is convergent and not divergent, this review process, through honest self-reflection against clearly defined benchmarks, provides necessary checks and balances.
The successful implementation of policies depends, among other things, on the following:
a) Robust institutions. These include an effective administration and
civil service, responsible legislature, independent judiciary, a vibrant private sector, and a responsible press. The underlying value entrenching these institutions is a commitment to good governance, which ensures that a country’s institutions remain effective, impartial, and are devoted to the formulation and implementation of pragmatic and focused growth policies, and are not distracted by motives for self-enrichment or extraction of a country’s resources and assets. These institutions are also responsible and serve to enhance, not undermine, each other’s operations.
b) Good leadership. Such leaders are visionary and diligent, selflessly devoted to national, not party/individual interests. For credibility, leaders must have integrity, be incorruptible (or have the incentives to remain so), and be honest. These leaders contribute to successful policy implementation by their ability to
12 Tan Yin Ying, Alvin Eng, and Edward Robinson
envision the road ahead, to mobilize the people, and to build consensus for their policies through a politics of convergence, not divergence.
c) People consensus. Sustained growth often requires trading short-term pain for long-term gain. The end-point of growth and development—the well-being of a nation’s people—will thus be meaningful only to a people united on the purpose and destiny of their country and who have an entrenched stake in the country. Policies that purport to bring about this end must have the consensus of the population, who can then be supportive of the leadership and government, even when sacrifices are called for. Social cohesion is key: growth policies should not be divisive or benefit one group to the detriment of another, in line with the politics of convergence practiced by the government. In the absence of people consensus, social strife or political instability may render unfruitful even the most determined efforts to implement growth policies.
The three key elements of robust institutions, good leaders, and people consensus—the “horizontals”—interact with each other and have critical roles to play at each stage of the development path, from the inception of ideas, to efficient use of resources, to formulation of growth policies and their implementation and review.
Resources, ideas, and implementation form a self-reinforcing growth cycle.
Policy makers who are able to accurately pin down the interactions between the three could thus generate sustained growth, which in turn boosts a country’s resources, strengthens its institutions, and bolsters popular support for its leaders. Yet, these same dynamics could be reinforced in a negative spiral, where the foundations for growth are repeatedly undermined. This makes poor growth outcomes more likely.
Singapore’s experience may be rather unique, given its circumstances. The country’s small size allows policy to be highly targeted, and makes policy execution, coordination, and implementation somewhat easier. Yet, as the framework above illustrates, its development experience can have wider application for analyzing and promoting the growth of a small region, if not of a bigger country. Singapore has learnt that resources and ideas are only necessary conditions, which are in and of themselves not sufficient to ensure sustained growth. Holistic implementation is key: there is no point in having first-class strategies and policies with third-class execution.
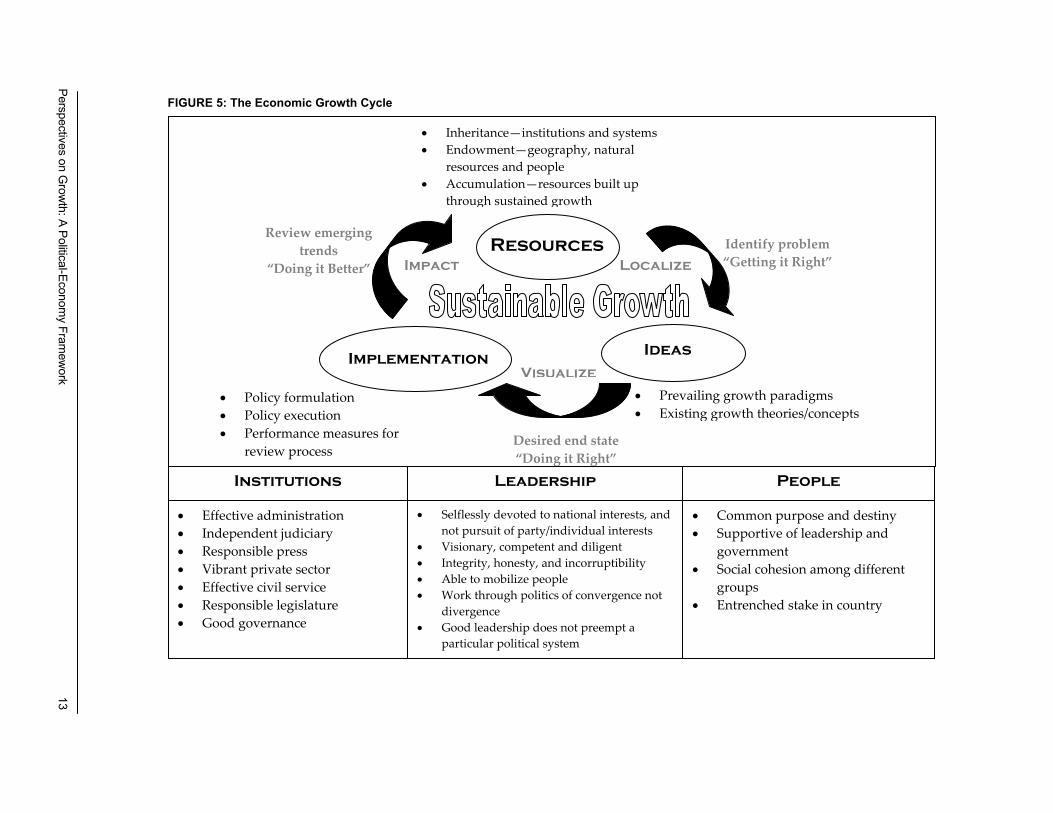
FIGURE 5: The Economic Growth Cycle
Ideas
Resources
Implementation
Impact
Visualize
• Prevailing growth paradigms • Existing growth theories/concepts
• Inheritance—institutions and systems • Endowment—geography, natural
resources and people • Accumulation—resources built up
through sustained growth
• Policy formulation • Policy execution • Performance measures for
review process Desired end state “Doing it Right”
Identify problem“Getting it Right”
Review emerging trends
“Doing it Better”
Institutions Leadership People
• Effective administration • Independent judiciary • Responsible press • Vibrant private sector • Effective civil service • Responsible legislature • Good governance
• Selflessly devoted to national interests, and not pursuit of party/individual interests
• Visionary, competent and diligent • Integrity, honesty, and incorruptibility • Able to mobilize people • Work through politics of convergence not
divergence • Good leadership does not preempt a
particular political system
• Common purpose and destiny • Supportive of leadership and
government • Social cohesion among different
groups • Entrenched stake in country
Localize
Perspectives on Grow
th: A Political-Economy Fram
ework
13
14 Tan Yin Ying, Alvin Eng, and Edward Robinson
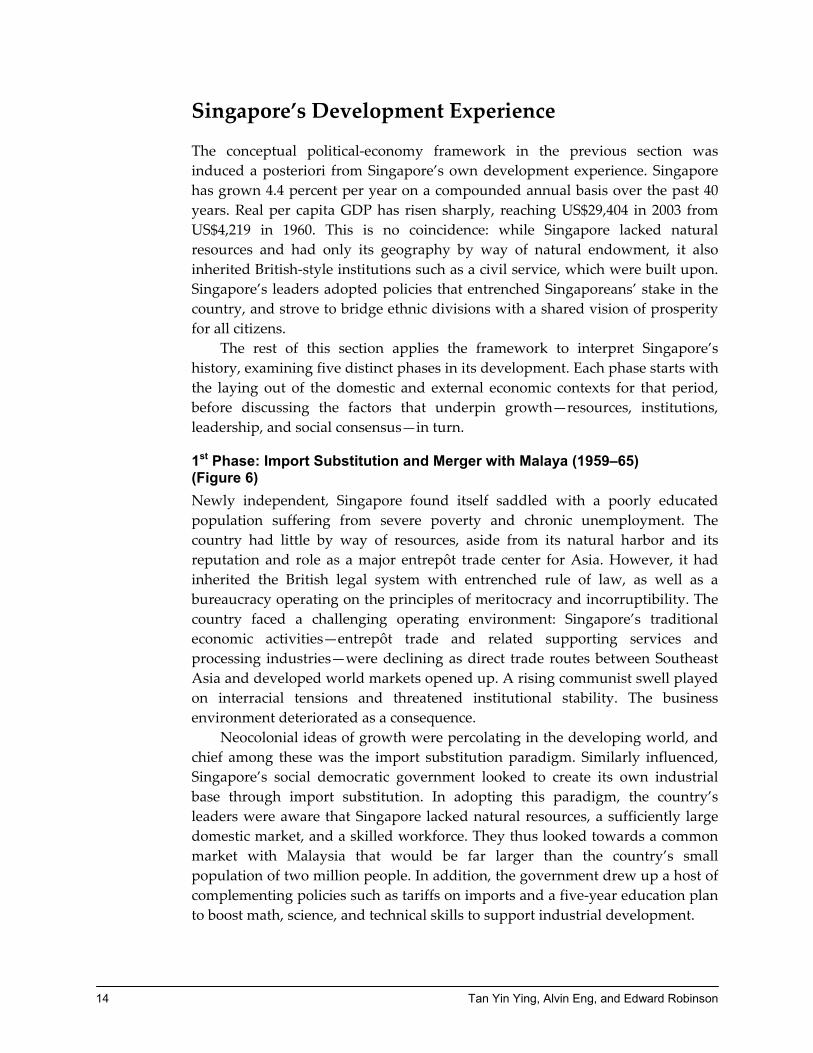
Singapore’s Development Experience
The conceptual political-economy framework in the previous section was induced a posteriori from Singapore’s own development experience. Singapore has grown 4.4 percent per year on a compounded annual basis over the past 40 years. Real per capita GDP has risen sharply, reaching US$29,404 in 2003 from US$4,219 in 1960. This is no coincidence: while Singapore lacked natural resources and had only its geography by way of natural endowment, it also inherited British-style institutions such as a civil service, which were built upon. Singapore’s leaders adopted policies that entrenched Singaporeans’ stake in the country, and strove to bridge ethnic divisions with a shared vision of prosperity for all citizens.
The rest of this section applies the framework to interpret Singapore’s history, examining five distinct phases in its development. Each phase starts with the laying out of the domestic and external economic contexts for that period, before discussing the factors that underpin growth—resources, institutions, leadership, and social consensus—in turn.
1st Phase: Import Substitution and Merger with Malaya (1959–65) (Figure 6) Newly independent, Singapore found itself saddled with a poorly educated population suffering from severe poverty and chronic unemployment. The country had little by way of resources, aside from its natural harbor and its reputation and role as a major entrepôt trade center for Asia. However, it had inherited the British legal system with entrenched rule of law, as well as a bureaucracy operating on the principles of meritocracy and incorruptibility. The country faced a challenging operating environment: Singapore’s traditional economic activities—entrepôt trade and related supporting services and processing industries—were declining as direct trade routes between Southeast Asia and developed world markets opened up. A rising communist swell played on interracial tensions and threatened institutional stability. The business environment deteriorated as a consequence.
Neocolonial ideas of growth were percolating in the developing world, and chief among these was the import substitution paradigm. Similarly influenced, Singapore’s social democratic government looked to create its own industrial base through import substitution. In adopting this paradigm, the country’s leaders were aware that Singapore lacked natural resources, a sufficiently large domestic market, and a skilled workforce. They thus looked towards a common market with Malaysia that would be far larger than the country’s small population of two million people. In addition, the government drew up a host of complementing policies such as tariffs on imports and a five-year education plan to boost math, science, and technical skills to support industrial development.

Perspectives on Growth: A Political-Economy Framework 15
Implementing import substitution required building up existing institutions, as well as vigorous efforts by Singapore’s leaders to drive the merger with Malaysia. The government created a scholarship system, which channeled its best and brightest into the civil service. The country’s leaders led by Prime Minister Lee Kuan Yew were pragmatic, and understood that industrialization would not happen simply because of a single policy decision, but would require a host of supporting measures. Social support for the merger was also strong, heightened by a sense of fear that Singapore could not “go it alone.”
A majority of the people voted for a merger via popular referendum. Nonetheless, the economic opportunities that Singapore had expected from the merger with Malaya failed to materialize, and indeed, the introduction of an additional layer of bureaucracy from Kuala Lumpur did not help the investment climate. Growth was erratic—after a recession in 1959, GDP growth rebounded but was highly volatile, ranging from 4 percent to 14 percent in alternate years.5
2nd Phase: From Import Substitution to Export-Oriented Growth (1966–73) (Figure 7) Singapore’s brief union with Malaya ended in 1965. With separation, the common market could not be realized, rendering import substitution unviable. The urgent need to create jobs in the economy was heightened with the impending closure of the British military base on the island, which would affect up to 70,000 jobs and bring a fifth of economic activity to a halt.
Industrialization could only succeed if Singapore tapped on external markets that it had no privileged access to. Export orientation thus became the logical choice of growth paradigm, as firms could manufacture goods and create jobs for a market far larger than what domestic consumption alone could sustain. To this end, the government abolished tariffs, reduced import quotas, and passed a host of supporting policies such as the 1967 Economic Expansion Incentives Act, which sharply reduced corporate tax rates on exporting manufacturers. Singapore’s efforts to bring in foreign investments were holistic in that they recognized the importance of ensuring harmonious industrial relations. The tripartite wage negotiation system was established to provide stability in the wage bargaining process and to deter labor militancy.
The institutional base for a fully sovereign state had already been laid, and the government continued to build up the capabilities of its bureaucracy. To implement its external-oriented growth policies, new statutory boards, such as the Economic Development Board (EDB), were created. Singapore’s founding leaders eschewed potentially divergent politics that threatened to divide people along racial and ideological lines, and dealt fairly with rising communal tensions. They also built up the country’s defense capabilities to boost security, and in turn, Singaporeans’ confidence in the country’s future. Under the leadership’s guidance, the population was galvanized into a resilient and hardworking 5 Based on GDP levels in pound sterling. Source: Lee (1974).
16 Tan Yin Ying, Alvin Eng, and Edward Robinson
people, determined to fight for their survival. They rallied to the leadership’s reminder that “The world does not owe us a living. We cannot live by the begging bowl.” 6 Over time, the people thus developed a commitment to Singapore as an independent country in which they had a stake.7 Policies such as the government housing schemes8 helped to further entrench this commitment.
Export orientation took off in this phase, and the economy was able to generate sustained growth. The EDB successfully attracted several multinational corporations (MNCs) to invest in the country, including National Semiconductor, Fairchild, Texas Instruments, and Hewlett-Packard. These firms helped lay the foundations for the development of Singapore’s electronics cluster. Policies were recalibrated and fine-tuned along the way.
3rd Phase: Industrial Restructuring (1973–84) (Figure 8) By the 1970s and early 80s, Singapore had established a substantial manufacturing base and capacity, in terms of both infrastructure and skilled labor. It had a solid reputation as a stable environment where MNC operations could thrive. However, the economy also faced the impact from the oil shocks of 1973 and 1979, which drove up business costs and dampened economic activity. Excess demand in the domestic labor market began to put upward pressure on real wages, resulting in a loss of competitiveness in relation to other exporters. Incipient wage-price pressures had begun to emerge that if not dealt with, would severely threaten Singapore’s competitiveness.
Dealing with the issue of cost competitiveness required a two-pronged approach. First, it was necessary to stem the domestic cost and price pressures. The tripartite wage negotiation arrangements, which brought employers, employees and the government to the bargaining table, were formalized in 1972 with the setting up of the National Wages Council (NWC). The NWC was also supported by a robust legal and legislative framework. This helped ensure wage stability at a time when pressures to increase wages were substantial.
Second, Singapore’s industrial sector had to shift to the manufacture of higher value-added products. As early as 1971, the government reviewed its industrialization program. Restructuring the industrial base towards more capital- and skill-intensive industries meant that the EDB became more selective in who it wooed to Singapore. Firms requiring extensive protection (and which were likely to be low-skilled or uncompetitive in the global market) were passed over or allowed to leave the country. The EDB also partnered with top European
6 Lee (2000). 7 Chua (2006) details the process of nation-building and the government policies that helped entrench Singaporeans’ sense of belonging. 8 Home ownership became a major tenet in Singapore’s nation-building program. In 1968, Singaporeans were allowed to use their savings with the Central Provident Fund (CPF) to purchase public housing. The CPF was a compulsory savings scheme first established in 1955.
Perspectives on Growth: A Political-Economy Framework 17
and Japanese MNCs to create training centers in Singapore, which helped enhance the skills of their local workers, and later, to train a broader swathe of Singaporeans. The government also introduced a levy on foreign workers to deter the hiring of low-skilled labor from abroad.
In this phase, the institutional capabilities and leadership of the EDB proved critical in the challenging task of fine-tuning Singapore’s investment promotion strategies. For example, the Board decided to seek investments from U.S. MNCs over Taiwanese and Hong Kong ones, as the latter group at that time tended to produce lower value-added, labor-intensive products such as textiles. Singapore’s leaders also appreciated the importance of maintaining investor confidence in the volatile environment. They were ready to uphold the country’s business-friendly reputation, which was becoming a very important intangible asset.
The country’s workers were supportive of the tripartite wage negotiation system. The implicit social compact between the government and the people—the promise that by exercising wage restraint to generate growth, the people would share in the benefits of growth—was upheld. The benefits of Singapore’s sustained economic progress were shared with the people, in the form of government housing upgrades and a public medical savings/insurance scheme known as Medisave. Tripartism was successful, with no serious labor unrest over this period.
Consequently, Singapore enjoyed strong productivity growth and maintained its competitive edge. Unemployment remained steady at 4.5 percent even as economic growth slowed temporarily to 4 percent in 1975 from 13 percent in 1972, and inflation spiraled to 22 percent in 1974. Growth rebounded soon after, and remained robust from 1976–83, averaging 8.5 percent each year. Inflation was brought down to 3.9 percent over the same period. Singapore’s industrial sector successfully moved up the value chain. For example, high-technology, investment in capital-intensive industries such as component and precision engineering soon displaced investment in labor-intensive industries such as textiles and semiconductor assembly.
4th Phase: Industrial Diversification & Consolidation (1985–97) (Figure 9) Having staved off the challenges of the 1970s, Singapore faced rising unit labor costs in the latter half of the 1980s, straining competitiveness and dampening demand for its traditional exports. New engines of growth were needed. The year 1985 marked the beginning of a new growth opportunity: post-Plaza Accord, a flood of investments rushed to Southeast Asia, as low- and mid-skilled manufacturing was outsourced from Japan.
Singapore, however, could not compete with its immediate neighbors for low-end manufacturing outsourced from Japan. Industrial restructuring, in this context, involved:
18 Tan Yin Ying, Alvin Eng, and Edward Robinson
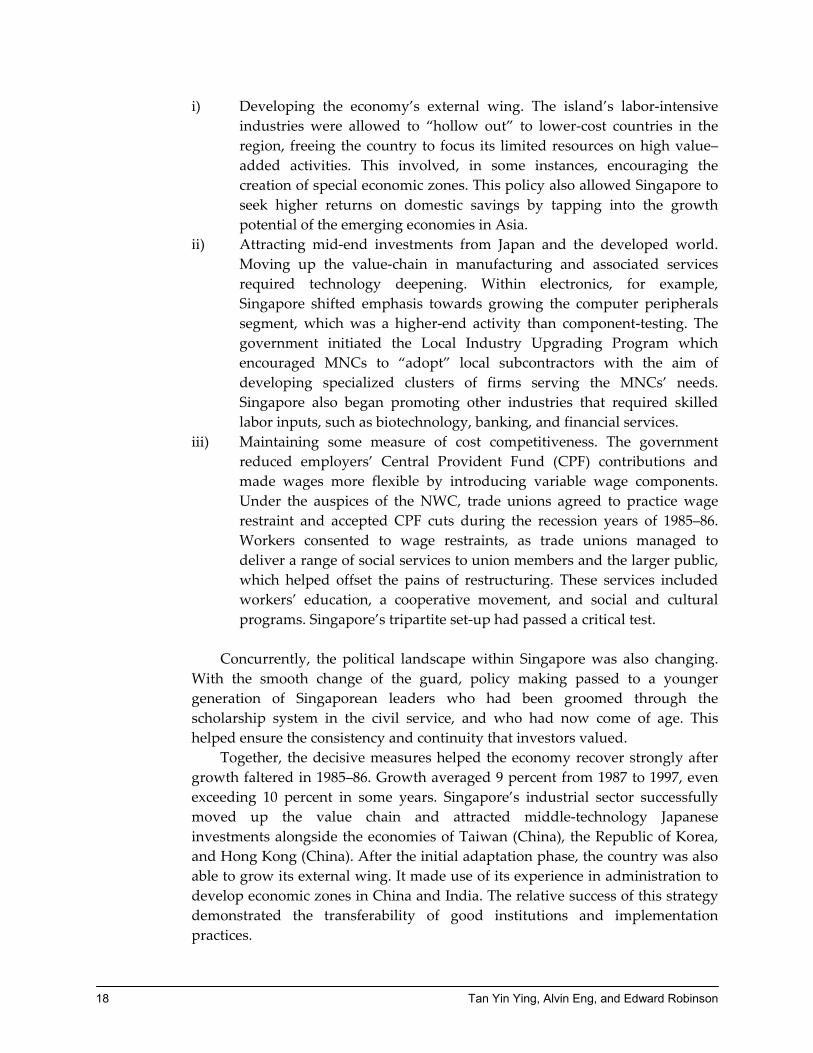
i) Developing the economy’s external wing. The island’s labor-intensive industries were allowed to “hollow out” to lower-cost countries in the region, freeing the country to focus its limited resources on high value–added activities. This involved, in some instances, encouraging the creation of special economic zones. This policy also allowed Singapore to seek higher returns on domestic savings by tapping into the growth potential of the emerging economies in Asia.
ii) Attracting mid-end investments from Japan and the developed world. Moving up the value-chain in manufacturing and associated services required technology deepening. Within electronics, for example, Singapore shifted emphasis towards growing the computer peripherals segment, which was a higher-end activity than component-testing. The government initiated the Local Industry Upgrading Program which encouraged MNCs to “adopt” local subcontractors with the aim of developing specialized clusters of firms serving the MNCs’ needs. Singapore also began promoting other industries that required skilled labor inputs, such as biotechnology, banking, and financial services.
iii) Maintaining some measure of cost competitiveness. The government reduced employers’ Central Provident Fund (CPF) contributions and made wages more flexible by introducing variable wage components. Under the auspices of the NWC, trade unions agreed to practice wage restraint and accepted CPF cuts during the recession years of 1985–86. Workers consented to wage restraints, as trade unions managed to deliver a range of social services to union members and the larger public, which helped offset the pains of restructuring. These services included workers’ education, a cooperative movement, and social and cultural programs. Singapore’s tripartite set-up had passed a critical test.
Concurrently, the political landscape within Singapore was also changing.
With the smooth change of the guard, policy making passed to a younger generation of Singaporean leaders who had been groomed through the scholarship system in the civil service, and who had now come of age. This helped ensure the consistency and continuity that investors valued.
Together, the decisive measures helped the economy recover strongly after growth faltered in 1985–86. Growth averaged 9 percent from 1987 to 1997, even exceeding 10 percent in some years. Singapore’s industrial sector successfully moved up the value chain and attracted middle-technology Japanese investments alongside the economies of Taiwan (China), the Republic of Korea, and Hong Kong (China). After the initial adaptation phase, the country was also able to grow its external wing. It made use of its experience in administration to develop economic zones in China and India. The relative success of this strategy demonstrated the transferability of good institutions and implementation practices.
Perspectives on Growth: A Political-Economy Framework 19
5th Phase: Toward a Knowledge-Based Economy (1998 to present) (Figure 10) Developing Asia’s golden years came to an abrupt end with the Asian financial crisis in 1997. Singapore found itself in a far more challenging external environment in this phase. The region was struggling to recover from the debilitating effects of the crisis, while the rise of China posed a huge competitive challenge. The sense of external uncertainty was compounded by the attack on New York City’s World Trade Center on September 11, 2001, and the discovery of terrorist groups in Asia linked to Al-Qaeda.
However, Singapore had a firm foundation on which it could build the capacity to face these challenges. The country had developed higher value–added activities across a broad range of industries. The relatively successful economic zones afforded the country the strategic opportunity to position itself as a gateway to Asia, and to market itself as a hub for other regions in the world to establish inroads into the fast-growing economies of China and India.
Restructuring the economy to face the challenges in this phase meant equipping people and firms to operate in a globalized world, where production was more readily diffusible and where knowledge was a premium. Singaporeans and the country’s firms had to be innovative, creative, and entrepreneurial, in order to generate the technologies and efficiencies on which future productivity gains would come.
The government’s role was thus to deregulate and liberalize economic activities, in order to reduce business costs and preserve jobs during the crisis and its aftermath. Two packages, amounting to US$12.5 billion, were introduced in 1998. These included policies to lower total wage bills by 15 percent; to reduce costs arising from industrial and commercial land rental, foreign worker levies, and other government charges for electricity, telecommunications, port, and airport services; as well as to provide rebates on property, income, and corporate tax. Yet another substantial package was introduced in 2001 amidst a global recession. The government also liberalized Singapore’s “software”—that is, policies relating to social, cultural, and human capital—to help make the city an attractive and vibrant place for globally footloose talents.
Economic restructuring was a bitter but necessary medicine, as Singapore’s economic planners were realistic and cognizant of the need to respond quickly to a changing environment. A key aspect was renewal in the political leadership and the civil service. There was a need for new ideas and fresh perspectives, and to engage the younger generation of Singaporeans. As the burden of economic restructuring would be borne by those suffering from structural unemployment, the government had to provide “social support to those adversely affected by the changes, to ensure that no one [was] left behind.” The social consensus for remaking Singapore was maintained through the visible, prudent, and targeted use of fiscal surpluses, to ease adjustment pains in the short term. Yet, it was critical that this support was implemented “without undermining the incentive
20 Tan Yin Ying, Alvin Eng, and Edward Robinson
to work.” 9 The people were thus incentivized to undertake retraining and schemes were carefully designed to avoid a “welfare culture.”
Sum-up Singapore’s economic development story is not necessarily about its successful adoption of unique policies. Instead, it is about how the country managed to implement appropriate policies successfully. This has come about through robust institutions guided by visionary leaders, who have won the support of the general populace. The people have experienced the tangible benefits of growth and have thus backed the government’s institutions and leaders. The successful implementation of growth policies has helped the country to earn credibility and develop a solid reputation, which has proven invaluable in Singapore’s bid to attract foreign investment. The conceptual political-economy framework developed in the previous section has shown its usefulness in providing a broad interpretive filter through which we can better understand the economic developmental experience.
9 Both quotes from Lee (2003).
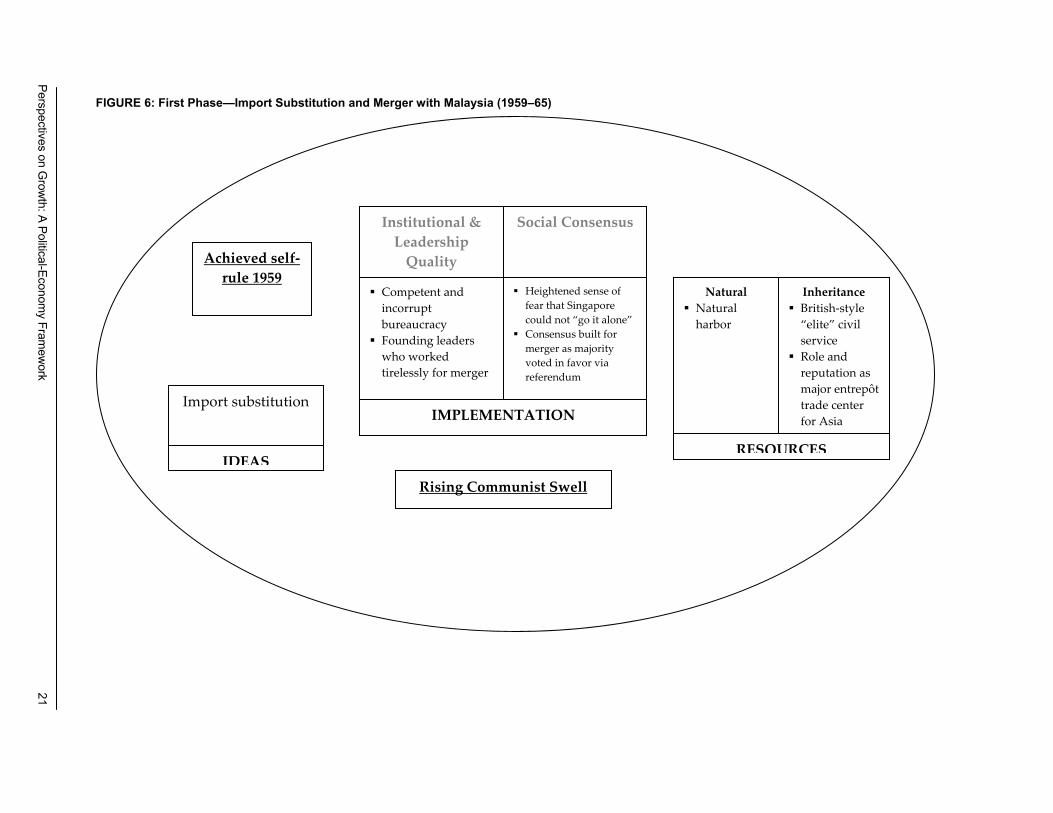
FIGURE 6: First Phase—Import Substitution and Merger with Malaysia (1959–65)
Import substitution
IDEAS
Natural Natural
harbor
RESOURCES
Institutional & Leadership
Quality
Competent and incorrupt bureaucracy
Founding leaders who worked tirelessly for merger
Social Consensus
Heightened sense of fear that Singapore could not “go it alone”
Consensus built for merger as majority voted in favor via referendum
IMPLEMENTATION
Achieved self-rule 1959
Rising Communist Swell
Inheritance British-style
“elite” civil service
Role and reputation as major entrepôt trade center for Asia
Perspectives on Grow
th: A Political-Economy Fram
ework
21
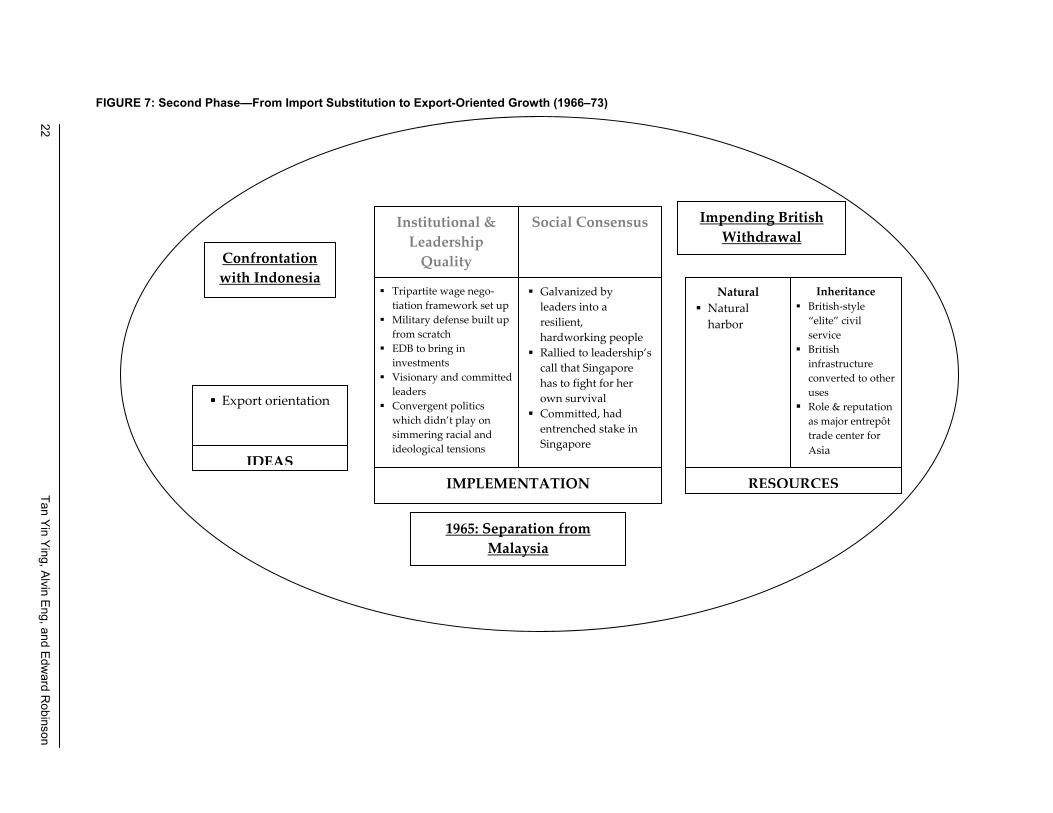
FIGURE 7: Second Phase—From Import Substitution to Export-Oriented Growth (1966–73)
Export orientation
IDEAS
Natural Natural
harbor
RESOURCES
Institutional & Leadership
Quality
Tripartite wage nego-tiation framework set up
Military defense built up from scratch
EDB to bring in investments
Visionary and committed leaders
Convergent politics which didn’t play on simmering racial and ideological tensions
Social Consensus
Galvanized by leaders into a resilient, hardworking people
Rallied to leadership’s call that Singapore has to fight for her own survival
Committed, had entrenched stake in Singapore
IMPLEMENTATION
Confrontation with Indonesia
1965: Separation from Malaysia
Inheritance British-style
“elite” civil service
British infrastructure converted to other uses
Role & reputation as major entrepôt trade center for Asia
Impending British Withdrawal
22 Tan Yin Ying, Alvin Eng, and Edw
ard Robinson
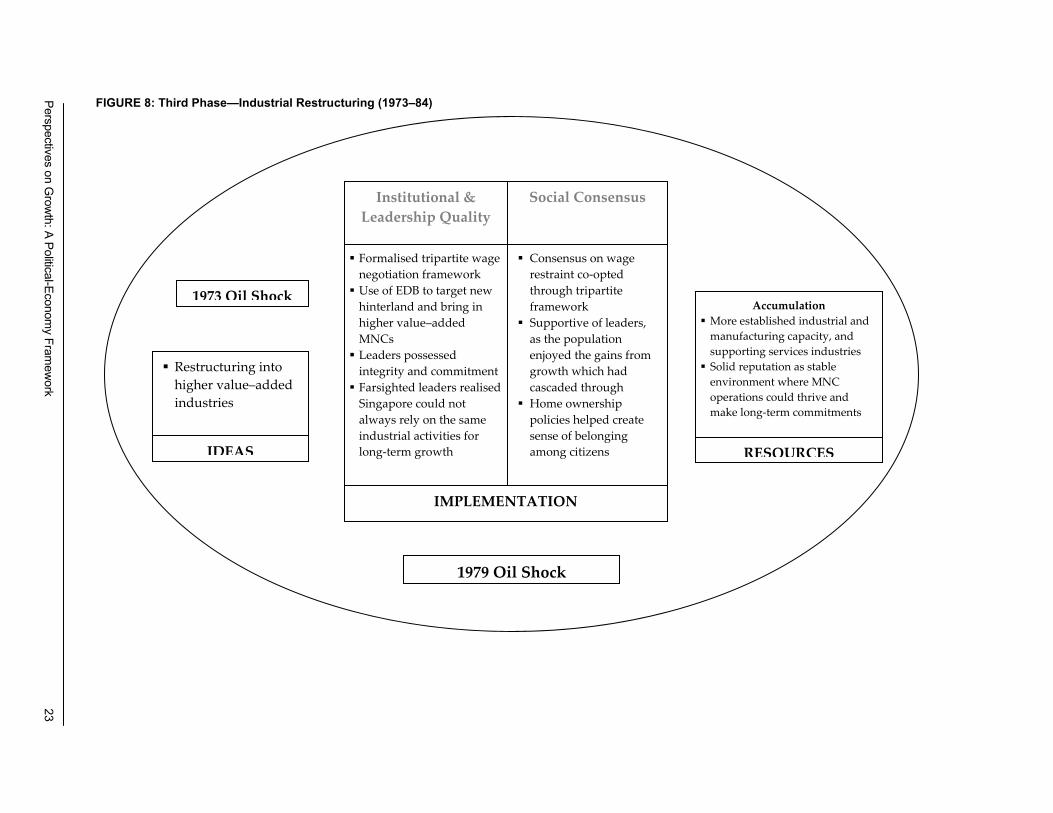
FIGURE 8: Third Phase—Industrial Restructuring (1973–84)
Restructuring into higher value–added industries
IDEAS
Accumulation More established industrial and manufacturing capacity, and supporting services industries
Solid reputation as stable environment where MNC operations could thrive and make long-term commitments
RESOURCES
Institutional & Leadership Quality
Formalised tripartite wage negotiation framework
Use of EDB to target new hinterland and bring in higher value–added MNCs
Leaders possessed integrity and commitment
Farsighted leaders realised Singapore could not always rely on the same industrial activities for long-term growth
Social Consensus
Consensus on wage restraint co-opted through tripartite framework
Supportive of leaders, as the population enjoyed the gains from growth which had cascaded through
Home ownership policies helped create sense of belonging among citizens
IMPLEMENTATION
1973 Oil Shock
1979 Oil Shock
Perspectives on Grow
th: A Political-Economy Fram
ework
23
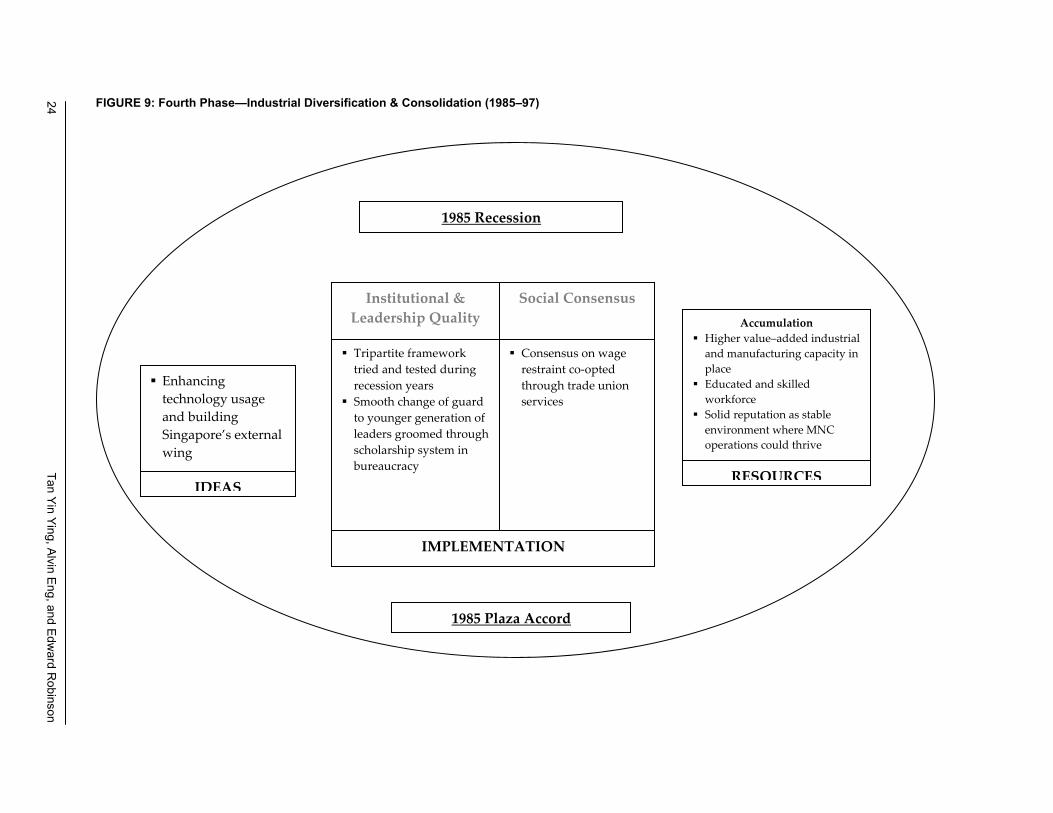
FIGURE 9: Fourth Phase—Industrial Diversification & Consolidation (1985–97)
Enhancing technology usage and building Singapore’s external wing
IDEAS
Accumulation Higher value–added industrial
and manufacturing capacity in place
Educated and skilled workforce
Solid reputation as stable environment where MNC operations could thrive
RESOURCES
Tripartite framework tried and tested during recession years
Smooth change of guard to younger generation of leaders groomed through scholarship system in bureaucracy
Consensus on wage restraint co-opted through trade union services
IMPLEMENTATION
Institutional & Leadership Quality
Social Consensus
1985 Recession
1985 Plaza Accord
24 Tan Yin Ying, Alvin Eng, and Edw
ard Robinson
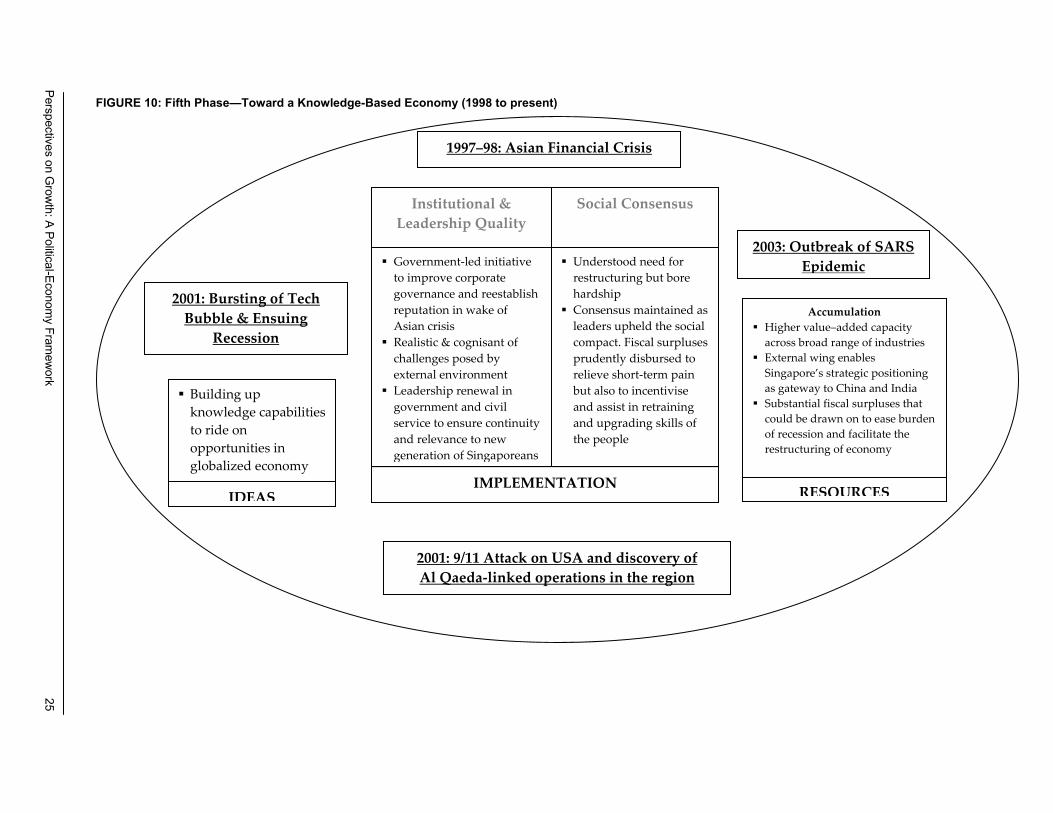
FIGURE 10: Fifth Phase—Toward a Knowledge-Based Economy (1998 to present)
1997–98: Asian Financial Crisis
Building up knowledge capabilities to ride on opportunities in globalized economy
IDEAS RESOURCES
Government-led initiative to improve corporate governance and reestablish reputation in wake of Asian crisis
Realistic & cognisant of challenges posed by external environment
Leadership renewal in government and civil service to ensure continuity and relevance to new generation of Singaporeans
Understood need for restructuring but bore hardship
Consensus maintained as leaders upheld the social compact. Fiscal surpluses prudently disbursed to relieve short-term pain but also to incentivise and assist in retraining and upgrading skills of the people
IMPLEMENTATION
2003: Outbreak of SARS Epidemic
Institutional & Leadership Quality
Social Consensus
2001: 9/11 Attack on USA and discovery of Al Qaeda-linked operations in the region
2001: Bursting of Tech Bubble & Ensuing
Recession
Accumulation Higher value–added capacity
across broad range of industries External wing enables
Singapore’s strategic positioning as gateway to China and India
Substantial fiscal surpluses that could be drawn on to ease burden of recession and facilitate the restructuring of economy
Perspectives on Grow
th: A Political-Economy Fram
ework
25
26 Tan Yin Ying, Alvin Eng, and Edward Robinson
Natural Endowments, Institutions, Leadership, and People
We now apply the conceptual political-economy framework to the growth performances of countries in Table 4, in order to establish its broader applicability. In particular, we attempt to assess divergences in countries’ growth by analyzing empirical measures identified as possible explanatory factors. As many of the underpinnings of growth are not readily quantifiable, we have made use of existing surveys and research, and, in certain instances, created appropriate proxies to indicators relevant to the conceptual framework on growth. The framework covers four broad categories of indicators: resources, institutions, leadership, and people or social consensus (see Appendix 2 for data sources and interpretations).10 Together, these four criteria cover the pillars of growth as summarized in Figure 5.
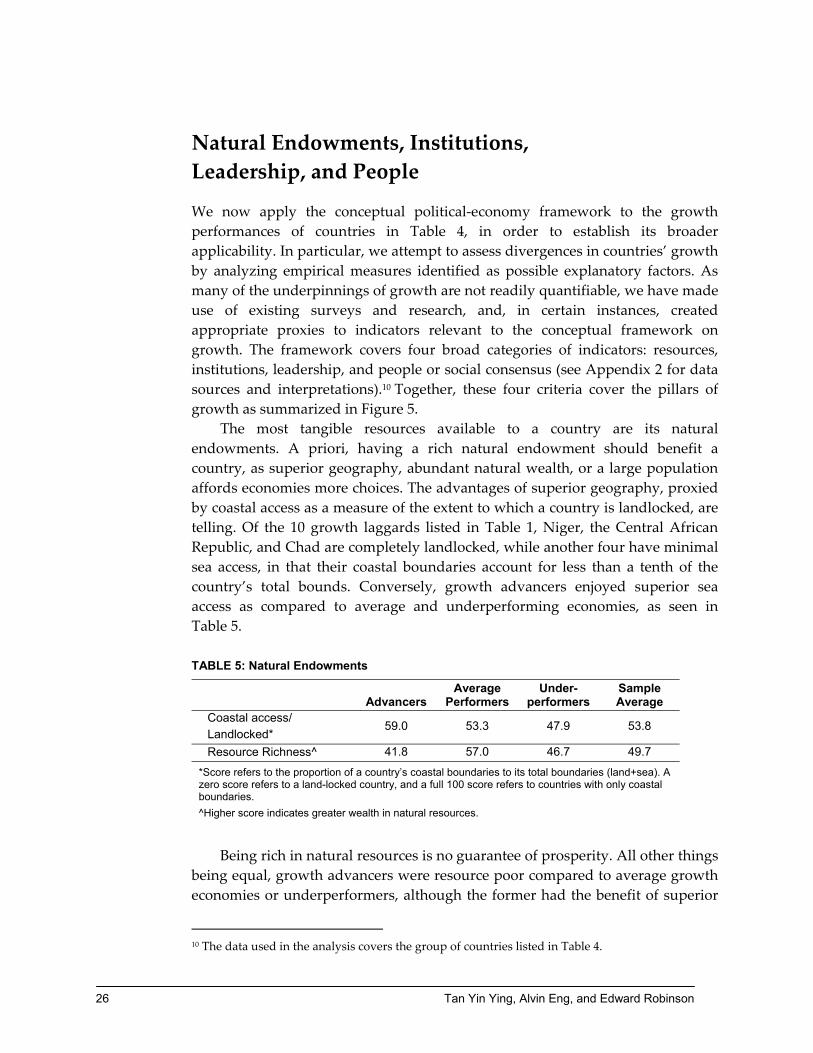
The most tangible resources available to a country are its natural endowments. A priori, having a rich natural endowment should benefit a country, as superior geography, abundant natural wealth, or a large population affords economies more choices. The advantages of superior geography, proxied by coastal access as a measure of the extent to which a country is landlocked, are telling. Of the 10 growth laggards listed in Table 1, Niger, the Central African Republic, and Chad are completely landlocked, while another four have minimal sea access, in that their coastal boundaries account for less than a tenth of the country’s total bounds. Conversely, growth advancers enjoyed superior sea access as compared to average and underperforming economies, as seen in Table 5. TABLE 5: Natural Endowments
Advancers Average
Performers Under-
performers Sample Average
Coastal access/ Landlocked*
59.0 53.3 47.9 53.8
Resource Richness^ 41.8 57.0 46.7 49.7
*Score refers to the proportion of a country’s coastal boundaries to its total boundaries (land+sea). A zero score refers to a land-locked country, and a full 100 score refers to countries with only coastal boundaries. ^Higher score indicates greater wealth in natural resources.
Being rich in natural resources is no guarantee of prosperity. All other things
being equal, growth advancers were resource poor compared to average growth economies or underperformers, although the former had the benefit of superior
10 The data used in the analysis covers the group of countries listed in Table 4.
Perspectives on Growth: A Political-Economy Framework 27
geographic location and sea access. By most counts, Africa and Central and South America are resource-rich continents; yet, the natural wealth of ancient nations located in these continents, such as the Ashanti, Aztec, and Incan Empires, did not guarantee their peoples’ prosperity in the subsequent centuries. Such reversals of fortune do occur, as Acemoglu, Johnson, and Robinson (2002) show.
Whether natural wealth enriches or impoverishes a country is heavily influenced by its institutional base. Strong institutions tend to implement policies that channel natural resources to the generation sustained growth and the accumulation of national wealth; weaker ones could conversely lead to the implementation of exploitative policies that benefit select groups in the short term but which are detrimental to the economy and the broader populace over the longer term. Institutional structures and operations are path-dependent “carriers of history.” Once created, they may persist for some time, unless impacted through the accumulation process or via shocks. The quality of institutions is also determined by the people staffing them.
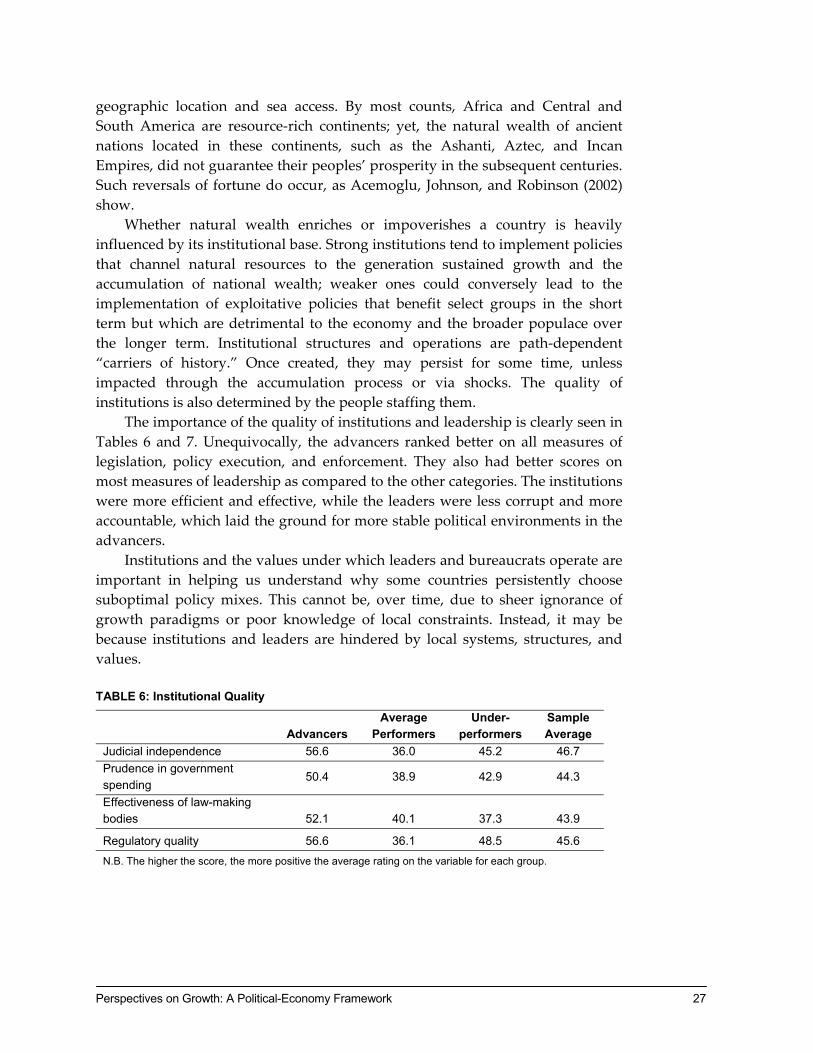
The importance of the quality of institutions and leadership is clearly seen in Tables 6 and 7. Unequivocally, the advancers ranked better on all measures of legislation, policy execution, and enforcement. They also had better scores on most measures of leadership as compared to the other categories. The institutions were more efficient and effective, while the leaders were less corrupt and more accountable, which laid the ground for more stable political environments in the advancers.
Institutions and the values under which leaders and bureaucrats operate are important in helping us understand why some countries persistently choose suboptimal policy mixes. This cannot be, over time, due to sheer ignorance of growth paradigms or poor knowledge of local constraints. Instead, it may be because institutions and leaders are hindered by local systems, structures, and values. TABLE 6: Institutional Quality
Advancers Average
Performers Under-
performers Sample Average
Judicial independence 56.6 36.0 45.2 46.7 Prudence in government spending
50.4 38.9 42.9 44.3
Effectiveness of law-making bodies 52.1 40.1 37.3 43.9
Regulatory quality 56.6 36.1 48.5 45.6 N.B. The higher the score, the more positive the average rating on the variable for each group.
28 Tan Yin Ying, Alvin Eng, and Edward Robinson
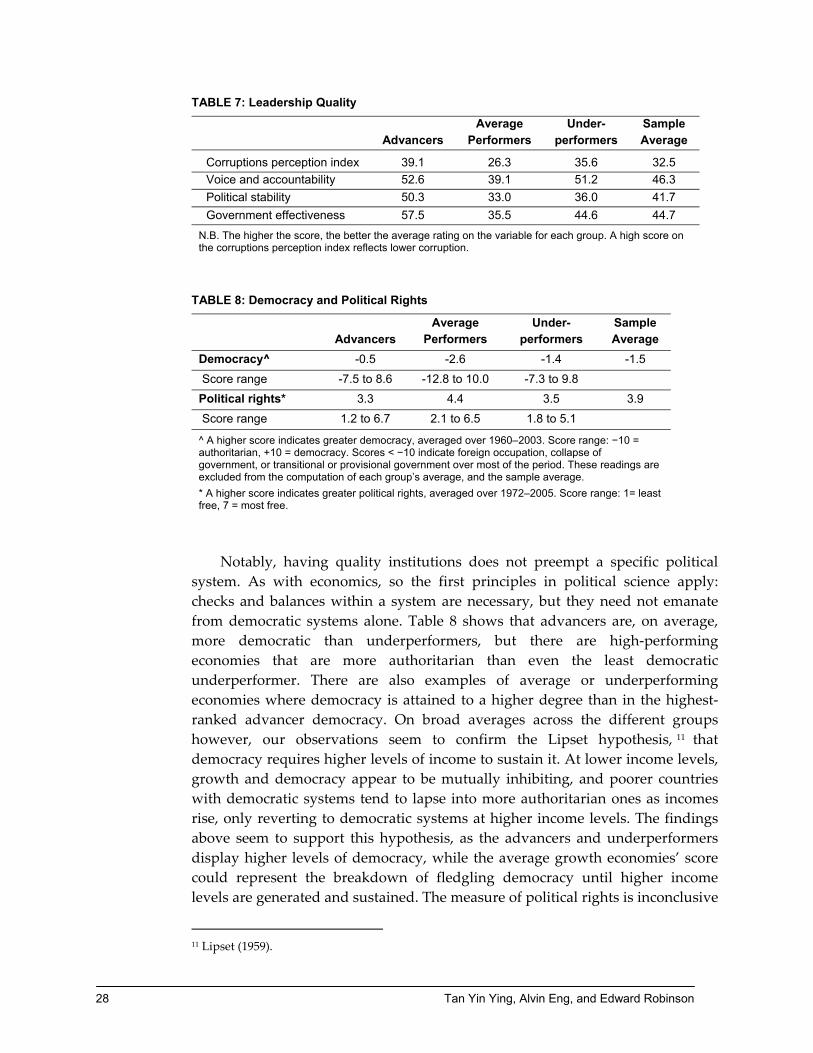
TABLE 7: Leadership Quality
Advancers Average
Performers Under-
performers Sample Average
Corruptions perception index 39.1 26.3 35.6 32.5 Voice and accountability 52.6 39.1 51.2 46.3 Political stability 50.3 33.0 36.0 41.7 Government effectiveness 57.5 35.5 44.6 44.7
N.B. The higher the score, the better the average rating on the variable for each group. A high score on the corruptions perception index reflects lower corruption.
TABLE 8: Democracy and Political Rights
Advancers Average
Performers Under-
performers Sample Average
Democracy^ -0.5 -2.6 -1.4 -1.5 Score range -7.5 to 8.6 -12.8 to 10.0 -7.3 to 9.8 Political rights* 3.3 4.4 3.5 3.9 Score range 1.2 to 6.7 2.1 to 6.5 1.8 to 5.1
^ A higher score indicates greater democracy, averaged over 1960–2003. Score range: −10 = authoritarian, +10 = democracy. Scores < −10 indicate foreign occupation, collapse of government, or transitional or provisional government over most of the period. These readings are excluded from the computation of each group’s average, and the sample average. * A higher score indicates greater political rights, averaged over 1972–2005. Score range: 1= least free, 7 = most free.
Notably, having quality institutions does not preempt a specific political
system. As with economics, so the first principles in political science apply: checks and balances within a system are necessary, but they need not emanate from democratic systems alone. Table 8 shows that advancers are, on average, more democratic than underperformers, but there are high-performing economies that are more authoritarian than even the least democratic underperformer. There are also examples of average or underperforming economies where democracy is attained to a higher degree than in the highest-ranked advancer democracy. On broad averages across the different groups however, our observations seem to confirm the Lipset hypothesis, 11 that democracy requires higher levels of income to sustain it. At lower income levels, growth and democracy appear to be mutually inhibiting, and poorer countries with democratic systems tend to lapse into more authoritarian ones as incomes rise, only reverting to democratic systems at higher income levels. The findings above seem to support this hypothesis, as the advancers and underperformers display higher levels of democracy, while the average growth economies’ score could represent the breakdown of fledgling democracy until higher income levels are generated and sustained. The measure of political rights is inconclusive
11 Lipset (1959).
Perspectives on Growth: A Political-Economy Framework 29
as well. Indeed, countries classified as growth advancers afford both the highest and lowest levels of political rights across the sample, and on average, score more poorly in this measure relative to the other groups.
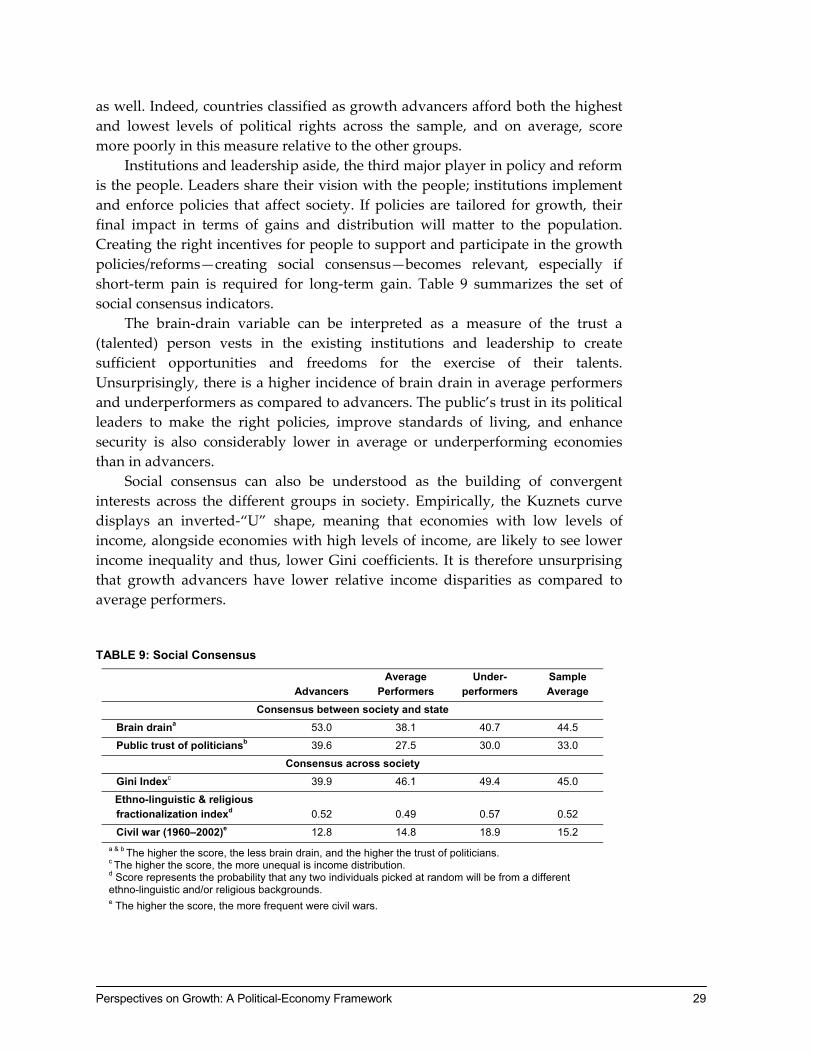
Institutions and leadership aside, the third major player in policy and reform is the people. Leaders share their vision with the people; institutions implement and enforce policies that affect society. If policies are tailored for growth, their final impact in terms of gains and distribution will matter to the population. Creating the right incentives for people to support and participate in the growth policies/reforms—creating social consensus—becomes relevant, especially if short-term pain is required for long-term gain. Table 9 summarizes the set of social consensus indicators.
The brain-drain variable can be interpreted as a measure of the trust a (talented) person vests in the existing institutions and leadership to create sufficient opportunities and freedoms for the exercise of their talents. Unsurprisingly, there is a higher incidence of brain drain in average performers and underperformers as compared to advancers. The public’s trust in its political leaders to make the right policies, improve standards of living, and enhance security is also considerably lower in average or underperforming economies than in advancers.
Social consensus can also be understood as the building of convergent interests across the different groups in society. Empirically, the Kuznets curve displays an inverted-“U” shape, meaning that economies with low levels of income, alongside economies with high levels of income, are likely to see lower income inequality and thus, lower Gini coefficients. It is therefore unsurprising that growth advancers have lower relative income disparities as compared to average performers.
TABLE 9: Social Consensus
Advancers Average
Performers Under-
performers Sample Average
Consensus between society and state Brain draina 53.0 38.1 40.7 44.5
Public trust of politiciansb 39.6 27.5 30.0 33.0
Consensus across society
Gini Indexc 39.9 46.1 49.4 45.0
Ethno-linguistic & religious fractionalization indexd 0.52 0.49 0.57 0.52
Civil war (1960–2002)e 12.8 14.8 18.9 15.2 a & b The higher the score, the less brain drain, and the higher the trust of politicians. c The higher the score, the more unequal is income distribution. d Score represents the probability that any two individuals picked at random will be from a different ethno-linguistic and/or religious backgrounds. e The higher the score, the more frequent were civil wars.
30 Tan Yin Ying, Alvin Eng, and Edward Robinson
Ethnic fractionalization is a direct measure of intrasocietal divisions. Empirical studies on sub-Saharan Africa show that underperforming African economies that are more fractionalized along ethno-linguistic and/or religious lines are also more prone to conflict, institutional capture, partial policy making, and divergent politics.
In 1960, 14 of the 15 most ethnically heterogeneous societies in the world were in Africa, and nearly all of these economies have remained in the bottom third of the global income spectrum since then. This is “Africa’s growth tragedy.” 12 More reasonably, the confluence of ethnic fractionalization with higher income inequality magnifies fault lines and weakens intrasocietal consensus. Biased policy making, obstructionist attitudes of the general public against pro-growth reforms, or even physical conflict between the different groups (civil war) could thus impede growth.
Fractionalization however, thus tells only part of the growth story. After all, 11 of the 14 growth advancers also had above-average levels of fractionalization, and yet their success contrasts starkly with that of Africa, or even with that of average and underperforming economies. Growth advancers seem to have engaged in convergent politics and policy making, and were able to create institutions to manage societal faultlines instead of diverging benefits to one group to the exclusion and/or at the expense of another. In average or underperforming economies, leaders and institutions were unable to build consensus across different factions. Notably, civil war occurred more frequently in growth underperformers, as institutions and leaders failed to forge unity and instead exploited differences for their own gain, possibly fighting for resource wealth.
Resources, institutions, leaders, and people all interact with each other, with institutional setups often the nexus of policy-making activity and consensus building between leaders and people. Countries may start with different natural endowments, but institution and leadership quality will determine their growth trajectory over the longer term. The people may be divided along several lines, but consensus can be built through robust institutions and competent, incorrupt, and trustworthy leaders. Advancers, by and large, are those that may not have had the fortune of geography but have enjoyed the fortunes of history. They have continued to build up institutions to meld existing fault lines in society, instead of allowing these divisions to wreck institutional and government operations.
Country data on each indicator is detailed in Appendix 3. Country scores have been rescaled from 0 to 100, with a higher number indicating a more favorable score. This allows us to derive a composite score for natural
12 Easterly and Levine (1997).
Perspectives on Growth: A Political-Economy Framework 31
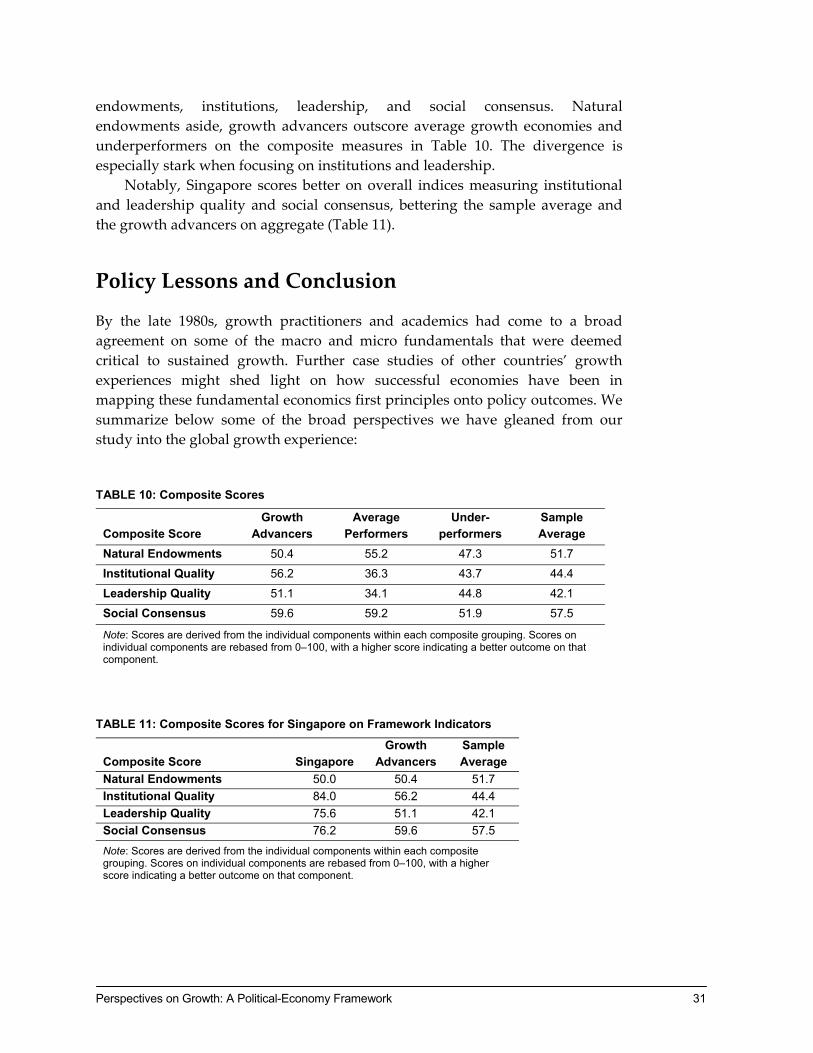
endowments, institutions, leadership, and social consensus. Natural endowments aside, growth advancers outscore average growth economies and underperformers on the composite measures in Table 10. The divergence is especially stark when focusing on institutions and leadership.
Notably, Singapore scores better on overall indices measuring institutional and leadership quality and social consensus, bettering the sample average and the growth advancers on aggregate (Table 11).
Policy Lessons and Conclusion
By the late 1980s, growth practitioners and academics had come to a broad agreement on some of the macro and micro fundamentals that were deemed critical to sustained growth. Further case studies of other countries’ growth experiences might shed light on how successful economies have been in mapping these fundamental economics first principles onto policy outcomes. We summarize below some of the broad perspectives we have gleaned from our study into the global growth experience: TABLE 10: Composite Scores
Composite Score Growth
Advancers Average
Performers Under-
performers Sample Average
Natural Endowments 50.4 55.2 47.3 51.7 Institutional Quality 56.2 36.3 43.7 44.4 Leadership Quality 51.1 34.1 44.8 42.1 Social Consensus 59.6 59.2 51.9 57.5
Note: Scores are derived from the individual components within each composite grouping. Scores on individual components are rebased from 0–100, with a higher score indicating a better outcome on that component.
TABLE 11: Composite Scores for Singapore on Framework Indicators
Composite Score Singapore Growth
Advancers Sample Average
Natural Endowments 50.0 50.4 51.7 Institutional Quality 84.0 56.2 44.4 Leadership Quality 75.6 51.1 42.1 Social Consensus 76.2 59.6 57.5
Note: Scores are derived from the individual components within each composite grouping. Scores on individual components are rebased from 0–100, with a higher score indicating a better outcome on that component.
32 Tan Yin Ying, Alvin Eng, and Edward Robinson
Policy Formulation i. Count the costs—know that sustained growth requires reforms that take
place over a continuum of cost-benefit tradeoffs. Growth, and the policies that jumpstart and sustain it, incurs costs. For example, income inequality is typically low at low levels of income but may rise as growth takes place into the middle-income strata, and decline as the country gets richer. The relevant lesson for developing economies at the lower end of the income scale is that there may be short-term pain in order to raise standards of living. For example, countries may have to live with less democracy or greater inequality in the short term to achieve sustainable growth in the long term.
ii. Foundational economics first principles do not map onto well-defined,
universal policy sets. Basic macroeconomic stability—a first principle—is essential if growth is to be sustained and for permanent progress to be made in the war on poverty. Ideas as to how an economy can attain macroeconomic stability are fluid and varied, and there is thus no single yellow brick road to prosperity. A paradigm that is fashionable and relevant in one decade could fall out of favor and be irrelevant in the next, and may yet be resurrected in a third.
iii. Policy formulation must have a localized context. Experience has shown that
a wholesale application of ideas to an economy is no recipe for growth. The idea needs to be applied to its local context. A pragmatic assessment of the resources, constraints, and other structural peculiarities associated with the domestic economy is necessary for any growth practitioner seeking to understand how certain growth paradigms may work out in an economy.
iv. Leadership quality is important, as policy formulation is prone to capture.
While practitioners and academics alike have come to a consensus that there is no single policy which is universally applicable to all economies, it has been less acceptable to enunciate the view that there are economies that persistently choose poor policies. Good policy-making requires high-caliber, impartial, selfless leaders in institutions that enhance, not undermine, each other. Singapore, for example, has a practice of ensuring that leaders in policy-making positions are well-remunerated, thereby reducing the incentives for leaders to undertake corruption or rent-seeking activities. The government scholarship system has also allowed the civil service to harness talent for its use. Checks on and balances against individuals and institutions with vested interests are also required. Good leaders also contribute to successful policy implementation by their ability to convey their vision of the road ahead, mobilize people, and build consensus for their policies through a politics of convergence, not divergence.
Perspectives on Growth: A Political-Economy Framework 33
Policy Implementation and Review i. Robust institutions are key to policy implementation. Failure at the
implementation stage drives a wedge between policy in theory and policy in effect. In order to reduce that wedge, institutions such as an effective administration and civil service, independent judiciary, a vibrant private sector, and a responsible press are needed. History has demonstrated the debilitating effects that institutions captured by vested interests have on growth; commitment to good governance ensures that a country’s institutions remain effective and impartial, and are devoted to the implementation of well-formulated growth policies.
ii. People consensus matters as growth policy ultimately impacts the population
directly. There are two kinds of consensus at the social level—one, between society and the government, and two, within different social groups. Sustained growth often requires trading short-term pain for long-term gain, and even the best of policies can be undermined at the implementation stage if people do not believe in the capabilities of the leaders and government to plan or carry through policy well. This would also reduce public willingness to incur short-term pain given the uncertainty of future gains from growth. The people’s confidence and trust in their leaders—the first kind of people consensus—is thus relevant for sustained growth. Furthermore, the end-point of growth and development—the well-being of a nation’s people—will thus be meaningful only to a people united on the purpose and destiny of their country and who have an entrenched stake in the country. In the absence of a unifying vision, social conflict becomes common, and directly undermines efforts to jumpstart growth as well.
iii. Start small and leverage on “demonstrable effects.” Many gradual steps in
the right direction may yield more benefits than wholesale “big bang” reforms. Small-scale reform can yield substantial gains (or ‘demonstrable effects’) on the margin without necessarily incurring significant costs. This also buys policy makers critical time for the building up of consensus and participation. On a geographical basis, large countries that face substantial logistic and institutional difficulties in implementing growth policies on a broad base can instead adopt a targeted approach by jumpstarting growth in a smaller region (for example, SEZs in China). Indeed the promise of a big solution to a very big problem is an outlier in the practice of economics, where economists usually study how marginal changes to existing systems and policies can bring about general marginal improvements.
iv. Avoid ideological lock-ins. A policy is only as successful as its impact. Policy
makers must avoid pursuing a policy for its own sake and should instead
34 Tan Yin Ying, Alvin Eng, and Edward Robinson
assess whether a policy is still working and/or remains relevant. Also, policies can be captured by vested interest groups. Policy makers must thus constantly review, fine tune, and calibrate policies. This allows them to assess whether (a) the ideas behind the policies have worked in the local context; (b) whether and how implementation could be improved; or more fundamentally, (c) whether one should rethink the original growth paradigms in light of possible changes in the operating environment. After all, policy makers rarely hit on right policy mix from the beginning. Starting small and proceeding in a sequenced step-wise fashion will allow time for building up popular consensus, and also will prevent policy inflexibility that tends to come with the high sunk costs associated with “big bang” reform packages.
Perspectives on Growth: A Political-Economy Framework 35
References
Acemoglu, D., Johnson, S. and Robinson, J.A. (Nov 2002), “Reversal of Fortune: Geography and Development in the Making of the Modern World Income Distribution,” Quarterly Journal of Economics, 117(4):1231-1294.
Annett, A. (2001), “Social Fractionalization, Political Instability, and the Size of Government,” IMF Staff Papers 48(3).
Cass, D. (Jul 1965), “Optimum Growth in an Aggregative Model of Capital Accumulation,” The Review of Economic Studies, 32(3):233-240.
Central Intelligence Agency (2007), CIA World Factbook.
Chan, C.B. et al. (2002), Heart Work. Singapore Economic Development Board and EDB Society.
Chua, B.H. (2006), “Values and Development in Singapore,” Developing Cultures: Case Studies. Edited by Lawrence E. Harrison and Peter Berger. Routledge.
University of Maryland (2005), Polity IV Project: Political Regime Characteristics and Transitions. College Park.
Durlauf, S.N., et al. (2005), “Growth Econometrics,” in Handbook of Economic Growth, Volume 1A, pp. 555-677. Edited by Philippe Aghion and Stephen N. Durlauf. North-Holland Elsevier Science Publishers.
Easterly, W., and Levine, R. (Nov 1997), “Africa’s Growth Tragedy: Policies and Ethnic Divisions,” Quarterly Journal of Economics, 112(4):1203-1250.
Freedom House (2006), Freedom in the World 2006: The Annual Survey of Political Rights and Civil Liberties.
Gleditsch, K.S. (2004), “A Revised List of Wars Between and Within Independent States, 1816–2002,” International Interactions 30(3):231-262.
Heston, A., Summers, R., and Aten, B. (Sep 2006), Penn World Table Version 6.2., Centre for International Comparisons of Production, Income and Prices at the University of Pennsylvania.
Kaufmann, D., Kraay, A., and Mastruzzi, M. (Sep 2006), “Governance Matters V: Governance Indicators for 1996-2005,” Policy Research Paper, World Bank, Washington, D.C.
Koopmans, T.C. (1965), “On the Concept of Optimal Economic Growth,” Pontificiae Academiae Scientiarum Scripta Varia 28(1).
36 Tan Yin Ying, Alvin Eng, and Edward Robinson
Lee, H.L. (2003), in capacity as then-Deputy Prime Minister of Singapore, keynote speech on “Remaking the Singapore Economy” at the annual dinner of the Economics Society of Singapore.
Lee, K.Y. (2000), From Third World to First: The Singapore Story: 1965–2000. Times Media Private Limited and The Straits Times Press.
Lee, S. (1974), The Monetary & Banking Development of Malaysia & Singapore, Singapore University Press.
Lipset, S.M. (Mar 1959), “Some Social Requisites of Democracy: Economic Development and Political Legitimacy,” American Political Science Review, 53(1):69-105.
Lopez-Claros, A., Porter, M.E., Schwab, K. (Dec 2005), “The Global Competitiveness Report 2005–2006: Policies Underpinning Rising Prosperity,” World Economic Forum.
Lucas, R.E. Jr. (Jul 1988), “On the Mechanics of Economic Development,” Journal of Monetary Economics, 22(1):3-42.
Mineral Resources Data System (2005), U.S. Geological Survey, U.S. Geological Survey, Reston, Virginia Online, at: http://tin.er.usgs.gov/mrds/.
PennWell Corporation (Dec 2006), Oil & Gas Journal, 104(47).
Romer, P. (Oct 1986), “Increasing Returns and Long-run Growth,” Journal of Political Economy, 94(5):1002–37.
Solow, R. (Feb 1956), “A Contribution to the Theory of Economic Growth,” Quarterly Journal of Economics, 70(1):65-94.
United Nations (1986), Handbook of International Trade and Development Statistics Supplement. New York.
United Nations (2005), UNCTAD Handbook of Statistics. New York.
World Bank Development Data Group (2006) World Development Indicators.
Perspectives on Growth: A Political-Economy Framework 37
Appendix 1: Method for Sampling PWT6.2
The Penn World Table provides internationally comparable data on production, income, and prices on up to 188 countries. In updating PWT6.1 to 6.2, several countries’ data have been added/removed, as a result of political changes or improvements to the national accounts. This paper was originally prepared using data from PWT6.1, but there have been several notable revisions with the release of PWT6.2 in September 2006. These revisions have the potential to skew the data dramatically, with the addition of data on, for example, oil-rich Middle Eastern countries in 1970, or poorer, former Soviet Union states post-1990.
Acknowledging that PWT6.2 has more updated information (extending to 2004 for a number of countries, and 2003 for most), the data is used for the rest of the analysis that follows in this paper. Yet, it is necessary to derive a consistent set of countries whose inclusion does not dramatically skew the analysis, nor create artificial “structural breaks” in the database. As such, the following methodology was applied to derive a final count of 118 countries in the sample:
1. Choose countries that appear in both PWT6.1 and 6.2. This reduces the database to 145 countries from 188 in the full PWT6.2.
2. Data from the RGDPC variable, or PPP-adjusted GDP per capita (chain-weighted) for these 145 countries, are divided into five-year periods. The latest observation, 2003, is also included. Of the nine blocs of five-year periods (1960–2000) and the final set of observations from 2003, any countries with less than six observations in PWT6.1 are removed. These countries are similarly removed from PWT6.2.
3. PWT6.2 also lacks data on a number of countries where previously there was data under PWT6.1—these are similarly removed.
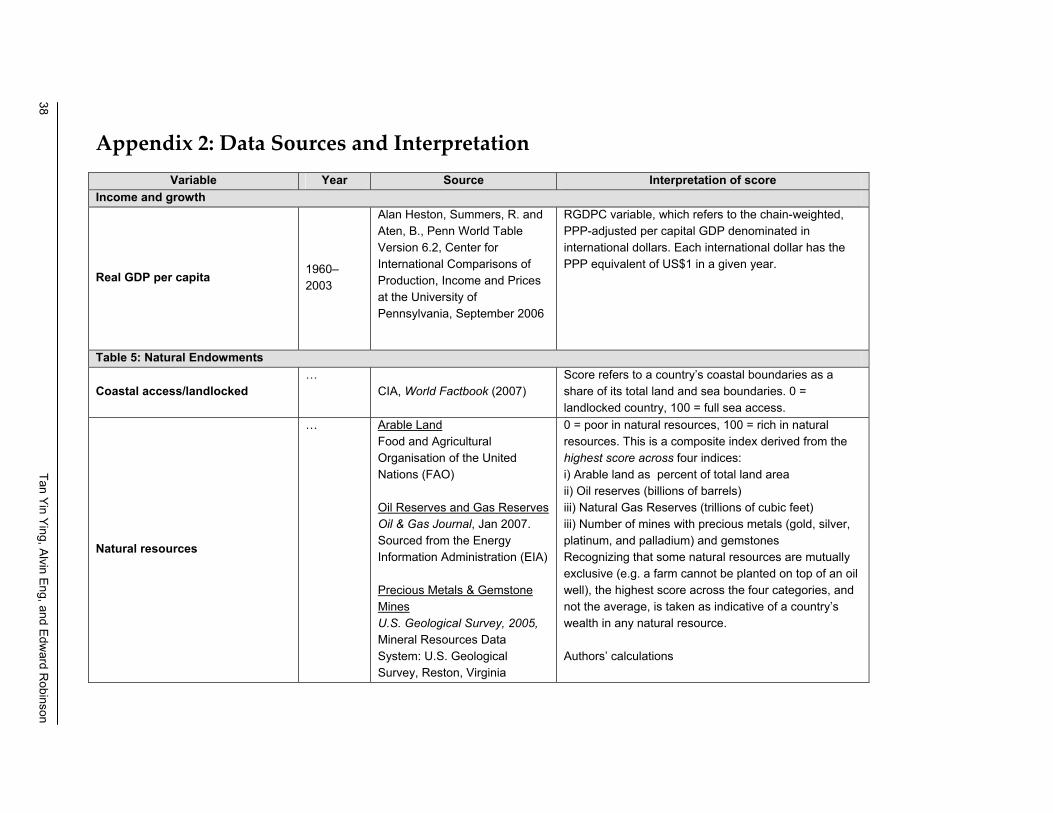
Appendix 2: Data Sources and Interpretation Variable Year Source Interpretation of score
Income and growth
Real GDP per capita 1960–2003
Alan Heston, Summers, R. and Aten, B., Penn World Table Version 6.2, Center for International Comparisons of Production, Income and Prices at the University of Pennsylvania, September 2006
RGDPC variable, which refers to the chain-weighted, PPP-adjusted per capital GDP denominated in international dollars. Each international dollar has the PPP equivalent of US$1 in a given year.
Table 5: Natural Endowments
Coastal access/landlocked …
CIA, World Factbook (2007) Score refers to a country’s coastal boundaries as a share of its total land and sea boundaries. 0 = landlocked country, 100 = full sea access.
Natural resources
… Arable Land Food and Agricultural Organisation of the United Nations (FAO) Oil Reserves and Gas Reserves Oil & Gas Journal, Jan 2007. Sourced from the Energy Information Administration (EIA) Precious Metals & Gemstone Mines U.S. Geological Survey, 2005, Mineral Resources Data System: U.S. Geological Survey, Reston, Virginia
0 = poor in natural resources, 100 = rich in natural resources. This is a composite index derived from the highest score across four indices: i) Arable land as percent of total land area ii) Oil reserves (billions of barrels) iii) Natural Gas Reserves (trillions of cubic feet) iii) Number of mines with precious metals (gold, silver, platinum, and palladium) and gemstones Recognizing that some natural resources are mutually exclusive (e.g. a farm cannot be planted on top of an oil well), the highest score across the four categories, and not the average, is taken as indicative of a country’s wealth in any natural resource. Authors’ calculations
38 Tan Yin Ying, Alvin Eng, and Edw
ard Robinson
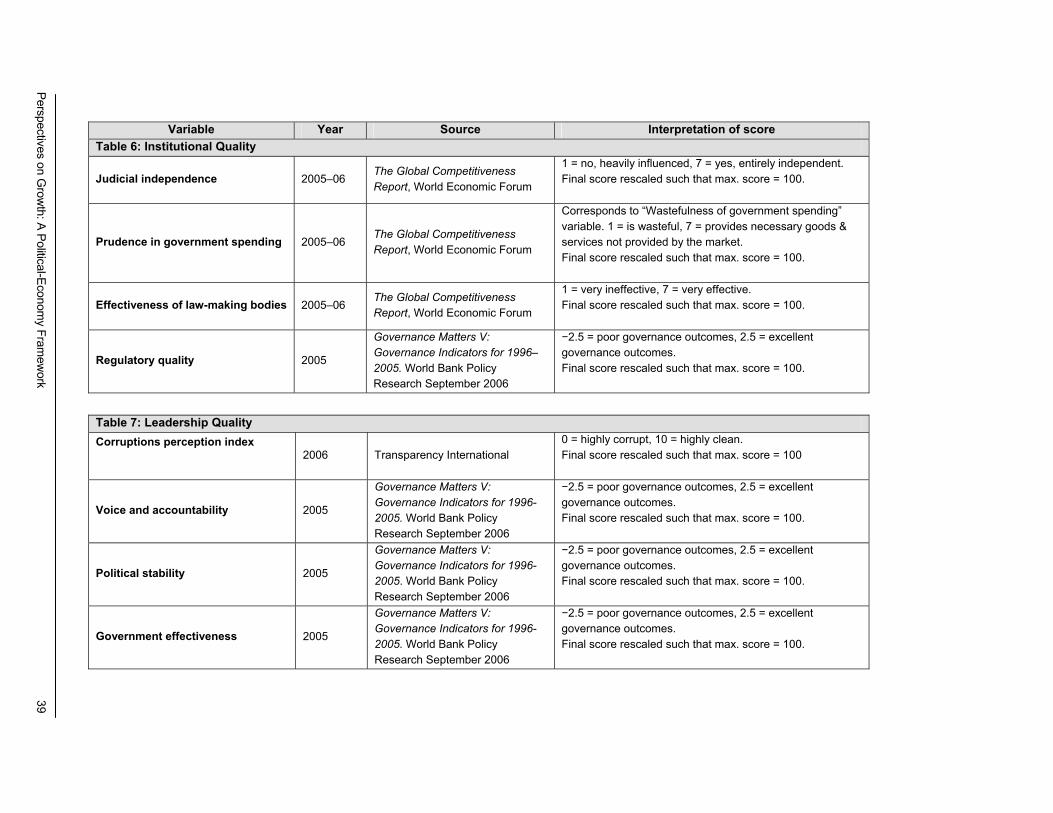
Variable Year Source Interpretation of score
Table 6: Institutional Quality
Judicial independence 2005–06 The Global Competitiveness Report, World Economic Forum
1 = no, heavily influenced, 7 = yes, entirely independent. Final score rescaled such that max. score = 100.
Prudence in government spending 2005–06 The Global Competitiveness Report, World Economic Forum
Corresponds to “Wastefulness of government spending” variable. 1 = is wasteful, 7 = provides necessary goods & services not provided by the market. Final score rescaled such that max. score = 100.
Effectiveness of law-making bodies 2005–06 The Global Competitiveness Report, World Economic Forum
1 = very ineffective, 7 = very effective. Final score rescaled such that max. score = 100.
Regulatory quality 2005
Governance Matters V: Governance Indicators for 1996–2005. World Bank Policy Research September 2006
−2.5 = poor governance outcomes, 2.5 = excellent governance outcomes. Final score rescaled such that max. score = 100.
Table 7: Leadership Quality Corruptions perception index
2006 Transparency International 0 = highly corrupt, 10 = highly clean. Final score rescaled such that max. score = 100
Voice and accountability 2005
Governance Matters V: Governance Indicators for 1996-2005. World Bank Policy Research September 2006
−2.5 = poor governance outcomes, 2.5 = excellent governance outcomes. Final score rescaled such that max. score = 100.
Political stability 2005
Governance Matters V: Governance Indicators for 1996-2005. World Bank Policy Research September 2006
−2.5 = poor governance outcomes, 2.5 = excellent governance outcomes. Final score rescaled such that max. score = 100.
Government effectiveness 2005
Governance Matters V: Governance Indicators for 1996-2005. World Bank Policy Research September 2006
−2.5 = poor governance outcomes, 2.5 = excellent governance outcomes. Final score rescaled such that max. score = 100.
Perspectives on Grow
th: A Political-Economy Fram
ework
39
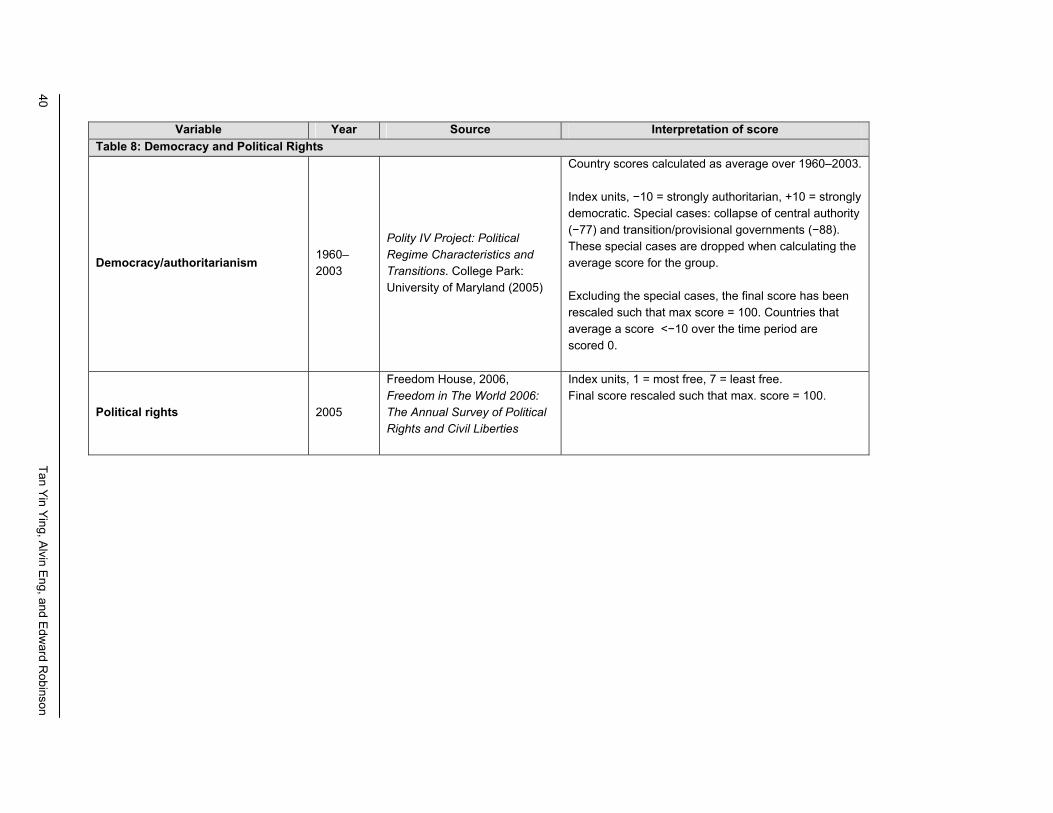
Variable Year Source Interpretation of score
Table 8: Democracy and Political Rights
Democracy/authoritarianism 1960–2003
Polity IV Project: Political Regime Characteristics and Transitions. College Park: University of Maryland (2005)
Country scores calculated as average over 1960–2003. Index units, −10 = strongly authoritarian, +10 = strongly democratic. Special cases: collapse of central authority (−77) and transition/provisional governments (−88). These special cases are dropped when calculating the average score for the group. Excluding the special cases, the final score has been rescaled such that max score = 100. Countries that average a score <−10 over the time period are scored 0.
Political rights 2005
Freedom House, 2006, Freedom in The World 2006: The Annual Survey of Political Rights and Civil Liberties
Index units, 1 = most free, 7 = least free. Final score rescaled such that max. score = 100.
40 Tan Yin Ying, Alvin Eng, and Edw
ard Robinson
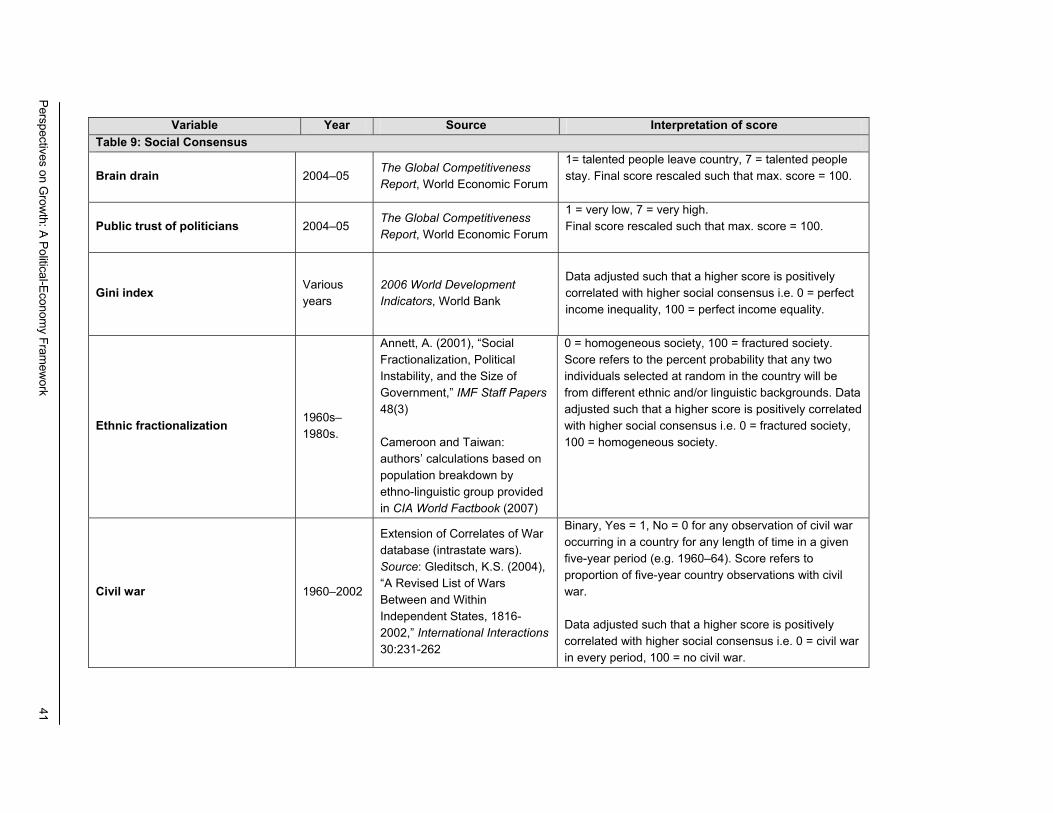
Variable Year Source Interpretation of score
Table 9: Social Consensus
Brain drain 2004–05 The Global Competitiveness Report, World Economic Forum
1= talented people leave country, 7 = talented people stay. Final score rescaled such that max. score = 100.
Public trust of politicians 2004–05 The Global Competitiveness Report, World Economic Forum
1 = very low, 7 = very high. Final score rescaled such that max. score = 100.
Gini index Various years
2006 World Development Indicators, World Bank
Data adjusted such that a higher score is positively correlated with higher social consensus i.e. 0 = perfect income inequality, 100 = perfect income equality.
Ethnic fractionalization 1960s–1980s.
Annett, A. (2001), “Social Fractionalization, Political Instability, and the Size of Government,” IMF Staff Papers 48(3) Cameroon and Taiwan: authors’ calculations based on population breakdown by ethno-linguistic group provided in CIA World Factbook (2007)
0 = homogeneous society, 100 = fractured society. Score refers to the percent probability that any two individuals selected at random in the country will be from different ethnic and/or linguistic backgrounds. Data adjusted such that a higher score is positively correlated with higher social consensus i.e. 0 = fractured society, 100 = homogeneous society.
Civil war 1960–2002
Extension of Correlates of War database (intrastate wars). Source: Gleditsch, K.S. (2004), “A Revised List of Wars Between and Within Independent States, 1816-2002,” International Interactions 30:231-262
Binary, Yes = 1, No = 0 for any observation of civil war occurring in a country for any length of time in a given five-year period (e.g. 1960–64). Score refers to proportion of five-year country observations with civil war. Data adjusted such that a higher score is positively correlated with higher social consensus i.e. 0 = civil war in every period, 100 = no civil war.
Perspectives on Grow
th: A Political-Economy Fram
ework
41
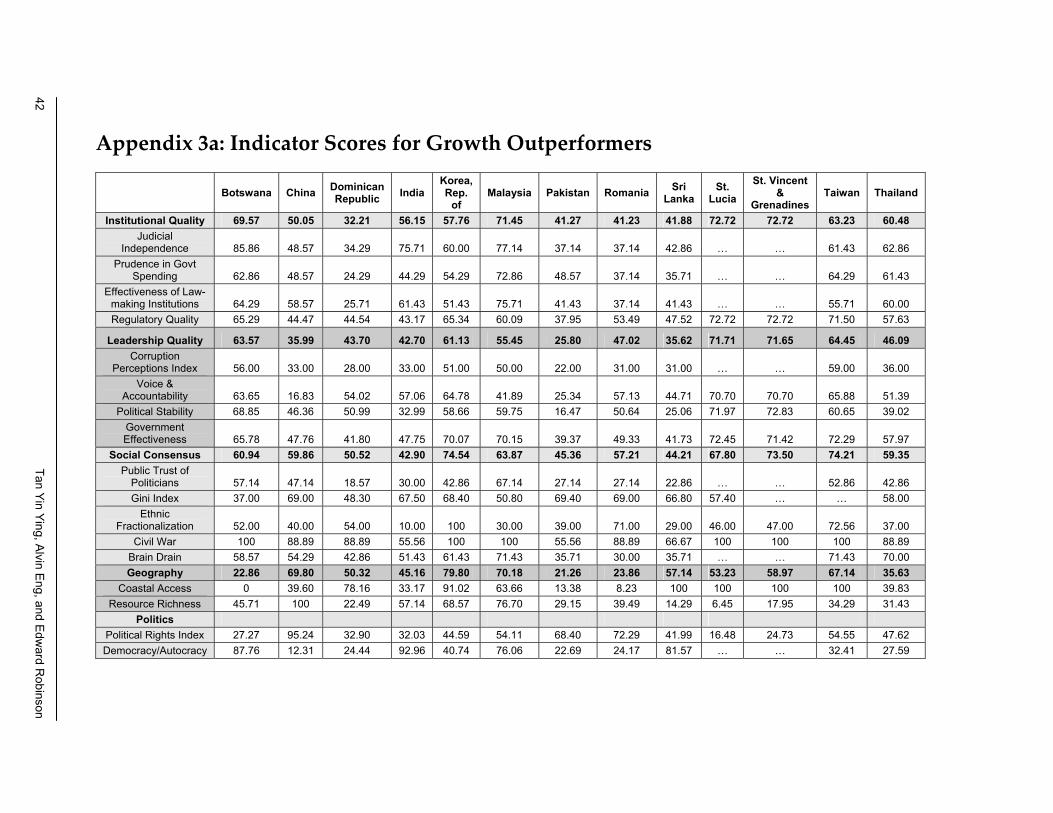
Appendix 3a: Indicator Scores for Growth Outperformers
Botswana China Dominican Republic India
Korea, Rep.
of Malaysia Pakistan Romania Sri
Lanka St.
Lucia St. Vincent
& Grenadines
Taiwan Thailand
Institutional Quality 69.57 50.05 32.21 56.15 57.76 71.45 41.27 41.23 41.88 72.72 72.72 63.23 60.48 Judicial
Independence 85.86 48.57 34.29 75.71 60.00 77.14 37.14 37.14 42.86 … … 61.43 62.86 Prudence in Govt
Spending 62.86 48.57 24.29 44.29 54.29 72.86 48.57 37.14 35.71 … … 64.29 61.43 Effectiveness of Law-
making Institutions 64.29 58.57 25.71 61.43 51.43 75.71 41.43 37.14 41.43 … … 55.71 60.00 Regulatory Quality 65.29 44.47 44.54 43.17 65.34 60.09 37.95 53.49 47.52 72.72 72.72 71.50 57.63
Leadership Quality 63.57 35.99 43.70 42.70 61.13 55.45 25.80 47.02 35.62 71.71 71.65 64.45 46.09 Corruption
Perceptions Index 56.00 33.00 28.00 33.00 51.00 50.00 22.00 31.00 31.00 … … 59.00 36.00 Voice &
Accountability 63.65 16.83 54.02 57.06 64.78 41.89 25.34 57.13 44.71 70.70 70.70 65.88 51.39 Political Stability 68.85 46.36 50.99 32.99 58.66 59.75 16.47 50.64 25.06 71.97 72.83 60.65 39.02
Government Effectiveness 65.78 47.76 41.80 47.75 70.07 70.15 39.37 49.33 41.73 72.45 71.42 72.29 57.97
Social Consensus 60.94 59.86 50.52 42.90 74.54 63.87 45.36 57.21 44.21 67.80 73.50 74.21 59.35 Public Trust of
Politicians 57.14 47.14 18.57 30.00 42.86 67.14 27.14 27.14 22.86 … … 52.86 42.86 Gini Index 37.00 69.00 48.30 67.50 68.40 50.80 69.40 69.00 66.80 57.40 … … 58.00
Ethnic Fractionalization 52.00 40.00 54.00 10.00 100 30.00 39.00 71.00 29.00 46.00 47.00 72.56 37.00
Civil War 100 88.89 88.89 55.56 100 100 55.56 88.89 66.67 100 100 100 88.89 Brain Drain 58.57 54.29 42.86 51.43 61.43 71.43 35.71 30.00 35.71 … … 71.43 70.00 Geography 22.86 69.80 50.32 45.16 79.80 70.18 21.26 23.86 57.14 53.23 58.97 67.14 35.63
Coastal Access 0 39.60 78.16 33.17 91.02 63.66 13.38 8.23 100 100 100 100 39.83 Resource Richness 45.71 100 22.49 57.14 68.57 76.70 29.15 39.49 14.29 6.45 17.95 34.29 31.43
Politics Political Rights Index 27.27 95.24 32.90 32.03 44.59 54.11 68.40 72.29 41.99 16.48 24.73 54.55 47.62 Democracy/Autocracy 87.76 12.31 24.44 92.96 40.74 76.06 22.69 24.17 81.57 … … 32.41 27.59
42 Tan Yin Ying, Alvin Eng, and Edw
ard Robinson
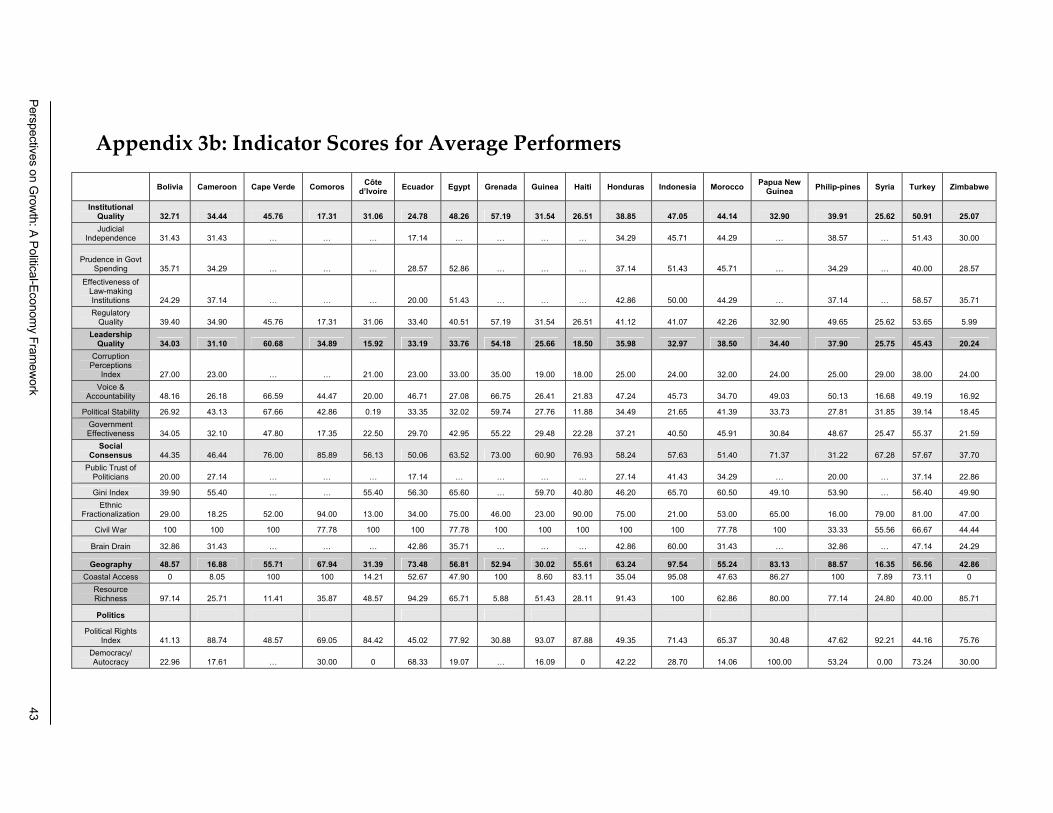
Appendix 3b: Indicator Scores for Average Performers
Bolivia Cameroon Cape Verde Comoros Côte d’Ivoire Ecuador Egypt Grenada Guinea Haiti Honduras Indonesia Morocco Papua New
Guinea Philip-pines Syria Turkey Zimbabwe
Institutional Quality 32.71 34.44 45.76 17.31 31.06 24.78 48.26 57.19 31.54 26.51 38.85 47.05 44.14 32.90 39.91 25.62 50.91 25.07 Judicial
Independence 31.43 31.43 … … … 17.14 … … … … 34.29 45.71 44.29 … 38.57 … 51.43 30.00
Prudence in Govt Spending 35.71 34.29 … … … 28.57 52.86 … … … 37.14 51.43 45.71 … 34.29 … 40.00 28.57
Effectiveness of Law-making Institutions 24.29 37.14 … … … 20.00 51.43 … … … 42.86 50.00 44.29 … 37.14 … 58.57 35.71 Regulatory
Quality 39.40 34.90 45.76 17.31 31.06 33.40 40.51 57.19 31.54 26.51 41.12 41.07 42.26 32.90 49.65 25.62 53.65 5.99 Leadership
Quality 34.03 31.10 60.68 34.89 15.92 33.19 33.76 54.18 25.66 18.50 35.98 32.97 38.50 34.40 37.90 25.75 45.43 20.24 Corruption
Perceptions Index 27.00 23.00 … … 21.00 23.00 33.00 35.00 19.00 18.00 25.00 24.00 32.00 24.00 25.00 29.00 38.00 24.00
Voice & Accountability 48.16 26.18 66.59 44.47 20.00 46.71 27.08 66.75 26.41 21.83 47.24 45.73 34.70 49.03 50.13 16.68 49.19 16.92
Political Stability 26.92 43.13 67.66 42.86 0.19 33.35 32.02 59.74 27.76 11.88 34.49 21.65 41.39 33.73 27.81 31.85 39.14 18.45 Government Effectiveness 34.05 32.10 47.80 17.35 22.50 29.70 42.95 55.22 29.48 22.28 37.21 40.50 45.91 30.84 48.67 25.47 55.37 21.59
Social Consensus 44.35 46.44 76.00 85.89 56.13 50.06 63.52 73.00 60.90 76.93 58.24 57.63 51.40 71.37 31.22 67.28 57.67 37.70
Public Trust of Politicians 20.00 27.14 … … … 17.14 … … … … 27.14 41.43 34.29 … 20.00 … 37.14 22.86
Gini Index 39.90 55.40 … … 55.40 56.30 65.60 … 59.70 40.80 46.20 65.70 60.50 49.10 53.90 … 56.40 49.90 Ethnic
Fractionalization 29.00 18.25 52.00 94.00 13.00 34.00 75.00 46.00 23.00 90.00 75.00 21.00 53.00 65.00 16.00 79.00 81.00 47.00
Civil War 100 100 100 77.78 100 100 77.78 100 100 100 100 100 77.78 100 33.33 55.56 66.67 44.44
Brain Drain 32.86 31.43 … … … 42.86 35.71 … … … 42.86 60.00 31.43 … 32.86 … 47.14 24.29
Geography 48.57 16.88 55.71 67.94 31.39 73.48 56.81 52.94 30.02 55.61 63.24 97.54 55.24 83.13 88.57 16.35 56.56 42.86 Coastal Access 0 8.05 100 100 14.21 52.67 47.90 100 8.60 83.11 35.04 95.08 47.63 86.27 100 7.89 73.11 0
Resource Richness 97.14 25.71 11.41 35.87 48.57 94.29 65.71 5.88 51.43 28.11 91.43 100 62.86 80.00 77.14 24.80 40.00 85.71
Politics
Political Rights Index 41.13 88.74 48.57 69.05 84.42 45.02 77.92 30.88 93.07 87.88 49.35 71.43 65.37 30.48 47.62 92.21 44.16 75.76
Democracy/ Autocracy 22.96 17.61 … 30.00 0 68.33 19.07 … 16.09 0 42.22 28.70 14.06 100.00 53.24 0.00 73.24 30.00
Perspectives on Grow
th: A Political-Economy Fram
ework
43
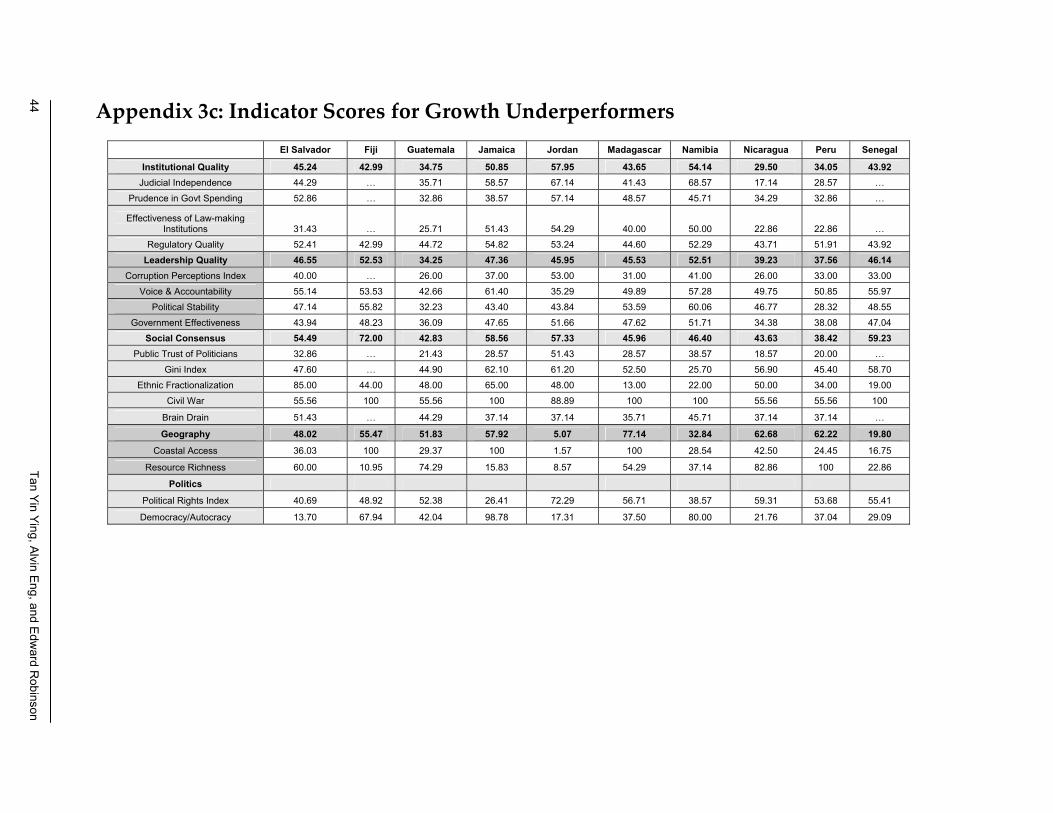
Appendix 3c: Indicator Scores for Growth Underperformers El Salvador Fiji Guatemala Jamaica Jordan Madagascar Namibia Nicaragua Peru Senegal
Institutional Quality 45.24 42.99 34.75 50.85 57.95 43.65 54.14 29.50 34.05 43.92 Judicial Independence 44.29 … 35.71 58.57 67.14 41.43 68.57 17.14 28.57 …
Prudence in Govt Spending 52.86 … 32.86 38.57 57.14 48.57 45.71 34.29 32.86 …
Effectiveness of Law-making Institutions 31.43 … 25.71 51.43 54.29 40.00 50.00 22.86 22.86 …
Regulatory Quality 52.41 42.99 44.72 54.82 53.24 44.60 52.29 43.71 51.91 43.92
Leadership Quality 46.55 52.53 34.25 47.36 45.95 45.53 52.51 39.23 37.56 46.14 Corruption Perceptions Index 40.00 … 26.00 37.00 53.00 31.00 41.00 26.00 33.00 33.00
Voice & Accountability 55.14 53.53 42.66 61.40 35.29 49.89 57.28 49.75 50.85 55.97
Political Stability 47.14 55.82 32.23 43.40 43.84 53.59 60.06 46.77 28.32 48.55
Government Effectiveness 43.94 48.23 36.09 47.65 51.66 47.62 51.71 34.38 38.08 47.04
Social Consensus 54.49 72.00 42.83 58.56 57.33 45.96 46.40 43.63 38.42 59.23 Public Trust of Politicians 32.86 … 21.43 28.57 51.43 28.57 38.57 18.57 20.00 …
Gini Index 47.60 … 44.90 62.10 61.20 52.50 25.70 56.90 45.40 58.70
Ethnic Fractionalization 85.00 44.00 48.00 65.00 48.00 13.00 22.00 50.00 34.00 19.00
Civil War 55.56 100 55.56 100 88.89 100 100 55.56 55.56 100
Brain Drain 51.43 … 44.29 37.14 37.14 35.71 45.71 37.14 37.14 …
Geography 48.02 55.47 51.83 57.92 5.07 77.14 32.84 62.68 62.22 19.80
Coastal Access 36.03 100 29.37 100 1.57 100 28.54 42.50 24.45 16.75
Resource Richness 60.00 10.95 74.29 15.83 8.57 54.29 37.14 82.86 100 22.86
Politics
Political Rights Index 40.69 48.92 52.38 26.41 72.29 56.71 38.57 59.31 53.68 55.41
Democracy/Autocracy 13.70 67.94 42.04 98.78 17.31 37.50 80.00 21.76 37.04 29.09
44 Tan Yin Ying, Alvin Eng, and Edw
ard Robinson

Eco-Audit
Environmental Benefits Statement The Commission on Growth and Development is committed to preserving endangered forests and natural resources. The World Bank’s Office of the Publisher has chosen to print these Working Papers on 100 percent postconsumer recycled paper, processed chlorine free, in accordance with the recommended standards for paper usage set by Green Press Initiative—a nonprofit program supporting publishers in using fiber that is not sourced from endangered forests. For more information, visit www.greenpressinitiative.org. The printing of all the Working Papers in this Series on recycled paper saved the following:
Trees* Solid Waste Water Net Greenhouse Gases Total Energy
48 2,247 17,500 4,216 33 mil. *40 inches in
height and 6–8 inches in diameter
Pounds Gallons Pounds CO2 Equivalent BTUs
The Commission on Growth and Development Working Paper Series
1. Perspectives on Growth: A Political-Economic Framework (Lessons from the Singapore Experience), by Tan Yin Ying, Alvin Eng, and Edward Robinson, March 2008
2. Exchange Rate Economics, by John Williamson, March 2008 3. Normalizing Industrial Policy, by Dani Rodrik, March 20084. The Real Exchange Rate and Economic Growth, by Barry Eichengreen, March 20085. Globalization, Growth, and Distribution: Framing the Questions, by Ravi Kanbur, March 2008
Forthcoming Papers in the Series: Growth Strategies and Dynamics: Insights from Country Experiences, by Mohamed A. El-Erian
and Michael Spence (March 2008)Political Competition, Policy Making, and the Quality of Public Policies in Costa Rica, by Fabrice Lehoucq
(April 2008)
Electronic copies of the working papers in this series are available online at www.growthcommission.org.
They can also be requested by sending an e-mail to [email protected].
Cover_WP001.indd 3Cover_WP001.indd 3 3/4/2008 9:38:07 AM3/4/2008 9:38:07 AM
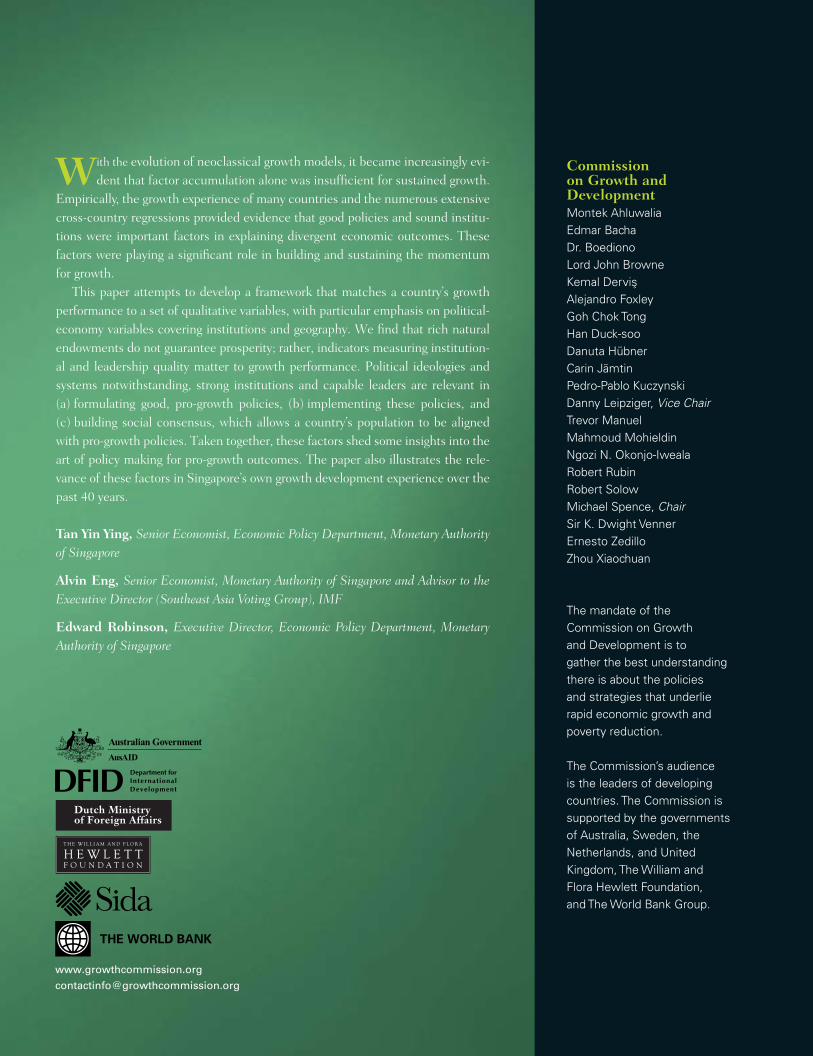
Perspectives on Growth:A Political-Economy
FrameworkLessons from the Singapore Experience
Tan Yin YingAlvin Eng
Edward Robinson
WORKING PAPER NO.1
www.growthcommission.org
Commission on Growth and Development Montek AhluwaliaEdmar BachaDr. BoedionoLord John Browne Kemal DervisAlejandro FoxleyGoh Chok TongHan Duck-sooDanuta HübnerCarin JämtinPedro-Pablo KuczynskiDanny Leipziger, Vice ChairTrevor ManuelMahmoud MohieldinNgozi N. Okonjo-IwealaRobert RubinRobert SolowMichael Spence, ChairSir K. Dwight VennerErnesto ZedilloZhou Xiaochuan
The mandate of the Commission on Growth and Development is to gather the best understanding there is about the policies and strategies that underlie rapid economic growth and poverty reduction.
The Commission’s audience is the leaders of developing countries. The Commission is supported by the governments of Australia, Sweden, the Netherlands, and United Kingdom, The William and Flora Hewlett Foundation, and The World Bank Group.
With the evolution of neoclassical growth models, it became increasingly evi-dent that factor accumulation alone was insuffi cient for sustained growth.
Empirically, the growth experience of many countries and the numerous extensive cross-country regressions provided evidence that good policies and sound institu-tions were important factors in explaining divergent economic outcomes. These factors were playing a signifi cant role in building and sustaining the momentum for growth.
This paper attempts to develop a framework that matches a country’s growth performance to a set of qualitative variables, with particular emphasis on political-economy variables covering institutions and geography. We fi nd that rich natural endowments do not guarantee prosperity; rather, indicators measuring institution-al and leadership quality matter to growth performance. Political ideologies and systems notwithstanding, strong institutions and capable leaders are relevant in (a) formulating good, pro-growth policies, (b) implementing these policies, and (c) building social consensus, which allows a country’s population to be aligned with pro-growth policies. Taken together, these factors shed some insights into the art of policy making for pro-growth outcomes. The paper also illustrates the rele-vance of these factors in Singapore’s own growth development experience over the past 40 years.
Tan Yin Ying, Senior Economist, Economic Policy Department, Monetary Authority of Singapore
Alvin Eng, Senior Economist, Monetary Authority of Singapore and Advisor to the Executive Director (Southeast Asia Voting Group), IMF
Edward Robinson, Executive Director, Economic Policy Department, Monetary Authority of Singapore
Cover_WP001.indd 1Cover_WP001.indd 1 3/5/2008 9:04:05 AM3/5/2008 9:04:05 AM