Embed Size (px)
Citation preview
Information Frictions and Entrepreneurship
Deepak Hegde∗‡ Justin Tumlinson†‡
Forthcoming at Strategic Management Journal
Abstract
Why do individuals become entrepreneurs? Why do some succeed? We propose two
theories in which information frictions play a central role in answering these questions.
Empirical analysis of longitudinal samples from the U.S. and the U.K. reveal the following
patterns: (i) entrepreneurs have higher cognitive ability than employees with compara-
ble education, (ii) employees have better education than equally able entrepreneurs, and
(iii) entrepreneurs’earnings are higher and exhibit greater variance than employees with
similar education. These, and other empirical tests support our asymmetric informa-
tion theory of entrepreneurship that when information frictions cause firms to undervalue
workers lacking traditional credentials, workers’quest to maximize their private returns
drives the most able into successful entrepreneurship.
Key words: Entrepreneurship; Asymmetric Information; Signaling; Education; Job-matching
∗New York University (e-mail: [email protected])†Loughborough University (email: [email protected])‡For their helpful comments, the authors thank Howard Aldrich, Ashish Arora, Ron Bart, Victor Bennett,
Gino Cattani, Gary Dushnitsky, Brent Goldfarb, Bronwyn Hall, Dietmar Harhoff, Thomas Hellman, AseemKaul, William Kerr, Tobias Kretschmer, Ian Larkin, Danielle Li, John Morgan, Ramana Nanda, Manju Puri,Vera Rocha, Thomas Rønde, Richard Rumelt, Carlos Serrano, Zur Shapira, Scott Stern, Thomas Triebs, KaivanVakili, Felix Várdy, Manuel Wiegand and Rebecca Zarutskie. We are grateful to Rajshree Agarwal (Editor)and two anonymous referees for may helpful suggestions that improved our work and thinking on the topic. Weare indebted to Steve Blank and Josh Wolfe of Lux Capital for stoking a multitude of lively dialogs betweenentrepreneurs and investors on our work, that let us know we were on the right track. All errors are our own.
1
Electronic copy available at: https://ssrn.com/abstract=2596846
Entrepreneurship
1 Introduction
Hewlett-Packard apparently denied Steve Jobs’petition for employment in 1977, because he
lacked a degree– Jobs had dropped out of Reed College in 1972. Twitter and Facebook rejected
San Jose State dropout Jan Koum’s job applications; a year later he founded WhatsApp!, a
company he would sell in five years to Facebook for $19 billion. D.J. Patel’s Indian geology
degree was not recognized by U.S. employers when he arrived in 1997, so he worked in the fast
food industry. Now he owns more than a dozen pizza franchises near Atlanta, Georgia. How
general is the experience of Jobs, Koum, and Patel– all of whom became entrepreneurs after
prospective employers overlooked their talents, evidently due to insuffi cient credentials?
In this paper, we formalize and test two theories of entrepreneurship that could explain
these successful entrepreneurs’ decisions to strike out on their own. Informational frictions
about worker ability lie at the heart of both. The difference between the two lies in who faces
the informational imperfection– potential employers or the worker himself.
The first explanation, driven by asymmetric information, argues that any individual has
incentive to start his own venture if potential employers perceive his productive capacity as
lower than he does. Building on the seminal contributions of Akerlof (1970) and Spence (1973)
to asymmetric information and signaling, we develop a theory in which firms reward workers
with wages based on observable signals of ability. Ability can be inferred from many traits
and behaviors. For example, potential employers commonly accept educational attainment and
work history as signals of unobservable ability. However, the signals are imperfect– if a worker
believes his ability exceeds what potential employers can infer from his observable characteris-
tics, then he chooses entrepreneurship and becomes residual claimant of his productivity, rather
than join a firm in which he would be paid according to his observable signals. We show that
these pressures exist whether signals arise exogenously or workers acquire them endogenously,
like educational degrees, and whether they increase the holder’s productivity or not.
Comparative advantage drives our second information-based theory of entrepreneurship. We
draw from Roy’s (1951) and Jovanovic’s (1979) insights that occupational choice results from
matching multi-dimensional human capital to job-dependent multi-factor production functions.
Others before us, most prominently Lazear (2004, 2005), have proposed that entrepreneurship
arises from differentiated abilities but have not derived clear predictions about entrepreneurial
entry and earnings when information about abilities is symmetrically imperfect (i.e., not known
with certainty by either the worker or employer at the outset). We develop a model in which
signals of ability are productive, like the specific skills one acquires through formal education.
2
Electronic copy available at: https://ssrn.com/abstract=2596846
Entrepreneurship
If these yield relatively more in existing firms, and innate cognitive ability produces relatively
more in entrepreneurship, then workers will eventually sort into the respective occupation where
their productivity is highest. The rate at which information imperfection resolves determines
how fast individuals find their optimal mode of work.
Both models generate some similar propositions, particularly in static settings. Both predict
that workers who choose entrepreneurship have higher ability and higher income than employ-
ees with the same signals, while entrepreneurs’signals are inferior to similarly able employees’.
However, only asymmetric information indicates that entrepreneurs’incomes will exhibit higher
variance among workers with the same signals. Dynamic analyses yield further telltale differ-
ences: With the reduction of informational asymmetries over worker careers, the hypothesized
ability advantage of entrepreneurs relative to employees of the same signal diminishes. On the
other hand, the resolution of symmetric informational imperfections predicts the opposite– as
a worker and his (potential) employers simultaneously learn his relative strengths and weak-
ness, the sorting of workers to matching occupations improves, which increases the ability gap
between entrepreneurs and employees with the same educational credentials over time.
We test these theoretical predictions using data drawn from the nationally representative
National Longitudinal Survey of Youth (NLSY), first administered to 12,686 individuals born
between 1957 and 1964, and resident in the U.S. in 1979. The NLSY provides a detailed
record of their education and work histories to the present. Analyzing this sample, we find
that those who become self-employed (or entrepreneurs) scored higher on cognitive ability
tests administered to them as adolescents than employees with similar educational credentials,
our proxy for observable signals. Despite their higher ability scores, the self-employed have
lower academic credentials. In fact, the larger the gap between an individual’s own ability
and the median ability of individuals with his same academic credentials, the more likely he
is to choose entrepreneurship. The median self-employed worker earns 7.3 percent more than
the comparably educated wage-employee, and entrepreneurial earnings have higher variance.
These empirical differences between the self-employed and wage-employed prevail for both self-
employed workers who incorporate their businesses as well as those who do not, with the results
on income and wealth differences being particularly stark for incorporated entrepreneurs–
those most likely to be residual claimants of high growth enterprises. We obtain these results
after controlling for a variety of potential correlates of entrepreneurial choice, including worker
wealth, non-cognitive traits such as risk-taking and locus of control, and other demographic
features. Analysis of a second nationally representative dataset constructed from the U.K.
National Child Development Study (NCDS), which follows the lives of every U.K. resident
3
Electronic copy available at: https://ssrn.com/abstract=2596846
Entrepreneurship
born during one particular week in 1958 to the present yields qualitatively similar results.
However, further empirical analyses do not equally support both theories. We find neither
evidence that the returns to cognitive ability are higher in entrepreneurship nor to education
in wage work– requisite conditions for comparative advantage. Further, although individuals
with high ability relative to their educational pedigree tend to enter entrepreneurship, the
effect attenuates over workers’careers– a pattern consistent with asymmetric information but
contradictory to comparative advantage with imperfect information. Next, employees’returns
to ability increase over time but show no significant evolution for entrepreneurs– suggesting that
employers learn their employees’abilities but entrepreneurs get paid for their innate talents
early on, again supportive of asymmetric information. Although the above evidence implies
workers know themselves better than the labor market, workers’information about their own
ability is also evidently imperfect, and occupational switching is not uncommon– those who
give up entrepreneurship for wage work have higher credentials than ability, while employees
transitioning to entrepreneurship have relatively higher ability, holding education and all else
constant. Hence, while we cannot completely rule out comparative advantage, the case for
asymmetric information appears more compelling.
Entrepreneurs are heroes of Schumpeterian creative destruction, but a large literature across
the social sciences portrays the self-employed as overconfident and under-educated job-hoppers
or social misfits. Our work contributes to resolving this paradox. By focusing on a single
facet– information frictions about ability– as the driver of entrepreneurship, our models ex-
plain occupational choice and success across the spectrum of ability: from the corner food
vendor lacking a high school diploma to the founder of a revolutionary, high-tech startup with
a PhD from MIT– something existing theories, or empirical tests of entrepreneurship theories,
cannot easily do. Our theories thus foreclose the bias inherent in studying entrepreneurial
subclasses such as venture backed startups, or high-tech founders (Ruef 2010 describes the
flawed generalizations that arise from such studies). We also delineate the subtle differences
between two distinct classes of information frictions– asymmetric versus symmetric imperfect
information– about worker ability as drivers of entrepreneurship.
Nevertheless, we emphasize that we neither explain the occupational choice of every en-
trepreneur nor rule out other explanations for entrepreneurship. Equally, we cannot resolve
the debate on entrepreneurial earnings. However, by showing that entrepreneurs earn more
conditional on their signals– as predicted by our theories of financially motivated workers– we
identify those more likely to succeed as entrepreneurs, after controlling for known influences
of entrepreneurial entry such as risk preferences, family wealth and confidence. Our empirical
4
Electronic copy available at: https://ssrn.com/abstract=2596846
Entrepreneurship
findings imply that those who strike out on their own because their productive ability is un-
dervalued by labor markets are successful. Still those who choose entrepreneurship for other
reasons (e.g., due to overconfidence or lifestyle preferences) may not enjoy similar success. Thus,
our findings suggest that the resolution of the entrepreneurial earnings puzzle hinges on why
workers choose entrepreneurship in the first place.
The rest of this paper is organized as follows. The next section briefly, and thus incompletely
and partially, summarizes the related literature. Section 3 presents our two theories of entre-
preneurial choice. Section 4 introduces our data and describes our empirical findings. Section 5
concludes. Formal proofs are relegated to Appendix A, while Appendices B and C respectively
describe additional empirical robustness checks and analyses using the British NCDS sample.
2 Related Literature
Our study speaks to a vast literature across the social sciences, which examines the determinants
of entrepreneurship and conditions that affect entrepreneurial success. Since a study like ours
cannot do justice to it, we refer readers to more comprehensive literature summaries in Parker
(2009) and Hebert and Link (1998) and situate our study among its direct antecedents below.
Dispositional versus Contextual Drivers. Sørensen (2007) divides the entrepreneur-
ship literature into two camps: “dispositional”and “contextual.”Dispositional studies tradition
argue that individuals’characteristics pre-dispose them towards either entrepreneurship or tra-
ditional employment. For example, McClelland (1964) argues that individuals who believe
their performance depends on their own actions– those with an internal locus of control– tend
to become entrepreneurs. Camerer and Lovallo (1999) provide experimental evidence that
overconfident, hubristic, individuals gravitate toward entrepreneurship. Kihlstrom and Laffont
(1979) suggest that entrepreneurs are risk loving. Lazear (2004, 2005) as well as Kacperczyk
and Younkin (2017) theorize that they have less focused interests than employees. Levine and
Rubinstein (2017) describe them as “smart and illicit.”Nicolaou et al. (2008) uncover highly
heritable entrepreneurial dispositions by comparing the activity of monozygotic and dizygotic
twins. Summarizing the evidence from large sample studies, Evans and Leighton (1989, p 521)
conclude: “Poorer wage workers– that is, unemployed workers, lower-paid wage workers and
men who have changed jobs a lot– are more likely to enter self-employment or to be self-
employed at a point in time, all else equal. These results are consistent with the view of some
sociologists that ‘misfits’are pushed into entrepreneurship.”
In contrast to the dispositional approaches, context-based explanations highlight environ-
5
Electronic copy available at: https://ssrn.com/abstract=2596846
Entrepreneurship
mental factors that goad workers into entrepreneurship. Studies in this camp highlight the roles
of family origin (Halaby, 2003; Sørensen, 2007), professional and social networks (Stuart and
Sorenson, 2005; Lerner and Malmendier, 2013), as well as the regional cultural and material
environment (Saxenian, 1994; Sorenson and Audia, 2000; Schoonhoven and Romanelli, 2001).
Our theories particularly relate to the “ability-job match”and “employee mobility”branches
of the dispositional and contextual explanations, respectively.
Ability-Job Match. Among dispositional explanations for entrepreneurship, a family of
studies by Åstebro, Chen and Thompson (2011), Braguinsky, Klepper, and Ohyama (2012),
and Ohyama (2015) casts the decision to found a firm as a matter of matching job to ability.
These papers’ formal models posit relationships between the distribution of worker ability
and the production functions of employees vis-à-vis entrepreneurs to derive predictions about
entrepreneurial choice as a function of ability. In Åstebro, et al. (2011), when ability and
job requirements are both uniformly distributed and production exhibits skill complementarity,
labor market frictions disproportionately prevent high and low ability workers from matching to
their optimal wage jobs, forcing them into entrepreneurship instead. Ohyama (2015) arrives at a
similar conclusion by assuming entrepreneurial earnings are more convex in ability than wages,
which allows entrepreneurial earnings to dominate wages at both tails of the ability distribution.
Braguinsky et al. (2012) posit distinctive roles for innate ability and work-experience– the
latter helps to identify good entrepreneurial ideas, while the former improves execution. From
this setup, they predict late entrepreneurial entrants fail less (because they are less innately
able but filter ideas better due to experience), but the highest earning entrepreneurs are those
that survive early entry (because they are the most capable to execute anything that comes up
and luckily had good ideas, despite poor filtering). Each of these papers find empirical support
for their predictions by treating education as a proxy for ability in large samples– effectively
equating education and ability for empirical purposes.1
Employee Experience and Mobility. Among contextual factors, work environments
characterized by dissent drive some employees into entrepreneurship.2 Klepper and Thompson
(2010) document “disagreements among leading decision makers concerning fundamental ideas
about technology and management that prompt dissidents to leave and start their own firms.”
Shah, Agarwal and Echambadi (2019) find that interpersonal and ethical frictions within orga-
1In a related literature stream that does not treat education as a signal of ability per se, Stenard andSauermann (2016) find that workers who end up in employment that does not utilize their education becomedissatisfied inducing them to leave and start their own firms.
2See Campbell, Kryscynski, and Olson (2017), and Agarwal, Gambardella, and Olson (2016) for comprehen-sive surveys of the literature connecting employee mobility to entrepreneurial entry.
6
Electronic copy available at: https://ssrn.com/abstract=2596846
Entrepreneurship
nizations push employees to spin-out their own ventures. Similarly, Klepper (2007) shows that
automobile manufacturers experiencing more disagreements between management and employ-
ees spun out more startups. Agarwal, Audretsch and Shakar (2007) point out that underutilized
knowledge, embedded in employees, spurs many to strike out on their own.
Entrepreneurial Earnings. While the studies we discuss above have established that
personality traits and environmental conditions goad individuals into entrepreneurship, except-
ing the ability-job match stream, they do not directly address when entrepreneurship can be
more profitable than wage-employment. In a pioneering study, Hamilton (2000) reports that
entrepreneurs’earnings start lower and grow slower than paid employees’, and suggests that
entrepreneurs accept lower income to indulge their taste for “being their own boss.”Moskowitz
and Vissing-Jorgensen (2002) likewise find that entrepreneurial investments earn less, despite in-
curring greater risk. Levine and Rubinstein (2017) use NLSY data to report that self-employed
workers who own incorporated businesses earn substantially more than employees (based on
both medians and means), but not other self-employed workers. But three other studies (Fairlie
2005, Hartog et al. 2010, and Van Praag et al. 2013) which also analyze the NLSY data report
higher means and medians for self-employed earnings overall, relative to employee earnings.
To overcome the issues associated with earnings data, a recent stream of work examines
expenditures. For example, Pissarides and Weber (1989) analyze data on household expendi-
tures and find that the self-employed are likely to under-report their earnings in Britain. This
suggests that traditional measures of entrepreneurs’ incomes are downwardly biased. Hurst,
Li and Pugsley (2014) analyze data from the U.S. Consumer Expenditure Survey and Panel
Study of Income Dynamics and establish that the self-employed under-report their income in
household surveys by about 25 percent. Similarly, using 38 years of longitudinal data, Sarada
(2016) finds that while self-employed individuals (mis)report earning 26.2% less, their house-
hold expenditures are 4.5 percent higher than the traditionally employed’s. This expenditure
premium accrues with longer experience in self-employment and is not offset by lower savings
or higher uncertainty, implying that entrepreneurs earn more than their salaried counterparts.
Connections to the Present Study. Our theories leverage the interaction of disposition
and context as drivers of entrepreneurship. Although intrinsic ability (disposition) determines
a worker’s entrepreneurial potential, stochastic signals and their workplace interpretation (con-
text) generate the informational asymmetries which spur the choice. Likewise relative levels
of innate ability and acquired skills (disposition) determine a worker’s comparative advantage
in wage work vis-à-vis entrepreneurship, but informational imperfections (context) determine
whether he finds optimal occupation. Hence we provide two nuanced bridges between disposi-
7
Electronic copy available at: https://ssrn.com/abstract=2596846
Entrepreneurship
tional and contextual approaches.3
Asymmetric information rationalizes observations from the employee mobility literature.
The disagreements, frictions and underutilized knowledge which push employees to leave suggest
asymmetric information– employees who perceive opportunities or capabilities (perhaps their
own) overlooked by their employers can exploit these outside the firm as entrepreneurs.
Although related to the ability-job matching models above, our asymmetric information
theory casts entrepreneurial choice as neither a function of ability nor the imperfect signal of
it (e.g. education) per se– but rather the wedge between them. Since our model is distinctly
agnostic about the distribution of ability and only lightly restricts the functional form of pro-
ductivity, we cannot generically relate ability or education to entrepreneurship, as others do.4
Instead whenever the difference between an individual’s ability and signal is high, the resulting
gap between productivity and wage drives him to choose residual claimancy as an entrepreneur.
The empirical tests associated with other models in this class measure ability using educational
pedigree– ours leverage the difference between that publicly observable ability proxy and a
privately administered aptitude test, invisible to the labor market. Hence, both our asymmet-
ric information theory and empirical tests complement rather than challenge extant studies
connecting education/ability and entrepreneurship.5
While the economics literature has discussed asymmetric information (Akerlof, 1970; Spence
1973) and comparative advantage (Roy 1951; Jovanovic 1979) for decades neither has been used
to offer an integrated explanation for entrepreneurial choice and income. Exhibit 1 graphically
depicts the relationship of our study to some of the distinct literature streams described here.
Exhibit 1 here
3 Theory
In this section we present two distinct theories of entrepreneurial choice: the first, driven
by asymmetric information about worker ability, the second, by innate ability’s comparative
3See also Aldrich and Fiol 1994; Klepper, 2007; Pontikes and Barnett, 2017, for studies examining theinterplay between dispositional and contextual factors in shaping occupational choice.
4The technical assumptions we impose to simply allow firms to survive even with adversely selected employees.5Our comparative advantage theory more closely resembles extant ability-job matching models– as informa-
tion imperfections resolve individuals sort into the occupation where their specific ability-education vector ismost productive. That is, fit between workers’multidimensional skills and job requirements drive the match.However, like other ability-job matching models the functional form of production matters– our comparativeadvantage theory requires that innate ability be more productive than education in entrepreneurship vis-à-viswage work– an assumption that we, ultimately, cannot empirically verify in our sample.
8
Electronic copy available at: https://ssrn.com/abstract=2596846
Entrepreneurship
advantage relative to that of acquired skills in entrepreneurship vis-à-vis wage work. However,
for parsimony, we do not present both theories in equal detail. Since our theory of asymmetric
information is the most novel, we present it first and in the greatest generality and rigor.
Because the concepts behind our theory of comparative advantage are more familiar, we only
describe it verbally in the main text, reserving a stylized formalization to Appendix A. In their
static forms, these theories generate similar empirical predictions. So, we extend both, again
verbally in the main text and formally in Appendix A, to include the resolution of imperfect
information about innate worker ability over time. Adding this dynamism produces opposing
hypotheses in the two theories, and we use these to empirically adjudicate between them.
3.1 Asymmetric Information
Our asymmetric information theory of entrepreneurial choice applies Akerlof’s (1970) “market
for lemons”to labor. Workers are both the more informed sellers and the traded good, while
employers are the less informed buyers. Employers offer wages based on observable signals,
but to the extent that better informed workers believe their ability exceeds the labor market’s
estimate of it, they prefer entrepreneurship, where they will be residual claimant of their talents.
In the vernacular, cherries become entrepreneurs and employees are lemons.
3.1.1 Intuition
A more detailed intuition is as follows. Suppose workers and firms are motivated solely by
money. Workers’productivity depends on unobservable traits, collectively called ability. Al-
though potential employers cannot observe workers’ability, they see a public, albeit noisy, signal
of it. Employers base wage offers solely on this signal. Theoretically, this signal is a composite,
comprised of a worker’s educational pedigree, verifiable accomplishments and experience, the
way he speaks, writes, looks and carries himself, anything observable. Critically, the signal (1)
does not perfectly reveal ability and (2) is the prevailing determinant of starting wages.6
When a worker accepts a wage offer, the hiring firm keeps his productivity minus his wage.
The firm is the residual claimant, keeping what is left after all factors of production have been
remunerated. However, the worker could reject all offers to become the residual claimant of
6We implicitly assume that an employer will not (quickly) update the wage to reflect true ability after hiringthe worker, perhaps because the random or complex nature of production obscures the ability of individualemployees in a team, or because even if an employer learned exactly how able her employee was, she only needsto pay as much as other employers, who lack her private information, would offer to prevent him from changingemployers (Alchian and Demsetz, 1972).
9
Electronic copy available at: https://ssrn.com/abstract=2596846
Entrepreneurship
his own productivity– an entrepreneur. The worker will do so whenever he believes that his
productivity exceeds the prevailing wage for his signal, since this will yield higher income.
The central predictions of our theory arise from asymmetric information about worker abil-
ity. As an approximation, we assume workers perfectly know their own ability. Appendix A.1.4
contains an extension where the worker is also unsure about his ability. When workers know
their own ability, then, among all workers with a given observable signal, those whose privately
known ability is less than the wage associated with that signal will accept employment, and all
whose ability exceeds the wage will become entrepreneurs.
The next section formalizes our theory of asymmetric information driven entrepreneurial
choice, makes the assumptions behind the above verbal argument explicit, and derives our
primary empirical hypotheses. We relegate all proofs to Appendix A.6 for clarity.
3.1.2 Formal Model
Individuals have privately known ability θ ∈[θ, θ]and publicly observable signal of it S ∈
[S, S
]distributed such that the posterior density of ability F ′ (θ|S) has full support over
[θ, θ]for all
S. To guarantee that higher signals beget higher equilibrium wage offers, we assume that the
monotone-likelihood-ratio-property (MLRP) strictly holds: for all θh > θl and Sl < Sh7
F ′ (θh|Sh)F ′ (θh|Sl)
>F ′ (θl|Sh)F ′ (θl|Sl)
An individual chooses to work either as an entrepreneur, where he produces θ (i.e. normal-
ized to his ability) and keeps all of his produce, or accepts wage work at a firm.8 Individual
productivity in a firm equals π (θ), finite and increasing in its argument. A (single) firm makes
take-it-or-leave-it wage offers w (S) to all individuals with signal S.
We make two regularity assumptions to guarantee optimal wages equalize marginal rev-
enues and marginal costs: (1) F (θ|S) is log-concave for all S, and (2) π (θ) exhibits weakly
decreasing differences with respect to θ (i.e. for all θ, (π (θ)− θ)′ ≤ 0). Virtually all probability
distributions commonly used in theoretical economics are log-concave.9 The latter assumption
7The MLRP means that observing any two individuals with signal S′ and S′′ such that S′ < S′′ andhypothesizing any two ability levels θ′ and θ′′ such that θ′ < θ′′, it is more likely that the higher ability θ′′
belongs to the individual with the higher signal S′′.8For parsimony we assume that entrepreneurs derive no benefit from signals. So long as the importance of
signaling is less in entrepreneurship than in wage work, this simplication is unrestrictive.9For example, Uniform, Normal, Exponential, Logistic, Extreme Value, Laplace, Power Function, Weibull,
Gamma, Chi-Squared (c ≥ 2), Chi (c ≥ 1), Beta (ν ≥ 1, ω ≥ 1), Maxwell, Rayleigh, Pareto, and Lognormaldistributions have log-concave cdfs (Bagnoli and Bergstrom 2005).
10
Electronic copy available at: https://ssrn.com/abstract=2596846
Entrepreneurship
means incrementally increasing an individual’s innate ability will not improve his productivity
as a wage worker more than his productivity as an entrepreneur. It could still be the case
that all individuals are more productive as employees than as entrepreneurs. Although these
assumptions guarantee that the firm’s wage setting problem is well-behaved (i.e., the second
order condition is satisfied for all critical points), they are stronger than necessary and not used
for any other purpose in the model.10
Two additional assumptions ensure that the equilibrium separates workers; i.e., both entre-
preneurship and traditional employment coexist. In order for traditional employment to exist,
traditional employment must be more productive than entrepreneurship over at least some abil-
ity range.11 So, to guarantee that the firm can profitably make at least one offer that will be
accepted by some individual, we assume that the least able individuals are more productive in
the firm (i.e. π (θ) > θ). To ensure that the firm cannot profitably entice everyone to join the
firm, we assume that extremely high ability, regardless of signal, is vanishingly rare– in par-
ticular, limθ→θ F′ (θ|S) = 0, at least for some S. Again, as we explain in Appendix A.6, these
conditions guarantee separation, but other reasonable alternative assumptions would suffi ce.
3.1.3 Analysis
Individuals with signal S reject traditional employment if and only if their entrepreneurial
outside option (ability) strictly exceeds the firm’s offer of w (S). Thus, for every signal S, the
firm chooses a wage w to solve
maxw
∫ w
θ
(π (θ)− w) dF (θ|S)
yielding a first-order-condition (FOC) for every signal S
(π (w)− w)F ′ (w|S) = F (w|S) (1)
such that the marginal benefit of attracting employees with ability θ = w and signal S (LHS
of (1)) equals the cost of raising the wages of all less able employees with signal S (RHS of
10For tight, but perhaps less intuitive, conditions for the second order condition to hold, see equation (5) inthe proof of Lemma 4 in Appendix A.6.11Without this assumption “lemons unravelling” in employment can occur. To see this, suppose employees
were exactly as productive inside the firm as outside (i.e., π (θ) = θ). For any wage offer w, individuals acceptingthe offer will have ability in the range [θ, w] and average productivity strictly less than w. Since the firm paysall the accepting workers w, such a high offer is clearly unprofitable. The firm may reduce the wage but thenthe most talented individuals who accepted before will now reject and the problem remains– no matter whatthe firm offers, the wage will always exceed the average productivity of those who accept.
11
Electronic copy available at: https://ssrn.com/abstract=2596846
Entrepreneurship
(1)). The (continuous) set of these solutions over the domain of Ss constitute a wage function
w (S) . Under our regularity assumptions, the firm’s problem is well-behaved:
Lemma 1 An interior, separating equilibrium exists, in which positive measures of individuals
choose entrepreneurship and traditional employment.
Since all individuals with signal S and ability strictly greater than w (S) choose entrepre-
neurship, and all with weakly lower ability choose employment, the following is immediate:
Proposition 1 Entrepreneurs are more able than employees of the same signal S.
Also observe that all employees with a given signal earn the same wage, despite the fact
that they have a range of abilities, whereas, since entrepreneurs earn according to their ability,
their incomes are not only higher but exhibit greater spread. That is,
Corollary 1 The incomes of entrepreneurs have higher median and variance than those of
employees of the same signal.
Note that while we have no reason to reject the common notion that entrepreneurship is
risky, the logic of Corollary 1 shows venture uncertainty is not required to create greater variance
in entrepreneurial incomes than in wages.
Proposition 1’s simplicity stems from the fact that for every signal level the unique minimum
ability of entrepreneurs coincides with the unique maximum ability of employees. Before making
the analogous argument for signals, we prove an intuitive property equilibrium wages:
Lemma 2 Wages strictly increase in signal (i.e., w′ (S) > 0).
Since MLRP implies that (unconditional on occupational choice) a higher pedigree always
probabilistically indicates higher ability, and productivity increases in ability, equilibrium wages
intuitively increase in signal. Because wages increase in signal, someone who would accept the
offer to individuals with signal S would accept all offers to individuals with higher signals. More
formally, monotonicity implies w (S) is invertible, and w−1 (θ) is the minimum signal, for which
the firm makes an offer that a θ ability individual would accept. Of course, the firm might not
make any offers which entice the most able workers. Similarly, there may be very low ability
individuals who would accept any offer the firms makes. Therefore, the following is immediate:
Proposition 2 Employees have better signals than entrepreneurs of the same ability θ (if there
exist θ able individuals engaged in both occupations).
12
Electronic copy available at: https://ssrn.com/abstract=2596846
Entrepreneurship
In developing the intuition for Proposition 1, we framed the question of occupational choice
as, “Given my entrepreneurial productivity, what minimum wage would I need to keep me from
entrepreneurship?”Since each signal induces a different wage, signals can be ordered according
to their associated wages, and every worker could equivalently ask, “Given my entrepreneurial
productivity, what minimum signal would I need to keep me from entrepreneurship?”Hence,
at every ability level, there exists a threshold signal, such that those whose signal exceeds that
threshold will receive an acceptable offer; those whose signal lies below the threshold will not–
they open their own business. This is the essence of Proposition 2. Figure 1 depicts the joint
sample space of ability and signal.12 It graphically illustrates Propositions 1 and 2.
Figure 1 here
For several reasons, the conclusions of the model are sharper than should be expected
empirically. First, own true productive ability is not really known to every worker, much less
the empiricist. Neither does the empiricist have access to the complete set of signals observable
to the labor market. The empiricist is limited to noisy proxies of these fundamental variables
of the model. Furthermore, the model does not capture all of the many factors that determine
occupational choice and earnings, just one– asymmetric information over ability. Hence, one
should not expect the predictions of Propositions 1, 2 and Corollary 1 to hold for every single
individual in the real world. Nevertheless, taken as average effects, these results form our
primary hypotheses that we empirically test.
H1: Entrepreneurs are more able than employees of the same signal, on average.
H2: Employees have better signals than entrepreneurs of the same ability, on average.
H3: The incomes of entrepreneurs have higher median (mean) and variance than those of
employees of the same signal.
3.1.4 Robustness
In Appendix A.1 we extend the model in four ways: Particularly, relevant when formal education
signals ability, we allow (1) workers to exert effort endogenously acquiring signals and (2)
signals to be productive. The model is also robust to allowing (3) entrepreneurship itself to
signal ability and (4) workers to be uncertain about their own ability. (5) We defer the model’s
further implications in a dynamic setting until Section 3.3.2.
In the next subsection we present an alternative theory of entrepreneurial choice.12The figure shows the joint sample space of ability and signal but does not their depict joint density or require
it. This is the key both to the theory’s generality and why its predictions over ability or signal are only conditionalon the other attribute– making unconditional predictions requires stronger distributional assumptions.
13
Electronic copy available at: https://ssrn.com/abstract=2596846
Entrepreneurship
3.2 Comparative Advantage
Roy (1951) argued that when individuals have heterogeneous abilities across varying tasks, they
sort into occupations where they have a comparative advantage. Could such a job-matching
model over multidimensional skills deliver our previously outlined predictions as well, without
the need for asymmetric information?
If innate ability is relatively more productive in entrepreneurship and formal education is
relatively more productive in wage work, then, by and large, it can. Under this assumption
and perfect information about ability, individuals sort into occupations where they are most
productive: (1) Fix an innate ability level, and above the threshold education level where com-
parative advantage favors wage work, all individuals become employees, while the less educated
become entrepreneurs. (2) Similarly, fix a level of education, and above some threshold, higher
ability individuals follow their comparative advantage into entrepreneurship, while the less able
accept wage offers. (3) Furthermore, assuming that higher levels of innate ability are productive
in both occupations, then, given education, these smart entrepreneurs will earn more– that is,
after all, why they chose the profession. Of course, if the direction of comparative advantage
were reversed, then matching would deliver exactly the opposite predictions. Furthermore, we
cannot generically say anything definitive about the relative variance of earnings in the two
professions under comparative advantage based job-matching, though, because if ability is ob-
served, then rather than all employees with a common level of education earning the same wage
(as in our model of asymmetric information), a wage contract can be written over both innate
ability and education. Hence, income variance depends on the interplay of the two attributes’
joint distribution and the production functions. The difference, though, between the empirical
implications of the two theories become much starker, when considered in a dynamic setting.
3.3 Information Frictions and Dynamics
3.3.1 Comparative Advantage
If ability and education were perfectly observable, then, under the comparative advantage
based job-matching explanation above, their relative influence on income should not change in
either occupation over time. But plausibly, both workers and employers must learn workers’
ability over time– imperfect information could be symmetric (see e.g., Jovanovic 1979). Sup-
pose that comparative advantage runs in the required direction, and that early in individuals’
careers, education is the primary indicator of innate ability– if workers of a given education
were more productive in entrepreneurship on average, then such educated individuals would
14
Electronic copy available at: https://ssrn.com/abstract=2596846
Entrepreneurship
gravitate towards entrepreneurship, and if not, those with these specific credentials would pre-
fer wage offers. But, because information about ability is imperfect, many would be in the
“wrong”occupation– entrepreneurs with particularly low innate ability (conditional on educa-
tion) would produce more as employees, and conversely employees with relatively high ability
(conditional on education) would be more productive running their own business. Thus, our
basic empirical predictions would hold, but misplaced workers would weaken them. Over time
though, both employers and workers receive more (symmetric) signals about workers’innate
abilities, wages adjust to reflect not just education but the entire signal history, many discover
they are (probably) in the wrong profession and switch. Individuals continue to choose the
occupation where workers with signal sets just like their own are most productive on average,
but as information about workers’innate ability improves, fewer are misplaced– the occupa-
tional match improves with the gradual revelation of information. Said differently, comparative
advantage driven job-matching implies that evidence for H1 becomes stronger over time.
We formalize the static and dynamic comparative advantage based job-matching model with
symmetric, imperfect information over worker ability in Appendices A.2 and A.3, respectively.
3.3.2 Asymmetric Information
Notice that by amending the matching model above, such that the worker knows his ability from
the outset but the manager continues to learn it over time, it become a dynamic asymmetric
information model, albeit less general than the one presented in Section 3.1.2. This asymmetric
information setup reverses the dynamic effect relative to the comparative advantage setup
with imperfect information– the ability gap between entrepreneurs and employees of a given
education, while remaining consistently positive, diminishes over time. We formalize this model
and explain our numerical solutions to it in Appendix A.4.13
The intuition is as follows. Asymmetric information about worker ability is highest at the
beginning of a worker’s career, when he has no documentable experience or output. This may
force a worker, who knows he would be more productive in the right position inside a firm but
has a relatively poor public signal, to adversely select into entrepreneurship, so that he can
keep his productivity, instead of accepting an even less desirable wage. This is why, unlike in
job-matching, asymmetric information’s empirical predictions do not depend on the direction
13Observe that the firm must compute a new wage for each education level and signal history in each period.Further, unlike in the symmetric comparative advantage model with imperfect information, the firm must alsoconsider the strategic actions of better informed workers in making the offers. This complexity places a generalanalytical solution beyond the scope of this paper, and we rely instead, on numeric solutions under various abilitydistributions and specific signaling technologies. These yield qualitatively consistent results (see Appendix A.4).
15
Electronic copy available at: https://ssrn.com/abstract=2596846
Entrepreneurship
of comparative advantage (see the numerical example in Appendix A.5). Over time, though,
employers get more information about a worker’s ability than just education. Empirically this
will manifest as wages becoming increasing driven by ability, conditional on education– the
manager is still rewarding observable signals of ability, but this myriad is invisible to the em-
piricist. Furthermore, as ability is revealed to employers, adverse selection into entrepreneurship
diminishes, causing the predictions of the asymmetric information model to soften over time.
Those that chose entrepreneurship later in life are much more likely to do for other reasons
than that the labor market cannot see their productive talents.
To summarize, we can use the following testable implications to adjudicate whether the
patterns in our data are a consequence of comparative advantage or asymmetric information.
H4: Under matching (asymmetric information) and holding education constant, the positive
difference between entrepreneurial and employee ability increases (decreases) as information
imperfection resolves over time.
H5: Matching requires that ability have a relatively stronger influence on entrepreneurial
earnings and education is a relatively stronger driver of earnings for wage employees. (Asym-
metric information does not depend on the direction of comparative advantage.)
H6: Asymmetric information predicts that the positive correlation of wages to ability, con-
ditional on education, will strengthen over time for wage employees. (Such a pattern may also
hold under matching with imperfect information under some conditions.)
We summarize the key assumptions, fundamental forces, and generated hypotheses from
both our asymmetric and comparative advantage theories of entrepreneurial choice, in both
their static and dynamic forms, in Exhibit 2.
Exhibit 2 here
4 Empirical Analysis
4.1 NLSY Sample and Variables
We test our hypotheses using data from the U.S. National Longitudinal Survey of Youth 1979
(NLSY). The NLSY follows the lives of 12,686 men and women, who were 15-22 years old when
first surveyed in 1979. These individuals were interviewed every year until 1994, and biennially
thereafter, producing a 24-period panel till 2010, when respondents were 46-53 years old. The
NLSY panel thus provides continuous employment and income history for each subject over
a majority of his/her career, as well as detailed information on the subject’s personality and
16
Electronic copy available at: https://ssrn.com/abstract=2596846
Entrepreneurship
socioeconomic characteristics. The sample has been extensively used in labor economics to
study educational attainment and earnings dynamics (see, e.g., Cameron and Heckman 2001,
or Altonji, Bharadwaj and Lange 2012).
The NLSY was designed to represent the population of youth residing in the U.S. on January
1, 1979. Of the 12,686 original participants, 6,111 belonged to a sample representative of the
civilian U.S. youth population in 1979. Another 5,295 individuals belonged to a supplemental
sample of civilian Hispanic or Latino, black, and economically disadvantaged non-black/non-
Hispanic respondents living in the U.S. in 1979. A further 1,280 respondents represented the
U.S. military population as of September 30, 1978. Following 1984, 1,079 members of the
military sample were no longer eligible for interview, leaving only 201 randomly selected military
respondents. Following 1990, none of the 1,643 members of the economically disadvantaged,
non-black/non-Hispanic sample were interviewed. Thus, by 1991, only 78.5 percent of the
sample (9,964 individuals) remained.14 Annual attrition, primarily due to death and emigration,
left 7,757 survivors by 2010, the last year in our study.15 We limit the sample to individuals
who worked full-time (i.e., more than 35 hours/week on average), either as an employee or self-
employed in at least one NLSY round between 1979 and 2010. Then, from each survey round, we
collect information on the individuals’employment records, educational qualifications, family
background, cognitive and non-cognitive ability test scores, income, and wealth.
We measure workers’cognitive ability through their age-adjusted Armed Forces Qualifica-
tion Test (AFQT) Score, a composite derived from the Armed Services Vocational Aptitude
Battery which includes tests on Arithmetic Reasoning, Math Knowledge, Word Knowledge,
and Paragraph Comprehension. In this, we follow in a long tradition, both in the military and
scholarly research, of using AFQT as a measure of cognitive ability or intelligence (e.g., Griliches
and Mason 1972, Carneiro and Heckman 2002, Iyer et al. 2015, Levine and Rubinstein 2017).
Workers’signals are measured by their educational qualifications, captured by their years of ed-
ucation or highest degree obtained, consistent with previous work at least since Spence (1973).
Exhibit 3 describes these and other control variables used in our empirical analyses.
Exhibit 3 here
Several papers before ours have identified the existence of asymmetric information between
employees and employers using the same NLSY data and AFQTmeasure for ability as our study
14The surveying agency dropped a segment of the military subsample due to interviewing diffi culties andstopped interviewing a large subsample of the disadvantaged due to funding cutbacks.15As of 2010, 573 main respondents (5.8 percent of the respondents eligible for interview) had been reported
as deceased. See https://www.nlsinfo.org/content/cohorts/nlsy79
17
Electronic copy available at: https://ssrn.com/abstract=2596846
Entrepreneurship
(e.g., Kahn 2013, Schönberg 2007). Altonji and Pierret (2001) interpret increasing returns to
AFQT scores among the wage employed over time as evidence for the presence of asymmetric
information and its resolution over time for wage workers. Hence, the existence of asymmetric
information over worker ability is well established in the literature.
We derive a single measure of the extent of a worker’s advantage in entrepreneurship relative
to wage work, under either theory– we refer to it as entrepreneurial advantage. Consider first,
the asymmetric information explanation. It is reasonable that an employer, observing a job
candidate’s level of education, attributes to him the median ability for all individuals with that
particular qualification. Hence, we measure entrepreneurial advantage as difference between
each individual’s AFQT score and the median AFQT score for those sharing the individual’s
educational qualification. This measure can be positive, indicating that the employer will likely
underestimate the worker’s ability, or negative indicating a probable overestimate. Turning
to the comparative advantage explanation, this measure captures the productivity difference a
worker would have in entrepreneurship, relative to others with the same education.
4.1.1 Summary Statistics
Our final estimation sample is an unbalanced panel with 176,379 person-year observations on
11,476 unique individuals.16 Of these, 7.1 percent of the observations are on self-employed
individuals and the rest earn wages as employees. 1.2 percent of the sample’s person-year
observations are on self-employed individuals with incorporated businesses.
Table 1 here
Table 1 presents summary statistics for the variables in this sample. Some variables (e.g.,
individuals’cognitive and non-cognitive test scores, and parental education) have no within-
individual variation across survey rounds, some variables have limited variation (e.g., indi-
viduals’ educational qualifications increase during youth but stabilize after age 30), while
employment related variables (e.g., annual income) vary over time. For the average person-
year, self-employed individuals have higher ability scores than salaried workers (AFQT score
of 45.4 versus 43.4), comparable educational qualifications (12.9 years versus 12.8 years of
school), higher annual incomes ($90,985 versus $61,954) and higher net-worth ($237,090 ver-
sus $83,704).17 Self-employed workers also have larger gaps between their ability and signals,
16Table B1 of Appendix B provides information on the number of unique individuals in full-time employment,and the fraction of individuals in self-employment, during each round of NLSY79 between 1979 and 2010.17Table B2 of Appendix B shows that self-employed individuals scored higher, on average, than salaried
individuals on several other tests of general intelligence, such as the PSAT, SAT, and ACT tests. We found
18
Electronic copy available at: https://ssrn.com/abstract=2596846
Entrepreneurship
indicative of higher asymmetric information, relative to wage workers. On average, the self-
employed are more likely to be male, white, born abroad, older, more risk-loving, sociable, have
higher self-esteem and come from more wealthy families. As reported by Levine and Rubinstein
(2017), self-employed individuals who own incorporated businesses appear to be a class of their
own– they have higher ability scores, higher educational qualifications but also the largest gap
between their ability and education (indicative of high asymmetric information about their
cognitive ability) relative to other workers. Incorporated entrepreneurs also earn much more
and have substantially larger wealth than salaried and other self-employed workers.
4.2 Descriptive Evidence
4.2.1 Unconditional relationships
Our theory predicts that entrepreneurs’ability and income exceeds employees’conditional on
observable signals, but their signals fall short conditional on ability. The summary statistics
suggest that entrepreneurs have higher ability and lower educational qualifications, even uncon-
ditionally, which of course, our theory does not preclude.18 In Appendix B, we examine the full
distributions of ability scores, income and net worth for salaried workers and entrepreneurs.19
The figures confirm that outliers do not drive our findings regarding ability and wealth differ-
ences between wage workers and entrepreneurs. This provides evidence contrary to the popular
notion that entrepreneurs’are outliers and that their ability and earnings concentrate at both
tails of the corresponding population distributions.
Next, we turn to testing the conditional predictions of our theory.
4.2.2 Conditional relationships
Figure 2 here
Figure 2 presents descriptive evidence for conditional H1– for every level of formal education
other than Master’s degree, entrepreneurs have higher median AFQT scores than employees.
Figure 3 here
this result quite striking, since these tests are used to secure entry into higher education, and, as we will showbelow, entrepreneurs systematically have lower educational qualifications.18Although H1 and H3 hold at every signal level and H2 holds at every ability level, guaranteeing that they
hold unconditionally requires additional assumptions on the joint ability-signal distribution.19Figure B1 of Appendix B plots the cumulative densities of AFQT scores for the self-employed and employees.
Figure B2 plots the kernel density of log annual household income (Panel A) and household net-worth (PanelB) for the salaried employees versus the self-employed.
19
Electronic copy available at: https://ssrn.com/abstract=2596846
Entrepreneurship
The second part of H3 states that entrepreneurs’ incomes exhibit higher variance than
the incomes of their employed counterparts. Figure 3 presents the distributions of income and
wealth as box plots for entrepreneurs and employees, conditional on the highest academic degree
obtained. The boxes span the 25th to 75th percentiles, the horizontal bar in each denotes the
median, while the whiskers extend from the 5th to 95th percentiles. Panel A shows that the
median income and the income variance of entrepreneurs exceeds that of employees at all levels
of education. Panel B shows that this pattern also holds in the wealth distributions.
The above evidence suggests that entrepreneurs generally have higher ability scores and
higher earnings with greater variance at most education levels.
Could these findings be driven by biased sample attrition? In particular, might espe-
cially low ability, hence low-earning, self-employed workers fall into unemployment or part-time
employment—and thus, out of our sample—more than low ability wage workers? Table B3 in Ap-
pendix B shows that self-employed workers are slightly more likely than salaried workers to drop
out of full-time work during a subsequent year in our panel (12.9 percent versus 10.7 percent).
However, the self-employed who drop out have, on average, higher AFQT scores, comparable
years of education, and higher incomes, relative to the salaried workers who drop out. These
relative patterns, preserved in the sample of survivors, compare to those from our full panel
of worker-years reported in Table 1. Thus, we conclude that attrition bias does not drive our
descriptive findings on the relative differences between salaried workers and self-employed.
Appendix C describes and analyzes a secondary dataset, the U.K. National Childhood De-
velopment Study (NCDS) of 1958. The NCDS sample covers the population of U.K. residents
born in a specific week in 1958. Since each subsequent survey round, conducted four-to-eight
years apart, focuses on different attributes, our analysis is primarily cross-sectional. Neverthe-
less, the descriptive findings from the NCDS sample qualitatively mirror those from the NLSY
sample– entrepreneurs had scored higher on cognitive ability tests in primary school, both un-
conditionally and conditional on educational attainment, and median entrepreneurs’ income
exceeds that of wage earners’, with higher variance, at most educational levels.
4.3 Regression Analysis
In this section, we test our hypotheses using multivariate regressions. Our first set of regressions
estimate the probability that an individual is self-employed as a function of ability, educational
qualifications, and our entrepreneurial advantage metric. The second set of regressions estimate
annual income and net-worth as a function of occupational choice (self-employed or salaried)
20
Electronic copy available at: https://ssrn.com/abstract=2596846
Entrepreneurship
and educational qualifications. Both sets control for demographic, attitudinal and background
influences that may affect our outcomes of interest and the main explanatory variables.
4.3.1 Ability and Education
Table 2 here
Table 2 presents Linear Probability Model (LPM) regression estimates that test H1 and
H2.20 Column 1 shows our baseline regression model with no other controls and estimates that
a one percent change in workers’ability score increases the probability of entrepreneurship by
0.4 percent (p = 0.04), relative to the 7.1 percent unconditional probability of being an entre-
preneur. A one percent increase in the years of education appears to decrease the probability of
entrepreneurship by 0.5 percent (p = 0.57). Column 2 shows that adding a battery of control
variables specified in Table 1 to the model increases the estimated effect of a percent change
in AFQT score on the probability of entrepreneurship to 0.6 percent (p = 0.01). Further, the
estimated effect of a percentage increase in education falls to a 5.2 percent reduction in the
probability of self-employment (p = 0.01).21 Column 3 confirms that measuring signals by the
worker’s highest degree (by including a dummy variable for each of the possible educational
degrees) rather than as the number of years of education yields qualitatively similar estimates.22
Column 4 reveals a statistically significant positive relationship between our entrepreneur-
ial advantage measure and the probability of entrepreneurship. A unit increase in this gap,
which can be interpreted as the individual having a one percentile higher AFQT score than the
median score for the individual’s educational qualification, increases the probability of entre-
preneurship by 0.02 percent (p = 0.01). This estimated effect size translates to a 0.02 standard
deviation increase in the probability of self-employment for a one standard deviation increase
in the worker’s ability-education gap. Column 5 incorporates person fixed effects and reveals
that a one percent within-worker increase in education decreases the worker’s probability of
entrepreneurship by nearly 10 percent (p = 0.01). This model cannot identify the effect of
ability scores on entrepreneurship since the scores remain fixed for each worker in our sample.
20We report LPM estimates for all models with binary dependent variables due to the ease of interpretingthe corresponding coeffi cients, but ensure the robustness of all our results with Probit estimations.21Column 1 of Table B4 of Appendix B reports estimated effects of all controls– risk tolerant, more outgoing
individuals, those with highly educated mothers, and greater wealth are more likely to become entrepreneurs.22Table B5 of Appendix B shows that the results are also robust to controlling for the ranking of the college
or university the worker obtained his highest degree from. The negative coeffi cient (p = 0.02) on College Tierindicates that controlling for all else, the self-employed graduate from lower tiered colleges, which is consistentwith Proposition 2, because college rank imperfectly signals a graduate’s ability.
21
Electronic copy available at: https://ssrn.com/abstract=2596846
Entrepreneurship
In all models, the estimated negative relationship between education and entrepreneurship
includes both the effects of exogenously assigned credentials and of endogenously acquired
education. In other words, the estimates do not rule out that individuals may decide to become
entrepreneurs and thus choose to forgo higher educational qualifications. The objective of our
study is to examine how ability and education influence selection into entrepreneurship. To
the extent that high ability individuals forgo the next level of education because they correctly
expect their future productivity will be higher than the market can infer from their educational
signal, this endogenous mechanism is consistent with our explanation.23
Next, we examine how the gap between ability and education affects worker choice among (i)
wage employment, (ii) self-employment in an unincorporated business, and (iii) self-employment
in an incorporated business. We estimate worker choice as a function of explanatory and control
variables using a multinomial logit model and report the corresponding results in Table 3. The
reference, and thus omitted, class in these regressions is wage employment.
Table 3 here
Column 1 of Table 3 shows unincorporated entrepreneurs have higher ability and lower ed-
ucation, as suggested by our theories, but that incorporated entrepreneurs have higher ability
and higher education than the wage employed, holding other variables constant. Nevertheless,
it is the gap between a worker’s ability and his signal that best captures asymmetric infor-
mation or comparative advantage, and Column 2 shows a positive relationship between our
entrepreneurial advantage measure and unincorporated entrepreneurship (p ≈ 0.00), and a null
relationship between entrepreneurial advantage and incorporated entrepreneurship (p = .56).
Most incorporated entrepreneurs start as unincorporated entrepreneurs or wage workers and
the share of incorporated entrepreneurs in the sample increases with worker age. Hence, testing
our hypotheses in a subsample of workers for whom the choice among the three occupational
states is meaningful (that is, workers above a certain threshold age, which we arbitrarily picked
to be 32 years) as in Columns 3 and 4 confirms a positive and statistically significant effect of
ability and entrepreneurial advantage on the choice of both incorporated and unincorporated
entrepreneurship. This finding is consistent with the result in Levine and Rubinstein (2017)
that incorporated entrepreneurs are “smart”(that is, have scored higher than wage workers on
23Table B6 of Appendix B suggests that the effect of asymmetric information on entrepreneurship is highestat lower educational levels (barring for the “no high-school”category). It is possible the endogenous acquisitionof signals leads high ability individuals to forgo higher education, leading to a deepening of the ability-signalgap for entrepreneurs with low educational qualifications.
22
Electronic copy available at: https://ssrn.com/abstract=2596846
Entrepreneurship
ability tests) but have other negative signals (in their paper, a history of “illicit”activities) to
counteract the positive signaling effect of their education.
4.3.2 Earnings
Table 4 here
H3 predicts that entrepreneurs earn higher incomes than employees, conditional on signals.
Table 4 reports quantile regression estimates of the effects of independent variables on annual
income and net-worth.24 Column 1 of Table 4 shows that, holding constant other variables that
affect income, including education, self-employed individuals have an earnings advantage of 7.3
percent (p ≈ 0.00).25 Columns 2 and 3 show that unincorporated and incorporated business
owners earn 2 percent (p = 0.09) and 30.7 percent (p ≈ 0.00) more than employees, respectively.
Next, we examine whether the same person enjoys higher earnings as an entrepreneur than
as a wage worker. That is, we estimate an individual fixed-effects model with log annual in-
come as the dependent variable and self-employed as the independent variable of interest. In
addition, to examine the effect of the gap between ability and education on entrepreneurial
earnings, we interact the self-employed indicator with our entrepreneurial advantage measure
(AFQT - median AFQT for the focal individual’s educational level). This specification allows
us to hold unobserved heterogeneity across individuals’constant and investigate how earnings
of the same person responds to entrepreneurship driven by the gap between ability and edu-
cation. Less than 3 percent of wage employees switch to entrepreneurship in any given year
and there is no within-individual variation in the cognitive and non-cognitive characteristics of
individuals. This restricts identification of asymmetric information or comparative advantage
to stem from within-person occupational switches and changes in education after the worker
started her career.26 Nevertheless, the corresponding estimates, reported in Column 4, reveal
that the interaction term of self-employment and entrepreneurial advantage is positively related
to annual income (p = 0.06). Although the effect sizes seem small at first glance, the estimates
imply a one percentile point increase in the individual’s AFQT score above the corresponding
24We estimate quantile regressions since they are known to provide more robust estimates in the presenceof outliers than OLS regressions, and both the annual income and net-worth variables in our sample can beexpected to have outliers. Tables B7 and B8 show that the results are reasonably robust to OLS regressions,particularly in a subsample of younger workers, for who we expect asymmetric information to be highest.25Columns 2 and 3 of Table B4 in Appendix B report estimated effects of all control variables on workers’
income and net-worth– sociability, self-mastery, self-esteem, entrepreneurial and educated parents and wealthendowments all have a positive effect on workers’income and wealth.26It is possible this constraint placed by the fixed-effects model accounts for the somewhat large estimate of
the effect of the main education variable seen in Columns 4 and 8.
23
Electronic copy available at: https://ssrn.com/abstract=2596846
Entrepreneurship
signal’s median, is associated with a 0.1 percent increase in annual income providing further
confirmatory evidence for H3.
Several recent papers establish that entrepreneurs tend to underreport their incomes, and
consumption data or household wealth data more accurately capture their financial status (e.g.,
Pissarides andWeber 1989, Hurst, Li and Pugsley 2014, and Sarada 2016). Hence, we repeat our
analysis using households’net-worth as the outcome variable. Since net-worth can be negative
for high-debt individuals, this analysis accounts for the possibility that entrepreneurs debt
finance higher earnings. Column 5 shows that the median self-employed-year is associated with
about $24,000 more net-worth, after holding other variables constant (p ≈ 0.00). Columns 6 and
7 show that respectively, unincorporated business owners and incorporated business owners have
nearly $14,400 and $180,900 higher net-worth than employees (both estimates are statistically
significant at p ≈ 0.00). Column 8 shows the effects of entrepreneurial advantage driven self-
employment on net-wealth, revealing a positive but noisily estimated effect (p = 0.90).
Our theories appear to explain success in entrepreneurship, the highest form of which is
owning an incorporated business that employs and creates wealth for many others. In order to
further test the economic relevance of our explanations, we examine support for our hypothe-
ses in various industries after ranking them based on the median net worth (and income) of
entrepreneurs in the industry. We find the strongest evidence for our hypotheses in the sectors
where entrepreneurs average earnings were the highest (that is, in Manufacturing, Wholesale
Trade and “Finance, Insurance and Real-estate”). Of the 13 industry classifications in our
sample, “Manufacturing”and “Wholesale Trade”were also the two largest sectors by employ-
ment, together accounting for about 40 percent of the sample respondents (and presumably
jobs since the survey represents the U.S. civilian working population).27 Asymmetric informa-
tion (or comparative advantage) appears to explain entrepreneurship in sectors that not only
account for a high percentage of jobs, but also in industries that provide the greatest pecuniary
incentives to become a residual claimant, as suggested by our asymmetric information theory.
Hence, we find robust support for our theories of entrepreneurial choice—asymmetric infor-
mation and comparative advantage—in a representative U.S. data set. In Appendix C, we report
qualitatively similar findings obtained from the U.K. NCDS sample. In the next section, we
examine occupational dynamics with the goal of adjudicating whether asymmetric information
or comparative advantage explains the empirical patterns we have documented thus far.
27Tables B9 and B10 of Appendix B present corresponding results.
24
Electronic copy available at: https://ssrn.com/abstract=2596846
Entrepreneurship
4.4 Analysis of Dynamics
We examine entrepreneurship dynamics in our NLSY sample, which tracks individuals from
age 15-22 in 1979 till they turned 46-53 years old in 2010. Only about 18 percent of the panel
observations are for switchers– those who changed from entrepreneurship to wage-work, or
vice versa, after age 30.28 Entrepreneurs comprise less than three percent of the subsample of
individuals who did not change occupations after turning 30. Thus, most entrepreneurs acquire
some experience as wage workers prior to striking out on their own.
Table 5 here
Workers can, and do, switch occupations multiple times during their careers, with only 2.9
percent of wage workers during a given year switching to entrepreneurship in the subsequent
year. But nearly a quarter of those who were self-employed during a given year switch to wage
work in the subsequent year. Panel A of Table 5 shows how the frequency of switches in and
out of self-employment varies by the highest educational qualification attained by the workers,
without controls. Panel B of the same Table shows mean AFQT scores of workers at different
levels of education and switch status. The first two columns show that persistent entrepreneurs
(that is, those who did not switch out of entrepreneurship throughout their careers after turning
30) have higher AFQT scores than persistent wage workers for six out of the seven educational
attainment levels; Columns 3 and 4 show that those who switch to entrepreneurship from
wage employment have higher AFQT scores than those who stay as wage workers for three
out of the seven educational levels; the last two columns show that those who switch out of
entrepreneurship to take up salaried jobs have lower AFQT scores, on average, than those who
remain entrepreneurs for six out of the seven education levels.
Table 6 here
Next, Table 6 formally examines switching behavior as a function of ability and signals by
means of controlled LPM regressions. Column 1 of Table 6 shows that among those who do not
switch occupations after turning 30, entrepreneurs have higher AFQT scores than wage employ-
ees (this difference is not statistically significant at conventional levels, as can be expected given
the small fraction—just 2.7 percent—of entrepreneurs among workers who did not change their
28We pick the age 30 since most individuals stop acquiring educational signals after this age: choosing anearlier age threshold increases the per-worker frequency of switches, since workers move back and forth amongself employment, wage employment and part time employment before completing their educational attainment.Changing the age thresold wihthin a five year window does not qualitatively alter our findings.
25
Electronic copy available at: https://ssrn.com/abstract=2596846
Entrepreneurship
occupation). A one percent increase in education is associated with a 3 percent lower likelihood
of entrepreneurship among workers who do not change occupations (p ≈ 0.00). The estimates
in Columns 3 and 4 respectively suggest that workers with higher cognitive ability and lower
educational qualifications are more likely to switch from wage employment to entrepreneurship,
and workers with low ability but higher educational qualifications are more likely to switch out
of entrepreneurship into wage employment (the latter estimate of the effect of education is not
statistically significant at conventional levels). These findings suggest that although workers
may know their ability better than the labor market, they too learn it over time and sort into
entrepreneurship or wage employment in ways that are consistent with our theory. Finally, the
estimates in Column 5 confirm a weakening of the positive difference between entrepreneurial
and employee ability over the course of a worker’s career, confirming H4 in favor of asymmetric
information rather than for comparative advantage based matching.
Table 7 here
Table 7 investigates the returns to ability and education for entrepreneurs and wage workers.
The first two columns show the average returns to ability over worker careers are virtually iden-
tical for entrepreneurs and wage-workers (0.1182 vs. 0.1154; with closely overlapping confidence
intervals) and, if anything, the returns to education are slightly higher for entrepreneurs (0.7062
vs. 0.8904; at p = 0.04). These patterns are diffi cult to reconcile with matching (see H5 ). As
explained in Section 3.3.2, unlike matching, though, the asymmetric information explanation
does not depend on the direction of comparative advantage– innate ability or education can be
relatively more productive in either occupation.
The regression models reported in Columns 3 and 4 of Table 7 investigate the returns to
ability over time, holding education and other variables constant in subsamples of those who
are persistently wage-employed and persistently self-employed during our study period. The
estimates in Column 1 suggest that the returns to ability increase over time for salaried workers
(significant at p ≈ 0.00), while the payoffs for ability among the persistently self-employed do
not appear to change significantly. This is consistent with the explanation that employers
gradually learn about, and reward, the ability of employees– information about ability in wage
employment is incomplete but resolves over time (thus providing evidence for H6, consistent
with the asymmetric information theory). No such pattern is discernible in entrepreneurship,
suggesting that incomplete information about ability is unlikely to drive entrepreneurial income.
Taken together, support for our theory is strongest early in individuals’careers, when asym-
metric information about their ability is likely to be highest. At the early stage of their careers,
26
Electronic copy available at: https://ssrn.com/abstract=2596846
Entrepreneurship
individuals with ability much higher than their signals convey select into entrepreneurship even
though they may be incorrectly placed in their first occupations. With the passage of time, two
contrasting effects determine the average effect of ability on entrepreneurship—later entrants
into entrepreneurship have lower ability than early entrants (presumably because later entrants
switch into self-employment as a lifestyle choice or to maintain the work flexibility associated
with self-employment) but some less able entrepreneurs– particularly those with superior edu-
cational qualifications– also switch into salaried work.
We emphasize these empirical tests provide evidence favoring asymmetric information but
do not definitively rule out comparative advantage based matching, with switches in and out
of entrepreneurship suggesting imperfect information about comparative advantage. Thus,
workers may only be better rather than perfectly informed about their ability. Since we obtain
these findings after examining the employment records of the same set of individuals over nearly
their entire professional careers, we can also rule out that the findings are an artifact of sample
selection or survival bias. Overall, we conclude from the weight of evidence that asymmetric
information about worker ability is likely to be an important driver of entrepreneurship.
5 Conclusion
Summary. We proposed two theories of entrepreneurial choice driven by information fric-
tions: the first, actuated by firms’reliance on imperfect credentials to assess workers’ability,
the second, by matching multidimensional human capital to differing requirements in the entre-
preneurial and wage sectors. Although the mechanisms– asymmetric information in the former
theory and comparative advantage with symmetric imperfect information in the latter– differ
starkly, the two theories hypothesize some similar relationships between innate ability and ed-
ucational credentials on the one hand, and the decision to found a firm and its success on the
other. As predicted by both formal models, our cross-sectional empirical analysis revealed that,
holding other variables constant, entrepreneurs have higher cognitive ability scores, lower levels
of educational attainment, and greater earnings. We confirmed these findings in two different
datasets: (1) a longitudinal study following a representative sample of U.S. youth beginning in
1979, and (2) a dataset of U.K. residents born in one particular week in 1958.
Nevertheless, the data does not support the two theories equally. As asymmetric information
predicts, entrepreneurial earnings exhibit higher variance, conditional on all else. Meanwhile
comparative advantage requires higher returns to ability in entrepreneurship or to education
in wage work, but our samples lack evidence of these pre-conditions. Furthermore, conditional
27
Electronic copy available at: https://ssrn.com/abstract=2596846
Entrepreneurship
on education, the dominance of entrepreneurs’ ability weakened, while returns to cognitive
ability in wage work strengthened over our subjects’careers– patterns predicted by asymmetric
information but contradictory to comparative advantage. Hence, while we cannot definitively
rule out that comparative advantage draws some to start their own business, we find clear and
consistent evidence that asymmetric information pushes many to do so.
We thus offer, test and provide evidence for a novel explanation for entrepreneurship: those
who are undervalued by the traditional labor market, reject it and become entrepreneurs.
Asymmetric information about ability leads incumbent firms to employ only “lemons,”relatively
unproductive workers. The relatively talented retain the benefits of their superior productivity
by choosing entrepreneurship. This implication, that entrepreneurs are, in fact, “cherries”
contrasts with a large literature in social science, which casts entrepreneurs as “lemons”– those
who either cannot find, cannot hold, or cannot stand real jobs.
Limitations. While we have demonstrated our theories’robustness to several extensions,
we cannot explore all possibilities here. First, entrepreneurial aspirations are beyond the model;
in fact, we abstract from all motives except pecuniary ones. The interactions of the informa-
tional forces we introduce, with more traditional explanations of entrepreneurial choice may
yield further insights. For example, we showed that our asymmetric information theory is ro-
bust to workers’educational choices in the pursuit of higher income, but we did not consider
educational choices driven by non-pecuniary tastes. Since the average age of a US founder is
42 (Azoulay et al., 2020), more than a decade after most individuals complete their formal
education, educational choices in one’s youth do not seem primarily driven by future entrepre-
neurial implications in middle-age. Nevertheless, entrepreneurial aspiration’s potential impacts
on educational attainment merit further investigation. Second, entrepreneurship is workers’
response to asymmetric information about their ability, but how might firms respond? In in-
dustries where individual output, even if produced within a firm, is clearly measurable and
verifiable, managers could offer output contingent wages, paying more for higher performance,
thus making workers partial residual claimants of their ability. Hence, in sales or finance, where
commissions and performance bonuses are commonplace, we would expect the best (relative
to their signal) to choose contracts where the highest portion of their income is performance
based. Similarly, Dushnitsky (2009) argues that inventors who require investor support signal
their inventions’quality by electing payment schemes contingent on their success. Essentially,
these contracts amount to intrapreneurship, which our model does not comprehend.
Broader Implications. Although previous work has shown that individuals choose en-
trepreneurship for a variety of reasons– including desire to be ones’ own boss, love of risk,
28
Electronic copy available at: https://ssrn.com/abstract=2596846
Entrepreneurship
overconfidence, flexible work hours– the one we introduce has peculiar implications for entre-
preneurial outcomes, labor force productivity, education, and public policy. Many drivers of
entrepreneurial entry do not predict extraordinary financial payoffs– in fact, those drawn to
entrepreneurship by a taste for its non-pecuniary benefits should be expected to earn less than
their employed counterparts. In contrast, asymmetric information about ability pushes the
most productive workers into entrepreneurship in search of higher earnings. Thus, the puzzle
of entrepreneurial earnings is intimately tied to why an individual sets up his own firm.
Our findings also suggest that the networks of families and friends that dominate financing
for the earliest stage ventures have reasons beyond emotion to do so. These individuals know
budding entrepreneurs best when asymmetric information about their quality is greatest (Stuart
and Sorenson, 2005; Hegde and Tumlinson, 2014; Kerr et al. 2014). It is also possible tight-
knit clusters of entrepreneurial activity offer some of the same advantages to the formation of
entrepreneurial partnerships and investments (Gans, et al. 2002; Guzman and Stern 2015).
In light of our findings, the notion of “entrepreneurial success” becomes subtler, because
although those driven into entrepreneurship by asymmetric information earn more than simi-
larly credentialed employees, their selection into the occupation may still be adverse– they may
be even more productive as employees, but the market failed to see it. Policies that stimulate
entrepreneurship will only generate aggregate wealth if founders are truly more productive as
entrepreneurs. For example, if educational institutions provide more precise signals of ability,
information asymmetry, and with it adverse selection, could be reduced. Although this may
imply less entrepreneurship, those who choose it will do so because of comparative advantage.
Conversely, if educational institutions, which have traditionally served a credentialing purpose
(e.g., business schools), muddle their signals through policies such as non-disclosure of student
grades to employers, entrepreneurship may rise without stimulating growth.
Relatedly, asymmetric information may also explain why several groups, such as immigrants
and the underprivileged, gravitate toward entrepreneurship. In a sense, entrepreneurship is
undervalued workers’response to (statistical) discrimination (Tumlinson, 2012). Our empirical
analysis exploits education as the attribute of (statistical) discrimination, but in principle, any
observable attribute upon which employers base wage offers may elicit such a reaction from
the more able, whether its use is fair or not. Understanding whether unrecognized academic
credentials or other forms of discrimination drive these choices requires further research. But
again, public policies reducing informational frictions with better credentialling for adults and
accrediting foreign degrees may induce a societally productive drop in entrepreneurship.
Finally, we return to Steve Jobs, Jan Koum and D.J. Patel, the entrepreneurs whose stories
29
Electronic copy available at: https://ssrn.com/abstract=2596846
Entrepreneurship
inspired our thinking about informational frictions and entrepreneurship. Few would doubt
that their entrepreneurial productivity far exceeded whatever they might have accomplished if
they had not started their own ventures. Yet, Koum went on to work for Facebook. Patel’s
franchisor enlisted him to expand the parent corporation into his native India with 400 stores
over 10 years. Apple fired Jobs in 1985, only to hire him back (after he founded NeXT and
funded Pixar) as CEO in 1997, a job he famously held till his untimely death. Each ultimately
signaled their remarkable talents by means of their entrepreneurial success and leveraged it
to become... an employee. We save a deeper examination of entrepreneurial dynamics and
transitions back to traditional employment for a future study.
References
Agarwal, R., Audretsch, D. and Sarkar, M.B., 2007. “The process of creative construction:knowledge spillovers, entrepreneurship, and economic growth.” Strategic EntrepreneurshipJournal, 1(3-4), pp.263-286.
Agarwal, R., Gambardella, A. and Olson, D.M., 2016. “Employee mobility and entrepreneur-ship a virtual special issue [1].”Strategic Management Journal, 37(13), pp.E11-E21.
Akerlof, G. A. 1970. “The market for ‘lemons’: Quality uncertainty and the market mecha-nism.”The Quarterly Journal of Economics 84(3): 488-500.
Alchian A.A., and Demsetz H. 1972. “Production, information costs and economic organiza-tion.”American Economic Review 62 (5): 777—795.
Aldrich, H.E. and Fiol, C.M., 1994. “Fools rush in? The institutional context of industrycreation.”Academy of Management Review, 19(4), pp.645-670.
Altonji, J. G., Bharadwaj, P., and Lange, F. 2012. “Changes in the Characteristics of AmericanYouth: Implications for Adult Outcomes.”Journal of Labor Economics 30(4): 783-828.
Altonji, J.G. and Pierret, C.R., 2001. “Employer learning and statistical discrimination.”TheQuarterly Journal of Economics, 116(1), pp.313-350.
Åstebro, T., Chen, J. and Thompson, P., 2011. “Stars and misfits: Self-employment and labormarket frictions.”Management Science, 57(11), pp.1999-2017.
Azoulay, P., Jones, B.F., Kim, J.D. and Miranda, J., 2020. “Age and high-growth entrepre-neurship.”American Economic Review: Insights, 2(1), pp.65-82.
Bagnoli, M., and Bergstrom, T. 2005. “Log-concave probability and its applications.”Eco-nomic Theory, 26: 445-469.
Becker, G. S. 1962. “Investment in human capital: A theoretical analysis.”Journal of PoliticalEconomy, 70: 9-49.
Becker, G.S., 1962. “Investment in human capital: A theoretical analysis.”Journal of PoliticalEconomy, 70(5, Part 2), pp.9-49.
Braguinsky, S., Klepper, S. and Ohyama, A., 2012. “High-tech entrepreneurship.”The Journalof Law and Economics, 55(4), pp.869-900.
30
Electronic copy available at: https://ssrn.com/abstract=2596846
Entrepreneurship
Camerer, C., and Lovallo, D. 1999. “Overconfidence and excess entry: An experimental ap-proach.”American Economic Review, 89(1): 306-318.
Cameron, S. and Heckman, J. 2001. “The dynamics of educational attainment for black,Hispanic, and white males.”Journal of Political Economy, 109:455—99.
Campbell, B.A., Kryscynski, D. and Olson, D.M., 2017. “Bridging strategic human capitaland employee entrepreneurship research: A labor market frictions approach.”Strategic Entre-preneurship Journal, 11(3), pp.344-356.
Carnahan, S., Agarwal, R. and Campbell, B.A. 2012. “Heterogeneity in turnover: The effectof relative compensation dispersion of firms on the mobility and entrepreneurship of extremeperformers.”Strategic Management. Journal, 33(12), pp. 1411-1430.
Carneiro, P. and Heckman, J.J., 2002. “The evidence on credit constraints in post-secondaryschooling.”The Economic Journal, 112(482), pp.705-734.
Dushnitsky, G. 2009 “Entrepreneurial Optimism in the Market for Technological Inventions.”Organization Science, 21(1), pp. 150-167.
Evans, D.S. and Leighton, L.S., 1989. “The determinants of changes in US self-employment,1968—1987.”Small Business Economics, 1(2), pp.111-119.
Fairlie, R.W., 2005. “Self-employment, entrepreneurship, and the NLSY79.”Monthly Lab.Rev., 128, p.40.
Freeman, J. 1986 “Entrepreneurs as organizational products: Semiconductor firms and venturecapital firms”. In Libecap, G. (ed.), Advances in the Study of Entrepreneurship, Innovation,and Economic Growth, 1: 33—58. Greenwich, CT: JAI Press.
Gans, J., Hsu, D., & Stern, S. (2002). “When Does Start-Up Innovation Spur the Gale ofCreative Destruction?”The RAND Journal of Economics, 33(4), 571-586.
Griliches, Z. and Mason, W.M., 1972. “Education, income, and ability.”Journal of PoliticalEconomy, 80(3, Part 2), pp.S74-S103.
Guzman, J., & Stern, S. (2015). “Where is silicon valley?.”Science, 347(6222), 606-609.
Halaby, C.N., 2003. “Where job values come from.”American Sociological Review, 68, pp.251-278.
Hamilton, B. 2000. “Does entrepreneurship pay? An empirical analysis of the returns toself-employment.”Journal of Political Economy, 108(3):604-631.
Hartog, J., Van Praag, M. and Van Der Sluis, J., 2010. “If you are so smart, why aren’t youan entrepreneur? Returns to cognitive and social ability: Entrepreneurs versus employees.”Journal of Economics & Management Strategy, 19(4), pp.947-989.
Hébert, R. F., and Link, A. N., 1988. “The entrepreneur: Mainstream views and radicalcritiques.”New York: Praeger.
Hegde, D. and Tumlinson, J., 2014. “Does social proximity enhance business partnerships?Theory and evidence from ethnicity’s role in US venture capital.”Management Science, 60(9),pp.2355-2380.
Hurst, E., Li, G., and Pugsley, B. 2014. “Are Household Surveys Like Tax Forms: Evi-dence from Income Underreporting of the Self Employed.”Review of Economics and Statistics,96(1):19-33.
31
Electronic copy available at: https://ssrn.com/abstract=2596846
Entrepreneurship
Iyer, R., Khwaja, A.I., Luttmer, E.F. and Shue, K., 2015. “Screening peers softly: Inferringthe quality of small borrowers.”Management Science, 62(6), pp.1554-1577.
Jovanovic, B., 1979. “Job Matching and the Theory of Turnover.”Journal of Political Econ-omy, 87(5):972-90.
Kacperczyk, A. and Younkin, P., 2017. “The paradox of breadth: The tension between experi-ence and legitimacy in the transition to entrepreneurship.”Administrative Science Quarterly,62(4), pp.731-764.
Kahn, L.B., 2013. “Asymmetric information between employers.”American Economic Jour-nal: Applied Economics, 5(4), pp.165-205.
Kerr, W. R., Lerner, J., & Schoar, A. (2014). “The consequences of entrepreneurial finance:Evidence from angel financings.”The Review of Financial Studies, 27(1), 20-55.
Kihlstrom, R. E., and Laffont, J.J. 1979. “A general equilibrium entrepreneurial theory of firmformation based on risk aversion”Journal of Political Economy, 87(4):719-748.
Klepper, S., 2007. “Disagreements, spinoffs, and the evolution of Detroit as the capital of theUS automobile industry.”Management Science, 53(4), pp.616-631.
Klepper, S. and Thompson, P., 2010. “Disagreements and intra-industry spinoffs.” Interna-tional Journal of Industrial Organization, 28(5), pp.526-538.
Lazear, E. P. 2004. “Balanced skills and entrepreneurship”American Economic Review, 94(2):208-211 Lazear, E. P. 2005. “Entrepreneurship”Journal of Labor Economics , 23(4):649-680.
Lerner, J., and Malmendier, U., 2013. “With a Little Help from My (Random) Friends:Success and Failure in Post-Business School Entrepreneurship.”Review of Financial Stud-ies, 26(10):2411-2452.
Levine, R. and Rubinstein, Y., 2017. “Smart and illicit: who becomes an entrepreneur and dothey earn more?”The Quarterly Journal of Economics, 132(2), pp.963-1018.
McClelland, D. C. 1964. “The Achieving Society”Princeton, NJ, D. Van Norstrand.
Mincer, J. 1970. “On-the-Job Training: Costs, Returns and Some Implications.”Journal ofPolitical Economy 70, 5(2): 50-79.
Moskowitz, T. J. and Vissing-Jørgensen, A. 2002. “The Returns to Entrepreneurial Investment:A Private Equity Premium Puzzle?”The American Economic Review, 92 (4):745—778.
Nicolaou, N., Shane, S., Cherkas, L., Hunkin, J. and Spector, T.D., 2008. “Is the tendency toengage in entrepreneurship genetic?”Management Science, 54(1), pp.167-179.
Ohyama, A., 2015. “Entrepreneurship and job-relatedness of human capital.” Economica,82(328), pp.740-768. Parker, S.C. 2009. “The Economics of Entrepreneurship” CambridgeUniversity Press, Cambridge.
Pissarides, C. and Weber, G. 1989. “An expenditure based estimate of Britain’s black econ-omy”Journal of Public Economics 39(1): 17-32.
Pontikes, E.G. and Barnett, W.P., 2017. “The non-consensus entrepreneur: Organizationalresponses to vital events.”Administrative Science Quarterly, 62(1), pp.140-178.
Roy, A. D. 1951. “Some thoughts on the distribution of earnings.”Oxford Economic Papers,3(2):135-146.
32
Electronic copy available at: https://ssrn.com/abstract=2596846
Entrepreneurship
Ruef, M., 2010. The entrepreneurial group: Social identities, relations, and collective action.Princeton University Press.
Sarada, 2016. “The unobserved returns to entrepreneurship.”Working paper. Department ofEconomics, UCSD.
Saxenian, A., 1994. “Regional networks: industrial adaptation in Silicon Valley and route128.”
Schoonhoven, C.B. and Romanelli, E., 2001. The entrepreneurship dynamic: Origins of entre-preneurship and the evolution of industries. Stanford University Press.
Schönberg, U., 2007. “Testing for asymmetric employer learning.”Journal of Labor Economics,25(4), pp.651-691.
Shah, S. K., Agarwal, R. and Echambadi, R. 2019. “Jewels in the crown: Exploring themotivations and team building processes of employee entrepreneurs.”Strategic ManagementJournal, 40(9), pp. 1417-1452.
Sørensen, J.B., 2007. “Bureaucracy and entrepreneurship: Workplace effects on entrepreneur-ial entry.”Administrative Science Quarterly, 52(3), pp.387-412.
Sorenson, O. and Audia, P.G., 2000. “The social structure of entrepreneurial activity: Ge-ographic concentration of footwear production in the United States, 1940—1989.”AmericanJournal of Sociology, 106(2), pp.424-462.
Spence, M. 1973. “Job Market Signaling.”The Quarterly Journal of Economics, 87(3): 355-374.
Stenard, B.S. and Sauermann, H., 2016. “Educational mismatch, work outcomes, and entryinto entrepreneurship.”Organization Science, 27(4), pp.801-824.
Stuart, T.E. and Sorenson, O., 2005. “Social networks and entrepreneurship.”In Handbook ofentrepreneurship research (pp. 233-252). Springer, Boston, MA.
Tumlinson, J. 2012. “Adverse Selection in Team Formation under Discrimination.”Workingpaper available at SSRN 2101064.
Van Praag, M., van Witteloostuijn, A. and van der Sluis, J., 2013. “The higher returns to for-mal education for entrepreneurs versus employees.”Small Business Economics, 40(2), pp.375-396.
33
Electronic copy available at: https://ssrn.com/abstract=2596846
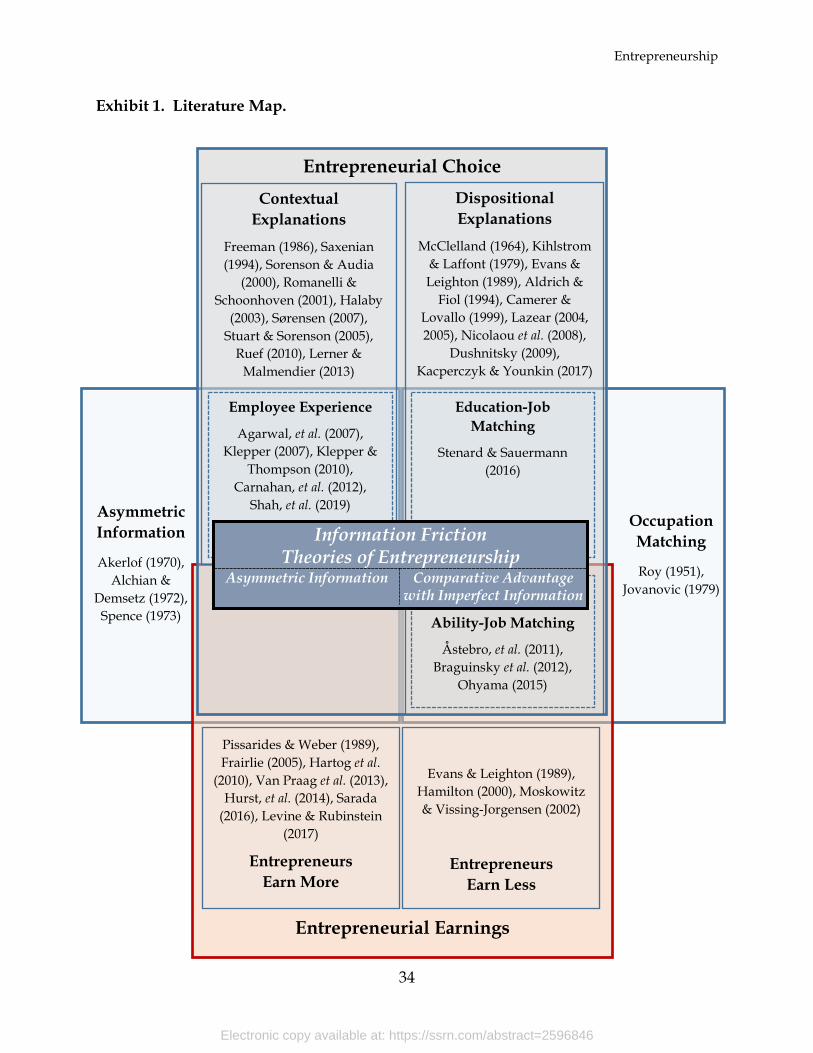
Entrepreneurship
34
Exhibit 1. Literature Map.
Entrepreneurial Earnings
Entrepreneurial Choice
Dispositional Explanations
McClelland (1964), Kihlstrom & Laffont (1979), Evans & Leighton (1989), Aldrich &
Fiol (1994), Camerer & Lovallo (1999), Lazear (2004, 2005), Nicolaou et al. (2008),
Dushnitsky (2009), Kacperczyk & Younkin (2017)
Contextual Explanations
Freeman (1986), Saxenian (1994), Sorenson & Audia
(2000), Romanelli & Schoonhoven (2001), Halaby
(2003), Sørensen (2007), Stuart & Sorenson (2005),
Ruef (2010), Lerner & Malmendier (2013)
Evans & Leighton (1989), Hamilton (2000), Moskowitz & Vissing-Jorgensen (2002)
Entrepreneurs Earn Less
Pissarides & Weber (1989), Frairlie (2005), Hartog et al.
(2010), Van Praag et al. (2013), Hurst, et al. (2014), Sarada
(2016), Levine & Rubinstein (2017)
Entrepreneurs Earn More
Ability-Job Matching
Åstebro, et al. (2011), Braguinsky et al. (2012),
Ohyama (2015)
Asymmetric Information
Akerlof (1970), Alchian &
Demsetz (1972), Spence (1973)
Occupation Matching
Roy (1951), Jovanovic (1979)
Employee Experience
Agarwal, et al. (2007), Klepper (2007), Klepper &
Thompson (2010), Carnahan, et al. (2012),
Shah, et al. (2019)
Education-Job Matching
Stenard & Sauermann (2016)
Information Friction Theories of Entrepreneurship
Asymmetric Information Comparative Advantage with Imperfect Information
Electronic copy available at: https://ssrn.com/abstract=2596846
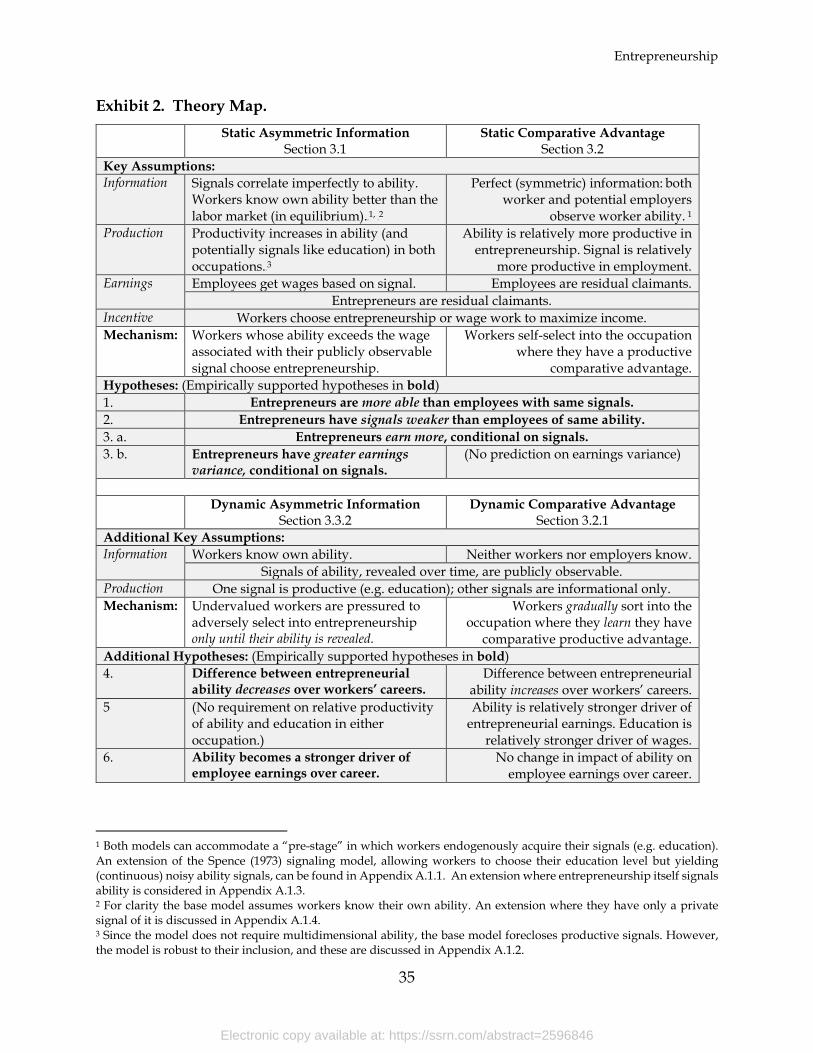
Entrepreneurship
35
Exhibit 2. Theory Map. Static Asymmetric Information
Section 3.1 Static Comparative Advantage
Section 3.2 Key Assumptions: Information Signals correlate imperfectly to ability.
Workers know own ability better than the labor market (in equilibrium).0F
1, 1F
2
Perfect (symmetric) information: both worker and potential employers
observe worker ability. 1
Production Productivity increases in ability (and potentially signals like education) in both occupations.2F
3
Ability is relatively more productive in entrepreneurship. Signal is relatively
more productive in employment. Earnings Employees get wages based on signal. Employees are residual claimants.
Entrepreneurs are residual claimants. Incentive Workers choose entrepreneurship or wage work to maximize income. Mechanism: Workers whose ability exceeds the wage
associated with their publicly observable signal choose entrepreneurship.
Workers self-select into the occupation where they have a productive
comparative advantage. Hypotheses: (Empirically supported hypotheses in bold) 1. Entrepreneurs are more able than employees with same signals. 2. Entrepreneurs have signals weaker than employees of same ability. 3. a. Entrepreneurs earn more, conditional on signals. 3. b. Entrepreneurs have greater earnings
variance, conditional on signals. (No prediction on earnings variance)
Dynamic Asymmetric Information
Section 3.3.2 Dynamic Comparative Advantage
Section 3.2.1 Additional Key Assumptions: Information Workers know own ability. Neither workers nor employers know.
Signals of ability, revealed over time, are publicly observable. Production One signal is productive (e.g. education); other signals are informational only. Mechanism: Undervalued workers are pressured to
adversely select into entrepreneurship only until their ability is revealed.
Workers gradually sort into the occupation where they learn they have
comparative productive advantage. Additional Hypotheses: (Empirically supported hypotheses in bold) 4. Difference between entrepreneurial
ability decreases over workers’ careers. Difference between entrepreneurial
ability increases over workers’ careers. 5 (No requirement on relative productivity
of ability and education in either occupation.)
Ability is relatively stronger driver of entrepreneurial earnings. Education is
relatively stronger driver of wages. 6. Ability becomes a stronger driver of
employee earnings over career. No change in impact of ability on
employee earnings over career.
1 Both models can accommodate a “pre-stage” in which workers endogenously acquire their signals (e.g. education). An extension of the Spence (1973) signaling model, allowing workers to choose their education level but yielding (continuous) noisy ability signals, can be found in Appendix A.1.1. An extension where entrepreneurship itself signals ability is considered in Appendix A.1.3. 2 For clarity the base model assumes workers know their own ability. An extension where they have only a private signal of it is discussed in Appendix A.1.4. 3 Since the model does not require multidimensional ability, the base model forecloses productive signals. However, the model is robust to their inclusion, and these are discussed in Appendix A.1.2.
Electronic copy available at: https://ssrn.com/abstract=2596846

Entrepreneurship
36
Exhibit 3. NLSY Variable Definitions.
Self-employed is equal to 1 if NLSY respondent indicated current job as “self-employed in his or her own business, professional practice, or farm;” NLSY defines an individual as self-employed if he or she owned at least 50 percent of the business, is principal managing partner, or files a form SE for Federal income taxes. Independent contractors, consultants, and freelancers are also classified as self-employed.
Self-employed Incorporated is equal to 1 if Self-employed individual reported his/her business as incorporated.
Armed Forces Qualification Test (AFQT) Score is indicated in percentiles and calculated from the Armed Services Vocational Aptitude Battery (ASVAB) which includes tests on Arithmetic Reasoning, Math Knowledge, Word Knowledge, and Paragraph Comprehension. NLSY respondents took the ASVAB in 1980, when they were 16-23 years of age. Scores are age-adjusted using the procedure described in Altonji, Bharadwaj, & Lange (2012).
Years of Education is measured on an ordinal scale such that 0 = No formal schooling, 1 = completion of 1st grade, 2 = completion of 2nd grade,..12= completion of 12th grade (high school), 16=completion of four-year college, and 20 = completion of eight years of college or higher.
Highest Degree Earned is measured on an ordinal scale which indicates 0 = No formal schooling, 1=High School Diploma (or equivalent), 2=Associate/Junior College, 3=Bachelor of Arts, 4=Bachelor of Science, 5=Master’s, and 6 = PhD or other advanced professional degrees (MD, JD, LLD, DDS).
Annual Income is total net family income expressed in 2010$. Values are top-coded such that incomes of the top 2 percent of earners are coded as the average value of the top two percent.
Net-worth is created by summing all asset values and subtracting all debts of respondent’s family and expressed in 2010$. Net-worth of the top two percent are top-coded as the average of the top two percent.
Age is age of respondent in years
Risk-loving is from respondents’ answer to a question asking them how much they like taking risks on a scale between 0 indicating “unwilling to take any risks” and 10 indicating “fully prepared to take risks”
Sociability is derived from respondents’ answer to a question asking them how sociable they are on a scale between 1 indicating “Extremely shy” and 4 indicating “Extremely outgoing”
Self-esteem is based on respondent responses to the Rosenberg Self-Esteem Test designed to measure the self-evaluation that an individual maintains. 0 on the scale indicates the highest level, and 30 the lowest level of self-esteem.
Pearlin Mastery indicates a respondent’s score on The Pearlin Mastery Scale designed to measure the extent to which individuals perceive themselves to be in control of forces that significantly impact their lives. 0 indicates the highest level of mastery and 28 the lowest.
Industry dummies 13 dummy variables indicating industry of respondents’ primary job based on the 1970 census code such that 1= Agriculture, Forestry, Fishing and Hunting; 2= Mining; 3= Construction; 4= Manufacturing; 5= Transportation, Communication, Utilities; 6= Wholesale & Retail Trade; 7= Finance, Insurance and Real Estate; 8= Information, Business and Repair Services; 9= Personal, Educational, and Health Services; 10= Arts, Entertainment and Recreation; 11= Professional, Accommodation and Other Services; 12= Public Administration and 13= Other.
Male, White, Born Abroad, Supplementary Sample and Military Sample dummies are binary variables set to 1 if respondent is male, non-black/non-hispanic, born outside of the U.S., is drawn from the NLSY supplementary sample and is drawn from the NLSY Military Sample respectively (the variables are set to 0 otherwise).
Electronic copy available at: https://ssrn.com/abstract=2596846
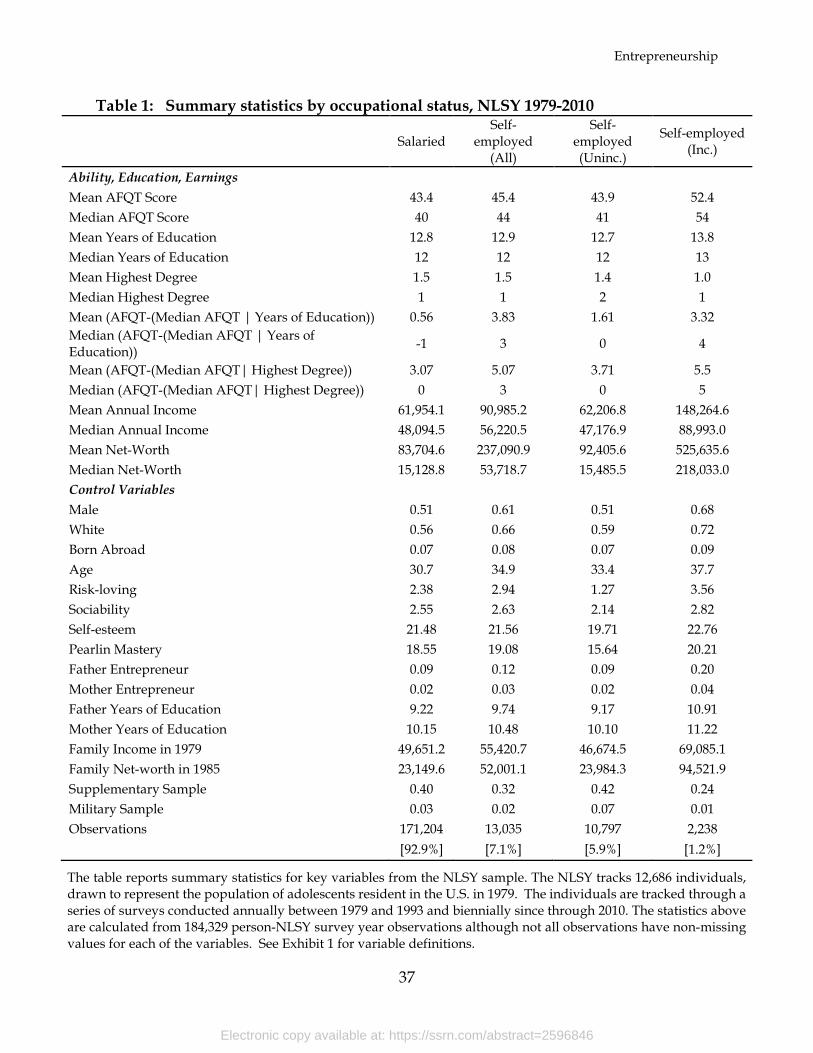
Entrepreneurship
37
Table 1: Summary statistics by occupational status, NLSY 1979-2010
Salaried Self-
employed (All)
Self-employed (Uninc.)
Self-employed (Inc.)
Ability, Education, Earnings
Mean AFQT Score 43.4 45.4 43.9 52.4 Median AFQT Score 40 44 41 54 Mean Years of Education 12.8 12.9 12.7 13.8 Median Years of Education 12 12 12 13 Mean Highest Degree 1.5 1.5 1.4 1.0 Median Highest Degree 1 1 2 1 Mean (AFQT-(Median AFQT | Years of Education)) 0.56 3.83 1.61 3.32 Median (AFQT-(Median AFQT | Years of Education)) -1 3 0 4
Mean (AFQT-(Median AFQT| Highest Degree)) 3.07 5.07 3.71 5.5 Median (AFQT-(Median AFQT| Highest Degree)) 0 3 0 5 Mean Annual Income 61,954.1 90,985.2 62,206.8 148,264.6 Median Annual Income 48,094.5 56,220.5 47,176.9 88,993.0 Mean Net-Worth 83,704.6 237,090.9 92,405.6 525,635.6 Median Net-Worth 15,128.8 53,718.7 15,485.5 218,033.0 Control Variables
Male 0.51 0.61 0.51 0.68 White 0.56 0.66 0.59 0.72 Born Abroad 0.07 0.08 0.07 0.09 Age 30.7 34.9 33.4 37.7 Risk-loving 2.38 2.94 1.27 3.56 Sociability 2.55 2.63 2.14 2.82 Self-esteem 21.48 21.56 19.71 22.76 Pearlin Mastery 18.55 19.08 15.64 20.21 Father Entrepreneur 0.09 0.12 0.09 0.20 Mother Entrepreneur 0.02 0.03 0.02 0.04 Father Years of Education 9.22 9.74 9.17 10.91 Mother Years of Education 10.15 10.48 10.10 11.22 Family Income in 1979 49,651.2 55,420.7 46,674.5 69,085.1 Family Net-worth in 1985 23,149.6 52,001.1 23,984.3 94,521.9 Supplementary Sample 0.40 0.32 0.42 0.24 Military Sample 0.03 0.02 0.07 0.01 Observations 171,204 13,035 10,797 2,238 [92.9%] [7.1%] [5.9%] [1.2%]
The table reports summary statistics for key variables from the NLSY sample. The NLSY tracks 12,686 individuals, drawn to represent the population of adolescents resident in the U.S. in 1979. The individuals are tracked through a series of surveys conducted annually between 1979 and 1993 and biennially since through 2010. The statistics above are calculated from 184,329 person-NLSY survey year observations although not all observations have non-missing values for each of the variables. See Exhibit 1 for variable definitions.
Electronic copy available at: https://ssrn.com/abstract=2596846
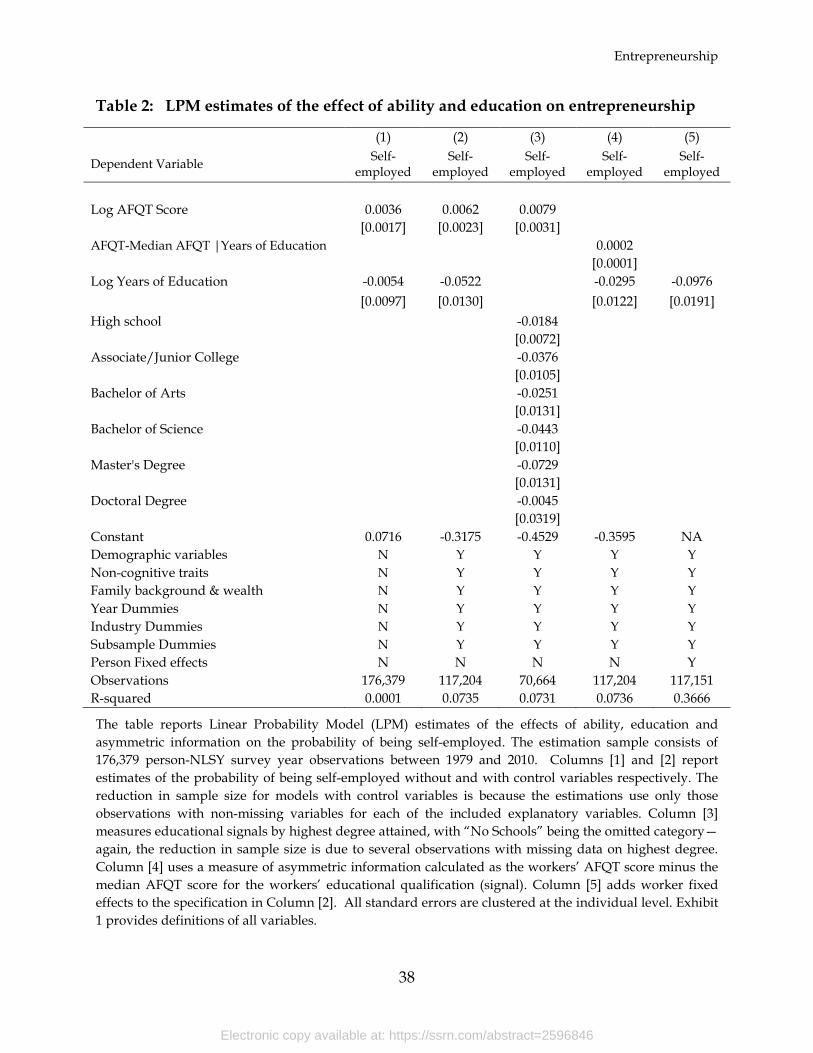
Entrepreneurship
38
Table 2: LPM estimates of the effect of ability and education on entrepreneurship
(1) (2) (3) (4) (5)
Dependent Variable Self-employed
Self-employed
Self-employed
Self-employed
Self-employed
Log AFQT Score 0.0036 0.0062 0.0079
[0.0017] [0.0023] [0.0031]
AFQT-Median AFQT |Years of Education 0.0002 [0.0001]
Log Years of Education -0.0054 -0.0522 -0.0295 -0.0976 [0.0097] [0.0130] [0.0122] [0.0191]
High school -0.0184 [0.0072]
Associate/Junior College -0.0376 [0.0105]
Bachelor of Arts -0.0251 [0.0131]
Bachelor of Science -0.0443 [0.0110]
Master's Degree -0.0729 [0.0131]
Doctoral Degree -0.0045 [0.0319]
Constant 0.0716 -0.3175 -0.4529 -0.3595 NA Demographic variables N Y Y Y Y Non-cognitive traits N Y Y Y Y Family background & wealth N Y Y Y Y Year Dummies N Y Y Y Y Industry Dummies N Y Y Y Y Subsample Dummies N Y Y Y Y Person Fixed effects N N N N Y Observations 176,379 117,204 70,664 117,204 117,151 R-squared 0.0001 0.0735 0.0731 0.0736 0.3666
The table reports Linear Probability Model (LPM) estimates of the effects of ability, education and asymmetric information on the probability of being self-employed. The estimation sample consists of 176,379 person-NLSY survey year observations between 1979 and 2010. Columns [1] and [2] report estimates of the probability of being self-employed without and with control variables respectively. The reduction in sample size for models with control variables is because the estimations use only those observations with non-missing variables for each of the included explanatory variables. Column [3] measures educational signals by highest degree attained, with “No Schools” being the omitted category—again, the reduction in sample size is due to several observations with missing data on highest degree. Column [4] uses a measure of asymmetric information calculated as the workers’ AFQT score minus the median AFQT score for the workers’ educational qualification (signal). Column [5] adds worker fixed effects to the specification in Column [2]. All standard errors are clustered at the individual level. Exhibit 1 provides definitions of all variables.
Electronic copy available at: https://ssrn.com/abstract=2596846
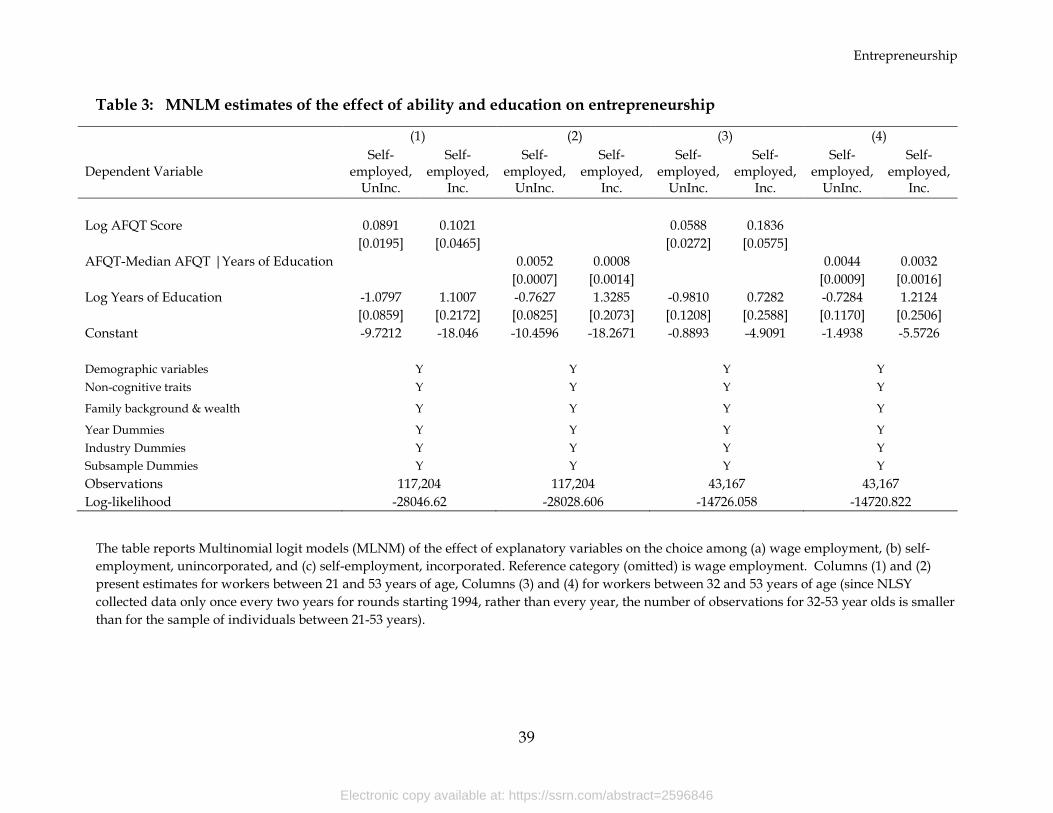
Entrepreneurship
39
Table 3: MNLM estimates of the effect of ability and education on entrepreneurship
(1) (2) (3) (4)
Dependent Variable Self-
employed, UnInc.
Self-employed,
Inc.
Self-employed,
UnInc.
Self-employed,
Inc.
Self-employed,
UnInc.
Self-employed,
Inc.
Self-employed,
UnInc.
Self-employed,
Inc. Log AFQT Score 0.0891 0.1021 0.0588 0.1836
[0.0195] [0.0465] [0.0272] [0.0575]
AFQT-Median AFQT |Years of Education 0.0052 0.0008 0.0044 0.0032 [0.0007] [0.0014] [0.0009] [0.0016]
Log Years of Education -1.0797 1.1007 -0.7627 1.3285 -0.9810 0.7282 -0.7284 1.2124 [0.0859] [0.2172] [0.0825] [0.2073] [0.1208] [0.2588] [0.1170] [0.2506]
Constant -9.7212 -18.046 -10.4596 -18.2671 -0.8893 -4.9091 -1.4938 -5.5726
Demographic variables Y Y Y Y Non-cognitive traits Y Y Y Y
Family background & wealth Y Y Y Y
Year Dummies Y Y Y Y Industry Dummies Y Y Y Y Subsample Dummies Y Y Y Y Observations 117,204 117,204 43,167 43,167 Log-likelihood -28046.62 -28028.606 -14726.058 -14720.822
The table reports Multinomial logit models (MLNM) of the effect of explanatory variables on the choice among (a) wage employment, (b) self-employment, unincorporated, and (c) self-employment, incorporated. Reference category (omitted) is wage employment. Columns (1) and (2) present estimates for workers between 21 and 53 years of age, Columns (3) and (4) for workers between 32 and 53 years of age (since NLSY collected data only once every two years for rounds starting 1994, rather than every year, the number of observations for 32-53 year olds is smaller than for the sample of individuals between 21-53 years).
Electronic copy available at: https://ssrn.com/abstract=2596846
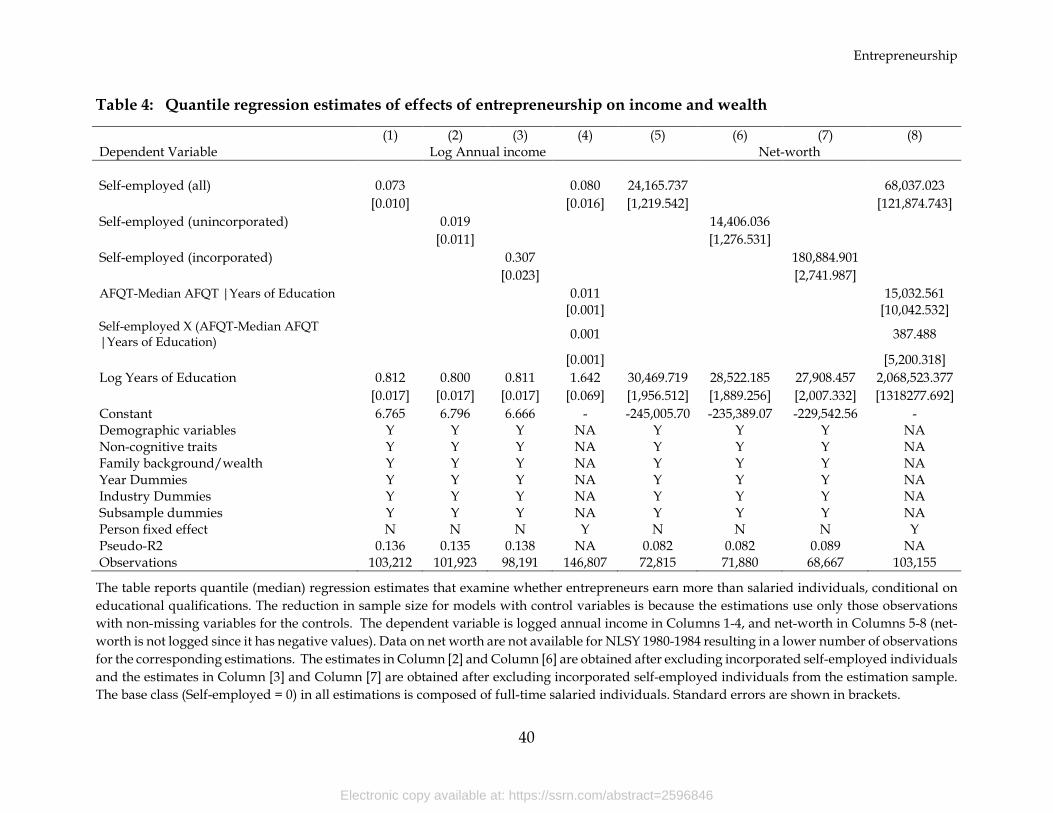
Entrepreneurship
40
Table 4: Quantile regression estimates of effects of entrepreneurship on income and wealth
(1) (2) (3) (4) (5) (6) (7) (8) Dependent Variable Log Annual income Net-worth Self-employed (all) 0.073 0.080 24,165.737 68,037.023
[0.010] [0.016] [1,219.542] [121,874.743] Self-employed (unincorporated) 0.019 14,406.036
[0.011] [1,276.531]
Self-employed (incorporated) 0.307 180,884.901 [0.023] [2,741.987]
AFQT-Median AFQT |Years of Education 0.011 15,032.561 [0.001] [10,042.532]
Self-employed X (AFQT-Median AFQT |Years of Education)
0.001 387.488 [0.001] [5,200.318]
Log Years of Education 0.812 0.800 0.811 1.642 30,469.719 28,522.185 27,908.457 2,068,523.377 [0.017] [0.017] [0.017] [0.069] [1,956.512] [1,889.256] [2,007.332] [1318277.692]
Constant 6.765 6.796 6.666 - -245,005.70 -235,389.07 -229,542.56 - Demographic variables Y Y Y NA Y Y Y NA Non-cognitive traits Y Y Y NA Y Y Y NA Family background/wealth Y Y Y NA Y Y Y NA Year Dummies Y Y Y NA Y Y Y NA Industry Dummies Y Y Y NA Y Y Y NA Subsample dummies Y Y Y NA Y Y Y NA Person fixed effect N N N Y N N N Y Pseudo-R2 0.136 0.135 0.138 NA 0.082 0.082 0.089 NA Observations 103,212 101,923 98,191 146,807 72,815 71,880 68,667 103,155
The table reports quantile (median) regression estimates that examine whether entrepreneurs earn more than salaried individuals, conditional on educational qualifications. The reduction in sample size for models with control variables is because the estimations use only those observations with non-missing variables for the controls. The dependent variable is logged annual income in Columns 1-4, and net-worth in Columns 5-8 (net-worth is not logged since it has negative values). Data on net worth are not available for NLSY 1980-1984 resulting in a lower number of observations for the corresponding estimations. The estimates in Column [2] and Column [6] are obtained after excluding incorporated self-employed individuals and the estimates in Column [3] and Column [7] are obtained after excluding incorporated self-employed individuals from the estimation sample. The base class (Self-employed = 0) in all estimations is composed of full-time salaried individuals. Standard errors are shown in brackets.
Electronic copy available at: https://ssrn.com/abstract=2596846
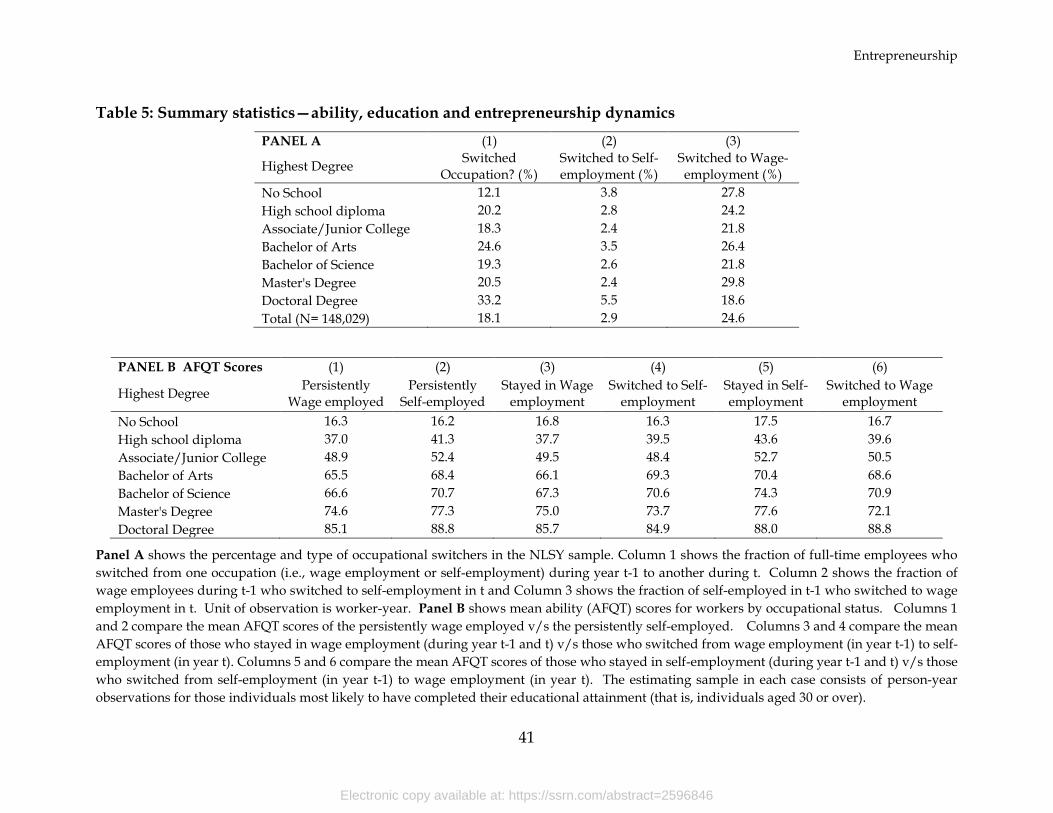
Entrepreneurship
41
Table 5: Summary statistics—ability, education and entrepreneurship dynamics
PANEL A (1) (2) (3)
Highest Degree Switched Occupation? (%)
Switched to Self-employment (%)
Switched to Wage-employment (%)
No School 12.1 3.8 27.8 High school diploma 20.2 2.8 24.2 Associate/Junior College 18.3 2.4 21.8 Bachelor of Arts 24.6 3.5 26.4 Bachelor of Science 19.3 2.6 21.8 Master's Degree 20.5 2.4 29.8 Doctoral Degree 33.2 5.5 18.6 Total (N= 148,029) 18.1 2.9 24.6
PANEL B AFQT Scores (1) (2) (3) (4) (5) (6)
Highest Degree Persistently Wage employed
Persistently Self-employed
Stayed in Wage employment
Switched to Self-employment
Stayed in Self-employment
Switched to Wage employment
No School 16.3 16.2 16.8 16.3 17.5 16.7 High school diploma 37.0 41.3 37.7 39.5 43.6 39.6 Associate/Junior College 48.9 52.4 49.5 48.4 52.7 50.5 Bachelor of Arts 65.5 68.4 66.1 69.3 70.4 68.6 Bachelor of Science 66.6 70.7 67.3 70.6 74.3 70.9 Master's Degree 74.6 77.3 75.0 73.7 77.6 72.1 Doctoral Degree 85.1 88.8 85.7 84.9 88.0 88.8
Panel A shows the percentage and type of occupational switchers in the NLSY sample. Column 1 shows the fraction of full-time employees who switched from one occupation (i.e., wage employment or self-employment) during year t-1 to another during t. Column 2 shows the fraction of wage employees during t-1 who switched to self-employment in t and Column 3 shows the fraction of self-employed in t-1 who switched to wage employment in t. Unit of observation is worker-year. Panel B shows mean ability (AFQT) scores for workers by occupational status. Columns 1 and 2 compare the mean AFQT scores of the persistently wage employed v/s the persistently self-employed. Columns 3 and 4 compare the mean AFQT scores of those who stayed in wage employment (during year t-1 and t) v/s those who switched from wage employment (in year t-1) to self-employment (in year t). Columns 5 and 6 compare the mean AFQT scores of those who stayed in self-employment (during year t-1 and t) v/s those who switched from self-employment (in year t-1) to wage employment (in year t). The estimating sample in each case consists of person-year observations for those individuals most likely to have completed their educational attainment (that is, individuals aged 30 or over).
Electronic copy available at: https://ssrn.com/abstract=2596846
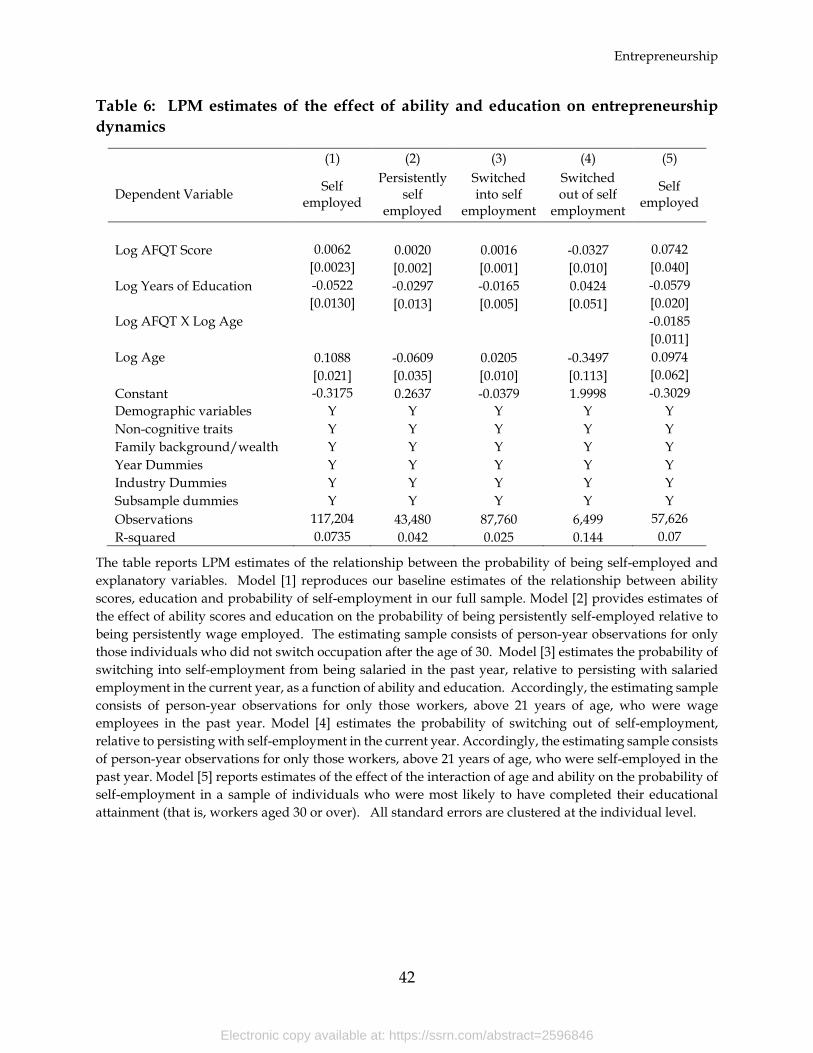
Entrepreneurship
42
Table 6: LPM estimates of the effect of ability and education on entrepreneurship dynamics
(1) (2) (3) (4) (5)
Dependent Variable Self employed
Persistently self
employed
Switched into self
employment
Switched out of self
employment
Self employed
Log AFQT Score 0.0062 0.0020 0.0016 -0.0327 0.0742
[0.0023] [0.002] [0.001] [0.010] [0.040] Log Years of Education -0.0522 -0.0297 -0.0165 0.0424 -0.0579
[0.0130] [0.013] [0.005] [0.051] [0.020] Log AFQT X Log Age -0.0185
[0.011] Log Age 0.1088 -0.0609 0.0205 -0.3497 0.0974
[0.021] [0.035] [0.010] [0.113] [0.062] Constant -0.3175 0.2637 -0.0379 1.9998 -0.3029 Demographic variables Y Y Y Y Y Non-cognitive traits Y Y Y Y Y Family background/wealth Y Y Y Y Y Year Dummies Y Y Y Y Y Industry Dummies Y Y Y Y Y Subsample dummies Y Y Y Y Y Observations 117,204 43,480 87,760 6,499 57,626 R-squared 0.0735 0.042 0.025 0.144 0.07
The table reports LPM estimates of the relationship between the probability of being self-employed and explanatory variables. Model [1] reproduces our baseline estimates of the relationship between ability scores, education and probability of self-employment in our full sample. Model [2] provides estimates of the effect of ability scores and education on the probability of being persistently self-employed relative to being persistently wage employed. The estimating sample consists of person-year observations for only those individuals who did not switch occupation after the age of 30. Model [3] estimates the probability of switching into self-employment from being salaried in the past year, relative to persisting with salaried employment in the current year, as a function of ability and education. Accordingly, the estimating sample consists of person-year observations for only those workers, above 21 years of age, who were wage employees in the past year. Model [4] estimates the probability of switching out of self-employment, relative to persisting with self-employment in the current year. Accordingly, the estimating sample consists of person-year observations for only those workers, above 21 years of age, who were self-employed in the past year. Model [5] reports estimates of the effect of the interaction of age and ability on the probability of self-employment in a sample of individuals who were most likely to have completed their educational attainment (that is, workers aged 30 or over). All standard errors are clustered at the individual level.
Electronic copy available at: https://ssrn.com/abstract=2596846
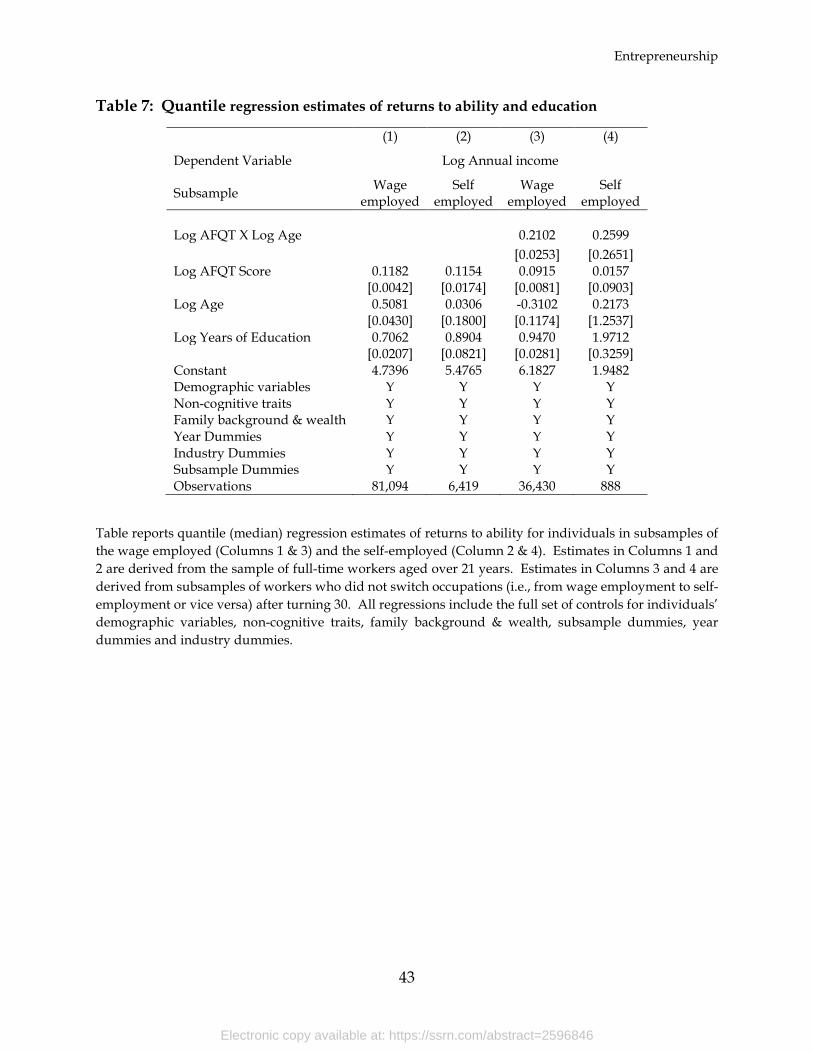
Entrepreneurship
43
Table 7: Quantile regression estimates of returns to ability and education
(1) (2) (3) (4)
Dependent Variable Log Annual income
Subsample Wage employed
Self employed
Wage employed
Self employed
Log AFQT X Log Age 0.2102 0.2599
[0.0253] [0.2651] Log AFQT Score 0.1182 0.1154 0.0915 0.0157
[0.0042] [0.0174] [0.0081] [0.0903] Log Age 0.5081 0.0306 -0.3102 0.2173
[0.0430] [0.1800] [0.1174] [1.2537] Log Years of Education 0.7062 0.8904 0.9470 1.9712
[0.0207] [0.0821] [0.0281] [0.3259] Constant 4.7396 5.4765 6.1827 1.9482 Demographic variables Y Y Y Y Non-cognitive traits Y Y Y Y Family background & wealth Y Y Y Y Year Dummies Y Y Y Y Industry Dummies Y Y Y Y Subsample Dummies Y Y Y Y Observations 81,094 6,419 36,430 888
Table reports quantile (median) regression estimates of returns to ability for individuals in subsamples of the wage employed (Columns 1 & 3) and the self-employed (Column 2 & 4). Estimates in Columns 1 and 2 are derived from the sample of full-time workers aged over 21 years. Estimates in Columns 3 and 4 are derived from subsamples of workers who did not switch occupations (i.e., from wage employment to self-employment or vice versa) after turning 30. All regressions include the full set of controls for individuals’ demographic variables, non-cognitive traits, family background & wealth, subsample dummies, year dummies and industry dummies.
Electronic copy available at: https://ssrn.com/abstract=2596846
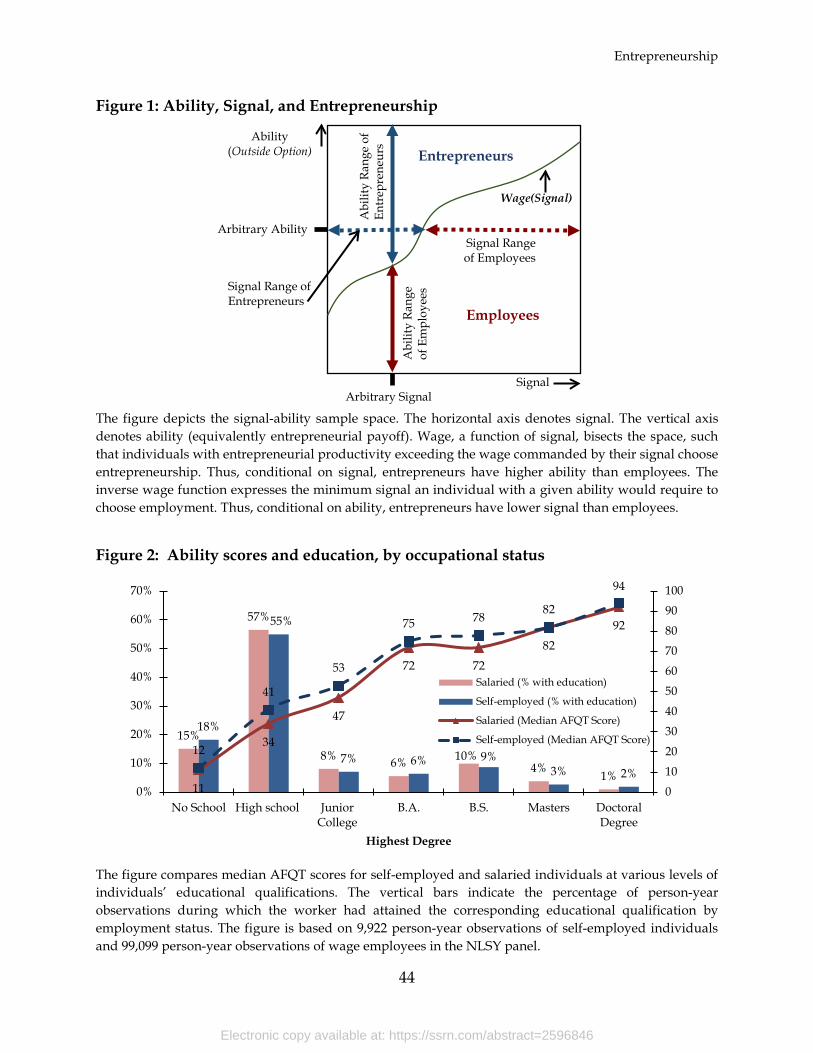
Entrepreneurship
44
Figure 1: Ability, Signal, and Entrepreneurship
The figure depicts the signal-ability sample space. The horizontal axis denotes signal. The vertical axis denotes ability (equivalently entrepreneurial payoff). Wage, a function of signal, bisects the space, such that individuals with entrepreneurial productivity exceeding the wage commanded by their signal choose entrepreneurship. Thus, conditional on signal, entrepreneurs have higher ability than employees. The inverse wage function expresses the minimum signal an individual with a given ability would require to choose employment. Thus, conditional on ability, entrepreneurs have lower signal than employees.
Figure 2: Ability scores and education, by occupational status
The figure compares median AFQT scores for self-employed and salaried individuals at various levels of individuals’ educational qualifications. The vertical bars indicate the percentage of person-year observations during which the worker had attained the corresponding educational qualification by employment status. The figure is based on 9,922 person-year observations of self-employed individuals and 99,099 person-year observations of wage employees in the NLSY panel.
15%
57%
8% 6% 10%4%
1%
18%
55%
7% 6% 9%3% 2%
11
34
47
72 7282
92
12
41
53
75 78 82
94
0102030405060708090100
0%
10%
20%
30%
40%
50%
60%
70%
No School High school JuniorCollege
B.A. B.S. Masters DoctoralDegree
Highest Degree
Salaried (% with education)
Self-employed (% with education)
Salaried (Median AFQT Score)
Self-employed (Median AFQT Score)
Ability (Outside Option)
Signal
Entrepreneurs
Employees
Abi
lity
Rang
e of
En
trep
rene
urs
Abi
lity
Rang
e of
Em
ploy
ees
Arbitrary Signal
Signal Range of Entrepreneurs
Signal Range of Employees
Arbitrary Ability
Wage(Signal)
Electronic copy available at: https://ssrn.com/abstract=2596846
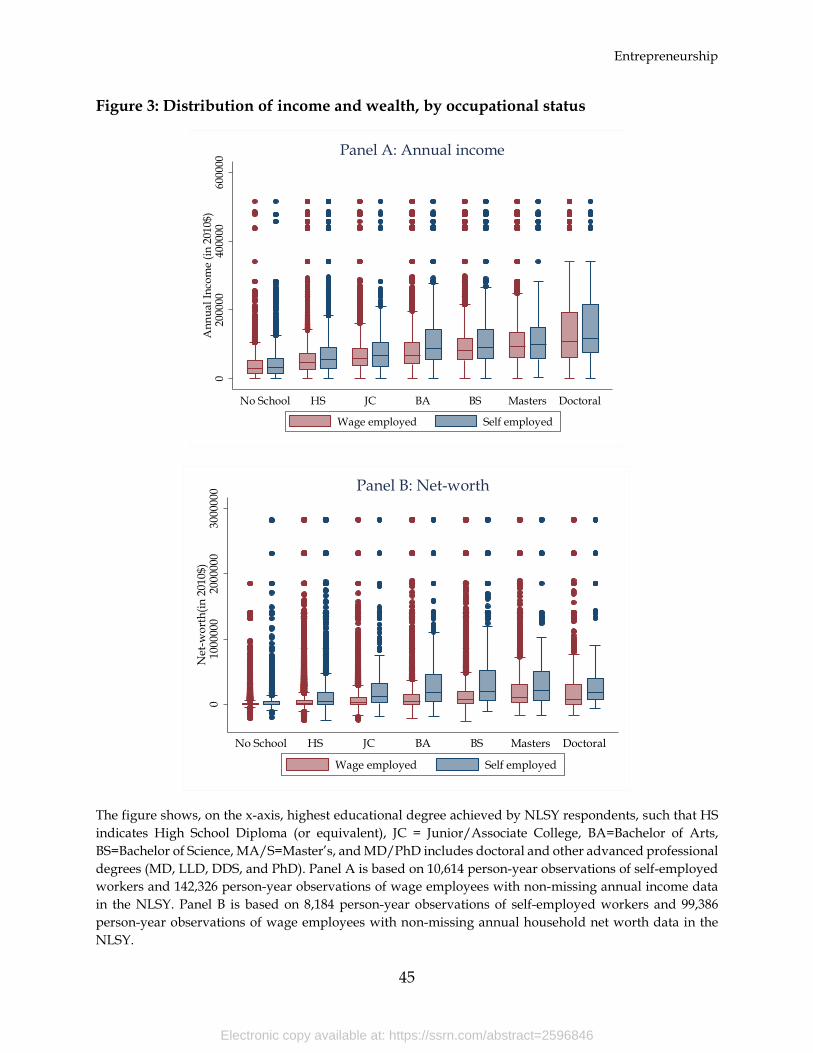
Entrepreneurship
45
Figure 3: Distribution of income and wealth, by occupational status
The figure shows, on the x-axis, highest educational degree achieved by NLSY respondents, such that HS indicates High School Diploma (or equivalent), JC = Junior/Associate College, BA=Bachelor of Arts, BS=Bachelor of Science, MA/S=Master’s, and MD/PhD includes doctoral and other advanced professional degrees (MD, LLD, DDS, and PhD). Panel A is based on 10,614 person-year observations of self-employed workers and 142,326 person-year observations of wage employees with non-missing annual income data in the NLSY. Panel B is based on 8,184 person-year observations of self-employed workers and 99,386 person-year observations of wage employees with non-missing annual household net worth data in the NLSY.
020
0000
4000
0060
0000
Ann
ual I
ncom
e (in
201
0$)
No School HS JC BA BS Masters Doctoral
Panel A: Annual income
Wage employed Self employed
010
0000
020
0000
030
0000
0N
et-w
orth
(in 2
010$
)
No School HS JC BA BS Masters Doctoral
Panel B: Net-worth
Wage employed Self employed
Electronic copy available at: https://ssrn.com/abstract=2596846
Entrepreneurship
A Theoretical Appendix
For Online Publication Only
A.1 Extensions to Static Asymmetric Information
A.1.1 Endogenous Signal Acquisition
In certain situations, an exogenous signal of ability is not just a simplification but the only
reasonable model; e.g. observable but hard to cultivate physical traits like height and chiselled
cheekbones (noisily) signal fitness for certain occupations like basketball or fashion modelling.
But in other settings workers make decisions which influence the signals of their ability that
employers see. Our leading empirical example, formal educational attainment, is clearly a case
where the individual endogenously influences the signal. Does this difference play a meaningful
role in the theory?
To answer this, consider an additional stage, expanding on Spence’s (1973) canonical job-
market signaling model, that occurs before the occupational choice decision– one where each
individual chooses how much effort to exert in the acquisition of an educational signal. Individ-
uals have privately known ability θ distributed according to log-concave density F ′, such that
limθ→θ F′ (θ) = 0. In childhood (Stage 1) individuals invest effort in an observable educational
signal. The signal is the sum of chosen effort e and noise ε distributed according to log-concave
density G′ (i.e., S (e) = e+ ε). Effort in education costs C (e, θ). Higher effort levels cost more
(Ce > 0 , where the subscript denotes the partial derivative with respect to e), but any level
of effort is less costly for more able individuals (Cθ < 0). We also assume that C is suffi ciently
convex in effort for individuals’second-order-condition (SOC) to hold (see proof of Lemma 7 in
the Theoretical Appendix A.6) and the standard Spence-Mirrlees (or single crossing) property
Ceθ < 0 holds. In adulthood (Stage 2) individuals choose either to enter entrepreneurship,
where they earn their ability θ, or accept a wage w (S) as described in the main model.
In order for the results of our main model to hold for endogenously determined signals, the
resulting posterior distribution of ability given a signal must be log-concave and satisfy the
MLRP in equilibrium. In Appendix A.7 we show that it does:
Lemma 3 Equilibrium effort exerted in pursuit of signal (and average signal) increases in
ability, such that (i) the posterior distribution of ability F (θ|S) is log-concave and (ii) the
posterior density of ability F ′ (θ|S) satisfies the MLRP.
Therefore,
1
Electronic copy available at: https://ssrn.com/abstract=2596846
Entrepreneurship
Proposition 3 When workers endogenously acquire signal before making an occupational choice,
all results of Section 3 continue to hold.
In summary, the employer does not care whether signals are exogenously endowed or en-
dogenously acquired per se. She only cares about their statistical relationship to unobservable
productivity. This is why the addition of a pre-stage where workers endogenously cultivate
signals does not change results from the base model, where signals are acquired exogenously.
It may seem counterintuitive that entrepreneurs would invest in a signal at all, because in
our base model, a strong signal does not help them. Indeed, if the signal were a deterministic
function of ability and effort, then individuals of some ability levels would all become education
eschewing entrepreneurs, and individuals of other ability levels would engage in just enough
education to signal their ability (and fitness for wage work). But the assignment of a signal is
stochastic. So, all individuals of a given ability in the pre-stage have the same motivation and
the same ex ante chance of becoming an entrepreneur. They invest optimally based on the prior
odds. Effort exerted pursuing a signal depends only on ability in equilibrium– all individuals
of a given ability try just as hard to earn a degree. Ex post, though, those with good random
signal draws will accept wage offers, while those with poor draws will become entrepreneurs.
Note that this extension, like Spence’s original model, is one of pure signalling– that is,
effort exerted in acquiring education does not alter ability. But it could be that education
fundamentally improves productivity (as in Becker 1962 and Mincer 1970). Does this parsimony
motivated omission matter? In our model, the amount of effort exerted is, in equilibrium, an
increasing function of ability. Thus, if the human capital added by education increases in effort
and innate ability, then in equilibrium, final human capital becomes a transform of ability itself.
So, although education changes human capital, and individuals seek more of it for its productive
value, the signal will still have the required statistical properties with respect to total human
capital, and our model’s propositions hold.29
We now show that our asymmetric explanation of entrepreneurial choice extends to this
setting, where productivity depends on both privately and publicly observable human capital.
A.1.2 Productive Signals
Treating ability as unidimensional and signal as unproductive distills the model to its simplest
essence, but a signal is often productive in its own right. For example, although innate ability
29Formally, so long as the human capital enhanced by education is modelled as a noisy function of effortand ability, such that the posterior distribution of ability given pedigree remained log-concave and satisfied theMLRP, our results will continue to hold.
2
Electronic copy available at: https://ssrn.com/abstract=2596846
Entrepreneurship
positively correlates to educational attainment, it is generally accepted that skills acquired
through formal education are productive, increasing human capital itself. Similarly, documented
job experience signals productivity but it often makes one more productive too. Here we show
that allowing productivity to depend both on hidden innate ability and observable signal does
not alter our predictions. For simplicity, we revert to our base model of exogenously determined
signals but allow them to be productive.
Suppose that productivity in entrepreneurship and wage work are respectively given by
πT (θ, S) and πW (θ, S) , increasing in both parameters, where θ, S and F are defined as in
Section 3.1. Again the worker chooses entrepreneurship if and only if her payoff from doing so
exceeds the wage she is offered by the firm, which is a function of S: πT (θ, S) > w (S). Although
slightly more complex than simply the wage, as it is when human capital is unidimensional, there
is still a cutoff level of innate ability above which the worker chooses entrepreneurship θ > θS =
π−1T (w (S) , S), where π−1
T (•, S) denotes the inverse function of entrepreneurial productivity,
which yields innate ability, given signal S. Thus, when θS lies within the support of innate
ability, the logic of Proposition 1 and Corollary 1 remain unchanged. Analogous to the one-
dimensional ability case, for every S, the firm chooses w to solve
maxw
∫ θS
θ
(πW (θ, S)− w) dF (θ|S)
With assumptions analogous to those in the one dimensional ability model, this problem is also
well-behaved, and the equilibrium wage increases in signal.30 Thus, Proposition 2 continues to
hold. A numerical example is included in Appendix A.5.
A.1.3 Entrepreneurship as a Signal
Another potential form of endogenous signalling stems directly from our theory itself. Since
workers who reject their offers are more able than those who accept, might not rejecting an offer
(and becoming an entrepreneur) signal higher ability and trigger a higher wage offer from an
employer? It depends on the information credibly contained in a wage offer rejection. The key
learning from Spence’s (1973) model is that a separating equilibrium can only exist if higher
signals are relatively more costly for low ability workers to obtain, so that in equilibrium, high
signals are more likely to indicate high ability (i.e. the MLRP is satisfied). If rejecting a wage
offer and setting up a firm costs workers of all abilities approximately the same amount, then
30Since the fact that wages increase in the quality of pedigree, especially education, is generally uncontrover-sial, and the proofs are no more enlighting than those for the one dimensional case, we omit them.
3
Electronic copy available at: https://ssrn.com/abstract=2596846
Entrepreneurship
this key requirement fails.31 In the short term, saying ‘no’to an offer, adding a brief period of
self-employment on one’s CV and even filing incorporation paperwork, is unlikely to separate
high ability individuals from low– if firms offered wage premia that exceeded these costs, every
employee, regardless of ability, would incur them. So, firms have no incentive to pay for the
simple signal of wage offer rejection or even brief entrepreneurial stints. Hence, the model does
not unravel due to workers “playing hard to get.”
On the other hand, a key implication of our theory is that conditional on signal, entrepre-
neurs are higher ability– so occupational choice must eventually be a signal of ability. In the
long term, the signal of entrepreneurship is more costly for low ability workers than for high
ability workers, because entrepreneurs are residual claimants of their respective abilities. This
differential, if large enough, can satisfy the requirements for a separating signalling equilibrium.
Assuming time invariant production functions in entrepreneurship and wage employment, and
without knowing anything about the performance of the venture, the longer the entrepreneurial
stint the greater the ability signal, and the better the ultimate wage offer. Having a history
of long term entrepreneurship then simply becomes part of one’s signal, just like education or
any other observable characteristic. Thereafter, to attract an entrepreneur the firm would have
to offer a wage that exceeds the individuals’future entrepreneurial payoffs. Again, our static
model is agnostic about how signal is obtained and simply requires that the signal composed of
all observables be related to underlying ability by the MLRP at the time a wage offer is made.
Of course, over a worker’s career the labor market gets other signals of her ability beyond
entrepreneurial history, many of which the empiricist does not observe. When the labor market
gets more signals of an employee’s type over time, asymmetric information, and with it ad-
verse selection into entrepreneurship, diminishes. We discuss this further in Section 3.3.2 and
Appendix A.4.
A.1.4 Imperfect Worker Information
Any worker knows his strengths and weakness better with experience than when his career
started. Thus, a more realistic model would reveal to each worker, in addition to his public signal
31To understand why, suppose that a firm offered w (S) to all workers with signal S and that starting anew venture costs c ≥ 0 , regardless of ability. Then all workers with ability θ > w (S) + c chooseentrepreneurship. What if the firm offered wE (S) > w (S) to those who rejected w (S) (i.e. entrepreneurs)?First, the highest ability workers (i.e. θ > wE (S)+ c) still reject the new offer and continue with their ventures.Second, if wE (S)− c > w (S) , then all workers with ability θ ≤ wE (S) + c will reject w (S) , start firmsand accept offer wE (S); it is more profitable for even the least able workers. If wE (S) − c ≤ w (S) , thenall workers with ability θ ≤ wE (S) + c will forego setting up a venture and simply accept w (S). There is noinformation in the signal of rejecting an offer and setting up a firm by itself; paying for it makes no sense.
4
Electronic copy available at: https://ssrn.com/abstract=2596846
Entrepreneurship
S, a private signal yt of ability, rather than ability θ itself. Here we mean yt to be an aggregate
of accumulated private signals over time, such that the precision of yt exceeds the precision of
yt−1. Then the worker, rather than knowing his actual ability θ,could compute its distribution
conditional on his private and public signals: H (θ| yt, S). Were he risk neutral, then the worker
would become an entrepreneur in period t if and only if his expected ability (equivalently
entrepreneurial payoff) exceeded the market wage for his public signal type: E [θ| yt, S] >
w (S) . Subject to H satisfying the MLRP in θ with respect to yt for all S, the LHS will
increase in yt such that all S pedigreed workers whose private signal exceeds some cutoff yt
will choose entrepreneurship, all whose signal falls below will accept wage work, and all of the
original intuitions of our base model hold.
The one significant difference yielded by adding imperfection to the worker’s informa-
tion about his ability is that some individuals who should have chosen wage work become
entrepreneurs– since their private signals are noisy, although they expect their entrepreneurial
productivity to exceed the wage offer, their actual entrepreneurial productivity is lower. As the
precision of workers’private signals improves over time, these choices will be corrected– those
that switch from entrepreneurship into employment will tend to have higher public signals rela-
tive to their ability compared to those who remain entrepreneurs. Indeed, we will show exactly
this pattern in the data in Section 4.4.
Lastly, not only might workers’observe private signals of their own ability, but employers
may also observe private signals of job applicants’ability. Furthermore, while it is intuitive that
workers’information about their ability is more precise than the labor market’s, the worker can
have an asymmetric informational advantage in equilibrium, even when ex ante less informed
of his own ability than his potential employers. To see this, suppose a worker has unobservable
ability, but in addition to a public signal, both worker and employer get private signals of the
worker’s ability, such that conditional on that ability, they are independent. The employer
makes the worker a wage offer based on her public and private signals of the worker’s ability,
knowing that any worker who believes his ability higher will reject, and that since the worker
does not know his own ability with certainty, the wage offer itself may covey information to
the employee, and alter his beliefs about his own ability, in equilibrium. In particular, if the
employer offers all workers the same wage, then there is no information in the wage offer, but
if the employer offers a wage (strictly) increasing in her private signal, then the worker can
(perfectly) back out the employer’s private signal of his ability from her wage offer. Thus in
this setting, due to the fact that offers are made by employers, regardless of whose raw signal
is noisier ex ante, the worker is always better informed of his ability in equilibrium than the
5
Electronic copy available at: https://ssrn.com/abstract=2596846
Entrepreneurship
employer, and our model’s predictions hold.
A.2 Static Comparative Advantage
In Section 3.2 of the main text, we verbally argue that a matching model can deliver Propositions
1 and 2 together with the first part of Corollary 1, if and only if innate ability has a relative
comparative advantage in entrepreneurship, while educations’ relative advantage is in wage
work. To see this more formally, consider a simple matching model of entrepreneurial choice
with perfectly observable two dimensional ability 〈θ, S〉 and linear production function
πY (θ, S) = XY θ + (1−XY )S (2)
where XY ∈ [0, 1] captures the productivity of innate ability θ relative to education S in either
entrepreneurship or wage work (Y ∈ {T,W}). In a competitive market, each worker earnshis productivity. Hence, a worker, chooses entrepreneurship if and only if he earns more by
doing so (i.e., πT (θ, S) > πW (θ, S)), which reduces simply to (i) θ > S if innate ability has
a comparative advantage in entrepreneurship (i.e., XT > XW ) or (ii) θ < S if innate ability
has a comparative advantage in wage work (i.e., XT < XW ). In the former case, this simple
matching model yields the predictions of the asymmetric information model, except on income
variance.32 In the latter case it predicts precisely the opposite.
A.3 Dynamic Comparative Advantage
This simple matching model is easily extended to multiple periods with incomplete information
about worker ability by allowing the worker to accumulate a pedigree– a series of publicly
observable signals, each positively correlated to his unobservable, innate ability. To be precise,
let hidden innate ability θ be distributed with full support over the reals. In each period
t, each worker is assigned an additional publicly observable signal θt ∈ {H,L} of his innateability, such that smarter individuals are more likely to receive H signals (formally, let p (θ) ≡Pr{θt = H
∣∣∣ θ} , for all t, and for all θ′ > θ′′, p (θ′) > p (θ′′)). We denote the number of H
signals by time t as Kt. Assume that the first signal of ability is the worker’s education (i.e.,
S ∈ {SL, SH} where S = Sθ1). Unlike all subsequent signals, education also increases worker
productivity directly, as specified in eqn. (2).
32To obtain the “variance” result from matching would require which would additionallyrequire that the joint distribution of ability and education satisfy: X2
TV ar [θ| θ > S, S] >X2WV ar [θ| θ ≤ S, S] .
6
Electronic copy available at: https://ssrn.com/abstract=2596846
Entrepreneurship
Since there is no information asymmetry, worker and employer always agree on the worker’s
expected innate ability. Hence, they also agree on his expected productivity in each occupation.
A worker will choose entrepreneurship in period t if and only if he expects to earn more as an
entrepreneur: E [πT (θ, S)|S,Kt] > E [πW (θ, S)|S,Kt], or equivalently. Similar to the perfect
information case above, this implies that if innate ability has a comparative advantage in
entrepreneurship (i.e., XT > XW ), an individual will choose entrepreneurship if and only if
his expected innate ability conditional on his signal exceeds his education: E [θ|S,Kt] > S.
Observe that, since all individuals with the same education and signal set {S,Kt} have thesame expected ability, they will enter the same occupation.
Suppose that in the first period, all individuals with education S choose entrepreneurship
(because E [θ|S] > S). Then in the first period, all entrepreneurs with education S have
average ability E [θ|S]. In the second period, the first period entrepreneurs with education
S either (1) all stay in entrepreneurship, because regardless of what the new signal is, their
expected productivity is higher in entrepreneurship (i.e., E [θ|S,H] > E [θ|S, L] > S), or (2)
only those with high signals (θ2 = H) stay in entrepreneurship, while those with low signals
(θ2 = L) become employees (because E [θ|S,H] > S ≥ E [θ|S, L]). In case (1) the average
ability of entrepreneurs in the second period is E [θ|S] , exactly as in the first period, while in
case (2) the average ability of entrepreneurs is E [θ|S,H] in the second period, which is strictly
greater than E [θ|S] .
Suppose, instead, that in the first period, all individuals with education S choose wage
employment (because S ≥ E [θ|S]). Then in the first period, all employees with education S
have average ability E [θ|S]. In the second period, the first period employees with education S
either (1) all stay in wage employment (because S ≥ E [θ|S,H] > E [θ|S, L]), or (2) only those
with θ2 = L signals stay in employment, while those with θ2 = H signals become entrepreneurs
(because E [θ|S,H] > S ≥ E [θ|S, L]). In case (1) the average ability of employees in the
second period is E [θ|S], exactly as in the first period, while in case (2) the average ability of
employees is E [θ|S, L] in the second period, which is strictly less than E [θ|S] .
This pattern continues period after period– for every level of education S, entrepreneurs
will have weakly higher innate ability, and employees will have weakly lower innate ability from
period t to period t+1, and for some t large enough the inequalities will be strict.33 Intuitively,
the matching improves over time– eventually, every individual sorts into the occupation where
he has a comparative advantage (e.g. all with θ > S eventually become entrepreneurs and stay
33This follows because θ has full support over R and XT > XW , which implies that for every finite S, thereexists a threshold ability above which a positive measure of workers are more productive as entrepreneurs andbelow which a positive measure are more productive as workers.
7
Electronic copy available at: https://ssrn.com/abstract=2596846
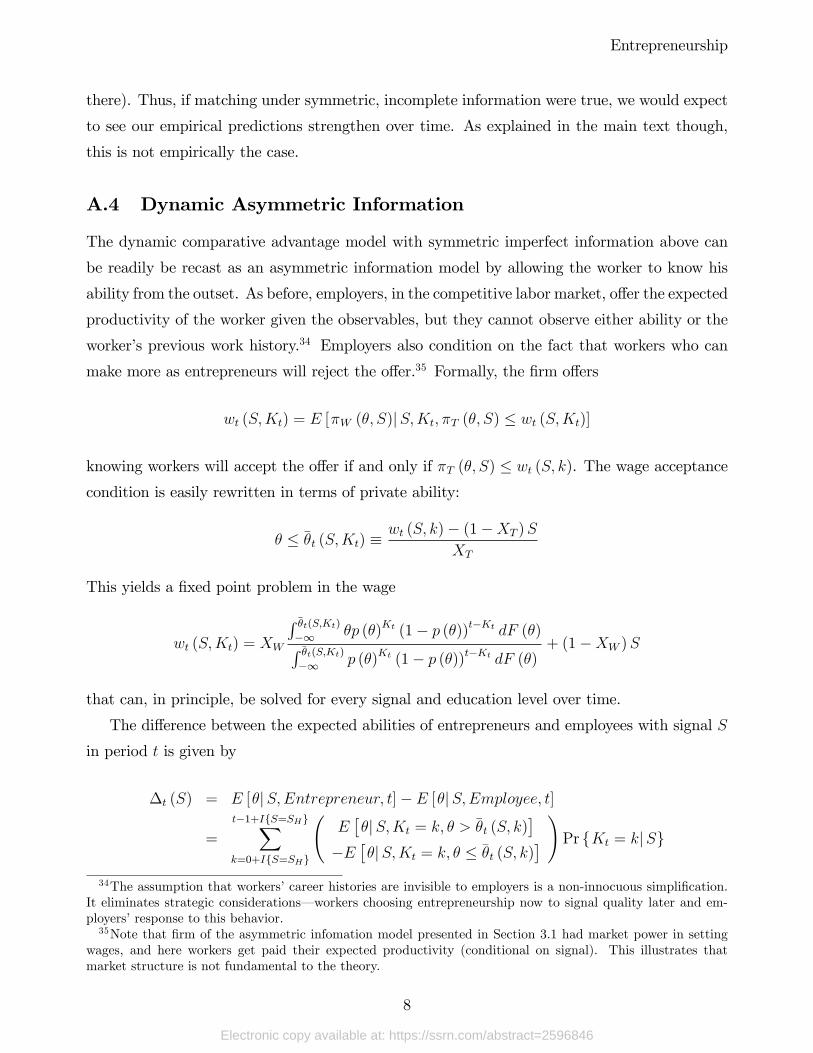
Entrepreneurship
there). Thus, if matching under symmetric, incomplete information were true, we would expect
to see our empirical predictions strengthen over time. As explained in the main text though,
this is not empirically the case.
A.4 Dynamic Asymmetric Information
The dynamic comparative advantage model with symmetric imperfect information above can
be readily be recast as an asymmetric information model by allowing the worker to know his
ability from the outset. As before, employers, in the competitive labor market, offer the expected
productivity of the worker given the observables, but they cannot observe either ability or the
worker’s previous work history.34 Employers also condition on the fact that workers who can
make more as entrepreneurs will reject the offer.35 Formally, the firm offers
wt (S,Kt) = E [πW (θ, S)|S,Kt, πT (θ, S) ≤ wt (S,Kt)]
knowing workers will accept the offer if and only if πT (θ, S) ≤ wt (S, k). The wage acceptance
condition is easily rewritten in terms of private ability:
θ ≤ θt (S,Kt) ≡wt (S, k)− (1−XT )S
XT
This yields a fixed point problem in the wage
wt (S,Kt) = XW
∫ θt(S,Kt)
−∞ θp (θ)Kt (1− p (θ))t−Kt dF (θ)∫ θt(S,Kt)
−∞ p (θ)Kt (1− p (θ))t−Kt dF (θ)+ (1−XW )S
that can, in principle, be solved for every signal and education level over time.
The difference between the expected abilities of entrepreneurs and employees with signal S
in period t is given by
∆t (S) = E [θ|S,Entrepreneur, t]− E [θ|S,Employee, t]
=
t−1+I{S=SH}∑k=0+I{S=SH}
(E[θ|S,Kt = k, θ > θt (S, k)
]−E
[θ|S,Kt = k, θ ≤ θt (S, k)
] )Pr {Kt = k|S}
34The assumption that workers’career histories are invisible to employers is a non-innocuous simplification.It eliminates strategic considerations– workers choosing entrepreneurship now to signal quality later and em-ployers’response to this behavior.35Note that firm of the asymmetric infomation model presented in Section 3.1 had market power in setting
wages, and here workers get paid their expected productivity (conditional on signal). This illustrates thatmarket structure is not fundamental to the theory.
8
Electronic copy available at: https://ssrn.com/abstract=2596846
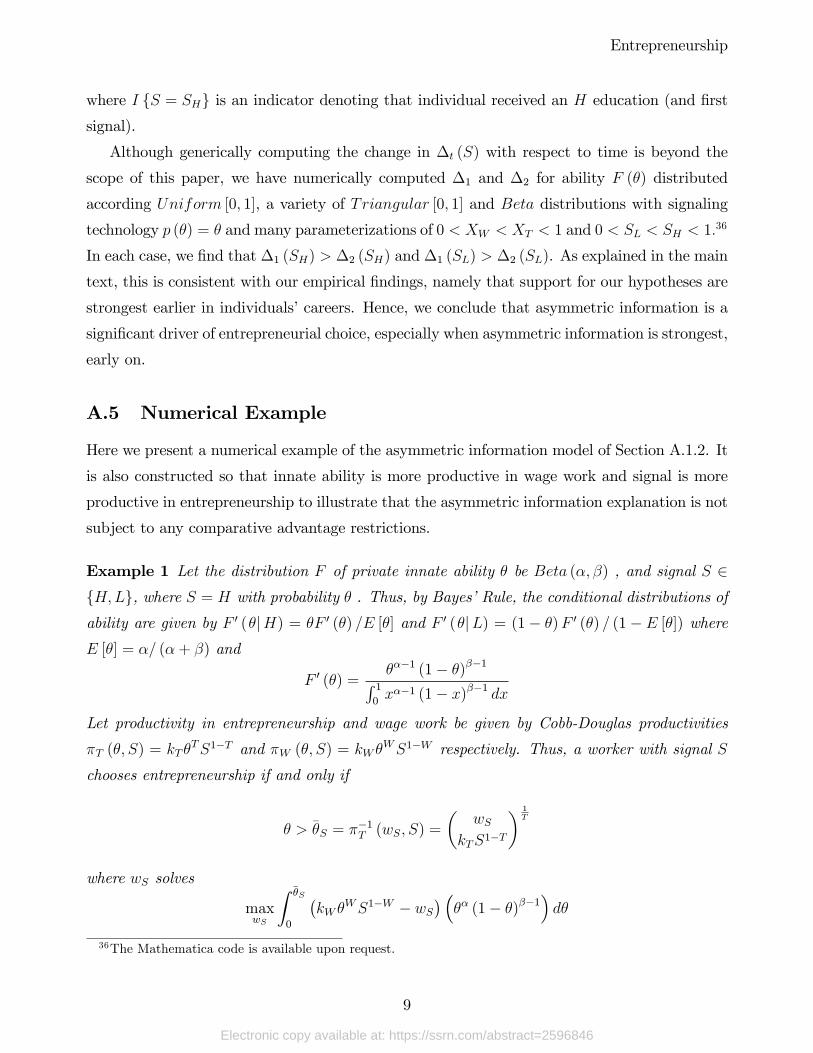
Entrepreneurship
where I {S = SH} is an indicator denoting that individual received an H education (and first
signal).
Although generically computing the change in ∆t (S) with respect to time is beyond the
scope of this paper, we have numerically computed ∆1 and ∆2 for ability F (θ) distributed
according Uniform [0, 1], a variety of Triangular [0, 1] and Beta distributions with signaling
technology p (θ) = θ and many parameterizations of 0 < XW < XT < 1 and 0 < SL < SH < 1.36
In each case, we find that ∆1 (SH) > ∆2 (SH) and ∆1 (SL) > ∆2 (SL). As explained in the main
text, this is consistent with our empirical findings, namely that support for our hypotheses are
strongest earlier in individuals’careers. Hence, we conclude that asymmetric information is a
significant driver of entrepreneurial choice, especially when asymmetric information is strongest,
early on.
A.5 Numerical Example
Here we present a numerical example of the asymmetric information model of Section A.1.2. It
is also constructed so that innate ability is more productive in wage work and signal is more
productive in entrepreneurship to illustrate that the asymmetric information explanation is not
subject to any comparative advantage restrictions.
Example 1 Let the distribution F of private innate ability θ be Beta (α, β) , and signal S ∈{H,L}, where S = H with probability θ . Thus, by Bayes’Rule, the conditional distributions of
ability are given by F ′ (θ|H) = θF ′ (θ) /E [θ] and F ′ (θ|L) = (1− θ)F ′ (θ) / (1− E [θ]) where
E [θ] = α/ (α + β) and
F ′ (θ) =θα−1 (1− θ)β−1∫ 1
0xα−1 (1− x)β−1 dx
Let productivity in entrepreneurship and wage work be given by Cobb-Douglas productivities
πT (θ, S) = kT θTS1−T and πW (θ, S) = kW θ
WS1−W respectively. Thus, a worker with signal S
chooses entrepreneurship if and only if
θ > θS = π−1T (wS, S) =
(wS
kTS1−T
) 1T
where wS solves
maxwS
∫ θS
0
(kW θ
WS1−W − wS) (θα (1− θ)β−1
)dθ
36The Mathematica code is available upon request.
9
Electronic copy available at: https://ssrn.com/abstract=2596846

Entrepreneurship
Assume the following parameter set: α = β = 10, H = 54> L = 1, kT = 1, kW = 2, and
T = 12< W = 2
3. The firm optimally offers w∗H ≈ 0.944 to workers with signal H, and
all with innate ability below θH ≈ 0.713 accept; all more able workers with signal H become
entrepreneurs. The firm optimally offer w∗L ≈ 0.816 to workers with signal L, and all with
innate ability below θL ≈ 0.665 accept; all more able workers with signal L become entrepreneurs.
Figure A1 illustrates the solution.
Figure A1 here
A.6 Proofs for Base Model
Lemma 4 Any interior solution to the FOC is the unique global optimum.
Proof. Taking the derivative of (1) with respect to w yields the following Second Order
Condition (SOC):
(π (w)− w)′ F ′ (w|S) + (π (w)− w)F ′′ (w|S)− F ′ (w|S) < 0 (3)
We can write the FOC from (1) as
(π (w)− w)F ′ (w|S)
F (w|S)= 1 (4)
Thus, dividing (3) by F (w|S) and multiplying the final term by the LHS of (4), we see that
the SOC holds at a critical point if and only if
(π (w)− w)′F ′ (w|S)
F (w|S)+ (π (w)− w)
[F ′′ (w|S)
F (w|S)−(F ′ (w|S)
F (w| s)
)2]< 0
which is equivalent to
(π (w)− w)′F ′ (w|S)
F (w|S)+ (π (w)− w) [lnF (w|S)]′′ < 0 (5)
The first term is negative due to decreasing differences in the production technologies (i.e., for
all θ, (π (θ)− θ)′ ≤ 0 ), and the second term is also negative because (a) any w satisfying (4) is
less than π (w) and (b) F (w|S) is log-concave. Thus, the SOC holds at all critical points.
Lemma 1An interior, separating equilibrium exists, in which positive measures of individuals
choose entrepreneurship and traditional employment.
10
Electronic copy available at: https://ssrn.com/abstract=2596846
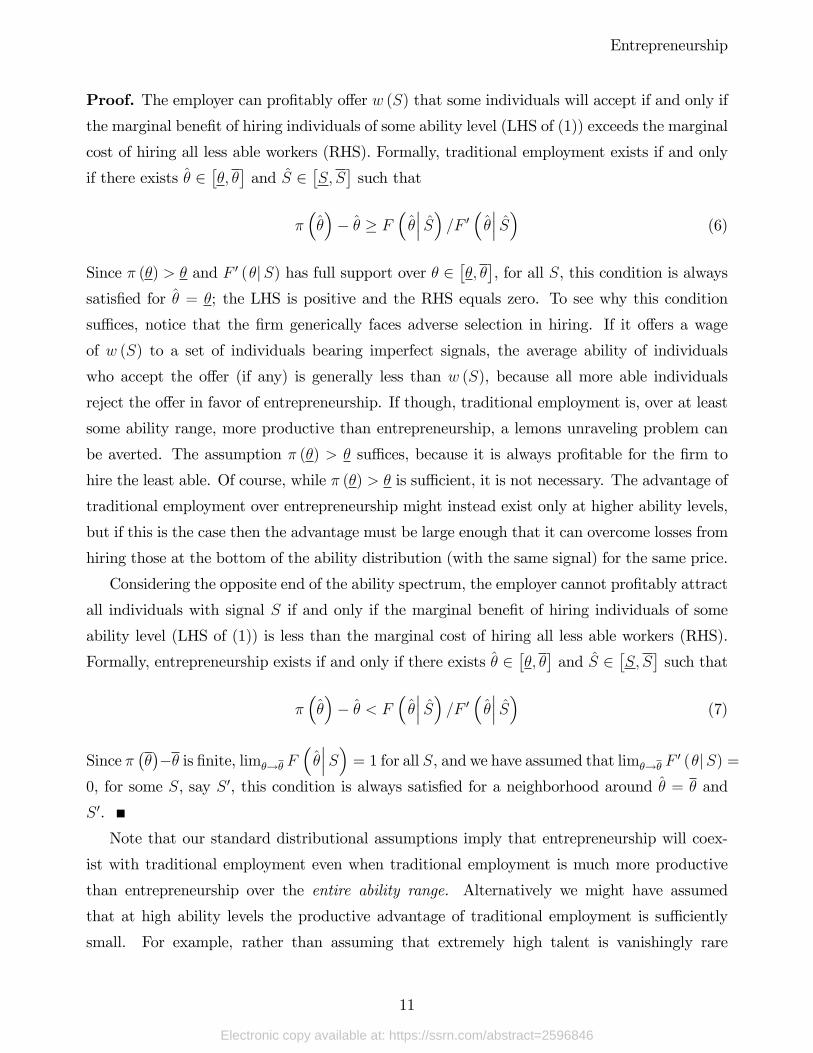
Entrepreneurship
Proof. The employer can profitably offer w (S) that some individuals will accept if and only if
the marginal benefit of hiring individuals of some ability level (LHS of (1)) exceeds the marginal
cost of hiring all less able workers (RHS). Formally, traditional employment exists if and only
if there exists θ ∈[θ, θ]and S ∈
[S, S
]such that
π(θ)− θ ≥ F
(θ∣∣∣ S) /F ′ ( θ∣∣∣ S) (6)
Since π (θ) > θ and F ′ (θ|S) has full support over θ ∈[θ, θ], for all S, this condition is always
satisfied for θ = θ; the LHS is positive and the RHS equals zero. To see why this condition
suffi ces, notice that the firm generically faces adverse selection in hiring. If it offers a wage
of w (S) to a set of individuals bearing imperfect signals, the average ability of individuals
who accept the offer (if any) is generally less than w (S), because all more able individuals
reject the offer in favor of entrepreneurship. If though, traditional employment is, over at least
some ability range, more productive than entrepreneurship, a lemons unraveling problem can
be averted. The assumption π (θ) > θ suffi ces, because it is always profitable for the firm to
hire the least able. Of course, while π (θ) > θ is suffi cient, it is not necessary. The advantage of
traditional employment over entrepreneurship might instead exist only at higher ability levels,
but if this is the case then the advantage must be large enough that it can overcome losses from
hiring those at the bottom of the ability distribution (with the same signal) for the same price.
Considering the opposite end of the ability spectrum, the employer cannot profitably attract
all individuals with signal S if and only if the marginal benefit of hiring individuals of some
ability level (LHS of (1)) is less than the marginal cost of hiring all less able workers (RHS).
Formally, entrepreneurship exists if and only if there exists θ ∈[θ, θ]and S ∈
[S, S
]such that
π(θ)− θ < F
(θ∣∣∣ S) /F ′ ( θ∣∣∣ S) (7)
Since π(θ)−θ is finite, limθ→θ F
(θ∣∣∣S) = 1 for all S, and we have assumed that limθ→θ F
′ (θ|S) =
0, for some S, say S ′, this condition is always satisfied for a neighborhood around θ = θ and
S ′.
Note that our standard distributional assumptions imply that entrepreneurship will coex-
ist with traditional employment even when traditional employment is much more productive
than entrepreneurship over the entire ability range. Alternatively we might have assumed
that at high ability levels the productive advantage of traditional employment is suffi ciently
small. For example, rather than assuming that extremely high talent is vanishingly rare
11
Electronic copy available at: https://ssrn.com/abstract=2596846
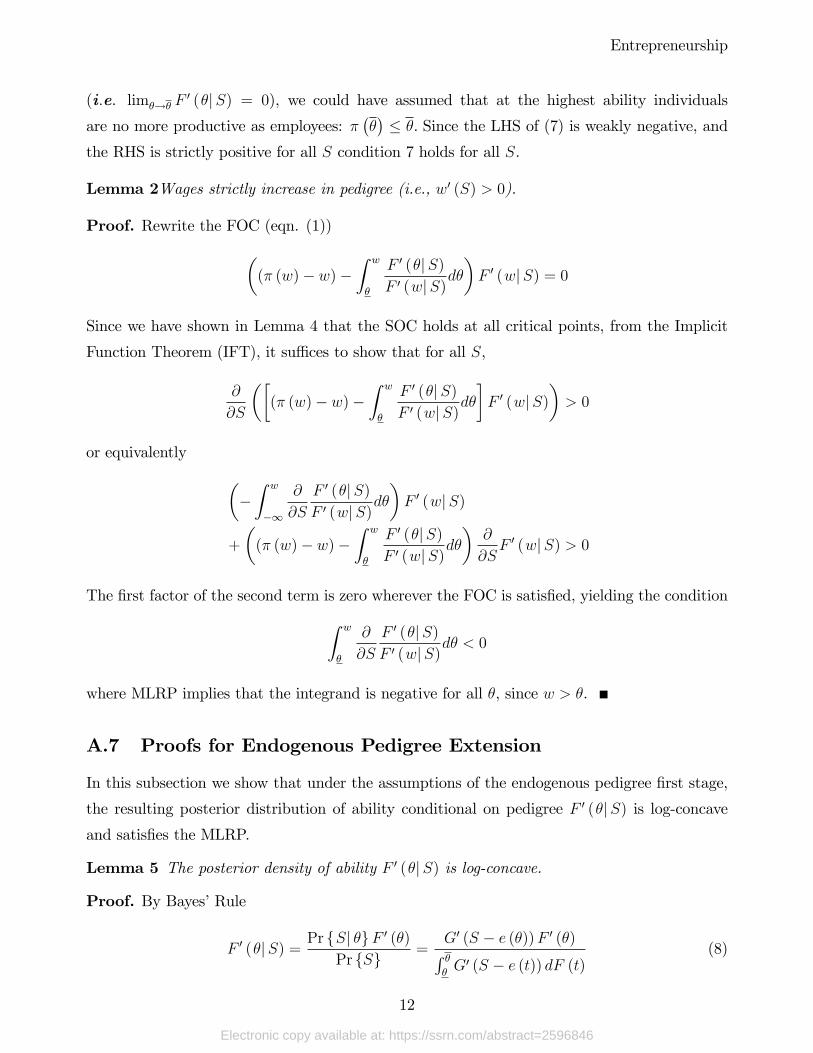
Entrepreneurship
(i.e. limθ→θ F′ (θ|S) = 0), we could have assumed that at the highest ability individuals
are no more productive as employees: π(θ)≤ θ. Since the LHS of (7) is weakly negative, and
the RHS is strictly positive for all S condition 7 holds for all S.
Lemma 2Wages strictly increase in pedigree (i.e., w′ (S) > 0).
Proof. Rewrite the FOC (eqn. (1))((π (w)− w)−
∫ w
θ
F ′ (θ|S)
F ′ (w|S)dθ
)F ′ (w|S) = 0
Since we have shown in Lemma 4 that the SOC holds at all critical points, from the Implicit
Function Theorem (IFT), it suffi ces to show that for all S,
∂
∂S
([(π (w)− w)−
∫ w
θ
F ′ (θ|S)
F ′ (w|S)dθ
]F ′ (w|S)
)> 0
or equivalently (−∫ w
−∞
∂
∂S
F ′ (θ|S)
F ′ (w|S)dθ
)F ′ (w|S)
+
((π (w)− w)−
∫ w
θ
F ′ (θ|S)
F ′ (w|S)dθ
)∂
∂SF ′ (w|S) > 0
The first factor of the second term is zero wherever the FOC is satisfied, yielding the condition∫ w
θ
∂
∂S
F ′ (θ|S)
F ′ (w|S)dθ < 0
where MLRP implies that the integrand is negative for all θ, since w > θ.
A.7 Proofs for Endogenous Pedigree Extension
In this subsection we show that under the assumptions of the endogenous pedigree first stage,
the resulting posterior distribution of ability conditional on pedigree F ′ (θ|S) is log-concave
and satisfies the MLRP.
Lemma 5 The posterior density of ability F ′ (θ|S) is log-concave.
Proof. By Bayes’Rule
F ′ (θ|S) =Pr {S| θ}F ′ (θ)
Pr {S} =G′ (S − e (θ))F ′ (θ)∫ θθG′ (S − e (t)) dF (t)
(8)
12
Electronic copy available at: https://ssrn.com/abstract=2596846
Entrepreneurship
Thus, F ′ (θ|S) is log-concave, because multiplication preserves log-concavity (the denominator
is a constant, given S ).
Lemma 6 If equilibrium effort increases in ability, then the posterior density of ability F ′ (θ|S)
satisfies the MLRP.
Proof. Differentiating the likelihood ratio yields (using equation (8))
∂
∂S
F ′ (θ|S)
F ′ (w|S)=F ′ (θ)
F ′ (w)
∂
∂S
Pr {S| θ}Pr {S|w} =
F ′ (θ)
F ′ (w)
∂
∂S
G′ (S − e (θ))
G′ (S − e (w))
=F ′ (θ)
F ′ (w)
G′′ (S − e (θ))G′ (S − e (w))−G′ (S − e (θ))G′′ (S − e (w))
G′ (S − e (w))2
Thus, ∂∂S
F ′( θ|S)F ′(w|S)
< 0 for all θ < w if
G′′ (S − e (θ))
G′ (S − e (θ))<G′′ (S − e (w))
G′ (S − e (w))
which holds, because the log-concavity of G′ implies (log (G′))′′ = (G′′/G′)′ < 0 , and e (θ) <
e (w) implies S − e (θ) > S − e (w) .
Since average pedigree moves with ability exactly as effort does, because E [S (e (θ))| θ] =
e (θ)+E [ε] and the expected noise term is independent of ability, Lemma 6 can be equivalently
written
Corollary 2 If in equilibrium, average pedigree increases in ability, then the posterior density
of ability F ′ (θ|S) satisfies the MLRP.
In other words, so long as a separating equilibrium exists in the first stage signalling game,
such that higher ability individuals receive higher pedigrees on average, all of the results of
the baseline model also hold when pedigree is endogenously determined. As previously stated,
that pedigrees increase in ability can readily be observed in the data, but for completeness
we establish that this is true under our assumed conditions, which are standard to signaling
models:
Lemma 7 Equilibrium effort exerted in pursuit of signal increases in ability.
Proof. In Stage 1 , individuals maximize payoff considering both Stage 2 occupational choices,
maxeθPr {θ > w (S)}+ E [w (S)| θ ≤ w (S)] Pr {θ ≤ w (S)} − C (e, θ)
13
Electronic copy available at: https://ssrn.com/abstract=2596846
Entrepreneurship
or in integral form
maxeθG(w−1 (θ)− e
)+
∫ +∞
w−1(θ)−ew (e+ ε) dG (ε)− C (e, θ)
Differentiating with respect to e yields the following FOC
−θG′(w−1 (θ)− e
)+ w
(e+ w−1 (θ)− e
)G′(w−1 (θ)− e
)+
∫ +∞
w−1(θ)−ew′ (e+ ε) dG (ε)− C1 (e, θ) = 0
which readily simplifies to the marginal benefit of all possible ‘good’pedigree realizations re-
sulting from an increase in effort must equal the marginal cost of that effort increase:∫ +∞
w−1(θ)−ew′ (e+ ε) dG (ε) = C1 (e, θ)
Thus, a (continuously) separating equilibrium exists if the solution to this implicit equation for
e strictly increases in θ . We have assumed that cost is suffi ciently convex for the SOC to be
satisfied. Thus, from the IFT, dedθhas the same sign as
∂
∂θ
(∫ +∞
w−1(θ)−ew′ (e+ ε) dG (ε)− C1 (e, θ)
)= −w′
(w−1 (θ)
)G′(w−1 (θ)− e
) ∂∂θ
(w−1 (θ)
)− C12 (e, θ)
= G′(w−1 (θ)− e
)− C12 (e, θ) > 0
which is positive, because G′ is a probability density and C12 < 0 by assumption (i.e., the
Spence-Mirrlees condition).
Lemma 3Equilibrium effort exerted in pursuit of signal (and average signal) increases in ability,
such that (i) the posterior distribution of ability F (θ|S) is log-concave and (ii) the posterior
density of ability F ′ (θ|S) satisfies the MLRP.
Proof. Part (i): Since log-concave density implies log-concave distribution (See Bagnoli and
Bergstrom 2005, Theorem 1) the result follows from 5.
Part (ii): Follows immediately from Lemmas 7 and 6, together with the fact that average
signal moves with ability exactly as effort does, because E [S (e (θ))| θ] = e (θ) + E [ε] and the
expected noise term is independent of ability.
14
Electronic copy available at: https://ssrn.com/abstract=2596846
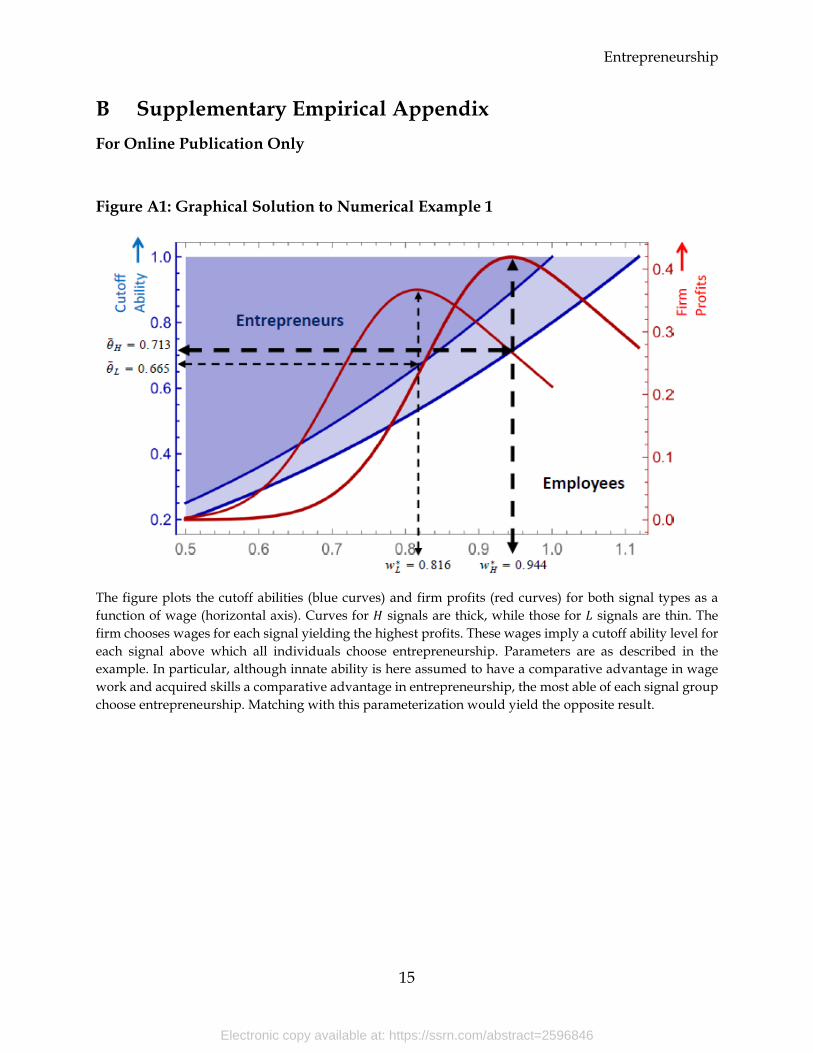
Entrepreneurship
15
B Supplementary Empirical Appendix For Online Publication Only
Figure A1: Graphical Solution to Numerical Example 1
The figure plots the cutoff abilities (blue curves) and firm profits (red curves) for both signal types as a function of wage (horizontal axis). Curves for 𝐻𝐻 signals are thick, while those for 𝐿𝐿 signals are thin. The firm chooses wages for each signal yielding the highest profits. These wages imply a cutoff ability level for each signal above which all individuals choose entrepreneurship. Parameters are as described in the example. In particular, although innate ability is here assumed to have a comparative advantage in wage work and acquired skills a comparative advantage in entrepreneurship, the most able of each signal group choose entrepreneurship. Matching with this parameterization would yield the opposite result.
Electronic copy available at: https://ssrn.com/abstract=2596846
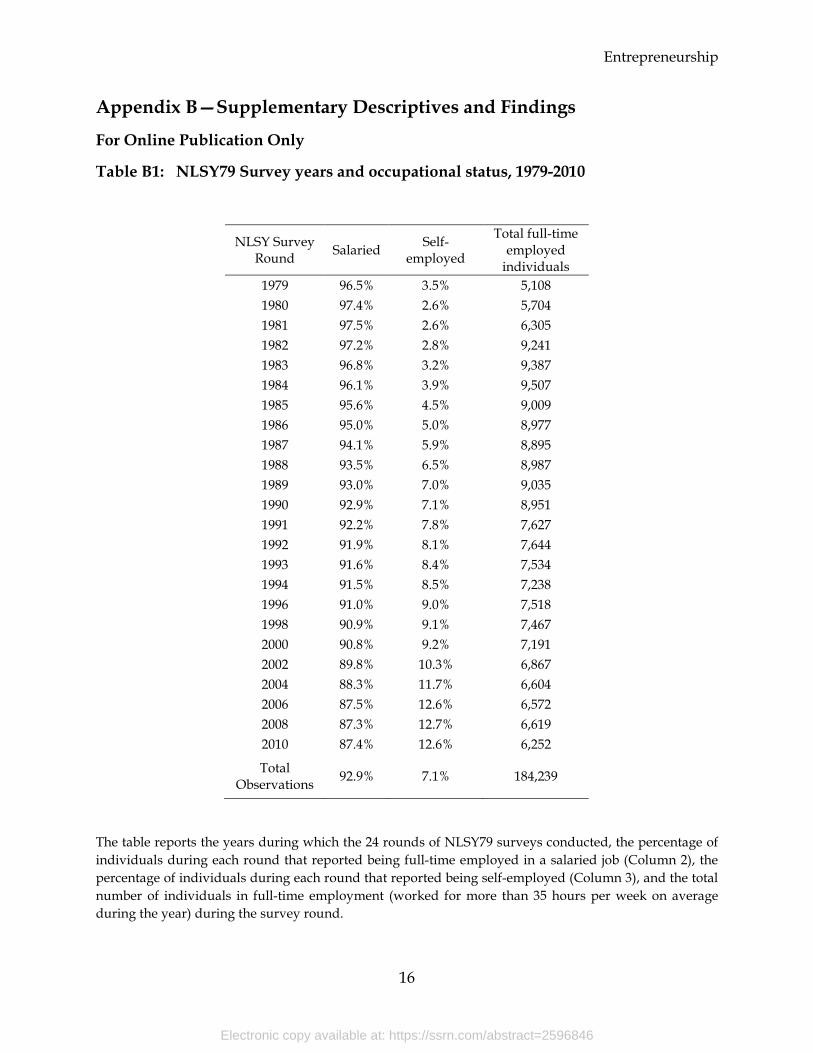
Entrepreneurship
16
Appendix B—Supplementary Descriptives and Findings
For Online Publication Only
Table B1: NLSY79 Survey years and occupational status, 1979-2010
NLSY Survey Round Salaried Self-
employed
Total full-time employed
individuals 1979 96.5% 3.5% 5,108 1980 97.4% 2.6% 5,704 1981 97.5% 2.6% 6,305 1982 97.2% 2.8% 9,241 1983 96.8% 3.2% 9,387 1984 96.1% 3.9% 9,507 1985 95.6% 4.5% 9,009 1986 95.0% 5.0% 8,977 1987 94.1% 5.9% 8,895 1988 93.5% 6.5% 8,987 1989 93.0% 7.0% 9,035 1990 92.9% 7.1% 8,951 1991 92.2% 7.8% 7,627 1992 91.9% 8.1% 7,644 1993 91.6% 8.4% 7,534 1994 91.5% 8.5% 7,238 1996 91.0% 9.0% 7,518 1998 90.9% 9.1% 7,467 2000 90.8% 9.2% 7,191 2002 89.8% 10.3% 6,867 2004 88.3% 11.7% 6,604 2006 87.5% 12.6% 6,572 2008 87.3% 12.7% 6,619 2010 87.4% 12.6% 6,252
Total Observations 92.9% 7.1% 184,239
The table reports the years during which the 24 rounds of NLSY79 surveys conducted, the percentage of individuals during each round that reported being full-time employed in a salaried job (Column 2), the percentage of individuals during each round that reported being self-employed (Column 3), and the total number of individuals in full-time employment (worked for more than 35 hours per week on average during the year) during the survey round.
Electronic copy available at: https://ssrn.com/abstract=2596846
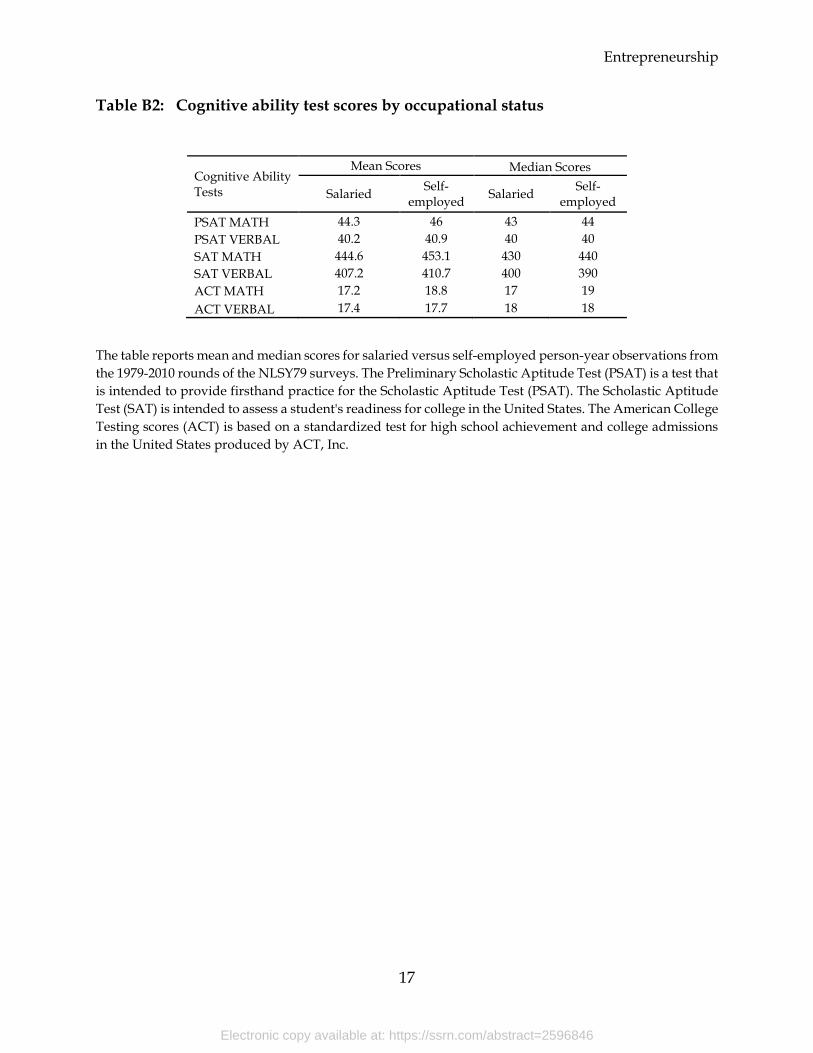
Entrepreneurship
17
Table B2: Cognitive ability test scores by occupational status
Cognitive Ability Tests
Mean Scores Median Scores
Salaried Self-employed Salaried Self-
employed PSAT MATH 44.3 46 43 44 PSAT VERBAL 40.2 40.9 40 40 SAT MATH 444.6 453.1 430 440 SAT VERBAL 407.2 410.7 400 390 ACT MATH 17.2 18.8 17 19 ACT VERBAL 17.4 17.7 18 18
The table reports mean and median scores for salaried versus self-employed person-year observations from the 1979-2010 rounds of the NLSY79 surveys. The Preliminary Scholastic Aptitude Test (PSAT) is a test that is intended to provide firsthand practice for the Scholastic Aptitude Test (PSAT). The Scholastic Aptitude Test (SAT) is intended to assess a student's readiness for college in the United States. The American College Testing scores (ACT) is based on a standardized test for high school achievement and college admissions in the United States produced by ACT, Inc.
Electronic copy available at: https://ssrn.com/abstract=2596846
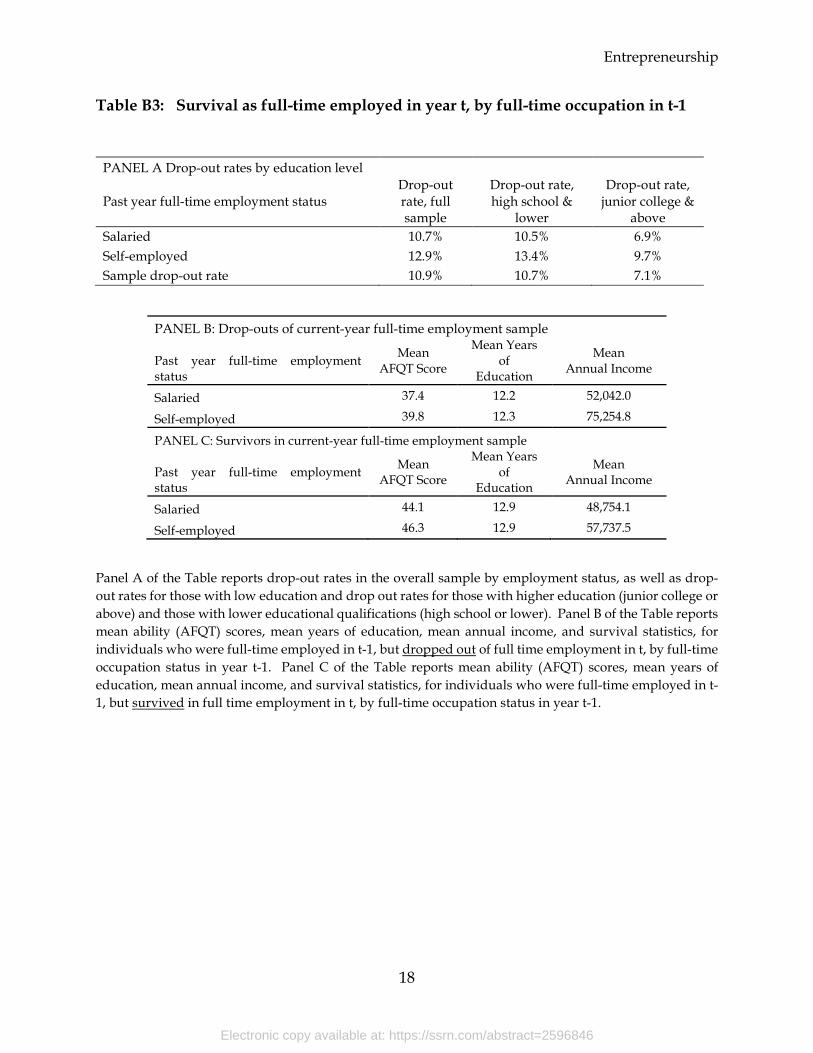
Entrepreneurship
18
Table B3: Survival as full-time employed in year t, by full-time occupation in t-1
PANEL A Drop-out rates by education level
Past year full-time employment status Drop-out rate, full sample
Drop-out rate, high school &
lower
Drop-out rate, junior college &
above Salaried 10.7% 10.5% 6.9% Self-employed 12.9% 13.4% 9.7% Sample drop-out rate 10.9% 10.7% 7.1%
PANEL B: Drop-outs of current-year full-time employment sample
Past year full-time employment status
Mean AFQT Score
Mean Years of
Education
Mean Annual Income
Salaried 37.4 12.2 52,042.0
Self-employed 39.8 12.3 75,254.8
PANEL C: Survivors in current-year full-time employment sample
Past year full-time employment status
Mean AFQT Score
Mean Years of
Education
Mean Annual Income
Salaried 44.1 12.9 48,754.1
Self-employed 46.3 12.9 57,737.5
Panel A of the Table reports drop-out rates in the overall sample by employment status, as well as drop-out rates for those with low education and drop out rates for those with higher education (junior college or above) and those with lower educational qualifications (high school or lower). Panel B of the Table reports mean ability (AFQT) scores, mean years of education, mean annual income, and survival statistics, for individuals who were full-time employed in t-1, but dropped out of full time employment in t, by full-time occupation status in year t-1. Panel C of the Table reports mean ability (AFQT) scores, mean years of education, mean annual income, and survival statistics, for individuals who were full-time employed in t-1, but survived in full time employment in t, by full-time occupation status in year t-1.
Electronic copy available at: https://ssrn.com/abstract=2596846
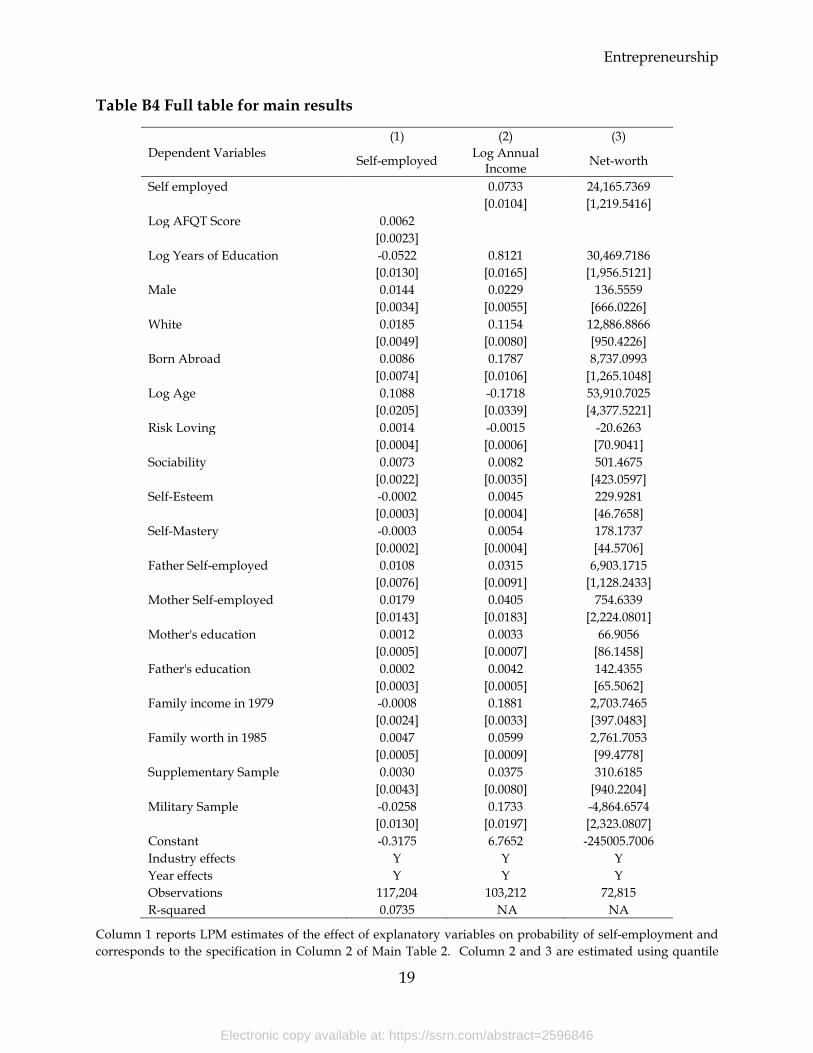
Entrepreneurship
19
Table B4 Full table for main results
(1) (2) (3) Dependent Variables Self-employed Log Annual
Income Net-worth
Self employed 0.0733 24,165.7369 [0.0104] [1,219.5416]
Log AFQT Score 0.0062 [0.0023]
Log Years of Education -0.0522 0.8121 30,469.7186 [0.0130] [0.0165] [1,956.5121]
Male 0.0144 0.0229 136.5559 [0.0034] [0.0055] [666.0226]
White 0.0185 0.1154 12,886.8866 [0.0049] [0.0080] [950.4226]
Born Abroad 0.0086 0.1787 8,737.0993 [0.0074] [0.0106] [1,265.1048]
Log Age 0.1088 -0.1718 53,910.7025 [0.0205] [0.0339] [4,377.5221]
Risk Loving 0.0014 -0.0015 -20.6263 [0.0004] [0.0006] [70.9041]
Sociability 0.0073 0.0082 501.4675 [0.0022] [0.0035] [423.0597]
Self-Esteem -0.0002 0.0045 229.9281 [0.0003] [0.0004] [46.7658]
Self-Mastery -0.0003 0.0054 178.1737 [0.0002] [0.0004] [44.5706]
Father Self-employed 0.0108 0.0315 6,903.1715 [0.0076] [0.0091] [1,128.2433]
Mother Self-employed 0.0179 0.0405 754.6339 [0.0143] [0.0183] [2,224.0801]
Mother's education 0.0012 0.0033 66.9056 [0.0005] [0.0007] [86.1458]
Father's education 0.0002 0.0042 142.4355 [0.0003] [0.0005] [65.5062]
Family income in 1979 -0.0008 0.1881 2,703.7465 [0.0024] [0.0033] [397.0483]
Family worth in 1985 0.0047 0.0599 2,761.7053 [0.0005] [0.0009] [99.4778]
Supplementary Sample 0.0030 0.0375 310.6185 [0.0043] [0.0080] [940.2204]
Military Sample -0.0258 0.1733 -4,864.6574 [0.0130] [0.0197] [2,323.0807]
Constant -0.3175 6.7652 -245005.7006 Industry effects Y Y Y Year effects Y Y Y Observations 117,204 103,212 72,815 R-squared 0.0735 NA NA
Column 1 reports LPM estimates of the effect of explanatory variables on probability of self-employment and corresponds to the specification in Column 2 of Main Table 2. Column 2 and 3 are estimated using quantile
Electronic copy available at: https://ssrn.com/abstract=2596846
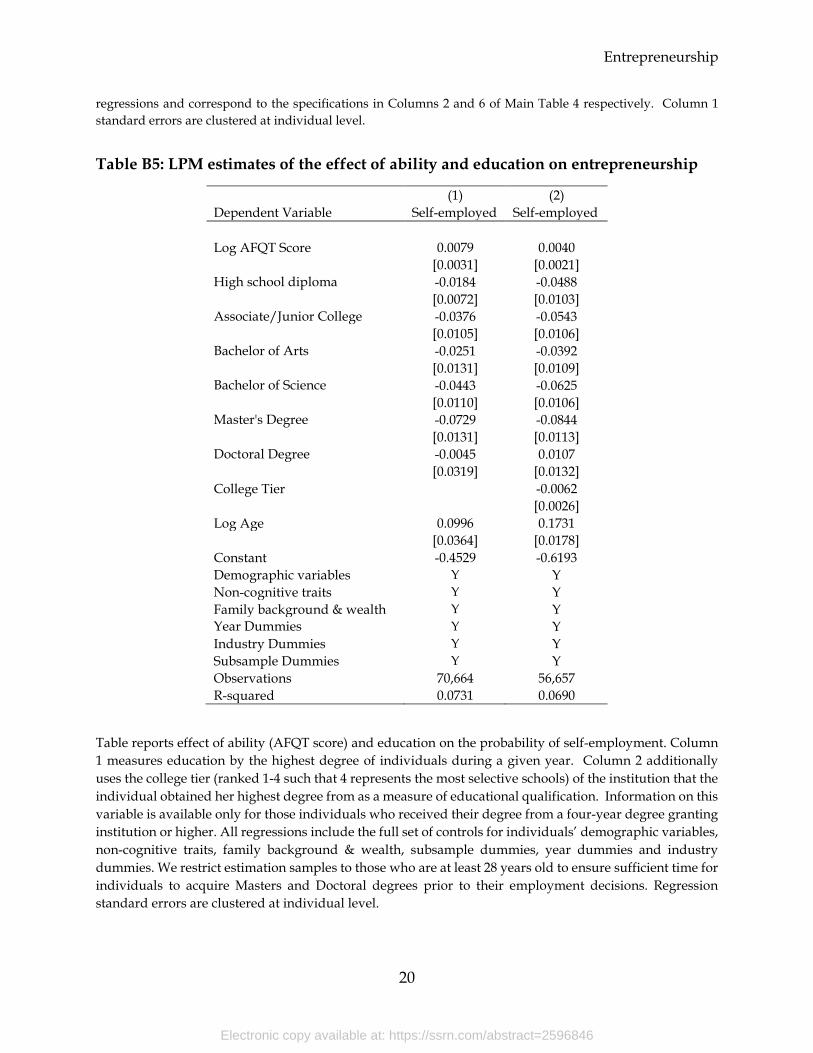
Entrepreneurship
20
regressions and correspond to the specifications in Columns 2 and 6 of Main Table 4 respectively. Column 1 standard errors are clustered at individual level.
Table B5: LPM estimates of the effect of ability and education on entrepreneurship
(1) (2) Dependent Variable Self-employed Self-employed Log AFQT Score 0.0079 0.0040
[0.0031] [0.0021] High school diploma -0.0184 -0.0488
[0.0072] [0.0103] Associate/Junior College -0.0376 -0.0543
[0.0105] [0.0106] Bachelor of Arts -0.0251 -0.0392
[0.0131] [0.0109] Bachelor of Science -0.0443 -0.0625
[0.0110] [0.0106] Master's Degree -0.0729 -0.0844
[0.0131] [0.0113] Doctoral Degree -0.0045 0.0107
[0.0319] [0.0132] College Tier -0.0062
[0.0026] Log Age 0.0996 0.1731
[0.0364] [0.0178] Constant -0.4529 -0.6193 Demographic variables Y Y Non-cognitive traits Y Y Family background & wealth Y Y Year Dummies Y Y Industry Dummies Y Y Subsample Dummies Y Y Observations 70,664 56,657 R-squared 0.0731 0.0690
Table reports effect of ability (AFQT score) and education on the probability of self-employment. Column 1 measures education by the highest degree of individuals during a given year. Column 2 additionally uses the college tier (ranked 1-4 such that 4 represents the most selective schools) of the institution that the individual obtained her highest degree from as a measure of educational qualification. Information on this variable is available only for those individuals who received their degree from a four-year degree granting institution or higher. All regressions include the full set of controls for individuals’ demographic variables, non-cognitive traits, family background & wealth, subsample dummies, year dummies and industry dummies. We restrict estimation samples to those who are at least 28 years old to ensure sufficient time for individuals to acquire Masters and Doctoral degrees prior to their employment decisions. Regression standard errors are clustered at individual level.
Electronic copy available at: https://ssrn.com/abstract=2596846
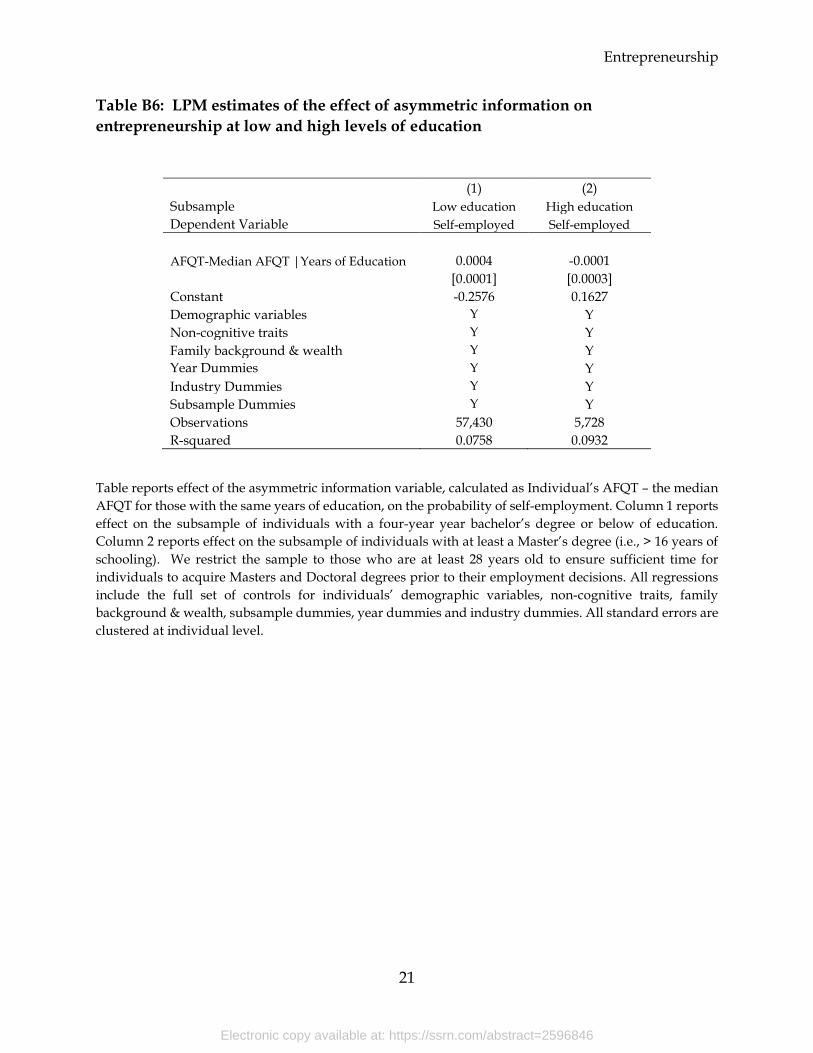
Entrepreneurship
21
Table B6: LPM estimates of the effect of asymmetric information on entrepreneurship at low and high levels of education
(1) (2) Subsample Low education High education Dependent Variable Self-employed Self-employed AFQT-Median AFQT |Years of Education 0.0004 -0.0001
[0.0001] [0.0003] Constant -0.2576 0.1627 Demographic variables Y Y Non-cognitive traits Y Y Family background & wealth Y Y Year Dummies Y Y Industry Dummies Y Y Subsample Dummies Y Y Observations 57,430 5,728 R-squared 0.0758 0.0932
Table reports effect of the asymmetric information variable, calculated as Individual’s AFQT – the median AFQT for those with the same years of education, on the probability of self-employment. Column 1 reports effect on the subsample of individuals with a four-year year bachelor’s degree or below of education. Column 2 reports effect on the subsample of individuals with at least a Master’s degree (i.e., > 16 years of schooling). We restrict the sample to those who are at least 28 years old to ensure sufficient time for individuals to acquire Masters and Doctoral degrees prior to their employment decisions. All regressions include the full set of controls for individuals’ demographic variables, non-cognitive traits, family background & wealth, subsample dummies, year dummies and industry dummies. All standard errors are clustered at individual level.
Electronic copy available at: https://ssrn.com/abstract=2596846
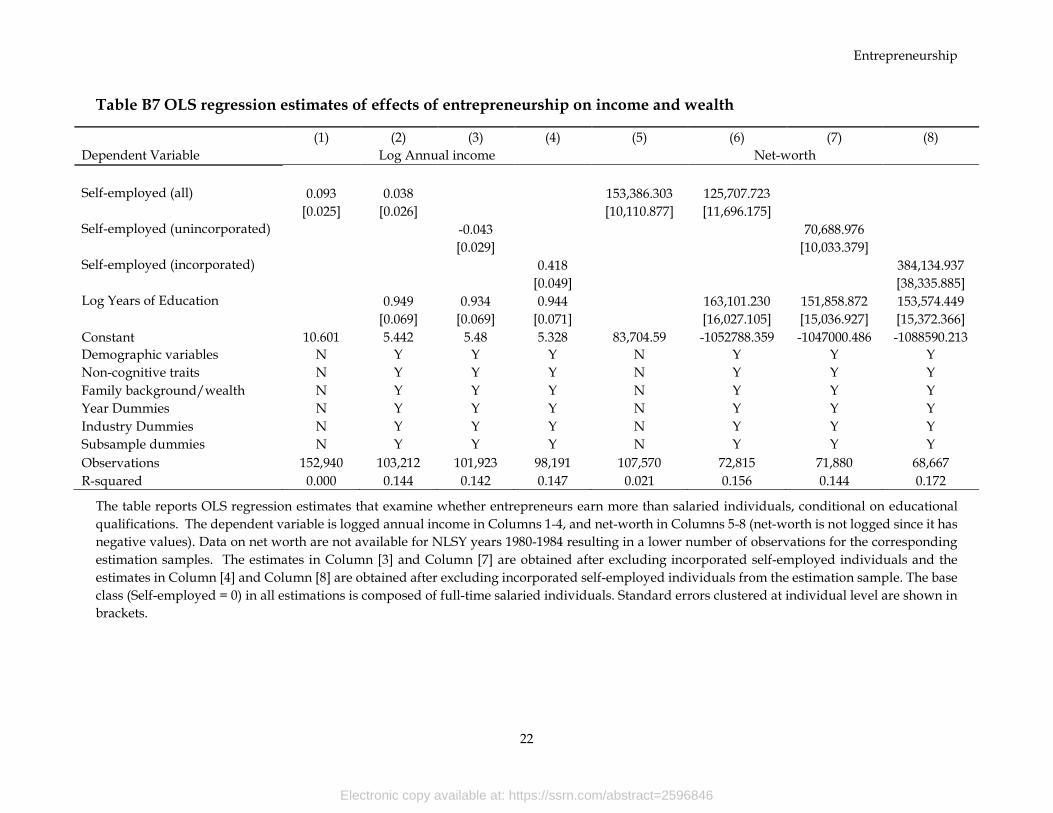
Entrepreneurship
22
Table B7 OLS regression estimates of effects of entrepreneurship on income and wealth
(1) (2) (3) (4) (5) (6) (7) (8) Dependent Variable Log Annual income Net-worth Self-employed (all) 0.093 0.038 153,386.303 125,707.723
[0.025] [0.026] [10,110.877] [11,696.175] Self-employed (unincorporated) -0.043 70,688.976 [0.029] [10,033.379] Self-employed (incorporated) 0.418 384,134.937
[0.049] [38,335.885] Log Years of Education 0.949 0.934 0.944 163,101.230 151,858.872 153,574.449
[0.069] [0.069] [0.071] [16,027.105] [15,036.927] [15,372.366] Constant 10.601 5.442 5.48 5.328 83,704.59 -1052788.359 -1047000.486 -1088590.213 Demographic variables N Y Y Y N Y Y Y Non-cognitive traits N Y Y Y N Y Y Y Family background/wealth N Y Y Y N Y Y Y Year Dummies N Y Y Y N Y Y Y Industry Dummies N Y Y Y N Y Y Y Subsample dummies N Y Y Y N Y Y Y Observations 152,940 103,212 101,923 98,191 107,570 72,815 71,880 68,667 R-squared 0.000 0.144 0.142 0.147 0.021 0.156 0.144 0.172
The table reports OLS regression estimates that examine whether entrepreneurs earn more than salaried individuals, conditional on educational qualifications. The dependent variable is logged annual income in Columns 1-4, and net-worth in Columns 5-8 (net-worth is not logged since it has negative values). Data on net worth are not available for NLSY years 1980-1984 resulting in a lower number of observations for the corresponding estimation samples. The estimates in Column [3] and Column [7] are obtained after excluding incorporated self-employed individuals and the estimates in Column [4] and Column [8] are obtained after excluding incorporated self-employed individuals from the estimation sample. The base class (Self-employed = 0) in all estimations is composed of full-time salaried individuals. Standard errors clustered at individual level are shown in brackets.
Electronic copy available at: https://ssrn.com/abstract=2596846
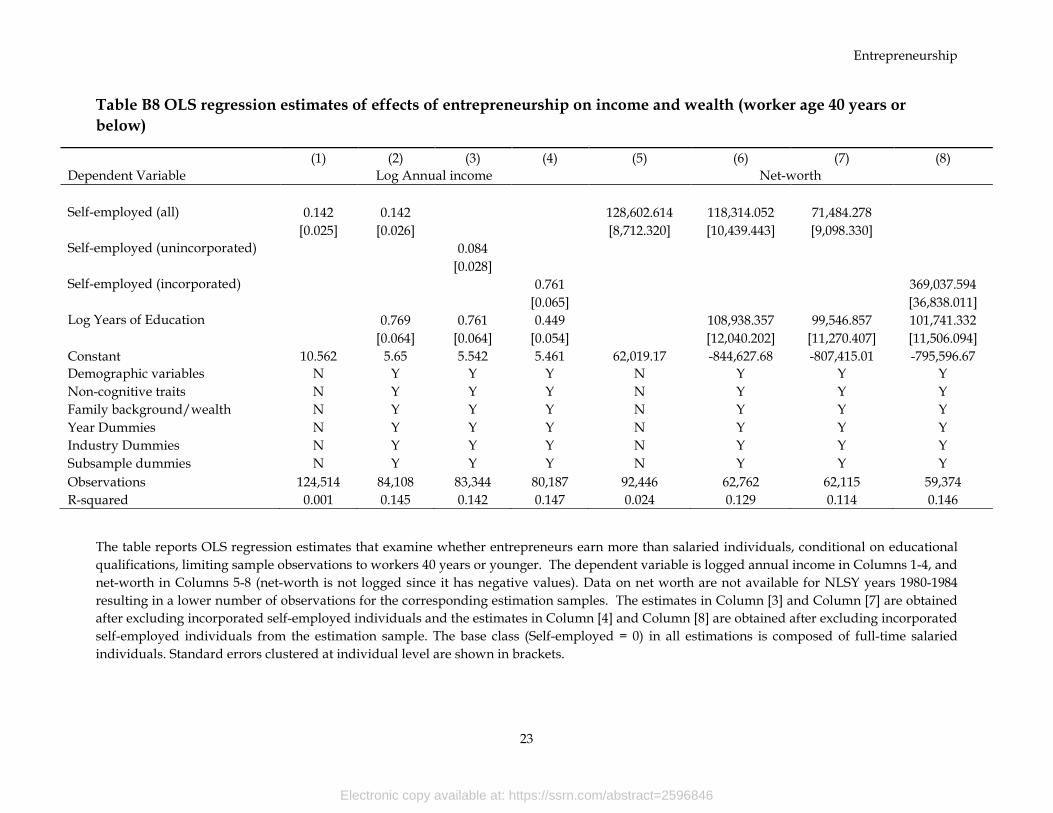
Entrepreneurship
23
Table B8 OLS regression estimates of effects of entrepreneurship on income and wealth (worker age 40 years or below)
(1) (2) (3) (4) (5) (6) (7) (8) Dependent Variable Log Annual income Net-worth Self-employed (all) 0.142 0.142 128,602.614 118,314.052 71,484.278
[0.025] [0.026] [8,712.320] [10,439.443] [9,098.330] Self-employed (unincorporated) 0.084
[0.028] Self-employed (incorporated) 0.761 369,037.594
[0.065] [36,838.011] Log Years of Education 0.769 0.761 0.449 108,938.357 99,546.857 101,741.332
[0.064] [0.064] [0.054] [12,040.202] [11,270.407] [11,506.094] Constant 10.562 5.65 5.542 5.461 62,019.17 -844,627.68 -807,415.01 -795,596.67 Demographic variables N Y Y Y N Y Y Y Non-cognitive traits N Y Y Y N Y Y Y Family background/wealth N Y Y Y N Y Y Y Year Dummies N Y Y Y N Y Y Y Industry Dummies N Y Y Y N Y Y Y Subsample dummies N Y Y Y N Y Y Y Observations 124,514 84,108 83,344 80,187 92,446 62,762 62,115 59,374 R-squared 0.001 0.145 0.142 0.147 0.024 0.129 0.114 0.146
The table reports OLS regression estimates that examine whether entrepreneurs earn more than salaried individuals, conditional on educational qualifications, limiting sample observations to workers 40 years or younger. The dependent variable is logged annual income in Columns 1-4, and net-worth in Columns 5-8 (net-worth is not logged since it has negative values). Data on net worth are not available for NLSY years 1980-1984 resulting in a lower number of observations for the corresponding estimation samples. The estimates in Column [3] and Column [7] are obtained after excluding incorporated self-employed individuals and the estimates in Column [4] and Column [8] are obtained after excluding incorporated self-employed individuals from the estimation sample. The base class (Self-employed = 0) in all estimations is composed of full-time salaried individuals. Standard errors clustered at individual level are shown in brackets.
Electronic copy available at: https://ssrn.com/abstract=2596846
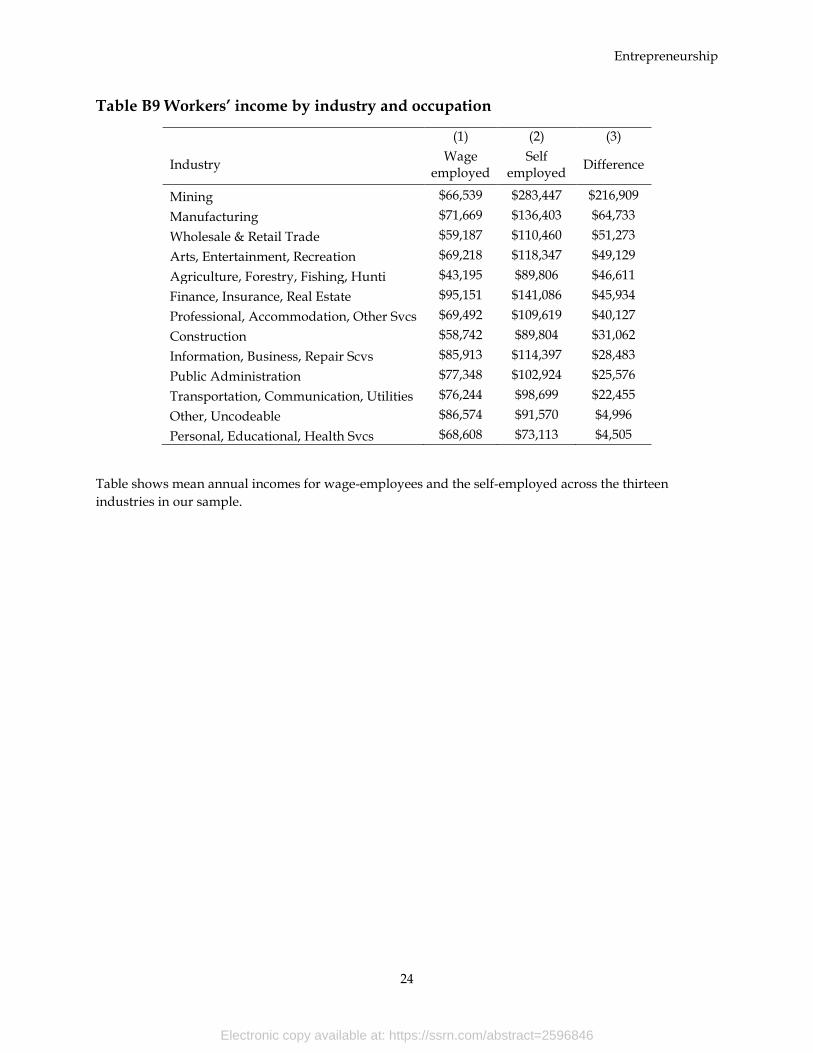
Entrepreneurship
24
Table B9 Workers’ income by industry and occupation
(1) (2) (3)
Industry Wage employed
Self employed Difference
Mining $66,539 $283,447 $216,909 Manufacturing $71,669 $136,403 $64,733 Wholesale & Retail Trade $59,187 $110,460 $51,273 Arts, Entertainment, Recreation $69,218 $118,347 $49,129 Agriculture, Forestry, Fishing, Hunti $43,195 $89,806 $46,611 Finance, Insurance, Real Estate $95,151 $141,086 $45,934 Professional, Accommodation, Other Svcs $69,492 $109,619 $40,127 Construction $58,742 $89,804 $31,062 Information, Business, Repair Scvs $85,913 $114,397 $28,483 Public Administration $77,348 $102,924 $25,576 Transportation, Communication, Utilities $76,244 $98,699 $22,455 Other, Uncodeable $86,574 $91,570 $4,996 Personal, Educational, Health Svcs $68,608 $73,113 $4,505
Table shows mean annual incomes for wage-employees and the self-employed across the thirteen industries in our sample.
Electronic copy available at: https://ssrn.com/abstract=2596846
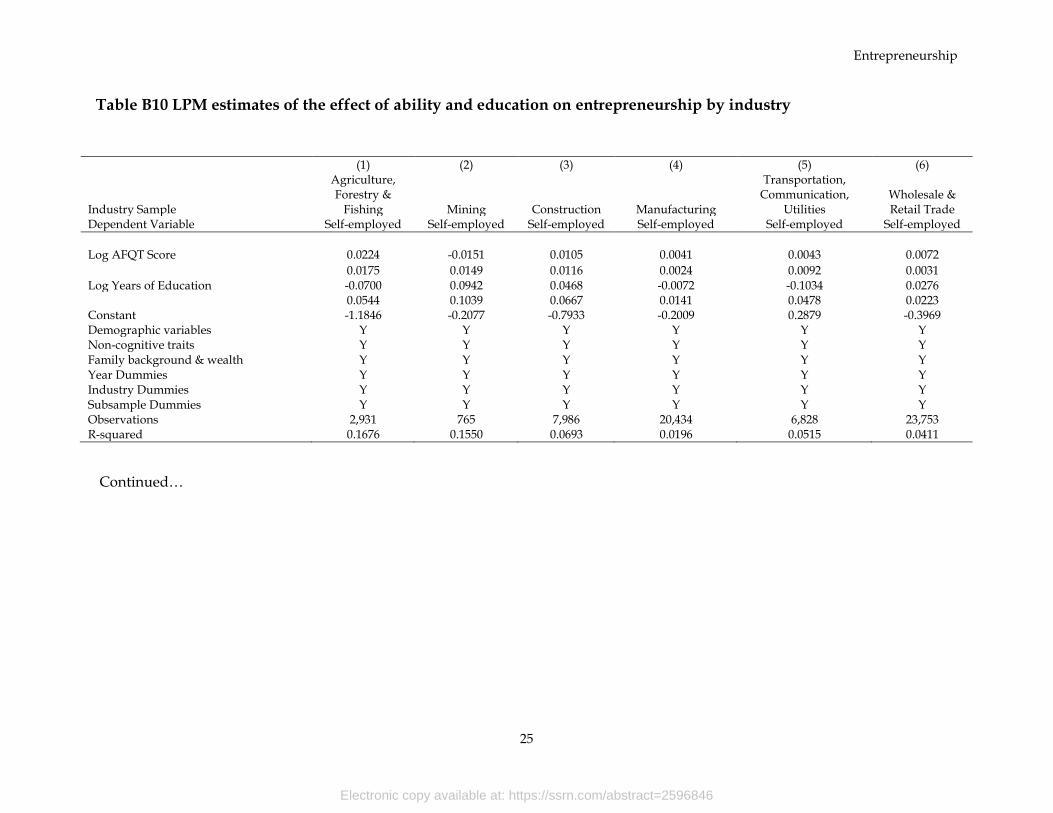
Entrepreneurship
25
Table B10 LPM estimates of the effect of ability and education on entrepreneurship by industry
(1) (2) (3) (4) (5) (6)
Industry Sample
Agriculture, Forestry &
Fishing Mining Construction Manufacturing
Transportation, Communication,
Utilities Wholesale & Retail Trade
Dependent Variable Self-employed Self-employed Self-employed Self-employed Self-employed Self-employed Log AFQT Score 0.0224 -0.0151 0.0105 0.0041 0.0043 0.0072
0.0175 0.0149 0.0116 0.0024 0.0092 0.0031 Log Years of Education -0.0700 0.0942 0.0468 -0.0072 -0.1034 0.0276
0.0544 0.1039 0.0667 0.0141 0.0478 0.0223 Constant -1.1846 -0.2077 -0.7933 -0.2009 0.2879 -0.3969 Demographic variables Y Y Y Y Y Y Non-cognitive traits Y Y Y Y Y Y Family background & wealth Y Y Y Y Y Y Year Dummies Y Y Y Y Y Y Industry Dummies Y Y Y Y Y Y Subsample Dummies Y Y Y Y Y Y Observations 2,931 765 7,986 20,434 6,828 23,753 R-squared 0.1676 0.1550 0.0693 0.0196 0.0515 0.0411
Continued…
Electronic copy available at: https://ssrn.com/abstract=2596846
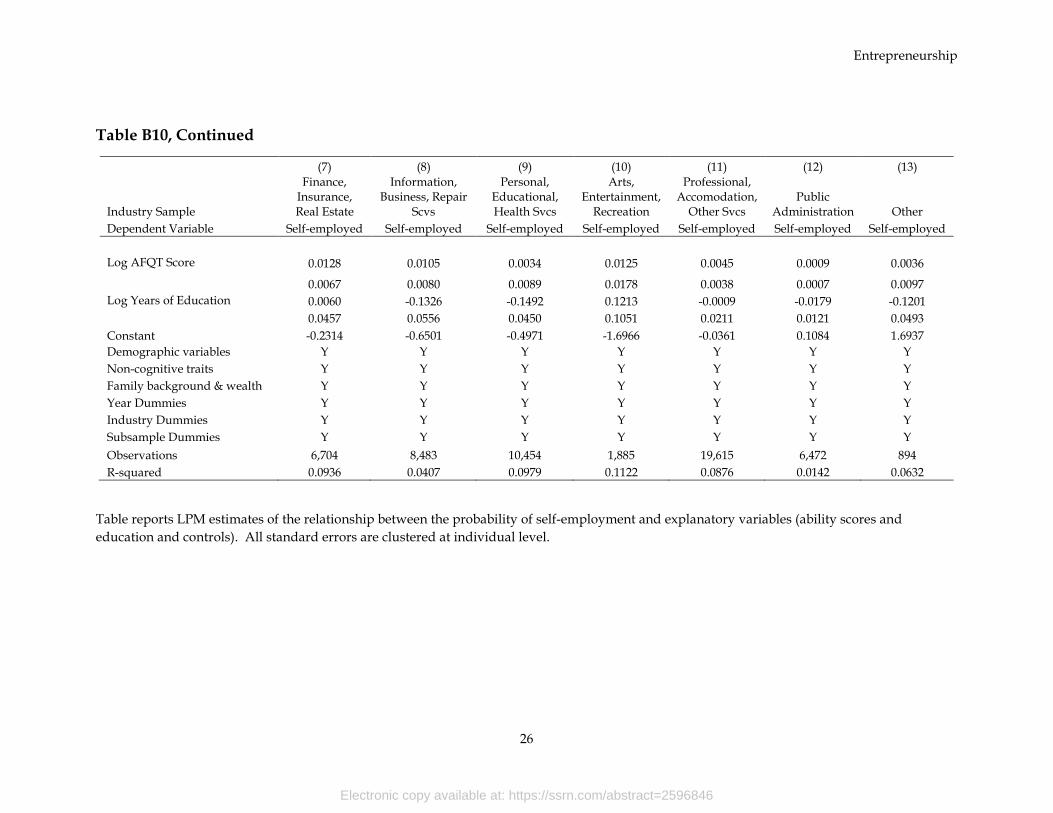
Entrepreneurship
26
Table B10, Continued
(7) (8) (9) (10) (11) (12) (13)
Industry Sample
Finance, Insurance, Real Estate
Information, Business, Repair
Scvs
Personal, Educational, Health Svcs
Arts, Entertainment,
Recreation
Professional, Accomodation,
Other Svcs Public
Administration Other Dependent Variable Self-employed Self-employed Self-employed Self-employed Self-employed Self-employed Self-employed Log AFQT Score 0.0128 0.0105 0.0034 0.0125 0.0045 0.0009 0.0036
0.0067 0.0080 0.0089 0.0178 0.0038 0.0007 0.0097 Log Years of Education 0.0060 -0.1326 -0.1492 0.1213 -0.0009 -0.0179 -0.1201
0.0457 0.0556 0.0450 0.1051 0.0211 0.0121 0.0493 Constant -0.2314 -0.6501 -0.4971 -1.6966 -0.0361 0.1084 1.6937 Demographic variables Y Y Y Y Y Y Y Non-cognitive traits Y Y Y Y Y Y Y Family background & wealth Y Y Y Y Y Y Y Year Dummies Y Y Y Y Y Y Y Industry Dummies Y Y Y Y Y Y Y Subsample Dummies Y Y Y Y Y Y Y Observations 6,704 8,483 10,454 1,885 19,615 6,472 894 R-squared 0.0936 0.0407 0.0979 0.1122 0.0876 0.0142 0.0632
Table reports LPM estimates of the relationship between the probability of self-employment and explanatory variables (ability scores and education and controls). All standard errors are clustered at individual level.
Electronic copy available at: https://ssrn.com/abstract=2596846
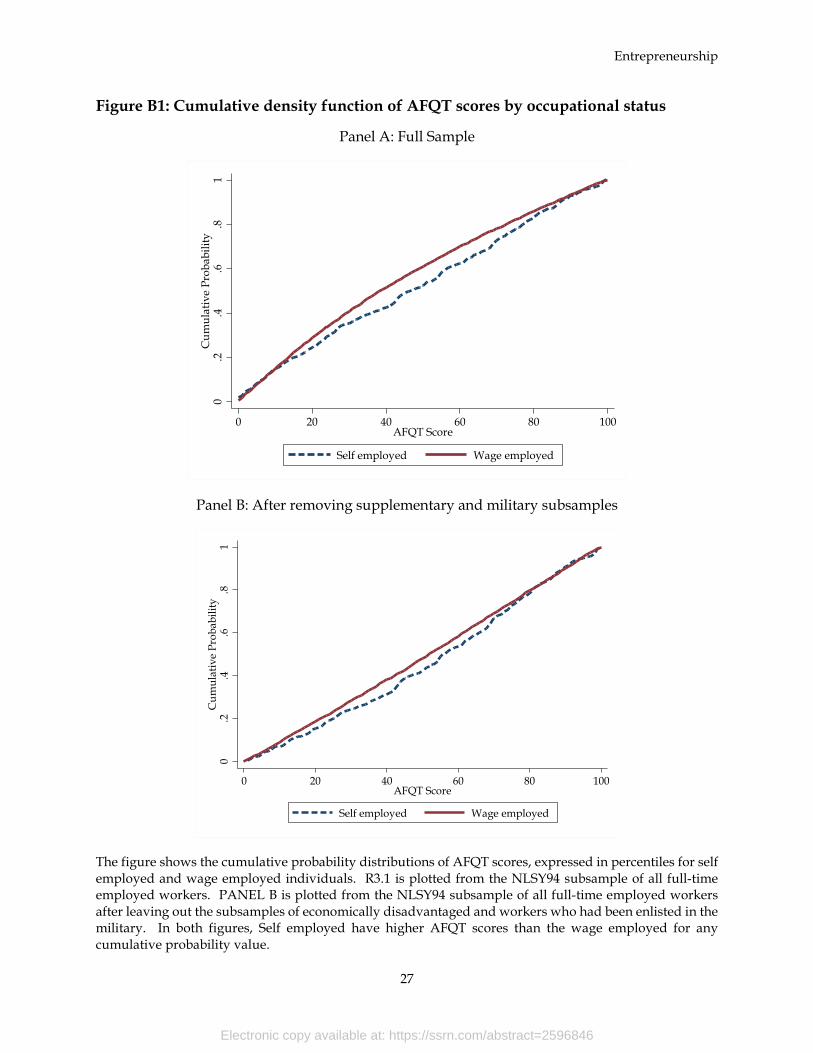
Entrepreneurship
27
Figure B1: Cumulative density function of AFQT scores by occupational status
Panel A: Full Sample
Panel B: After removing supplementary and military subsamples
The figure shows the cumulative probability distributions of AFQT scores, expressed in percentiles for self employed and wage employed individuals. R3.1 is plotted from the NLSY94 subsample of all full-time employed workers. PANEL B is plotted from the NLSY94 subsample of all full-time employed workers after leaving out the subsamples of economically disadvantaged and workers who had been enlisted in the military. In both figures, Self employed have higher AFQT scores than the wage employed for any cumulative probability value.
0.2
.4.6
.81
Cum
ulat
ive
Prob
abili
ty
0 20 40 60 80 100AFQT Score
Self employed Wage employed
0.2
.4.6
.81
Cum
ulat
ive
Prob
abili
ty
0 20 40 60 80 100AFQT Score
Self employed Wage employed
Electronic copy available at: https://ssrn.com/abstract=2596846
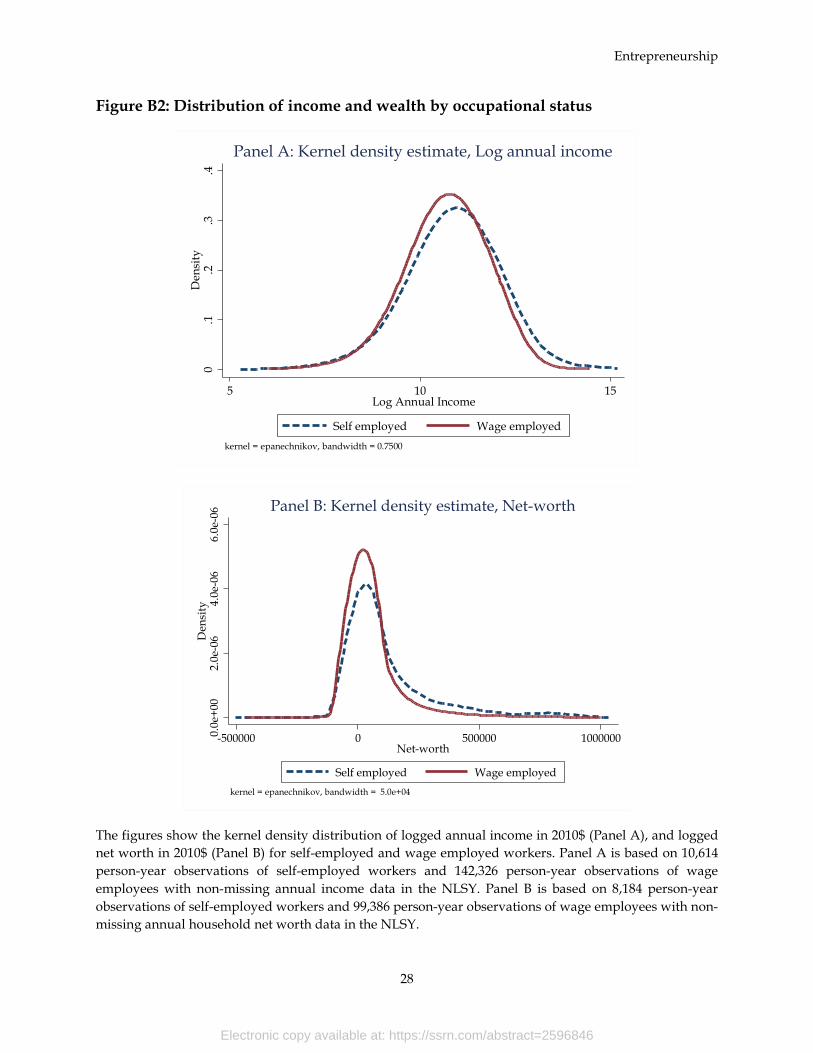
Entrepreneurship
28
Figure B2: Distribution of income and wealth by occupational status
The figures show the kernel density distribution of logged annual income in 2010$ (Panel A), and logged net worth in 2010$ (Panel B) for self-employed and wage employed workers. Panel A is based on 10,614 person-year observations of self-employed workers and 142,326 person-year observations of wage employees with non-missing annual income data in the NLSY. Panel B is based on 8,184 person-year observations of self-employed workers and 99,386 person-year observations of wage employees with non-missing annual household net worth data in the NLSY.
0.1
.2.3
.4D
ensi
ty
5 10 15Log Annual Income
Self employed Wage employedkernel = epanechnikov, bandwidth = 0.7500
Panel A: Kernel density estimate, Log annual income
0.0e
+00
2.0e
-06
4.0e
-06
6.0e
-06
Den
sity
-500000 0 500000 1000000Net-worth
Self employed Wage employedkernel = epanechnikov, bandwidth = 5.0e+04
Panel B: Kernel density estimate, Net-worth
Electronic copy available at: https://ssrn.com/abstract=2596846
Entrepreneurship
29
Appendix C—Description and Analysis of UK NCDS
For Online Publication Only
NCDS Variable Definitions.
All variables and data are from the U.K.s 1958 National Child Development Survey (NCDS). The NCDS follows the lives of all 18,558 individuals born in England, Scotland and Wales in one particular week of March 1958. The NCDS tracks the same respondents in eight ‘sweeps’ of surveys carried out in years 1965, 1969, 1974, 1981, 1991, 1999-2000, 2004, 2008 and 2013. Complete data dictionaries are currently available only through Sweep 8 conducted in 2008.
Self-employed is equal to 1 if NCDS—Sweep7 respondent indicated current job as “Full-time self-employed;” Self-employed is set to 0 if NCDS—Sweep 7 respondent indicated current job as “Full-time paid employee (30 or more hours per week)”. Respondents were aged 46 during Sweep 7.
Outstanding Ability is set to 1 if the respondent was identified as having “Any Outstanding Ability” by the respondent’s teacher in school at age 11 (information collected in NCDS—Sweep 2).
Copying Design Test (CDT) Score is the score the respondent achieved, ranging from 0-12, on a test that required them to copy and reproduce designs. The scores were collected in NCDS—Sweep 1 when the respondents were aged 7.
Draw-a-man Test (DMT) Score is the score the respondent achieved, ranging from 0-53, on a test that required them to draw a man. The scores were collected in NCDS—Sweep 1 when the respondents were aged 7.
Educational Attainment is measured by National Vocation Qualification (NVQ) equivalents for the highest academic qualification attained by the respondent as reported in NCDS—Sweep 8 when respondents were aged 50. The NVQ equivalents range from 0 for no formal schooling, to 5 for Master’s Degree or Higher.
Annual Income is total family income from all sources before tax deductions. All values are expressed in 2007 GBP and collected during NCDS—Sweep 7.
Social functioning score is derived from respondents’ answers to a questionnaire designed to evaluate their level of social adjustment and ranges from 0-100. Scores were collected during NCDS—Sweep 8 when respondents were aged 50.
Extraversion score is based on respondent responses to the “IPIP Personality Inventory-Extraversion” Test and ranges between 10-50. Scores were collected during NCDS—Sweep 8 when respondents were aged 50.
Male and Born Abroad are binary variables set to 1 if respondent is male, and born outside of the UK respectively (the variables are set to 0 otherwise).
Marital Status is indicated by a vector of five dummies, indicating Single, Legally Married, Separated, Divorced and Widowed during NCDS—Sweep 4.
Family Background is indicated by a vector of 18 dummies indicating socio-economic group of the head of the respondent’s household during NCDS—Sweep 2 when the respondent was aged 11.
Electronic copy available at: https://ssrn.com/abstract=2596846
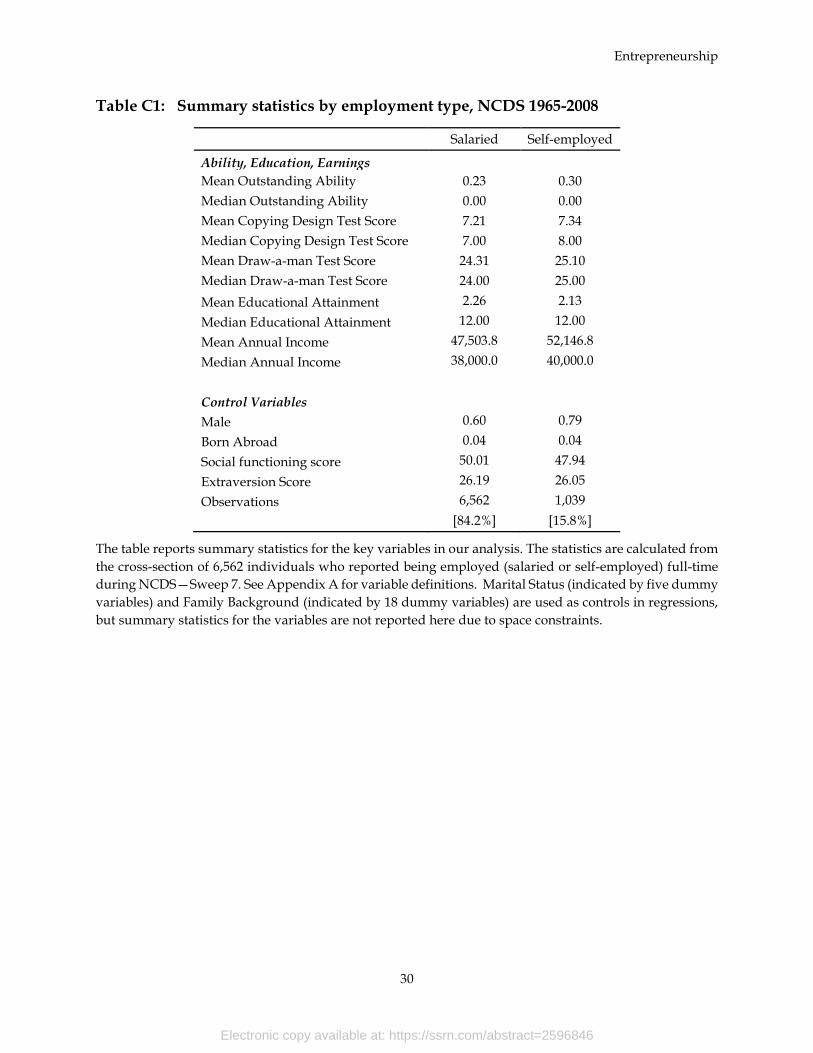
Entrepreneurship
30
Table C1: Summary statistics by employment type, NCDS 1965-2008
Salaried Self-employed
Ability, Education, Earnings
Mean Outstanding Ability 0.23 0.30 Median Outstanding Ability 0.00 0.00 Mean Copying Design Test Score 7.21 7.34 Median Copying Design Test Score 7.00 8.00 Mean Draw-a-man Test Score 24.31 25.10 Median Draw-a-man Test Score 24.00 25.00 Mean Educational Attainment 2.26 2.13 Median Educational Attainment 12.00 12.00 Mean Annual Income 47,503.8 52,146.8 Median Annual Income 38,000.0 40,000.0
Control Variables
Male 0.60 0.79 Born Abroad 0.04 0.04 Social functioning score 50.01 47.94 Extraversion Score 26.19 26.05 Observations 6,562 1,039
[84.2%] [15.8%]
The table reports summary statistics for the key variables in our analysis. The statistics are calculated from the cross-section of 6,562 individuals who reported being employed (salaried or self-employed) full-time during NCDS—Sweep 7. See Appendix A for variable definitions. Marital Status (indicated by five dummy variables) and Family Background (indicated by 18 dummy variables) are used as controls in regressions, but summary statistics for the variables are not reported here due to space constraints.
Electronic copy available at: https://ssrn.com/abstract=2596846
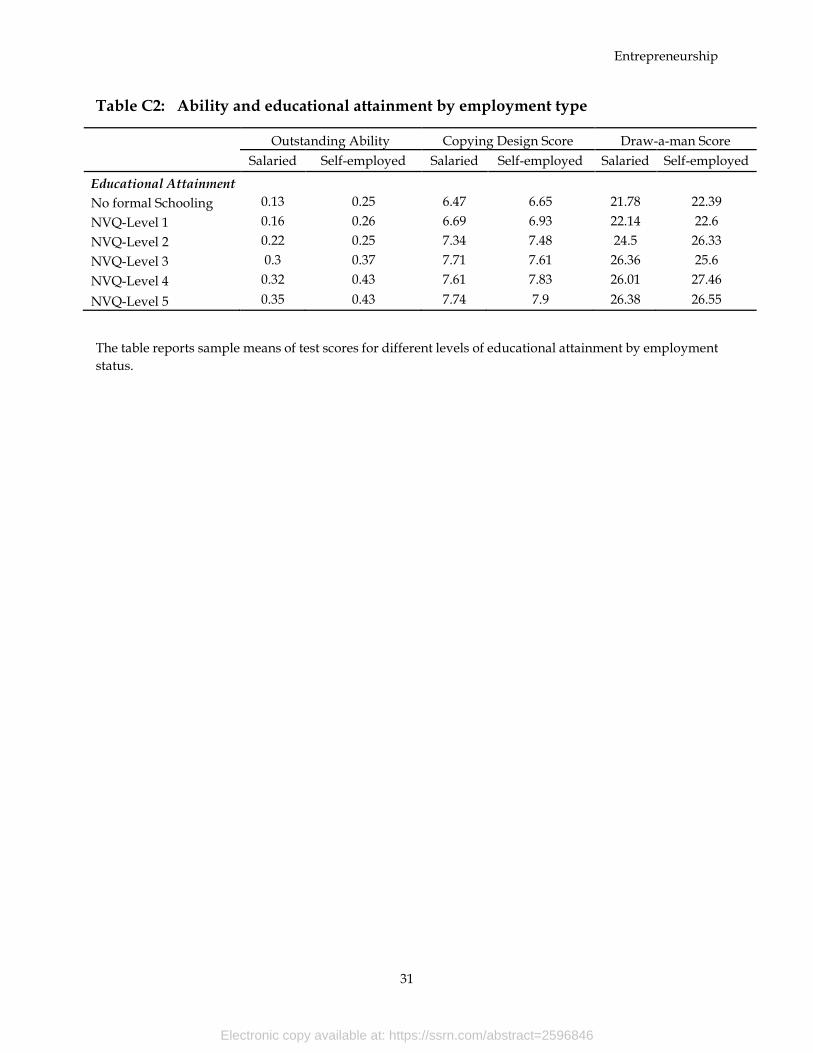
Entrepreneurship
31
Table C2: Ability and educational attainment by employment type
Outstanding Ability Copying Design Score Draw-a-man Score Salaried Self-employed Salaried Self-employed Salaried Self-employed
Educational Attainment No formal Schooling 0.13 0.25 6.47 6.65 21.78 22.39 NVQ-Level 1 0.16 0.26 6.69 6.93 22.14 22.6 NVQ-Level 2 0.22 0.25 7.34 7.48 24.5 26.33 NVQ-Level 3 0.3 0.37 7.71 7.61 26.36 25.6 NVQ-Level 4 0.32 0.43 7.61 7.83 26.01 27.46 NVQ-Level 5 0.35 0.43 7.74 7.9 26.38 26.55
The table reports sample means of test scores for different levels of educational attainment by employment status.
Electronic copy available at: https://ssrn.com/abstract=2596846
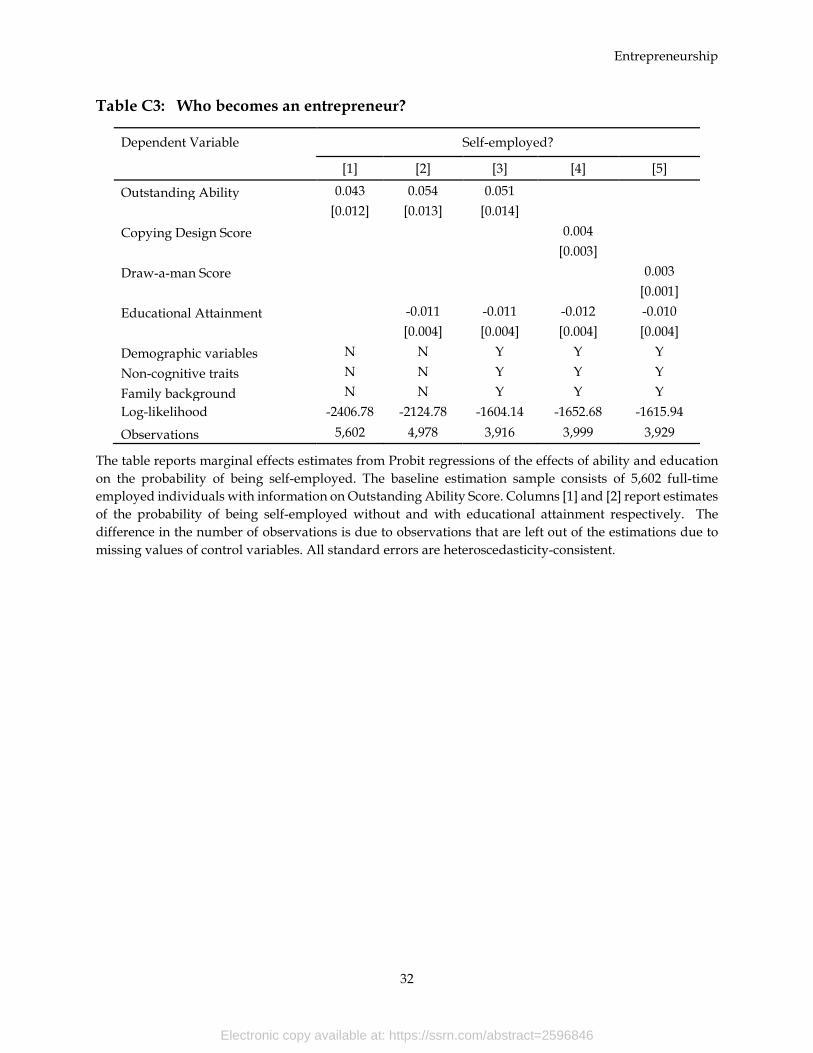
Entrepreneurship
32
Table C3: Who becomes an entrepreneur?
Dependent Variable Self-employed?
[1] [2] [3] [4] [5]
Outstanding Ability 0.043 0.054 0.051
[0.012] [0.013] [0.014]
Copying Design Score 0.004
[0.003]
Draw-a-man Score 0.003
[0.001]
Educational Attainment -0.011 -0.011 -0.012 -0.010
[0.004] [0.004] [0.004] [0.004]
Demographic variables N N Y Y Y Non-cognitive traits N N Y Y Y Family background N N Y Y Y Log-likelihood -2406.78 -2124.78 -1604.14 -1652.68 -1615.94
Observations 5,602 4,978 3,916 3,999 3,929
The table reports marginal effects estimates from Probit regressions of the effects of ability and education on the probability of being self-employed. The baseline estimation sample consists of 5,602 full-time employed individuals with information on Outstanding Ability Score. Columns [1] and [2] report estimates of the probability of being self-employed without and with educational attainment respectively. The difference in the number of observations is due to observations that are left out of the estimations due to missing values of control variables. All standard errors are heteroscedasticity-consistent.
Electronic copy available at: https://ssrn.com/abstract=2596846
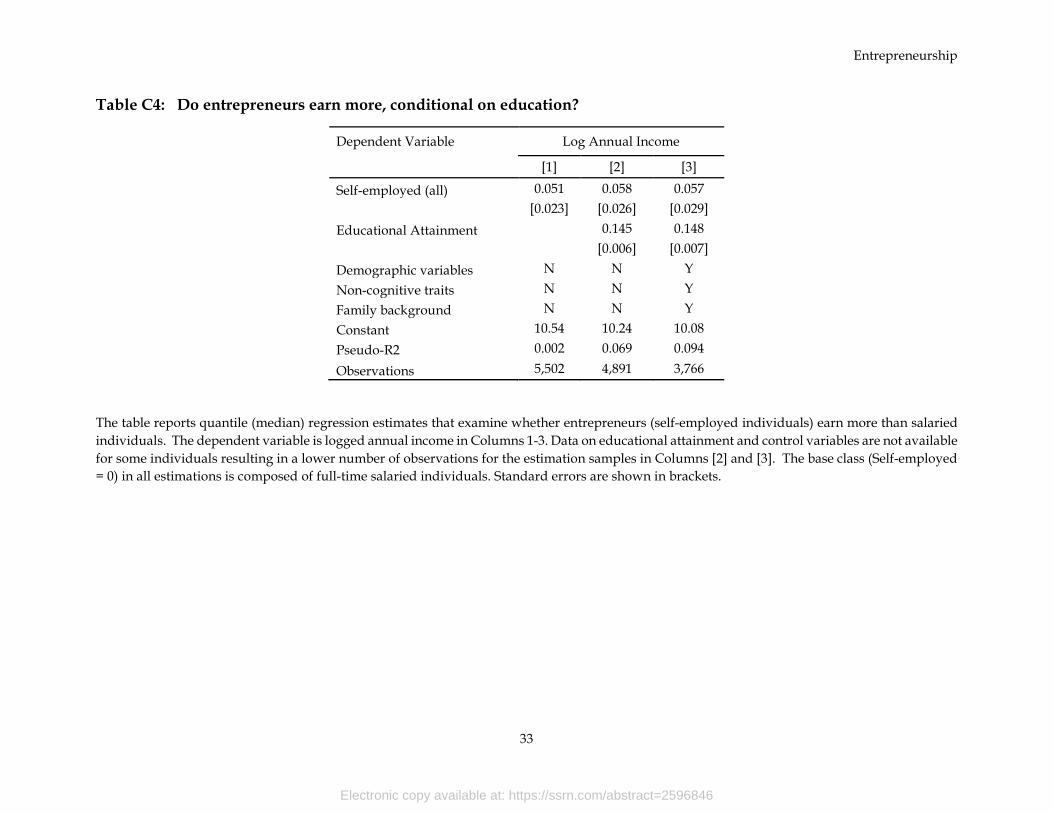
Entrepreneurship
33
Table C4: Do entrepreneurs earn more, conditional on education?
Dependent Variable Log Annual Income
[1] [2] [3]
Self-employed (all) 0.051 0.058 0.057
[0.023] [0.026] [0.029] Educational Attainment 0.145 0.148
[0.006] [0.007]
Demographic variables N N Y Non-cognitive traits N N Y Family background N N Y Constant 10.54 10.24 10.08 Pseudo-R2 0.002 0.069 0.094
Observations 5,502 4,891 3,766
The table reports quantile (median) regression estimates that examine whether entrepreneurs (self-employed individuals) earn more than salaried individuals. The dependent variable is logged annual income in Columns 1-3. Data on educational attainment and control variables are not available for some individuals resulting in a lower number of observations for the estimation samples in Columns [2] and [3]. The base class (Self-employed = 0) in all estimations is composed of full-time salaried individuals. Standard errors are shown in brackets.
Electronic copy available at: https://ssrn.com/abstract=2596846

Entrepreneurship
34
NCDS Figures
Figure C1: Distribution of income, Salaried v/s Self-employed
The figure shows, on the x-axis, highest educational attainment achieved by NCDS respondents, such that 0 indicates No formal schooling, and 5 represents NVQ Level that corresponds to a Master’s degree or higher. The figure is based on the responses of 1,039 self-employed individuals and 5,523 salaried individuals as reported in Sweep #7 of the NCDS.
020
0000
4000
0060
0000
8000
0010
0000
0A
nnua
l Inc
ome
(200
7 G
BP)
0 1 2 3 4 5
Salaried Self-employed
Electronic copy available at: https://ssrn.com/abstract=2596846