Embed Size (px)
Citation preview

M I C R O N U T R I E N T D E F I C I E N C I E SAND INTERVENTIONS IN CAMBODIA
Information for Improved Programming
By Robert Johnston and Joel Conkle
A2Z - The USAID Micronutrient and Child Blindness Project
February 2008

February, 2008
Artwork by Chan Vitarin
Photograph by Robert Johnston
A2Z - Th e USAID Micronutrient and Child Blindness Project
Phnom Penh, Cambodiawww.a2zproject.org(855) 23 997 501
Offi ce Address:#160, Street 71, Room 309Tonle Bassac, Chamkar Mon 12300Phnom Penh, Cambodia
February, 2008
Artwork by Chan Vitarin
Photograph by Robert Johnston
A2Z - Th e USAID Micronutrient and Child Blindness Project
Phnom Penh, Cambodiawww.a2zproject.org(855) 23 997 501
Offi ce Address:#160, Street 71, Room 309Tonle Bassac, Chamkar Mon 12300Phnom Penh Cambodia

ContentsDedication .......................................................................................................................IIIAcknowledgements ...........................................................................................................IIIAbbreviations ...................................................................................................................IVExecutive Summary ............................................................................................................1Introduction .......................................................................................................................7
Vitamin A .............................................................................................................
Conditions of Vitamin A Defi ciency ................................................................................13Preventive Vitamin A Supplementation ............................................................................18Issues with the Indicators from the CDHS and HIS .........................................................20Trends and Conditions in Vitamin A Supplementation ....................................................32
Anemia .................................................................................................................
Conditions of Anemia ......................................................................................................42Causes of Anemia .............................................................................................................42Low Birth Weight .............................................................................................................44Prevalence of Anemia .......................................................................................................45Iron Supplementation ......................................................................................................52Issues with the Indicator from the CDHS ........................................................................54Trends and Conditions of Iron Supplementation ..............................................................57Preventive Deworming .....................................................................................................63Estimates of Iron Defi ciency and other Causes of Anemia ................................................67
Iodine ...................................................................................................................
Iodine Defi ciency .............................................................................................................74Iodine Fortifi cation ..........................................................................................................76
Zinc ......................................................................................................................
Zinc Defi ciency ................................................................................................................81Zinc Treatment for Diarrhea.............................................................................................85
Conclusions ..........................................................................................................
Annexes .................................................................................................................Methods ...........................................................................................................................95Anthropometry ................................................................................................................99References ......................................................................................................................109
40
13
73
80
89
95

iv Micronutrient Defi ciencies and Interventions in CambodiaInformation for Improved Programming
Th is report is dedicated to Dr. Ou Kevanna and the staff of the National Nutrition Program (NNP) of the Cambodian Ministry of Health. Despite the numerous constraints including limited fi nancial and human resources, the NNP by their perseverance and hard work have made progress in addressing maternal and child under nutrition.
Th e National Nutrition Program is to be commended for its achievements. Dr Ou Kevanna, as the head of the National Nutrition Program is especially recognized for his untiring eff orts to increase awareness among policy makers about the relationship between the population’s health and the achievement of Cambodia’s socio-economic development goals.
With increased commitment and support from the Cambodian government and development partners the National Nutrition Program will be able to eff ectively deliver nutrition interventions to improve the health of all women and children. Without improvements in the nutrition of women and children, Cambodia’s plan for sustainable development and continued economic growth will be unachievable.
Dedication

vMicronutrient Defi ciencies and Interventions in CambodiaInformation for Improved Programming
Th anks to: Dr. Prak Sophorneary - Deputy Program Manager, NNP Dr. Reach Ratana - Anemia Prevention and Control Coordinator, NNP Mr. Touch Dara - IDD Program Coordinator - NNPDr. Kao Ny - Anemia Prevention and Control Project Offi cer-NNPDr. Mary Chea - IYCF Community Baby Friendly Initiative Coordinator - NNP Mr. Hou Krouen - Program Manager, Helen Keller CambodiaMr. Zaman Talukder - Country Director, Helen Keller CambodiaMs. Michelle Lang-Alli - Regional Technical Advisor, Catholic Relief Service Dr. Susan Jack - Technical Advisor Child Survival WHO / A2Z Micronutrient Project Ms. La Ong Tokmoh - Nutrition Technical Offi cer - WHODr. Kia Reinis - Country Monitor of Cambodian Demographic Survey 2005
Th anks to:Dr. Prak Sophorneary - Deputy Program Manager, NNPDr. Reach Ratana - Anemia Prevention and Control Coordinator, NNPMr. Touch Dara - IDD Program Coordinator - NNPDr. Kao Ny - Anemia Prevention and Control Project Offi cer-NNPDr. Mary Chea - IYCF Community Baby Friendly Initiative Coordinator - NNP Mr. Hou Krouen - Program Manager, Helen Keller CambodiaMr. Zaman Talukder - Country Director, Helen Keller CambodiaMs. Michelle Lang-Alli - Regional Technical Advisor, Catholic Relief ServiceDr. Susan Jack - Technical Advisor Child Survival WHO / A2Z Micronutrient Project Ms. La Ong Tokmoh - Nutrition Technical Offi cer - WHODr. Kia Reinis - Country Monitor of Cambodian Demographic Survey
2005
Acknowledgements

vi Micronutrient Defi ciencies and Interventions in CambodiaInformation for Improved Programming
ANC - Antenatal CareARI - Acute Respiratory InfectionsBMI - Body Mass IndexCDHS - Cambodian Demographic and Health SurveyCESVI - Cooperazione e Sviluppo (Cooperation and Development)CHVs - Community Health VolunteersCNMBS - Cambodian National Malaria Baseline SurveyCNMS - Cambodian National Micronutrient SurveyGTZ - Deutsche Gesellschaft für Technische Zusammenarbeit (German Agency for Technical Cooperation)Hb - HemoglobinHIS - Health Information SystemIFA - Iron/folic acid IMCI - Integrated Management of Childhood IllnessIRD - International Relief and DevelopmentIRIS - International Research on Infant SupplementationIVACG - International Vitamin A Consultative GroupIZiNCG - Th e International Zinc Nutrition Consultative Group KFP - Key Family PracticesLBW - Low birth weightLQAS - Lot Quality Assurance Sampling MICS - Multiple Indicator Cluster SurveysMoH - Ministry of HealthNCHS - National Center for Health StatisticsNGOs - Non-Governmental OrganizationsNIS - National Institute of StatisticsNNP - National Nutrition Program (of the Cambodian Ministry of Health)ORS - Oral rehydration saltsPSI - Population Services InternationalRACHA - Reproductive and Child Health AllianceTASK - Tratrung ning Akphiwat Sokhaphiep neak Kre Kraw (Supporting the Development & Health of the Poor)UCLA - University of California – Los AngelesUNICEF - Th e United Nations Children’s FundUSAID - United States Agency for International Development VAD - Vitamin A Defi ciencyVIF - Variance Infl ation FactorWHO - World Health OrganizationWIF - Weekly Iron Folate
ANC - Antenatal CareARI - Acute Respiratory InfectionsBMI - Body Mass IndexCDHS - Cambodian Demographic and Health SurveyCESVI - Cooperazione e Sviluppo (Cooperation and Development)CHVs - Community Health VolunteersCNMBS - Cambodian National Malaria Baseline SurveyCNMS - Cambodian National Micronutrient SurveyGTZ - Deutsche Gesellschaft für Technische Zusammenarbeit (German Agency for Technical Cooperation)Hb - HemoglobinHIS - Health Information SystemIFA - Iron/folic acidIMCI - Integrated Management of Childhood IllnessIRD - International Relief and Development
Abbreviations

1Micronutrient Defi ciencies and Interventions in CambodiaInformation for Improved Programming
Executive Summary
IntroductionAnemia and micronutrient defi ciencies are invisible, insidious forms of malnutrition that aff ect individuals, families and countries. Micronutrient malnutrition decreases the chances of leading a healthy life by reducing immune function, work capacity and education ability. At key points in the life cycle these micronutrient defi ciencies can lead to severe growth retardation and death.
A2Z - Th e USAID Micronutrient and Child Blindness Project is working towards identifying and implementing eff ective and aff ordable interventions to address anemia and micronutrient defi ciencies. In Cambodia, A2Z works to mainstream micronutrients into the health system and advance food fortifi cation through critical analysis, ongoing coordination with government and nutrition partners and provision of technical support and innovation.
Cambodia’s economy has grown dramatically in the past years and the fl oods and droughts common to the past have fortunately been absent. Living conditions on the whole are improving for the general population. Despite these improvements, Cambodia has a higher maternal mortality rate and an equal rate of child under-fi ve mortality compared to Bangladesh. Cambodian conditions of anemia and micronutrient malnutrition are among the worst in south-east Asia. Th ere is an urgent need to address malnutrition in Cambodia.
Cambodia is fortunate to have many sources of data on maternal and child health and nutrition, such as two Demographic and Health Surveys, a Health Information System and several smaller studies. Th is report documents what the available data sources reveal about the conditions of anemia and micronutrient defi ciencies, their prevention and treatment. Th e conditions of child malnutrition used in this analysis are based on the heights and weights from the Demographic and Health Surveys calculated with the new International Growth Standards released from WHO in 2006. Th e indicators of malnutrition are presented in the annex.
The new child growth standards show that stunting or chronic malnutrition in Cambodian children (43%) is higher than what was reported in the CDHS 2005 (37%), which used the old NCHS/WHO/UNICEF growth standards. Th e prevalence of wasting or acute malnutrition increased slightly (8%) when the new growth standards are compared to the old (7%). The findings concerning micronutrient defi ciencies continue below.

2 Micronutrient Defi ciencies and Interventions in CambodiaInformation for Improved Programming
Inequity in utilization of servicesThe most consistent finding throughout this analysis was that the Cambodian women and children who are most in need of micronutrient and deworming interventions are the least likely to receive them. The great inequities in the delivery of child survival interventions were first documented in the CDHS 2000 and continue to be evident today. Th e micronutrient interventions in this report are promoted for all women and children, but anemia and micronutrient defi ciencies will not decrease unless the population in need receives the appropriate interventions. Cambodia is following international recommendations to iodize salt and provide universal micronutrient supplementation and deworming as needed but a dramatic intensifi cation of eff orts is required. Elimination of this inequity will allow delivery of the micronutrient and deworming interventions to the correct populations and result in rapid measurable improvements in health.
No improvement in rates of maternal night blindness. Vitamin A defi ciency is a serious public health problem among women and children in Cambodia. Twenty-two percent of rural children 6-59m of age had severe vitamin A defi ciency (low serum retinol) in 2000 (CNMS 2000). In Kampong Th om and Stung Treng/Preah Vihear, almost 5% of women reported night blindness during their last pregnancy in 2005 (CDHS 2005). Comparison of the adjusted levels of reported maternal night blindness from the CDHS 2000 and CDHS 2005 shows no improvement. For children, data is available only from 2000 and the trend of vitamin A defi ciency cannot be assessed.
What is the coverage of vitamin A supplementation in children? Th e CDHS 2005 reported a rate of vitamin A supplementation in children of 34%. Th e vitamin
A supplementation questions changed between 2000 to 2005 allowing mothers to respond “don’t know” when child received vitamin A. Analysis showed that poor mother’s recall and mothers reporting “don’t know” when child received vitamin A (30%) signifi cantly biased the estimate. Adjustments for recall bias and use of imputation for cases where mothers reported “don’t know” when child received vitamin A produced a coverage estimate of 50%. Supplementation rates in children appear to have improved (from 29% to an estimated 50%) but the trend of vitamin A coverage in children is not precise due to the high percentage of “don’t know” when responses in 2005.
Th e rate of utilization of vitamin A supplements in children (ever received vitamin A) was not biased by the conditions detailed above. Counts of children who never received vitamin A were calculated and graphed on a map. In Kampong Cham province over 45,000 children aged 6-59 months never received vitamin A. Th is analysis showed that provincial utilization (and coverage) rates alone do not clearly identify where the largest populations of children are not receiving interventions. Actual numbers of children need to be taken into account in the intensifi cation of delivery of micronutrient interventions.
Post-partum vitamin A supplementation improved but still very low coverage. Th e CDHS 2005 reported that 27% of post-partum women received supplementation with vitamin A in the eight weeks after delivery. Th e post-partum indicator was not aff ected by biases identifi ed with the child supplementation indicator. Th e post-partum supplementation rate almost tripled from 2000 to 2005 (from 11% to 27%) but is still low. Th e HIS data shows improvements in vitamin A supplementation rates in both post-partum women and children over time.

3Micronutrient Defi ciencies and Interventions in CambodiaInformation for Improved Programming
Anemia in women and children remains a serious problem.In Cambodia, anemia has been documented repeatedly as a serious public health issue in children under fi ve and women of reproductive age. Anemia increases the risk of maternal and perinatal mortality and negatively affects child development and educational and economic potential.
Th e most recent measures in the CDHS 2005 showed that 47% of women aged 15-49 years were anemic and 11% had moderate or severe anemia. Sixty-two percent of children aged 6-59 months were anemic and 33% had moderate or severe anemia. From 2000 to 2005 the prevalence of anemia in children was stagnant. In women of reproductive age in the same time period, the prevalence of anemia in women decreased by 11 percentage points.
Th e exact causes of anemia in aff ected populations have not been accurately quantifi ed but the most important causes are considered to be:
Dietary iron defi ciency Other micronutrient defi ciencies Infection with hookworm and/or
schistosomiasis Hemoglobinopathies and Malaria
Iron defi ciency No data on iron defi ciency in women of reproductive age was identifi ed. Th e iron needs during pregnancy are known to be the highest throughout the entire life cycle. Iron defi ciency is assumed to be a signifi cant cause of anemia in pregnant women in Cambodia. Two studies on iron and multi-micronutrient supplementation were done in pre-school children in Kampot and Kampong Chnnang provinces. Th e children in the control groups who did not receive iron but received vitamin A and deworming (depending on age) had a prevalence of iron deficiency (low serum ferritin adjusted for infl ammation) of about 50%.
Low coverage of deworming in under-fi ve children and pregnant women.No national level data on prevalence of intestinal parasites was identifi ed but hookworms that cause anemia are considered common in school children and adult populations. Less than one-third of children 12-59 months received deworming treatment in 2005. Children are more likely to receive deworming after 2 years of age and possibly when they start to show symptoms of parasitic infection. About 10% of pregnant women received deworming overall. In some provinces, such as Mondolkiri and Rattanakiri, deworming was virtually non-existent for pregnant women. Th e highest coverage rates for pregnant women in any province were about 20%.
No data was collected on post-partum deworming. No data was collected on deworming in the CDHS 2000 precluding trend analysis.
Malaria infection rates are low. After the rapid deforestation that occurred over the past 15 years, malaria appears to have largely disappeared as a serious cause of under-five mortality. Using the prevalence estimates of slide positive malaria from the Cambodian National Malaria Baseline Survey 2004 and WHO estimates of populations living in malaria risks zones, a national level prevalence of 0.4% was calculated. Malaria is regularly diagnosed in marginal forested zones with low population density. On the national level, it is not considered to contribute signifi cantly as a cause of anemia or under-fi ve mortality.
Hemoglobinopathies Th e genetic causes of anemia common in Cambodiahave been documented in at least fi ve recent studies. Th ere is no national level data, but hemoglobin E and alpha thalassemia are the most common hemoglobinopathies while beta thalassemia was less common. In a review of all studies, it was concluded that the majority of hemoglobinopathies were
4 Micronutrient Defi ciencies and Interventions in CambodiaInformation for Improved Programming
clinically benign. Th ere is still the need to determinethe eff ect of hemoglobinopathies on hemoglobin concentration. If hemoglobinopathies are responsible for 30% of anemia for example, then interventions will never decrease the anemia prevalence below that 30% platform. Th e information on the eff ect of hemoglobinopathies will help determine the criteria of success for programs addressing preventable anemia.
More robust data and action is needed on low birth weight.Children born with low birth weight often develop iron defi ciency anemia before reaching six months of age. Supplemental oral iron is recommended for low birth weight infants starting from 6 to 8 weeks of age. Th is is not practiced in Cambodia. Th e CDHS 2005 reported a low birth weight rate of 8%, but only 40% of children were measured and the source of 80% of birth weights was maternal recall. Using accepted methods of estimation of low birth weight accounting for size at birth and adjusting for heaping at the 2.5 kg cut-off produced a low birth weight rate of 15%. More robust data is needed to help focus attention on this issue. Public health interventions are needed to prevent low birth weight and treat its consequences in Cambodia.
Utilization of Iron Supplementation increased but poor compliance continues. Iron supplementation of 90 days is recommended for all pregnant women in Cambodia. In 2005, only 18% of women took the recommended number (90+ tablets) of iron supplements during their last pregnancy. Only two-thirds of women reported that they received any iron supplementationduring their last pregnancy. Nine percent of women who received iron reported “don’t know” the number of days that they took iron/folic acid (IFA) tablets. To avoid this introducing bias, utilization rates (ever received IFA tablets) were used in provincial and trend analyses.
Utilization of IFA tablets increased from 21% in 2000 to 63% in 2005. Counts of the number of women who never received IFA tablets during pregnancy were calculated and inserted into a map graph. Due to small populations, the provinces with the lowest rates of utilization (Preah Vihear/Stung Treng and Mondolkiri/Rattanakiri) have small numbers of women who have never received any IFA tablets compared to other provinces. Th e higher population density provinces had larger numbers of women not utilizing IFA tablets. Th e two provinces with the worst conditions were Kampong Cham and Kandal provinces with 400,000 and 260,000 women, respectively who never took any IFA tablets during pregnancy
Provincial utilization (and coverage) rates do not clearly identify where the largest populations do not receive interventions. Actual numbers of the target population need to be taken into account in the intensifi cation of delivery of micronutrient interventions.
Low coverage of post-partum iron supplementationWomen’s iron stores are often exhausted after delivery. Only 11% of women reported receipt of any IFA tablets post-partum in 2005. Th ere was no data collected in 2000 so a trend cannot be assessed.
Increase in household use of iodized salt but problems remain in border areas. Iodine defi ciency is one of the leading causes of preventable cognitive impairment. Th e most current data on iodine defi ciency in Cambodia from the 1996/7 National Goiter Survey found 17% of school-aged children with iodine defi ciency. UNICEF is currently preparing for a new national iodine defi ciency study in school children in 2008. Th e prevalence of iodine defi ciency has likely decreased rapidly after producers and distributors began to comply with the universal salt iodization law of 2003.

5Micronutrient Defi ciencies and Interventions in CambodiaInformation for Improved Programming
Th e percent of households with no salt or non-iodized salt decreased from 86% in 2000 to 29% in 2005. No information was collected on fi sh sauce, which may contain iodine and is used commonly in Cambodian households. Th e only provinces where use of iodized salt decreased (Svay Rieng, Mondol Kiri/ Rattanakiri) are along the border with Vietnam. Th is is considered due to the importation of non-iodized salt. More eff orts are needed to ensure that iodine defi ciency is not a problem in remote areas like Mondul Kiri and Rattanakiri.
Almost 650,000 children under-fi ve years of age are zinc defi cient.Adequate zinc nutrition is necessary for normal pregnancy outcomes, optimal child health and physical growth. National measures of zinc defi ciency based on biomarkers do not exist and estimates are based on proxy measures such as prevalence of stunting. From 2005 data, Cambodia is considered to have among the highest rates of zinc defi ciency in children in SE Asia (stunting-43%). An estimated 647,000 children under fi ve years of age are zinc defi cient.
Children in every province in Cambodia are at a high risk for zinc defi ciency (>20% stunting). Th e provinces with the highest rates of risk are Pursat, Siem Reap and Mondolkiri/Rattanakiri while the provinces with the highest number of children at risk are Kampong Cham, Battambang/Krong Pailin, and Siem Reap.
Current recommendations for use of zinc in children are for diarrhea treatment. Oral rehydration salts used along with 10 days of zinc supplemen-tation was found to reduce the length of illness and prevent reoccurrence. In 2005, the prevalence of diarrhea in children in a two-week period was 20%, representing almost 300,000 children under 5 years of age. Th e prevalence of diarrhea was highest among children 6 to 23 months of age. Th is coincides with the child’s growth spurt and greatest need for zinc.
In 2006, an innovative social marketing program of diarrhea treatment kits (ORS bundled with 10 days of 20mg zinc supplements) was piloted in two provinces. Th e program was evaluated (rapid assessment) and found successful. This pilot project ended and progress on the national level implementation of the ORS plus zinc treatment has been stalled.
ConclusionsFor progress to be made with nutrition, strong collaboration is needed between health workers, national programs and organizations working in child survival, rural development, water and sanitation, food safety, education and several other sectors.
Micronutrient nutrition, macronutrient nutrition and illness all play a large role in explaining the health conditions of Cambodia. Despite recent improvements in maternal and child health and nutrition, this analysis shows that several long term and complex challenges remain, such as:
increasing and maintaining micronutrient supplementation coverage rates
reaching remote and poor inaccessible populations
improving the quality and use of health information
Recommendations related to all of these challenges are presented in the conclusions of this document, which also includes the issues and recommendations related to individual micronutrients.

6 Micronutrient Defi ciencies and Interventions in CambodiaInformation for Improved Programming
Introduction
Malnutrition and micronutrient defi ciencies are the result of the complex interactions of poor diet, feeding behaviors, hygiene and illness. Micronutrient malnutrition aff ects physical and mental growth and development. Physical growth is much easier to measure and commonly assessed by height, weight and age. In this report, the international WHO Child Growth Standards (WHO 2007) were used to calculate new estimates of stunting, wasting and underweight in children under fi ve years of age. According to these new indicators, 43% of children are stunted, 29% are underweight and 9% are wasted. Further tables and charts presenting the new malnutrition estimates are included in the annexes.
Figure 1: Prevalence of stunting, underweight, wasting, and low body mass index in children under fi ve years of age, CDHS 2005 with new international growth standards.
42.6
28.5
8.66.6
0
10
20
30
40
50
Stunted (<-2SD HAZ) Underweight (<-2SD
WAZ)
Wasted (<-2SD WHZ) Low BMI (<-2SD Z-BMI)
Percent
Number=3,356

7Micronutrient Defi ciencies and Interventions in CambodiaInformation for Improved Programming
Micronutrient malnutrition can be addressed in several ways including supplementation, fortifi cation, dietary counseling and behavior change and prevention of illness through hygiene and food safety. Organizations working in Cambodia have implemented or are starting many innovative projects to address micronutrient deficiencies. Th ese projects include:
Homestead Food Production – Helen Keller International, Cambodia
Social Marketing of Diarrhea Treatment Kits (Oral Rehydration Salts bundled with 10 tablets of zinc) - Population Services International, Cambodia
PlumpyNut for management of severe acute malnutrition - National Pediatric Hospital, Magna, TASK and Clinton Foundation
Sprinkles for school children in selected program areas - World Food Program
Fortifi ed MI DARA Noodles - International Relief and Development, Cambodia
Fortifi ed Fish Sauce - RACHA Iron and Vitamin A rich fi sh research - RVA
University, Denmark and Inland Fisheries Research and Development Institute, Cambodia
In-home micronutrient fortification and complementary feeding counseling - Good Food for Children Project (National Nutrition Program (HSSP), A2Z, HKI, WHO and UNICEF)
Despite these projects, there is serious need for basic system support to make government programs more effective. This analysis attempts to show what is known about the current situation of malnutrition, anemia and micronutrient defi ciencies, and the national programs that address these problems. Th e report intends to provide relevant
stakeholders with information to enable better prioritization of resources and targeting of nutritioninterventions. Detailed information is given on the sub-groups most aff ected by micronutrient deficiencies, the geographical areas with high prevalence rates or population counts with micronutrient defi ciencies, and the possible reasons for increased vulnerability to micronutrient defi ciencies.
Cambodia is fortunate to have many sources of data on maternal and child health and nutrition. Th ese data include two Demographic and Health Surveys (CDHS 2000 and CDHS 2005), a Health Information System (HIS), the Twelve Key Family Practices for Health report and other studies conducted in Cambodia and the region. Further details on the analysis methods are given in the annexes at the end of the report.
Th e report is concerned with anemia, defi ciencies of iron, vitamin A, zinc and iodine and deworming which are dealt with in sections. Each section addresses the following points:
How many persons have the problem? Where are they located? What are their defi ning characteristics? What is the trend with the problem?How many receive the intervention? Where are they located? What are their defi ning characteristics? What is the trend with the intervention?
Th is report is long but far from comprehensive. Th ere is a great deal more information that can be uncovered from the existing data sources. We hope that the information included in this report will be used to improve program implementation.

8 Micronutrient Defi ciencies and Interventions in CambodiaInformation for Improved Programming
Vitamin A Defi ciency Summary Points
Prevalence: 22% of rural children 6-59m of age had severe vitamin A defi ciency as measured by serum retinol in 2000 (CNMS 2000) and 2% of women had night blindness during their last pregnancy in 2005 (CDHS 2005).
Geographic Distribution: Kampong Th om and Stung Treng/Preah Vihear have the highest reported prevalence of maternal night blindness. Th e rates in these three provinces are close to 5% (CDHS 2005), which indicates a problem of public health signifi cance. In 2000 the provinces of Kampong Th om, Preah Vihear, Koh Kong, Oddar Meanchey and Rattanakiri reported rates of child night blindness over 1% indicating a signifi cant public health problem (CNMS, 2000)
Vitamin A
Children are born with low stores of vitamin A. Th e fi rst “vaccination” that they receive is the vitamin A rich colostrum in the fi rst few days after birth. Exclusive
breastfeeding in the fi rst six months of life has a protective eff ect against vitamin A defi ciency, but mothers who are vitamin A defi cient produce breastmilk that is defi cient in vitamin A (Miller et al, 2002). After six months of life, breastfeeding no longer provides adequate nutrition for the rapidly growing infant. Children older than six months of age and women of reproductive age are considered to be at special risk of vitamin A defi ciency.
Vitamin A defi ciency is a result of low intake of foods from animal sources (such as meat, liver, fi sh, and eggs), vitamin A rich fruits and vegetables and illness (Miller et al, 2002). For nutrition and health staff promoting vitamin A rich foods, it needs to be clear that fruits and vegetables are important sources of vitamin A, but the bio-availability of vitamin A is much higher from foods from animal sources compared to fruits and vegetables (West et al, 2002). Good vitamin A stores boosts immunity and signifi cantly reduces the harmful eff ects of diarrhea and measles. Defi ciency of vitamin A leads fi rst to increased morbidity. More severe defi ciencies of vitamin A cause night blindness and xerophthalmia, and increased risk of death.
Conditions of Vitamin A Defi ciency

9Micronutrient Defi ciencies and Interventions in CambodiaInformation for Improved Programming
At-Risk Populations: Rural, uneducated women of the lowest wealth quintile have the highest prevalence of night blindness. For children, no background details were reported with the vitamin A defi ciency or night blindness indicators, but the children of the women most at risk are likely to be vitamin A defi cient also.
Trends: Comparison of the adjusted levels of reported maternal night blindness from the CDHS 2000 and CDHS 2005 shows no change. For children, data is available only from 2000 and the trend cannot be assessed.
Country Sample Size & Population Group Date & Source Prevalence
Cambodia Children 6-59 months (N=359) 2000, CNMS 22.3
Lao PDR Children 0-59 months (N=419) 2000, National Survey 44.7
Vietnam Children 6-59 months (N=1,975) 2000, National Survey 12.4
Nepal Children 6-59 months (N=843) 1997-98, National Survey 32.3
Note: Severe vitamin A defi ciency is defi ned as serum retinol < 0.7 mmol/Liter.
Sources: Hix et al, 2006 (Cambodia). Ministry of Health [Lao People’s Democratic Republic]. Report on national health survey:
health status of the People of LAO PDR. Vientiane, Ministry of Health, 2001. National Institute of Nutrition. Report on Vietnam National anemia Survey, 2000. Hanoi,
2001. Nepal Micronutrient Status Survey December 1997- May 1998.
During the data collection of CNMS 2000, blood samples were collected from over 2,000 preschool children. Vitamin A results have not been reported for all children. In the laboratory, 385 tubes were randomly selected from the total sample. Serum retinols were measured in 359 children for whom adequate serum volume was still available (Hix et al, 2006). No background information was presented to show that these 359 children were similar in characteristics to the original sample of 15,550 children. Th is survey was only conducted in rural areas of ten provinces and cannot be considered nationally representative. Th e prevalence reported from the CMNS 2000 should be considered an approximation of the prevalence of vitamin A defi ciency in rural Cambodian children.
Th e prevalence of severe vitamin A defi ciency in the region is given in table 1 below. All countries included used the same measure and standard cut-off for severe vitamin A defi ciency. Th e reported prevalence of severe deficiency among rural children 6-59 months of age from the Cambodia National Micronutrient Survey (CNMS) 2000 is 22%. Th e prevalence of severe vitamin A defi ciency
in Cambodia is lower than Laos and Nepal, but is nearly twice the prevalence of neighboring Vietnam and is well above the 10% cutoff value used to signify a public health problem (WHO, 1996)
Table 1. Prevalence of Severe Vitamin A Defi ciency in Children in S & SE Asian Countries

10 Micronutrient Defi ciencies and Interventions in CambodiaInformation for Improved Programming
In the CNMS 2000, mothers were asked if their children currently had night blindness. Two well-understood terms that both mean night blindness were used in the Khmer translation of the question. Th e World Health Organization and IVACG established that a prevalence of night blindness greater than or equal to 1% among young children (18-59 or 24-59 months) constitutes a “problem of public health significance” and suggests that a much larger proportion of the population suffers from sub-clinical vitamin A defi ciency, which increases the risk of morbidity and mortality (WHO, 1982). Figure 2. Night Blindness in Children 18-59
months of age, CNMS 2000
has been validated as an indicator of vitamin A defi ciency (Christian, 2002), but the only study identifi ed to validate child night blindness as an accurate method to determine vitamin A defi ciency in a population found that in an area with no defi ned term for night blindness, reported night blindness did not identify vitamin A defi ciency in a population (Wedner et al, 2004). A more accurate measure that is less common, but represents more advanced vitamin A defi ciency in children, would be visual identifi cation of xerophthalmia, bitot’s spots and corneal scarring by trained experts.
Th e CDHS 2000 and 2005 reported data on night blindness during pregnancy in women who gave birth in the last fi ve years. In 2000 and 2005, the
woman was asked if she had night blindness with the local term and if she had vision problems during the day. Th e indicator for night blindness was based on women who reported having night blindness and adjusted by sub-tracting the women who reported having vision problems during the day.
An adjusted maternal night blindness prevalence of 5% or more is recommended as a cut-off at which vitamin A defi ciency may be considered to be a problem of public health signifi cance within the community (IVACG, 2002). The adjusted national prevalence of night blindness among women during their last pregnancy in 2005 is 2% (shown in the national column on the right hand side of fi gure 3).
Th ere is signifi cant variation of the prevalence of maternal night blindness by province in 2005. In the Battambang/Pailin domain, there was no reported maternal night blindness, while in Kampong Th om and the Preah Vihear/Stung Treng domain, the prevalence was almost 5%.
In the CNMS 2000, the provinces of Preah Vihear, Kampong Th om, Koh Kong, Oddar Meanchey and Rattanakiri reported rates of child night blindness over one percent, indicating a signifi cant public health problem (fi gure 2). With the exception of Kampong Th om, all of these provinces are remote and have small populations. It is important to note that compared to the provinces with high prevalence, the prevalence of 0.6% of night blindness in Kampong Cham could represent close to three times as many children with night blindness due to the large population in that province.
Th e indicator of child night blindness has never been collected in DHS surveys due to questions about its accuracy. Maternal night blindness
0.2 0.30.6 0.6 0.7
1 1.1 1.2
1.82.1
0
1
2
3
Kanda
l
Battam
bang
Kampo
t
Kampo
ng C
ham
Kampo
ng Sp
eu
Preah
Vihe
ar
Kampo
ng Th
om
Koh K
ong
Oddar
Meanch
ey
Rattan
akiri
Percent of children 18-59 months reported with night blindness
N=12,820 CNMS 2000

11Micronutrient Defi ciencies and Interventions in CambodiaInformation for Improved Programming
According to the CDHS 2005, rural women, those with no schooling, and those of the lowest wealth quintile had the highest prevalence of night blindness. Th ese women have the highest risk of vitamin A defi ciency (Table 2).
Table 2. Prevalence of maternal night blindness by background characteristics, CDHS 2005
Figure 3. Adjusted prevalence of maternal night blindness by province, CDHS 2005
Th e CDHS 2000 collected data from 15 domains while the CDHS 2005 collected data from 19 domains. Th e thirteen domains that are directly
comparable are shown in figure 4. The data is sorted by the adjusted percent of reported maternal night blindness from low to high.
Th e adjusted national prevalence of night blindness among women during their last pregnancy appears to have increased from 1.6% in 2000 to 2.2% in 2005 (shown in the national column on the right hand side
of fi gure 4). Th e rate of maternal night blindness appears to have gone down in only two domains (Battambang/Pailin and Takeo) remained the same in Pursat, and to have increased in the remaining ten domains. Th e biggest increases were found in Kampong Speu, Mondolkiri/Rattanakiri, Kampong Cham, Prey Veng and Kampong Th om.
Th e large variation between the adjusted rates of maternal night blindness between 2000 and 2005 could suggest that despite the existence of a local term in the Khmer language for night blindness, this indicator is not very robust to identify vitamin A defi ciency in women during the last pregnancy by province. Th e variation also could be due to differences in understanding the question and recording the answer by interviewer teams. Th e recommended indicator is for women who have been pregnant in the last three years, but the diff erence between three year and fi ve year recall is not considered to aff ect the estimates greatly.
CDHS 2005 (N=5,865)
Percent of mothers reporting night blindness during pregancy in past five years
0.0
1.0
2.0
3.0
4.0
5.0
6.0
Batta
mba
ng &
Kro
ng P
ailin
Take
oPh
nom
Pen
hK
ratie
Odd
ar M
eanc
hey
Kro
ng P
reah
Sih
anou
k &
Koh
Kon
gPu
rsat
Siem
Rea
pBa
ntea
y Mea
n C
hey
Kam
pong
Spe
uK
anda
l
Mon
dolk
iri/R
atta
naki
ri Sv
ay R
ieng
Kam
pong
Chh
nang
Kam
pot &
Kro
ng K
epK
ampo
ng C
ham
Prey
Ven
gK
ampo
ng Th
om
Prea
h Vi
hear
& S
tung
Tre
ng
Nat
iona
l
0.00.5 0.7 0.9 0.9 1.1 1.2
1.7 1.8 2.0 2.1 2.2 2.6 2.8 2.8
3.8 4.04.7 4.8
2.2
Percent Number
Education
No SchoolingPrimarySecondary +
3.32.30.7
1,3563,4821,028
Wealth Quintile
LowestSecondMiddleFourthHighest
3.92.81.81.20.8
1,4771,3201,0771,003
988
Place of Residence
RuralUrban
Overal
2.41.3
2.2
8275,039
5,865

12 Micronutrient Defi ciencies and Interventions in CambodiaInformation for Improved Programming
Figure 4. Adjusted rates of maternal night blindness by province, CDHS 2000 and CDHS
1.6
2.82.7
1.51.41.7
0.6
1.0
0.5
1.1 1.1
0.4
1.3 1.6
2.2
4.7
4.03.8
2.82.6
2.22.12.0
0.0
0.50.7
1.2
1.8
0
1
2
3
4
5
Battam
bang/K
rong P
ailin
Takeo
Phnom
Penh
Pursat
Bantea
y Mean
Che
y
Kampo
ng Sp
euKan
dal
Mondo
lkiri/
Rattan
akiri
Svay
Rieng
Kampo
ng C
hhna
ng
Kampo
ng C
ham
Prey V
eng
Kampo
ng Th
om
Nation
al
Adjusted 2000 Adjusted 2005
CDHS 2000 (N=5,714) CDHS 2005 (N=5,865)
Percent of mothers reporting night blindness during pregancy in past five years
Preventive Vitamin A Supplementation
Vitamin A Supplementation Summary Points
Coverage: Th e vitamin A supplementationrate for children from the CDHS 2005 was widely considered to be an under-estimate. Analysis adjusting for recall bias and using imputation for cases where mothers reported “don’t know” when child received vitamin A produces a coverage estimate of 50%.
Th e CDHS 2005 reported that 27% of post-partum women received supplementation with vitamin A in the eight weeks after delivery.
Preventive vitamin A supplementation began in Cambodia in the mid 1990s as part of National Immunization Days. Since then, vitamin A supplementation for children 6-59 months and post-partum women has been integrated into routine outreach activities.
Vitamin A is provided at health centers, hospitals, and through routine monthly immunization outreach. Children are supposed to receive vitamin A twice a year during Vitamin A supplementation activities, which are implemented through routine outreach. Before 2008 supplementation activities were scheduled every March and November (8 months and 4 months apart) rather than the recommended six months apart. To correct this, from 2008 on, the supplementation activities are scheduled in May and November.

13Micronutrient Defi ciencies and Interventions in CambodiaInformation for Improved Programming
In the past, Ministry of Health policy mandated that Community Health Volunteers were not allowed to distribute vitamin A in order to protect a woman or children from receiving an overdose. In the last revision to the Vitamin A Policy in 2007, Community Health Volunteers were given a defi ned role to help with vitamin A supplementation and mop-up activities.
Current IMCI guidelines in Cambodia recommend vitamin A to be given as a curative supplement for persistent diarrhea, measles, anemia, severe malnutrition (underweight), and night blindness(MOH/WHO/UNICEF, 2006). Curative supplementation of vitamin A is not discussed here as there is no data on this issue in the CDHS.
Issues with the Indicators from the CDHS and HIS
Vitamin A Supplementation in Children
Th e CDHS 2005 results for vitamin A supplementation in children under-fi ve showed that only close to one-third received vitamin A. Closer analysis on the vitamin A indicator suggests this number is an under-estimate.
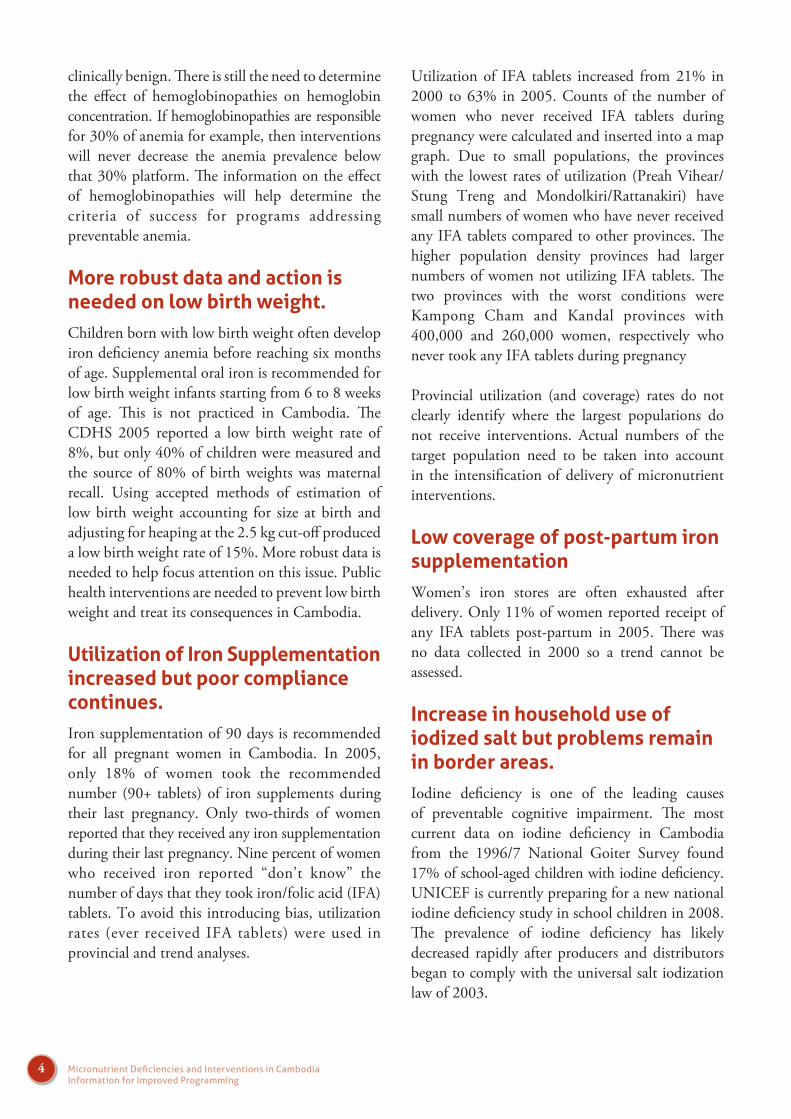
Figure 5 presents vitamin A coverage from the HIS by round and year and the CDHS and 12 KFP surveys by year. In 2000, the CDHS matches exactly the November round of the HIS. Th e CDHS 2000 collected data from February to June of 2000, and should be compared to the
supplementation given in November 1999 and March 2000. Th e HIS data showed coverage of 80 and 63%, respectively. In 2005, the CDHS 2005 collected data mostly from children supplemented in November 2005. Th e CDHS coverage rate (35%) was less than half of the HIS rate (79%). It is common for DHS surveys to report that vitamin A coverage is about half that normally reported from Health Information Systems in developing countries (Robin Houston, personal communication).
Th e coverage rate from the 12 Key Family Practices survey of 2006 was slightly higher (43%) than the CDHS 2005 but only included children aged 6-23 months. Th ese younger children are more likely to receive vitamin A compared to older children as shown by the CDHS 2005 (Figure 6). Th e HIS has shown continual improvements in vitamin A coverage of children since 2002. March of 2007 was the fi rst time the HIS showed that the national coverage reached over 100% (the pink area on the graph).
Due to procurement issues, two blue colors of vitamin A capsules were used during the data collection period of the CDHS 2005. Some suggested that the change in color of vitamin A capsules was the cause of the low coverage. While only one of these colors matched the sample vitamin A capsules displayed by the interviewers during the interviews, it is likely that other issues are more likely to aff ect the vitamin A supplementation rate.
14 Micronutrient Defi ciencies and Interventions in CambodiaInformation for Improved Programming
Figure 5. National vitamin A supplementation coverage in children by round, year and source of data, HIS, CDHS 2000 & 2005 and 12 KFP 2006
Percent of children 6-59m who received vitamin A
29
35
43
0
20
40
60
80
100
1999 2000 2001 2002 2003 2004 2005 2006 2007
(Children 6-23m)
CDHS 2000 - N=7,327, CDHS 2005 - N=6,527, 12 KFP - N=311
HIS Round 1 (March) HIS Round 2 (November)
CDHS 12 Key Family Practices
Analysis of the CDHS 2005 and HIS data by province (fi gure 6) more clearly shows the trend of the DHS vitamin A supplementation indicator to follow about half of the HIS estimates. According to the HIS, several provinces exceeded 100% coverage in 2005 and 2006 (the pink area on the graph). Th e HIS data from March and November 2006 matches very closely. Th e HIS data from November 2005 shows a similar trend on the right hand side of the graph. On the left side of the graph, more variation is evident, as if the program and/or denominators changed in these provinces. Only 14 of the 25 provinces are shown on the graph due to comparability issues.
Th e province where the DHS and HIS most closely match is Phnom Penh. It is not known if data quality of the HIS is better in Phnom Penh compared to other provinces. Further investigation is needed to demonstrate if this is the case. It is often diffi cult to achieve high coverage of interventions like vitamin A in urban centers. Caregivers are often too busy working or have other tasks that they consider more important than vitamin A supplementation.

15Micronutrient Defi ciencies and Interventions in CambodiaInformation for Improved Programming
Figure 6. National vitamin A supplementation coverage in children by province, round, year and source of data, HIS and CDHS 2005
0
20
40
60
80
100
120
140
160
Bantea
y Mean
chey
Kampo
ng Cham
Kampo
ng Chhn
ang
Kampo
ng Speu
Kampo
ng Thom
Kandal
Kratie
Phnom Pen
h
Prey V
eng
Pursat
Siem Reap
Svay
Rieng
Takeo
Oddar
Meanch
ey
HIS Nov 2005 HIS Mar 2006 HIS Nov 2006 CDHS 2005
Note: Only the provinces that are comparable are displayed.
Percent of children 6-59m who received vitamin A
One simple explanation for the low vitamin A coverage rate from the CDHS 2005 is that very few records are made on the yellow card. Th ere is space on the yellow card for reporting, but outreach staff do not commonly record the supplementation. Of the 35% reported vitamin A supplementation in children, only 4% was recorded on the yellow card (not shown). Th e data presented in the CDHS on vitamin A supplementation comes from maternal recall. Th ese mothers have to remember an event that occurred up to 6 months in the past.
Mothers have diffi culties distinguishing vitamin A from other orally administered interventions such as polio and most do not know that their child should receive vitamin A twice a year. Qualitative research in 3 provinces in Cambodia showed that mothers of children under fi ve do not clearly know what vitamin A looks like or when vitamin A is available in the vitamin A round for their child (Johnston & Ly, 2007).
Maternal recall is not considered a very robust source of information. A recent validation study of recording and reporting vitamin A by A2Z in India found that mothers recalled only 42% of vitamin A supplementation that was recorded on
their child’s vaccination record (A2Z, 2007a). Conditions are likely to be very similar in Cambodia.
A complication to recording vitamin A supplementation on the yellow card is that caregivers commonly lose the card after the vaccination schedule is complete. Figure 7 below shows that by 4 months of age of the child, about 80% have yellow cards. After 8 months, caregivers begin to
lose the yellow card. By the age of 35 months, only50% of caregivers retain the child’s yellow card.
Vitamin A supplementation in children by age follows a similar pattern. Th e highest supplementa-tion rates (45%) are found in children between 8 to 14 months of age. Th e rates fall to close to 35% by 18 months of age and decline as the child grows older. Supplementation rates are not related to yellow card retention in Cambodia, but the graph demonstrates the trend of declining interest in and involvement with public health interventions after the child reaches one year of age. Also it is important to note that loss of the yellow card prevents improvements in recording vitamin A supplementation.

16 Micronutrient Defi ciencies and Interventions in CambodiaInformation for Improved Programming
0
10
20
30
40
50
60
70
80
90
100
0 2 4 6 8 10 12 14 16 18 20 22 24 26 28 30 32 34 36 38 40 42 44 46 48 50 52 54 56 58
Possess Yellow Card
Vitamin A Supplementation
Percent
Note: values are smoothed with a five month moving average
Figure 7. Possession of yellow card and vitamin A supplementation by age in months, CDHS 2005
Figure 8. Possession of yellow card and vitamin A supplementation by age in months, CDHS 2005
A recent Global Vitamin A Alliance technical advi sory group meet ing on v i tamin A supplementation reported “Large scale household surveys are considered the gold standard for monitoring purposes, currently these surveys do not provide reliable estimates of supplementation coverage” (GAVA, 2007). Th is group suggested that further research on methods is needed to address these issues.
Further analysis of the two CDHS surveys shows other issues aff ect the vitamin A supplementation indicator in Cambodia. Th e standard indicator for vitamin A coverage in children 6-59 months of age considers a child protected from vitamin A defi ciency if he or she has been supplemented in the last six months. Analysis of the data on vitamin A supplementation shows that the indicator is affected by multiple biases. These biases are reviewed below.

17Micronutrient Defi ciencies and Interventions in CambodiaInformation for Improved Programming
Figure 9. Child vitamin A supplementation questions, CDHS 2005 questionnaire
It is important to note that the vitamin A supplementation questions changed between 2000 and 2005. In the CDHS 2000, only one question is used (fi gure 8), while in the CDHS 2005 two questions are used (fi gure 9).
In the CDHS 2005, the fi rst question asks if the child has ever received vitamin A supplementation. Th e fi rst question and the percent distribution of responses are given below:
Table 3. Percent distribution of child (6-59m) ever received vitamin A (First Question), CDHS 2005
Ever received vitamin A Percent NumberYes, received 73.3% 4780No, never received 24.9% 1629Don’t know 1.8% 117Total 100.0% 6527
If the mother responded “No” or “Don’t Know”, that child is considered not supplemented. If the answer is “Yes,” the mother is then asked “how many months ago did (child) take the last dose.” Th ese answers are given below (table 4).
Table 4. Percent distribution of when child received vitamin A out of children who had ever received vitamin A (Second Question), CDHS 2005
Timing Percent Number< = 6 months ago 46.6% 2226> 6 months ago 23.6% 1127Don’t know 29.8% 1424Missing 0.1% 3Total 100.0% 4780
Th e children with answers of “>6 months ago” or “Don’t Know” are considered not protected. Only the children who received a dose “<=6 months ago” are considered protected and used as the numerator for supplementation coverage.
It is a common DHS practice to count “Don’t Know” as “No” in calculation of indicators. When the number of “Don’t Know” responses is low, this does not bias the results. Assigning the 30% of cases who replied “Don’t Know” into the “No” category may have caused a signifi cant underestimation of supplementation coverage.
Other issues that could aff ect the question on timing of vitamin A supplementation are recall bias and date heaping. Further analysis was done to determine if these problems may have also aff ected vitamin A coverage in children.
Preventive vitamin A supplementation occurs twice a year. Data collection for the CDHS 2005 took seven months. During that time there was one vitamin A supplementation month. Vitamin A is not commonly given as a curative treatment, so there should be little to no variation by month of data collection.
Analysis of vitamin A supplementation coverage by month (fi gure 10) shows that recall bias aff ected reported supplementation rates. There is substantial variation by month (from 15 to 45%). Th is indicates that recall bias is likely also to cause the indicator to be an underestimate.

18 Micronutrient Defi ciencies and Interventions in CambodiaInformation for Improved Programming
Th e month after supplementation should have the lowest recall bias as the respondents do not have to remember an action in the distant past. Th e highest reported coverage is found in December, the month after vitamin A supplementation.
Figure 10. Percent vitamin A supplementation in children by month of data collection, CDHS 2005
0
5
10
15
20
25
30
35
40
45
50
Sept Oct Nov Dec Jan Feb Mar
2005 2006
Vitamin A Supplementation
Month
Percent of children 6-59m who received vitamin A by month of interview
Month and Year
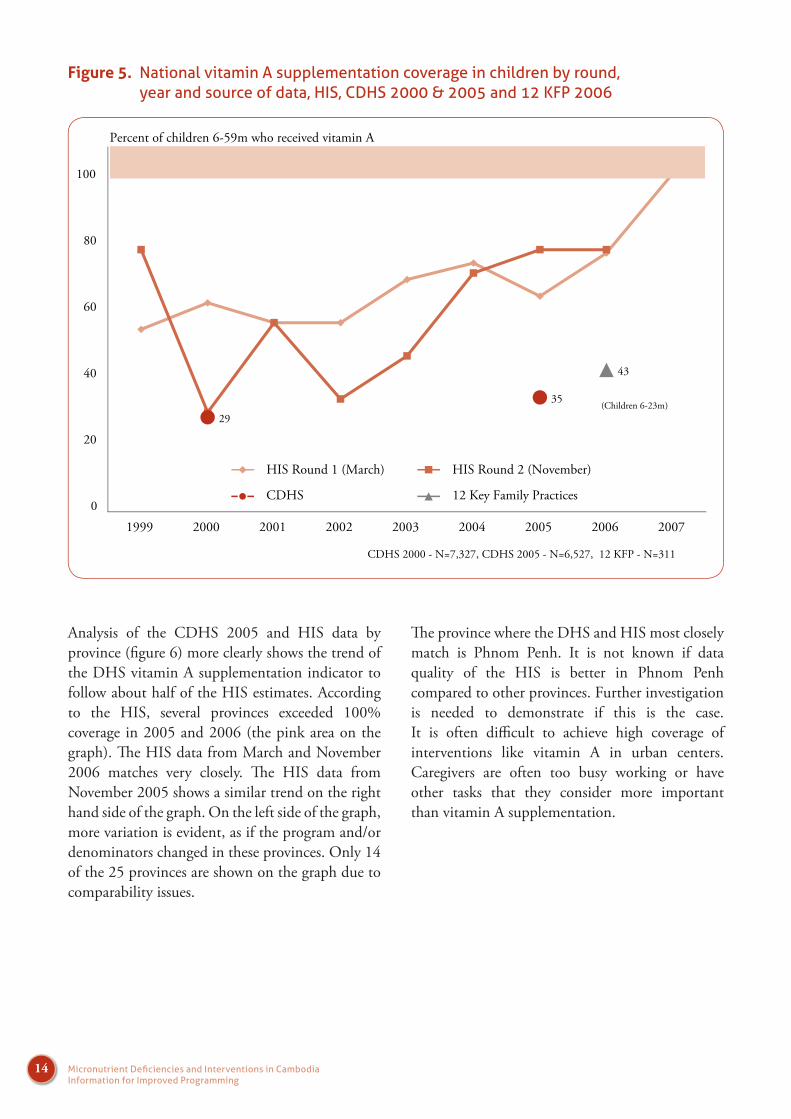
Date heaping or a preference for reporting certain times (such as one month or one year) can bias results. To determine if date heaping occurred in the response to the question when the child received supplementation, a histogram of the reported number of months prior to the interview when the child received vitamin A is presented (figure 11). As the data collection took seven months, there should be no date heaping evident.
Th e graph shows that there was signifi cant heaping in the response. Mothers were more likely to answer with a simple number such as one month, one year,
two years or three years instead of reporting the accurate number of months. Th is heaping is not considered to have aff ected the estimate of vitamin A supplementation. If the extra numbers of children found in the one month response were distributed evenly through the 0 to 3 month categories, these children would still be considered protected.
Th e eff ects of recall bias and date heaping cannot be completely eliminated, but they can be minimized by reducing the time between the interview and supplementation activity.
19Micronutrient Defi ciencies and Interventions in CambodiaInformation for Improved Programming
0
100
200
300
400
500
600
700
800
0 2 4 6 8 10 12 14 16 18 20 22 24 26 28 30 32 34 36 38 40 44 46 49 55
Reported Months Since Last Supplementation
Heaping
Number of children supplemented with vitamin A
Heaping
Heaping
Heaping
Figure 11. Number of children supplemented with vitamin A by reported number of months since last supplementation, CDHS 2005
It is not possible to quantify the exact eff ect of recall bias, and “Don’t Know” responses on the vitamin A coverage indicator, but a more accurate estimate can be calculated. Using data from the month after supplementation will minimize the eff ect of recall bias and date heaping. Th e “Don’t Know” responses can be accounted for by imputing (predicting) values for this population. Th ese methods were used to make the new estimates for vitamin A supplementation coverage in children given below. Th e exact methods and their potential limitations are presented in the annex of the report in the Methodology section.
Th e adjusted vitamin A supplementation rate for children based on data from December 2005, with values imputed for “yes” supplemented but “don’t know” when is 50%. Th is adjusted indicator is 15 percentage points higher than the CDHS reported coverage and 29 percentage points lower than the HIS 2005 Round II (November) estimate (fi gure 12).

20 Micronutrient Defi ciencies and Interventions in CambodiaInformation for Improved Programming
35
50
79
0
10
20
30
40
50
60
70
80
90
100
CDHS 2005 (N=6,527) CDHS 2005 Adjusted for RecallBias & "Don't Know" Response
(N=681)
HIS Round II - November 2005
Percent of children supplemented with Vitamin A by source of data
Figure 12. Reported and adjusted vitamin A supplementation rates in children 6-59m, CDHS 2005 and HIS (November 2005)
The Health Information System is the only source of timely monitoring data for preventive interventions like vitamin A supplementation in the country. The HIS is representative on the national, provincial, health operational district and health center level. An eff ective HIS is needed for monitoring and evaluation of public health interventions.
Th e HIS overestimates vitamin A supplementation in children as demonstrated by recent estimates reaching over 100% (figures 5 & 6). The HIS currently uses offi cial population fi gures from the National Institute of Statistics (NIS) to calculate the denominators for the HIS. The issue of inaccurate estimates of target populations from the NIS is well-known and is considered to be one major cause for the disparity between the CDHS and HIS estimates. A national census is planned for 2008, which should help to improve the denomi-nators but results may not be available until 2010.
Two other issues are likely to affect the HIS coverage estimates:
Supplementation outside the target group Double counting
Coverage estimates in the HIS are calculated by including all reported supplementation over a six month period (January to June and July to December). A problem with this method is that
during the outreach workers are not likely to check whether or not the child has been supplemented within the last six months. Most often there is no record of supplemen-tation if the worker wanted to check. Th e new IMCI guidelines recommend giving a vitamin A supplement to children who have not received one in the last four months, not six. It is possible, but not likely that a
child receives supplementation twice during a six month period and is double counted in the HIS coverage estimate.
Th e second issue is supplementation of children outside the target age group. No adverse health consequences have been found with supplementingan infant under six months of age. Studies are currently being implemented to test the benefi t of vitamin A supplementation in children in this age group. Despite the fact that outreach workers are trained to give vitamin A to children starting from six months of age, 25% of mothers of children less than six months of age report that their child received vitamin A (fi gure 12).
If one quarter of children under the age 6 months are supplemented and included in the numerator but not the denominator for the HIS coverage indicator, the potential for overestimation is considerable. Th e CDHS does not collect data on vitamin A supplementation of children older than 59 months of age making it impossible to estimate the overall eff ect on coverage of supplementing children outside the target population. Qualitative research has shown that supplementation of

21Micronutrient Defi ciencies and Interventions in CambodiaInformation for Improved Programming
children both younger and older than the target population and the elderly occurs in Cambodia (Johnston and Ly, 2007).
Supplementation of children outside the target age group aff ects coverage estimates, but is not considered to have any adverse health consequences. Th is is not the case for vitamin A supplementation of women. Post-partum mothers are recommended to receive a high-dose vitamin A supplement only in the six weeks after delivery (MoH, 2007). High doses should never be given to women outside this
time period, as vitamin A can cause birth defects in pregnant women (WHO, 1998). It is not possible to determine the exact timing of post-partum supplementation from the CDHS 2005, but the lack of attention to age with child supplementation raises concern that pregnant women may receive high doses of vitamin A at improper times as well.
Figure 13. Percent of children who ever received vitamin A supplementation by age in months, CDHS 2005
0
10
20
30
40
50
60
70
80
0 1 2 3 4 5 6 7 8 9 10 11
Age in Months
Percent of children who ever received vitamin A supplementation
25% of children aged 0-5 months (not in the target population) received vitamin A.
Vitamin A Supplementation in Women
Post-partum vitamin A supplementation is a public health intervention that normally occurs during outreach activities every month. In 2000, the CDHS and HIS reportd that only about 11% of women received vitamin A post-partum. According to the HIS, the coverage rate increased to about 45% in 2004. Th e CDHS 2005 reported 27% and the 12 KFP 2006 reported 37% (fi gure 14).
It is important to note that the CDHS reported the indicator in women who gave birth in the past 5 years, while the 12 KFP 2006 reported on women who gave birth only in the past 2 years. If the HIS documents a real change in post-partum vitamin A supplementation, it is easy to see how shortening of the time period for the 12 KFP indicator explains the 10 percentage point increase in one year.

22 Micronutrient Defi ciencies and Interventions in CambodiaInformation for Improved Programming
There have been questions on the benefit of post-partum vitamin A supplementation. These questions have been attributed to the lack of universally recognized defi nitions of successful outcomes among policy makers and program managers. A review of supplementation studies found that post-partum supplementation provides measureable increases in serum retinol concentrationsand reductions of morbidity for women and their children (Rice, 2007).
Figure 14. Post-partum vitamin A supplementation by year and source of data, HIS, CDHS 2000 & 2005 and 12 KFP 2006
11
27
37
0
10
20
30
40
50
60
70
80
90
100
2000 2001 2002 2003 2004 2005 2006
HIS
CDHS
12 Key Family Practices
Percent of post-partum women who received vitamin A
CDHS 2000: N=5,714 CDHS 2005: N=5,865 12 Key Family Practices: N=484
Th ere is only one question on post-partum vitamin A supplementation in the CDHS questionnaires and “don’t know” is not given as an option. Th is eliminates the “don’t know” response as a source of bias seen above with child supplementation.
Th e monthly or bi-monthly supplementation can help to reduce the eff ect of recall bias, but the longer women have to remember into the past, the more this bias returns and the data quality deteriorates. As no date or number of months is asked for, there is no heaping or number preference in the answer.

23Micronutrient Defi ciencies and Interventions in CambodiaInformation for Improved Programming
Trends and Conditions in Vitamin A Supplementation
Vitamin A Supplementation Summary Points
Geographic Distribution: There is significant variation of vitamin A supplementation by province. Th e provinces with the lowest coverage for children also have the lowest coverage for women (Preah Vihear, Stung Treng, Mondolkiri/Rattanakiri and Phnom Penh).
Excluded Populations: Children from households of the poorest wealth quintile and those of an uneducated mother were the least likely to ever receive any vitamin A supplementation. Women of the poorest wealth quintile and those who were not educated were the least likely to ever receive post-partum vitamin A supplementation.
Trends: Supplementation rates of post-partum women almost tripled from 2000 to 2005 (from 11% to 27%). Supplementation rates in children appear to have improved (from 29% to an estimated 50%) but the trend of vitamin A coverage in children is not precise due to the high percentage of “don’t know when” responses (30%). Th e HIS data shows improvements in vitamin A supplementation in both post-partum women and children over time.
Th e vitamin A supplementation indicator in children from the CDHS 2005 does not accurately provide a national estimate due to recall bias and “don’t know when” responses as discussed above. Provincial estimates are also aff ected by a large degree of variation of “don’t know when” answers (from 4 to 44% by province).
To address this problem when analyzing provincial conditions, coverage of vitamin A supplementation is replaced with utilization. Th is variable is defi ned as the child ever receiving vitamin A. Utilization is not aff ected by the “don’t know when” answers (table 3). Nationally, 73% of children 6-59 months of age have ever received vitamin A supplementation. Utilization does not provide information on whether the child is protected from vitamin A defi ciency, but describes if the intervention has been delivered to the target population in the defi ned area.

24 Micronutrient Defi ciencies and Interventions in CambodiaInformation for Improved Programming
For post-partum women, the standard coverage indicator of receiving vitamin A supplementation within eight weeks after delivery does not have problems like those described above and is used in the analyses. In each section, the post-partum supplementation details are presented fi rst followed by those of children.
Where do populations have the lowest supplementation rates? Provincial variation of vitamin A supplementation is high for both mothers and children. It ranges from 6 to 63% for post-partum women and from 45 to 91% of children ever received vitamin A. Th e same provinces have the lowest supplementation
rates for children and women (Phnom Penh, Preah Vihear/Stung Treng, Mondolkiri/Rattanakiri (table 5).
Women and children in Preah Vihear and Stung Treng are at greatest risk for vitamin A defi ciency and are the least likely to receive supplementation. Women in Kampong Th om were also found to have the highest rates of maternal night blindness. Post-partum supplementation rates in this province only reached 34% leaving a majority unprotected by the intervention. Although some provinces have higher supplementation rates than others, supplementation rates are unacceptably low throughout the country.
Table 5. Post-partum vitamin A coverage and vitamin A utilization in children 6-59 months of age by province, CDHS 2005
Vitamin A Supplementation Post-Partum Women Children Age 6-59 Months Ever Received Vitamin AProvince Vitamin A
CoverageProvince Vitamin A
CoveragePhnom Penh 6.4 Phnom Penh 56.4Preah Vihear/Stung Treng 9.3 Preah Vihear/Stung Treng 45.4Mondolkiri/Rattankiri 14.9 Mondolkiri/Rattankiri 53.1Oddar Meanchey 17.3 Oddar Meanchey 91.7Krong Preah Sihanouk/Koh Kong 19.6 Krong Preah Sihanouk/Koh Kong 91.4Svay Rieng 19.9 Svay Rieng 58.8Kampot/Krong Kep 21.7 Kampot/Krong Kep 56.7Kampong Speu 22.4 Kampong Speu 75.9Banteay Mean Chey 25.1 Banteay Mean Chey 86.3Kampong Cham 25.7 Kampong Cham 68.5Takeo 27.1 Takeo 88.3Kratie 28.2 Kratie 70.8Battambang/Krong Pailin 28.7 Battambang/Krong Pailin 79.4Kandal 30.4 Kandal 85.8Kampong Chhnang 30.6 Kampong Chhnang 74.6Siem Reap 31.8 Siem Reap 74.9Kampong Th om 33.5 Kampong Th om 82.7Prey Veng 46.4 Prey Veng 82.8Pursat 63.3 Pursat 88.7Overall 27.3 Overall 73.3

25Micronutrient Defi ciencies and Interventions in CambodiaInformation for Improved Programming
On the map below (fi gure 15) the number of children 6-59 months of age who never received vitamin A supplementation are plotted by province and the provinces with below average utilization rates are marked with a black circle. Th e methods used to calculate the number of children can be found at the end of the report in the methodology section.
Th e provinces with no shading and the lowest number of children who have never received vitamin A have low population counts and population density. Th e provinces with the darkest shading and the highest numbers of children who have
# of Children Never Received Vitamin A
Below Average Utilization
<10,000
10,000-20,000
20,000-45,000
>45,0000
never received vitamin A have high populations with high population density. One might assume that the more densely populated provinces would have more eff ective supplementation activities as the children would be easier to reach, but this is not the case. In Kampong Cham (with the darkest shading) over 49,000 children have never received vitamin A.
Figure 14. Number of children 6-59 months of age who never received a vitamin A supplement and below average utilization by province, CDHS 2005

26 Micronutrient Defi ciencies and Interventions in CambodiaInformation for Improved Programming
Th e map also shows that below average utilization does not identify the provinces that have the highest numbers of children who have never received vitamin A.
In order to improve the vitamin A supplementation rate, the intervention needs to reach larger numbers of the population. Th e map shows key provinces where more coordination and/or resources are needed. If all the children who never received vitamin A in Kampong Cham, Phnom Penh and Kampot/Krong Kep, were supplemented in a timely manner, the vitamin A supplementation rate would increase 25 percent. Nutrition programmers need to take into account not only supplementation rates, but also the target number of children to cover when planning for supplementation activities.
Which populations have the lowest coverage?
Post-partum vitamin A supplementation and child level utilization varied greatly by province as shown above, and targeting certain provinces can help to improve coverage. Within provinces, it is necessary to know which populations have the lowest coverage in order to ensure that they receive specifi c attention in future supplementation rounds.
Post-partum supplementation
Table 6. Postpartum vitamin A supplementation by socio-demographic characteristics, CDHS 2005
Background charateristicsPost-partum vitamin A
supplementation Number
Education
No Schooling 22.0 1,356
Primary 27.9 3,482
Secondary + 32.2 1,028
Wealth Quintile
Lowest 24.2 1,477
Second 27.5 1,320
Middle 32.0 1,077
Fourth 29.3 1,003
Highest 24.2 988
Place of Residence
Rural 27.9 5,039
Urban 23.5 827
Overall 27.3 5,865

27Micronutrient Defi ciencies and Interventions in CambodiaInformation for Improved Programming
Maternal education appeared to be the factor that caused the largest variation in post-partum supplementation. Th irty-two percent of women who had completed one year of secondary schooling received vitamin A compared to only 22% who had no schooling. Women from the poorest wealth quintile had the lowest rate of supplementation (24%), while women from the middle wealth quintile had the highest rate of supplementation (32%). Women in the highest wealth quintile had a similar rate of supplementation as the poorest quintile (24%), but also were at the lowest risk of vitamin A defi ciency.
When the results above are considered with the rates of maternal night blindness (table 2), it is evident
that the populations who have the highest need for vitamin A supplementation have the lowest chance to receive the intervention.
Bivariate analysis cannot determine exactly which conditions cause post-partum vitamin A supplementation to be lower in some populations compared to others as it cannot control for confounding. In order to clarify the conditions that aff ect supplementation in women, probit regression of post-partum vitamin A supplementationwas run on expected determinants (table 7). Interactions and collinearity between all independent explanatory variables were tested and found not signifi cant.
Variable Marginal Eff ect Z P>z Signifi cant
(P<0.05)
Age of Child in Months -0.001 -2.62 0.01 *
Urban/Rural
Urban -0.033 -1.21 0.22
Rural Reference category
Mother’s education
No Education -0.057 -3.22 <0.01 *
Primary Reference category
Secondary Education 0.066 2.94 <0.01 *
Mother's age
Mothers Age 15-19 -0.017 -0.44 0.66
Mothers Age 20-29 0.027 1.73 0.08
Mothers Age 30-39 Reference category
Mothers Age 40-49 -0.023 -0.98 0.33
Wealth quintiles
Poorest Wealth Quintile -0.061 -3.18 <0.01 *
Poorer Wealth Quintile -0.033 -1.7 0.09
Middle Wealth Quintile Reference category
Richer Wealth Quintile -0.036 -1.54 0.13
Richest Wealth Quintile -0.093 -3.51 <0.01 *
Note: Th e predicted probability of post-partum supplementation in the model was 0.269. Th e estimate of post-partum supplementation from the CDHS 2005 is 0.273.
Table 7. Marginal eff ects of probit regression on post-partum vitamin A supplementation by selected determinants

28 Micronutrient Defi ciencies and Interventions in CambodiaInformation for Improved Programming
In probit like logistic regression, continuous linear variables (such as age in months) can be used as explanatory independent variables. Th e marginal eff ect in probit regression is interpreted as the percent change in the probability of an individual being supplemented (the dependent variable) for every unit increase of the explanatory (independent) variable. As an example from the above table, for every additional month of child’s age, the probability of supplementation decreases by 0.1 percent.
In probit regression when using categorical variables (such as wealth quintiles) as explanatory independentfactors, one category has to be defi ned as the reference category. When interpreting the outcomes from these variables the marginal eff ect is not a unit increase, but a measure of change in the outcome variable when starting from the reference category and changing to the category of interest. For example, the marginal eff ects show changing from the middle wealth quintile (the reference category) to the richest wealth quintile decreases the probability of supplementation by 9.3 percent.
Th e analysis above shows that age of child in months is signifi cant as an explanatory factor for post-partum vitamin A supplementation, but the marginal eff ect is small (+0.1 percentage points per each month of child’s age) Urban/rural residence and mother’s age were not signifi cant.
The effect of wealth and education on supplementation was found significant in the regression. Women with no education were 6 percent less likely to be supplemented post-partum compared to the reference group. Women of the lowest wealth quintile were also 6 percent less likely to be supplemented compared to the reference group.
While the general low rate of supplementation in all women show that dramatic improvements are needed for the entire population, these results show that special eff orts have to be made to reach the poorest and least educated. Th ose creating behavior change strategies that are designed to raise awareness and provoke specifi c actions around vitamin A supplementation need to take special care to ensure that the materials and messages communicate clearly to these underserved populations.
Utilization of vitamin A in children
Bivariate analysis of utilization of vitamin A in children shows similar associations as found above with post-partum supplementation. Utilization increases as maternal education improves. With household wealth, utilization is lowest in the poorest wealth quintile. It improves to the highest levels in the middle and fourth wealth quintiles before it drops in the highest wealth quintile. Urban/rural residence does not appear to aff ect supplementation.

29Micronutrient Defi ciencies and Interventions in CambodiaInformation for Improved Programming
Background charateristics vitamin A utilization Number
Education
No Schooling 67.6 1,529
Primary 76.2 3,772
Secondary + 78.9 1,107
Wealth Quintile
Lowest 70.4 1,723
Second 75.6 1,460
Middle 78.5 1,114
Fourth 79.2 1,041
Highest 71.3 1,070
Place of Residence
Rural 74.6 5,501
Urban 74.5 907
Overall 74.6 6,408
As with post-partum supplementation, a probit regression was run on utilization of vitamin A in children to more accurately determine what background characteristics cause the populationsto have lower utilization. Interactions and collinearity of explanatory variables were tested and found not to be signifi cant.
The age of child in months was significant (table 9) and for each increase of month of age, the probability of ever receiving vitamin A increases by 0.3%. Th is fi nding is to be expected as the older a child becomes, the greater chance he or she has to ever receive the supplement.
Th e eff ects of wealth and education on utilization were found signifi cant in the regression. Children of women with no education were 9 percent less likely to be supplemented compared to the reference group. Children from the poorest wealth quintile were 6 percent less likely to be supplemented compared to the reference group.
Mother’s age was also found to be signifi cant in the model only for mothers aged 15 to 19 years. Children of these youngest mothers are 12 percent less likely to be supplemented compared to the reference group. Cambodian women do not marry early, so mother’s aged 15 to 19 years made up only 2% of the population included in the regression. This finding is not so relevant as this group represents such a small percent of the population.
Th ere is no data on children with vitamin A defi ciency from 2005. It is likely that children of mothers who are vitamin A defi cient also are defi cient. If this is the case then the children most at risk for vitamin A defi ciency are the least likely to ever receive vitamin A.
Table 8. Utilization of vitamin A in children 6-59m by socio-demographic characteristics, CDHS 2005

30 Micronutrient Defi ciencies and Interventions in CambodiaInformation for Improved Programming
What is the trend for vitamin A supplementation?
Th e exact trend of vitamin A supplementation in children cannot be determined from the CDHS surveys. Th is was due to changes in the questions and subsequently in the responses. Estimates based on adjustments for recall bias and imputation to adjust for “don’t know” when responses give an estimate of 50% coverage in 2005. Th is represents a 72% improvement from the under-fi ve supplementation rate of 2000. While the HIScoverage rates are diffi cult to believe when they
range over 100%, the trends from HIS data collected according to the same methods over time should be valid for trend analysis. Th e HIS displays a 55% improvement in child supplementation rates between 2000 and 2005 (fi gure 5).
Th e coverage rate for vitamin A supplementation of post-partum women from the CDHS has almost tripled from 11% in 2000 to 27% in 2005. Th is great improvement is largely due to the very low cove rage rate in 2000. According to the HIS, the trend in post-partum vitamin A suplementation has increased by 277% from 13% in 2000 to 49% in 2005.
Table 9. Marginal eff ects of probit regression on utilization of vitamin A in children by selected determinants
Variable Marginal Eff ect Z P>z Signifi cant
(P<0.05)
Age of Child in Months -0.003 6.8 0.01 *
Urban/Rural
Urban -0.019 0.71 0.48
Rural Reference category
Mother’s education
No Education -0.085 -3.8 <0.01 *
Primary Reference category
Secondary Education 0.053 2.46 <0.01 *
Mother's age
Mothers Age 15-19 -0.121 -3.34 0.02 *
Mothers Age 20-29 0.001 0.09 0.93
Mothers Age 30-39 Reference category
Mothers Age 40-49 -0.002 0.11 0.91
Wealth quintiles
Poorest Wealth Quintile -0.059 -2.44 <0.02 *
Poorer Wealth Quintile -0.021 -0.88 0.38
Middle Wealth Quintile Reference category
Richer Wealth Quintile -0.004 -0.16 0.87
Richest Wealth Quintile -0.118 -3.43 <0.01 *
Note: Th e predicted probability of vitamin A utilization in the model was 0.752.Th e estimate of vitamin A utilization from the CDHS 2005 is 0.733.

31Micronutrient Defi ciencies and Interventions in CambodiaInformation for Improved Programming
Anemia
Oxygen is the life giving element that allows all humans and animals to survive and thrive on earth. Th e deprivation of oxygen causes death. Anemia is the condition where the body’s capacity to use oxygen is reduced and health is put at risk.
Th e health consequences of anemia include: increased risk of maternal and perinatal mortality (Stoltzfus et al 2004), impaired cognitive and psychomotor development, reduced cognitive performance, reduced work productivity and endurance (Stoltzfus, 2001) and decreased economic potential (Horton & Ross, 2003).
It is important to note that recent meta analysis research (Stoltzfus et al, 2004) has shown that it is not only severe anemia but also mild and moderate anemia that increases a pregnant woman’s risk of mortality.
Anemia Summary Points
Prevalence: In 2005, 47% of women aged 15-49 years were anemic and 11% had moderate or severe anemia. 62% of children aged 6-59 months were anemic and 33% had moderate or severe anemia.
Geographic Distribution: In 2005, anemia in children aged 6-59 months was greater than 40% in all provinces. For women of reproductive age, anemia prevalence in all provinces except Phnom Penh was greater than 40% in 2005.
Populations at Risk: Anemia is most common in pregnant women and children from 6 to 24 months of age. Poor uneducated women and their children are more likely to be anemic than educated wealthier populations.
Trend: From 2000 to 2005 the prevalence of anemia in children has not changed. In women of reproductive age, the prevalence of anemia decreased by 11 percentage points between 2000 and 2005.
Anemia is a severe public health problem among all women and children in Cambodia. Th ere is an urgent need to prevent anemia in these two target populations, but also to determine the etiology of anemia in the general population to eff ectively address the exact causes when and where they are found.
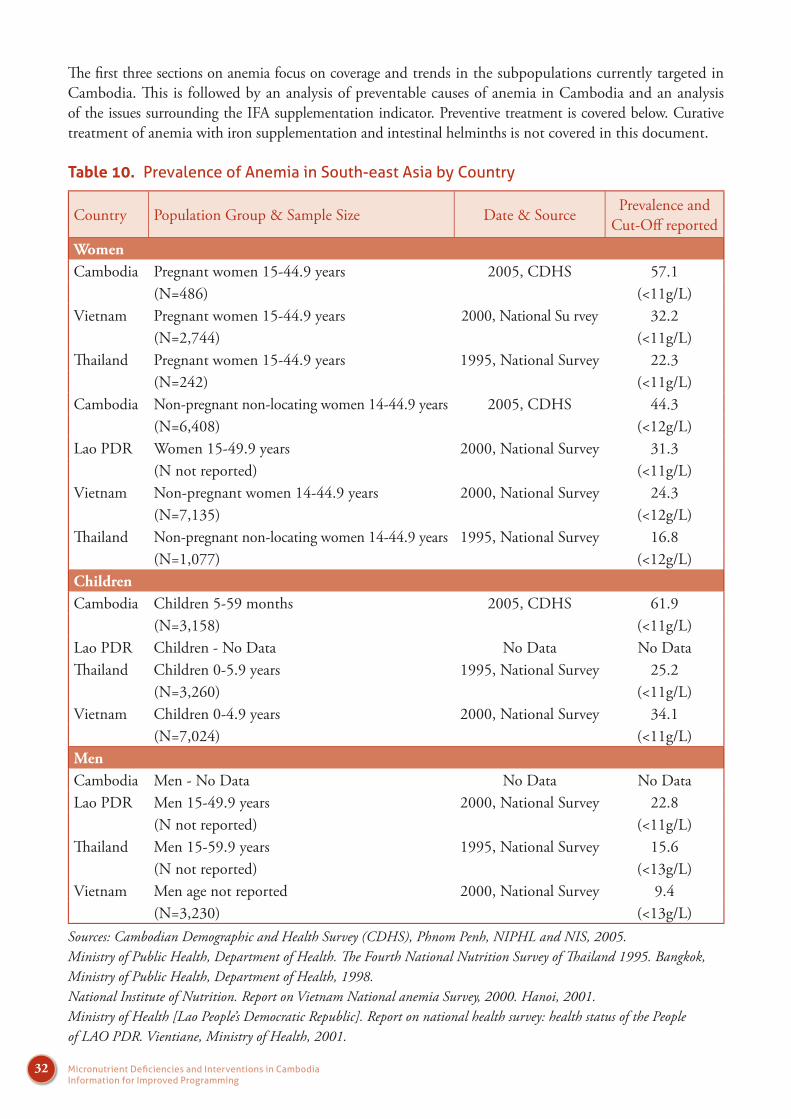
32 Micronutrient Defi ciencies and Interventions in CambodiaInformation for Improved Programming
Th e fi rst three sections on anemia focus on coverage and trends in the subpopulations currently targeted in Cambodia. Th is is followed by an analysis of preventable causes of anemia in Cambodia and an analysis of the issues surrounding the IFA supplementation indicator. Preventive treatment is covered below. Curative treatment of anemia with iron supplementation and intestinal helminths is not covered in this document.
Table 10. Prevalence of Anemia in South-east Asia by Country
Country Population Group & Sample Size Date & Source Prevalence and Cut-Off reported
WomenCambodia Pregnant women 15-44.9 years 2005, CDHS 57.1
(N=486) (<11g/L)Vietnam Pregnant women 15-44.9 years 2000, National Su rvey 32.2
(N=2,744) (<11g/L)Th ailand Pregnant women 15-44.9 years 1995, National Survey 22.3
(N=242) (<11g/L)Cambodia Non-pregnant non-locating women 14-44.9 years 2005, CDHS 44.3
(N=6,408) (<12g/L)Lao PDR Women 15-49.9 years 2000, National Survey 31.3
(N not reported) (<11g/L)Vietnam Non-pregnant women 14-44.9 years 2000, National Survey 24.3
(N=7,135) (<12g/L)Th ailand Non-pregnant non-locating women 14-44.9 years 1995, National Survey 16.8
(N=1,077) (<12g/L)ChildrenCambodia Children 5-59 months 2005, CDHS 61.9
(N=3,158) (<11g/L)Lao PDR Children - No Data No Data No DataTh ailand Children 0-5.9 years 1995, National Survey 25.2
(N=3,260) (<11g/L)Vietnam Children 0-4.9 years 2000, National Survey 34.1
(N=7,024) (<11g/L)MenCambodia Men - No Data No Data No DataLao PDR Men 15-49.9 years 2000, National Survey 22.8
(N not reported) (<11g/L)Th ailand Men 15-59.9 years 1995, National Survey 15.6
(N not reported) (<13g/L)Vietnam Men age not reported 2000, National Survey 9.4
(N=3,230) (<13g/L)Sources: Cambodian Demographic and Health Survey (CDHS), Phnom Penh, NIPHL and NIS, 2005.Ministry of Public Health, Department of Health. Th e Fourth National Nutrition Survey of Th ailand 1995. Bangkok,Ministry of Public Health, Department of Health, 1998.National Institute of Nutrition. Report on Vietnam National anemia Survey, 2000. Hanoi, 2001.Ministry of Health [Lao People’s Democratic Republic]. Report on national health survey: health status of the People of LAO PDR. Vientiane, Ministry of Health, 2001.

33Micronutrient Defi ciencies and Interventions in CambodiaInformation for Improved Programming
Conditions of Anemia
Anemia is a signifi cant problem worldwide and particularly in SE Asia. In table 10, the prevalence of anemia in Cambodia and neighboring countries are presented, and shows:
Anemia in pregnant women is twice as high in Cambodia (57%) compared to Vietnam (32%) and three times higher than pregnant women in Th ailand (22%),
Anemia in non-pregnant, non-lactating women is highest in Cambodia (44%) compared to non-pregnant, non-lactating women in Vietnam (24%) and Th ailand (17%) and compared to all women in Lao PDR (31%),
Anemia in children under fi ve is twice as high in Cambodia (62%) compared to Vietnam (34%) and Th ailand (25%),
Th ere is no data for anemia in men in Cambodia but it is likely to be an issue as the prevalence ranges from 9% in Vietnam to 22% in Lao PDR.
Cambodia has the most recent data but national level conditions of anemia do not change rapidly unless eff ective national level programs are implemented and sustained. Th ere is no national level data for children aged 5-15 years in Cambodia. In a study on weekly iron folate supplementation in two school districts of Kampot province, the anemia prevalence in children aged 5-15 years was 64% (Longfi ls et al, 2005). WHO recommends that anemia prevalence of 40% be used as the cut-off to describe a severe public health problem in populations (WHO, 2001). According to these criteria, anemia is a severe public health problem in Cambodian women, children under fi ve and possibly in children from 5-15 years of age as well.
Causes of Anemia
On average iron defi ciency is estimated to cause 50% of anemia worldwide (WHO/UNICEF/UNU, 2001, Stoltzfus, 2003). Determination of the exact causes of anemia is diffi cult as there
are multiple conditions that can cause anemia. Th e main causes of anemia are:
Dietary iron defi ciency
Infectious diseases such as malaria, hookworm infections, schistosomiasis, HIV/AIDS, tuberculosis and other chronic diseases including almost any infl ammatory illness that lasts several months or longer, and some malignancies
Defi ciencies of other key micronutrients including folate, vitamin B12, vitamin C, vitamin A, protein, copper and other minerals
Inherited conditions that aff ect red blood cells, such as thalassemia
Severe acute hemorrhage (occurring in childbirth)
Chronic blood losses (as with peptic ulcers) and
Trauma
In Cambodia, the country specifi c causes of anemia have been estimated and are shown in fi gure 16 below. Iron defi ciency (30%), hemoglobinopathies (30%) and other micronutrient defi ciencies (20%) are considered the most common causes of anemia. A Venn diagram is used to demonstrate that the causes of anemia are not exclusive. It is assumed that these estimates are for the general population but the population group represented by these estimates was not defi ned. As the estimates are largelybased on two studies of pre-school children, it is likely that they represent conditions in pre-school children rather than adult men or women.
It should be noted that there is no national level data on the prevalence of iron or other micronutrient defi ciencies, malaria, intestinal parasites or hemo-globinopathies so all the presented percent contributions are unsupported estimates. In populations known to have high rates of anemia (women of reproductive age and children under-fi ve), it is probable that the contribution of iron defi ciency is underestimated. Similar conditions of iron defi ciency may be found in children age 5-15 years. Th e small area studies measuring iron

34 Micronutrient Defi ciencies and Interventions in CambodiaInformation for Improved Programming
status are discussed below. Th e contribution of malaria to anemia in Cambodia is likely overestimated and also discussed below.
Current provincial or regional level studies are underway to help defi ne the causes of anemia in children in Cambodia. Th is will help to clarify the
Other micronutrient deficiencies (MN)causing anemia
Iron Deficiency
MalariaHemoglobinopathies
Intestinal parasitesOverlapping Causes
of Anemia:
Hemoglobinopathies ~30%
Iron Deficiency ~30%
Other MN deficiencies ~20%
Intestinal parasites ~15%
Malaria ~10%
Source: CESVI study, GTZ study and rough estimates -Dr S Jack-WHO/TASK
conditions, but national level data is needed on both populations considered at risk and not at risk.
Figure 16. Venn diagram of the overlapping causes of anemia and estimated percent contribution
Low Birth Weight
Low birth weight is one cause of anemia in young infants. Children born with low birth weight (LBW) often have low iron stores and develop iron defi ciency anemia before reaching six months of age. Th ere is some evidence that anemia is common in LBW breastfed infants as early as 8 weeks of age. International experts recommend the administration of supplemental oral iron to low birth weight infants starting from 6 to 8 weeks of age (Edmond & Bahl, 2006). Low birth weight is defi ned as an infant weighing less than 2.5 kg at birth. Cambodia has two sources of national level data on low birth weight: the HIS (not shown) and Demographic and Health Surveys. Th e HIS is considered to have poor quality dataas it is based only on facility based births and not all facilities have scales.

35Micronutrient Defi ciencies and Interventions in CambodiaInformation for Improved Programming
Both the CDHS 2000 and CDHS 2005 have poor quality data on low birth weight for the following reasons:
78% of births take place at home (CDHS 2005)
Only 17% and 40% of children in 2000 and 2005, respectively were weighed at birth (Table 9)
For the children who were weighed but born at home, they were likely weighed too late (the child should preferably be weighed in the fi rst hour of life)
Th e data are taken from records on the vaccination card or from maternal recall. Only one fi fth of data is taken from the vaccination card (CDHS 2005). Data from maternal recall have been demonstrated to be of poor quality,
Heaping or preference for certain numbers is very common (not shown).
Table 11. Prevalence of Low Birth Weight in Cambodia, Thailand and Bangladesh by year and source of data
Country and Year % Low Birth Weight
% of births weighed N
Cambodian DHS 2000 6 17 8,175
Cambodian DHS 2005 8 40 7,789
Cambodian DHS 2005 (Adjusted) 15 40 7,789
Th ailand MICS 2006 9 99 9,409
B'desh MICS 2006 27 16 11,899
B'desh Low Birth Weight Study 2003-04 36 80 3,085
Table 11 above compares data on low birth weight from Cambodia, Th ailand and Bangladesh in order to demonstrate that the indicator reported in DHS and Multiple Indicator Cluster Surveys (MICS) will often underestimate the true prevalence of low birth weight. It should be noted that MICS surveys use the same methodology and have the same problems as the DHS surveys. Th e prevalence of low birth weight of weighed children has increased in Cambodia from 6 to 8 percent as more women reported their child was weighed at birth from 2000 to 2005. In Th ailand, the MICS methodology did not underestimate the prevalence of low birth weight babies as 99% of the children were weighed at birth. Th ailand, where women are considered to be signifi cantly more healthy than in Cambodia was found to have a higher prevalence of LBW (9%) than Cambodia (8%). Th is indicates that Cambodia’s reported estimate is most likely an underestimate.
In Bangladesh, the Multiple Indicator Cluster survey reported 27 percent of children had low birth weights. Th is is compared to the Bangladesh Low Birth Weight Study where 80% of live births in a national sample were weighed and the prevalence of low birth weight was 36%. Th e study found the prevalence of low birth weight was 33% higher than the MICS data.
Methods to improve the estimates of low birth weight from the DHS/MICS methods were developed and fi nd on average the adjusted estimates are 24% higher than the DHS/MICS estimates. Th ese methods make adjustments for relative birth size and heaping (of reported weight) (Blanc and Wardlaw, 2004). Th ese adjusted estimates are not robust when they are based on a small percentage of the population weighed at birth.

36 Micronutrient Defi ciencies and Interventions in CambodiaInformation for Improved Programming
Using these methods, the adjusted rate of low birth weight calculated from the CDHS 2005 was 15%. Th is appears closer to what would be expected given the high rates of stunting (8% with height < 145cm) and undernutrition (21% with low Body Mass Index - CDHS 2005) among women of childbearing age. Th e true conditions of low birth weight are not known nor addressed in Cambodia. It is clear that low birth weight increases the risk of death and anemia in young children. Th ere is a critical need for more accurate measures and eff ective interventions to reduce the rate of low birth weight.
Prevalence of Anemia
Anemia data were collected in both the CDHS 2000 and 2005. In both surveys, Hemocue machines were used. The same trainings and standardization procedures were used and in many cases the same interviewers were hired to do the interviews and blood testing. Figure 17 below
presents the national prevalence of anemia in three populations considered to have the highest risk foranemia. Eight percent of children and fi ve percent of women had missing data for hemoglobin concentration.
On the national level, the prevalence of anemia in young children did not change signifi cantly between 2000 and 2005. No real change was evident in children in the anemia categories by severity. For pregnant women, the prevalence of anemia decreased by 9 percentage points. Th is change was largely due to a decrease in the moderate anemia category. In non-pregnant, non-lactating women the prevalence of anemia declined by 11 percentage points. In this population group the change was caused by a ten percentage point decrease in mild anemia.
Figure 17. Prevalence of anemia in women and children by severity and year, CDHS 2000 and 2005
30.6 32.1
35.230
9.9 8.5
30.8 29
26.9
23.6
44.5
35
2 0.7 4.3 3.4 0.7 0.90
10
20
30
40
50
60
70
Children 2000N=1461
Children 2005N=3158
PregnantWomen 2000
N=209
PregnantWomen 2005
N=486
Non-pregnantnon-lactatingwomen 2000
N=2722
Non-pregnantnon-lactatingwomen 2005
N=6408
Population and Year
Mild
Moderate
Severe
Percentage with Anemia
Total63.4 Total
61.8
Total 66.4
Total57.0 Total
55.1
Total44.4

37Micronutrient Defi ciencies and Interventions in CambodiaInformation for Improved Programming
Th e provincial prevalence of anemia shows considerable variation (Table 12). Th e data are sorted by anemia prevalence in 2005. Th e domains of the CDHS 2000 were recategorized to match those of the CDHS 2005. Only one province (Oddar Meanchey) had insuffi cient sample to represent reliable data, and its results are not shown. Th e provincial data presented is based on children of interviewed mothers from the CDHS 2000.
In 2005, close to three-quarters of children or more were anemic in Pursat, Siem Reap, Kampong Th om, Sihanoukville/Koh Kong and Oddar Meanchey. Th e lowest provincial estimates were in Phnom Penh (52%) and Kampot/ Krong Kep (49%). Th e prevalence of anemia increased by 10 percentage points or more in Pursat, Sihanoukville/Koh Kong, Battambang/Krong Pailin, Preah Vihear/Stung Trengand Phnom Penh. Six provinces showed no real change in anemia prevalence (a diff erence less than 3 percentage points). Anemia decreased by more
than 10 percentage points in Kampong Speu, Kampong Cham and Kampot/Krong Kep. The greatest changes of anemia prevalence in either direction were found in Battambang/Krong Pailin (+19 percentage points)and Pursat (+15 percentage points). For Battambang/Krong Pailin, it appears that the prevalence in 2000 (36%) was an underestimate. For Pursat the prevalence in 2005 (85%) appears inaccurate. Both of these outcomes could be due to poor anemia testing technique.
Th e most important point demonstrated by the provincial prevalence is that conditions remained above the cut-off defi ned as a severe public health problem.
Table 12. Prevalence of Low Birth Weight in Cambodia, Thailand and Bangladesh by year and source of data
ProvincePrevalence of Anemia in Children Diff erence
(2005-2000)2000 2005Pursat 69.2 84.6 15.4Siem Reap 76.8 78.1 1.3Kampong Th om 78.7 75.1 -3.6Sihanoukville/Koh Kong 57.3 73.7 16.4Oddar Meanchey * 73.2 *Banteay Mean Chey 61.8 70.6 8.8Svay Rieng 68.1 68.5 0.4Preah Vihear/Stung Treng 56.9 67.4 10.5Kampong Speu 75.7 63.4 -12.3Mondolkiri/Rattanakiri 67.1 63.4 -3.7Kampong Chhnang 67.1 60.2 -6.9Prey Veng 58.8 59.6 0.8Kratie 52.8 58.9 6.1Kampong Cham 73.2 56.5 -16.7Takeo 65.0 55.9 -9.1Battambang/Krong Pailin 36.0 54.9 18.9Kandal 58.3 54.9 -3.4Phnom Penh 41.8 52.2 10.4Kampot/Krong Kep 61.8 48.5 -13.3Overall 63.6 61.8 -1.8Number 1,420 3,158 -1.8
Note: Percentages based on less than 30 unweighted counts are not shown.

38 Micronutrient Defi ciencies and Interventions in CambodiaInformation for Improved Programming
Analysis of hemoglobin concentration in children by age in months and year (fi gure 18) showed the conditions changed only slightly between 2000 and 2005. When the mean hemoglobin concentrations from the two surveys are analyzed by age in months, a variation can be seen. In 2000 the child’s mean hemoglobin concentration did not fall as low as that of year 2005 during the age of 10 to 15 months. In 2005, the mean hemoglobin concentration climbed above 10.5 g/dl by 24 months of age, where it took until 31 months of age in the year 2000. After 31 months of age, there is little diff erence between the mean hemoglobin concentration in 2000 and 2005.
Anemia is caused by many factors, but children have their highest iron needs between the age 6 and 24 months due to their rapid growth. Eighty-one percent of children 6 to 8 months of age in
Cambodia are anemic (CDHS 2005) indicating that the majority of children did not have adequate iron stores to last until 6 months of age. After 6 monthsof age, children are fed complementary foods. Th e iron gap or insuffi ciency of iron in the complementary feeding diet has been found to exist in Cambodia just as in more developed countries (Anderson, 2004). Children are also more likely to be exposed to disease and intestinal parasites causing diminished appetite, poor absorption and/or iron losses.
Currently there is no national policy or commonly implemented intervention to treat or prevent iron defi ciency in children under 24 months of age.
Figure 18. Mean hemoglobin concentration in children 6-59 months by age in months and year, CDHS 2000 and 2005
9
9.5
10
10.5
11
11.5
12
6 8 10 12 14 16 18 20 22 24 26 28 30 32 34 36 38 40 42 44 46 48 50 52 54 56 58
Mean Hb concentration 2000
Mean Hb concentration 2005
Note: Points are smoothed with a five month moving average.
Grams per deciliter

39Micronutrient Defi ciencies and Interventions in CambodiaInformation for Improved Programming
For women of reproductive age, anemia prevalence varied considerably by province. Th e data in table 13 are sorted by anemia prevalence in 2005. Th e three provinces with the highest prevalence of anemia were Preah Vihear/Stung Treng, Kampong Speu, Kampong Th om and Banteay Mean Chey (57% or higher). Two of these three provinces also had among the highest prevalence of anemia in children. Th e province with the lowest prevalence of anemia in women was Phnom Penh (29%). Phnom Penh had the second lowest prevalence of anemia in children. Phnom Penh was the only province that fell signifi cantly below the cut-off of a severe public health problem (40%).
Th e prevalence of anemia in women decreased in 16 of the 19 of domains. Th e only two provinces where anemia increased were Kampong Chnnang and Battambang/Krong Pailin (5 percentage
points). Th e provinces with the largest decreases in anemia were Phnom Penh (24 percentage points), Mondolkiri/Rattanakiri (21 percentage points), Takeo and Kampong Cham (about 17 percentage points). Th e decrease in anemia in women in Phnom Penh is likely due to the large increases in socio-economic status and quality and access to health care in the capital city. It is interesting to note that the conditions identifi ed in child anemia in Pursat and Battambang/Krong Pailin are not evident in the measures of anemia in women.
Th e decrease of the overall anemia prevalence in women was driven by the changes of the populous provinces of Kampong Cham, Phnom Penh, Takeo and Prey Veng.
Table 13. Prevalence of anemia in women 15-49 years of age by province and year, CDHS 2000 and 2005
ProvincePrevalence of Anemia in Children Diff erence
(2005-2000)2000 2005Pursat 68.7 62.6 -6.1Siem Reap 59.6 58.0 -1.6Kampong Th om 66.8 57.4 -9.4Sihanoukville/Koh Kong 65.4 57.1 -8.3Oddar Meanchey * 57.1 *Banteay Mean Chey 51.4 55.9 4.5Svay Rieng 69.9 55.9 -14.0Preah Vihear/Stung Treng 47.5 52.8 5.3Kampong Speu 63.3 52.4 -10.9Mondolkiri/Rattanakiri 60.2 49.4 -10.8Kampong Chhnang 64.6 46.8 -17.8Prey Veng 50.8 46.3 -4.5Kratie 54.2 45.9 -8.3Kampong Cham 63.0 42.3 -20.7Takeo 52.8 42.3 -10.5Battambang/Krong Pailin 58.2 41.0 -17.2Kandal 54.6 40.3 -14.3Phnom Penh 55.9 36.6 -17.3Kampot/Krong Kep 52.6 29.1 -23.5Overall 57.8 46.6 -11.2Number 3,634 8,219
Note: Percentages based on less than 30 unweighted counts are not shown.

40 Micronutrient Defi ciencies and Interventions in CambodiaInformation for Improved Programming
Table 14 below shows anemia conditions in children by background characteristics. Children of uneducated mothers and those in the lowest and second lowest wealth quintile have the highest prevalence of any anemia. Anemia also is highest in the 6-8, 9-11 and 12-17 month old age groups.
Table 14. Prevalence of anemia in women 15-49 years of age by province and year, CDHS 2000 and 2005
Anemia status by level
Mild (Hb conc.
10-10.9g/dL)
Moderate (Hb conc.
7.0-9.9 g/dL)
Severe (Hb conc. <7.0 g/dL)
Any anemia (Hb conc.<11g/dL)
Number
Age in months
6-8 26.0 54.2 0.3 80.5 163
9-11 24.5 61.7 0.9 87.1 170
12-17 24.8 59.2 1.8 85.8 370
18-23 32.6 36.8 1.2 70.7 376
24-35 32.7 25.7 0.2 58.6 679
36-47 28.8 21.5 0.8 51.1 721
48-59 27.8 19.5 0.4 47.7 679
Mother’s education
No Schooling 30.1 37.6 0.8 68.5 726
Primary 29.3 32.1 0.8 62.3 1,765
Secondary and higher 28.1 24.2 0.2 52.5 489
Wealth quintile
Lowest 28.1 40.4 0.9 69.4 811
Second 29.9 35.1 1.0 65.9 700
Middle 27.5 32.8 1.0 61.3 602
Fourth 29.2 26.1 0.5 55.9 550
Highest 31.0 20.1 0.0 51.0 494
Overall 29.0 32.1 0.7 61.9 3,158
Th e most interesting point from table 14 is that mild anemia does not change greatly over the diff erent background characteristics. Th is provides a hint that hemoglobinopathies may be a major cause of mild anemia. Hemoglobinopathies are not expected to cluster by maternal education or socio-economic status. Moderate anemia
(Hb concentration from 7.0 – 9.9 g/dL) is the type of anemia that responds to the changes in characteristics. While there is anemia found throughout the entire child population, this more detrimental level of anemia (moderate to severe) should be immediately addressed through specifi c targeting of interventions.

41Micronutrient Defi ciencies and Interventions in CambodiaInformation for Improved Programming
Table 15. Prevalence of anemia in women by background characteristics, CDHS 2005
Anemia status by level
Mild (Hb conc.
10-10.9g/dL)
Moderate (Hb conc.
7.0-9.9 g/dL)
Severe(Hb conc. <7.0 g/dL)
Any anemia (Hb conc.<11g/dL)
Number
Number of children ever born
0 34.5 8.7 1.3 44.5 2,998
1 36.9 9.9 0.9 47.7 953
2-3 34.0 10.4 0.6 45.1 1,905
4-5 35.4 10.6 0.9 46.9 1,339
6+ 38.9 14.2 1.0 54.1 1,024
Mother’s education
No Schooling 36.4 15.0 1.5 52.9 1,636
Primary 36.3 9.9 0.9 47.2 4,622
Secondary and higher 32.2 6.9 0.8 39.9 1,960
Wealth quintile
Lowest 37.0 17.1 1.4 55.5 1,452
Second 37.9 11.7 1.2 50.8 1,540
Middle 37.1 9.9 1.3 48.3 1,639
Fourth 38.8 7.9 0.9 47.5 1,599
Highest 28.0 6.2 0.4 34.7 1,988
Overall 35.4 10.2 1.0 46.6 8,219
Th e prevalence of anemia in women by background characteristics is shown in table 15. Women who have had six children or more had signifi cantly higher prevalence of anemia compared to those who had less children. Th e majority of change is found in moderate anemia, as it increases with each child born. Women with no schooling (53%) or primary schooling (47%) had a significantly higher prevalence of anemia compared to women with secondary education or higher (40%). Again the majority of change is found in moderate anemia.
Socio-economic status presents the largest variation of anemia prevalence in women. In the highest wealth quintile only 35% of women were anemic, while in the lowest, 56% were found anemic. Th e diff erence is explained by large changes in both moderate and mild anemia. With moderate anemia, as the wealth quintile rises the prevalence of moderate anemia falls. With mild anemia, the prevalence remains the same across the fi rst four quintiles and only decreases when reaching the highest wealth quintile.

42 Micronutrient Defi ciencies and Interventions in CambodiaInformation for Improved Programming
Iron Supplementation
In September 2007, the new National Guidelines for Iron/Folic Acid supplementation in pregnant and post-partum women were disseminated. Th e iron/folic acid tablets are available from hospitals, health centers, or outreach activities (MoH, 2007). Pilot projects have been conducted on providing weekly iron folate (WIF) supplements to secondary school girls, factory women and rural women of reproductive age and fortifi cation of fi sh sauce, but neither are national programs.
Iron Supplementation Summary Points Coverage: In 2005, only 18% women received the recommended number (90+ tablets) of iron supplements during their last pregnancy. Only two-thirds of women reported that they received any iron supplementation during their last pregnancy.
Geographic Distribution: Svay Rieng and Takeo had the highest coverage of any iron supplementation, while Kratie, Sihanoukville, Koh Kong, and Od-dar Meanchey had the lowest rate of any supplementation.
Low Coverage Populations: Uneducated women and those in the lowest wealth quintile were the least likely to receive iron supplementation.
Trend: Th ere has been a 42 percentage point increase in women receiving at least one iron supplement between 2000 and 2005. Every province improved over that time, with Prey Veng increasing coverage by 62 percentage points. The rate of women who received the recommended number of iron supplements increased from 3% to 18% from the year 2000 to 2005.
Th ere is no policy for preventive supplementation of children, despite anemia in children being a documented long-term severe public health problem in Cambodia. Th e resistance to implementation of anemia prevention/treatment programs including iron supplementation for infants and young childrenis an international problem. Many MOH leaders and health planners do not appear to know that eff ective and practical interventions are available for addressing anemia (Kapil, 2003).
Th e safety concerns pertaining to iron supplementation in children in areas where malaria and infectious diseases are common have caused many countries to move cautiously with anemia reduction programs in children. Many dangerous pathogens need iron for survival and thrive when it is present in suffi cient quantities. Anemia of chronic infl ammation stems from the body storing iron to make it unavailable to pathogens. A WHO expert consultation on prevention and control of iron defi ciency found that iron defi cient children should be treated with iron supplements, but caution exercised in areas where the prevalence of malaria and other infectious diseases are high (WHO, Jan 2006). Th is statement was released after expert consultation reviewed the topic. One large study in particular conducted in Tanzania that found that children who received iron and folic acid with or without zinc were signifi cantly more likely to be hospitalized and had a non-signifi cant trend towards increased mortality. Th e same study demonstrated that iron supplementation in children with iron defi ciency signifi cantly reduced the rate of adverse events (hospitalizations or deaths) (Sazawal et al, 2006; Lynch et al, 2007). Th e sister study in Nepal with similar methods and sample size did not report outcomes in children stratifi ed by presence of iron defi ciency anemia (Tielsch et al, 2006).
Th e WHO statement made it clear that fi ndings should not be extrapolated to food fortifi cation or food based approaches. Large scale trials of in-home fortifi cation with multiple micronutrient demonstrated that it is safe and eff ective (Zlotkin et al, 2005; IRIS Study Group, 2005). Effi cacy trials of in-home fortifi cation in infants and young
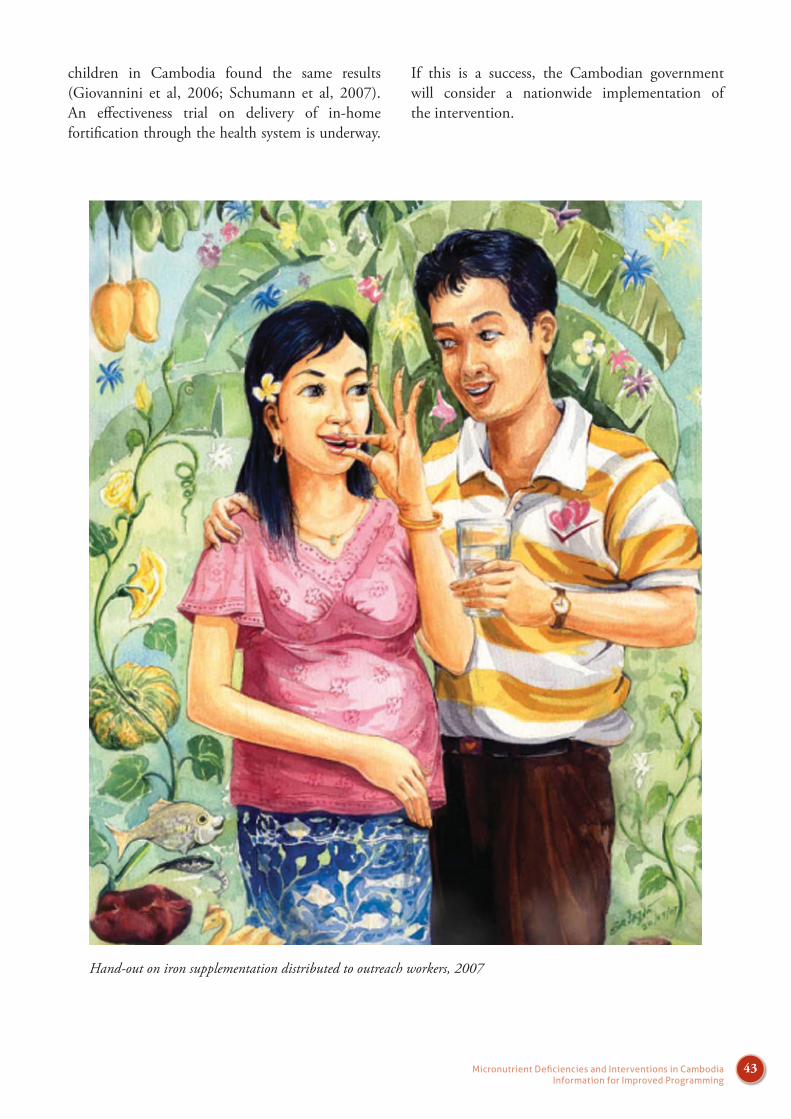
43Micronutrient Defi ciencies and Interventions in CambodiaInformation for Improved Programming
Hand-out on iron supplementation distributed to outreach workers, 2007
children in Cambodia found the same results (Giovannini et al, 2006; Schumann et al, 2007). An eff ectiveness trial on delivery of in-home fortifi cation through the health system is underway.
If this is a success, the Cambodian government will consider a nationwide implementation of the intervention.

44 Micronutrient Defi ciencies and Interventions in CambodiaInformation for Improved Programming
Current recommendations in Cambodia state that pregnant women should receive at least 90 tablets of iron during their pregnancy. Th e target put forth by the NNP for iron/folate supplementation of pregnant women is that 50% take at least 90 tablets by 2010. To monitor supplementation the NNP is using the indicator of the percentage of women that received 90+ tablets during their last pregnancy.
Issues with the Indicator from the CDHS
Th is indicator of women receiving 90 or more iron tablets during their last pregnancy has the same problem as vitamin A in that respondents reply “don’t know,” but the calculation of the two indicators is diff erent. As previously discussed, the vitamin A indicator treats all of the people replying “don’t know” as No. With iron supplementation the women who responded “don’t know” remain separated. As in the vitamin A questions, the data on IFA supplemented is collected with two questions. Th e same question was used in the 2000 and 2005 surveys.
Figure 19. Prenatal iron supplementation questions, CDHS
Interviewers asked the fi rst question about ever receiving IFA tablets and while showing iron tablets used for demonstration. Sixty-three percent of women responded “yes” and less than half a percent responded “don’t know” (table 16).
Table 16. Percent distribution ever received iron tablets during last pregnancy (First Question), CDHS 2005
Ever received iron tablets Percent NumberYes, received 62.8 3685No, never received 36.8 2160Don’t know 0.3 20Total 100.0 5864
Th ose women who answered that they received IFA tablets, were asked how many days during the entire pregnancy did they take the tablets. Only 28% of the women took IFA tablets for 90 days or more. About 9% responded “don’t know” to the question on number of days of iron tablets.
421 During this pregnancy, were you YES . . . . . . . . . . . . . . . . . . 1 given or did you buy any iron tablets? NO . . . . . . . . . . . . . . . . . . 2
(SKIP TO 422 A) SHOW TABLETS. DON'T KNOW . . . . . . . . 8
422 During the whole pregnancy, for NUMBER how many days did you take the DAYS tablets?
DON'T KNOW . . . . . . . . 998 IF ANSWER IS NOT NUMERIC, PROBE FOR APPROXIMATE NUMBER OF DAYS.

45Micronutrient Defi ciencies and Interventions in CambodiaInformation for Improved Programming
36.8
30.8
9.0
17.6
5.7
0
5
10
15
20
25
30
35
40
none less than 60 60 to 89 90 or more don't know
Percent
CDHS 2005, N=5,865
Table 17. Percent distribution of number of days women took IFA tablets during last pregnancy out of women who received any IFA tablets during pregnancy (Second Question), CDHS 2005
Number of days took IFA tablets Percent Number
less than 90 days 63.4 223890 days or more 28.1 1035Don’t know 8.5 312Total 100.0 3685
In calculation of the indicator of percentage of women who took the recommended number of IFA tablets during pregnancy, the women who responded “no” to the initial question were put into the received “none” category. Th ose who responded “yes” to the fi rst question and a number of days were categorized (<60 days, 60-89 days and 90 or more days). Th e “don’t know” responses from the fi rst and second questions were put into the “don’t know” category. Th e results are reported in fi gure 20 below.
Figure 20. Number of days women took IFA tablets during last pregnancy, CDHS 2005
Th e inclusion of the “don’t know” category in the results gives a more accurate representation of IFA supplementation. While the percent of women reporting “don’t know” is relatively low, there is a possibility to have underestimated the percent of women who took IFA tablets for 90 days or more. As the CDHS 2005 had a large sample size, those who reported “don’t know” represented 312 womenin the weighted sample, which is a suffi cient number for further analysis.

46 Micronutrient Defi ciencies and Interventions in CambodiaInformation for Improved Programming
Analysis was done to determine if these women who reported “don’t know” how many days were diff erent than the average women in the sample. Table 18 below shows that women from urban areas are twice as likely to report “don’t know” number of days compared to rural women. Women of the richest wealth quintile are fi ve times as likely to report “don’t know” how many days compared to those in the poorest wealth quintile. Even women in the richest wealth quintile had a prevalence of anemia of 35%, showing that iron supplementation is needed.
Table 18. Percent of women reporting “don’t know” how many days of IFA tablets taken by background characteristics, CDHS 2005
Percent“don’t know”
number of dayNumber
EducationNo Schooling 2.9 1,355Primay 5.6 3,482Seconday + 7.6 1,082Wealth QuintilePoorest 2.3 1,476Poorer 3.8 1,320Middle 4.7 1,077Richer 6.2 1,003Richest 11.7 988Place of ResidenceRural 4.4 5,038Urban 10.8 827Overal 5.3 5,865
Trends and Conditions of Iron Supplementation
Iron supplementation during pregnancy is a well established intervention to improve the health of women and newborn children. Th e conditions of iron supplementation in Cambodia are presented below. Table 20 shows the percentage of women
who received the recommended supplementation of IFA tablets for 90 days or more in 2005 by province. Th e results are sorted by the percentage of women who took 90 days or more of IFA tablets.
Th e three provinces with the highest rates of women taking 90 days or more of IFA tablets (28% or higher) were Pursat, Svay Rieng and Prey Veng. The rate in Pursat (53%) is 14 percentage points above the next highest province. Th ese results appear signifi cantly higher than the results from other provinces and may be an overestimate. Th e provinces with the lowest rates of women taking 90 days or more of IFA tablets (7% or lower) were Kampong Th om, Kampong Cham, Preah Vihear/Stung Treng and Mondolkiri/Rattanakiri. Two of these domains (Kampong Th om and Preah Vihear/Stung Treng) were found to have the highest prevalence of anemia in women (Table 13). Kampong Cham and Mondolkiri/Rattanakiri were found to have large decreases in anemia in women (17 and 22 percentage points, respectively). The negligible recommended supplementation rates found in these provinces show that iron supplementation during pregnancy did not cause the decrease in anemia.
Th ere was signifi cant provincial variation in the percent response of “don’t know” number of days took IFA tablets (from a low of 0% to a high of 19%). Th e provinces with the highest reported rates of “don’t know” number of days were Phnom Penh, Takeo, Sihanoukville/ Koh Kong, Banteay Mean Chey and Kampong Cham (9% or more). Th ese “don’t know” answers cause the data to become less robust for provincial and temporal comparisons. For this reason, comparisons at the provincial level with this indicator are not presented. Provincial comparisons are made below with the indicator of IFA tablet utilization (any IFA tablets during last pregnancy). Rates of utilization are not signifi cantly aff ected by “don’t know” answers and span a greater range as compared to recommended supplementation rates.

47Micronutrient Defi ciencies and Interventions in CambodiaInformation for Improved Programming
Table 19. Percent of women who took IFA tablets for 90+ days by province, CDHS 2005
Percent who took IFA tablets for 90 days or more
Province Yes No Don’t know Total Number
Pursat 53.0 47.1 0.0 100 167
Svay Rieng 39.3 60.7 0.0 100 202
Prey Veng 28.1 71.6 0.3 100 485
Kampot/Krong Kep 26.7 71.9 1.3 100 290
Banteay Mean Chey 23.1 67.8 9.1 100 254
Battambang/Krong Pailin 21.9 78.1 0.0 100 404
Takeo 18.9 66.8 14.4 100 372
Siem Reap 18.4 81.1 0.5 100 472
Kampong Chhnang 16.6 80.0 3.4 100 218
Phnom Penh 16.0 66.2 17.9 100 476
Kampong Speu 16.0 78.7 5.3 100 335
Oddar Meanchey 15.6 84.4 0.0 100 76
Kratie 12.6 80.7 6.8 100 137
Kandal 11.9 87.2 0.9 100 531
Sihanoukville/Koh Kong 10.0 71.0 19.0 100 146
Kampong Th om 6.5 92.0 1.5 100 299
Kampong Cham 6.2 84.8 9.0 100 738
Preah Vihear/Stung Treng 5.2 92.4 2.4 100 153
Mondolkiri/Rattanakiri 1.5 97.4 1.2 100 107
Overall 17.6 77.1 5.3 100 5865
Th e comparison of utilization of IFA tablets by year and province is presented in table 20 below. Th e data are sorted by utilization rates in 2005. Th e national utilization rate of taking any IFA tablets increased threefold from 21% in 2000 to 63% in 2005. Th e provinces with the highest IFA tablet utilization rates were Pursat, Svay Rieng and Takeo (80% or higher). Again Pursat is found to have the highest rate. While this result does not appear out of range, it should be interpreted with care. Th e domains with the lowest IFA tablet
utilization rates were Preah Vihear/Stung Treng and Mondolkiri/Rattanakiri (36 and 22%, respectively).
Th e provinces with the largest improvements in IFA tablet utilization from 2000 to 2005 were Prey Veng, Takeo and Kampot/Krong Kep (50 percentage points or more). Th e provinces with the lowest improvements in utilization were Kratie, Preah Vihear/Stung Treng and Mondolkiri/Rattanakiri (26 percentage points or less).

48 Micronutrient Defi ciencies and Interventions in CambodiaInformation for Improved Programming
Table 20. Ever received IFA tablets during last pregnancy by province and year, CDHS 2000 and 2005
Ever received IFA tablets during pregnancy
Province 2000 2005Diff erence
(2005-2006)
Pursat 38.1 87.5 49.4Svay Rieng 39.6 80.9 41.3Takeo 23.7 79.8 56.1Battambang/Krong Pailin 33.4 76.6 43.2Kampong Chhnang 28.3 75.6 47.3Phnom Penh 38.6 72.5 33.9Prey Veng 6.1 68.3 62.2Banteay Mean Chey 23.8 61.5 37.7Siem Reap 17.7 61 43.3Kandal 16.9 60.1 43.2Kampot/Krong Kep 9.7 59.4 49.7Kampong Th om 15.6 56.9 41.3Kampong Cham 16.1 54.5 38.5Kampong Speu 18.1 52.5 34.4Oddar Meanchey 9.8 49.9 40.1Sihanoukville/ Koh Kong 15.2 45.3 30.1Kratie 21.0 44.1 23.1Preah Vihear/Stung Treng 9.2 35.5 26.3Mondolkiri/Rattanakiri 8.1 22.2 14.1Overall 20.8 62.8 42.0
Number 5,694 5,865
Th e rate of recommended IFA supplementation (90 tablets) is low with less than one in fi ve women taking the recommended number of tablets. Th e rate of utilization of IFA tablets is also low with less than two-thirds of women ever receiving any IFA during pregnancy. Immediate measures are needed to improve pregnant women’s use of iron supplements. Despite the fact that universal iron supplementation is the recommendation in Cambodia, these measures should take into account the numbers of women not being served when dedicating resources for improving the anemia reduction program.
In the map below (fi gure 21) the numbers of women who never received any IFA tablets during pregnancy are presented by province. It is evident that the provinces with the lowest rates of utilization (Preah Vihear/Stung Treng and Mondolkiri/Rattanakiri) have low numbers of women who have never received any IFA tablets compared to other provinces. Th e provinces with higher population density were found to have a higher number of women who do not utilize the IFA intervention. Th e two provinces with the worst conditions were Kampong Cham and Kandal provinces with 400,000 and 260,000 women, respectively who never used any IFA tablets during pregnancy

49Micronutrient Defi ciencies and Interventions in CambodiaInformation for Improved Programming
Figure 20. Number of days women took IFA tablets during last pregnancy, CDHS 2005
# of Women who Never Received IFA tablets
30,000 - 99,999
100,000-149,999
150,000-249,999
250,000+
Th e map helps to illustrate the problem that the intervention is not reaching high numbers of its target population. Th e reason for this is not because the population lives in inaccessible areas or is poor. Th ere are several factors on the delivery side that cause utilization to be low including stock-outs of IFA tablets, poor knowledge about responsibilities of outreach work, staffi ng
problems with the outreach and ANC personnel, no community mobilization for attending outreach activities. On the receiving side, problems include inadequate interest or diffi cult access to ANC, poor knowledge about anemia and its dangers during childbirth. Th ese problems need to be clearly identifi ed and addressed to improve program performance.

50 Micronutrient Defi ciencies and Interventions in CambodiaInformation for Improved Programming
Table 21. Percent of women who took IFA tablets for 90 days or more by timing of fi rst ANC check, CDHS 2005
Timing of fi rst ANC visit by
month of pregnancy
Percent ofwomen who took IFA tablet for 90
days or moreNumber
No ANC visits 2.4 16521st month 31.5 1532nd month 32.4 3533rd month 30.1 8494th month 29.3 6005th month 25.3 9126th month 20.0 5287th month 10.2 4458th month 5.1 2449th month 2.7 101Don’t know 8.8 27Overal 17.6 5865
Currently, 69% of pregnant women get at least one ANC check (CDHS 2005). Th ese women are normally given 60 tablets at their fi rst ANC check and 30 tablets at their second or later ANC check. Analyzing the percentage of women who took IFA tablets for 90 days or more by timing of ANC shows a strong relation between early ANC visits and the highest rates of compliance with recommended supplementation of IFA tablets. About 30% of women who reported their fi rst ANC visit in the fi rst four months of becoming pregnant took IFA tablets for 90 days or more during their pregnancy. Women probably are not perfectly accurate with reporting the month of pregnancy when they fi rst received ANC but the results show the importance of getting an ANC check in the fi rst trimester for improving rates of IFA supplementation. The rate of compliance with recommended supplementation of IFA tablets during pregnancy was analyzed by maternal education and socio-economic status (table 22). Th e wealth quintiles had very little eff ect on supplementation rates. From the poorest quintile (14%) to the richest
quintile (20%) the rate only changed by 6 percentage points. Th is result could be related to the condition shown above that women of higher wealth quintiles are more likely to report “don’t know” how many days took IFA tablets.
Maternal education was found to have a strong eff ect on compliance with the recommended IFA supplementation. Women with no schooling had supplementation rates of only 12% compared to 27% in women with secondary or more education.
Table 22. Percent of women who took IFA tablets for 90 days or more by background characteristics, CDHS 2005
Percent ofwomen who took IFA tablet for 90
days or moreNumber
EducationNo Schooling 12.0 1,356Primary 16.9 3,482Secondary + 27.4 1,028Wealth QuintileLowest 14.0 1,477Second 19.4 1,320Middle 17.0 1,077Fourth 18.9 1,003Highest 20.0 988Overal 17.6 5,865
Post-partum IFA Supplementation
Cambodia’s Iron Supplementation Guidelines from the National Nutrition Program recommend that all women receive 42 IFA tablets during the post-partum period. Th e question used in the CDHS 2005 asks mothers if they received any IFA tablets within the 2 months of their last delivery, thus the indicator is utilization of post-partum IFA tablets. Th is indicator is presented in table 23 below and the provincial rates are sorted in descending order. No question was included on post-partum IFA tablets in the CDHS 2000.

51Micronutrient Defi ciencies and Interventions in CambodiaInformation for Improved Programming
Only 11% of women reported receipt of any IFA tablets post-partum. Th e provinces with the highest rates of utilization were Pursat, Prey Veng and Siem Reap (over 15%). Th e utilization rate from Pursat is over twice that of the next highest province and should be interpreted with caution. Th e provinces with the lowest utilization rates were Oddar Meanchey, Mondolkiri/Rattanakiri and Kampong Cham. Th is is particularly concerning for Kampong Cham as the province has the highest numbers of women who do not utilize IFA supplementation during pregnancy (shown above).
Table 23. Post-partum utilization of IFA tablets by province, CDHS 2005
Province Percent ever received IFA tablets post-partum Number
Pursat 37.7 166
Prey Veng 17.5 485
Siem Reap 15.4 472
Kampong Th om 14.3 299
Kampong Chhnang 13.9 218
Sihanoukville/Koh Kong 11.9 146
Kratie 11.8 137
Banteay Mean Chey 11.2 256
Battambang/Krong Pailin 11.1 404
Takeo 10.4 372
Kampong Speu 8.0 335
Phnom Penh 7.9 475
Kandal 7.6 531
Preah Vihear/Stung Treng 7.2 153
Kampot/Krong Kep 6.2 290
Svay Rieng 5.8 202
Oddar Meanchey 4.5 76
Mondolkiri/Rattanakiri 4.3 106
Kampong Cham 3.0 738
Overall 10.5 5865

52 Micronutrient Defi ciencies and Interventions in CambodiaInformation for Improved Programming
Preventive Deworming
Preventive Deworming Summary Points
Coverage: 10% of pregnant women and 30% of children 12-59 months of agereceived deworming medicine in 2005.
Geographic Distribution: In some provinces, such as Mondolkiri and Rattanakiri, deworming is virtually non-existent for pregnant women. Th e highest coverage rates for pregnant women in any province are about 20%.
Trend: As no data was collected on deworming in the CDHS 2000, no trend can be assessed.
In 2004, the National Task Force for Helminth Control in Cambodia published policy and guidelines recommending deworming of preschool children (12-59 months) twice a year, pregnant women (after 1st trimester), post-partum women and children in primary school. For pre-school children the distribution of deworming medicine is given concurrently with vitamin A supplementation. Th e national program uses mebendazole, one of two available deworming medications promoted by the WHO (WHO/UNICEF, 2004).
Th e CDHS 2005 includes questions on dewormingfor women during their last pregnancy and for children age 6-59 months. Th ere is no record left in the household, such as the yellow card, where child deworming is recorded. For women, there is space to record deworming on the mothers health record book, but this record is not commonly used throughout the country. No data on post-partum deworming was collected in the CDHS.
Overall, only 1 out of 10 women received deworming medication during the pregnancy of their last born child in the past fi ve years (table 24). Th e low coverage may be related to the recent introduction of deworming during pregnancy. Th e survey asked women about deworming during the last pregnancy in the fi ve years prior to the survey, but the national policy was not fi nalized until the year before the survey, 2004. Results for deworming in the year prior to the survey are also presented for women who gave birth in the year before the survey. Th e overall percent of women dewormed was only slightly higher (13%) showing that even during 2004 deworming was not a common intervention for pregnant women.
In the three provinces (Siem Reap, Mondolkiri/Rattanakiri and Banteay Mean Chey) with the lowest prevalence of deworming (3%) in the one year before the interview, it appears that the deworming intervention of pregnant women has not begun. Five provinces (Prey Veng, Kampot/Krong Kep, Sihanoukville/Koh Kong, Pursat and Kampong Speu) had 23% or more of pregnant women who received deworming medication in the year before the interview. Th e largest change in percent of women dewormed in the fi ve years compared to the one year before survey was in Prey Veng where the prevalence increased by 10 percentage points.
Th e CDHS 2005 reported a deworming coverage of 27% in children 6-59 months. Th e child indicator is not aff ected by the recent adoption of a national policy as the survey asks only about supplementation in the last six months, compared to the last fi ve years for deworming during pregnancy.
An issue with the indicator for children is that it is reported for children 6-59 months of age when the national policy stipulates that only children older than 1 year should receive supplementation. In the target age group (12-59 months) 30% of children received deworming medication in the last six months.

53Micronutrient Defi ciencies and Interventions in CambodiaInformation for Improved Programming
Table 24. Percent of women who received deworming during pregnancy during the last 5 years and last one year, CDHS 2005
Deworming during pregnancy
Province Percent in the past 5 year Percent in the past 1 year
Kampot/Krong Kep 23.7 27.5
Sihanoukville/Koh Kong 20.3 23.4
Pursat 16.8 23.5
Kampong Speu 16.5 23.4
Battambang/Krong Pailin 16.4 16.9
Oddar Meanchey 15.3 18.5
Kratie 13.5 17.2
Phnom Penh 13.3 17.5
Prey Veng 13.3 23.0
Kandal 12.7 8.9
Svay Rieng 9.6 10.0
Kampong Th om 8.3 9.6
Takeo 7.1 11.5
Kampong Chhnang 6.8 10.1
Preah Vihear/Stung Treng 4.1 5.8
Kampong Cham 4.1 5.5
Siem Reap 3.9 2.9
Mondolkiri/Rattanakiri 3.7 3.4
Banteay Mean Chey 3.2 3.0
Overall 10.6 12.7
Number 5,864 2,049
Analysis of deworming by the age of child in months (fi gure 22) shows that deworming is most commonly given after the child reaches 2 years of age. From age 2 to 5 years the rate of deworming mostly remains above 30%. Vitamin A coverage is very similar in this age group. Th is timing of receipt of deworming treatment may be related to the child showing symptoms of parasitic infection that caregivers recognize. Knowledge of
worms and their treatment with medicine is common in the Cambodian rural population. It is possible that most children receiving deworming do not receive it from outreach, but instead from the health center or pharmacy for treatment. Despite these points, preventive treatment with mebendazole has not become common practice yet in Cambodia.

54 Micronutrient Defi ciencies and Interventions in CambodiaInformation for Improved Programming
0
5
10
15
20
25
30
35
40
45
50
0 2 4 6 8 10 12 14 16 18 20 22 24 26 28 30 32 34 36 38 40 42 44 46 48 50 52 54 56 58
Percent
Prevalence reported in the CDHS 2005 for children 6-59m - 26.7%
Age in Months The data are smoothed with a five point running average
Prevalence reported for children 12-59m - 29.5%
Figure 22. Child deworming in the six months before interview by age in months,CDHS 2005
Deworming in children (30%) is three times more common than deworming in pregnant women (11%). Deworming in children by province (table 25) shows that the intervention is commonly given in many provinces. Th e provinces with the highest coverage of deworming are Battambang/Krong Pailin, Pursat, Prey Veng, and Sihanoukville/Koh Kong (all over 40%). Th e provinces with the lowest coverage of deworming were Siem Reap and Mondolkiri/Rattanakiri with 16% and 6%, respectively. Th ese two provinces also had thelowest deworming coverage in pregnant women.
Th e percentage responding “don’t know” (2.1%) is not large enough to aff ect the national estimate. Kampong Speu has the highest percent of “don’t know” responses (12%) and the deworming coverage in that province should be interpreted with care.
No trend in child deworming can be assessed as no data on deworming were collected in the CDHS 2000.

55Micronutrient Defi ciencies and Interventions in CambodiaInformation for Improved Programming
Table 25. Percent distribution of children aged 12-59m who received deworming inthe 6 months prior to interview, CDHS 2005
Deworming in children in the past 6 months
Yes No Don’t know Total Number
Battambang/Krong Pailin 51.7 48.3 0.0 100 250
Pursat 42.5 57.2 0.3 100 690
Prey Veng 42.1 57.5 0.4 100 228
Sihanoukville/Koh Kong 41.8 54.8 3.4 100 345
Kampong Speu 38.5 49.7 11.8 100 296
Kandal 38.5 57.6 3.9 100 493
Banteay Mean Chey 33.8 63.7 2.5 100 136
Svay Rieng 31.7 67.5 0.9 100 458
Kampong Th om 25.8 73.1 1.1 100 448
Kampong Cham 25.5 73.8 0.8 100 160
Oddar Meanchey 25.1 74.9 0.0 100 493
Phnom Penh 24.4 72.8 2.8 100 189
Kampong Chhnang 22.8 74.9 2.4 100 377
Kampot/Krong Kep 22.7 75.5 1.9 100 74
Preah Vihear/Stung Treng 22.3 77.2 0.4 100 384
Kratie 18.9 79.8 1.4 100 305
Takeo 16.5 82.4 1.1 100 153
Siem Reap 15.8 83.8 0.5 100 150
Mondolkiri/Rattanakiri 6.4 93.1 0.5 100 113
Overall 29.5 68.4 2.1 100 5740
Estimates of Iron Defi ciency and other causes of Anemia
In the past, interventions providing iron supplements to address anemia achieved signifi cant rates of adherence but found little impact. Th is caused many experts and policy makers to believe that anemia interventions did not work in developing countries. To implement a successful program, it is important to know the proportion of anemia that is preventable.
Anemia is caused by many factors, but irondefi ciency is considered the most common. Iron defi ciency is commonly caused by:
Little to no foods from animal sources in diet (insuffi cient iron) and
Disease related malabsorption of iron

56 Micronutrient Defi ciencies and Interventions in CambodiaInformation for Improved Programming
Th e graph of hemoglobin concentration by age above (fi gure 18) suggests that iron defi ciencycontributes signifi cantly to anemia in Cambodian children. Th e rapid growth in children from 6 to 24 months of age demands a higher concentration of iron in the diet than most other ages. When these iron demands are not met, hemoglobin concentration falls below 11 g/l. Th e low hemoglobin concentration in this age group that improves by two years of age is strong evidencethat iron defi ciency is the cause.
Two micronutrient supplementation studies in Cambodia collected blood samples from pre-school children. Serum ferritin results in the control groups provide estimates of iron defi ciency in the Cambodian context (Table 16). Th e CESVI study shows that at 6 months of age iron defi ciency was only 13%, but by 18 months the prevalence rose above 50%. Th e GTZ study shows that inchildren 6-24 month of age, 49% are iron defi cient. After fi ve months, the prevalence decreases slightly to 42%. Th e concentration of serum ferritin is known to increase wheninfl ammation is present. Th e CESVI study accounted for this by controlling for infl ammation as measured by C-reactive protein in their analysis. Th e GTZ study found high rates of infl ammation at endline (19%) but found no change in results of serum ferritin when these cases were excluded from analysis.
Children in both studies received vitamin A and deworming, which likely reduced the prevalence of iron defi ciency. As the majority of Cambodian children do not receive vitamin A or deworming, the fi gure of 50% of children with iron defi ciency could be an underestimate in the general pre-school population.
Table 26. Iron defi ciency in control group children measured by serum ferritin, CESVI 2006 and GTZ 2007
Study CESVI Study
GTZ Study
BaselinePercent with iron defi ciency
13% 49%
Age of sample children
6 months 6-24 months
Number 49 68
EndlinePercent with iron defi ciency
52% 42%
Age of sample children
18 months 11-29 months
Number 45 64Note: Percentages based on less than 30 unweighted counts are not shown.
Th e response to iron treatment in anemic subjects is another measure of iron defi ciency anemia. Th e two studies are used again to provide data not exactly on iron defi ciency anemia but preventable anemia in pre-school children as children received iron/multi-micronutrient supplementation, deworming and vitamin A supplementation. It is not possible to determine the impact of the specifi c preventable causes such as vitamin A defi ciency and intestinal parasitic infections as they were not measured.
Th e studies showed that iron/multi-micronutrient supplementation, deworming and vitamin A reduced the prevalence of anemia from 70 to 80% at baseline to 30 to 40% at endline. Th e pooled estimates from these two studies show that the interventions reduced anemia prevalence by 50% of anemia in pre-school children (Table 27).

57Micronutrient Defi ciencies and Interventions in CambodiaInformation for Improved Programming
Table 27. Prevalence of anemia in pre-school children before and after iron or multi-micronutrient supplementation in two studies in Cambodia, CESVI 2006 and GTZ 2007
Fe-Folatesupplementation
Multi-micronutrientsupplementation
Control group
CESVI Study
Baseline anemia prevalence Number
79.9100
70.3101
73.549
Follow-up anemia prevalenceNumber
31.190
42.796
66.745
Children were 6 months of age at baseline and study followed children for 12 months
GTZ Study
Baseline anemia prevalenceNumber
79.768
80.068
76.668
Follow-up anemia prevalenceNumber
38.564
37.565
71.060
Children were 6-24 months of age at baseline and study followed children for 5 months
Helminths
Helminths are common in developing countries. Hookworms, in particular are known to cause to iron defi ciency anemia through blood loss. Other helminths can contribute to anemia through their negative eff ects on vitamin A absorption, diarrhea, and chronic infl ammation (Crompton et al, 2003).
Th ere are no nationally representative studies on helminths in Cambodia. Small studies from 1997 to 2001 have shown that hookworm (N. americanus, A. duodenale), whipworm (T. trichuria), and roundworm (A. lumbricoides) are present in the country and infestation is common across many age groups (MoH, 2004). To more eff ectively implement national programs, a comprehensive survey is recommended to determine the distribution of helminth species by geography, season and age. In Cambodia, children under 12 months of age are not treated for helminths. Prevalence of helminths is not known in this age group. A study from Uttar Pradesh state in India
documented that similar high prevalence of hookworm and other helminths was found in children under 12 months of age and their mothers (A2Z, 2007b). Th ese conditions also could be found in Cambodia.
Although current WHO recommendations promote the use of both mebendazole and albendazole to treat intestinal parasites (WHO/UNICEF, 2004), a review of studies suggests albendazole is more eff ective against hookworm and equally eff ective against other helminths when compared to the other treatment options (Crompton et al, 2003). A recent study in neighboring Vietnam showed similar fi ndingswith respect to hookworm (Flohr et al, 2007), but consensus on this topic has not been reached due to a lack of quality effi cacy studies. Research on the most eff ective parasite treatment in Cambodia would contr ibute impor tant information to the anemia program. Regular effi cacy monitoring advised by the WHO is also needed to track drug resistance (WHO, 2005).

58 Micronutrient Defi ciencies and Interventions in CambodiaInformation for Improved Programming
Malaria
In endemic areas, malaria can be a major cause of anemia as the parasite destroys red blood cells. Malaria has been considered a signifi cant problem in Cambodia and the Ministry of Health established the National Malaria Center dedicated to its control. When the National Malaria Center was founded, malaria was considered responsible for a signifi cant number of child deaths. After the high rates of deforestation that have occurred over the past 15 years, malaria appears to have largely disappeared as a serious cause of morbidity and under fi ve mortality.
In 2004, the Cambodia National Malaria BaselineSurvey (CNMBS) was conducted. Th e sample was designed to collect data from villages in three domains (0-250m from forest, 250-1,000m from forest and 1-2km from forest) and was not nationally representative. Villages were identifi ed as “less than 2 kilometers from forest” with forest-cover maps derived from remote sensing using satellite data from 1995-96 and 1998-2001.
As the most recent Food and Agriculture Organization assessment of global forest cover shows that Cambodia lost 29% of its primary tropical forest between 2000 and 2005 (FAO, 2005), it is probable that the forest cover maps used for the sample do not represent current conditions.
According to the CNMBS survey report, 11% of all villages in Cambodia were within 2 km of forest. In the three malaria endemic domains, the highest prevalence of slide positive malaria was 3.6%, which is low compared to conditions of sub-Saharan Africa. Th e three domains consisted of marginal areas of low population density. In order to convert these results into provincial and national malaria prevalence estimates, the malaria prevalences from the CNMBS 2004 were used with the WHO 2005 document (counts of ) “endemic villages and population at risk of malaria.xls”.
Table 28. Estimate of national malaria prevalence in 2005, CNMBS 2004 and WHO 2005
Area Malaria slide positive rate %
Count of population
living in zone
Percent of population in
zone
Number estimated to have malaria
CNMBS risk zones
< 250 m to forest 3.4 792,998 5.9 26,962
250 m to < 1km from forest 3.6 819,962 6.1 29,519
1km to < 2km from forest 1.4 0 0.0 0
Non-risk zones
more than 2km from forest 0 11,887,040 88.1 0
Overall 0.4 13,500,000 100.0 56,481
Source: CNMBS 2004 and WHO document “Endemic villages and population at risk of malaria”.

59Micronutrient Defi ciencies and Interventions in CambodiaInformation for Improved Programming
Th e national malaria prevalence was estimated to be 0.4% (table 29). Th ese estimates could slightly underestimate the prevalence as the WHO document of population counts only covered the CNM risk zones, which cover only 0 to 1000 meters from the forest. Th e last risk zone (1-2km from forest) of the CNMBS 2004 was given a population count of zero as no data was available. Th e prevalence could be overestimated as the population less than 1km from forest included in the WHO document made up 12% of the population, not 11% as stated in the CNMBS report. Sensitivity analysis showed that it would take one million people living in the risk zone 1-2km from forest zone to raise the malaria prevalence by 0.1 percentage point.Th is would equal 20% of the population living 2km or less from the forest, which is almost double the total amount of population estimated by the malaria survey researchers to live within 2km of the forest.
In 2005, there were 355 deaths and in 2006, 396 deaths were attributed to malaria (WHO and CNM Malaria experts quote). Th ese deaths were likely to be children. Assuming that all malaria deaths occurred in children under fi ve, then malaria would account for less than 1.4% of all deaths of children under fi ve.
Th ese data are not robust, but demonstrate the conditions of lack of information that persists despite the substantial fi nancial support given to address malaria in Cambodia. A new National Malaria Survey was conducted in 2007, but results have not been released. HIS data shows declining trends in reported malaria cases since 2000, but it is diffi cult to determine a prevalence fi gure from the HIS as cases not seen by the health system are not recorded and there are data quality issues.
Genetic Causes of Anemia
Hemoglobinopathy and thalassemia are two terms used to describe a variety of genetic abnormalities, some of which cause anemia. Five studies were identifi ed that collected data on hemoglobinopathies. Th ese studies are presented in table 29.
Four studies were conducted on population based samples (Kandal study, Zinc study, CESVI study and GTZ) but the Zinc study collected information only from children who were severely stunted (-3SD Height for Age). Th e Zinc study should only be considered representative of this sub-group of the population. Th e Angkor Children’s Hospital study was a hospital based sample and should be interpreted with care. Th e Kandal study was never written up in detail, so it is diffi cult to evaluate the sample or the study. Both the CESVI and GTZ studies tested for hemoglobinopathies at baseline. For the CESVI study, the children were 6 months of age at baseline and the concentration of fetal hemoglobin may have still been high obscuring their mature blood profi le. For the GTZ study, the children were 6-24 months of age and this issue may have aff ected testing in some children, but probably did not aff ect the population outcomes.

60 Micronutrient Defi ciencies and Interventions in CambodiaInformation for Improved Programming
Table 29. Percent distribution of hemoglobinopathies and percentage of hemoglobinopathies by type in children, various studies
Study
Angkor Children’s Hospital
Study
Kandal Study
Zinc Study
CESVI Study
GTZ Study
Presence of Hemoglobinopathy
Any hemoglobinopathy (%) 51.5 49.7 33.8 71.2 35.0
No hemoglobinopathy (%) 48.5 50.3 66.2 28.8 65.0
Total 100.0 100.0 100.0 100.0 100.0
Number 260 159 286 191 250
Location Siem Reapregion
Village(s) in Kandal province
Phnom Penhslum
KampongChnnany, Tuk Phos district
Kampotprovince
Age of children 5-16 years 8-72m 12-35m 6m 6-24m
Hemoglobinopathy by type
HbE (%)HbE Heterozygous (%) HbE Homozygous (%)
28.8 24.520.14.4
28.826.12.7
56.547.68.9
32.028.43.6
Alpha Th alassemia (%) 35.4 29.6 not tested not tested not tested
Beta Th alassemia (%) 0.8 not tested 6.8 not tested not tested
Note: All studies on population based samples except Angkor Children’s Hospital study based on hospital based sample.Th e Zinc study sampled only children who were -3 SD stunted.
Sources: Angkor Children’s Hospital Study (Carnley et al, 2006), Kandal Study (one page fi ndings 2002), Zinc Study (Jack, 2005), CESVI study (CESVI, 2006) GTZ study (GTZ, 2007)
Th e prevalence of any hemoglobinopathy ranged from 34 to 71% in children from 6 months to 16 years of age. Th e highest prevalence was found in Kampong Chnnang province and the lowest was found in Kampot province and the severely stunted children of Phnom Penh.
When reviewing the hemoglobinopathies by type, beta thalassemia was the least common. Th eprevalence ranged from 1 to 7% but testing for beta thalassemia was not done in 3 out of the 5 studies. Hemoglobin E (HbE) and Alpha Th alassemia are the most common hemoglobinopathies found. Alpha thalassemia was found in 30 to 35% of
children but was only tested for in 2 out of 5 studies. Th e prevalence of HbE ranged between 25 to 57% in children. Th e severity of the HbE hemoglobinopathies was presented and between 3 and 9% of children had homozygous HbE. In the GTZ and CESVI studies children with HbE were shown to have anemia and those with homozygous HbE had lower hemoglobin concentrations.
Th ese children with HbE hemoglobinopathy when treated with iron or multiple micronutrient supplementation demonstrated measureable improvements in hemoglobin concentration

61Micronutrient Defi ciencies and Interventions in CambodiaInformation for Improved Programming
(CESVI, 2006; GTZ, 2007; Jack, 2005). It can be concluded that hemoglobinopathies contribute to cause anemia in Cambodian children but are rarely the only cause of anemia. Th ese children can be aff ected by any combination of hemoglobinopathies, nutritional defi ciencies and/or infection.
Single and multiple hemoglobinopathies can be diagnosed. Multiple hemoglobinopathies usually are more severe in terms of negative impact. Most studies could not comment on the prevalence of two or more hemoglobinopathies in the study populations as they did not test for all thalassemia. Th e Zinc study found that 2% of children in the severely stunted child population had multiple hemoglobinopathies. Future studies need to collect and present information on the prevalence of multiple hemoglobinopathies.
Th e data on hemoglobinopathies is not representative on the national level. Despite that fact, it is evident that the Cambodian population has a high prevalence of abnormal hemoglobin traits. Th e Angkor Children’s Hospital study reports that majority of abnormalities were mild and it is unlikely that thalassemia represents a major health burden in this region of Cambodia (Carnley et al, 2006). In the review of all studies, the conclusion was given that the majority of hemoglobinopathies were clinically benign (Jack, 2005). National level
data is still needed on the prevalence and impact of hemoglobinopathies in men, women and children. Th is information will help to clarify the etiology of anemia and allow more accurate determination of success within anemia prevention and reduction interventions.
Iodine
Iodine is found naturally in earth and defi ciency is a result of low soil-concentration of iodine. Th ese conditions are commonly found in areas of high altitude, river plains, and locations far from the sea (Delange, 1994). Th e negative eff ects of iodine defi ciency range from impaired cognitive function to goiter, cretinism, low birth weight, stillbirth and increased perinatal and infant mortality.
Iodized salt production began in Cambodia in 1999. In 2003, the law on universal salt iodization was signed into eff ect. Fortifi cation of salt is the only iodine intervention in Cambodia. Health workers are supposed to conduct a bi-annual assessment of iodized salt use in their catchment area. Training has begun on salt testing with liquid drops test and iodized salt promotion (MoH, 2007) but the extent of implementationis not known.
Iodine Defi ciency
Iodine Defi ciency Summary Points
Prevalence: Th e most current data on iodine defi ciency (Th e 1996-97 National Goiter Survey) found 17% of school-aged children with goiter.
Geographic Distribution: Siem Reap, Rattanakiri, Banteay Mean Chey, and Svay Rieng were the four provinces found to have the highest prevalence of iodine defi ciency in 1997. Currently the provinces bordering Vietnam are the most likely to have iodine defi ciency.
Trend: Th ere is no data to analyze the trend of iodine defi ciency but the national prevalence has likely decreased rapidly after producers and distributers began to comply with the universal salt iodization law of 2003.

62 Micronutrient Defi ciencies and Interventions in CambodiaInformation for Improved Programming
Iodine Defi ciency
Iodine Defi ciency Summary Points
Prevalence: Th e most current data on iodine defi ciency (Th e 1996-97 National Goiter Survey) found 17% of school-aged children with goiter.
Geographic Distribution: Siem Reap, Rattanakiri, Banteay Mean Chey, and Svay Rieng were the four provinces found to have the highest prevalence of iodine defi ciency in 1997. Currently the provinces bordering Vietnam are the most likely to have iodine defi ciency.
Trend: Th ere is no data to analyze the trend of iodine defi ciency but the national prevalence has likely decreased rapidly after producers and distributers began to comply with the universal salt iodization law of 2003.
Table 30. Prevalence of total goiter rate by province, National Goiter Survey 1996-97
Category of IodineProvince Total Goiter Rate Defi ciency
Siem Reap 39.4 SevereRattanakiri 37.9 SevereBanteay Mean Chey 36.2 SevereSvay Rieng 31.4 SevereKratie 24.2 ModerateStung Treng 24.1 ModerateKampong Speu 21.0 ModeratePursat 20.5 ModeratePreah Vihear 20.1 ModerateKampong Chhnang 10.4 MildBattambang 10.2 MildKep 9.2 MildKandal 8.3 MildSihanoukville 7.5 MildPrey Veng 7.0 MildTakeo 6.9 MildPhnom Penh 4.6 NoneKampong Th om 3.7 NoneKampot 1.3 None
Overall 17.0 Moderate
Note: Th e categorization of iodine defi ciency is defi ned according to WHO classifi cation: Severe >30, Moderate 20-30, Mild 5-20, None <5 (WHO, 2001)

63Micronutrient Defi ciencies and Interventions in CambodiaInformation for Improved Programming
Th e 1996-97 National Goiter Survey found an overall goiter rate of 17% in school-aged children (table 30) and 12% in children 8-12 years of age (not shown). Th e survey did not include the provinces of Kampong Cham, Mondolkiri, Koh Kong, Oddar Meanchey and Krong Pailin. Kampong Cham was the most populous province
Figure 23. Mother and child in Rattanakiri, 2006
at that time (containing 14% of the total population – National Census 1998) and its exclusion likely biased the overall goiter rate. Th e four provinces that were found to have severe conditions of goiter were Siem Reap, Rattanakiri, Banteay Mean Chey and Svay Rieng. in 2008.

64 Micronutrient Defi ciencies and Interventions in CambodiaInformation for Improved Programming
Iodine Fortifi cation Summary Points
Coverage: In 2005, 29% of all households (about 600,000) did not have adequately iodized salt. No information was collected on fi sh sauce which may contain iodine and is used commonly in Cambodian households. Geographic Distribution: Th e provinces with the lowest coverage of fortifi ed salt in households were along the Vietnamese border and in Kampot/Krong Kep. Salt production is carried out almost exclusively in Kampot and Krong Kep. Iodine defi ciency is not considered an issue in these two production areas.
Low Coverage Populations: Households in the lowest wealth quintile are the least likely to have fortifi ed salt.
Trend: Th e percent of households without iodized salt decreased from 86% in 2000 to 29% in 2005. Th e only provinces where use of non-iodized salt increased (Svay Rieng, Mondolkiri/Rattanakiri) are along the border with Vietnam.
Two of these provinces were on the Vietnamese border and Banteay Mean Chey is on the Th ai border with Siem Reap as the neighboring province. It is not known if salt coming fromTh ailand or Vietnam at the time of the survey was iodized or not. All of the remaining excluded provinces were on the borders and could have been useful to answer this question.
Rattanakiri was found to have the second highest prevalence of iodine deficiency in 1997.Th e population in Rattanakiri and Mondolkiri
provinces are likely to have high risk of iodine defi ciency as the provinces are diffi cult to access, highland areas bordering Vietnam and Lao PDR. Th e woman from the photo had a visible goiter (fi gure 23) and was living in Rattanakiri. It is interesting to note that her child is eating junk food produced outside of Cambodia. Th is snack probably contains iodized salt.
UNICEF plans to conduct a national survey of iodine defi ciency in school children in 2008.
Iodine Fortifi cation
Th e NNP has set a target that 90% of households use adequately iodized salt by 2010. Th e CDHS 2005 reported that 74% of salt was fortifi ed with iodine in households with salt. Th is fi gure does not account for households where salt is not used. On the national level, 2% of households did not have salt (table 31). Th e low percentage of households without salt does not signifi cantly aff ect the national estimate, but has more impact in provinces like Kratie and Mondolkiri/Rattanakiri where 4 and 8% of households, respectively do not have salt.
Th ere were four domains where over 40% of households did not have salt or iodized salt(Svay Rieng, Mondolkiri/Rattanakiri, Prey Veng and Kampot/Krong Kep). Th e domain of Kampot/Krong Kep is home to the salt fl ats where the majority of Cambodian salt is produced. Th is area bordering the sea is not considered to be at risk of iodine defi ciency. Kampot was found to have the lowest levels of iodine defi ciency in school children in 1997 (table 30).

65Micronutrient Defi ciencies and Interventions in CambodiaInformation for Improved Programming
On the other hand, Svay Rieng and Rattanakiri had high risk of iodine defi ciency in 1997. Svay Rieng, Mondolkiri/Rattanakiri and Prey Veng had the lowest percentage use of iodized salt in 2005. Calculations of number of households aff ected per province showed that Prey Veng and Svay Rieng had a combined number of over 200,000 households without iodized salt. Mondolkiri/Rattanakiri had a combined number of only 15,000 households without iodized salt, but this represented 44% of the total households in the two provinces.
Iodized salt is available in markets, but the costis a disincentive for use. In Svay Rieng and Prey Veng, non-iodized salt in the market costs about 150-200 riels a kilogram (4-5 US cents). Iodized salt costs from 800-1,000 riels a kilogram (20-25 US cents). Often, households in rural areas do not buy salt from markets, but exchange part of their rice harvest for a one year supply of salt (about 20kg). Th is salt is brought from Vietnam to Cambodian border provinces. In 2000, Vietnamese salt was iodized and the border provinces had high percentages of iodized salt use. In 2005 compliance has fallen and the salt brought over the border to Cambodia is not iodized (Dr Kieng Navy, personal communication).
Vietnam has led the way with the innovation offortifying fi sh sauce with iron. What has gone largely unnoticed is that fi sh sauce probably isfortifi ed with iodine since the introduction ofiodized salt law. Fish sauce is produced in Cambodia by a few large producers and large numbers of small artisan producers. Many households use fi sh sauce instead of salt when cooking, so it is possible that iodine is eff ectivelydelivered through this vehicle to a large majority of the population. Further eff orts should be made to ensure that fi sh sauce is made with iodized salt.
Commercially produced food often contain iodized salt. Commercially produced snack food consumption is high in young children in Cambodia (Anderson, 2006; Johnston, 2006). To know defi nitively whether iodine is delivered by these products, they should be tested for iodine content. Food consumption studies (proposed in Cambodia) would help greatly to determine the quantity of foods consumed by diff erent groups in the population. From that information, the iodine content delivered could be estimated to clarify who may still be at risk of iodine defi ciency.

66 Micronutrient Defi ciencies and Interventions in CambodiaInformation for Improved Programming
Table 31. Percentage of households with no salt and with salt not containing iodine and number of households without iodized salt by province, CDHS 2005
Percentage of total households Number of households
without iodized salt
Province with salt not containing iodine without salt Total
Prey Veng 51.7 1.2 52.9 114,524
Kampot/Krong Kep 62.3 1.1 63.4 87,965
Svay Rieng 80.5 0.3 80.8 85,207
Kandal 30.7 1.5 32.2 81,409
Kampong Cham 15.8 1.7 17.5 58,785
Takeo 25.6 1.1 26.7 48,773
Banteay Mean Chey 30.2 1.1 31.3 45,186
Kampong Speu 28.2 2.2 30.4 43,069
Siem Reap 18.4 1.3 19.7 31,323
Kampong Th om 19.9 1.2 21.1 26,510
Phnom Penh 8.9 1.7 10.6 23,651
Kampong Chhnang 17.7 1.1 18.8 21,822
Battambang/Krong Pailin 8.9 0.3 9.2 20,417
Mondolkiri/Rattanakiri 35.2 8.3 43.5 14,826
Sihanoukville/Koh Kong 17.7 3.1 20.8 14,275
Pursat 9.9 0.6 10.5 10,347
Preah Vihear/Stung Treng 16.0 1.9 17.9 9,942
Kratie 9.5 4.1 13.6 9,695
Oddar Meanchey 16.5 0.1 16.6 5,004
Overall/TotalNumber
27.1 1514,243
28.6 600,301
Note: Percentages are based on total number of households interviewed.
On the national level households in the lowest and second lowest wealth quintiles are the least likely to have fortifi ed salt (table 32). In Kampot/Krong Kep, iodized salt is easily available and there is little diff erence between wealth quintiles. In Svay Rieng,
the diff erence in coverage between the lowest and highest wealth quintiles is almost 40 percentage points. A similar association is found with use of iodized salt and socio-economic status in Prey Veng although not to the same extent.

67Micronutrient Defi ciencies and Interventions in CambodiaInformation for Improved Programming
Table 32. Percentage of households using iodized salt by wealth quintiles by national domain and selected provinces, CDHS 2005
Province
Wealth Quintile National Prey Veng Svay Rieng Kampot/ Krong Kep
LowestNumber
652,845
40378
10133
37137
SecondNumber
662,884
44368
12152
28163
MiddleNumber
712,884
47293
14154
39188
FourthNumber
762,715
66145
24124
41160
HighestNumber
872,706
6578
5954
4569
Total Number
7314,034
471,263
18617
37716
Overall Moderate
Note: Denominator includes households with salt tested for iodine.
Before universal fortifi cation was mandated in Cambodia, 86% of households did not use iodized salt (table 33). Th ree provinces had signifi cantly better coverage with iodized salt than the national average (Svay Rieng, Mondolkiri/Rattanakiri and Phnom Penh). In Svay Rieng and Mondolkiri/Rattanakiri, these conditions were considered due to imports of iodized salt from Vietnam.
By 2005, the situation reversed for Svay Rieng and Mondolkiri/Rattanakiri. Th e percentage of households not using iodized salt increased in these two domains while it has dropped in all other provinces. Th e lowest numbers of households not using iodized salt were found in Phnom Penh, Pursat and Battambang/Krong Pailin (11% or less).

68 Micronutrient Defi ciencies and Interventions in CambodiaInformation for Improved Programming
Table 33. Percentage of households not using iodized salt by province, CDHS 2000 and 2005
Households without iodized salt or no salt
Province2000 2005 Diff erence
(2005-2000)Percent Number Percent Number
Banteay Mean Chey 96.1 581 31.3 595 -64.9
Kampong Cham 92.8 1,724 17.5 2,012 -75.3
Kampong Chhnang 93.7 477 18.8 544 -74.9
Kampong Speu 97.3 671 30.4 775 -66.9
Kampong Th um 95.8 621 21.1 689 -74.7
Kandal 90.4 1,146 32.2 1,384 -58.1
Kratie 68.9 268 13.6 289 -55.4
Phnom Penh 54.1 993 10.6 1,180 -43.6
Prey Veng 87.4 1,090 52.9 1,278 -34.5
Pursat 91.6 364 10.5 430 -81.1
Siem Reap 94.4 704 19.7 927 -74.7
Svay Rieng 63.3 566 80.8 619 17.5
Takeo 88.5 898 26.7 991 -61.7
Oddar Meanchey 93.6 66 16.6 146 -77.0
Battambang/Krong Pailin 93.2 819 9.2 891 -84.1
Kampot/Krong Kep 87.9 635 63.4 724 -24.5
Sihanoukville/Koh Kong 96.1 289 20.8 320 -75.3
Preah Vihear/Stung Treng 74.3 198 17.9 262 -56.4
Mondolkiri/Rattanakiri 24.4 127 43.5 186 19.1
Overall 86.2 12,236 28.6 14,243 -57.6
Note: Denominator is all households interviewed.

69Micronutrient Defi ciencies and Interventions in CambodiaInformation for Improved Programming
Zinc
Zinc is a critical nutrient for immune function, growth, and development. Th e eff ects of zinc defi ciency range from increased risk of mortality, growth retardation, diminished immune function, skin disorders and cognitive dysfunction (Keusch et al, 2006). Zinc is commonly the most defi cient nutrient in complementary foods fed to infants (Shrimpton et al, 2005).
Zinc treatment in children with diarrhea has been shown to reduce the duration of the illness and prevent subsequent re-infection. While some studies have shown similar positive eff ects of zinc treatment with respiratory infections, conclusions from reviews fi nd the evidence insuffi cient or inconsistent (Brown, 2007). WHO consensus currently recommends zinc for the treatment of diarrhea in children (WHO, 2005) and evidence is growing for more extensive preventive supplementation and fortifi cation with zinc.
In March 2006, Population Services International – Cambodia began a pilot project in Pursat and Siem Reap provinces of social marketing a diarrhea treatment kit of oral rehydration salts (ORS) packaged with a 10-day treatment of zinc supplements. Th is ground breaking project distributed the diarrhea treatment kit through market channels and through health volunteers of RACHA and Red Cross. While the project was not evaluated with rigorous quantitative methods, it was considered a very successful method to deliver ORS plus zinc to caregivers of sick children. Th e pilot ended and national implementation of ORS plus zinc was planned, but the 2007 national budget approved by Ministry of Finance did not include zinc (included on the essential drug list) and the intervention has stalled.
Th e updated Integrated Management of Childhood Illness (IMCI) guidelines for Cambodia (2006), prescribe oral rehydration salts (ORS) and a 10-day treatment of zinc supplements for diarrhea treatment. Health workers are supposed to give the initial treatment at the health center and have caregivers give the remaining tablets at home. Th ere is no policy on preventive zinc supplementation, but it is likely that zinc will be included in multi-micronutrient supplements for women and children in the future.
Th ere is no population data on zinc defi ciencies in Cambodia. Th e risk of zinc defi ciency in children is estimated through proxy measures. Th e next section on zinc treatment provides analysis on diarrhea prevalence and the quantities of zinc needed.

70 Micronutrient Defi ciencies and Interventions in CambodiaInformation for Improved Programming
Zinc Defi ciency
In Cambodia, only one study has measured serum zinc in severely stunted children (-3 SD Height for Age) in a Phnom Penh slum. Despite expectations for all children to be defi cient, only three-quarters of the children were found to have low serum zinc concentrations (<9.9 μmol/L - Jack, 2005).
Globally, there is little biochemical data available to assess the prevalence of zinc defi ciency. Th ere is no ideal measure for assessment of small changes of zinc status in individuals but serum zinc concentrations can be used for population zinc status measures (Brown, 2007). Iron defi ciency is often found along with zinc defi ciency as both minerals are found in the same food sources and absorption is modified by the same dietary components. Iron and zinc defi ciencies are expected to follow similar patterns in a population (IZiNCG, 2004). New guidelines for assessing population zinc status suggest that stunting can be used as a proxy indicator of zinc defi ciency where serum zinc concentrations or dietary zinc intake data is not available.
Th e International Zinc Nutrition Consultative Group (IZiNCG) used national prevalence of stunting and dietary assessment to estimate the risk of zinc defi ciency. Th is assessment stated that Cambodia had the highest percentage of population at risk of zinc defi ciency in SE Asia (44% - IZiNCG, 2004). Th is analysis was based on population counts from the early 1990’s and an unnamed source of national data on zinc and phytate content in Cambodian foodstocks.
Use of current estimates of stunting is more likely to provide accurate conditions of zinc defi ciency in children. All provinces had a prevalence of stunting above 20%, which is the cut-off point for high risk of zinc defi ciency (table 34). Th e provinces with highest prevalence of children at risk of zinc defi ciency were Pursat, Siem Reap and Mondolkiri/Rattanakiri, and Siem Reap (58% or higher). Th e results from Pursat province should be interpreted with care, and further detail is given in the anthropometry section in the Annex. Th e provinces with the most children at risk are Kampong Cham, Prey Veng, and Siem Reap with almost 60,000 children or more at risk per province. In total, close to 650,000 children under fi ve are stunted and at high risk of defi ciency.
Zinc Defi ciency Summary Points
Prevalence: Cambodia is estimated to have among the highest rates of zinc deficiency in children in SE Asia (prevalence of stunting - 43%). An estimated 647,000 children under fi ve years of age are zinc defi cient.
Geographic Distribution: Every province in Cambodia is at a high risk for zinc defi ciency (>20% stunting). Th e provinces with the highest estimated rates of zinc defi ciency are Pursat, Siem Reap and Mondolkiri/Rattanakiri. Th e provinces with the most children with zinc defi ciency are Kampong Cham, Battambang/Krong Pailin, and Siem Reap.
Populations at Risk: Children from 6 to 18 months of age are considered to have the greatest need for zinc treatment as this is when the combined effects of malnutrition and disease cause permanent damage or death in children. Zinc deficiency is higher among children from the poorest households and of mothers with no education.
Trend: Zinc defi ciency is likely to have decreased slightly as the prevalence of stunting declined from 50 to 43% from 2000 to 2005. This shows a slight improvement but is over two times the prevalence given as a cut-off for high risk of zinc defi ciency (20%).

71Micronutrient Defi ciencies and Interventions in CambodiaInformation for Improved Programming
ProvincePercent of children
at risk of zinc defi ciency
NumberNumber of children
at risk of zinc defi ciency
Kampong Cham 43.3 305 77,202Siem Reap 58.1 135 60,844Battambang/Krong Pailin 46.7 93 56,718Prey Veng 41.0 175 48,312Takeo 44.7 104 46,947Kandal 31.1 303 39,990Pursat 64.1 197 35,509Kampong Th om 45.1 223 33,444Kampot/Krong Kep 38.6 88 33,176Kampong Speu 39.6 236 32,308Banteay Mean Chey 37.9 370 31,531Kampong Chhnang 41.8 252 29,262Svay Rieng 45.6 137 23,818Phnom Penh 24.1 188 21,003Kratie 42.0 88 19,687Preah Vihear/Stung Treng 51.4 68 18,726Sihanoukville/Koh Kong 39.5 87 16,372Mondolkiri/Rattanakiri 57.8 40 12,907Oddar Meanchey 50.8 266 8,835
Overrall/Total 42.6 3,356 646,591
Note: Percent at risk of zinc defi ciency is percent stunted (-2 SD HAZ).
Th e risk of zinc defi ciency (stunting) is aff ected by age but cannot be interpreted straight-forwardby the rates by age groups below (table 35). For children from 6 to 18 months of age, the risk is highest while the numbers are lowest (less than 15%). Although the risk increases rapidly until 18 months of age (51%), by the time that the child reaches 18 months, the damage is underway. It is very diffi cult for children to recover from stunting without strong, well managed eff ective treatment of malnutrition programs, which are rare.
Th e risk of zinc defi ciency is associated with maternal education. Th e least educated mothers have children with the highest risk of zinc defi ciency (52%) while the best educated have children with the lowest risk (27%). Zinc defi ciency
Table 34. Prevalence and counts of number of children aged 0-59 months at risk of zinc defi ciency by province, CDHS 2005
also is likely twice as common among children from poor households (23%) compared to rich households (52%).
Th e risk of zinc defi ciency is at or above 20% in every maternal education and socio-economic category. Th is can be interpreted that all Cambodian children are at high risk for zincdefi ciency and blanket supplementation is needed. While small studies have demonstrated positive eff ects of zinc supplementation in children, the two largest studies of zinc supplementation in children in Pemba, Tanzania and southern Nepal with sample sizes of 25,000 and 29,000, respectively have not shown any signifi cant eff ects on morbidity or mortality (Sazawal et al, 2007: Tielsch et al 2006).

72 Micronutrient Defi ciencies and Interventions in CambodiaInformation for Improved Programming
Table 35. Prevalence of children aged 0-59 months at risk of zinc defi ciency by background characteristics, CDHS 2005
Percent of children at risk of zinc defi ciency
Age in months Percent Count
<6m 14.7 319
6-8m 12.7 172
9-11m 22.5 177
12-17m 39.9 349
18-23m 50.5 376
24-35 47.9 654
36-47m 53.1 684
48-59m 50.7 626
Mother’s education
No education 51.6 806
Primary 43.5 1960
Secondary or higher 27.4 590
Wealth index
Poorest 52.4 838
Poorer 47.3 748
Middle 44.6 638
Richer 39.4 561
Richest 23.1 570
Total 42.6 3356
Note: Percent at risk of zinc defi ciency is percent stunted (-2 SD HAZ).
Zinc treatment of diarrhea has been demonstrated to be eff ective. Distribution of zinc tablets packaged with ORS in diarrhea treatment kits began in two provinces of Cambodia. Th is combinedtreatment was well received in these provinces, often replacing the misuse of antibiotics or
intravenous fl uids given by public and private health providers. Th is intervention desperatelyneeds to be made available on the national level along with education on treatment of diarrhea to caregivers and health providers.

73Micronutrient Defi ciencies and Interventions in CambodiaInformation for Improved Programming
Th e CDHS provides information on the geographical distribution of diarrhea. Th e question on diarrhea in the DHS asks about the two weeks prior to the interview; results can be viewed as the prevalence/number of children that have diarrhea in a two-week period. Th e national prevalence of diarrhea in a two-week period is 19.5% according to the CDHS 2005; this is virtually unchanged from the 2000 prevalence of 18.9% and corresponds to ~ 300,000 children under-5. Kampong Cham, Preah Vihear, Stung Treng, and Prey Veng have the highest prevalence of diarrhea. Provinces with the most cases of diarrhea include Kampong Cham, Prey Veng, and Kandal.
Diarrhea Summary Points
Prevalence: In 2005, the prevalence of diarrhea in children in a two-week period was 20%, representing almost 300,000 children under 5 years of age.
Geographic Distribution: Children in Kampong Cham, Preah Vihear/ Stung Treng, and Prey Veng had the highest prevalence of diarrhea. Th e provinces with the largest numbers of children under 5 with diarrhea were Kampong Cham and Prey Veng.
Populations at Risk: Th e prevalence of diarrhea was highest among children 6 to 23 months of age. Children of more educated mothers and from households of higher socio-economic status had slightly lower prevalence of diarrhea, but it was common among all children.
Trend: No change in the prevalence of diarrhea was identifi ed between 2000 and 2005. Th e two DHS surveys were done at diff erent times of the year. Th e month of the year clearly aff ected the prevalence of diarrhea.
In Cambodia, there is a great need for improved water and sanitation services and hygiene practices to prevent diarrhea. An enormous number of children are continually becoming sick with diarrhea in any given two week period. In Kampong Cham, over 50,000 children under 5 have diarrhea in a two week period. Th ese children would benefi t from the use of diarrhea treatment including zinc tablets.
Zinc Treatment for Diarrhea

74 Micronutrient Defi ciencies and Interventions in CambodiaInformation for Improved Programming
Table 36. Prevalence and counts of diarrhea in children under fi ve in the two weeks preceding the survey by province, CDHS 2005
Province
Percent of children with diarrhea
in the two weeks preceding the
survey
NumberNumber of
children withdiarrhea
Kampong Cham 30.0 880 53,513
Prey Veng 27.2 562 32,073
Battambang/Krong Pailin 18.3 492 22,210
Kandal 17.2 635 22,147
Banteay Mean Chey 22.3 316 18,539
Kampong Th om 25.0 369 18,527
Phnom Penh 18.4 598 16,059
Siem Reap 14.3 626 14,986
Pursat 24.8 205 13,746
Kampong Speu 16.4 433 13,368
Kampong Chhnang 16.9 293 11,845
Takeo 11.2 460 11,755
Kratie 22.6 178 10,584
Preah Vihear/Stung Treng 28.0 194 10,207
Kampot/Krong Kep 11.0 363 9,466
Svay Rieng 9.8 236 5,115
Mondolkiri/Rattanakiri 21.1 147 4,713
Sihanoukville/Koh Kong 8.8 191 3,647
Oddar Meanchey 13.8 92 2,398
Overrall/Total 19.5 7,271 294,898
In 2005, caregivers did not regularly contact health centers for treatment of diarrhea in their children. Only just over one third of children under 5 were taken to a health provider for treatment and of these children, only one third went to the public sector (CDHS 2005). For the 300,000 children with diarrhea only about 38,000 received treatment from the public health sector. Th e challenge of achieving high coverage rates through the public
sector with diarrhea treatment kits with zinc tablets supplementation is formidable, and is only one way to reach sick children. A successful social marketing campaign of the diarrhea treatment kit that PSI developed would be the type of public-private partnership that would deliver the product to the caregiver and child and change treatment behaviors in caregivers and health care providers.

75Micronutrient Defi ciencies and Interventions in CambodiaInformation for Improved Programming
Where the risk of zinc defi ciency (stunting) by agein months does not clearly identify when zinc is lacking, the prevalence of diarrhea is more useful. Table 37 shows that the prevalence of diarrhea is high at less than 6 months of age (18%) but it reaches its highest point at 6 to 11 months of age (32%). Zinc treatment for diarrheais critical for children 6 months and older. Studies have shown that zinc treatment before 6 months of age does not provokethe same positive outcomes (Brown, 2007).
It is interesting to note that maternal education andsocio-economic status aff ect the prevalence of diarrhea, but not as strongly as the child’s age in months. Children of uneducated mothers are one-third more likely to have diarrhea than children of mothers with secondary or higher education. Children from households of the lowest wealth quintiles are about two-thirds more likely to have diarrhea compared to children from households of the highest wealth quintile. Children aged 6 to 11 months are more than 3 times as likely to have diarrhea compared to children aged 48 to 59 months. Diarrhea is a common problem in the majority of children in Cambodia and special attention is needed to address the devastating interaction of disease and malnutrition when exclusive breastfeeding ends at six months of age.
Th e prevalence of diarrhea is strongly aff ected by seasonality. Th is has the potential to aff ect trend estimates as the CDHS 2000 and 2005 were carried
Table 37. Diarrhea Prevalence of Children Under-5 Years by Socio-Economic Characteristics
Percent of children with diarrhea in the two weeks preceding
the survey
Number
EducationNo Schooling 21.4 1,730Primary 19.9 4,288Secondary + 15.7 1,253Wealth QuintileLowest 22.4 1,945Second 20.8 1,646Middle 19.8 1,276Fourth 18.3 1,176Highest 14.1 1,228Age in Months0 to 6 17.7 7436 to 11 31.8 77312 to 23 27.9 1,51724 to 35 20.4 1,41836 to 47 13.6 1,43048 to 59 9.8 1,389Overrall 19.5 7,271
out at diff erent times of the year. Th e prevalence of diarrhea by month (fi gure 18) shows the highest rates in the dry season (from January to March). Th e seasonal trend is not complete due to a lack of data in August, but shows a decline from the highest rates in the dry season (January and February) to the lowest rates in the rainy season (May and June). Th e highest rates of diarrhea in the dry season may be related to the low quantity and poor quality of water in the dry season. Similar trends with diarrhea have been found in community based surveillance of measles and diarrhea in four Cambodian provinces (Oum, 2005) and in neighboring Th ailand (Jiraphongsa, 2005). Both of these studies show diarrheal disease peaks in January and is least common in July.

76 Micronutrient Defi ciencies and Interventions in CambodiaInformation for Improved Programming
0
5
10
15
20
25
30
January
February
MarchApril
MayJu
neJu
ly
August
Septem
ber
October
November
Decem
ber
2000
2005
Percen
Figure23. Diarrhea prevalence by month and year of survey, CDHS 2000 & 2005
Stocks of zinc tablets packaged with with ORSare not currently available in Cambodia for diarrhea treatment. Th is treatment method has been well documented and advocated for strongly in its own WHO statement. Now Cambodia desperately needs to procure zinc tablets and begin eff ective implementation of this intervention. Considering the seasonality of
diarrhea, the stocks should be secured by June or July to prepare for the increasing incidence of diarrhea as the year comes to an end. Strong advocacy should be made to the governmental sections who allocate budget for essential medicines to ensure that zinc tablets are procured in 2008 to avoid the lost opportunities for child survival that occurred in 2007.

77Micronutrient Defi ciencies and Interventions in CambodiaInformation for Improved Programming
Th is research set out to quantify the current status of anemia, micronutrient defi ciencies, and the public health interventions designed for their treatment or prevention. Although this document presents a lot of information on these topics, it is far from comprehensive. Additional analysis on the available data sources can provide more information. For each topic, coverage estimates, geographic distribution, at-risk populations, and trends have been quantifi ed. Data quality was reviewed and in-depth analysis on the diff erent indicators revealed various issues. Th e conclusions begin with cross-cutting issues which are presented along with related recommendations under the following headings:
Eg a) Improving the quality b) Inequity and low coverage c) Formalizing community d) Preventable anemia
Th e section on cross-cutting issues is followed by recommendations for issues aff ecting individual topics.
Cross- Cutting Issuesa) Improving the Quality of Information
Cambodia Demographic and Health Survey
Th e analysis of the two CDHS surveys showed that the methods used to calculate and report indicators on micronutrient interventions were not consistent. Th e survey question for some indicators changed from 2000 to 2005. In addition to this inconsistency, there are also problems with “don’t know” responses for the following indicators:
Vitamin A Supplementation in children in the past 6 months Recommended IFA supplementation (90+ tablets) during pregnancy Deworming in children in the past 6 months
Th is research set out to quantify the current status of anemia, micronutrient defi ciencies, and the public health interventions designed for their treatment or prevention. Although this document presents a lot of information on these topics, it is far from comprehensive. Additional analysis on the available data sources can provide more information. For each topic, coverage estimates, geographic distribution, at-risk populations, and trends have been quantifi ed. Data quality was reviewed and in-depth analysis on the diff erent indicators revealed various issues. Th e conclusions begin with cross-cutting issues which are presented along with related recommendations under the following headings:
Eg a) Improving the quality b) Inequity and low coverage c) Formalizing community d) Preventable anemia
Conclusions

78 Micronutrient Defi ciencies and Interventions in CambodiaInformation for Improved Programming
With vitamin A supplementation in the CDHS 2005, we found that not adjusting for the answer “don’t know” when and issues of maternal recall led to a signifi cant underestimation of the coverage.
Other indicators were not signifi cantly aff ected by the “don’t know” when or how many responses because of low coverage. Th is situation could change as coverage of the interventions improves over time. Th is is made more likely by the fi nding that the subpopulation of women most likely to receive iron supplementation are also the most likely to respond “don’t know.”
Th e three indicators above have a commonproblem of respondents responding “don’t know”. Th e “don’t know” category is treated diff erently in calculation in each of the three indicators. For vitamin A, the “don’t know” when responses are added to the “No” category. For iron supplementation, the “don’t know” how many responses are kept separate for indicator calculation and are present in the report table. For deworming the “don’t know” when responses are not included in calculation of the indicator and not includedin the report table.
Th e diff erent methods used with the “don’t know” responses could greatly aff ect coverage estimates. The changing of methods complicates intepretation. A common method for calculating indicators with “don’t know” responses is needed.
In the next CDHS special training to interviewers on nutrition indicators could help to reduce the number of “don’t know” answers from respondents. Th e questionnaire can be shortened to reduce the answer fatigue that the respondent suff ers during a 60 to 90 minute interview. Th e CDHS alsoshould be focused more on the known documented causes of morbidity and mortality and their interventions and away from the donor driven agenda evident in the past.
Health Information System
Currently, the Cambodian Health Information System does not accurately measure delivery of interventions. While not detailed extensively here, evidence of HIS data quality issues raises serious questions of its validity. Every month, the HIS collects large amounts of data related to nutrition and is currently the only regular source of data that is representative below the provincial level. To improve data quality, the data should be used and reviewed on a regular basis. A new analysis database currently under development by A2Z and RACHA will provide the NNP with routine nutrition indicators calculated from HIS data. Th is will put the data into use and consistent review and feedback will help to improve data quality. External validation of HIS data is also needed to improve data quality.
Th is research shows that the HIS likely overestimates vitamin A supplementation coverage. Th ree possible causes of overestimation (inaccurate target populations, double counting, supplementing outside the target group) are presented in this report. Results from the planned census will help to improve the target population numbers.
Th e issue of double counting could be addressed if all supplementation was completed in the same month throughout the country. Th is is diffi cult as some health operational districts begin the month before or fi nish the month after the planned vitamin A supplementation month. Reducing the allotted time for supplementation activities could help, but there is concern that this would put a heavy burden on the outreach workers who normally work as public health providers in the morning and private providers in the afternoon.

79Micronutrient Defi ciencies and Interventions in CambodiaInformation for Improved Programming
Supplementation outside the target group is difficult to address. High dose vitamin A supplementation of women outside the target time period is dangerous. Further research is needed to determine the extent of vitamin A supplementation outside of target groups for both children and post-partum mothers. New national and international recommendations recommend post-partum mothers receive a high-dose vitamin A supplement only up to six weeks after delivery to prevent the chance of vitamin A related birth defects. Research on deworming during prescribed periods is also important. If problems are identifi ed, improved training of health workers with appropriate materials should immediately address the issue.
Monitoring Biannual Interventions
Even if the CDHS were to provide an accurate estimate for all indicators, it is only representative down to the province or province group level and is conducted only every fi ve years. It is not designed to monitor biannual interventions. To monitor biannual interventions, a low-cost, accurate measure on the appropriate level is needed.
Lot Quality Assurance Sampling (LQAS) methods using a questionnaire with improved questions on vitamin A supplementation implemented immediately after the supplementation round would fi t this need. A standardized method can replace the more expensive survey tools that NGOs have used to monitor individual programs. Th e data collected from a standardized LQASmethod could also be used to validate and strengthen the HIS.
b) Inequity and Low Coverage
Th is analysis shows great variation in delivery of interventions by province and socio-economic status. Th e most disturbing fi nding is that the Cambodian women and children who are most in need of micronutrient and deworming interventions are the least likely to receive them. Th e great inequities in the delivery of child
survival interventions were fi rst documented in the data from 2000 and continue to be evident today. Th e micronutrient interventions in this report are promoted for all women and children but it is critical to realize that anemia and micronutrient defi ciencies will not decrease unless the population in need receives the appropriate interventions.
In addition to focusing on those most in need, programs must strive to reach as many people as possible in order to achieve the best possible improvements in health outcomes. Th e coverage of almost all interventions reviewed is unacceptably low. Only half of children and one-third of post-partum women receive vitamin A. Two-thirds of all targeted populations do not receive deworming or iron supplementation. Th e easiest way to increase universal coverage is to provide for the easy-to-reach populations, but the populations that will benefi t the most from preventive interventions often are not those who are easy-to-reach.
As resources permit, the best solution is to focus on both maximizing coverage and ensuring prevention in the most vulnerable populations. Th is can be achieved by setting dual target goals, standardizing implementation and removing barriers to access and use.
Th e current MoH target goals for vitamin A, iron supplementation and deworming focus on overall coverage. Th is does not help to target the individuals who have the strongest need for these interventions. A dual target goal, that is a second goal of reaching a set percentage of those in the lowest wealth quintiles could help to target those most in need.
Th e lack of a standard system for implementation contributes to the provincial variation of coverage. Th ere is a strong need for the National Nutrition Program to produce a standard implementation plan with all government partners and begin implementation in all operational districts according to the plan. A key to the standardized implementation, the communication strategy on vitamin A and iron supplementation is currently being developed by the NNP, WHO,

80 Micronutrient Defi ciencies and Interventions in CambodiaInformation for Improved Programming
and A2Z. As demand from the household and community level increases and is coupled with regular provision of services from health providers, coverage will improve. From that point, eff orts can begin to focus on maintenance of high rates of coverage.
Barriers to high coverage exist on supply-side and receiving-side. On the supply side stock-outs, poor knowledge on work responsibilities and staffi ng problems has been identifi ed. Research on the supply chain and distribution of vitamin A, iron and mebendazole can help to address stock-outs. Standardized implementation plans and improved ownership on the operational district and health center level is needed to address staffi ng and job responsibility issues.
On the receiving side, barriers to high coverageinclude diffi cult access to health services, insuffi cient community mobilization, poor knowledge about the interventions and reduced contact with health providers after a child reaches one year of age. Community health volunteers could signifi cantly address these issues if given the responsibility.
c) Formalizing the Role of Community Health Volunteers
As more household and community level interventions are recommended and adopted, the requirements for implementation are less in the hands of facility based workers. Curative zinc treatment for diarrhea and daily in-home multi-micronutrient fortifi cation of complementary food must be done in the household. Th ese interventions require new delivery strategies.
One strategy is to formalize the roles and responsibilities of community health volunteers. Th is process is beginning. Th e 2007 revised vitamin A policy defi ned a role for community health volunteers in the delivery of vitamin A
capsules. Integrating community health volunteers as paid staff of the health system and increasing their accountability through monitoring could have a large impact to improve programs. Th e costs of this strategy would be more expensive than the current system, but the investment in successful programs would reap large returns in terms of health, development and economic gain.
d) Preventable Anemia
Th e terms used in regular discussion of anemia (and micronutrient defi ciencies) can marginalize the issue to the hands of a few persons working in nutrition. Th e label of iron defi ciency anemia or nutritional anemia implies that the problem can be solved by nutrition interventions alone. Th is is not the case. A comprehensive integrated approach to anemia prevention (and child health) needs commitment from more than the National Nutrition Program and a condition that is framed as a nutritional issue is not likely to get the attention it deserves from other ministries and departments.
Programs need to focus on preventable causes of anemia within child health programs and secure involvement from both the government and the general public. Th e interventions including improved sanitation, access to potable water, ORS plus zinc treatment of diarrhea, rotavirus vaccine, bed nets and proper antibiotic treatment of ARI should be integrated into the health actions. For progress to be made with nutrition, strong collaboration is needed between health workers,national programs and organizations working in child survival, rural development, water and sanitation, food safety, education and several other sectors. To secure the involvement of all these diff erent sectors, clear and understandable terms to defi ne the issues must be used.

81Micronutrient Defi ciencies and Interventions in CambodiaInformation for Improved Programming
Methods
Number of Households and Children
Th e national and provincial population estimates of Cambodia were taken from estimates calculated by the National Institute ofStatistics (NIS). Th ese population counts originated from the 1998 Census and were updated from the Cambodian Intercensal Population Survey of 1994.
Th e number of households in each province was calculated by dividing the NIS population estimates by the mean household size from the CDHS 2005.
Th e population of each province is an average of NIP estimates of2005 and 2006 because the CDHS 2005 was conducted from September 2005 to February of 2006. Population estimates for specifi c age groups of children are based on the NIS population estimates and percentage of population in the specifi c age groups from the CDHS 2005.
Table 38. Population counts by province. NIS 2005
January 2006
Province(s) PopulationEstimates
Banteay Mean Chey 722,897
Kampong Cham 1,682,799
Kampong Chhnang 579,228
Kampong Speu 708,778
Kampong Th om 628,048
Kandal 1,262,377
Kratie 357,492
Phnom Penh 1,118,942
Prey Veng 1,081,780
Pursat 494,889
Siem Reap 793,907
Svay Rieng 527,229
Takeo 912,664
Oddar Meanchey 151,127
Battambang/Krong Pailin 1,113,449
Kampot/Krong Kep 693,982
Sihanoukville/Koh Kong 342,531
Preah Vihear/Stung Treng 278,275
Mondolkiri/Rattanakiri 170,497
Total 13,620,889
Methods
Number of Households and Children
Th e national and provincial population estimates of Cambodia were taken from estimates calculated by the National Institute ofStatistics (NIS). Th ese population counts originated from the 1998 Census and were updated from the Cambodian Intercensal Population Survey of 1994.
Table 38. Population counts by province.NIS 2005
January 2006
Province(s) PopulationEstimates
Banteay Mean Chey 722,897
Kampong Cham 1,682,799
Kampong Chhnang 579,228
Kampong Speu 708,778
Kampong Thom 628 048
Annexes

82 Micronutrient Defi ciencies and Interventions in CambodiaInformation for Improved Programming
Methods used for vitamin A analysis
Imputation and selecting cases from one month post supplementation round
Th e three issues related to calculation of child vitamin a supplementation within the last six months include: “don’t know” response, recall bias, and date heaping. Th ese issues are addressed by limiting analysis to mothers responding in December and imputation.
Th e 2005 CDHS was carried out from September of 2005 to March of 2006. Th ere was one vitamin A supplementation month during this time period, and it took place in November of 2005. December is selected to reduce the time between interview and supplementation, which will help to limit the eff ects of recall bias and date heaping. Approximately 1/3 of mothers reply “don’t know” to the second question of a series of two questions used to calculate the indicator of child vitamin A supplementation within the last 6 months. Th ese children are then included in the “no” category for indicator calculation, which under-estimates coverage because some of these children are likely to have been supplemented in the last six months. Imputation, predicting a response for those mothers who reported “don’t know,” is used to correct this problem.
Selecting only mothers interviewed in December and imputing values for those that reply “don’t know” provides an estimate of coverage. Th e number of months since the last supple-mentation is predicted for all of the mothers interviewed in December responding “yes” to the fi rst question (has (child) ever received a vitamin A dose like this?) and “don’t know” to the second question (how many months ago did (child) take the last dose?).
For the entire survey 6,525 mothers were asked the fi rst question on child vitamin A supplementation. Selecting only mothers interviewed in December reduces this number to 1,160. Of these mothers, 882 reply “yes” and are asked the second question.
Th e remaining 278 mothers are included in the denominator for calculation of the indicator and are not asked the second question. Of the 882 mothers asked the second question in December, 515 give a month within the last six months, 166 give a month more than six months ago, and 201 reply “don’t know.” Th e number of months since the last supplementation is predicted for the 201 mothers responding “don’t know.” Th e following determinants are used for prediction:
child’s age, child’s sex, breastfeeding status, urban/rural residence, mother’s education, mother’s age, socio-economic status, mother received vitamin A, last visit to health center.
After imputing, 63 of the 201 predicted values are within the last six months. Th ese are added to the 515 that gave a month within the last six months to form the numerator for indicator calculation. Th is makes a total of 578 within the last six months over the total number of child cases - 1160. For 2005, this method increases the coverage from 34% the reported in the CDHS to a new estimate of 50%.
A limitation to imputation is that it does not control for the necessary assumption that women who respond “don’t know” are diff erent from those that give a fi gure. Another limitation to predicting values is that much of the variability in supplementation can not be explained. In this case, the selected determinants used for imputation only explain 10% of the variation (not shown).
A limitation to only using interviews from December is that despite including mothers from all provinces, the survey is less robust in terms of national representation. Domains that collected data from groups of provinces will show only data from the province where data was collected in December. Th e domains of groups of provinces are those with low population so the outcomes do not strongly aff ect the national estimates. December respondents are not statistically diff erent from those interviewed in other months with respect to age, wealth, and education (table 39) as shown by probit regression on the month of December (table 40).

83Micronutrient Defi ciencies and Interventions in CambodiaInformation for Improved Programming
Testing for Interactions and Collinearity in Regression Analysis
Regression analysis used to evaluate the associations between individual characteristics and vitamin A supplementation included analysis on interactions and collinearity of the independent variables.
Table 39. Mean age of child, household wealth quintile, respondent’s age and education by month of interview categorized into December and all months of data collection, CDHS 2005
Mean Number
Age of Child in Months
December 29.2 1,592
Other Months 29.4 6,698
Wealth Quintile
December 2.66 1,592
Other Months 2.73 6,698
Age of Respondent
December 9.6 1,592
Other Months 29.9 6,698
Years of Education
December 3.45 1,592
Other Months 3.46 6,696
Total 8,288
Table 40. Probit Regression of the Month of December on Child’s Age, Wealth, Respondent’s Age and Education
Independent Variables Coeffi cient P-ValueAge of Child in Months <-.01 0.76
Wealth Score <.01 0.94
Age of Respondent <-.01 0.31
Year of Education <.01 0.89
Dependent Variable = Months of DecemberNumber ,288
Interaction variables were created by multiplying each predictor variable with every other predictor variable. Th ese interactions variables were then included in a regression and none were found to be signifi cant. Collinearity was tested for using a STATA postestimation command, collin, provided by the Academic Technology Services of UCLA. No independent variables had a VIF value meriting further attention (above 10).

84 Micronutrient Defi ciencies and Interventions in CambodiaInformation for Improved Programming
Anthropometry
Th e anthropometry indicators below were calculated according to WHO Child Growth Standards (WHO, 2007) using data from both the CDHS 2000 and CDHS 2005.
Table 1. Percent distribution of valid anthropometry Z- scores by province, CDHS 2005
Valid data
Child died
Invalid/ missing
dataTotal Weighted Un-
weighted
Province Percent Percent Percent Percent Count Count
Pursat 76.4 7.7 15.9 100.0 115 195Banteay Mean Chey 80.9 6.8 12.4 100.0 167 204Krong Preah 83.8 3.9 12.3 100.0 104 223Sihanouk & Koh Kong 88.0 4.7 7.3 100.0 302 171Phnom Penh 86.0 7.2 6.8 100.0 79 335Mondolkiri/Rattanakiri 82.1 11.6 6.3 100.0 127 157Svay Rieng 85.4 8.8 5.8 100.0 276 169Prey Veng 89.6 4.8 5.6 100.0 338 179Kandal 90.3 4.5 5.2 100.0 338 274Siem Reap 86.6 8.4 5.0 100.0 217 242Kampong Th om 79.0 16.1 4.9 100.0 51 238Oddar Meanchey 83.6 11.6 4.8 100.0 105 292Preah Vihear & Steung Treng 85.7 10.0 4.3 100.0 432 162Kampong Cham 87.1 9.8 3.1 100.0 157 220Kampong Chhnang 89.6 7.3 3.1 100.0 104 263Kratie, Kampot & Krong Kep 88.5 8.5 3.0 100.0 198 204Battambang & Krong Pailin 90.3 7.2 2.6 100.0 279 223Kampong Speu 92.5 5.1 2.4 100.0 213 215Takeo 93.9 5.4 0.7 100.0 238 191Total 87.4 7.3 5.3 100.0 3841 4157
For accurate measures of anthropometry, it is important to demonstrate that a high percentageof children selected were successfully measured. Half of all households were selected for anthropometry. In those households, an average of 7.3 % of children had died. An average of 5.3 % had invalid or missing data. Most provinces have an acceptable percentage of invalid or missing data, except for three. Pursat has three times the percentage of invalid or missing data (15.9%) compared to the national average while Banteay Mean Chey, and Sihanoukville/Koh Kong (12%) have over twice the national average. Th ese data should be considered less representative of these provinces than the other provinces on the whole.
Another method to review data quality is to observe the mean and standard deviation of the Z-scores. Th e standard deviation of the height for age Z-score for Pursat province (1.9) is the highest of all provinces and signifi cantly higher than the national total standard deviation (1.3)indicating a greater variety of height measures in the distribution and poorer quality data. Th e height measures of Pursat province also aff ectthe weight for height and BMI Z-scores. Th e standard deviations for the weight for height and BMI Z-scores (1.9 and 1.8 consecutively) are almost twice the national average (both 1.1) also indicating poor quality data.

85Micronutrient Defi ciencies and Interventions in CambodiaInformation for Improved Programming
Table 2. Mean and standard deviation of valid anthropometry Z scores by province. CDHS 2005
Standard Deviations (SD)
Province Weight for age SD
Weightfor age SD
Weight for height SD
BMI for age SD
Banteay Mean Chey MeanStd. Deviation
1.31.0
-1.6 1.1
-0.50.9
-0.30.9
Kampong Cham MeanStd. Deviation
-1.51.1
-2.01.2
-0.61.1
-0.31.0
Kampong Chhnang MeanStd. Deviation
-1.51.0
-1.81.2
-0.70.9
-0.50.9
Kampong Speu MeanStd. Deviation
-1.40.9
-1.71.1
-0.71.0
-0.51.0
Kampong Th om MeanStd. Deviation
-1.61.0
-1.91.2
-0.71.0
-0.51.0
Kandal MeanStd. Deviation
-1.41.0
-1.41.4
-0.81.0
-0.71.1
Kratie MeanStd. Deviation
-1.51.1
-1.91.4
-0.60.9
-0.40.9
Phnom Penh MeanStd. Deviation
-1.01.1
-1.21.3
-0.41.2
-0.31.2
Prey Veng MeanStd. Deviation
-1.61.1
-1.71.2
-0.91.1
-0.71.1
Pursat MeanStd. Deviation
-1.61.1
-2.51.9
-0.21.9
0.01.8
Siem Reap MeanStd. Deviation
-1.71.0
-2.21.3
-0.61.1
-0.41.1
Svay Rieng MeanStd. Deviation
-1.60.9
-1.81.3
-0.71.2
-0.51.3
Takeo MeanStd. Deviation
-1.51.0
-1.81.3
-0.61.2
-0.51.2
Oddar Meanchey MeanStd. Deviation
-1.61.0
-1.91.3
-0.70.9
-0.51.0
Battambang & Krong Pailin MeanStd. Deviation
-1.31.0
-1.71.4
-0.51.2
-0.31.1
Kampot & Krong Kep MeanStd. Deviation
-1.31.0
-1.61.2
-0.60.9
-0.40.9
Sihanoukville & Koh Kong MeanStd. Deviation
-1.51.1
-1.81.5
-0.60.9
-0.41.0
Preah Vihear & Stung Treng MeanStd. Deviation
-1.81.0
-1.91.2
-0.90.9
-0.81.0
Mondolkiri/Rattanakiri MeanStd. Deviation
-2.01.2
-2.51.5
-0.71.0
-0.51.1
Total MeanStd. DeviationN
-1.51.0
3356
-1.81.3
3356
-0.61.1
3356
-0.5 1.1
3356

86 Micronutrient Defi ciencies and Interventions in CambodiaInformation for Improved Programming
Figure 1. Histogram of Height for Age Z-scores ( Stunting), CDHS 2005
Figure 2. Histogram of Weight for Age Z- scores ( Underweight), CDHS 2005
zhaz
Freq
uenc
y
Cases weighted by wgting
Mean = -1.7806Std. Dev. = 1.33805N = 3,356
6.004.002.000.00-2.00-4.00-6.00
300.00
250.00
200.00
150.00
100.00
50.00
0.00
zhaz
Freq
uenc
y
Cases weighted by wgting
Mean = -1.4606Std. Dev. = 1.04618N = 3,356
4.002.000.00-2.00-4.00-6.00
400.00
300.00
200.00
100.00
0.00

87Micronutrient Defi ciencies and Interventions in CambodiaInformation for Improved Programming
Figure 3. Histogram of Weight for Height Z - scores ( Wasting), CDHS 2005
Figure 4. Histogram of Body Mass Index Z -Scores, CDHS 2005
zhaz
Freq
uenc
y
Cases weighted by wgting
Mean = -0,6298Std. Dev. = 1,086N = 3,356
4.00 6.002.000.00-2.00-4.00-6.00
400.00
300.00
200.00
100.00
0.00
zBMI
Freq
uenc
y
Cases weighted by wgting
Mean = -0,4582Std. Dev. = 1,0827N = 3,353
4.00 6.002.000.00-2.00-4.00-6.00
400.00
300.00
200.00
100.00
0.00

88 Micronutrient Defi ciencies and Interventions in CambodiaInformation for Improved Programming
Table 3. Prevalence of malnutrition indicators by background characteristics, CDHS 2005
Stunted (<-2SD HAZ)
Underweight (<-2SD WAZ)
Wasted (<-2SDWHZ)
Low Body Mass Index
(<-2SD Z-BMI)
Age in months Percent Percent Percent Percent Count
<6 m 14.7 13.5 13.3 13.8 319
6-8m 12.7 10.7 9.1 11.0 172
9-11m 22.5 28.4 17.1 15.7 177
12-17m 39.9 24.0 10.7 8.7 349
18-23m 50.5 31.2 8.1 5.0 376
24-35m 47.9 28.1 6.4 4.0 654
36-47m 53.1 34.9 7.9 4.2 684
48-59m 50.7 35.3 5.5 4.3 626
Sex of child
Male 45.4 29.9 8.8 6.6 1630
Female 40.1 27.2 8.3 6.6 1726
Size of child at birth
Average or larger 40.7 25.8 7.6 5.9 2864
Smaller than average 53.5 44.1 13.2 9.9 355
Very small 53.6 45.0 16.3 12.4 109
Don't know 59.7 46.6 13.8 13.4 27
Mother’s body mass index
Low BMI (<18.5) 45.5 41.8 15.1 11.3 643
Normal BMI (18.5-24.9) 423 25.8 7.3 5.6 2438
Overweight/Obese (>=25) 39.0 21.0 4.3 4.2 271
Residence
Phnom Penh 24.1 14.4 7.0 7.0 266
Other urban 39.9 31.1 8.5 7.2 319
Rural 44.7 29.6 8.7 6.5 2771
Total 42.6 28.5 8.6 6.66 3356

89Micronutrient Defi ciencies and Interventions in CambodiaInformation for Improved Programming
Table 4. Prevalence of malnutrition indicators by background characteristics, CDHS 2005
Stunted (<-2SD HAZ)
Underweight (<-2SD WAZ)
Wasted (<-2SD WHZ)
Wasted Low Body Mass Index
(<-2SD Z-BMI)
Province Percent Percent Percent Percent Count
Banteay Mean Chey 37.9 22.0 5.9 3.9 135Kampong Cham 43.3 29.3 8.7 5.8 370Kampong Chhnang 41.8 29.3 7.7 5.5 137Kampong Speu 39.6 23.8 8.1 4.0 197Kampong Th om 45.1 31.9 6.0 5.9 188Kandal 31.1 28.6 10.9 9.8 303Kratie 42.0 27.7 6.2 5.3 93Phnom Penh 24.1 14.4 7.0 7.0 266Prey Veng 41.0 30.0 12.5 11.3 236Pursat 64.1 34.5 16.6 13.1 88
Siem Reap 58.1 37.6 8.0 6.1 305Svay Rieng 45.6 27.9 11.4 9.7 104Takeo 44.7 31.9 7.1 5.4 223Oddar Meanchey 50.8 26.9 7.3 6.7 40Battambang & Krong Pailin 46.7 23.2 7.5 4.7 252Kampot & Krong Kep 38.6 23.8 4.2 1.0 175Sihanoukville & Koh Kong 39.5 29.1 7.7 5.8 87Preah Vihear & Stung Treng 51.4 41.3 13.4 11.7 88
Mondolkiri/Rattanakiri 57.8 46.4 11.3 7.0 68
Mother’s education
No education 51.6 32.5 9.3 7.2 806
Primary 43.5 29.7 8.4 6.5 1960
Secondary or higher 27.4 18.9 7.9 6.1 590
Wealth index
Poorest 52.4 34.8 10.5 7.5 838
Poorer 47.3 32.6 10.2 7.0 748
Middle 44.6 26.3 7.2 5.8 638
Richer 39.4 28.6 6.1 5.2 561
Richest 23.1 16.2 7.5 7.0 570
Total 42.6 28.5 8.6 6.6 3356

90 Micronutrient Defi ciencies and Interventions in CambodiaInformation for Improved Programming
Table 5. Sample sizes for anthropometry (in graphs by age) by diff erent growth standards from CDHS 2000 and CDHS 2005
Old Standards Percent New
Standards Percent
CDHS 2000
Not selected for anthropometry 4072 49.8% 4072 49.8%Selected for anthropometry 4103 50.2% 4103 50.2%Total 8175 100% 8175 100%Selected for anthropometry CDHS 2000
Valid cases 3257 79.4% 3285 80.1%Invalid cases 446 10.9% 418 10.2%Child dead 400 9.7% 400 9.7%Total 4103 100% 4103 100%CDHS 2005
Not selected for anthropometry 3948 50.7% 3948 50.7%
Selected for anthropometry 3841 49.3% 3841 49.3%Total 7789 100% 7789 100%
Selected for anthropometry CDHS 2005
Valid cases 3338 86.9% 3356 87.4%
Invalid cases 223 5.8% 205 5.3%
Child dead 280 7.3% 280 7.3%
Total 3841 100% 3841 100%
Note: includes only children of interviewed mothers.
During the data collection, all children who resided in the household were weighed and measured. In the presentation of the data, children of non-interviewed mothers are excluded. Th e birth dates of these children are often not recorded or incorrect invalidating the analysis of their z scores.

91Micronutrient Defi ciencies and Interventions in CambodiaInformation for Improved Programming
Figure 5. Percent of children stunted by age in months and diff erent growth standards, CDHS 2000 and CDHS 2005
0
10
20
30
40
50
60
70
0 2 4 6 8 10 12 14 16 18 20 22 24 26 28 30 32 34 36 38 40 42 44 46 48 50 52 54 56 58
CDHS 2000 Old
CDHS 2000 New
CDHS 2005 Old
CDHS 2005 New
Percent Stunted
Note: Points are smoothed with a 5 month moving average.
0
5
10
15
20
25
30
0 2 4 6 8 10 12 14 16 18 20 22 24 26 28 30 32 34 36 38 40 42 44 46 48 50 52 54 56 58
CDHS 2000 Old
CDHS 2000 New
CDHS 2005 Old
CDHS 2005 New
Percent Wasted
Figure 6. Percent of children wasted by age in months and diff erent growth standards, CDHS 2000 and CDHS 2005
Note: Points are smoothed with a 5 month moving average.

92 Micronutrient Defi ciencies and Interventions in CambodiaInformation for Improved Programming
0
10
20
30
40
50
60
70
0 2 4 6 8 10 12 14 16 18 20 22 24 26 28 30 32 34 36 38 40 42 44 46 48 50 52 54 56 58
Percent Underweight
CDHS 2000 Old
CDHS 2005 New
CDHS 2000 New
CDHS 2005 Old
Figure 7. Percent of children underweight by age in months and diff erent growth standards, CDHS 2000 and CDHS 2005
Note: Points are smoothed with a 5 month moving average.

93Micronutrient Defi ciencies and Interventions in CambodiaInformation for Improved Programming
Anderson VP, 2005. Risk of anaemia, and iron, zinc and vitamin A defi ciency among stunted children in Phnom Penh, Cambodia. Masters thesis - University of Otago. Dunedin, New Zealand.
Anderson VP, et al. in print. Co-existing micronutrient defi ciencies among stunted Cambodian infants and toddlers. Asian Pacifi c Journal of Clinical Nutrition. 2007.
A2Z, 2007a. Micronutrient Validation Surveys on Vitamin A and Iron and Folic Acid (IFA) Supplementation in Eastern Uttar Pradesh, India. (Sunil Muttoo and UV Somayajulu). A2Z Micronutrient Project. New Delhi, India. October 11, 2007.
A2Z, 2007b. Intestinal parasite study in mothers and their children in Uttar Pradesh state, India. A2Z Micronutrient Project. New Delhi, India.
Blanc AK and T Wardlaw, 2005. Monitoring low birth weight: an evaluation of international estimates and an update estimation procedure. Bulletin of the World Health Organization. March 2005, 83 (3) 178-185.
Brown KH, 2007. Information Gaps for scaling-up programs to improve zinc nutrition. A2Z Gap Analysis. A2Z Micronutrient Project. Washington DC.
Carnley BP, JF Prior , A Gilbert , E Lim , R Devenish , H Sing , E Sarin , R.Guhadasan,SG Sullivan , CA Wise , AH Bittles , K Chan , MS Wong , V Chan , WN Erber 2006. Th e prevalence and molecular basis of hemoglobinopathies in Cambodia. Hemoglobin. 2006, 30 (4) 463-470.
CDHS, 2005. (National Institute of Public Health, National Institute of Statistics [Cambodia] and ORC Macro. 2006). Cambodia Demographic and Health Survey 2005. Phnom Penh, Cambodia and Calverton, Maryland, USA: National Institute of Public Health, National Institute of Statistics and ORC Macro.
CESVI, 2006. (Giovannini M, Debora Sala, Michele Usuelli, Luca Livio, Gaia Francescato, Marta Braga, Giovanni Radaelli, and Enrica Riva. 2006. Journal of Pediatric Gastroenterology and Nutrition. Double-Blind, Placebo-Controlled Trial Comparing Eff ects of Supplementation with Two Diff erent Combinations of Micronutrients Delivered as Sprinkles on Growth, Anemia, and Iron Defi ciency in Cambodian Infants. Journal of Pediatric Gastroenterology and Nutrition. March 2006, 42:306-312.
Anderson VP, 2005. Risk of anaemia, and iron, zinc and vitamin A defi ciency among stunted children in Phnom Penh, Cambodia. Masters thesis - University of Otago. Dunedin, New Zealand.
Anderson VP, et al. in print. Co-existing micronutrient defi ciencies among stunted Cambodian infants and toddlers. Asian Pacifi c Journal of Clinical Nutrition. 2007.
A2Z, 2007a. Micronutrient Validation Surveys on Vitamin A and Iron and Folic Acid (IFA) Supplementation in Eastern Uttar Pradesh, India. (Sunil Muttoo and UV Somayajulu). A2Z Micronutrient Project. New Delhi, India. October 11, 2007.
A2Z, 2007b. Intestinal parasite study in mothers and their children in Uttar Pradesh state, India. A2Z Micronutrient Project. New Delhi, India.
Blanc AK and T Wardlaw, 2005. Monitoring low birth weight: an evaluation of
References

94 Micronutrient Defi ciencies and Interventions in CambodiaInformation for Improved Programming
CNMS, 2000. Cambodian National Micro-nutrient Survey – Helen Keller International – Cambodia. Phnom Penh, Cambodia.
CNMBS, 2004. (B Mao, V Saphonn) Report of the Cambodia National Malaria Baseline Survey 2004. National Institute of Public Health, Cambodia (NIPH) 5 August 2005 National Institute of Public Health, Cambodia (NIPH) Malaria Consortium Phnom Penh, Cambodia.
Christian P, 2002. Recommendations for indicators: night blindness during pregnancy-a simple tool to assess vitamin A defi ciency in a population. Journal of Nutrition. 2002 Sept, 132 (9 Suppl): 2884S-2888S.
Conkle J, 2007. Exclusive Breastfeeding in Cambodia: Survey Comparability & Explaining Change. UNICEF. Phnom Penh, Cambodia.
Crompton DW et al, 2003. Controlling disease due to helminth infections. Geneva: World Health Organization.
Delange F, 1994. Th e disorders induced by iodine defi ciency. Th yroid, 4: 107-128.
Edmond K and R Bahl, 2006. Optimal feeding of low-birth-weight infants: technical review. WHO. Geneva.
FAO, Global Forest Resource Assessment 2005, Annex 3 – Global Tables, p. 233, ftp://ftp.fao.org/docrep/ f ao/008/A0400E/A0400E14.pdf .(Last downloaded 18 March 2007).
Fishman SM, P Christian and KP West Jr, 2000. Th e role of vitamins in the prevention and control of anemia. Public Health Nutrition. 3(2): 125-150
Flohr C et al, 2007. Low effi cacy of mebendazole against hookworm in Vietnam: two randomized controlled trials. American Journal of Tropical Medicine and Hygiene. 2007 April, 76(4):732-736.
GAVA, 2007. Global Vitamin A Alliance. Monitoring Vitamin A Supplementation. Technical Advisory Group Meeting Report. New York, 19-20 July 2006.
Hix J et al, 2006. Validation of a rapid enzymeimmunoassay for the quantitation of retinol-binding protein to assess vitamin A status within populations. European Journal of Clinical Nutrition (2006) 60: 1299–1303.
Horton S and J Ross, 2003. Th e economics of iron defi ciency. Food Policy (2003) 28: 51–75.
IRIS Study Group, 2005. Effi cacy of a Foodlet-Based Multiple Micronutrient Supplement for Preventing Growth Faltering, Anemia, and Micronutrient Defi ciency of Infants: Th e Four Country IRIS Trial Pooled Data Analysis. International Research on Infant Supplementation (IRIS) Study Group: Journal of Nutrition 2005. 135: 631S–638S.
IVACG, 2002. Maternal Night Blindness: A New Indicator of Vitamin A Defi ciency International Vitamin A Consultative Group Statement. Washington D.C.
IZiNCG, 2004. International Zinc Nutrition Consultative Group (IZiNCG). Assessment of the risk of zinc defi ciency in populations and options for its control. Hotz C and Brown KH, eds. Food and Nutrition Bulletin 2004. 25: S91-S202.
Jack S, 2005. Comparison of Cambodia Trials. Presented at the 3rd National Anaemia Workshop: 5-6 May 2005. Phnom Penh, Cambodia.
Jiraphongsa C et al, 2005. Epidemiology and burden of rotavirus diarrhea in Th ailand: results of sentinel surveillance. Journal of Infectious Disease. 2005 Sept 1;192 Suppl 1:S87-93.
Johnston R, 2006. Th e Twelve Key Family Practices for Health Survey Report - 2006. National Center for Health Promotion. Phnom Penh, Cambodia.
Johnston R and S Ly, 2007. Recording and Reporting Nutrition Interventions on the Community and Health Center Level in Rural Cambodia, Qualitative Study, A2Z Micronutrient Project, Phnom Penh, Cambodia.
Kapil U, 2003. Prevention and Control of Iron Defi ciency Anemia Amongst Young Children.Indian Pediatrics 2003, 40:293-295.

95Micronutrient Defi ciencies and Interventions in CambodiaInformation for Improved Programming
Keusch GT et al, 2006. Diarrheal Diseases. Disease Control Priorities in Developing Countries 2006 (2nd Edition) ed. 371-388. New York: Oxford University Press.
Kheng H, 2007. Presentation on Scaling Up the Use of Zinc for Treating Diarrhea in Cambodia, Population Services International- Cambodia 2007. Phnom Penh, Cambodia.
Longfi ls P, Ung KH, Hay S, and Muth S, 2005. Weekly Iron and Folic Acid Supplementation as a Tool to Reduce Anemia among Primary School Children in Cambodia. Nutrition Reviews. December 2005: (II) S139–S145.
Lynch Sean, Betsy Lozoff , Chessa Lutter, Peter Ranum and Phil Harvey 2007. Gap Analysis – Information needed for consensus on policies and programs to improve iron nutrition. A2Z Micronutrient Project. Washington DC.
Miller M, Jean Humphrey, Elizabeth Johnson, Edmore Marinda, Ron Brookmeyer and Joanne Katz (2002). Why Do Children Become Vitamin A Defi cient?, Supplement: Proceedings of the XX International Vitamin A Consultative Group Meeting. Journal of Nutrition. 132:2867S-2880S, September 2002.
MoH, 2004. National Policy and Guideline for Helminth Control in Cambodia. National Task Force for the Control of Soil-Transmitted Helminthiases, Schistosomiasis, and for the Elimination of Lymphatic Filariasis, Phnom Penh, Cambodia.
MoH/WHO/UNICEF, 2006. Integrated Management of Childhood Illness Guidelines. Phnom Penh, Cambodia.
MoH, 2007a. Vitamin A Supplementation Policy. National Nutrition Program. Cambodian Ministry of Health. Phnom Penh, Cambodia.
MoH, 2007b. National Nutrition Program - Annual Operational Plan 2007, National Maternal and Child Health Center. Phnom Penh, Cambodia.
National IDD Control Program, 2000. Report on IDD Control Activities. 2000, Hanoi, Vietnam.
MOARD, 2005., Th e 5-Year Plan for the Agricultural and Rural Development Sector Period 2006 -2010, Ministry of Agriculture and Rural Development. Hanoi, Vietnam.
MOST, 2005. Diarrhea Treatment Guidelines for Clinic-Based Healthcare Workers. Th e MOST Project, 2005.
Oum S et al, 2005. Community-based surveillance: a pilot study from rural Cambodia.
Tropical Medicine and International Health. 2005 Jul;10(7):689-97.
Rice AL, 2007. Post-partum vitamin A supple-mentation: evaluating the evidence for action. Technical Brief. A2Z Micronutrient Project. Washington DC. January 2007.
Sazawal S, Black RE, Ramsan M, Chwaya HM, Stoltzfus R, Dutta A, Dhingra U, Kabole I, Deb S, Othman MK, Kabole FM. Eff ect of routine prophylactic supplementation with iron and folic acid on admission to hospital and mortality in preschool children in a high malaria transmission setting: a community-based, randomized, placebo-controlled trial. Lancet, 2006; 367:133-43.
Sazawal S et al, 2007. Eff ect of zinc supplementation on mortality in children aged 1–48 months: a community-based randomised placebo controlled trial. Lancet 2007; 369: 927–34.
Shrimpton R et al, 2005. Zinc defi ciency: what are the most appropriate interventions? British Medical Journal. 2005; 330:347-349 (12 February). GTZ, 2007. Effi cacy and safety of twice-weekly administration of three RDAs of iron and folic acid with and without complement of 14 essential micronutrients at one or two RDAs: a placebo-controlled intervention trial in anemic Cambodian infants 6 to 24 months of age. European Journal of Clinical Nutrition (2007): 1–14.
Stoltzfus RJ, L Mullany and RE Black, 2004.Chapter 3. Iron Defi ciency Anemia. Comparative Quantifi cation Of Health Risks: Global and Regional Burden of Diseases Attributable to

96 Micronutrient Defi ciencies and Interventions in CambodiaInformation for Improved Programming
Selected Major Risk Factors. Geneva, World Health Organization, 2004.
Stolzfus, RJ. 2004. Iron defi ciency anemia: reexamining the nature and magnitude of the public health problem. Summary: implications for research and programs. Journal of Nutrition, 2001, 131 (Suppl. 2): 697S-701S.
Tielsch J.M., Khatry S., Stoltzfus R., Katz J., LeClerq S., Adhikan R., Mullany L.C., Shresta S., Black R.E. Eff ect of routine prophylactic supplementation with iron and folic acid onpreschool child mortality in Southern Nepal: community based, cluster-randomised, placebo-controlled trial. Lancet, 2006; 367:144-52.
Victora, C.G.; Fenn, B.; Bryce, J.; Kirkwood, B.R.; Co-coverage of preventive interventions andimplications for child-survival strategies: evidence from national surveys. Lancet, 2005; 366 (9495):1460-6.
Wedner SH, DA Ross, N Congdon, R Balira, V Spitzer and A Foster, 2004. Validation of night blindness reports among children and women in a vitamin A defi cient population in rural Tanzania. European Journal of Clinical Nutrition (2004) 58, 409–419.
West CE, Ans Eilander and Machteld van Lieshout (2002) Consequences of Revised Estimates of Carotenoid Bioeffi cacy for Dietary Control of Vitamin A Defi ciency in Developing Countries. Supplement: Proceedings of the XX International Vitamin A Consultative Group Meeting. Journal of Nutrition. 132:2920S-2926S, September 2002.
WHO (1982) Control of vitamin A defi ciency and xerophthalmia. Report of a joint WHO/UNICEF/USAID/Helen Keller International IVACG Meeting. WHO Technical Report Series 672. Geneva: World Health Organization 1982:1-70.
WHO, 1996. Indicators for assessing vitamin A defi ciency and their application in monitoring and evaluating intervention programmes. Geneva, World Health Organization, 1996 (WHO/NUT/96.10).
WHO, 1998. Integration of vitamin A supplementation with immunization: policy and programme implications. Report of a meeting, 12-13 January 1998. Global programme for vaccines and immunization. Expanded programme on immunization. UNICEF, New York.
WHO/UNICEF/UNU, 2001. Iron defi ciency anemia: assessment, prevention and control. Geneva, World Health Organization, 2001 (WHO/NHD/01.3).
WHO/UNICEF, 2004. Prevention and control of schistosomiasis and soil-transmitted helminthiasis. WHO/UNICEF Joint Statement. Geneva, World Health Organization.
WHO, 2005. Deworming for health and development: Report of the third global meeting of the partners for parasite control. Geneva, World Health Organization, 2005.
WHO/UNICEF/USAID, 2005. Diarrhoea treatment guidelines including new recommen-dations for the use of ORS and zinc supplemen-tation for clinic-based healthcare workers. WHO/UNICEF/USAID Joint Statement. Geneva, World Health Organization.
WHO, 2006. Iron supplementation of young children in regions where malaria transmission is intense and infectious disease highly prevalent. January 2006. WHO Statement, Geneva.
WHO, 2007. New international growth standards – Multicentre Growth Reference Study. Geneva, World Health Organization, 2007. Zlotkin SH, Schauer C, Christofi des A, Sharieff W, Tondeur MC, et al. (2005) Micronutrient Sprinkles to control childhood anaemia. PLoS Med 2(1): e1.


RACHA. PO. Box 2471#160, Street 71, Room 309Tonle BassacChamkar Mon (12300)Phnom Penh, Cambodia.
Phone: (855) 23 997 501Fax: (855) 23 997 502Website: www.a2zproject.com
Designed by G
raphic Roots - ww
w.graphicroots.com
.kh