Embed Size (px)
Citation preview
Information Aggregation Efficiency
in Virtual Prediction Markets
The Role of Trader Type, Allocative Efficiency and Source of Information
Master Thesis
M.sc. in Business Administration with specialization in
Business Information Management
RSM Erasmus University
Jérôme Martin
ID 297899jm
13.09.2006 ���� Final Version
Coach: prof. dr. ir. Eric van Heck
1st co-reader: dr. Mathijs A. van Dijk
Keywords Prediction market, information aggregation efficiency, information market, virtual stock
market, experimental economics, double auction
The author declares that the text and work presented in this Master thesis is original and no sources other
than those mentioned in the text and its references have been used in creating the Master thesis.
The copyright of the master thesis rests with the author. The author is responsible for its contents. RSM
Erasmus University is only responsible for the educational coaching and beyond that cannot be held
responsible for the content.
Information Aggregation in Prediction Markets
J. Martin � Master Thesis � 27.09.2006 2
Table of Contents
1 Introduction....................................... ......................................................................... 5
1.1 Summary ....................................................................................................................... 5
1.2 Introduction to the Topic ................................................................................................ 6
1.3 Research Objective ....................................................................................................... 8
1.4 Research Questions ...................................................................................................... 8
1.5 Research Methodology.................................................................................................. 9
2 Literature Review.................................. ................................................................... 10
2.1 Efficient Information Aggregation in Markets ............................................................... 10
2.2 Efficient Market Hypothesis ......................................................................................... 11
2.3 Trader Type ................................................................................................................. 13
2.4 Critics of Marginal Trader Hypothesis.......................................................................... 13
2.5 Source of Information .................................................................................................. 14
2.6 Monetary Incentives and Transaction Costs................................................................ 14
2.7 Biases and Knowledge ................................................................................................ 15
2.8 Diversity of Agents....................................................................................................... 15
2.9 Price Signals and Learning.......................................................................................... 16
2.10 Averaging Principle...................................................................................................... 17
2.11 Opinion Pools .............................................................................................................. 17
2.12 Probability Elicitation ................................................................................................... 18
2.13 Market Price and Averaging Principle ......................................................................... 18
2.14 Aggregate Uncertainty................................................................................................. 19
2.15 Knowledge Heterogeneity ........................................................................................... 19
2.16 Number of Traders and Informants.............................................................................. 20
2.17 Self Selection vs. External Selection ........................................................................... 21
2.18 Market Making Mechanism.......................................................................................... 21
2.19 Double Auction Market Mechanism............................................................................. 22
2.20 Contract Types ............................................................................................................ 22
2.21 Supply and Demand Structure .................................................................................... 23
2.22 Allocative Efficiency and Competitive Prices............................................................... 24

Information Aggregation in Prediction Markets
J. Martin � Master Thesis � 27.09.2006 3
3 Conceptual Framework ............................... ............................................................ 25
3.1 Introduction.................................................................................................................. 25
3.2 Conceptual model (Part I) – Trader-based Model of Information Aggregation ............ 25
3.3 Conceptual model (Part II) – Market-based Model of Information Aggregation........... 27
3.4 Conclusion................................................................................................................... 29
4 Experimental Design & Research Methodology ......... .......................................... 30
4.1 Introduction.................................................................................................................. 30
4.2 Experimental Design ................................................................................................... 30
4.3 Data Selection & Measurement of Constructs............................................................. 35
5 Data Analysis & Empirical Results .................. ...................................................... 40
5.1 Introduction.................................................................................................................. 40
5.2 General Observations.................................................................................................. 40
5.3 Trader-based Model of Information Aggregation......................................................... 53
5.4 Market-based Model of Information Aggregation......................................................... 57
5.5 Summary ..................................................................................................................... 61
5.6 Reflection on the analysis results ................................................................................ 62
5.7 Reflection on Practical Implications............................................................................. 63
6 Discussion & Conclusions ........................... .......................................................... 67
6.1 Discussion ................................................................................................................... 67
6.2 Recommendations for Further Research..................................................................... 68
7 Acknowledgements ................................... .............................................................. 70
8 Bibliography....................................... ...................................................................... 70
Appendices ......................................... ............................................................................ 74
A Description of the Trading Platform ................................................................................. 74
B Trader Manual ................................................................................................................. 85
C Software .......................................................................................................................... 91
D Description of the datasets and data pre-processing ...................................................... 94
E Market results ................................................................................................................ 105
E.1 Overview of Markets Results for the 128 Experimental Markets ............................... 105
E.2 Supply and Demand Graphs of Selected Markets..................................................... 110

Information Aggregation in Prediction Markets
J. Martin � Master Thesis � 27.09.2006 4

Information Aggregation in Prediction Markets
J. Martin � Master Thesis � 27.09.2006 5
1 Introduction
1.1 Summary
Prediction markets have shown excellent information aggregation and forecasting abilities.
Markets can efficiently consolidate information that is widely dispersed among a number of
individuals. In such markets, securities of future outcomes are traded on virtual trading
platforms. Resulting market prices reflect a market consensus about the likelihood of future
outcomes.
The development of electronic markets has enabled a broader application of markets and
improved market design options for the purpose of business forecasting and decision support.
Prediction markets are expected to become a central information management instrument of
organizations in the future. However, little is known about the mechanism of information
aggregation in such markets. A predominant theory of information aggregation based on
differences in trader types has been proposed in literature. It states that a certain trader type
shows superior ability to identify relevant information and show less cognitive biases. It states
further that this trader type is responsible for efficient information aggregation. Empirical
observations made in several experimental markets militate against such a theory.
This thesis seeks to challenge the trader-based theory by testing its assumptions with regard to
prediction accuracy and by proposing and testing an alternative theory based on allocative
efficiency. The alternative theory accounts information averaging through a double auction
mechanism as determinant of efficient information aggregation in markets. It states further that
information aggregation may be improved by a higher degree of allocative efficiency. Both
theories are empirically tested through a laboratory experiment which includes a set of
combined.
The results indicate that the trader type seems to be less relevant for efficient information
aggregation while no direct relationship between allocative efficiency and information
aggregation efficiency can be found. Instead, the results indicate sources of information to affect
efficient information aggregation.
A better understanding of the information aggregation mechanism is crucial for both researchers
and market designers. The results of this research will help market designers with
recommendations for achieving higher forecast accuracy, a better interpretation of market
results and improved market design.
Information Aggregation in Prediction Markets
J. Martin � Master Thesis � 27.09.2006 6
1.2 Introduction to the Topic
1.2.1 Interest of Research Topic
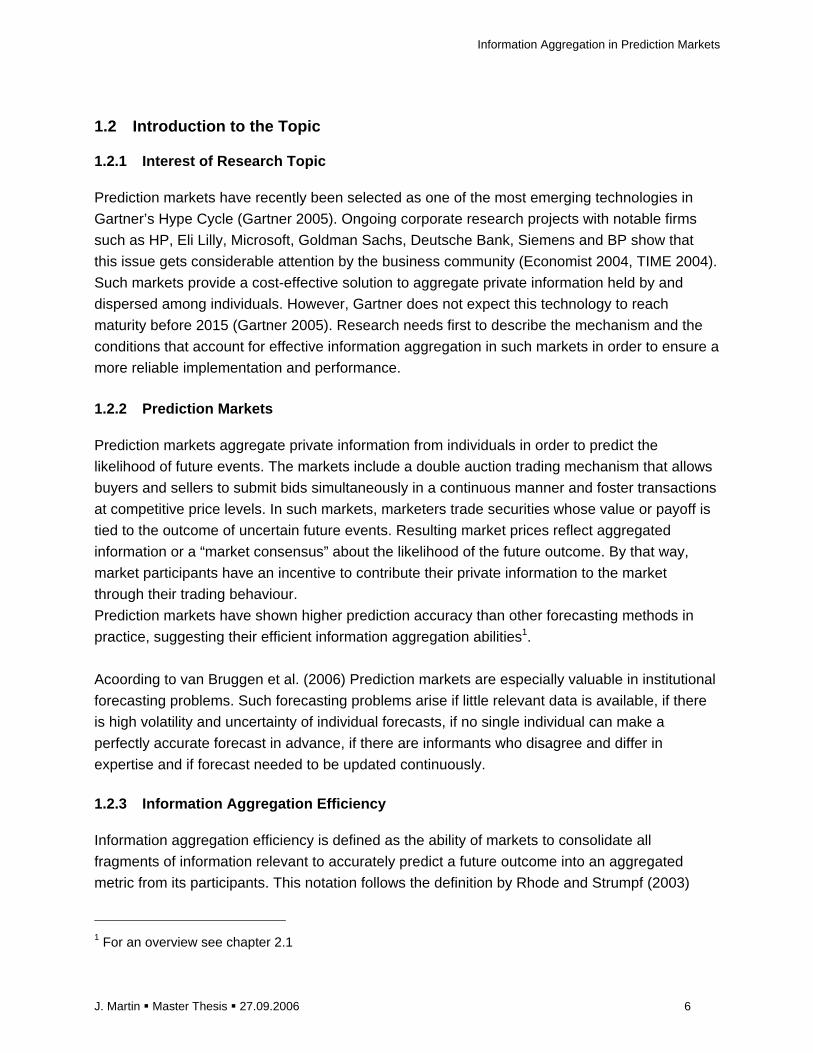
Prediction markets have recently been selected as one of the most emerging technologies in
Gartner’s Hype Cycle (Gartner 2005). Ongoing corporate research projects with notable firms
such as HP, Eli Lilly, Microsoft, Goldman Sachs, Deutsche Bank, Siemens and BP show that
this issue gets considerable attention by the business community (Economist 2004, TIME 2004).
Such markets provide a cost-effective solution to aggregate private information held by and
dispersed among individuals. However, Gartner does not expect this technology to reach
maturity before 2015 (Gartner 2005). Research needs first to describe the mechanism and the
conditions that account for effective information aggregation in such markets in order to ensure a
more reliable implementation and performance.
1.2.2 Prediction Markets
Prediction markets aggregate private information from individuals in order to predict the
likelihood of future events. The markets include a double auction trading mechanism that allows
buyers and sellers to submit bids simultaneously in a continuous manner and foster transactions
at competitive price levels. In such markets, marketers trade securities whose value or payoff is
tied to the outcome of uncertain future events. Resulting market prices reflect aggregated
information or a “market consensus” about the likelihood of the future outcome. By that way,
market participants have an incentive to contribute their private information to the market
through their trading behaviour.
Prediction markets have shown higher prediction accuracy than other forecasting methods in
practice, suggesting their efficient information aggregation abilities1.
Acoording to van Bruggen et al. (2006) Prediction markets are especially valuable in institutional
forecasting problems. Such forecasting problems arise if little relevant data is available, if there
is high volatility and uncertainty of individual forecasts, if no single individual can make a
perfectly accurate forecast in advance, if there are informants who disagree and differ in
expertise and if forecast needed to be updated continuously.
1.2.3 Information Aggregation Efficiency
Information aggregation efficiency is defined as the ability of markets to consolidate all
fragments of information relevant to accurately predict a future outcome into an aggregated
metric from its participants. This notation follows the definition by Rhode and Strumpf (2003)
1 For an overview see chapter 2.1

Information Aggregation in Prediction Markets
J. Martin � Master Thesis � 27.09.2006 7
who claim that efficient futures markets must provide the best prediction of future events given
the current information available from market participants. Information aggregation efficiency can
be measured in terms of relative prediction accuracy. This notion refers to the comparison of
absolute forecast errors between different forecast metrics obtained from the same market or
from another market with different settings but similar to-be-predicted event. For instance, the
comparison of mean individual forecasts with last transaction prices of the same market or the
comparison of last transaction prices of two different prediction markets that aimed to predict the
same event.
1.2.4 Marginal Trader Hypothesis
While many researchers have investigated the level of prediction accuracy achieved by several
prediction markets few have attempted to explain the information aggregation mechanism itself.
A predominant theory of information aggregation has been proposed by Forsythe et al. (1992).
The theory has its theoretical roots in classic capital market theory. It claims that information
aggregation in prediction markets is determined by a small subgroup of market participants,
called “marginal traders” who usually submit orders at marginal prices close to the previous
transaction price. These traders are supposed to show less biases, to use different information
sources and to possess more accurate information about the to-be-predicted outcome than non-
marginal traders. However, Forsythe et al. didn’t measure these constructs and their influence
on information aggregation directly but rather inferred their role from observing the trading
behaviour of market participants.
1.2.5 Critics of the Predominant Theory
Further empirical research by other scholars has not shown any presence of unbiased “marginal
traders” in prediction markets (Beckmann & Werding 1996, Bruggelambert 2004). Furthermore,
it is improbable that a minority of traders can outweigh the market power of all other investors
simply through trading and therefore fully account for the information aggregation efficiency.
1.2.6 Alternative Model of Information Aggregation
Therefore, in this thesis, the predominant theory of marginal traders will be challenged by
analyzing the underlying assumptions regarding marginal traders with an improved experimental
design. The new experimental will test the relationship between trader type, choice of
information source, presence of biases and information accuracy. By this way, it should be
verified directly whether these factors determine individual information accuracy and therefore
can be attributed to determine aggregate information efficiency.
This research seeks to measure the constructs directly through questionnaires and to show that
they cannot explain information aggregation efficiency in markets solely. It should be shown that
Information Aggregation in Prediction Markets
J. Martin � Master Thesis � 27.09.2006 8
information aggregation efficiency depends rather on global market characteristics than
individual trader characteristics.
An alternative theory of information aggregation that supposes the double auction to act like an
averaging mechanism is discussed and empirically tested. The alternative model accounts
allocative efficiency measured by competitive price level as well as supply and demand structure
as determinants of information aggregation efficiency.
1.3 Research Objective
The objective of this thesis is to identify determinants of information aggregation in markets in
order to achieve higher prediction accuracy in practice through improved market design and
improved interpretation of market results
By proposing an alternative model of information aggregation that accounts allocative efficiency
as well as supply and demand characteristics for efficient information aggregation a new
theoretical model will be contributed.
In addition, an existing predominant model that accounts the presence of a specific type of
trader, called marginal trader, as a determinant for efficient information aggregation will be
challenged.
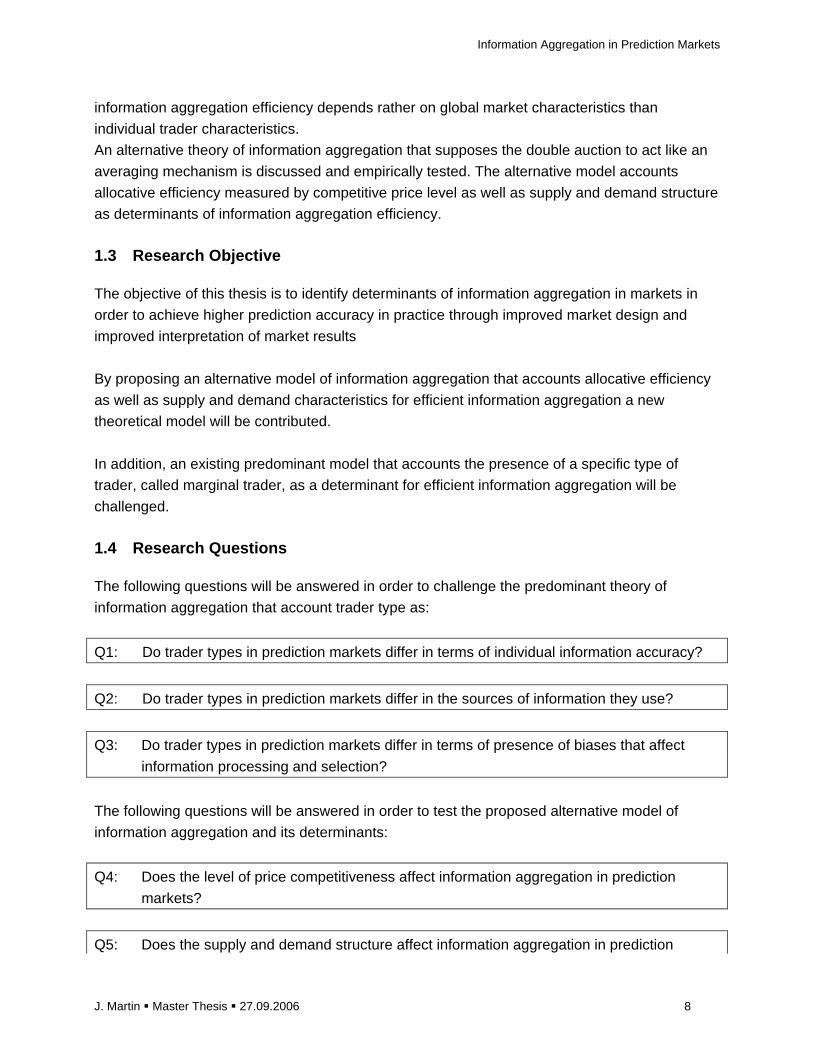
1.4 Research Questions
The following questions will be answered in order to challenge the predominant theory of
information aggregation that account trader type as:
Q1: Do trader types in prediction markets differ in terms of individual information accuracy?
Q2: Do trader types in prediction markets differ in the sources of information they use?
Q3: Do trader types in prediction markets differ in terms of presence of biases that affect
information processing and selection?
The following questions will be answered in order to test the proposed alternative model of
information aggregation and its determinants:
Q4: Does the level of price competitiveness affect information aggregation in prediction
markets?
Q5: Does the supply and demand structure affect information aggregation in prediction

Information Aggregation in Prediction Markets
J. Martin � Master Thesis � 27.09.2006 9
markets?
Q6: How can competitive price levels and supply & demand structure be measured in
prediction markets?
1.5 Research Methodology
This master thesis will be organized as follows. First, a literature review will be conducted in
chapter 2. Some relevant concepts from existing research into prediction markets and from
research into the fields of experimental and neoclassical economics, efficient market theory and
statistical psychology will be discussed and conclusions drawn.
A predominant theory of trader-based information aggregation in markets will be presented and
alternative hypotheses regarding the underlying assumptions will be formulated. Based on some
empirical findings in previous research, an alternative model of information aggregation which
considers allocative afficiency and demand and supply structure as determinants will be
described in chapter 3.
The assumptions of both models will be tested with an own set of prediction market experiments.
Resulting datasets will be analyzed with quantitative statistical methods and interpreted.
Depending on the empirical results, the alternative model will be adjusted or rejected.

Information Aggregation in Prediction Markets
J. Martin � Master Thesis � 27.09.2006 10
2 Literature Review
2.1 Efficient Information Aggregation in Markets
It has already early been proposed by von Hayek (1945) to use market mechanisms for the
purpose of efficient information aggregation and decision making. During the first half of the 20th
century, markets had been implemented successfully to generate accurate forecasts and have
reached levels of liquidity and market size that have never been reached again since then.
Between 1868 and 1940, prediction markets were run during 15 presidential elections on the
New York stock exchange (Rhode & Strumpf 2003). During that period, the final market price
predicted the final election outcome only one time inaccurately. The prediction accuracy
observed in historical prediction markets is even far more astonishing given the fact that
information propagation occurred very slowly at that time. News spread usually by telegraphic
transmission and appeared only several days later.
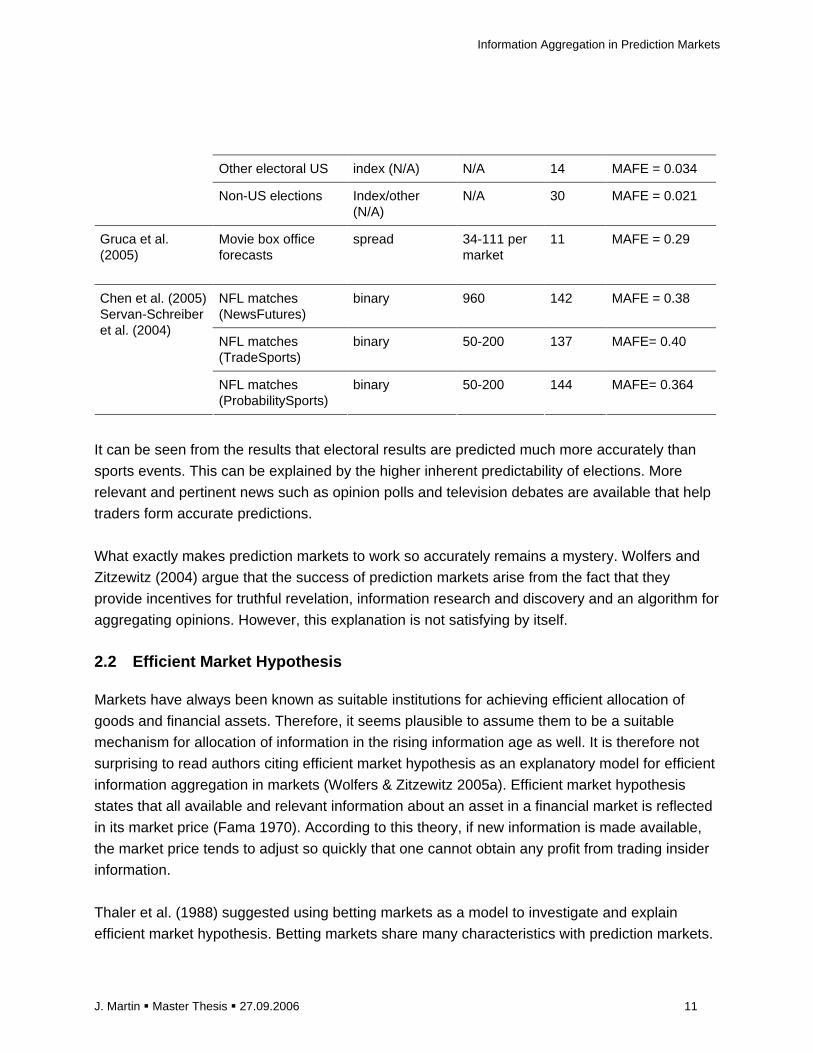
Comparable levels of prediction accuracy have been reported for a number of electronic
prediction markets over the last decade. Table 2.1 summarizes some of those results.
Table 2.1
Author To-be-forecasted event
Contract Type 2 (currency)
Participants Markets Accuracy
Chen & Plott (2002)
(Sales forecasting at Hewlett Packard)
spread (real money)
7-26 per market
12 MAFE3 = 0.24 (performed better than institutional expert forecast in 6 out of 8 markets)
Spann & Skiera (2003)
Play money Spread (play money)
725,000 registered participants
152 MAFE = 0.31
Rhode & Strumpf (2003)
Historical elections Index (play money)
N/A 15 Predicted winner in 14 of 15 election accurately
Berg et al. (2000) US presidential elections
Index (real money)
N/A 5 MAFE = 0.013
2 for a detailed explanation of contract types see chapter 2.20. 3 percentual mean average forecast error
Information Aggregation in Prediction Markets
J. Martin � Master Thesis � 27.09.2006 11
Other electoral US index (N/A) N/A 14 MAFE = 0.034
Non-US elections Index/other (N/A)
N/A 30 MAFE = 0.021
Gruca et al. (2005)
Movie box office forecasts
spread 34-111 per market
11 MAFE = 0.29
NFL matches (NewsFutures)
binary 960 142 MAFE = 0.38
NFL matches (TradeSports)
binary 50-200 137 MAFE= 0.40
Chen et al. (2005) Servan-Schreiber et al. (2004)
NFL matches (ProbabilitySports)
binary 50-200 144 MAFE= 0.364
It can be seen from the results that electoral results are predicted much more accurately than
sports events. This can be explained by the higher inherent predictability of elections. More
relevant and pertinent news such as opinion polls and television debates are available that help
traders form accurate predictions.
What exactly makes prediction markets to work so accurately remains a mystery. Wolfers and
Zitzewitz (2004) argue that the success of prediction markets arise from the fact that they
provide incentives for truthful revelation, information research and discovery and an algorithm for
aggregating opinions. However, this explanation is not satisfying by itself.
2.2 Efficient Market Hypothesis
Markets have always been known as suitable institutions for achieving efficient allocation of
goods and financial assets. Therefore, it seems plausible to assume them to be a suitable
mechanism for allocation of information in the rising information age as well. It is therefore not
surprising to read authors citing efficient market hypothesis as an explanatory model for efficient
information aggregation in markets (Wolfers & Zitzewitz 2005a). Efficient market hypothesis
states that all available and relevant information about an asset in a financial market is reflected
in its market price (Fama 1970). According to this theory, if new information is made available,
the market price tends to adjust so quickly that one cannot obtain any profit from trading insider
information.
Thaler et al. (1988) suggested using betting markets as a model to investigate and explain
efficient market hypothesis. Betting markets share many characteristics with prediction markets.
Information Aggregation in Prediction Markets
J. Martin � Master Thesis � 27.09.2006 12
Both provide an excellent environment for testing efficient market theory. This is especially due
to the determined contract specifications and market settings in both market types. For instance,
a financial market asset like a share is traded on an infinite scope and there are multiple
definitions of the underlying asset value, leaving room for different interpretations of market
price. In contrast, a contract in an electoral prediction market is traded on a definite outcome that
has a clearly observable state on a certain date.
Classical capital market theory as propagated by Fama (1970) states that markets require
fulfilling four conditions to achieve efficiency:
The first condition concerns violations of arbitrage free pricing. Efficient capital markets require
that nobody can profit from simultaneously trading the same contract. For the case of prediction
markets, this means that nobody should be able to trade the same contract at different prices in
different markets at the same time.
The second condition concerns the use of historical price information for building trading rules.
In efficient markets, it should not be possible to infer future contract prices from historical data.
The third condition concerns the possibility of making trading profits based solely on publicly
available information. It should not be possible to make trading profits based on common
information.
The fourth condition concerns the possibility of making trading profits based on private
information. This condition is rarely met in prediction markets as it would require all
knowledgeable individuals in the world to contribute their information to the market by trading
activity in order to guarantee a sufficient level of market efficiency.
Observed evidence from prediction markets suggests that markets which failed to meet the
mentioned requirements can achieve a high level of prediction accuracy anyway. For instance
Chen and Plott (2002) observed in 12 markets for sales forecasting a violation of the non-
arbitrage condition. In markets with small number of participants and little liquidity the no-
arbitrage condition is often violated. Despite this type of inefficiency the market performed quite
well in comparison with institutional expert forecasts. However, the occurrence of measurable
no-arbitrage violations in prediction markets does not necessarily mean that traders could profit
from arbitrage opportunities as this usually requires a certain degree of market liquidity. The
mere fact that market prices that occurred in the past theoretically allow arbitrage does not mean
that transactions can be immediately executed at that price as this depends usually on demand
and supply situation.
It remains to this date unknown to what extend the level of market efficiency affects information
Information Aggregation in Prediction Markets
J. Martin � Master Thesis � 27.09.2006 13
aggregation in markets. It has been shown that even prediction markets with a high number of
traders tend to show violations of one or more conditions of market efficiency without forfeiting
information aggregation efficiency (Oliven & Rietz 2004)
2.3 Trader Type
Forsythe et al. (1992) use the efficient market theory as a framework to explain the accurate
forecasting results of presidential elections that have been observed in the Iowa Electronic
Markets (Forsythe et al. 1992, Oliven & Rietz 2004) and the University of British Columbia
political markets (Forsythe et al. 1998). The authors found that although most traders in the
market showed biases the aggregated market price served as a highly accurate prediction
metric. They found evidence for the presence of a particular minority group of traders in those
markets, called “marginal traders”. These traders frequently submit limit orders at prices close to
the market price, make higher investments and achieve higher trading returns than non-marginal
traders. Forsythe et al. claim that these traders show less biased and more rational trading
behaviour. However, this theory opposes another predominant economic theory which assumes
all individuals to follow a concept of bounded rationality in which individuals usually exhibit at
least partly non-rational behaviour (Simon 1955).
According to the theory of “marginal traders”, biased and uninformed traders tend to push the
market price through their trading behaviour towards an inaccurate level. But at the same time,
these deviations from the accurate price serve as incentives for marginal traders to enter the
market and to benefit from trading. Forsythe el al. (1992) argue that marginal traders drive the
market price towards a more accurate predictive level. Marginal traders are often referred to as
“market makers” because they are thought to place the best outstanding bid and ask orders at
prices that are accepted by biased traders (also referred to as “price takers”) subsequently.
2.4 Critics of Marginal Trader Hypothesis
While many authors in the field cite the theory of marginal traders as explanation for the efficient
information aggregation in prediction markets few have raised doubts and have sought to
address this issue with further research and empirical evidence. For instance, other authors
conducted analysis of data from several German political stock markets using the framework of
Forsythe et al. but found no evidence for the superior rationality of marginal traders. Marginal
traders in these markets did not systematically purchase shares of true favourites but preferred
to buy share of candidates for which showed a preference as well regardless of their true
winning chances (Bruggelambert 2004, Beckmann & Werding 1996).
James Surowiecki (2004), author of an influential bestseller book in the field, stimulated a
controversial debate by opposing the marginal trader theory. As he put it out:

Information Aggregation in Prediction Markets
J. Martin � Master Thesis � 27.09.2006 14
“The idea of the ‘marginal investor’ … is an intuitively appealing concept, because it allows us to
retain our faith that a few smart people have the right answers while still allowing the market to
work. But it’s a myth. There’s no marginal investor in the sense of a single investor (or a small
group of investors) who determines the prices that all investors buy and sell at. No trader … has
enough capital to outweigh the aggregated buying and selling power of all the other investors.”
2.5 Source of Information
Forsythe et al. (1992) suggested that marginal traders differ from ordinary traders in that they
are able to recognize when news happens and when not. They measured reactions to news
events prior to the elections by comparing upper percentile price changes after important news
occurred and trading behaviour of market participants.
Berg and Rietz (2005) claim that information structure with regard to public and private
information may affect prediction accuracy of markets. The results of their ongoing research are
still not available but their survey results show that only 76% of the market participants reported
basing their trades in at least 50% of cases on information. The question is how traders who
base their trading decisions and probability judgments on different sources of information such
as news, expert judgments or intuition perform relative to other traders in terms of trading
success and prediction accuracy and how such sources affect prediction accuracy.
There are some concerns the informational success of prediction markets might derive from
external information aggregation mechanism like polls or betting markets in the case of sports
prediction markets. However, two arguments violate against this assumption. First, Forsythe et
al. (1992) could show by a regression analysis that market prices in the Iowa Presidential
Markets did not follow poll results but anticipated them. Second, it would not explain why
prediction markets achieved better prediction accuracy than polls in most cases.
2.6 Monetary Incentives and Transaction Costs
However, if we assume the marginal trader hypothesis to be valid, then transaction costs would
seriously affect the attractiveness for marginal traders to enter the market as they would impede
those traders from benefiting from marginal gains. Tradesports4 and NewsFutures5 are two main
public prediction markets that offer similar contracts to bet on NFL football game outcomes.
While NewsFutures charges no trading fees TradeSports charges different trading fees for
“market makers” and “price takers” to stimulate marginal trading behaviour. Those traders who
set an outstanding bid with limit price that is not immediately executed (“market makers”) are
4 http://www.tradesports.com 5 http://www.newsfutures.com

Information Aggregation in Prediction Markets
J. Martin � Master Thesis � 27.09.2006 15
charged no trading fees. Those traders who accept the best outstanding bids (“price takers”) and
whose orders are immediately executed are charged commission fees.
Despite these differences Servan-Schreiber et al. (2004) found no significant differences in
forecast accuracy between the two markets. These evidences raise some doubts about the role
of marginal traders.
The authors suggest an alternative explanation for the similar performance of both markets.
They differ between intrapersonal and interpersonal opinion weights in the information
aggregation mechanism that might affect market performance and argue that these effects
counterbalance each other. Newsfutures endow all its participants with the same initial amount
of play money and is therefore thought to weight interpersonal beliefs stronger. TradeSports in
turn is thought to stimulate people to better assess their betting risk due to the use of real
money, thus weighting intrapersonal beliefs stronger.
2.7 Biases and Knowledge
Following their findings that showed no difference between real-money and play-money markets,
Servan Schreiber et al. argue that knowledge and motivation must be the most important factors
to explain accuracy in prediction markets and think real-money incentives to be of secondary
importance. Kambil and van Heck (2002) argue that participants of markets “must represent the
peer group that is knowledgeable about the issues the market seeks to address”. However, no
further explanation regarding these assumptions is provided.
One might also ask for the role of information processing capabilities of participants. Besides
collecting and possessing all relevant information it is crucial to select and interpret this
information in the right way to form accurate assumptions about future outcomes. Researchers
in the field have shown the presence of biases and irrational behaviour among traders in
prediction markets. Forsythe and al. (1999) have found evidence for the presence of
assimilation-contrast bias among traders. The prediction of future outcomes by participants was
found to be significantly influenced by their own preference for that outcome.
2.8 Diversity of Agents
Hong and Page (2004) conducted laboratory experiments with artificially programmed agents
that mimic human agents and that use diverse heuristics with different levels of ability for
problem-solving tasks. The authors found evidence that groups of low-ability agents with diverse
heuristics outperform same-size groups of high-ability agents that use homogeneous heuristics.
They found a trade-off between high-ability and diversity of agents but conclude that an ideal
group will be composed of agents with both high-ability and diversity.
Information Aggregation in Prediction Markets
J. Martin � Master Thesis � 27.09.2006 16
Hong and Page (2004) argued that with increasing size, a group will get automatically more
diverse, thus supporting observations from opinion pools which performed better with increasing
size up to a certain number of participants (Chen et al. 2005). Hong and Page argue that the
value and contribution of an additional agent for the group performance depends not so much on
his problem solving ability but on his heuristic approach relative to other problem solvers. Based
on these findings and in context with prediction markets, one may raise the question whether
markets with biased participants may not achieve high information aggregation efficiency
collectively. Therefore, the crucial question may not be whether biased or unbiased participants
are in the market but whether biases are diverse.
However, Hong and Page (2004) content that the model did not consider communication costs
and learning. They argue that groups with agents having different perspectives may lead to
higher communication costs between agents. One advantage of market mechanisms is that it
allows participants to communicate via and learn from uniform price signals thus reducing
communication costs and facilitating information aggregation.
2.9 Price Signals and Learning
Bondarenko and Bossaerts (2000) developed and tested a model of Bayesian inference to show
with data from the Iowa Electronic Market that participants are following Bayes’ law in learning
from signals and updating constantly their beliefs. They conclude that participants have initial
beliefs about the conditional probability of future events. For instance, a participant who bets on
the outcome of an election may estimate the likelihood of victory for a particulate candidate as
60% if he performs well on the next TV debate and 35% if he performs worse. The final
estimation finally depends on a signal (in this case the performance of the candidate during the
TV debate). In a market, prices can serve as signals for individuals to update their beliefs.
Gruca et al. (2005) could provide further evidence for this theory by showing that price signals let
participants adjust their beliefs towards a market consensus. Rhode and Strumpf (2003)
observed in historical electoral prediction markets that the contract prices often started at levels
close to even odds and then converged to higher or lower price levels later if the margin of a
candidate was wide. They hypothesized that traders anticipate news to occur that forces them to
alter their predictions later. The logical conclusion is that the most accurate information should
be contained in the last trading prices prior to occurrence of the to-be-predicted event. However,
it has also been shown that individuals are prone to the hindsight bias. This bias describes the
tendency of individuals to overweight the informational relevance of new information in contrast
to prior information (Davis & Holt 1992).
Therefore, Gruca et al. (2005) pointed out that it may be crucial to collect private information
prior to any market activity in order to get an impression of the trader’s private information. When

Information Aggregation in Prediction Markets
J. Martin � Master Thesis � 27.09.2006 17
such private information is collected later after beginning of market activity it may be influenced
by information from other traders through price signals and thus represent public information.
2.10 Averaging Principle
A quite robust explanation for the mechanism of information aggregation in information markets
stems from the field of statistical psychology. A multitude of experiments conducted in the first
half of the 20th century by experimental psychologists showed that average judgments from
members of large groups often outperform the best individual judgment, even if individuals were
much more skilled (Larrick & Soll, 2006). A simple statistic phenomenon called “averaging
principle” may explain the superior performance of prediction markets compared to individual
experts. The averaging principle simply cancels out errors of individual estimates by building the
arithmetic mean of estimations from several individuals. However, to benefit from this
mechanism individual estimations need to be symmetrically distributed around the true value to
be estimated (also referred to as “bracketing”).
2.11 Opinion Pools
Much evidence from prediction markets supports the hypothesis of the “averaging principle” as
mechanism of price formation. Chen et al. (2005) conducted an empirical comparison of
prediction stock markets (TradeSports, NewsFutures) and an opinion pool (ProbabilitySports6).
The authors showed that the opinion pool market performed not significantly different compared
to the two prediction stock markets in terms of forecast accuracy. They showed furthermore that
the simple arithmetic average of opinions in opinion pools provides the best prediction metric.
Therefore, we may conclude that the information aggregating mechanism in markets acts like a
simple averaging mechanism as well.
Opinion pools like ProbabilitySports are often referred to as “expert judgement” pools and
compared as a different information aggregation institution to prediction markets (Servan-
Schreiber et al. 2004). However, participation in ProbabilitySports is allowed to every participant
who pays a small entry fee and not just to a distinguished group of experts. We may reasonably
ask whether an opinion pool like PropabilitySports might not be a kind of market itself despite
the lack of a trading system and a lacking interaction among participants. ProbabilitySports
encourages its participants to provide their private information for incentives that depend on their
level of accurate predictions in turn. In contrast to classic opinion polls, participants in opinion
pools are encouraged to reveal probability estimations of future outcomes instead of
preferences.
6 http://www.probabilitysports.com
Information Aggregation in Prediction Markets
J. Martin � Master Thesis � 27.09.2006 18
2.12 Probability Elicitation
The problem of estimating probabilities is that individuals have often not sufficient experience in
estimating probabilities as probability distributions cannot be observed directly in reality. Scoring
rules help to elicit true probability judgments of individuals by tying a payoff to a function of the
estimate (Davis & Holt 1992). Such a function measures the difference between the estimated
probability distribution and the true observed distribution.
One example of such a function is the quadratic scoring rule in the setting of binary to-be-
predicted outcome.
Payoff = 1 - (r - I)² where I is a binary variable representing the true outcome and r is the
probability estimate. If the individuals want to maximize their payoff function they need to state
the true probability estimate. The lower the absolute difference between predicted and observed
distribution the higher will be the payoff. Such a reward function was also utilized in the case of
ProbabilitySports.
2.13 Market Price and Averaging Principle
Wolfers et al. (2005b) and Gjerstad (2004) set up different formal models showing the market
price in stock markets to be very close to the mean of market participants’ beliefs if the
distribution of beliefs is symmetric. Gjerstad argues that the distribution of traders’ beliefs may
affect price formation in prediction markets. However, he contents that in the case of logarithmic
utility function market prices will usually equal to the mean of traders’ beliefs independent of the
distribution of beliefs. Wolfers et al. (2005b) could find empirical evidence for his theoretical
model in data from the opinion pool ProbabilitySports. It is therefore not illegitimate to conclude
that the market mechanism and its resulting market price work in prediction markets as an
algorithm that averages the beliefs of market participants.
However, Manski (2005) shows in his formal model that market price can diverge from the mean
of beliefs. His model assumes risk-neutral market participants and he argues that the level of
risk preference among traders does not influence price formation but rather influences the part
of budget invested. All these models differ in that they are based on restrictive assumptions.
Some models assume risk-averse traders with different levels of risk-aversion, some assume
risk-neutral traders, some assume equal utility functions for all traders, some use wealth-
weighted means (so that beliefs of traders with a higher wealth are weighted more) or non-
wealth-weighted. It is unlikely that the information aggregation mechanism behaves in such an
uniform manner and these models omit one import feature of prediction markets. The ability to
learn from the belief of other traders through price signalling, which is difficult to express within a
formal model. However, prediction markets may stimulate information exchange and adaptation
of individual beliefs and finally result in a market price that represents the mean of modified
Information Aggregation in Prediction Markets
J. Martin � Master Thesis � 27.09.2006 19
beliefs.
Gruca et. al (2005) support the idea of an averaging mechanism accounting for information
aggregation efficiency with further evidence from laboratory experiments in which they showed
that the mean of initial individual predictions from market participants highly correlated with the
mean implied by final market prices. The authors observed a tighter distribution of forecasts
around the consensus in the market compared to the initial situation and concluded thus that
markets help groups to reach a consensus.
Van Bruggen et al. (2006) found similarities between the information aggregation mechanism of
the Delphi forecasting technique and prediction markets. In the Delphi approach, experts share
their forecasts iteratively and anonymously until a consensus is reached. However, the method
lacks some important features like an incentive mechanism that fosters truthful revelation,
information research and frequent updating as one find it in prediction markets.
2.14 Aggregate Uncertainty
The success of prediction markets depends critically on whether the prediction situation shows
aggregate uncertainty. Aggregate uncertainty occurs if an event cannot be predicted with a
certain level of confidence based on the aggregated fragments of information collected from
informants. Chen et al. (2006) posit that in markets without aggregate uncertainty, the best
prediction is reached through a direct communication equilibrium. That is, if all traders
communicate their private information directly to each other so that an equilibrium can be
reached which represents the best informed prediction with which all traders can agree.
However, Chen et al. claim that in the case of aggregate uncertainty, such an equilibrium must
not necessarily be reached.
2.15 Knowledge Heterogeneity
Van Bruggen et al. (2006) differ between forecasting situations with high and low knowledge
heterogeneity. They posit that low knowledge heterogeneity occurs if informants have access to
public information and don’t differ much in their beliefs while high knowledge heterogeneity is
believed to occur if the to-be-predicted event has a high inherent uncertainty and beliefs differ
much among individuals. The authors refer to the prediction of financial indicators or sales
forecasts within a team of sales persons as a forecasting problem of low heterogeneity while the
prediction of sports events or new product success is believed to belong to a high heterogeneity
forecasting problem.
Van Bruggen et al. (2006) identified four factors to distinguish between different levels of
knowledge heterogeneity. The first includes the presence of an anchor point for the prediction.
Forecasting problems that have a strong anchor point for building the forecast (e.g. the superior

Information Aggregation in Prediction Markets
J. Martin � Master Thesis � 27.09.2006 20
past performance of a soccer team that lets informants judge the probability of future victory
higher). The second includes the amount of public vs. private information. The third includes the
inherent predictability and the fourth including environmental variability.
Van Bruggen et al. (2006) compared the forecasting performance of key informants, prediction
markets and opinion pools (which they refer to as combined judgmental forecasts). They found
that prediction markets performed better than combined forecasts and key informants in high
heterogeneity forecasting problems such as predicting the winner of soccer plays. In forecasting
situations with low knowledge heterogeneity, namely the prediction of financial indices, no
forecasting mean dominated the other in terms of prediction accuracy. However, if sports events
are thought to show high knowledge heterogeneity then it remains unclear why Chen et al.
(2005) found no significant difference in prediction accuracy between prediction markets and
combined forecasts in predicting sports events. Also, the level of heterogeneity may vary
considerably among different sports forecasting situations and may not solely be determined by
the nature of the to-be-predicted event.
2.16 Number of Traders and Informants
The paradox that was mentioned in the last section may be explained by the different number of
traders in the markets analyzed by Chen et al. (2005) and van Bruggen et al. (2006). While the
number of informants and traders in the prediction markets and opinion pools analyzed by van
Bruggen et al. was held constant at 6 traders per market, the prediction markets and opinion
pools analyzed by Chen et al. (2005) attracted often more than 100 traders.
Hansen (2003) noted in this context the superior ability of markets in pooling information from
many individuals. According to the author, pooling mechanisms work well or even better than
prediction markets when the number of traders is low or equals only one informant. However,
with an increasing number of informants he supposes markets to do a better job in selecting and
aggregating complementary pieces of information. Most pooling mechanisms simply average
different pieces of information from different informants. These information fragments may have
different degrees of completeness and relevance so that information may get lost through simple
averaging. However, the results observed in the analysis by Chen et al. (2005) and van
Bruggen et al. (2006) seem to rebut this theory as the sports forecasting markets performed only
significantly better than combined forecasts in the case of few participants but not in the case of
hundreds of participants.
Van Bruggen et al. (2006) posit that markets with only a small number of knowledgeable
participants tend to show less information aggregation efficiency. This assumption is contrary to
the marginal trader paradigm which posits that prices are determined by knowledgeable traders
regardless of their relative or absolute ratio of the trader population.
Information Aggregation in Prediction Markets
J. Martin � Master Thesis � 27.09.2006 21
2.17 Self Selection vs. External Selection
It is noteworthy to make a little objection here. Chen et al. (2005) acted on an analysis that was
performed and published earlier by Servan-Schreiber et al. (2004). In this analysis, Servan-
Schreiber et al. found a slightly significant advantage for prediction market compared to opinion
pools in terms of forecasting accuracy although they used the same data as Chen et al.
(2005).The reason for this paradox is that the analyzed opinion pool, ProbabilitySports, forced all
its informants to make a forecast for every game of the NFL season and automatically added a
value if the informants did not themselves. Chen et al. (2005) excluded these artificially added
forecasts from analysis and then found no difference between the opinion pools and the
prediction markets anymore. Here lies the reason why many scholars like Hanson (2003)
question the efficiency of the opinion pooling mechanism. In markets, informants select
themselves according to the knowledge they can add to the already contributed knowledge
represented by the market price.
However, self-selection must not necessarily lead to contribution of more accurate information.
89% of the traders that participated in the Iowa presidential markets reported they believed that
they were more informed about the election than their peers, thus showing a substantial
overconfidence bias (Berg & Rietz 2005). Therefore, we cannot simply assume self-selection to
work as the key element of efficient information aggregation in these markets.
There have been numerous attempts to increase the forecast accuracy of opinion pools by
weighting the opinions of informants. However, Chen et al. (2005) and van Bruggen et al. (2006)
did not find any improved forecast accuracy for prediction metrics with weighted opinions. There
were rarely any key informants who outperformed the mean forecast on average for a set of
different forecasts.
2.18 Market Making Mechanism
Another objection has to be made. Van Bruggen et al. (2006) used a market making trading
mechanism that differed from the one used at other prediction markets like TradeSports and
NewsFutures. The trading mechanism was designed according to the combinatorial markets rule
suggested by Hanson (2003). This rule allows traders to trade a contract any time at previously
determined price. It combines the advantages of opinion pools with an integrated scoring rule in
markets with a low number of traders with those of markets if a sufficient number of traders are
present. The mechanism increases the market price for each new buy order and decreases it for
each new sale order according to an adjustment rule. Each trader pays off the trading partner of
the previous transaction in which he was involved while the market owner pays off only the
trader of the last transaction. There is no order queue and simultaneous auction like in the
double auction mechanism used in markets like Tradesports or NewsFutures. In markets with
low liquidity, such market making mechanism will stimulate trading and thus market efficiency.

Information Aggregation in Prediction Markets
J. Martin � Master Thesis � 27.09.2006 22
However, the double auction mechanism may hold superior outcomes in markets with high
liquidity, as suggested in the next chapter.
2.19 Double Auction Market Mechanism
Since Chamberlain’s first classroom experiments with double auctions in (Chamberlain 1948)
many efforts have spent to investigate this type of market mechanism which showed high
efficiency in reaching competitive outcomes. The major advantage of double auctions compared
to other market institutions is that bidding processes of buyers and sellers occur simultaneously
and in a decentralized manner. Bidders submit either a sell order at a limit price (bid) or a buy
order at a limit price (ask). Trades usually occur at prices somewhere between limit ask and limit
bid prices if the bid (or ask) price of the submitted order matches the ask (or bid) price of the
best outstanding order depending on the trading mechanism. If the bid or ask price of a
submitted order doesn’t match the ask (or bid) price of an existing order the order will be added
to a queue.
A typical characteristic of such markets is that prices converge quickly towards the efficient
equilibrium (Davis & Holt 1992). It should be noted that this definition of market efficiency, which
stems from the field of microeconomics, differs from the definition provided by capital market
theory and discussed earlier. The definition from microeconomics refers to an allocative
efficiency where no additional surplus in buyer or seller rent can be extracted from further
trading. In terms of pareto efficiency, allocative efficiency equals an equilibrium where no trader
can gain higher benefit through trading without decreasing the benefit of another trader. In other
words, the equilibrium price represents an optimal “information consensus” among all market
participants or a forecast to which everyone can agree to some extend.
Gode and Sunder (1993) showed in a set of experiment with programmed “zero-intelligence”
traders in artificial computer markets even don’t need to have experienced or educated traders
present to achieve efficient outcomes. This is in contrast to the view of Forsythe et al. (1992) and
other scholars who account the presence of experienced traders in markets as key to efficient
markets and successful information aggregation.
However, we need to differ between allocative efficiency and information aggregation efficiency.
It remains unclear how allocative efficiency really affects information aggregation efficiency.
2.20 Contract Types
Wolfers and Zitzewitz (2004) distinguish between three contract types designed to estimate
target quantities or probabilities in prediction markets. Winner-takes-all contracts (also referred
to as binary contracts) pay out a certain payoff if a certain outcome y of an event occurs and
nothing in the case of the opposite outcome. The reservation price a trader is willing to pay for

Information Aggregation in Prediction Markets
J. Martin � Master Thesis � 27.09.2006 23
the contract at a certain time prior to the event thus represents the final payoff times its expected
probability (e.g. winning chance of a particular soccer team).
Index contracts (also called linear contracts) pay out a payoff tied to the index value that is
directly linked to the outcome of an event (e.g. election vote share of a party)
The respective reservation price a trader is willing to pay for such a contract therefore
corresponds to his estimate of the expected index value.
Spread contracts pay out a payoff if the to be predicted value falls within a mutually exclusive set
of ranges or above a threshold value (e.g. box office revenues for a film will be between 100 and
125 Mio. Dollar.)
2.21 Supply and Demand Structure
With knowledge of the marketer’s reservation prices it is possible to depict supply and demand
curves. In goods markets these reservation prices are determined by cost and value of goods. In
prediction markets reservation prices must correspond to the perceived value of the traded
security which is tied to the outcome of a future event. This value is in turn determined by the
traders’ probability estimation.
If supply and demand curves are symmetric with a falling demand curve and an increasing
supply curve they intersect exactly in the midst between reservation bid and ask values. In the
setting of a symmetric prediction market, the resulting equilibrium price then represents a mean
of individual’s probability estimations (see Fig. 1 left hand). In fact, demand and supply structure
reflects the distribution of traders’ beliefs.
Figure 2.1: Equilibrated Supply (S) & Demand (D) st ructure and Information Averaging
p
p‘
D
S
D
S‘

Information Aggregation in Prediction Markets
J. Martin � Master Thesis � 27.09.2006 24
The price formation mechanism of double auction markets could thus explain the similarities
found among opinion pools and prediction markets as observed by Gruca et. al. (2005).
However, in the case of asymmetric markets or box-shape curves, trading prices often form
above or below the average of reservation prices depending on the elasticity of the demand or
supply curve (see Fig. 1 right hand and Fig. 2). This raises inevitably the question whether such
prices have lower prediction accuracy compared to predictions formed by averaging.
Figure 2.2: Box-shape Demand (D’) and Supply (S’) S tructure with Non-determinable Equilibrium
Price
2.22 Allocative Efficiency and Competitive Prices
Vernon Smith (1962) observed that after sudden shifts in demand and supply it took more time
and number of trades to reach competitive price levels again. Such shifts must occur quite often
in prediction markets if new information about the underlying event of an asset is becoming
available and is updated.
Smith provided performance indicators to measure the market efficiency with regard to
competitive equilibrium like the ratio of possible rent surplus obtained by traders and the
coefficient of price convergence. The ratio of possible rent surplus measures which percentage
of the total buyer and seller surplus (the difference between reservation prices of traders and the
actual trading prices times the quantity) was obtained through trading. The coefficient of price
convergence measure the mean divergence of the real transactions prices from the
hypothetically constructed equilibrium price which represents an ideal situation of optimal
efficiency. An interesting question is whether such performance indicators might indicate the
competitive outcome and accuracy of prediction markets ex ante.
D‘
p‘
S‘
Information Aggregation in Prediction Markets
J. Martin � Master Thesis � 27.09.2006 25
3 Conceptual Framework
3.1 Introduction
The conceptual model of this thesis is composed of two parts:
The first part 3.2 is devoted to restate the conceptual model that is inferred from the existing
trader-based model of information aggregation by Forsythe et al. (1992) with different
hypotheses regarding the relationship of independent and dependent variables.
The second part 3.3 is devoted to form a new theoretical model based on results of the literature
review.
3.2 Conceptual model (Part I) – Trader-based Model of Information Aggregation
As discussed in chapter 2 the trader-based model of information aggregation by Forsythe et al.
(1992) is currently the most cited and commonly used model. Central to its paradigm is the
presence of a certain type of traders in the market, called “marginal”-traders. These traders are
assumed to show less biases and to be able to recognize relevant information in opposite to
non-marginal traders. Marginal traders are supposed to determine market prices and are
therefore assumed to be responsible for efficient information aggregation in prediction markets.
Marginal traders can be identified by their trading behaviour as they usually submit orders close
to last trading price that are matched subsequently by other (non-marginal) traders.
3.2.1 Presence of Biases
Forsythe et al. (1992) observed that non-marginal traders who indicated a preference for a
certain outcome (e.g. election of a candidate) tended to hold more assets related to that
outcome and tended to pay higher prices for such assets. They inferred from that observation
that these traders would overestimate the likelihood of that outcome and make less accurate
predictions, a bias known as contrast-assimilation bias. They concluded that these traders
cannot account for the accurate predictions obtained by the aggregated market result (market
price) and that, thus, marginal traders must contribute all accurate information to the market
through their trading behaviour.
In the classic model, the presence of biases is therefore assumed to depend on trader type and
to affect individual information accuracy. As discussed in the literature review, several
researchers did not confirm such a relationship. Therefore, in our revisited model, we
hypothesize a non-existent relationship of trader type and presence of biases:

Information Aggregation in Prediction Markets
J. Martin � Master Thesis � 27.09.2006 26
H1: Marginal traders do not show a higher presence of contrast-assimilation biases than non-
marginal traders
The construct of presence of contrast-assimilation biases can be measured by inquiring traders
about their preference for a securities’ related outcome. It is expected that individuals exhibiting
a bias should indicate a clear preference for either soccer team A or B. The utilized experimental
setting will include a questionnaire that is submitted together with each order and that asks
traders indicating either a preference for a soccer team or no preference.
3.2.2 Choice of Relevant Information and Relevant I nformation Sources
Forsythe et al. (1992) analyzed the trading behaviour of marginal traders with regard to the
occurrence of major news events during the market course. They found a relationship and
inferred that marginal traders must be better in recognizing accurate information via news.
However, that construct wasn’t tested directly.
Following the previous line of reasoning with the lack of empirical evidence, we hypothesize that
there is no such relationship:
H2: Marginal and non-marginal traders do not differ in their choice of information sources
The construct information source will measured through a questionnaire that is provided
together with the order screen and asked to be filled out for every order.
3.2.3 Conclusion
Fig. 3.1 depicts the assumptions. In contrast to the predominant model of information
aggregation, it is hypothesized that the type of trader will not differ in the presence of contrast-
assimilation biases implied by indicated preferences and neither in the utilized sources of
information.
Trader Type Individual Information Accuracy
Presence of Biases
Information Source
0
0
0
Figure 3.1: Trader-based Conceptual Model

Information Aggregation in Prediction Markets
J. Martin � Master Thesis � 27.09.2006 27
Furthermore, we hypothesize that there are no differences in individual information accuracy
between different trader types.
H3: Marginal and non-marginal trader do not differ in terms of individual information accuracy.
The construct of individual information accuracy will be measured through a questionnaire which
asks people to estimate the probability of the event that is related to the security traded in the
market. Afterwards, the mean absolute forecasting error can be compared for each trader.
3.3 Conceptual model (Part II) – Market-based Model of Information Aggregation
As discussed in the literature review, experimental economists have identified several
determinants of market efficiency that affect price formation in double auction markets. Based on
the findings of Smith (1962), a new model of information aggregation that considers allocative
efficiency and equilibrated supply/demand structure as determinants. As noted in the literature
review, statistical averaging is an information aggregation mechanism that has been shown to
achieve the same prediction accuracy as double auction markets. In addition, Gruca et al.
(2005) showed empirical evidence that the mean of private information (individual probability
estimates) among market participants tends to converge to the market price. It is therefore
logical to conclude that the double auction mechanism averages information of market
participants as well.
3.3.1 Supply and Demand
In double auction markets, demand and supply curves correspond to the set of individual
reservation prices in conjunction with demanded or offered quantity. In a prediction market,
these reservation prices must logically correspond to probability estimations of the asset’s
underlying future event in conjunction with demanded or offered quantity. If supply and demand
curves are symmetric and are neither completely inelastic nor completely elastic they will
intersect exactly at the average of all reservation prices. The competitive market price level p will
then correspond to the average of all traders’ probability estimations or the average of all
traders’ private information. Fig 3.2 (left side) depicts this situation. The points on the demand
curves correspond to a set of probability estimations (θi1,…, θi
n) for the contracts’ underlying
event i by all traders. The points of the supply curve correspond to the probability of the
contracts’ underlying opposite event k.
Information Aggregation in Prediction Markets
J. Martin � Master Thesis � 27.09.2006 28
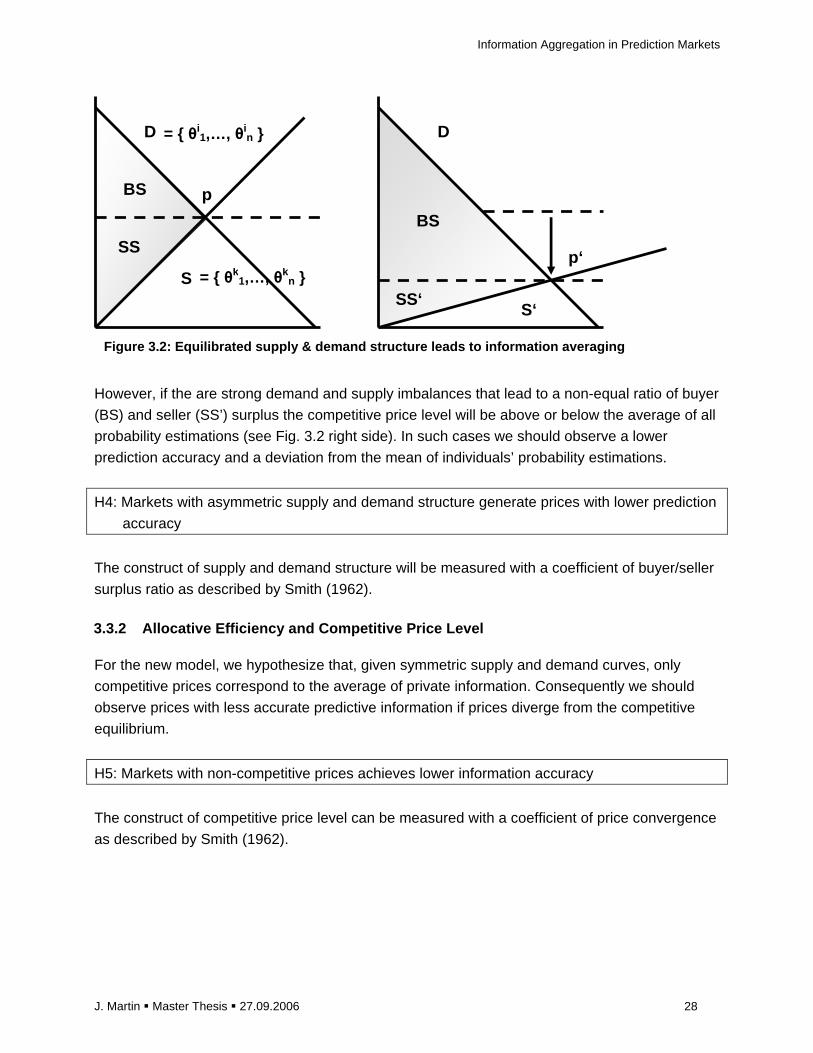
However, if the are strong demand and supply imbalances that lead to a non-equal ratio of buyer
(BS) and seller (SS’) surplus the competitive price level will be above or below the average of all
probability estimations (see Fig. 3.2 right side). In such cases we should observe a lower
prediction accuracy and a deviation from the mean of individuals’ probability estimations.
H4: Markets with asymmetric supply and demand structure generate prices with lower prediction
accuracy
The construct of supply and demand structure will be measured with a coefficient of buyer/seller
surplus ratio as described by Smith (1962).
3.3.2 Allocative Efficiency and Competitive Price L evel
For the new model, we hypothesize that, given symmetric supply and demand curves, only
competitive prices correspond to the average of private information. Consequently we should
observe prices with less accurate predictive information if prices diverge from the competitive
equilibrium.
H5: Markets with non-competitive prices achieves lower information accuracy
The construct of competitive price level can be measured with a coefficient of price convergence
as described by Smith (1962).
p
p‘
D
S
D
S‘
BS
SS
BS
SS‘
Figure 3.2: Equilibrated supply & demand structure leads to information averaging
= { θi1,…, θi
n }
= { θk1,…, θk
n }
Information Aggregation in Prediction Markets
J. Martin � Master Thesis � 27.09.2006 29
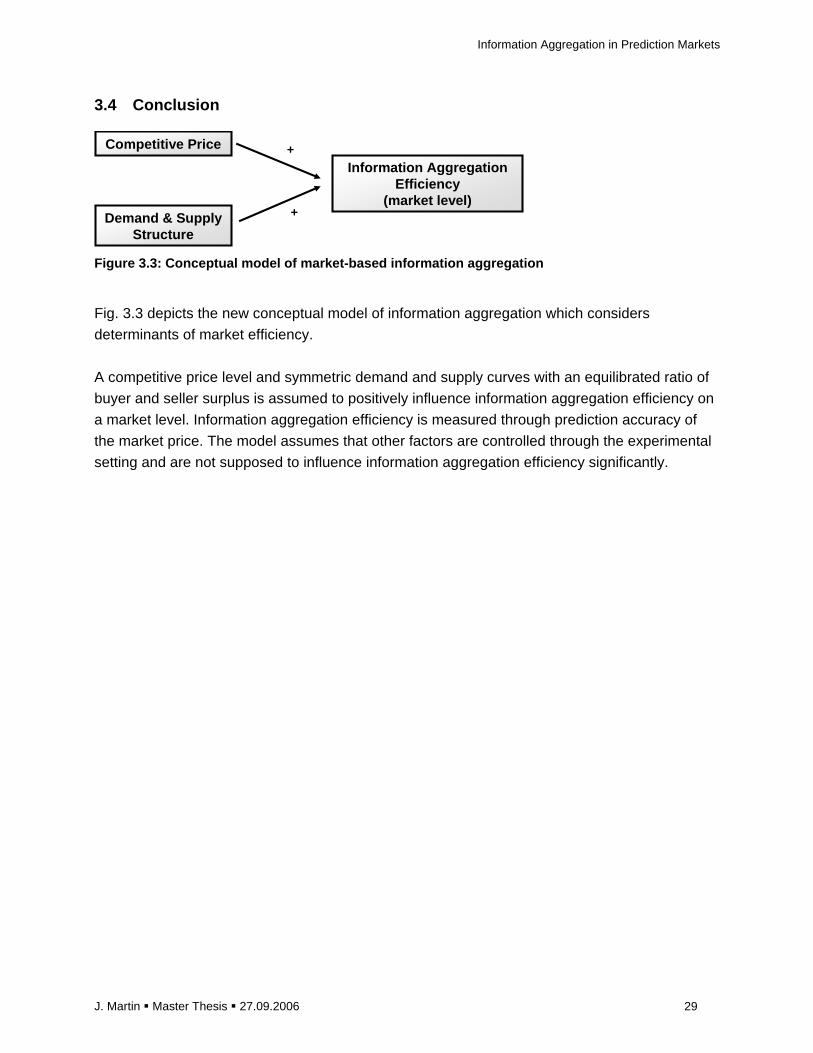
3.4 Conclusion
Competitive Price
Demand & SupplyStructure
Information AggregationEfficiency
(market level)+
+
Figure 3.3: Conceptual model of market-based inform ation aggregation
Fig. 3.3 depicts the new conceptual model of information aggregation which considers
determinants of market efficiency.
A competitive price level and symmetric demand and supply curves with an equilibrated ratio of
buyer and seller surplus is assumed to positively influence information aggregation efficiency on
a market level. Information aggregation efficiency is measured through prediction accuracy of
the market price. The model assumes that other factors are controlled through the experimental
setting and are not supposed to influence information aggregation efficiency significantly.

Information Aggregation in Prediction Markets
J. Martin � Master Thesis � 27.09.2006 30
4 Experimental Design & Research Methodology
4.1 Introduction
The following chapter contains a description of the experimental design used to obtain the data
for empirical analysis in this research. A set of prediction markets was run to collect private
information of traders along with market prices. The market and trading mechanism is described
in chapter 4.2 in detail. Chapter 4.3 contains a description of the methodologies used to
measure the constructs and variables that form the conceptual model.
4.2 Experimental Design
4.2.1 Market description
An online trading platform with a set of continuous double auction prediction markets, called
SoccerExchange7, was set up and run for the purpose of this research in order to collect data
about prediction accuracy of individual traders and markets as whole. Soccer matches of the
FIFA world cup 2006 were chosen as events to be predicted. A total of 128 different shares and
markets were offered for trading, one share for each match and participating team.
The reason why the soccer world cup has been chosen is that most participants are well
informed about this event due to the popular nature of the soccer in Europe. Participants have
easy access to information about soccer matches and all relevant information will be provided
sufficiently by media. In addition, it has been shown in previous prediction markets that markets
about sports outcomes attract more interest and a higher number of participants (Servan-
Schreiber et al. 2004). Furthermore, a high number of participants will have clear preferences for
particular teams they bet on so that indicators of assimilation contrast biases can be measured
easily.
4.2.2 Market design
A market design comparable to that of other prediction markets discussed in literature like the
Iowa Electronic Market, Tradesports or NewsFutures was chosen.
The market included “winner-takes-all”-contracts that paid out previously defined dividends for
the contract of the winning soccer team after each soccer match. To ensure participation, prizes
were offered for best-performing traders. In contrast to common experimental prediction
markets, participants were required to state explicitly their probability estimation (also referred to
as individual forecast) for the related outcome, their source of information for judging that 7 See http://www.soccerexchange.org for further information

Information Aggregation in Prediction Markets
J. Martin � Master Thesis � 27.09.2006 31
probability and their preference for an outcome when submitting a bid or ask order in the trading
system. One major difference in comparison to IEM and Tradesports was the use of play money
instead of real money. The use of an open source software package for building the trading
platform lead to further differences in contract design and market information available to traders
due to technical limitations as will be described in the following paragraphs.
The markets opened on May 28th (two weeks before the kick-off match) and remained open until
July 9th (the day of the final match). Every market was open permanently for trade 24h per day
until closure. The number of days a market was opened prior to the match varied from 3 days to
19 days depending on whether it was a match of the pre- or second round (for a detailed list of
all markets see Appendix). Markets of the 2nd round were opened after the winning teams of the
pre-round had become known so that they were opened only for a limited number of trading
days prior to the match. The market was a zero-sum market, meaning that the sum of (play-
money) investments by all traders corresponded to the sum of returns. To ensure participation,
prizes were offered for the three participants with the highest trading profit.
4.2.3 Trading Accounts
Marketers could register for one account per person for free throughout the world cup
tournament. After registration each participant received a trading account with 100.000$ of a
virtual currency (SoccerDollar) which he could use to buy or sell shares or portfolios. He could
use this play money to either purchase or sell unit portfolios that contain a pair of shares of both
competing teams respectively. Alternatively, marketers could buy or sell shares in their
respective market by trading with other market participants.
Each trader got information about his account value (with his assets valued at current market
prices), current trading performance (profits/losses), a graph of trading performance history, the
amount of free cash available for submitting new orders, a list of current holdings, outstanding
orders and transactions history.
The system allowed the trader to see list of all tradable shares with last trading price and current
outstanding bid and ask price. It permitted also to see a list of portfolios containing a pair of
opposite shares for each match.
4.2.4 Contract Design
A different contract was offered for every match and participating soccer team (in total 128
different contracts for 64 matches). Contracts were tied to a final payoff of either 100 or 0 S$
depending on the outcome of a corresponding soccer match. For instance, marketers could
trade either Costa Rica or Germany shares prior to the opening match. A contract was denoted
usually in the form “Costa Rica vs. Germany”, meaning that the share’s assumed outcome was
that CostaRica would beat Germany. After termination of the match, the holder of the winners’

Information Aggregation in Prediction Markets
J. Martin � Master Thesis � 27.09.2006 32
share received usually 100 S$ cash payment, while the holder of the losers’ share received no
payment.
Every share could be traded with other traders in its respective market. There was no Initial
Public Offering or initial endowment of trader accounts with shares. Instead, in order to circulate
shares, traders could buy portfolios (see next paragraph) and unbundle them to sell the shares
in their respective markets independently. This contract design was used in the IEM as well.
Traders were not allowed to sell short but portfolios allowed them to exert similar trading
strategies. Another advantage of offering portfolios is to prevent contract prizes from getting out
of hand in bubbles resulting from extreme supply imbalances.
A market was usually closed on a so-called arbitration date when the outcome of the respective
share (e.g. Team A has beaten Team B) was determined. The arbitration date was usually 2-3
hours after end of the match so that additional play times could be considered as well. A final
payoff of 100 S$ was then paid to the holder if the respective soccer team won. Otherwise the
holder received no payoff or, in the case of a draw or undeterminable result, he received 50 S$.
Such a valuation function allows a transformation of the traders’ probability estimations about
the likelihood of an outcome into prices, given that traders are risk-neutral.
There are a number of alternative contract designs used by other prediction markets that need
to be considered when comparing market results of different markets. For instance, Tradesports
offered for each world cup match an additional contract for draw outcomes. Newsfutures usually
tied opposite share prices together through a mechanism so that the prices of opposite shares
usually sum up to 100. Share prices of opposite contracts were not tied together in the
experiments of this research. In consequence, such share prices could add up to more or less
than 100 depending on market liquidity and efficiency and may not have reflected probabilities
accordingly. In order to adjust for such effects in analysis, also normalized prizes were
considered. In addition, Tradesports limited the outcome of match results to the state after a play
time of 90 min, while the contracts in this research were tied to the state of winning after
termination of the game (which could be well after 90 min due to prolongation). For this reason,
markets of 2nd round matches could not be compared among SoccerExchange and TradeSports
as the matches often included a significant amount of additional play time that changed the base
of valuation.
Information Aggregation in Prediction Markets
J. Martin � Master Thesis � 27.09.2006 33
4.2.5 Trading rules
Traders could submit orders by selecting the appropriate share, entering the quantity of units
and the maximum buying price (bid) or the minimum selling price (ask). The order was then
processed as follows:
If the bid (or ask) price was above (or below) the best current outstanding ask (or bid) price in
the order queue a transaction was executed at the price of the current outstanding ask (or bid)
price. For instance, if another trader had previously submitted a sell order at 60 S$ that
remained in the queue and if a different trader had submitted a new buy order at 70 S$ a
transaction would have been executed at 60 S$. If the quantity of both involved orders differed
the transaction was executed at the minor quantity of both orders. A separate order at the
remaining quantity was then kept in the order queue in such a case. For instance, if one trader in
the previous example had ordered to buy 50 shares while the best outstanding sell order was at
a quantity of 40 shares the remaining buy order at a price of 70 S$ and a quantity of 10 shares
would have been added to the queue.
The order processing mechanism checked only the best outstanding order but ignored the
following orders in the queue. This means that, in the case of our previous example, if a further
order at a price below 70 S$ had existed previously in the queue it would not have been
executed immediately. This inconvenience was due to the software design of the open source
software used. In the original market design of IEM, as described by Forsythe (1992), remaining
order quantities were cancelled immediately following the transaction and not kept in the queue.
However, traders could delete their unmatched orders themselves manually. Traders could not
sell shares to or buy shares from themselves.
No charges and transaction fees were imposed to traders. Traders could not trade on margin;
they were usually required to have a sufficient amount of free cash to submit a buy order.
Traders were usually allowed to trade during the period of match beginning until arbitration date.
The advantage of such a rule is to allow traders to liquidate their held contracts when the final
state is more or less obvious some time before arbitration (e.g. a far ledge of one team during a
match before half time).
4.2.6 Portfolios
Portfolios were offered to enable traders to buy or sell shares independently from the demand
and supply situation in market. One unit of a portfolio usually consisted of a pair of shares of the
two competing teams. The buyer could sell the included shares independently through the
respective markets at the market price if desired. Traders could buy an unlimited number of
portfolio units for every soccer match could be bought any time for a fixed price of 100 S$, given
that a trader had sufficient amount of cash available in his account. Traders could also sell
Information Aggregation in Prediction Markets
J. Martin � Master Thesis � 27.09.2006 34
portfolios back to the market at a price of 100 S$ any time, given that they had enough pairs of
opposing shares in their account (the portfolio price corresponded to the guaranteed final payoff
of both included shares in sum).
The advantage of offering portfolios is that traders have more options of profiting from arbitrage
and trading. For instance, if a trader wants to purchase a specific share and liquidity in the
respective market is not sufficient he can purchase a portfolio and sell the opposite share in its
respective market. Demand and supply can be better balanced and market inefficiencies like
non-competitive prices and bubbles can be limited.
4.2.7 Market Information
Trading was anonymous, meaning that traders could not recognize the identity of other bidders.
Traders could see the entire queue of outstanding bid and ask orders. They were provided
information about past transaction prices and the volume of shares held. In addition, a
continuously updated market ticker that informed through an acoustic signal about new orders
and transactions was offered. The purpose of the acoustic market ticker was to increase market
liquidity by making traders more vigilant which is important to prevent cheating attempts (see
chapter 5 for a further discussion of cheating attempts).
Each transaction and order was logged in the logfiles.
4.2.8 Questionnaire
The experimental design included a questionnaire that was provided together with the order
submission form. People were asked to state their preference for their team, a likelihood
estimation of that outcome and the source of their information (see the appendix for the
questionnaire in detail). This data was imposed with every order submitted. However, a trader
were neither forced to fill out the questionnaire, nor was the likelihood estimation embedded in a
scoring rule function as would be necessary to reveal true estimates. The reason for this was to
limit complexity of the game to ensure a sufficient level of participation.
4.2.9 Security Issues
In order to prevent users from opening multiple accounts, IP addresses of each user were
tracked and logged for every transaction. New account registrations needed to be approved first
by the administrator before account opening. In addition, freemail addresses were not allowed.
This security measure was introduced two weeks after market opening when several individuals
attempted to open multiple accounts through the same ip address and computer.

Information Aggregation in Prediction Markets
J. Martin � Master Thesis � 27.09.2006 35
4.3 Data Selection & Measurement of Constructs
In the following chapter, the methodology for measurement of the variables and constructs that
were described in chapter 3.2 and 3.3 is described.
4.3.1 Data Selection
The data used for empirical analysis in this research stems from the set of experimental
prediction markets that are described in 4.2. The dataset contains transactions, orders and
answered questionnaires by market participants.
As mentioned in the market description (4.2.2), traders were allowed to make transactions and
submit orders after beginning of the soccer matches. However, the data relevant for
investigation of information aggregation and prediction accuracy includes all transactions and
orders prior to the to-be-predicted event. We are only interested in the predictive capability of
traders and markets. Therefore, we will consider only the data prior to beginning of the matches
for analysis.
A considerable amount of data used for analysis stems from the questionnaires that were asked
to fill out along which every order. However, as traders were not required to fill out the
questionnaire, the responding rate was low but varied depending on the market. For purposes of
data analysis of supply, demand and equilibrium price only markets that showed respondent
rates above 75% and generated more than 10 orders were selected for analysis. Analogously,
the data for comparing individual statistics of traders were chosen. Questionnaire responses
were checked for coherence and only valid datasets were used for analysis.
4.3.2 Measurement of Market Prices
Typically, the last trading price is used in prediction markets as prediction metric as this price
should reflect the most recently updated information about the to-be-predicted event. However,
momentum prices can sometimes diverge from rational levels and be the results of market
bubbles, non-rationally behaving traders or collaboration. Therefore, we will also measure mean
trading prices. However, if we assume that the last trading price contains the most actual
information by traders, it should be the most accurate prediction metric compared to mean
trading prices.
In addition, we will distinguish between normalized and non-normalized market prices. As the
prices of shares corresponding to opposite teams of a match are not tied to each other in this
experiment they doesn’t necessarily sum up to 100 S$ although they should if the markets were
completely efficient. In consequence, we can artificially normalize these prices and consider
them as ratios in addition to non-normalized prices.

Information Aggregation in Prediction Markets
J. Martin � Master Thesis � 27.09.2006 36
4.3.3 Measurement of Prediction Accuracy
The terms prediction or information accuracy and information aggregation efficiency are used
simultaneous in this thesis. They describe the ability of a market or individual to make the best
prediction of an event given the information about that event available. It makes only sense the
measure prediction accuracy of markets in relative terms. This makes it difficult to compare the
prediction accuracy of different markets which attempt to predict different events. Only the
prediction accuracy of different markets run on the same event but with different settings can be
compared. Analogously, it makes only sense to compare the prediction accuracy of individuals
within a market but not between different markets. In order determine the prediction accuracy of
a metric within a market we can compare the accuracy of two or more different metrics within the
market. For instance, we can compare the predictive accuracy of the last trading price compared
to the mean of individual forecasts for that market.
As a quantitative measure for prediction accuracy two main metrics are commonly used in the
literature: the mean absolute forecast error (MAFE) and the percentage of accurately predicted
outcomes.
The MAFE measures the absolute difference between observed and predicted outcome. In the
case of binary winner-takes-all contract, it is MAFE= |o - pl| o=100 or 0=0 depending on the state
of the ooutcome where pl is the last trading price.
The percentage of accurately predicted outcomes measures the percentage of cases in which
the last trading price indicated an outcome (in the case of our analysis pl>50 for a and ) and that
prediction was later confirmed.
4.3.4 Measurement of Marginal Traders
In order to identify marginal traders, Forsythe et al. distinguished between limit orders that are
entered into the order queue without resulting in an immediate trade and market orders that lead
to an immediate transaction by matching a previously submitted outstanding order. Marginal
traders are assumed to submit more limit orders close to the market price while non-marginal
traders are assumed to submit limit orders far away from market price or at the market price.
Forsythe et al. composed an index that took the value 1 if:
a trader submitted either an order that was not matched immediately but later on during a day by
another order
or a trader submitted an order that was within two cents (~1%) of the last trade.
A trader was then identified as marginal trader if his index was 1 for at least three days.
However, such a measure is inconvenient as it an absolute value that doesn’t take into

Information Aggregation in Prediction Markets
J. Martin � Master Thesis � 27.09.2006 37
consideration proportionally traders that joined the market later. Due to reasons of feasibility of
dataset analysis only the first rule of the Forsythe’s index will be used in this research. However,
as price volatility in the markets of this research were much higher than in political stock market
such as the IEM price variations below 1% were rarely observed within SoccerExchange and did
not influence the distinction between marginal and non-marginal traders.
A further inconvenience of that measure is that it doesn’t consider the ratio of marginal trades vs.
non-marginal trades for each trader. Therefore, we use the relation of marginal vs. non-marginal
trades as additional measure. A trader is then considered a marginal trader if more than half of
his trades were marginal.
4.3.5 Measurement of Contrast-assimilation Bias
Forsythe et al conducted market polls during the Iowa presidential election market and asked
traders to state their preference for a candidate and their expectation of that candidate to win (in
particular after debates). In addition, they analyzed net purchases of shares of particular
candidates for each trader and related them to the preference for that candidate. By this way,
they inferred from a positive net purchase (purchase - sales of a particular share) of shares in
conjunction with a preference for the corresponding candidate the presence of contrast-
assimilation biases. Analogously to the index of days with marginal trading activity, Forsythe et
al. measured the number of days with net purchase activity. They inferred from the amount of
net purchases that supporters showed a higher valuation of the underlying share by buying
significantly more of it (Forsythe 1992). However, this inference is somewhat ambiguous as it
cannot be inferred from the quantity of shares purchased or sold how the traders valued them.
Following this methodology, we measure the percentage of trades for which the trader indicated
a preference and showed positive net purchases for each trader group (marginal vs. non-
marginal trader). However, due to the inconvenience of measuring just the number of days with
a particular trading method, we will measure the percentage of trades with a particular trading
method instead.
4.3.6 Measurement of Information Source
Forsythe et al. attempted to measure the influence of news on trading behaviour. They assumed
that the occurrence of news in a market could be measured when the absolute value of change
in price of a stock was greater than two standard deviations. In addition, they interviewed
reporters on their assessment of news events and compared these days with trading behaviour
of marginal and non-marginal traders. From such behaviour patterns, Forsythe et al. inferred that
marginal traders must more often use news as source of information. (Forsythe 1992)
In this research, the source of information used by traders for building probability estimation is

Information Aggregation in Prediction Markets
J. Martin � Master Thesis � 27.09.2006 38
measured directly through a questionnaire. Traders are asked for their most important source of
information (news, past performance, intuition, expert recommendation, market information or
other). This data serves to compare sources of information among marginal and non-marginal
traders.
4.3.7 Measurement of Competitive Price Level
Vernon Smith described a method to measure convergence towards a competitive price level
(Smith 1964). The competitive price level is defined as the point of intersection of demand and
supply curve in markets where no additional surplus can be extracted by trading. He uses the
coefficient of convergence alpha to measure the exchange price variation relative to competitive
price levels:
0
0100p
σα ⋅=
where he uses the ratio of standard deviation around the equilibrium price and the equilibrium
price.
We will use this indicator analogously to measure the level of competitiveness of market prices.
The following paragraph will describe how to construct demand and supply curves necessary for
determination of the competitive price level.
4.3.8 Constructing Demand and Aupply Curves for Pre diction markets
In classic experimental economics, supply and demand curves are drawn according to
reservation prices and quantities that are communicated to experiment participants. In prediction
markets, marketers build their reservation prices individually according to probability estimations.
In the experiment conducted for this research, participants were asked to state their individual
probability estimations with each market order. This information, together with the quantity of
orders, serves to plot demand and supply curves. However, as not all participants filled out the
questionnaire conscientiously, it is not possible to plot a completely realistic image of the
demand and supply. We will select only the markets with the highest response rates.
In addition, an analysis of the relationship of limit order price and reservation price will be
conducted to reveal whether reservation prices can be inferred from limit order prices directly.
Orders that were submitted and cancelled later throughout the course of a market have to be
excluded from analysis as well.
4.3.9 Measuring Supply and Demand Imbalances
As discussed in 3.3.1 supply and demand imbalances could lead to prices that are either not
competitive or don’t represent the mean of traders’ beliefs.

Information Aggregation in Prediction Markets
J. Martin � Master Thesis � 27.09.2006 39
The best way to measure supply and demand structure in a market with a high number of
participants would be to measure the slope of the curves. However, in experimental markets with
a limited number of participants, such as in our experiment, supply and demand curves show
rarely a continuous shape but rather a stepped shape. Therefore, as it is difficult to infer slope
from asymmetrically stepped curves, we will infer demand and supply structure from the ratio of
buyer and seller surplus.
Information Aggregation in Prediction Markets
J. Martin � Master Thesis � 27.09.2006 40
5 Data Analysis & Empirical Results
5.1 Introduction
The following chapter presents an empirical data analysis to test the hypotheses regarding the
influence of trader characteristics, allocative efficiency and demand and supply structure on
information aggregation efficiency as they were elaborated in chapter 3. This analysis is
conducted according to the methodology described in chapter 4 by using data obtained from a
set of experimental prediction markets conducted within the scope of this research. In chapter
5.2, more general observations and impressions of the experiment results are presented. In
chapter 5.3, results of the analysis of the trader characteristics such as trader type, preferences
and information sources and their influence of prediction accuracy are presented. In chapter 5.4,
results of the analysis relating allocative efficiency such as competitive price levels as well as
supply and demand structure are presented. The chapter concludes with a reflection about the
results in 5.6 and implications for practice in 5.7.
5.2 General Observations
5.2.1 Market Activity
Table 5.1 shows the statistics of the market activity. Of 132 market experiments conducted, 4 did
not result in any transactions and market price. With an average of 6.4 traders per market, the
number of market participants was far lower than that of comparable prediction markets. Some
markets attracted only as few as 2 active traders, the most active markets attracting as much as
16 active traders. There were 38 active traders registered in total. Participants included mainly
members of Erasmus University Rotterdam and other universities but also some participants
from outside university. The market activity was higher for markets of popular soccer teams (as
e.g. Germany, Brazil and the Netherlands). While the number of traders was low, the volume of
traded contracts and the turnover was quite fair as some traders showed high trading activity.
A particular problem was the low questionnaire response rate. On average, individuals did fill out
the questionnaire for 68 % of the orders submitted. However, in some markets the response rate
was below 40%. Therefore, for some analysis problems requiring a high overall response rate
such as the analysis of allocative efficiency and demand and supply structure only markets with
at least 75% response rate were chosen. However, the low number of traders should not affect
the representativeness of this research as many real world applications of prediction markets
such as business forecasting markets will include only a low number of traders comparable to
the one observed in the SoccerExchange experimental markets of this research. Experimental
markets conducted within the scope of other research included often markets with low number of
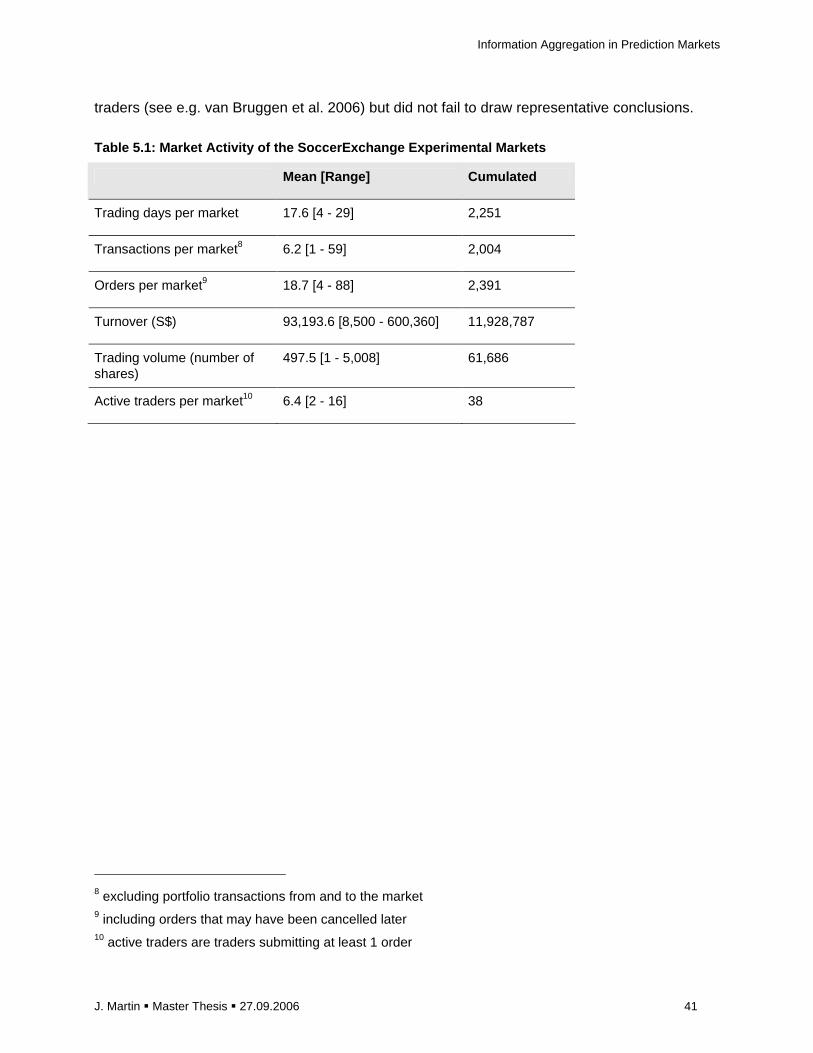
Information Aggregation in Prediction Markets
J. Martin � Master Thesis � 27.09.2006 41
traders (see e.g. van Bruggen et al. 2006) but did not fail to draw representative conclusions.
Table 5.1: Market Activity of the SoccerExchange Experimental Markets
Mean [Range] Cumulated
Trading days per market 17.6 [4 - 29] 2,251
Transactions per market8 6.2 [1 - 59] 2,004
Orders per market9 18.7 [4 - 88] 2,391
Turnover (S$) 93,193.6 [8,500 - 600,360] 11,928,787
Trading volume (number of shares)
497.5 [1 - 5,008] 61,686
Active traders per market10 6.4 [2 - 16] 38
8 excluding portfolio transactions from and to the market 9 including orders that may have been cancelled later 10 active traders are traders submitting at least 1 order
Information Aggregation in Prediction Markets
J. Martin � Master Thesis � 27.09.2006 42
5.2.2 Prediction Performance
Overall, the markets performed quite well in predicting the favourites of soccer world cup
matches. Non-normalized market prices predicted the winning team11 correctly in 72.3% of the
cases as shown in table 5.2. Normalized prices were less accurate in predicting winners with a
success rate of 66.1%. However, this difference is not statistically significant. Servan-Schreiber
et al. (2004) reported a success rate of 66% in predicting the favourite for comparable sports
prediction markets of NFL Football matches that attracted around 50-200 traders per market.
Thus, the non-normalized market prices of this research experiment performed remarkably well
as prediction metric despite the low number of participants present in the market. Like van
Bruggen et al. (2006) no significant correlation between trading activity and forecasting accuracy
was found.
Interestingly, market prices performed better in predicting the losing teams than the winning
teams, the highest lead margins occurring with non-normalized mean individual forecasts and
non-normalized last transaction prices. However, the difference was not significant. This paradox
should deserve attention in further research and should be analyzed in markets whose opposite
binary contracts are not tied together (as in the markets of this research) and which generate a
higher number of observations. This phenomenon might be explained by the tendency of traders
to overestimate the winning chances of favourites and to underestimate the losing chances of
underdogs as observed by Berg & Rietz (2002). This type of bias may be higher for favourites
than for underdogs. Unfortunately, such a bias could not be found in the markets of TradeSports
which are compared in the next chapter. The phenomenon might be related to the particular
trading mechanism utilized in the SoccerExchange experimental markets12.
Overall, non-normalized last trading prices seem to have been better prediction metrics for
underdogs and winners in total than normalized last trading prices, non-normalized and
normalized mean individual forecasts. But these differences are again not statistically significant.
11 “favorites” were implied by a last trading price PL>50 S$, underdogs were implied by a last trading price
PL<50 S$. Matches resulting in a draw were considered as inaccurately predicted underdogs/losers 12 for a detailed description see chapter 4

Information Aggregation in Prediction Markets
J. Martin � Master Thesis � 27.09.2006 43

Information Aggregation in Prediction Markets
J. Martin � Master Thesis � 27.09.2006 44
Table 5.2: Prediction Accuracy of the SoccerExchang e Experimental Prediction Markets

PL PLN F FN p value
MAFE 28.9 28.3 31.8 31.48 .39413
% of accurately predicted winners
68.2% (N=74)
68.3% (N=63)
61.6% (N=73)
67.2% (N=61)
.83714
% of accurately predicted losers
75.5% (N=49)
71.4% (N=63)
70.6% (N=51)
66.7% (N=63)
.788
P value (losers vs. winners)
.16315 .699 .305 .949
% of accurate predictions in total
72.3% (N=123)
66.1% (N=126)
65.3% (N=124)
66.9% (N=124)
.889
Fig. 5.1 categorizes the last trading prices (non-normalized) prior to matches according to
intervals of their values and plots them against the observed frequencies of victory. The
correlation coefficient of both variables indicates a significant correlation with R=93,6. As
can be seen from the graph, the market prices tend to systematically overestimate the
probabilities for which lower real frequencies are observed in reality.
13 one-way ANOVA 14 Kruskal-Wallis test 15 Wilcoxon-Mann-Whitney test
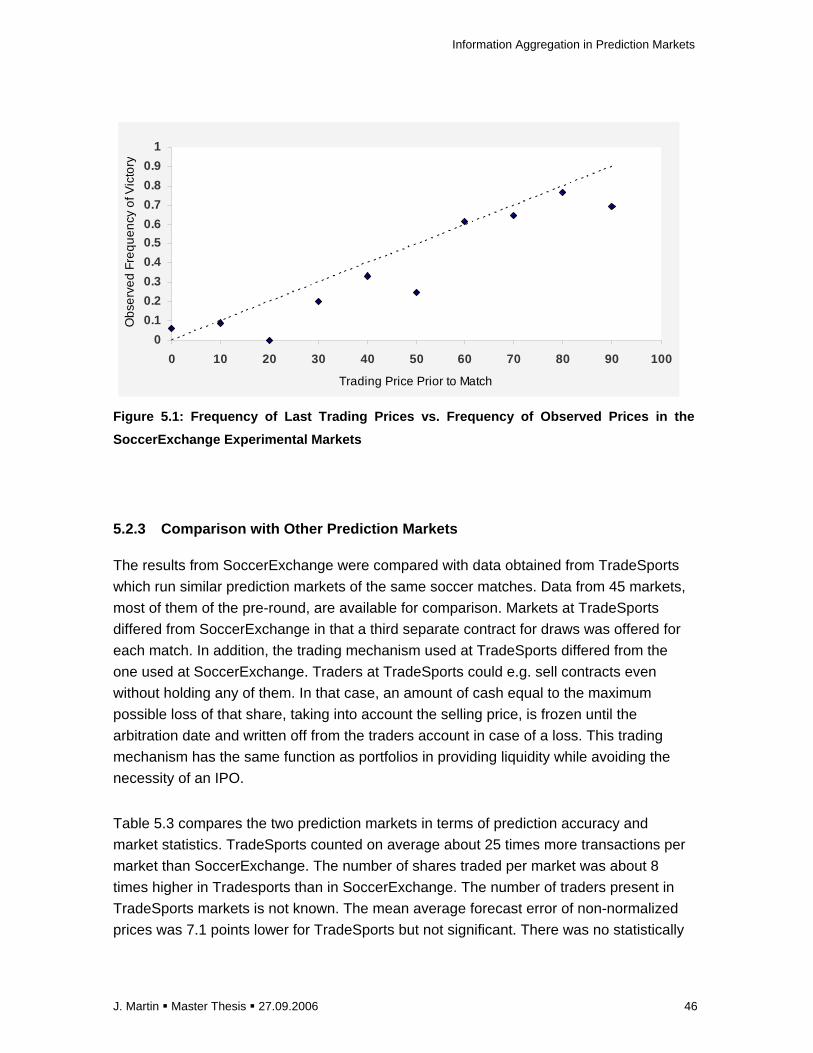
Information Aggregation in Prediction Markets
J. Martin � Master Thesis � 27.09.2006 46
0
0.1
0.2
0.3
0.4
0.5
0.6
0.7
0.8
0.9
1
0 10 20 30 40 50 60 70 80 90 100
Trading Price Prior to Match
Ob
serv
ed
Fre
qu
en
cy o
f Vic
tory
Figure 5.1: Frequency of Last Trading Prices vs. Fr equency of Observed Prices in the
SoccerExchange Experimental Markets
5.2.3 Comparison with Other Prediction Markets
The results from SoccerExchange were compared with data obtained from TradeSports
which run similar prediction markets of the same soccer matches. Data from 45 markets,
most of them of the pre-round, are available for comparison. Markets at TradeSports
differed from SoccerExchange in that a third separate contract for draws was offered for
each match. In addition, the trading mechanism used at TradeSports differed from the
one used at SoccerExchange. Traders at TradeSports could e.g. sell contracts even
without holding any of them. In that case, an amount of cash equal to the maximum
possible loss of that share, taking into account the selling price, is frozen until the
arbitration date and written off from the traders account in case of a loss. This trading
mechanism has the same function as portfolios in providing liquidity while avoiding the
necessity of an IPO.
Table 5.3 compares the two prediction markets in terms of prediction accuracy and
market statistics. TradeSports counted on average about 25 times more transactions per
market than SoccerExchange. The number of shares traded per market was about 8
times higher in Tradesports than in SoccerExchange. The number of traders present in
TradeSports markets is not known. The mean average forecast error of non-normalized
prices was 7.1 points lower for TradeSports but not significant. There was no statistically
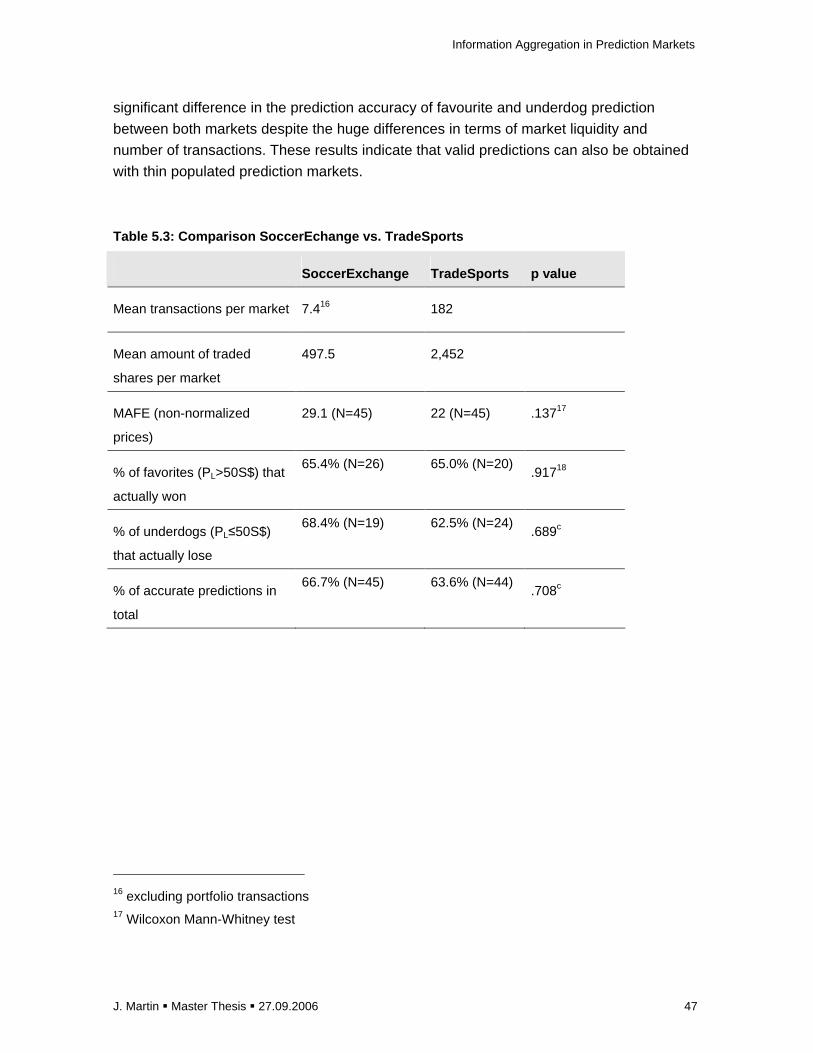
Information Aggregation in Prediction Markets
J. Martin � Master Thesis � 27.09.2006 47
significant difference in the prediction accuracy of favourite and underdog prediction
between both markets despite the huge differences in terms of market liquidity and
number of transactions. These results indicate that valid predictions can also be obtained
with thin populated prediction markets.
Table 5.3: Comparison SoccerEchange vs. TradeSports
SoccerExchange TradeSports p value
Mean transactions per market 7.416 182
Mean amount of traded
shares per market
497.5 2,452
MAFE (non-normalized
prices)
29.1 (N=45) 22 (N=45) .13717
% of favorites (PL>50S$) that
actually won
65.4% (N=26) 65.0% (N=20) .91718
% of underdogs (PL≤50S$)
that actually lose
68.4% (N=19) 62.5% (N=24) .689c
% of accurate predictions in
total
66.7% (N=45) 63.6% (N=44) .708c
16 excluding portfolio transactions 17 Wilcoxon Mann-Whitney test

5.2.4 Cheating Attempts
In the first two weeks of market operation, individuals could register without verification of
their accounts. At least 5 different individuals tried to open multiple accounts from the
same ip-address and computer although this was prohibited by the terms & conditions.
After two weeks, an additional security measure was added to the existing ip-address
tracking system that was already in place. The accounts of new registrants needed to be
verified by the administrator prior to trading. Existing multiple accounts that were found to
be opened by the same individuals were deactivated. However, it was difficult to verify
whether different individuals attempted to collaborate by using one account purposefully
for conducting disadvantageous trades to the benefit of another account.
Fig 5.2 shows one example of the use of multiple accounts for cheating purposes. The
graph plots the price history of the contract CRC-WIN-GER, which reflects the probability
of the underdog Costa Rica to beat the favourite Germany. The price suddenly climbed
from 5 to 90 S$ on 02/06/2006 although no significant news about that team had
occurred. One person used his accounts to first buy out all outstanding buy and sell
orders in the market to the disadvantage of the one account and then to buy the shares at
an irrational price from another of his accounts to the benefit of the other account. The
trader was identified as cheater and excluded from the market shortly after that event.

Information Aggregation in Prediction Markets
J. Martin � Master Thesis � 27.09.2006 49
Figure 5.2: Price History Showing Malicious Trading Behavior
Fig 5.3 depicts an event that is suspected to be of similar nature. It shows the price
history of the contract JPN-WIN-BRA, which reflects the probability of the underdog
Japan to beat the favourite Brazil. After the price adjusted to a level around 5 S$ it
climbed suddenly to 17 and 38 S$ on two occasions. Two individuals were responsible for
the entire transactions that lead to the high price levels. They were often logged in the
system at the same time using two different ip addresses. It can only be suspected but
not confirmed that they engaged in collaboration. In theory, such incidents do only occur
in market with low number of participants. If the number of participants is sufficiently high,
other traders can enter the market and profit from orders at irrationally high or low prices,
thus pushing the price back to a normal level. However, prediction markets have rarely
enough participants who are continuously present to track the market permanently.
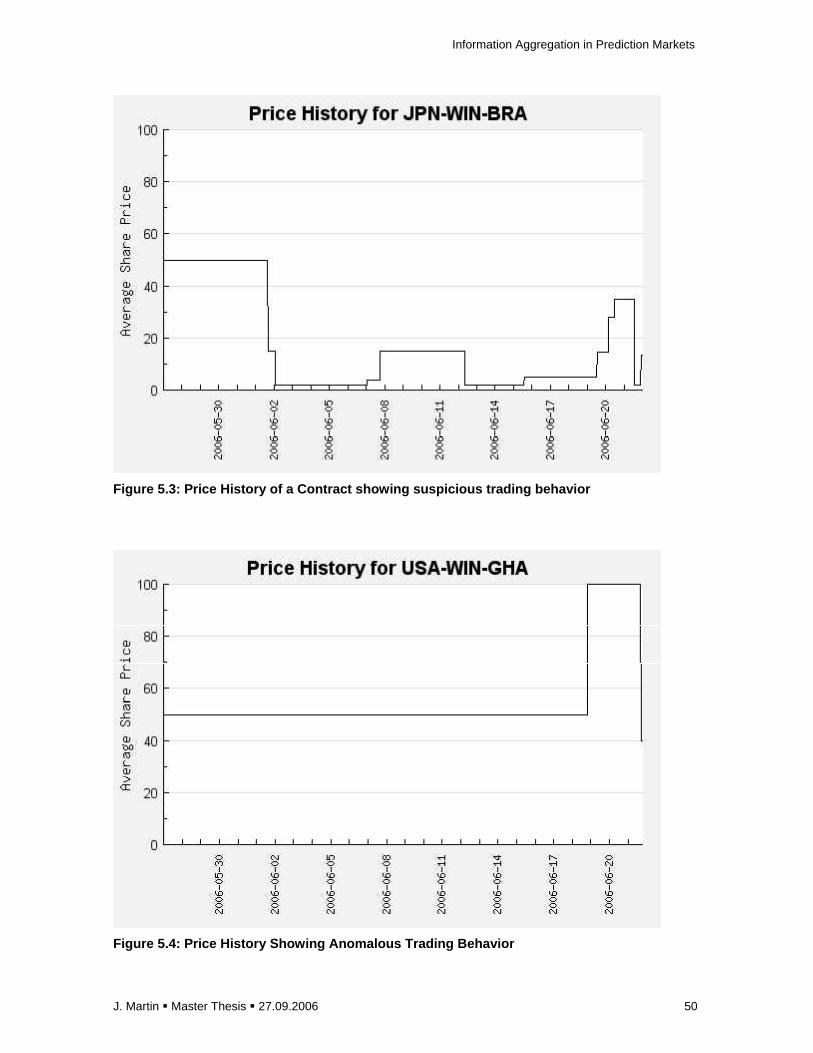
Information Aggregation in Prediction Markets
J. Martin � Master Thesis � 27.09.2006 50
Figure 5.3: Price History of a Contract showing sus picious trading behavior
Figure 5.4: Price History Showing Anomalous Trading Behavior
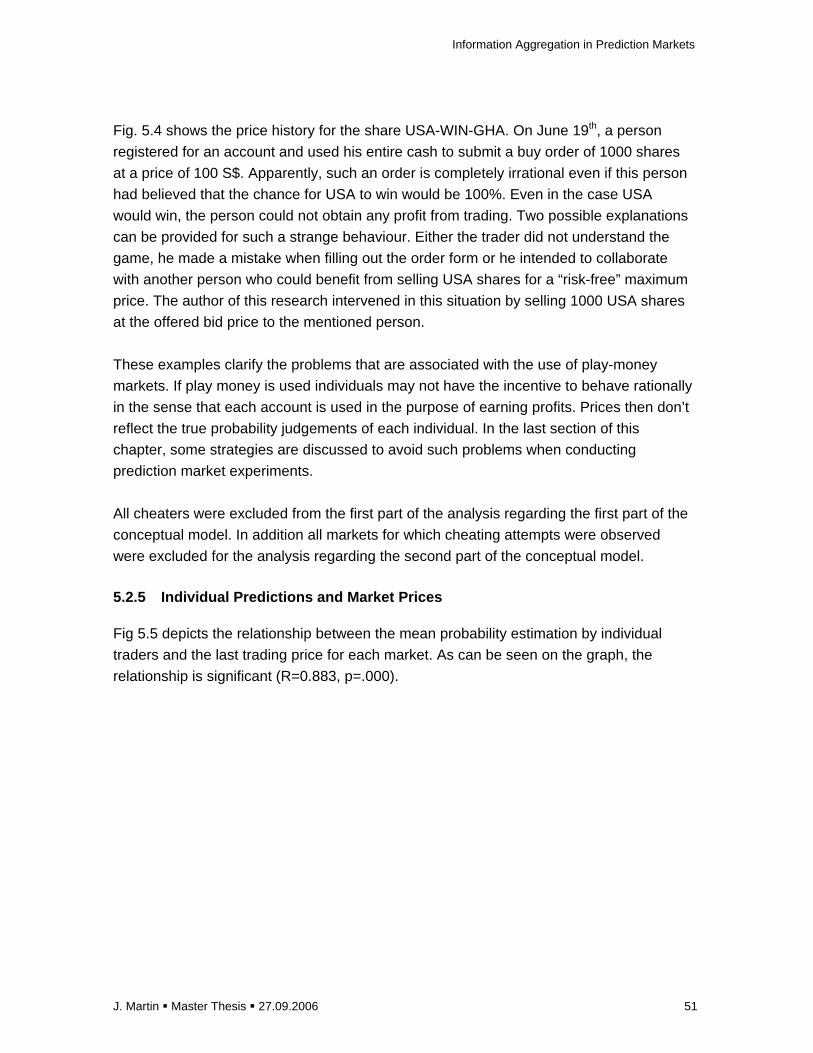
Information Aggregation in Prediction Markets
J. Martin � Master Thesis � 27.09.2006 51
Fig. 5.4 shows the price history for the share USA-WIN-GHA. On June 19th, a person
registered for an account and used his entire cash to submit a buy order of 1000 shares
at a price of 100 S$. Apparently, such an order is completely irrational even if this person
had believed that the chance for USA to win would be 100%. Even in the case USA
would win, the person could not obtain any profit from trading. Two possible explanations
can be provided for such a strange behaviour. Either the trader did not understand the
game, he made a mistake when filling out the order form or he intended to collaborate
with another person who could benefit from selling USA shares for a “risk-free” maximum
price. The author of this research intervened in this situation by selling 1000 USA shares
at the offered bid price to the mentioned person.
These examples clarify the problems that are associated with the use of play-money
markets. If play money is used individuals may not have the incentive to behave rationally
in the sense that each account is used in the purpose of earning profits. Prices then don’t
reflect the true probability judgements of each individual. In the last section of this
chapter, some strategies are discussed to avoid such problems when conducting
prediction market experiments.
All cheaters were excluded from the first part of the analysis regarding the first part of the
conceptual model. In addition all markets for which cheating attempts were observed
were excluded for the analysis regarding the second part of the conceptual model.
5.2.5 Individual Predictions and Market Prices
Fig 5.5 depicts the relationship between the mean probability estimation by individual
traders and the last trading price for each market. As can be seen on the graph, the
relationship is significant (R=0.883, p=.000).
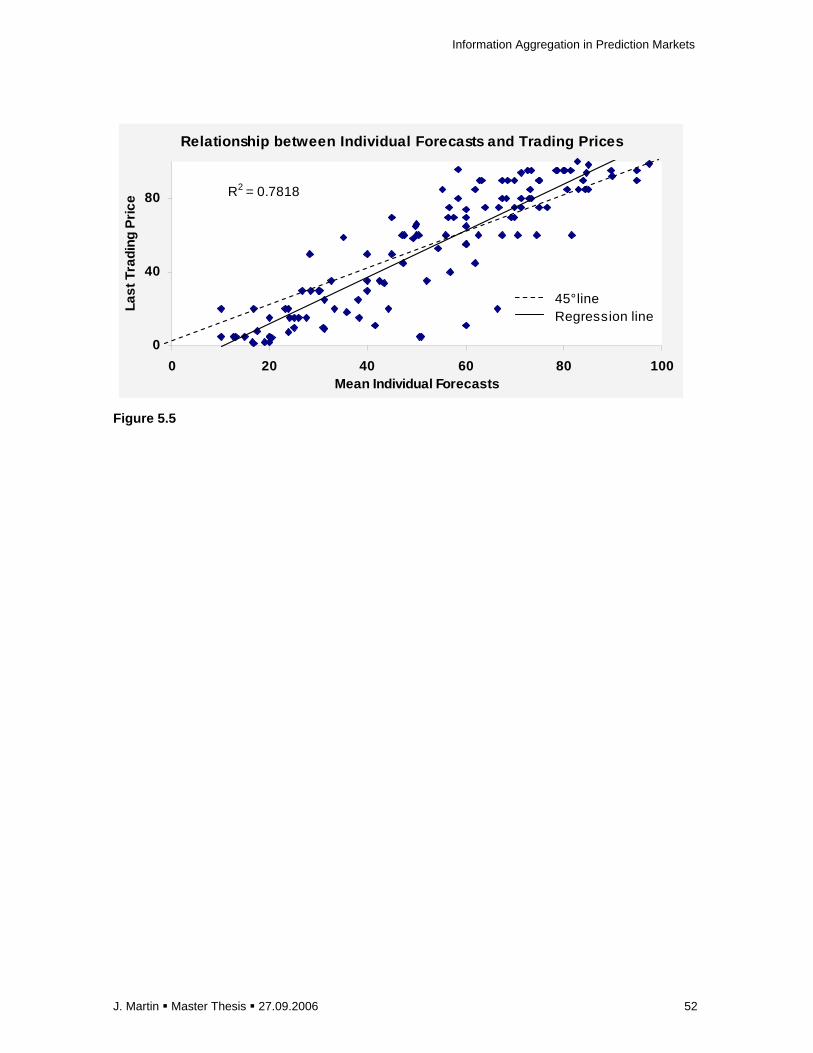
Information Aggregation in Prediction Markets
J. Martin � Master Thesis � 27.09.2006 52
Relationship between Individual Forecasts and Tradi ng Prices
R2 = 0.7818
0
40
80
0 20 40 60 80 100Mean Individual Forecasts
Last
Tra
ding
Pric
e
45° lineRegression line
Figure 5.5
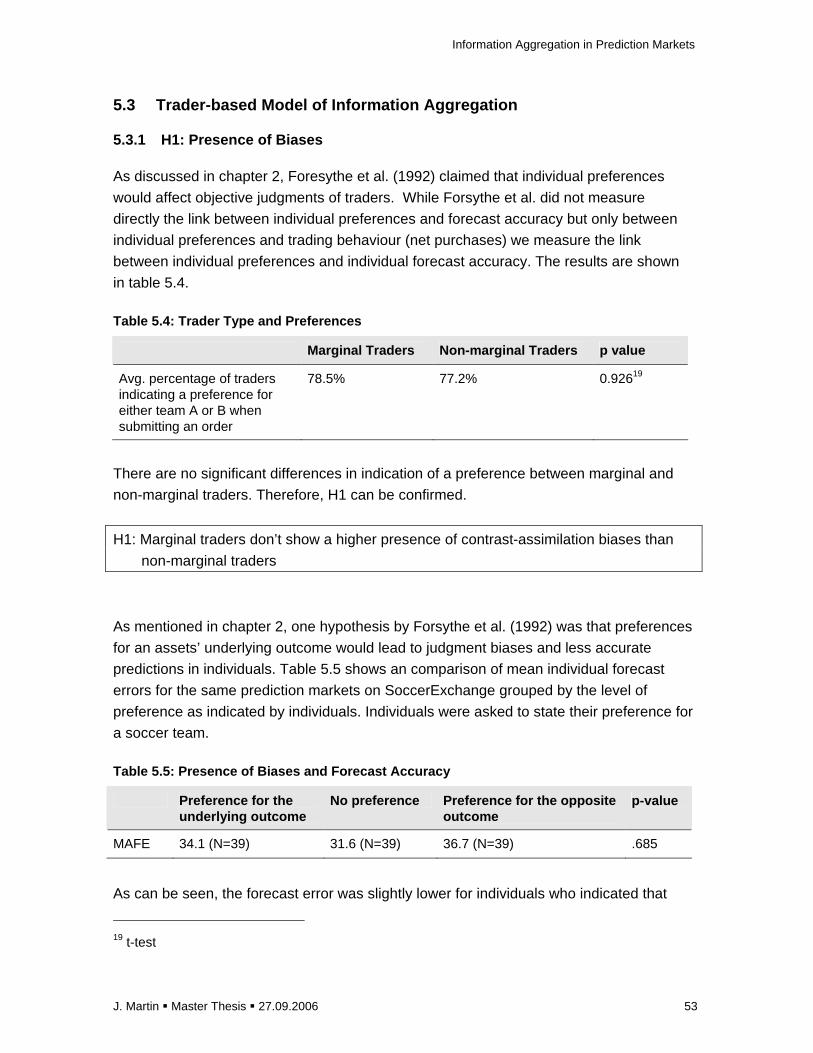
Information Aggregation in Prediction Markets
J. Martin � Master Thesis � 27.09.2006 53
5.3 Trader-based Model of Information Aggregation
5.3.1 H1: Presence of Biases
As discussed in chapter 2, Foresythe et al. (1992) claimed that individual preferences
would affect objective judgments of traders. While Forsythe et al. did not measure
directly the link between individual preferences and forecast accuracy but only between
individual preferences and trading behaviour (net purchases) we measure the link
between individual preferences and individual forecast accuracy. The results are shown
in table 5.4.
Table 5.4: Trader Type and Preferences
Marginal Traders Non-marginal Traders p value
Avg. percentage of traders indicating a preference for either team A or B when submitting an order
78.5% 77.2% 0.92619
There are no significant differences in indication of a preference between marginal and
non-marginal traders. Therefore, H1 can be confirmed.
H1: Marginal traders don’t show a higher presence of contrast-assimilation biases than
non-marginal traders
As mentioned in chapter 2, one hypothesis by Forsythe et al. (1992) was that preferences
for an assets’ underlying outcome would lead to judgment biases and less accurate
predictions in individuals. Table 5.5 shows an comparison of mean individual forecast
errors for the same prediction markets on SoccerExchange grouped by the level of
preference as indicated by individuals. Individuals were asked to state their preference for
a soccer team.
Table 5.5: Presence of Biases and Forecast Accuracy
Preference for the underlying outcome
No preference Preference for the opposite outcome
p-value
MAFE 34.1 (N=39) 31.6 (N=39) 36.7 (N=39) .685
As can be seen, the forecast error was slightly lower for individuals who indicated that
19 t-test
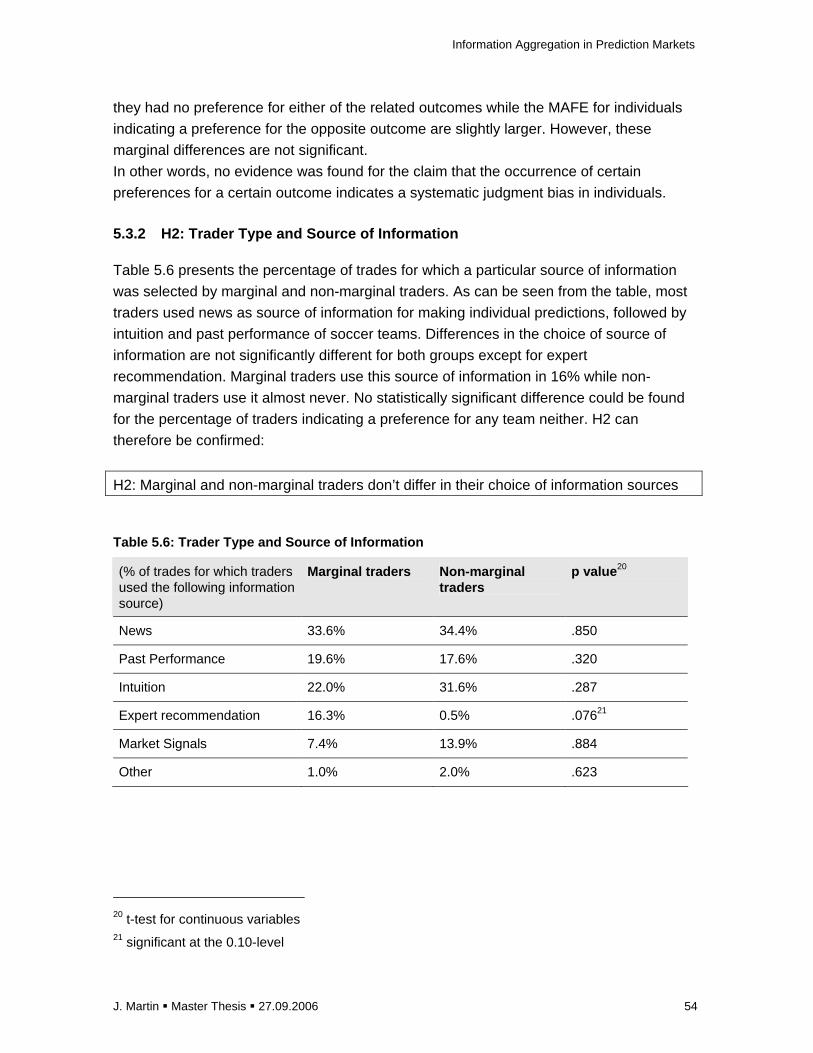
Information Aggregation in Prediction Markets
J. Martin � Master Thesis � 27.09.2006 54
they had no preference for either of the related outcomes while the MAFE for individuals
indicating a preference for the opposite outcome are slightly larger. However, these
marginal differences are not significant.
In other words, no evidence was found for the claim that the occurrence of certain
preferences for a certain outcome indicates a systematic judgment bias in individuals.
5.3.2 H2: Trader Type and Source of Information
Table 5.6 presents the percentage of trades for which a particular source of information
was selected by marginal and non-marginal traders. As can be seen from the table, most
traders used news as source of information for making individual predictions, followed by
intuition and past performance of soccer teams. Differences in the choice of source of
information are not significantly different for both groups except for expert
recommendation. Marginal traders use this source of information in 16% while non-
marginal traders use it almost never. No statistically significant difference could be found
for the percentage of traders indicating a preference for any team neither. H2 can
therefore be confirmed:
H2: Marginal and non-marginal traders don’t differ in their choice of information sources
Table 5.6: Trader Type and Source of Information
(% of trades for which traders used the following information source)
Marginal traders Non-marginal traders
p value 20
News 33.6% 34.4% .850
Past Performance 19.6% 17.6% .320
Intuition 22.0% 31.6% .287
Expert recommendation 16.3% 0.5% .07621
Market Signals 7.4% 13.9% .884
Other 1.0% 2.0% .623
20 t-test for continuous variables 21 significant at the 0.10-level

5.3.3 H3: Trader Type and Individual Information Ac curacy
Table 5.7 shows the statistics for the two groups of marginal and non-marginal traders. All
active traders who where found to cheat as well as the author who participated in the
game were excluded from this analysis. Both groups are distinguished according to the
first rule (number of days with marginal trading activity) as defined by Forsythe et al.
(1992) Marginal traders represent only about one third of the trader population. They
participate in a higher number of trades and submit a higher number of orders, thus
confirming the observations made by Forsythe et al. (1992) However, the results of this
research differ regarding the median trading profit, which was negative for marginal
traders and positive for non-marginal traders. H3 can therefore be confirmed:
H3: Marginal and non-marginal trader don’t differ in terms of individual information
accuracy
Table 5.7: Comparison Marginal vs. Non-marginal Tra ders
Marginal traders Non-marginal traders
p value 22
Number of traders 13 25
Mean number of transactions (excluding portfolio transactions)
76.9 12.9 .000
Mean number of orders 169.2 13.6 .000
Median trading profit (from trading prior to match)
-7275 235.5
MAFE 36.7 43.4 .693
As can be seen from the table 5.7, marginal traders showed a lower MAFE (6.7) but this
difference was not significant.
22 Mann-Whitney test
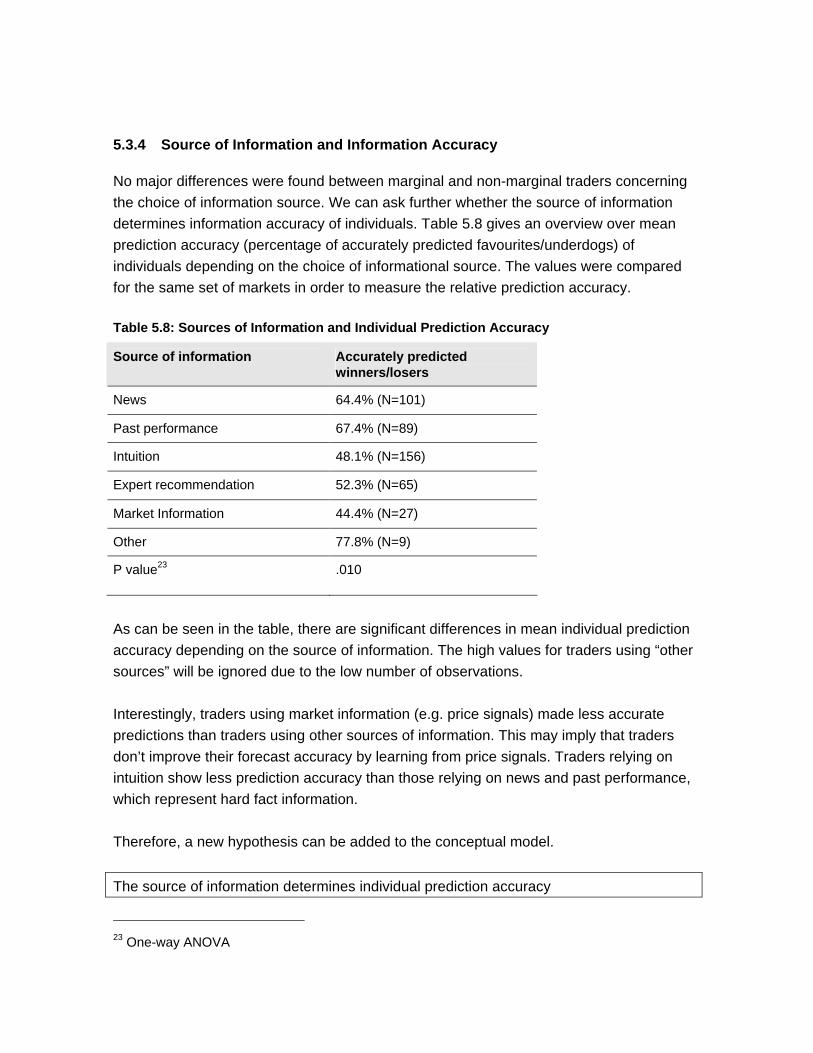
5.3.4 Source of Information and Information Accurac y
No major differences were found between marginal and non-marginal traders concerning
the choice of information source. We can ask further whether the source of information
determines information accuracy of individuals. Table 5.8 gives an overview over mean
prediction accuracy (percentage of accurately predicted favourites/underdogs) of
individuals depending on the choice of informational source. The values were compared
for the same set of markets in order to measure the relative prediction accuracy.
Table 5.8: Sources of Information and Individual Pr ediction Accuracy
Source of information Accurately predicted winners/losers
News 64.4% (N=101)
Past performance 67.4% (N=89)
Intuition 48.1% (N=156)
Expert recommendation 52.3% (N=65)
Market Information 44.4% (N=27)
Other 77.8% (N=9)
P value23 .010
As can be seen in the table, there are significant differences in mean individual prediction
accuracy depending on the source of information. The high values for traders using “other
sources” will be ignored due to the low number of observations.
Interestingly, traders using market information (e.g. price signals) made less accurate
predictions than traders using other sources of information. This may imply that traders
don’t improve their forecast accuracy by learning from price signals. Traders relying on
intuition show less prediction accuracy than those relying on news and past performance,
which represent hard fact information.
Therefore, a new hypothesis can be added to the conceptual model.
The source of information determines individual prediction accuracy
23 One-way ANOVA

Information Aggregation in Prediction Markets
J. Martin � Master Thesis � 27.09.2006 57
5.4 Market-based Model of Information Aggregation
5.4.1 Overview
In order to analyze the market efficiency as proposed in chapter 3.3 only 19 markets were
selected according to the ratio of valid questionnaire answers. Only markets with at least
75% of orders submitted together with valid questionnaires were included in the analysis.
Supply & Demand Chart - Market 15 UKR-WIN-ITA
0
10
20
30
40
50
60
70
80
90
100
0 100 200 300 400 500 600 700 800
Order Quantity
Res
erva
tion
Pric
e
0
10
20
30
40
50
60
70
80
90
100
1 2 3 4 5
Transactions
Tran
sact
ion
Pric
es
Figure 5.6: Supply/Demand Structure and Transaction Prices for an Exemplary Market
Fig. 5.6 depicts one exemplary market. Supply and demand curves, as depicted in the left
part, were constructed according to the reservation prices (implied by probability
estimates) and quantities that were stated by traders in the questionnaire and order form.
Reservation prices should represent the outer boundary for building limit order prices if
traders are assumed to behave rationally. However, in some few cases the true order
prices violated the boundaries implied by reservation prices. Therefore, these demand
and supply functions may not represent the real situation accurately but rather a close
approximates of the demand and supply structure and equilibrium market price levels.
The right part of the graph plots the occurred transaction prices in sequence. The dotted
line represents the computed equilibrium market price that occurs at the intersection of
demand and supply curves.
Fig 5.8 plots the equilibrium prices against last trading prices. A quite significant
relationship between equilibrium prices and last trading prices can be found (R=0.83).
However, there is an even stronger relationship between mean individual forecasts and
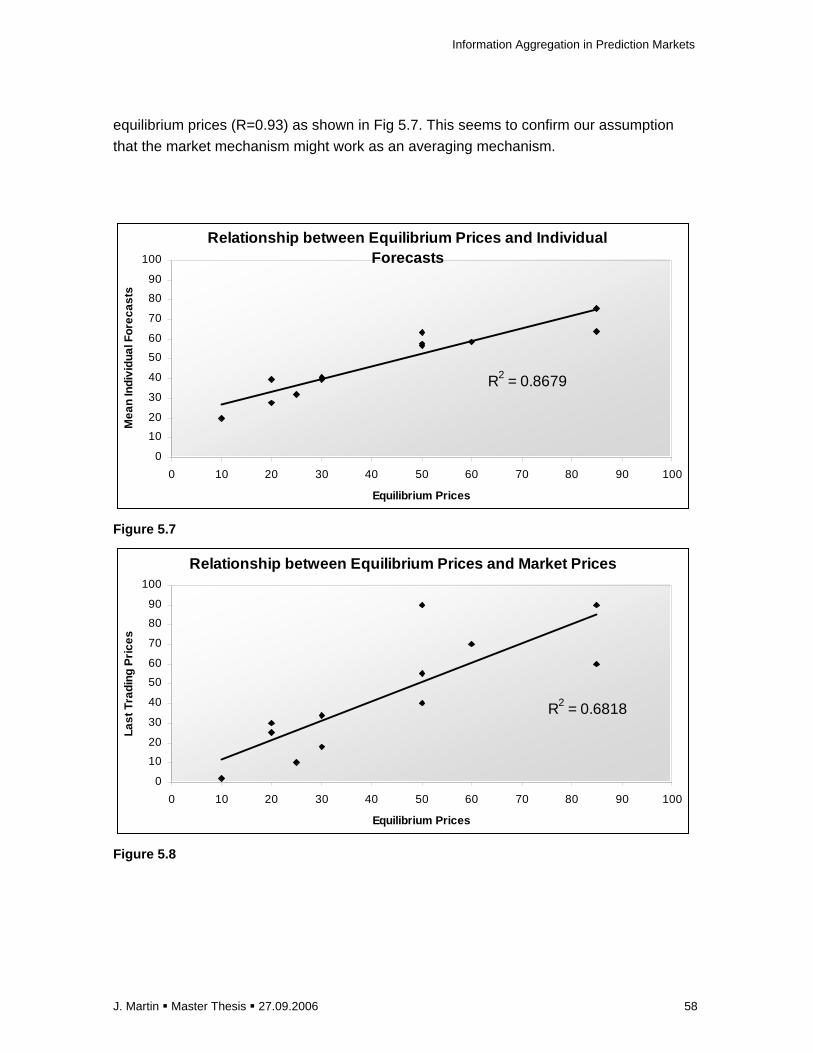
Information Aggregation in Prediction Markets
J. Martin � Master Thesis � 27.09.2006 58
equilibrium prices (R=0.93) as shown in Fig 5.7. This seems to confirm our assumption
that the market mechanism might work as an averaging mechanism.
Relationship between Equilibrium Prices and Individ ual Forecasts
R2 = 0.8679
0
10
20
30
40
50
60
70
80
90
100
0 10 20 30 40 50 60 70 80 90 100
Equilibrium Prices
Mea
n In
divi
dual
For
ecas
ts
Figure 5.7
Relationship between Equilibrium Prices and Market Prices
R2 = 0.6818
0
10
20
30
40
50
60
70
80
90
100
0 10 20 30 40 50 60 70 80 90 100
Equilibrium Prices
Last
Tra
ding
Pric
es
Figure 5.8
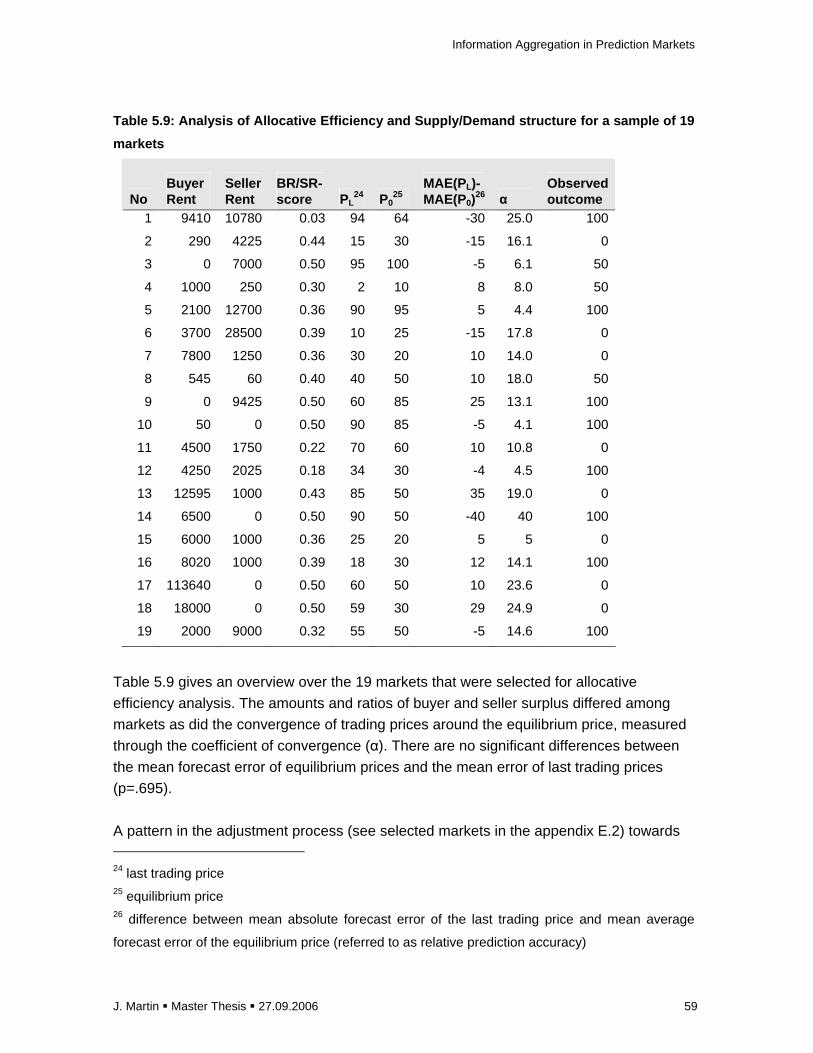
Information Aggregation in Prediction Markets
J. Martin � Master Thesis � 27.09.2006 59
Table 5.9: Analysis of Allocative Efficiency and Su pply/Demand structure for a sample of 19
markets
No Buyer Rent
Seller Rent
BR/SR-score PL
24 P025
MAE(PL)-MAE(P0)
26 α Observed outcome
1 9410 10780 0.03 94 64 -30 25.0 100
2 290 4225 0.44 15 30 -15 16.1 0
3 0 7000 0.50 95 100 -5 6.1 50
4 1000 250 0.30 2 10 8 8.0 50
5 2100 12700 0.36 90 95 5 4.4 100
6 3700 28500 0.39 10 25 -15 17.8 0
7 7800 1250 0.36 30 20 10 14.0 0
8 545 60 0.40 40 50 10 18.0 50
9 0 9425 0.50 60 85 25 13.1 100
10 50 0 0.50 90 85 -5 4.1 100
11 4500 1750 0.22 70 60 10 10.8 0
12 4250 2025 0.18 34 30 -4 4.5 100
13 12595 1000 0.43 85 50 35 19.0 0
14 6500 0 0.50 90 50 -40 40 100
15 6000 1000 0.36 25 20 5 5 0
16 8020 1000 0.39 18 30 12 14.1 100
17 113640 0 0.50 60 50 10 23.6 0
18 18000 0 0.50 59 30 29 24.9 0
19 2000 9000 0.32 55 50 -5 14.6 100
Table 5.9 gives an overview over the 19 markets that were selected for allocative
efficiency analysis. The amounts and ratios of buyer and seller surplus differed among
markets as did the convergence of trading prices around the equilibrium price, measured
through the coefficient of convergence (α). There are no significant differences between
the mean forecast error of equilibrium prices and the mean error of last trading prices
(p=.695).
A pattern in the adjustment process (see selected markets in the appendix E.2) towards 24 last trading price 25 equilibrium price 26 difference between mean absolute forecast error of the last trading price and mean average
forecast error of the equilibrium price (referred to as relative prediction accuracy)
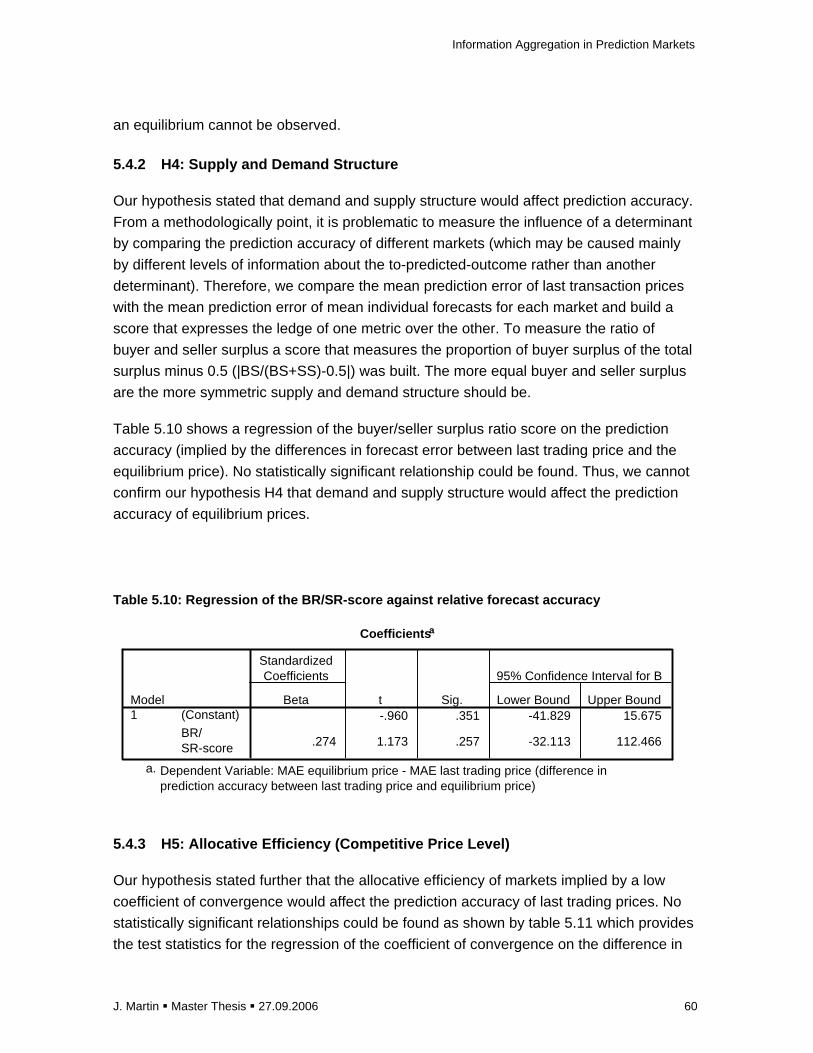
Information Aggregation in Prediction Markets
J. Martin � Master Thesis � 27.09.2006 60
an equilibrium cannot be observed.
5.4.2 H4: Supply and Demand Structure
Our hypothesis stated that demand and supply structure would affect prediction accuracy.
From a methodologically point, it is problematic to measure the influence of a determinant
by comparing the prediction accuracy of different markets (which may be caused mainly
by different levels of information about the to-predicted-outcome rather than another
determinant). Therefore, we compare the mean prediction error of last transaction prices
with the mean prediction error of mean individual forecasts for each market and build a
score that expresses the ledge of one metric over the other. To measure the ratio of
buyer and seller surplus a score that measures the proportion of buyer surplus of the total
surplus minus 0.5 (|BS/(BS+SS)-0.5|) was built. The more equal buyer and seller surplus
are the more symmetric supply and demand structure should be.
Table 5.10 shows a regression of the buyer/seller surplus ratio score on the prediction
accuracy (implied by the differences in forecast error between last trading price and the
equilibrium price). No statistically significant relationship could be found. Thus, we cannot
confirm our hypothesis H4 that demand and supply structure would affect the prediction
accuracy of equilibrium prices.
Table 5.10: Regression of the BR/SR-score against r elative forecast accuracy
Coefficients a
-.960 .351 -41.829 15.675
.274 1.173 .257 -32.113 112.466
(Constant)
BR/SR-score
Model1
Beta
StandardizedCoefficients
t Sig. Lower Bound Upper Bound
95% Confidence Interval for B
Dependent Variable: MAE equilibrium price - MAE last trading price (difference inprediction accuracy between last trading price and equilibrium price)
a.
5.4.3 H5: Allocative Efficiency (Competitive Price Level)
Our hypothesis stated further that the allocative efficiency of markets implied by a low
coefficient of convergence would affect the prediction accuracy of last trading prices. No
statistically significant relationships could be found as shown by table 5.11 which provides
the test statistics for the regression of the coefficient of convergence on the difference in
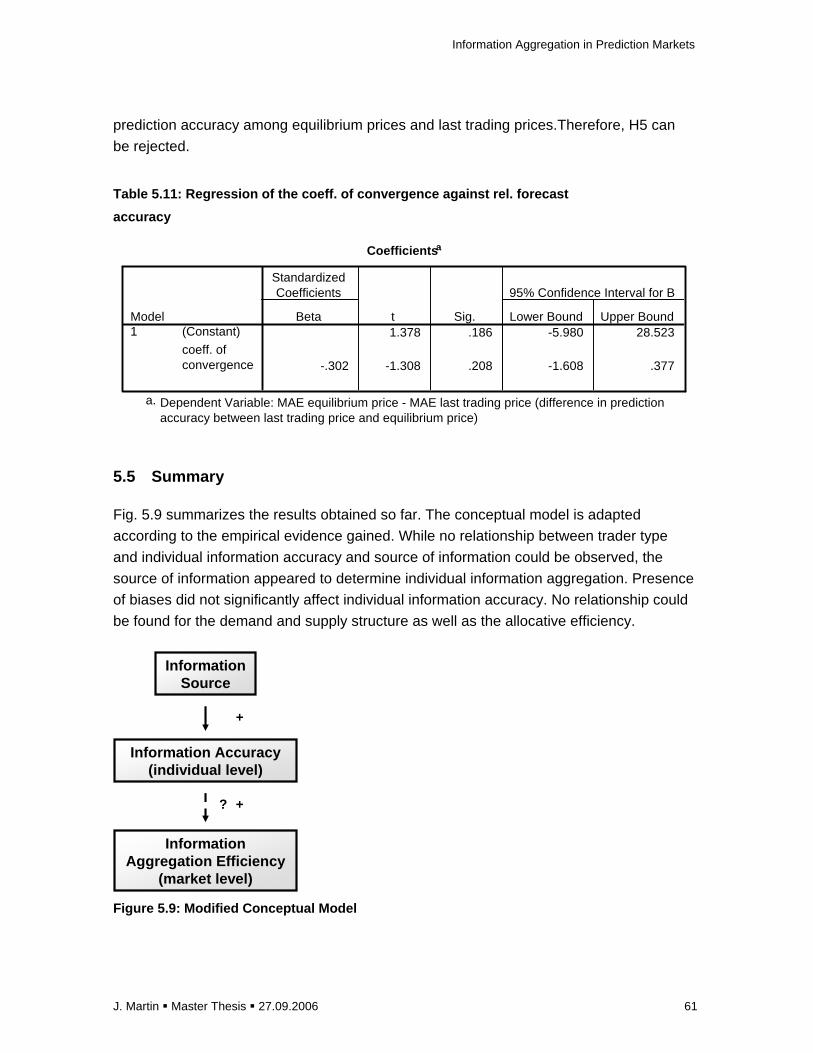
Information Aggregation in Prediction Markets
J. Martin � Master Thesis � 27.09.2006 61
prediction accuracy among equilibrium prices and last trading prices.Therefore, H5 can
be rejected. Table 5.11: Regression of the coeff. of convergence against rel. forecast
accuracy
Coefficients a
1.378 .186 -5.980 28.523
-.302 -1.308 .208 -1.608 .377
(Constant)
coeff. ofconvergence
Model1
Beta
StandardizedCoefficients
t Sig. Lower Bound Upper Bound
95% Confidence Interval for B
Dependent Variable: MAE equilibrium price - MAE last trading price (difference in predictionaccuracy between last trading price and equilibrium price)
a.
5.5 Summary
Fig. 5.9 summarizes the results obtained so far. The conceptual model is adapted
according to the empirical evidence gained. While no relationship between trader type
and individual information accuracy and source of information could be observed, the
source of information appeared to determine individual information aggregation. Presence
of biases did not significantly affect individual information accuracy. No relationship could
be found for the demand and supply structure as well as the allocative efficiency.
Information Accuracy(individual level)
Information Aggregation Efficiency
(market level)
Information Source
+?
+
Figure 5.9: Modified Conceptual Model
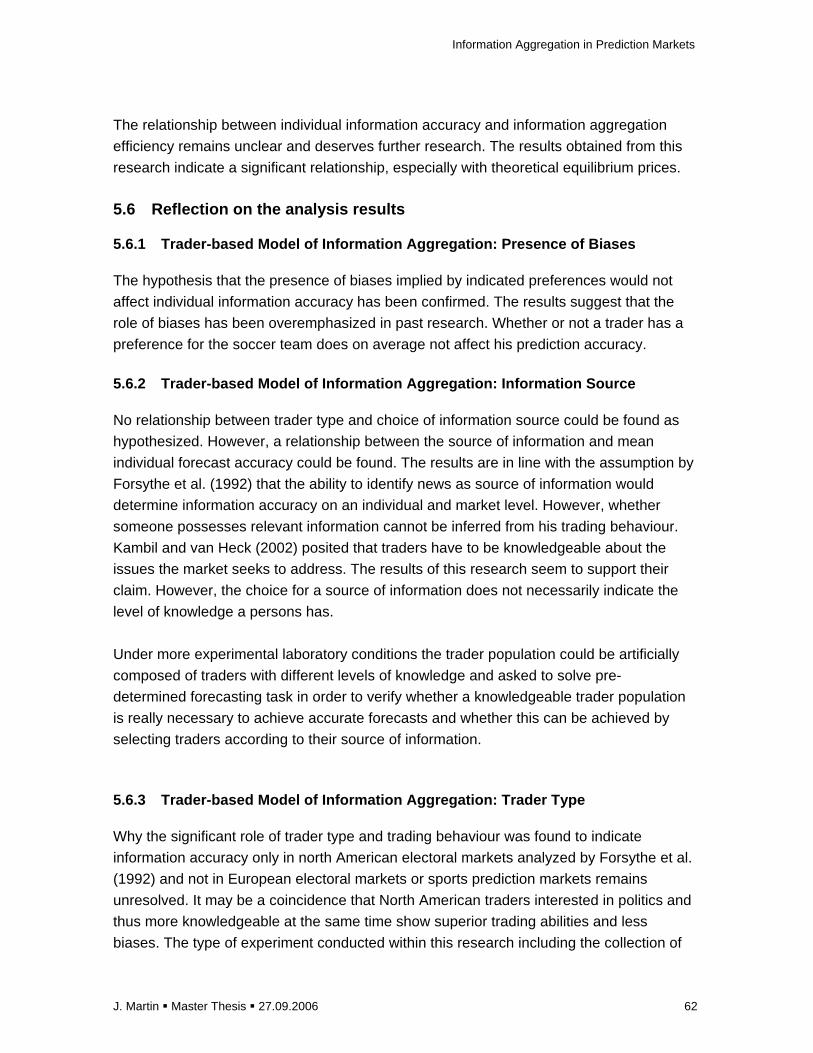
Information Aggregation in Prediction Markets
J. Martin � Master Thesis � 27.09.2006 62
The relationship between individual information accuracy and information aggregation
efficiency remains unclear and deserves further research. The results obtained from this
research indicate a significant relationship, especially with theoretical equilibrium prices.
5.6 Reflection on the analysis results
5.6.1 Trader-based Model of Information Aggregation : Presence of Biases
The hypothesis that the presence of biases implied by indicated preferences would not
affect individual information accuracy has been confirmed. The results suggest that the
role of biases has been overemphasized in past research. Whether or not a trader has a
preference for the soccer team does on average not affect his prediction accuracy.
5.6.2 Trader-based Model of Information Aggregation : Information Source
No relationship between trader type and choice of information source could be found as
hypothesized. However, a relationship between the source of information and mean
individual forecast accuracy could be found. The results are in line with the assumption by
Forsythe et al. (1992) that the ability to identify news as source of information would
determine information accuracy on an individual and market level. However, whether
someone possesses relevant information cannot be inferred from his trading behaviour.
Kambil and van Heck (2002) posited that traders have to be knowledgeable about the
issues the market seeks to address. The results of this research seem to support their
claim. However, the choice for a source of information does not necessarily indicate the
level of knowledge a persons has.
Under more experimental laboratory conditions the trader population could be artificially
composed of traders with different levels of knowledge and asked to solve pre-
determined forecasting task in order to verify whether a knowledgeable trader population
is really necessary to achieve accurate forecasts and whether this can be achieved by
selecting traders according to their source of information.
5.6.3 Trader-based Model of Information Aggregation : Trader Type
Why the significant role of trader type and trading behaviour was found to indicate
information accuracy only in north American electoral markets analyzed by Forsythe et al.
(1992) and not in European electoral markets or sports prediction markets remains
unresolved. It may be a coincidence that North American traders interested in politics and
thus more knowledgeable at the same time show superior trading abilities and less
biases. The type of experiment conducted within this research including the collection of
Information Aggregation in Prediction Markets
J. Martin � Master Thesis � 27.09.2006 63
individual forecasts should be repeated in the light of North American electoral markets to
reveal the individual forecast accuracy of marginal and non-marginal traders and to verify
whether there is any directly measurable relationship.
5.6.4 Market-based Model of Information Aggregation
In the data analysis no statistically significant relationship between measures of allocative
efficiency and relative prediction accuracy could be found. The hypothetical equilibrium
price was not found to predict the outcomes more accurately if supply and demand
curves had a more symmetric structure. Neither was it found to predict the outcomes
significantly more accurately than the last transaction price. The hypothetical equilibrium
prices correlated stronger with mean individual forecasts than with observed last
transaction prices independent of the shape and symmetry of demand and supply curves.
These results seem to confirm the theory that the mean of individual beliefs may be
independent of the distribution of beliefs among traders established by Gjerstad (2004).
The results also indicate that the double auction market mechanism seems at least
partially to work as an averaging mechanism since equilibrium prices are closer to mean
individual beliefs than to observed market prices. However, the last transaction prices
observed in markets often deviate from the hypothetical equilibrium price without being
significantly less accurate prediction metrics than the hypothetical equilibrium price. Thus,
there may be a further aggregation mechanism that hasn’t been described yet.
The results of analysis of alllocative efficiency obtained within the scope of this research
need to be interpreted with care as the data regarding submitted individual forecasts was
not complete. The issue of allocative efficiency in the context of prediction markets
deserves further attention and more experimental investigation under more controlled
laboratory settings. In particular, it should be made sure that traders elicit their true beliefs
when submitting probability estimations along with orders. This can be achieved e.g. by
including scoring rules for probability estimates such as described in chapter 2 and tying
of that scoring rule to a reward mechanism.
5.7 Reflection on Practical Implications
The conclusion drawn from this research may have in particular implications for
conduction double auction markets with limited number participants such as in business
forecasting situations.
In practise, the markets should be designed such that only knowledgeable individuals
using proper sources of information are attracted. Mere self selection through the market
incentive mechanism seems not to be sufficient to attract only knowledgeable individuals
Information Aggregation in Prediction Markets
J. Martin � Master Thesis � 27.09.2006 64
as a high number of individuals in the SoccerExchange markets e.g. relied on intuition as
source of information. A pre-selection mechanism, based upon questionnaires that test
for relevant knowledge in the field of the to-be-predicted event might serve this purpose.
Van Bruggen et al. (2006) provide an example of such questionnaires in their research.
Following this paradigm, it should be avoided to attract uniformed traders intentionally as
proposed by Wolfers & Zitzewitz (2004).
It might be of advantage to include questionnaires for revealing traders private
information in the form of probability estimations and to compare the mean beliefs with
market prices. In the case that orders are submitted but transactions did not occur, these
estimates can serve as an alternative prediction metric.
Much experience was gained regarding the issue of cheating behaviour while conducting
the SoccerExchange experimental markets. Solutions for that problem are discussed in
the next chapter.
5.7.1 Preventing Cheating
As shown by the experiment, one of the most obvious challenges for obtaining valid
experimental results is to prevent marketers from engaging in cheating or manipulative
behaviour. While the problem of manipulation for the purpose of influencing prices has
been discussed to some extend in the literature the problem of cheating for the purpose
of gaining profits from malicious inter-account trade has not been discussed sufficiently.
In markets with real-money marketers have no incentive to create multiple accounts or
collaborating with other traders for cheating purposes and fraudulently inter-account
trade. However, as noted by Servan-Schreiber et al. (2004) law regulations in several
countries prohibit the use of real-money prediction markets for non-academic purposes.
If a prediction market attracts a sufficiently high number of active traders malicious inter-
account trade could be prevented by other traders who could intervene in such situation
and profit from shares offered for buying or selling at irrational prices. Servan-Schreiber et
al. (2004) did not observe any significant difference between the prediction accuracy of
play money and real money markets as the compared markets in their research attracted
enough participants. However, if the experimenters fail to attract enough participants
other precautions need to be taken in order to prevent market manipulation.
The following actions and precautions can be taken to attempt cheating:

Information Aggregation in Prediction Markets
J. Martin � Master Thesis � 27.09.2006 65
Excluding Auspicious Traders
This type of security measure was deployed several times during the course of
SocceExchange. However, it is difficult to define when cheating behaviour occurs and
when not. One way to detect cheating behaviour is to track irrational behaviour. Irrational
behaviour usually occurs when no profit can be obtained by a particular transaction or
another trading strategy, such as including portfolio transactions, would be more
profitable. The problem of excluding suspicious traders lies in the possibility of
erroneously excluding non-fraudulently traders. Irrational behaviour can also be attributed
to a misunderstanding of game rules or incorrectly filled out order forms.
In addition, previously performed actions of fraudulently traders at the time of detection
may have affected the market price and cannot be undone.
Intervening with Supervisor Traders
Another possible solution to prevent cheating is to monitor the game permanently and to
intervene if suspicious orders are placed in order to prevent suspicious traders from
profiting from their cheats. One exemplary situation where a trader wanted to buy shares
at a non-rational price of 100 S$ is described in 5.4.2. However, here it comes again to
define suspicious orders and the problem of influencing endogenous market dynamics
through external influences.
Account Approval and Identity Management
A way to prevent the creation of multiple accounts is to track ip addresses of traders and
to refuse approval of multiple accounts opened from the same ip address and/or
computer. However, participants may have access via networks, as e.g. university
networks, that use a similar ip address. In addition, this method cannot prevent different
traders from collaborating.
A further way of verifying user identity is via verification of email addresses and identities
by disallowing registration with freemail addresses as it was done in the case of
SoccerExchange. However, as many people use freemail addresses this precaution will
prevent many individuals from participating.
Tying Rewards not Entirely to Trader Performance

Information Aggregation in Prediction Markets
J. Martin � Master Thesis � 27.09.2006 66
In the case of SoccerExchange, rewards were tied entirely to individual trader
performance. In consequence, individuals had incentives to attempt fraud by opening
multiple accounts or collaboration as they could influence their performance by that way.
Other prediction markets such as Stoccer27 avoided such a direct tying between trader
performance and rewards by selecting the best traders according to their performance
and finally allotting winners among this high-performer group. However, such an
approach can also motivate traders to create even much more multiple accounts to
maximize their winning chances, anyway.
Adding Scoring Rules
A new approach would include a scoring rule mechanism, such as for the case of
Soccerexchange, and tying reward to the performance of both trading profits and
prediction accuracy of individual forecasts. By this way, cheaters could only profit if they
would provide accurate individual forecasts and not solely by trading.
Increasing Market information
Continuously updated market tickers, SMS services and automatic agents could be used
to increase reactivity of other traders in situations where cheaters attempt to clear all
outstanding orders.
Limiting Trading Hours
Cheaters require lonely markets to execute their fraudulently trades. In order to make
sure that a sufficiently number of traders is present in the market the trading time could
be reduced (e.g. to a time frame of 15 min each day and shortly before the to-be-
predicted event). Another solution could be to accept all bids during a submission phase
throughout a day while adding to a bidding queue and to execute them only once every
day or every hour. By this way, a clearing of outstanding orders could be avoided.
27 http://www.stoccer.com
Information Aggregation in Prediction Markets
J. Martin � Master Thesis � 27.09.2006 67
6 Discussion & Conclusions
The following chapter includes a discussion of the findings obtained from this research as
well as a conclusion. In addition, recommendations regarding opportunities for further
researches are made.
6.1 Discussion
This research attempted to identify relevant determinants of information aggregation
efficiency in prediction markets. It was investigated whether a certain type of traders,
called marginal traders, show higher individual information accuracy than other traders
and thus account for efficient information aggregation in prediction markets as suggested
by Forsythe et al. (1992). In particular, it was investigated whether this trader type
achieves higher individual information accuracy by choosing sources of information
differently and showing fewer biased judgments as proposed by Forsythe et al.
Data for empirical analysis was collected through a set of 128 prediction markets that
were run during the FIFA soccer world cup 2006. The markets showed relatively high
prediction accuracy, implied by their market prices and mean individual forecasts. Despite
the low number of participants the markets achieved a level of prediction accuracy
comparable to that of other prediction markets such as TradeSports.
No significant difference in prediction accuracy, source of information and presence of
biases (implied by indicated preference for soccer teams) could be found between
marginal and non-marginal traders. In other words, no evidence was found for the theory
that marginal traders would show higher prediction accuracy on an individual level and
therefore drive the high information aggregation efficiency on market level. Thus, the
hypothesis that trader type would not affect information aggregation efficiency was
confirmed.
However, it was found that the source of information affects forecast accuracy on an
individual level and thus might influence information aggregation efficiency on an
aggregate market level.
In a second step, it was investigated whether market efficiency characteristics such as
competitive equilibrium price level and supply and demand structure affect prediction
accuracy of markets. A new experimental method was used to measure individual

Information Aggregation in Prediction Markets
J. Martin � Master Thesis � 27.09.2006 68
forecasts, market prices and order quantities at the same in order to display supply and
demand curves and to determine the equilibrium price level.
No evidence for a relationship between demand and supply structure or level of price
competitiveness and prediction accuracy of market prices could be found. No difference
in prediction accuracy between mean individual forecasts, equilibrium prices and last
trading prices could be found. However, a strong relationship between mean individual
forecasts and both equilibrium prices and last trading prices could be found.
However, the experimental results obtained through the experiments of this research
should be interpreted with care. Some markets suffered from manipulation by cheaters
and a low number of individual forecasts due to low questionnaire response although it
was tried to isolate these effects from analysis. Further experiments and more
representative data are needed to confirm the conclusions reached in this research.
6.2 Recommendations for Further Research
The findings indicate that market designers and research need to pay less attention to the
composition of trader population and to trader characteristics such as the presence of
biases or trading behaviour when setting up and investigating prediction markets.
However, the utilized sources of information deserve further attention. As shown by this
research, there might be potential for an increase in prediction accuracy if market
designer manage to control this variable among traders.
The combination of individual forecasts and prediction markets offers a powerful tool for
further analyzing information aggregation efficiency in prediction markets. The classical
experiments with double auctions conducted by Chamberlain (1948) and Smith (1962)
can be applied to predicting events as well and offer a great source of inspiration for
further experiments with prediction markets.
Existing research focused on using more realistic experimental settings. A higher degree
of experimental situation within laboratory settings would allow investigating isolated
effects such as demand and supply shocks, price formation or trading efficiency more in
detail.
One problem in researching prediction markets concerns the reproducibility and
comparability of results. As the inherent predictability and aggregate uncertainty varies
depending on the to-be-predicted outcome the results of different markets can not simply
be compared as it is often done in literature. Only markets with the same to-be-forecasted

Information Aggregation in Prediction Markets
J. Martin � Master Thesis � 27.09.2006 69
outcome, controlled boundary conditions and quantifiable and measurable dependent and
independent variables should be compared in order to be able to draw representative
conclusions.
The number of possible determinants affecting forecast accuracy that have been
identified by several scholars in the field has grown to an unmanageable number of
disruptive factors that might affect result results. While many scholars have been
attracted by the fascinating accuracy that has been achieved by those markets in real
world settings further experimental research attempts should focus on isolating influences
which may be achieved only by strict laboratory conditions. However, this would prevent
researches in turn from obtaining practice-relevant results but is necessary to gain insight
in the influence of all determinants.
The relationship of private information and aggregate market information deserves more
attention by future research. Only if research achieves to determine the information
aggregation mechanism market designers will be able to better control forecast accuracy
and interpret results.

Information Aggregation in Prediction Markets
J. Martin � Master Thesis � 27.09.2006 70
7 Acknowledgements
I would like to thank all persons who supported my master thesis research with input and
feedback. In particular, I would like to thank all the traders who have participated in the
prediction market experiments. Furthermore, I want to thank my coach Prof. van Heck for
having provided me a significant amount of his time as well as David Pennock and Brian
Galebach for having provided me data from ProbabilitySports. Although I have not utilized
the data in this research it provided me with some ideas of how to conduct the experiment
and data analysis.
8 Bibliography
(Beckmann & Werding 1996) Beckmann K & Werding M. 'passauer wahlborse': information processing in a political market experiment. Kyklos (1996) 49: pp. 171-204.
(Berg et al. 2000) Berg J, Forsythe R, Nelson F & Rietz TA. Results from a dozen years of election futures markets research. forthcoming in CA Plott and V Smith (Eds) Handbook of Experimental Economic Results (2000). http://www.biz.uiowa.edu/iem/archive/BFNR_2000.pdf
(Berg & Rietz 2002) Berg J & Rietz T. Longshots, overconfidence and efficiency on the iowa electronic market. Universtiy of Iowa Tippie School of Business. Working paper (2002). http://www.biz.uiowa.edu/iem/archive/Longshots_2002January.pdf
(Berg & Rietz 2005) Berg, J E, Rietz. The iowa electronic market: Lessons learned and answers yearned. Universtiy of Iowa Tippie School of Business. Working paper (2005). http://www.biz.uiowa.edu/faculty/trietz/papers/AEI-Brookings.pdf
(Berlemann & Schmidt 2001) Berlemann M & Schmidt C. Predictive accuracy of political stock markets empirical evidence from a european perspective. Humboldt Universitaet Berlin, Sonderforschungsbereich 373 (2001). Working paper.
(Bondarenko & Bossaerts 2000) Bondarenko O & Bossaerts P. Expectations and learning in iowa. Journal of Banking & Finance (2000) 24: pp. 1535-1555.
(Bruggelambert 2004) Bruggelambert G. Information and efficiency in political stock markets: using computerized markets to predict election results. Applied Economics (2004) 36: pp. 753-768.

Information Aggregation in Prediction Markets
J. Martin � Master Thesis � 27.09.2006 71
(Chamberlin 1948) Chamberlin EH. An experimental imperfect market. Journal of Political Economy (1948) 56: pp. 95-108.
(Chen & Plott 2002) Chen KY & Plott CR. Information aggregation mechanism: concept, design and implementation for a forecasting problem. Working paper (2002). http://www.hss.caltech.edu/SSPapers/wp1131.pdf
(Chen et al. 2005) Chen Y, Chu C, Mullen T & Pennock D. Information markets vs. opinion pools: an empirical comparison. The Pennsylvania State University. Working paper (2005). http://www.smeal.psu.edu/ebrc/publications/res_papers/2005_02.pdf
(Davis & Holt 1992) Davis D & Holt C. Experimental economics. Princeton University Press (1992).
(Economist 2004) Economist. Guessing games. Newspaper article (2004). http://www.economist.com/displaystory.cfm?story_id=3400241
(Fama 1970) Fama EF. Efficient capital markets: a review of theory and empirical work. Journal of Finance (1970) 25: pp. 383-417.
(Forsythe et al. 1992) Forsythe R, Nelson F, Neumann GR & Wright J. Anatomy of an experimental political stock-market. American Economic Review (1992) 82: pp. 1142-1161.
(Forsythe et al. 1998) Forsythe R, Frank M, Krishnamurthy V & Ross TW. Markets as predictors of election outcomes: campaign events and judgement bias in the 1993 ubc election stock market. Canadian Public Policy-Analyse De Politiques (1998) 24: pp. 329-351.
(Forsythe et al. 1999) Forsythe R, Rietz TA & Ross TW. Wishes, expectations and actions: a survey on price formation in election stock markets. Journal of Economic Behavior & Organization (1999) 39: pp. 83-110.
(Gartner 2005) Gartner. Gartner's hype cycle special report for 2005. (2005). http://www.gartner.com/resources/130100/130115/gartners_hype_c.pdf
(Gjerstad 2004) Gjerstad S. Risk aversion, beliefs, and prediction market equilibrium. Working paper (2004). http://www.econlab.arizona.edu/~gjerstad/papers/Gj_2005_PME.pdf
(Gode & Sunder 1993) Gode D & Sunder S. Allocative efficiency of markets with zero-intelligence traders: market as a partial substitute for individual rationality. The Journal of Political Economy (1993) 101: pp. 119-137.

Information Aggregation in Prediction Markets
J. Martin � Master Thesis � 27.09.2006 72
(Gruca et al. 2005) Gruca TS, Berg JE & Cipriano M. Consensus and differences of opinion in electronic prediction markets. Electronic Markets (2005) 15: pp. 13-22.
(Hanson 2003) Hanson R. Combinatorial information market design. Information Systems Frontiers (2003) 5: pp. 107-119.
(Hayek 1945) Hayek F. The use of knowledge in society. American Economic Review (1945) 35: pp. 519-530.
(Hong & Page 2004) Hong L & Page SE. Groups of diverse problem solvers can outperform groups of high-ability problem solvers. Proceedings of the National Academy of Sciences of the United States of America (2004) 101: pp. 16385-16389.
(Jacobsen et al. 2000) Jacobsen B, Potters J, Schram A, van Winden F & Wit J. (in)accuracy of a european political stock market: the influence of common value structures. European Economic Review (2000) 44: pp. 205-230.
(Kambil & van Heck 2002) Kambil A & van Heck E. Making markets : how firms xan design and profit from online auctions and exchanges. Harvard Business School Press (2002).
(Larrick & Soll 2006) Larrick R & Soll J. Intuitions about combining opinions: misappreciation of the averaging principle. Management Science (2006) 52: .
(Manski 2005) Manski C. Interpreting the predictions of prediction markets. Northwestern University. Working paper (2005). http://www.nber.org/papers/w10359
(Oliven & Rietz 2004) Oliven K & Rietz TA. Suckers are born but markets are made: individual rationality, arbitrage, and market efficiency on an electronic futures market. Management Science (2004) 50: pp. 336-351.
(Rhode & Strumpf 2003) Rhode P & Strumpf K. Historical prediction markets: wagering on presidential elections. (2003). University of North Carolina at Chapel Hill. Working paper. http://www.unc.edu/~cigar/papers/BettingPaper_final(JEP_Resubmit).pdf
(Servan-Schreiber et al. 2004) Servan-Schreiber E, Wolfers J, Pennock D & Galebach B. Prediction markets: does money matter?. Electronic Markets (2004) 14.
(Simon 1955) Simon HA. A behavioral model of rational choice. The Quarterly Journal of Economics (1955) 69: pp. 99-118.
Information Aggregation in Prediction Markets
J. Martin � Master Thesis � 27.09.2006 73
(Smith 1962) Smith VL. An experimental study of competitive behavior. Journal of Political Economy (1962).
(Spann & Skiera 2003) Spann M & Skiera B. Internet-based virtual stock markets for business forecasting. Management Science (2003) 49: pp. 1310-1326.
(Surowiecki 2004) Surowiecki J. The wisdom of crowds. RandomHouse (2004).
(TIME 2004) TIME. The end of management?. Newspaper article (2004). http://www.time.com/time/insidebiz/article/0,9171,1101040712-660965-1,00.html
(Thaler 1988) Thaler RH & Ziemba WT. Anomalies - parimutuel betting markets - racetracks and lotteries. Journal of Economic Perspectives (1988) 2: pp. 161-174.
(Van Bruggen et al. 2006) Van Bruggen GH, Spann M, Lilien GL & Skiera B. Institutional forecasting: the performance of thin virtual stock markets. Erasmus Institute of Management Report Series (2006). Working paper. https://ep.eur.nl/bitstream/1765/7840/1/ERS-2006-028-MKT.pdf
(Wolfers & Zitzewitz 2004) Wolfers J & Zitzewitz E. Prediction markets. Journal of Economic Perspectives (2004) 18: pp. 107-126.
(Wolfers & Zitzewitz 2005a) Wolfers J & Zitzewitz E. Prediction markets in theory and practice. University of Pennsylvania, The Wharton School. Working paper. (2005). http://bpp.wharton.upenn.edu/jwolfers/Papers/PredictionMarkets(Palgrave).pdf
(Wolfers & Zitzewitz 2005b) Wolfers J & Zitzewitz E. Interpreting prediction market prices as probabilities. University of Pennsylvania, The Wharton School. Working paper (2005). http://www.aeaweb.org/annual_mtg_papers/2006/0106_1015_0702.pdf
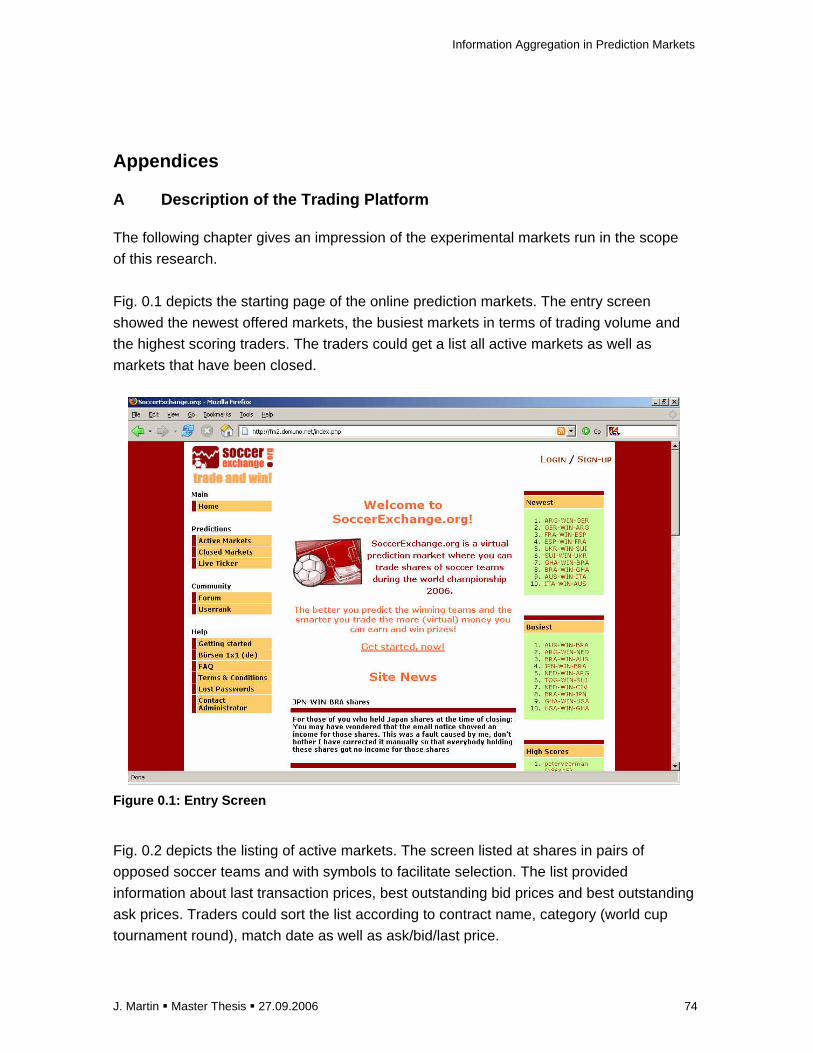
Information Aggregation in Prediction Markets
J. Martin � Master Thesis � 27.09.2006 74
Appendices
A Description of the Trading Platform
The following chapter gives an impression of the experimental markets run in the scope
of this research.
Fig. 0.1 depicts the starting page of the online prediction markets. The entry screen
showed the newest offered markets, the busiest markets in terms of trading volume and
the highest scoring traders. The traders could get a list all active markets as well as
markets that have been closed.
Figure 0.1: Entry Screen
Fig. 0.2 depicts the listing of active markets. The screen listed at shares in pairs of
opposed soccer teams and with symbols to facilitate selection. The list provided
information about last transaction prices, best outstanding bid prices and best outstanding
ask prices. Traders could sort the list according to contract name, category (world cup
tournament round), match date as well as ask/bid/last price.
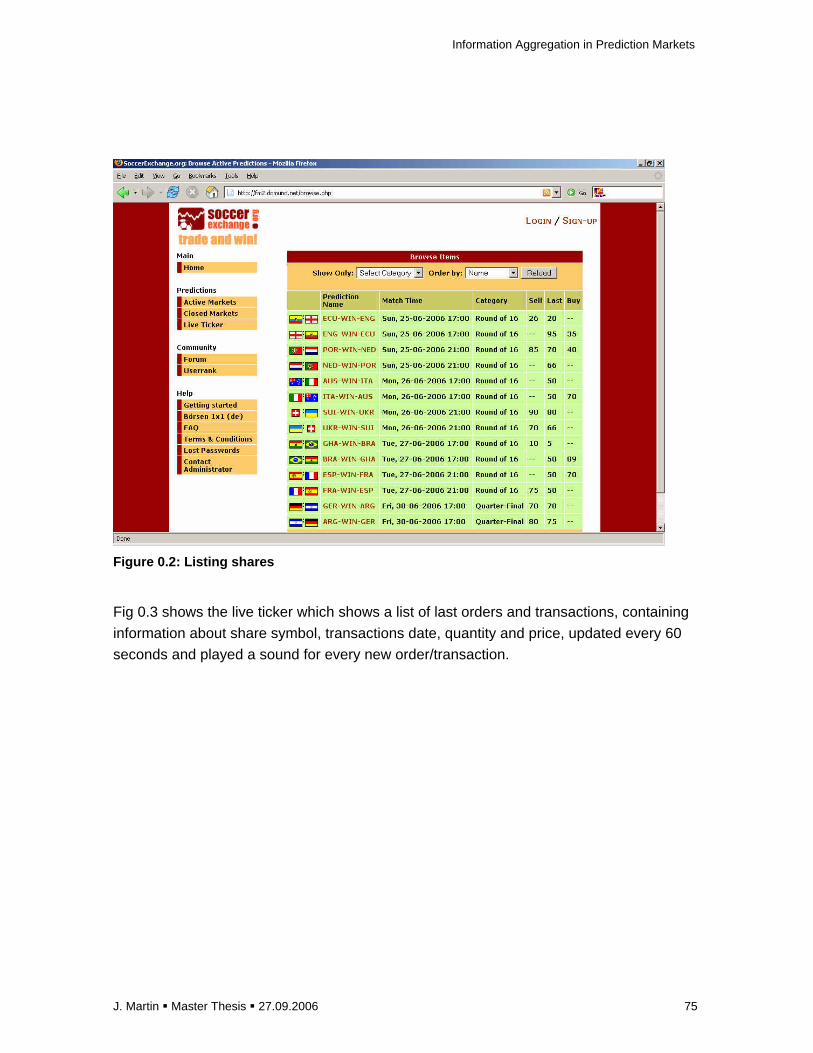
Information Aggregation in Prediction Markets
J. Martin � Master Thesis � 27.09.2006 75
Figure 0.2: Listing shares
Fig 0.3 shows the live ticker which shows a list of last orders and transactions, containing
information about share symbol, transactions date, quantity and price, updated every 60
seconds and played a sound for every new order/transaction.
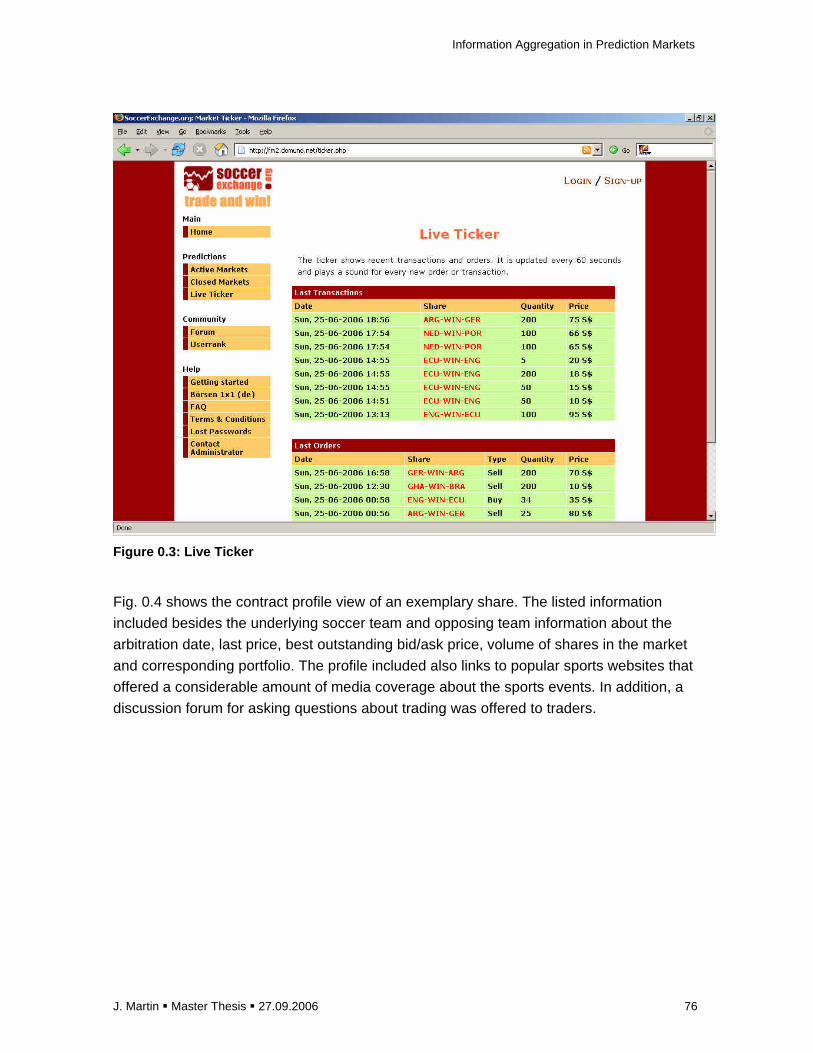
Information Aggregation in Prediction Markets
J. Martin � Master Thesis � 27.09.2006 76
Figure 0.3: Live Ticker
Fig. 0.4 shows the contract profile view of an exemplary share. The listed information
included besides the underlying soccer team and opposing team information about the
arbitration date, last price, best outstanding bid/ask price, volume of shares in the market
and corresponding portfolio. The profile included also links to popular sports websites that
offered a considerable amount of media coverage about the sports events. In addition, a
discussion forum for asking questions about trading was offered to traders.

Information Aggregation in Prediction Markets
J. Martin � Master Thesis � 27.09.2006 77
Figure 0.4: Contract Profile
Fig. 0.5 depicts the order screen that was included below the contract profile. The trader
saw listed its current holdings of the contract and outstanding orders of the contract that
could be deleted any time when desired. In addition, there was a form for creating a new
buy or sell order. The form included a questionnaire that could be filled out and submitted
along with the order type, quantity and limit price. Respondents were asked to state
whether they have any for the contracts’ underlying soccer team or the opposite team.
In addition they were asked to give a direct probability estimate and to state the source of
information used for making the probability estimate.
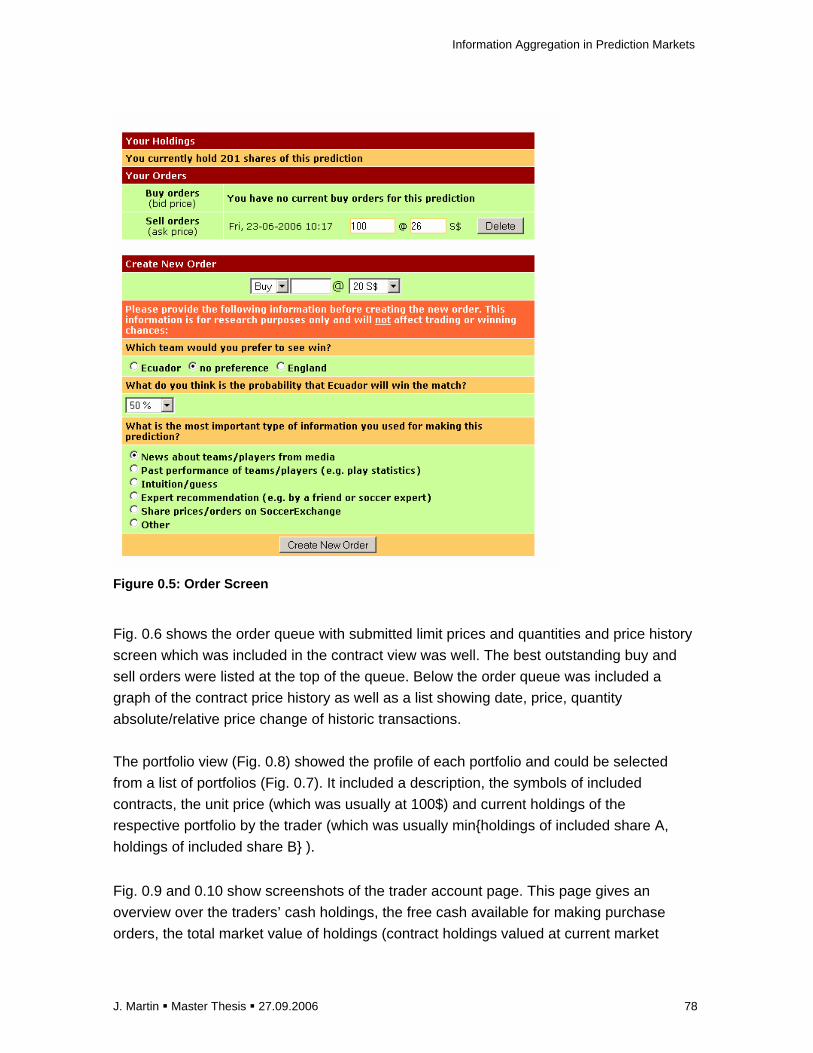
Information Aggregation in Prediction Markets
J. Martin � Master Thesis � 27.09.2006 78
Figure 0.5: Order Screen
Fig. 0.6 shows the order queue with submitted limit prices and quantities and price history
screen which was included in the contract view was well. The best outstanding buy and
sell orders were listed at the top of the queue. Below the order queue was included a
graph of the contract price history as well as a list showing date, price, quantity
absolute/relative price change of historic transactions.
The portfolio view (Fig. 0.8) showed the profile of each portfolio and could be selected
from a list of portfolios (Fig. 0.7). It included a description, the symbols of included
contracts, the unit price (which was usually at 100$) and current holdings of the
respective portfolio by the trader (which was usually min{holdings of included share A,
holdings of included share B} ).
Fig. 0.9 and 0.10 show screenshots of the trader account page. This page gives an
overview over the traders’ cash holdings, the free cash available for making purchase
orders, the total market value of holdings (contract holdings valued at current market
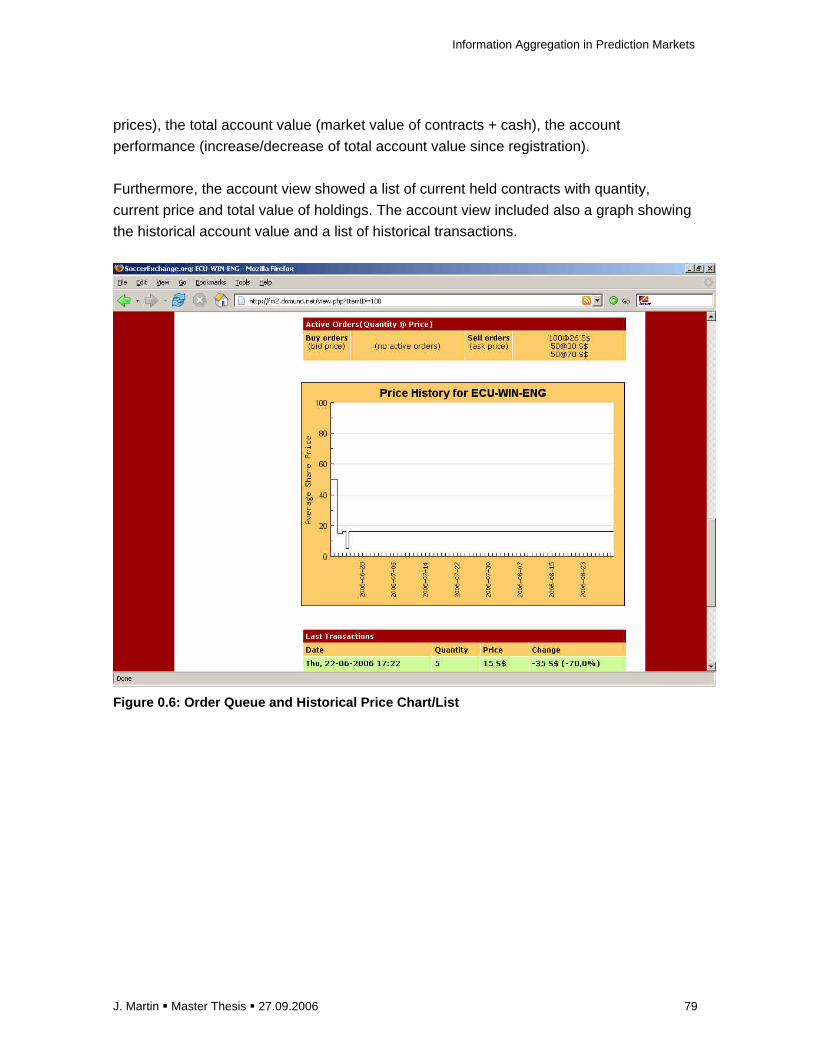
Information Aggregation in Prediction Markets
J. Martin � Master Thesis � 27.09.2006 79
prices), the total account value (market value of contracts + cash), the account
performance (increase/decrease of total account value since registration).
Furthermore, the account view showed a list of current held contracts with quantity,
current price and total value of holdings. The account view included also a graph showing
the historical account value and a list of historical transactions.
Figure 0.6: Order Queue and Historical Price Chart/ List
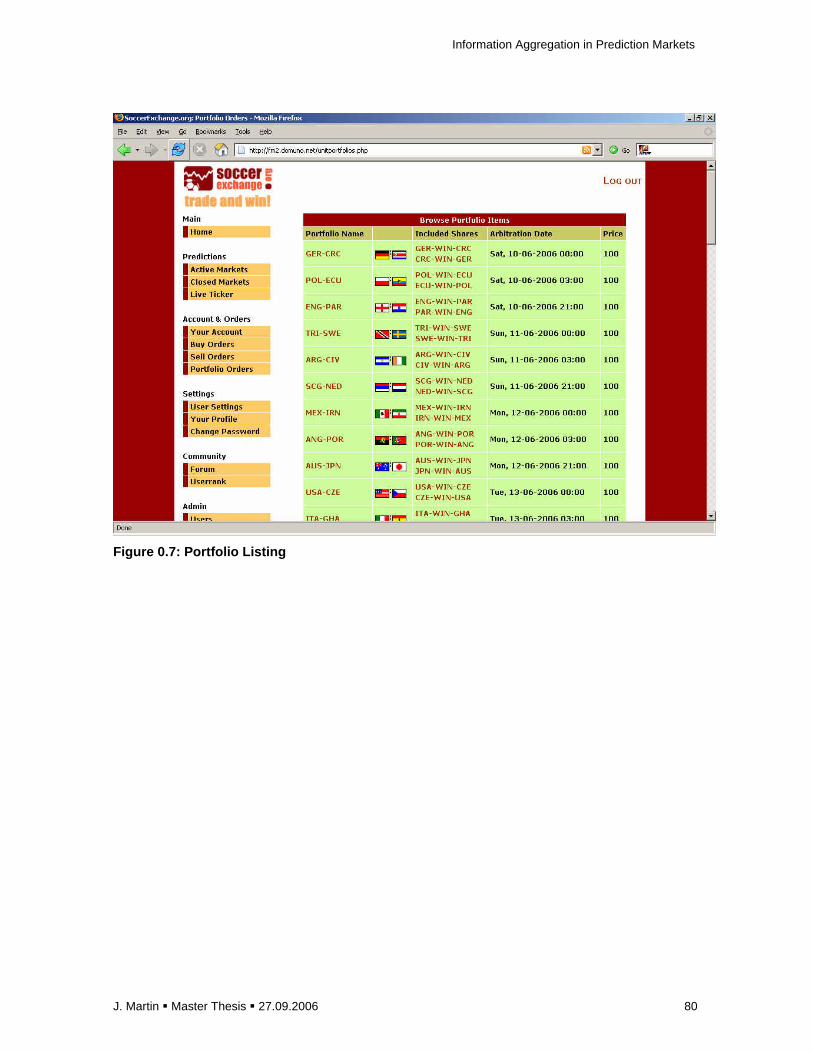
Information Aggregation in Prediction Markets
J. Martin � Master Thesis � 27.09.2006 80
Figure 0.7: Portfolio Listing
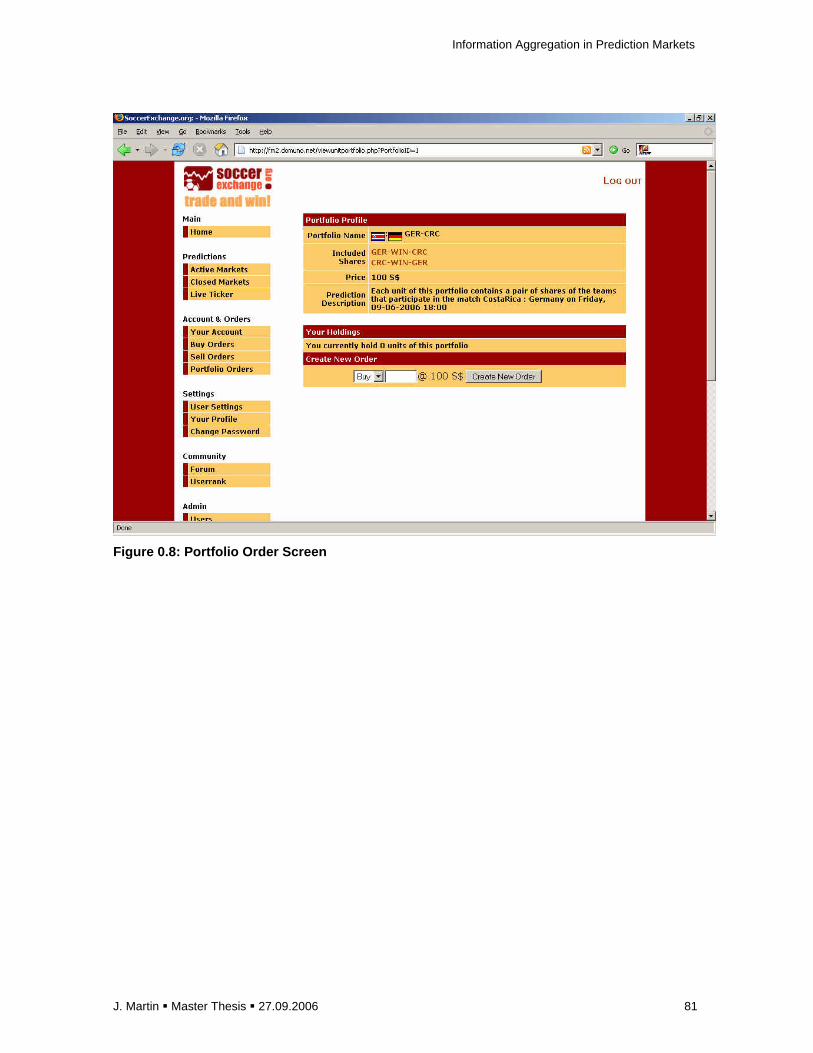
Information Aggregation in Prediction Markets
J. Martin � Master Thesis � 27.09.2006 81
Figure 0.8: Portfolio Order Screen
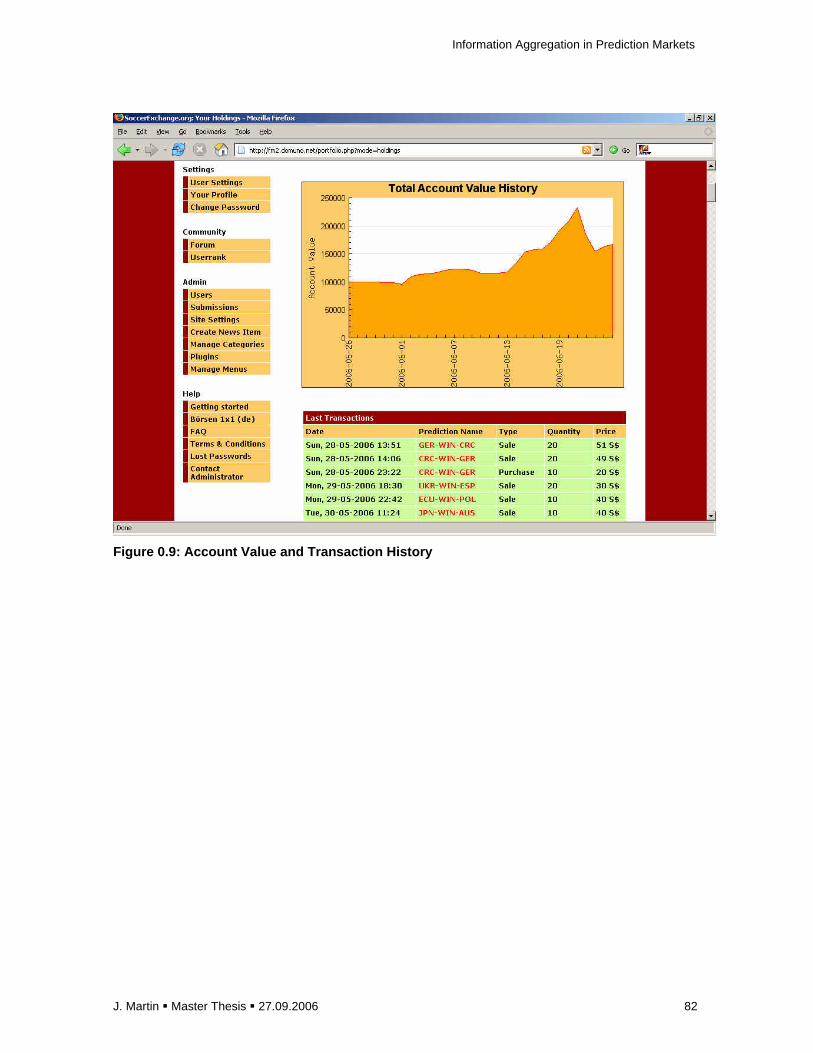
Information Aggregation in Prediction Markets
J. Martin � Master Thesis � 27.09.2006 82
Figure 0.9: Account Value and Transaction History

Information Aggregation in Prediction Markets
J. Martin � Master Thesis � 27.09.2006 83
Figure 0.10: Account Information and Statistics
Fig. 0.11 depicts the userrank page which listed all traders according to account value
performance.
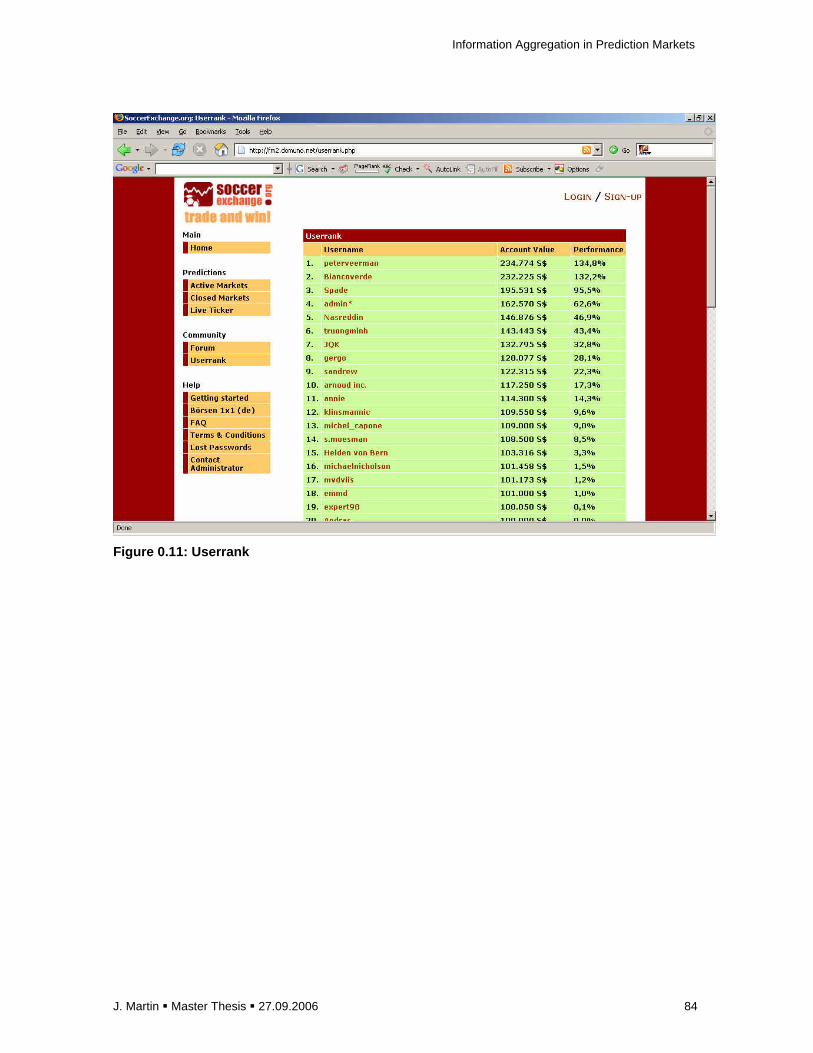
Information Aggregation in Prediction Markets
J. Martin � Master Thesis � 27.09.2006 84
Figure 0.11: Userrank

Information Aggregation in Prediction Markets
J. Martin � Master Thesis � 27.09.2006 85
B Trader Manual
The following sections shows the manual that was used to educate traders
Getting Started
What is SoccerExchange?
SoccerExchange is a virtual prediction market and is like a stock market. It uses the power of market forces to aggregate information from different individuals to create a more accurate prediction of events. From the user's perspective, this site functions as a game in which individuals can test their savvy for prediction against other users.
Before starting, please read carefully the terms an d conditions
What kinds of shares are offered in this stock mark et?
The shares offered on SoccerExchange are tied to the outcome of world cup soccer matches. For each soccer team and each match a diffrent share is offered. For example, the share with the symbol NED-WIN-ARG will be tied to a final payoff if The Netherlands beat Argentina. But there is also a share ARG-WIN-NED that pays off if Argentina wins.
How is the payoff determined?
If a team wins the holder of the corresponding share will get a payoff of 100S$ otherwise he will get nothing. Usually 6 hours after the scheduled match the market will be closed, the bank will get all shares back and the holder will get credited the final payoff as cash on his account (either 100 S$ or 0 S$ for each share). This date is called "arbitration date".
What happens if the game ends in a draw?
If a definite winner cannot be determined the final payoff will be 50 S$ each for the shares of both teams.
How can I trade shares?
You can buy or sell each share on the market from or to other traders prior to the arbitration date. You can place a buy or sell order by entering a limit buying or selling prices (called bid or ask). Whether the order is executed immediately depends on whether there are sale or purchase offers from other users whose limit prices fit your offered price.

Information Aggregation in Prediction Markets
J. Martin � Master Thesis � 27.09.2006 86
Why do the prices reflect probabilities?
Since the payoff is 100S$ if the event of a share takes place and nothing if not the market mechanism forces you to offer and demand shares at prices that equal your expectations about the probability of that event. If you think that team A will win with 80% probability you will be likely to pay maximal 80S$ for its underlying share. However, you may try to buy it at a lower price in order to make a trading profit.
Do I have to use real money?
No, after registration you will get a free account with 100.000 SoccerDollar from the bank. This is the virtual currency you use for trading shares. However, the traders with the highest trading profits will win prizes at the end.
What are the prizes?
1. price: 1 Amazon gift certificate worth 100 Euro 2. price: 1 Amazon gift certificate worth 60 Euro 3. price: 1 Amazon gift certificate worth 40 Euro
What options do I have to buy shares?
1) The first option is to place a buy order with a limit buy price as mentioned. However, if there are not enough shares offered for sale or if the offered sale prices do not fit your desired purchase price you have to wait until your order is matched by another subsequent order.
2) The second possibility is to buy a portfolio. Yo u can buy portfolios immediately at any time from the bank.
What is a portfolio?
A portfolio contains usually a pair of shares from team A and the opposite team B as well. It is offered for a fixed price of 100 S$ and can be purchased and sold any time from and to the bank. Foer example, NED-ARG is a portfolio that contains the shares NED-WIN-ARG (The Netherlands win) and ARG-WIN-NED (Argentina wins). If you hold a portfolio until the closure of the market you will neither lose nor gain money regardless of which team wins since you get 100S$ for one of the two shares for sure!
Why should I buy portfolios if I want to get only t he shares of team A but not team B?

Information Aggregation in Prediction Markets
J. Martin � Master Thesis � 27.09.2006 87
At the beginning of the game there may be no shares in the market to offer for sale but many buy orders. So, you may not be able to buy shares of your favorite team. The only way to get shares of team A immediately is to buy a bundle for 100 S$ and to sell the shares of team B on the market. If team A wins you will earn 100 S$ + the sale price of share B and make a profit.
Buying portfolios and selling its included shares i s the only way to get shares in circulation to the market! So if you only place buy orders and don't buy portfolios and offer shares for sale you may never get your de sired shares!
How can I buy and sell a portfolio?
Select under "Order Portfolios" a portfolio by clicking on the symbol and enter a quantity. You will then get a share of team A and B at a time times the quantity. If you want to sell units of a portfolio you need to hold at least one pair of shares of team A + team B. If you hold shares of one only team or if all shares of one team are bounded to sell orders you cannot sell portfolios!
How can I place a buy or sell order for a share?
1) Select the appropriate share under "Active Markets" 2) Enter a buy/sell limit price (the maximum price our are willing to pay for buying a share or the minimum price you are asking for selling a share)
3) Select the quantity of shares

Information Aggregation in Prediction Markets
J. Martin � Master Thesis � 27.09.2006 88
4) Fill in the questionnaire below and submit your order
Why do I have to fill in a questionnaire along with every order?
This questionnaire is for research purposes only and doesn't influence your trading or winning chance.
How is an order processed?
If your buy or sell order matches an outstanding sell or buy order it will be executed immediately. This happens usually if your limit buy/sell price is equal or above/below the highest/lowest outstanding limit sell/buy price by another trader. In other words, if you are a buyer you need to offer a higher or equal price than proposed by the seller and vice versa. Otherwise, if your offered purchase price is lower, your order will be added to a queue as an outstanding order until it gets matched by a subsequent order. You see usually the best (highest) outstanding bid price and the best (lowest) outstanding ask price at the top of the queue. If the quantity of your order matches only a part of a fitting outstanding order it will be executed partially and the remaining order will be added to the queue.
The following example will illustrate this:
In the following example, there are 79 sell orders in the queue for an ask price of 50 S$.
We enter a buy order with 80 shares for a maximum purchase price (bid) of 52 S$.
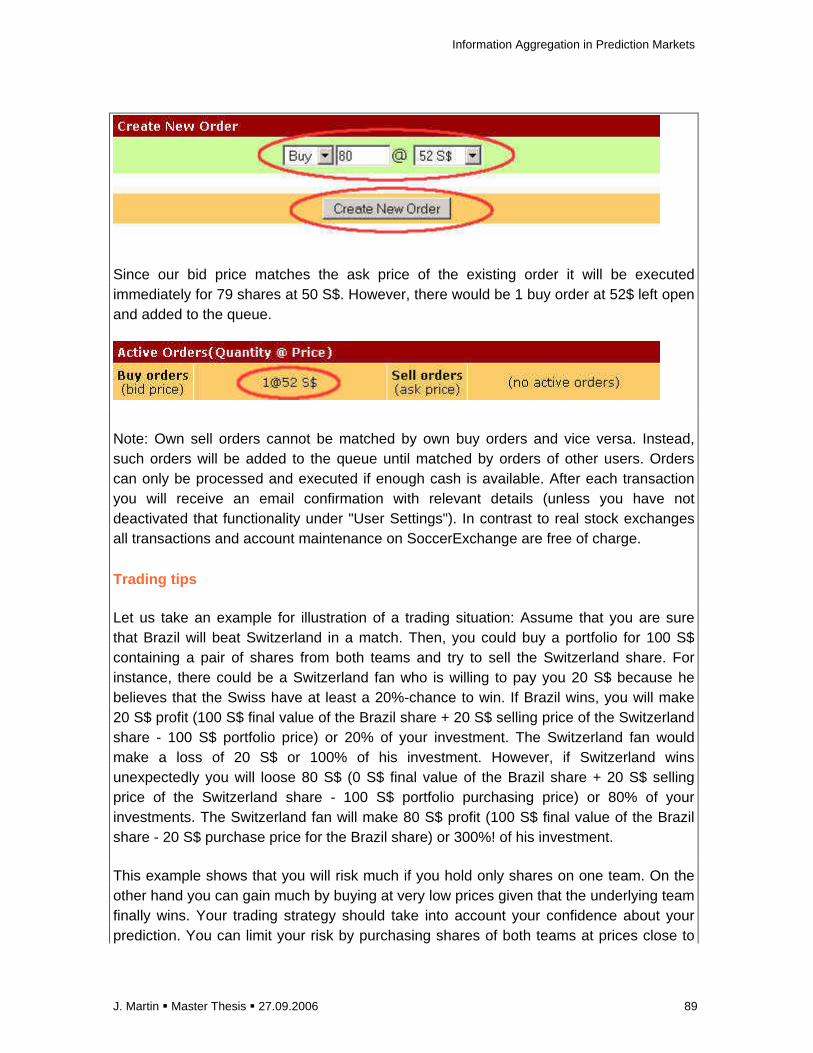
Information Aggregation in Prediction Markets
J. Martin � Master Thesis � 27.09.2006 89
Since our bid price matches the ask price of the existing order it will be executed immediately for 79 shares at 50 S$. However, there would be 1 buy order at 52$ left open and added to the queue.
Note: Own sell orders cannot be matched by own buy orders and vice versa. Instead, such orders will be added to the queue until matched by orders of other users. Orders can only be processed and executed if enough cash is available. After each transaction you will receive an email confirmation with relevant details (unless you have not deactivated that functionality under "User Settings"). In contrast to real stock exchanges all transactions and account maintenance on SoccerExchange are free of charge.
Trading tips
Let us take an example for illustration of a trading situation: Assume that you are sure that Brazil will beat Switzerland in a match. Then, you could buy a portfolio for 100 S$ containing a pair of shares from both teams and try to sell the Switzerland share. For instance, there could be a Switzerland fan who is willing to pay you 20 S$ because he believes that the Swiss have at least a 20%-chance to win. If Brazil wins, you will make 20 S$ profit (100 S$ final value of the Brazil share + 20 S$ selling price of the Switzerland share - 100 S$ portfolio price) or 20% of your investment. The Switzerland fan would make a loss of 20 S$ or 100% of his investment. However, if Switzerland wins unexpectedly you will loose 80 S$ (0 S$ final value of the Brazil share + 20 S$ selling price of the Switzerland share - 100 S$ portfolio purchasing price) or 80% of your investments. The Switzerland fan will make 80 S$ profit (100 S$ final value of the Brazil share - 20 S$ purchase price for the Brazil share) or 300%! of his investment.
This example shows that you will risk much if you hold only shares on one team. On the other hand you can gain much by buying at very low prices given that the underlying team finally wins. Your trading strategy should take into account your confidence about your prediction. You can limit your risk by purchasing shares of both teams at prices close to

Information Aggregation in Prediction Markets
J. Martin � Master Thesis � 27.09.2006 90
50 S$ or diversifying by holding several shares of diffrent matches and teams. However, please note that it makes no sense to buy shares of both competing teams at 50 S$ or portfolios with both teams and to wait until the market get closed. You will then get only as much as you have invested without any profit or loss.
It is only by trading that you can make profits!
How is the game organized?
The shares for the first round of the championship are offered right from the beginning. The shares for the matches of the second round will be offered as soon as the participating teams are known.
Have good luck and fun with trading!

Information Aggregation in Prediction Markets
J. Martin � Master Thesis � 27.09.2006 91
C Software
C.1 Choice of trading platform software
The trading platform of SocerExchange was built upon open source software. The author
identified 3 different open source packages that were available.
Zocalo28
A prediction market software written in Java and based upon object orientated language.
Zocalo has been created for the purpose of running short-session experimental markets
but is not appropriate for conducting long term prediction markets with a time period of
more than one day. Therefore it wasn’t considered for this research.
IdeaFutures29
Ideafutures is software package that emerged from the popular Ideafutures prediction
markets which claim on future developments. It is written in Perl programming language.
It wasn’t considered for this research as it didn’t use a relational database but only log
files instead. In addition, the author wasn’t familiar with Perl.
FreeMarket Project30
Freemarket is a recent development based on PHP and procedural programming. It uses
a relational MySQL database. The author chose this package for his research because of
his familiarity with PHP and because it allowed easy customization. The software needed
extensive modifications before it could be used for this research. Portfolios were
introduced
28 http://sourceforge.net/projects/zocalo/ 29 http://sourceforge.net/projects/ideafutures/ 30 http://www.freemarket-project.org
Information Aggregation in Prediction Markets
J. Martin � Master Thesis � 27.09.2006 92
C.2 Database Architecture
Fig. 0.12 shows a relational schema of the database structure with the most important
tables and fields (including data types). New outstanding orders were added to the
respective table. Transactions and orders were recorded in separate tables. The orders
table contained only records of outstanding orders that didn’t match immediately with
other orders. When they were matched subsequently, the table entry of the respective
order was deleted from the orders table and a new transaction entry was added to the
transactions table containing the ID’s of the previous orders that led to the transaction.
When the outstanding order was cancelled by the trader, it was simply deleted from the
“orders” table. All orders were also logged into a logfile together with the questionnaire
data so that historical data were also kept recorded. that was later transformed to
MySQL database for data processing. If a transaction resulted in a purchase of a contract
the new contract holdings were added to the respective holdings table.
The “portfolios” table included a list of unique portfolios. Portfolio transactions as such
were not recorded but only the transactions of the included shares. The portfolio id of the
portfolio to which a contract belonged was recorded for each contract in the “shares”
table. If a portfolio was selected by the trader for purchase or sale the included shares
were looked up in the “shares” table and transaction executed at a standard price of 50
S$ (since the sum of a portfolio unit transaction summed up to a price of 100 S$).
The “users” table contained besides basic information about users also the historical
account values that were updated every day to and added to a queue. It also contained a
field of current total account value that was updated with every transaction.
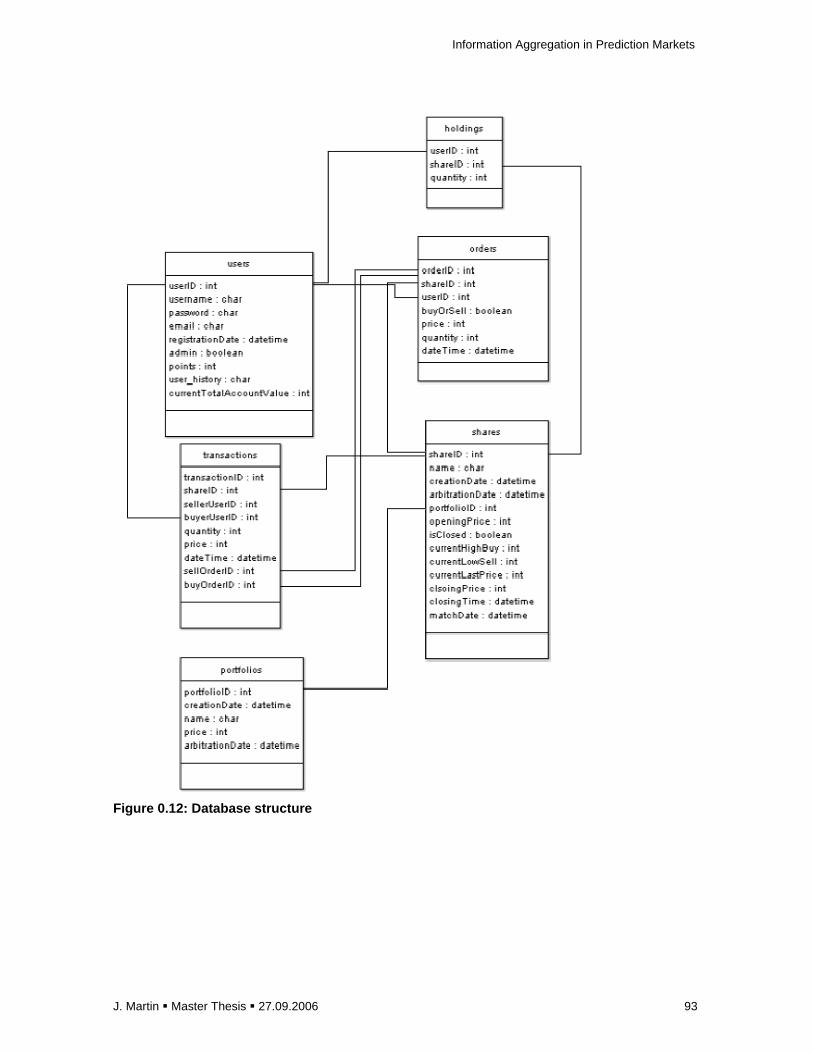
Information Aggregation in Prediction Markets
J. Martin � Master Thesis � 27.09.2006 93
Figure 0.12: Database structure

Information Aggregation in Prediction Markets
J. Martin � Master Thesis � 27.09.2006 94
D Description of the datasets and data pre-processi ng
Introduction
There are 5 tables relevant for the analysis: orders, orders_bmd transactions,
transactions_bmd and items.
The final calculation have been performed in the excel worksheet
soccerexchange_results.xls
The rough datasets (sql, csv) and excel sheets (xls) can be downloaded via
http://www.soccerexchange.org/data
Table orders:
field description
date
newdel 1=new order, 0=delete old order
id
each new order gets a new id, delete orders contain
the id of the original order
user user id
item share id
type 1=buy order, 0=sell order
quant quantity
price
buy order= maximum order price, sell order=minimum
order price
prob probability estimate - via questionnaire
pref
preference for a team (1=team A - the shares'
corresponding team, 2=no preference, 3=team B - the
shares' opposite team) - via questionnaire
source
source of information (1=News about teams/players f rom
media,2=Past performance of teams/players (e.g. pla y
statistics),3=Intuition/guess,4=Expert recommendati on
(e.g. by a friend or soccer expert),5=Share
prices/orders on SoccerExchange,6=Other) - via
questionnaire
Table transactions
date

Information Aggregation in Prediction Markets
J. Martin � Master Thesis � 27.09.2006 95
id
each new transaction gets a
new id
buyer user id of the buyer
buyorder
order id od the corresponding
buy order
seller user id of the seller
sellorder
order id od the corresponding
sell order
item share id
quantity transaction quantity
price transaction price
Table items
id share id
name
country code e.g. GER-WIN-CRC=Germany beats Costa
Rica
date creation date (market opening)
category
1=pre-round, 2=Round of 16, 3=quarter final,
4=half final, 5=3rd place, 6=final
closingprice determined final price=final payoff
closingtime closing date
winner corresponding team of the share
loser corresponding opposite team of the share
matchdate
Transformation of Tables
In order to create a table with all orders submitted prior to the match date (orders_bmd)
the original table orders was copied and the following SQL query was run:
Delete FROM orders_bmd USING orders_bmd, items WHERE items.id=orders_bmd.item
AND unix_timestamp(orders_bmd.date)>unix_timestamp(items.matchdate)
In order to create a table with all transactions executed prior to the match date
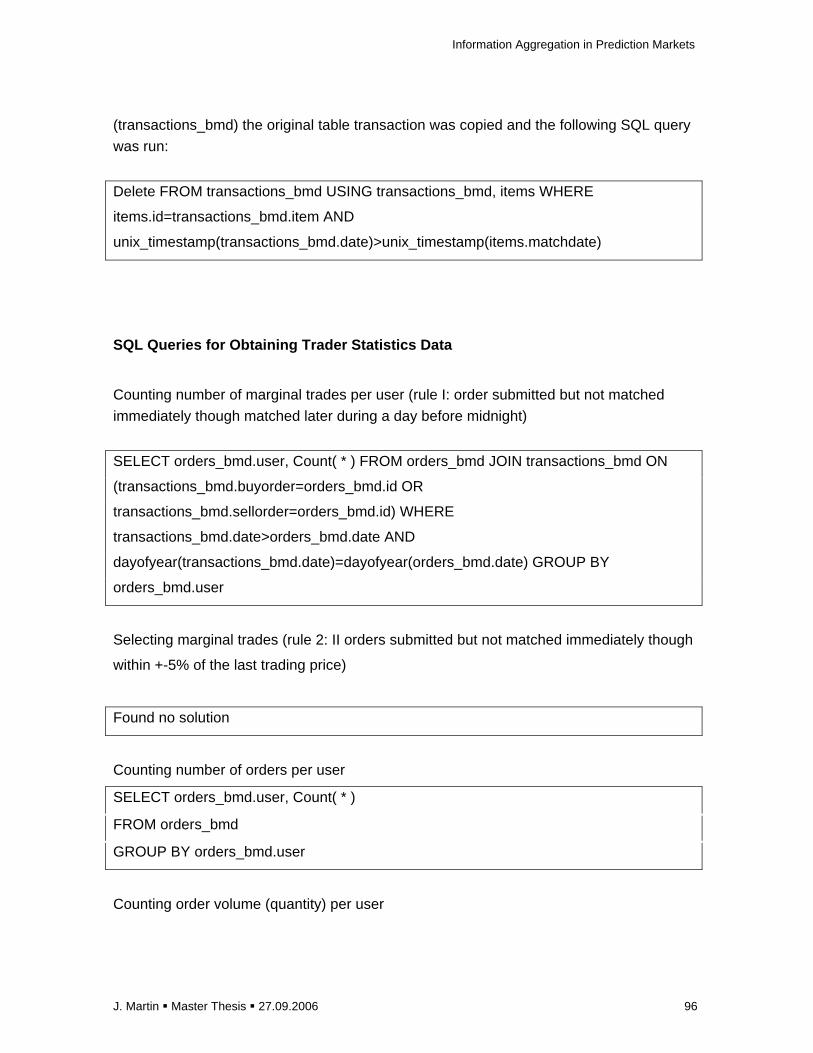
Information Aggregation in Prediction Markets
J. Martin � Master Thesis � 27.09.2006 96
(transactions_bmd) the original table transaction was copied and the following SQL query
was run:
Delete FROM transactions_bmd USING transactions_bmd, items WHERE
items.id=transactions_bmd.item AND
unix_timestamp(transactions_bmd.date)>unix_timestamp(items.matchdate)
SQL Queries for Obtaining Trader Statistics Data
Counting number of marginal trades per user (rule I: order submitted but not matched
immediately though matched later during a day before midnight)
SELECT orders_bmd.user, Count( * ) FROM orders_bmd JOIN transactions_bmd ON
(transactions_bmd.buyorder=orders_bmd.id OR
transactions_bmd.sellorder=orders_bmd.id) WHERE
transactions_bmd.date>orders_bmd.date AND
dayofyear(transactions_bmd.date)=dayofyear(orders_bmd.date) GROUP BY
orders_bmd.user
Selecting marginal trades (rule 2: II orders submitted but not matched immediately though
within +-5% of the last trading price)
Found no solution
Counting number of orders per user
SELECT orders_bmd.user, Count( * )
FROM orders_bmd
GROUP BY orders_bmd.user
Counting order volume (quantity) per user
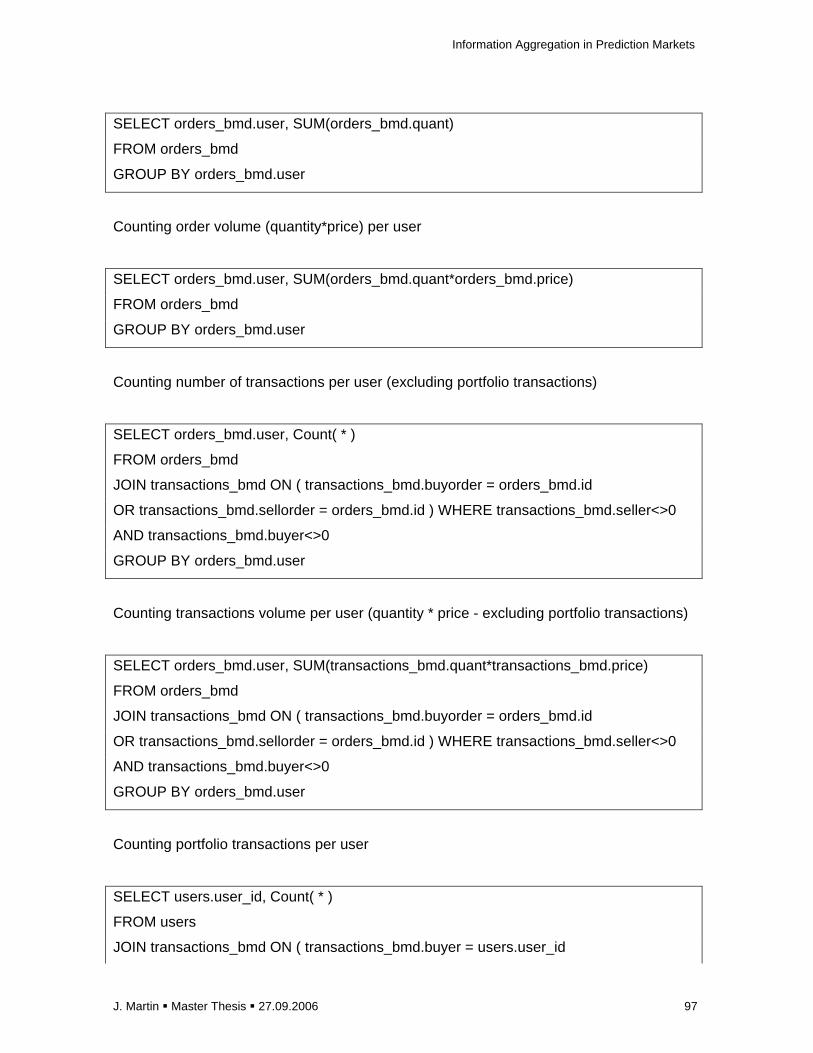
Information Aggregation in Prediction Markets
J. Martin � Master Thesis � 27.09.2006 97
SELECT orders_bmd.user, SUM(orders_bmd.quant)
FROM orders_bmd
GROUP BY orders_bmd.user
Counting order volume (quantity*price) per user
SELECT orders_bmd.user, SUM(orders_bmd.quant*orders_bmd.price)
FROM orders_bmd
GROUP BY orders_bmd.user
Counting number of transactions per user (excluding portfolio transactions)
SELECT orders_bmd.user, Count( * )
FROM orders_bmd
JOIN transactions_bmd ON ( transactions_bmd.buyorder = orders_bmd.id
OR transactions_bmd.sellorder = orders_bmd.id ) WHERE transactions_bmd.seller<>0
AND transactions_bmd.buyer<>0
GROUP BY orders_bmd.user
Counting transactions volume per user (quantity * price - excluding portfolio transactions)
SELECT orders_bmd.user, SUM(transactions_bmd.quant*transactions_bmd.price)
FROM orders_bmd
JOIN transactions_bmd ON ( transactions_bmd.buyorder = orders_bmd.id
OR transactions_bmd.sellorder = orders_bmd.id ) WHERE transactions_bmd.seller<>0
AND transactions_bmd.buyer<>0
GROUP BY orders_bmd.user
Counting portfolio transactions per user
SELECT users.user_id, Count( * )
FROM users
JOIN transactions_bmd ON ( transactions_bmd.buyer = users.user_id

Information Aggregation in Prediction Markets
J. Martin � Master Thesis � 27.09.2006 98
OR transactions_bmd.seller = users.user_id) WHERE transactions_bmd.seller=0 OR
transactions_bmd.buyer=0
GROUP BY users.user_id
Counting number of trades with a preference for either team A or B per trader (excluding
non valid entries, non-valid-entry=questionnaire form with fields in initial setting:
orders_bmd_ve.pref=2 AND orders_bmd_ve.prob=50 AND orders_bmd_ve.source=1)
SELECT orders_bmd, Count( * )
FROM orders_bmd
JOIN transactions_bmd ON ( transactions_bmd.buyorder = orders_bmd.id
OR transactions_bmd.sellorder = orders_bmd_ve.id )
WHERE (orders_bmd.pref=1 or orders_bmd.pref=3) AND NOT(orders_bmd.pref=2 AND
orders_bmd.prob=50 AND orders_bmd.source=1)
Group BY orders_bmd.user
Counting number of trades with no preference for either team A or B per trader (excluding
non valid entries, non-valid-entry=questionnaire form with fields in initial setting:
orders_bmd_ve.pref=2 AND orders_bmd_ve.prob=50 AND orders_bmd_ve.source=1)
SELECT orders_bmd, Count( * )
FROM orders_bmd
JOIN transactions_bmd ON ( transactions_bmd.buyorder = orders_bmd.id
OR transactions_bmd.sellorder = orders_bmd_ve.id )
WHERE (orders_bmd.pref=2) AND NOT(orders_bmd.pref=2 AND orders_bmd.prob=50
AND orders_bmd.source=1)
Group BY orders_bmd.user
Counting number of trades with source=1-6 per user (only valid entries)
SELECT orders_bmd.user, Count( * )
FROM orders_bmd
JOIN transactions_bmd ON ( transactions_bmd.buyorder = orders_bmd.id
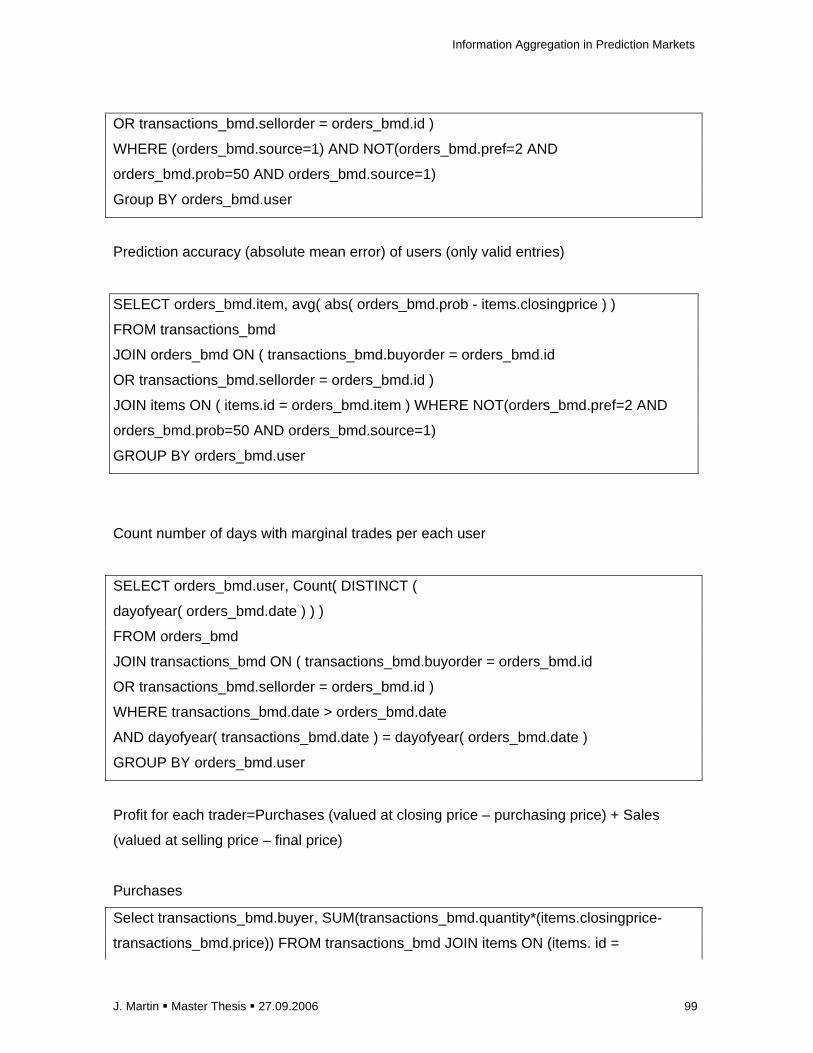
Information Aggregation in Prediction Markets
J. Martin � Master Thesis � 27.09.2006 99
OR transactions_bmd.sellorder = orders_bmd.id )
WHERE (orders_bmd.source=1) AND NOT(orders_bmd.pref=2 AND
orders_bmd.prob=50 AND orders_bmd.source=1)
Group BY orders_bmd.user
Prediction accuracy (absolute mean error) of users (only valid entries)
SELECT orders_bmd.item, avg( abs( orders_bmd.prob - items.closingprice ) )
FROM transactions_bmd
JOIN orders_bmd ON ( transactions_bmd.buyorder = orders_bmd.id
OR transactions_bmd.sellorder = orders_bmd.id )
JOIN items ON ( items.id = orders_bmd.item ) WHERE NOT(orders_bmd.pref=2 AND
orders_bmd.prob=50 AND orders_bmd.source=1)
GROUP BY orders_bmd.user
Count number of days with marginal trades per each user
SELECT orders_bmd.user, Count( DISTINCT (
dayofyear( orders_bmd.date ) ) )
FROM orders_bmd
JOIN transactions_bmd ON ( transactions_bmd.buyorder = orders_bmd.id
OR transactions_bmd.sellorder = orders_bmd.id )
WHERE transactions_bmd.date > orders_bmd.date
AND dayofyear( transactions_bmd.date ) = dayofyear( orders_bmd.date )
GROUP BY orders_bmd.user
Profit for each trader=Purchases (valued at closing price – purchasing price) + Sales
(valued at selling price – final price)
Purchases
Select transactions_bmd.buyer, SUM(transactions_bmd.quantity*(items.closingprice-
transactions_bmd.price)) FROM transactions_bmd JOIN items ON (items. id =
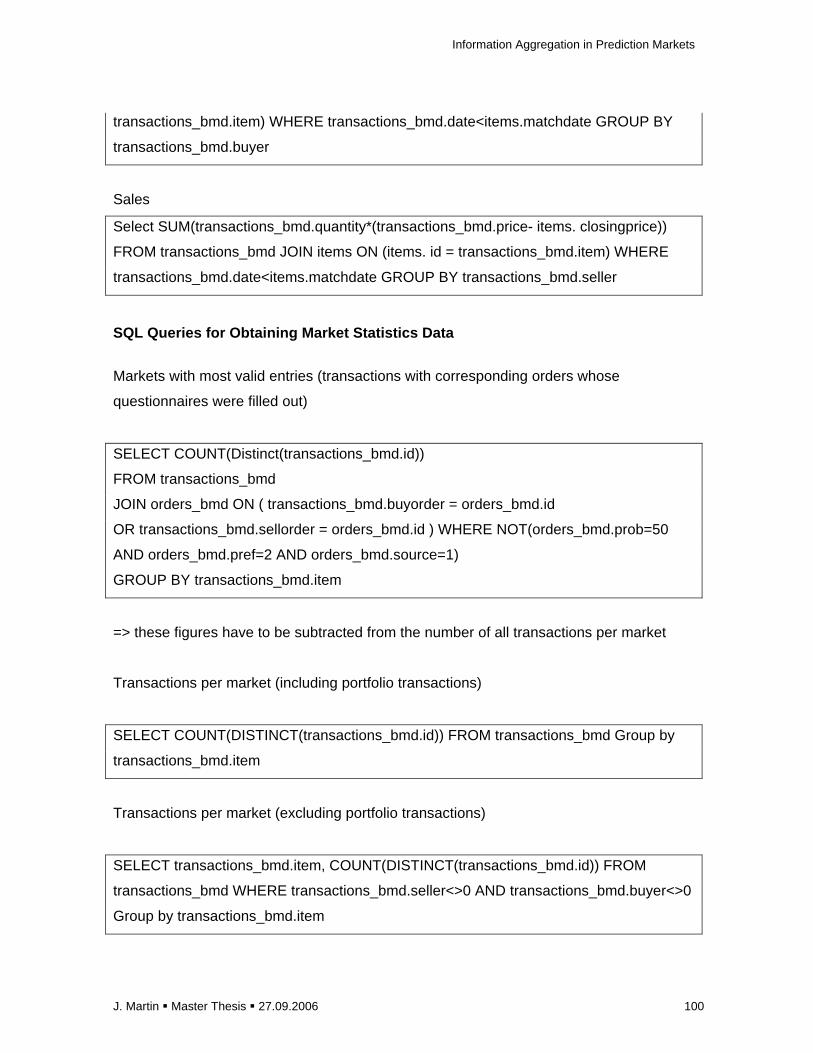
Information Aggregation in Prediction Markets
J. Martin � Master Thesis � 27.09.2006 100
transactions_bmd.item) WHERE transactions_bmd.date<items.matchdate GROUP BY
transactions_bmd.buyer
Sales
Select SUM(transactions_bmd.quantity*(transactions_bmd.price- items. closingprice))
FROM transactions_bmd JOIN items ON (items. id = transactions_bmd.item) WHERE
transactions_bmd.date<items.matchdate GROUP BY transactions_bmd.seller
SQL Queries for Obtaining Market Statistics Data
Markets with most valid entries (transactions with corresponding orders whose
questionnaires were filled out)
SELECT COUNT(Distinct(transactions_bmd.id))
FROM transactions_bmd
JOIN orders_bmd ON ( transactions_bmd.buyorder = orders_bmd.id
OR transactions_bmd.sellorder = orders_bmd.id ) WHERE NOT(orders_bmd.prob=50
AND orders_bmd.pref=2 AND orders_bmd.source=1)
GROUP BY transactions_bmd.item
=> these figures have to be subtracted from the number of all transactions per market
Transactions per market (including portfolio transactions)
SELECT COUNT(DISTINCT(transactions_bmd.id)) FROM transactions_bmd Group by
transactions_bmd.item
Transactions per market (excluding portfolio transactions)
SELECT transactions_bmd.item, COUNT(DISTINCT(transactions_bmd.id)) FROM
transactions_bmd WHERE transactions_bmd.seller<>0 AND transactions_bmd.buyer<>0
Group by transactions_bmd.item
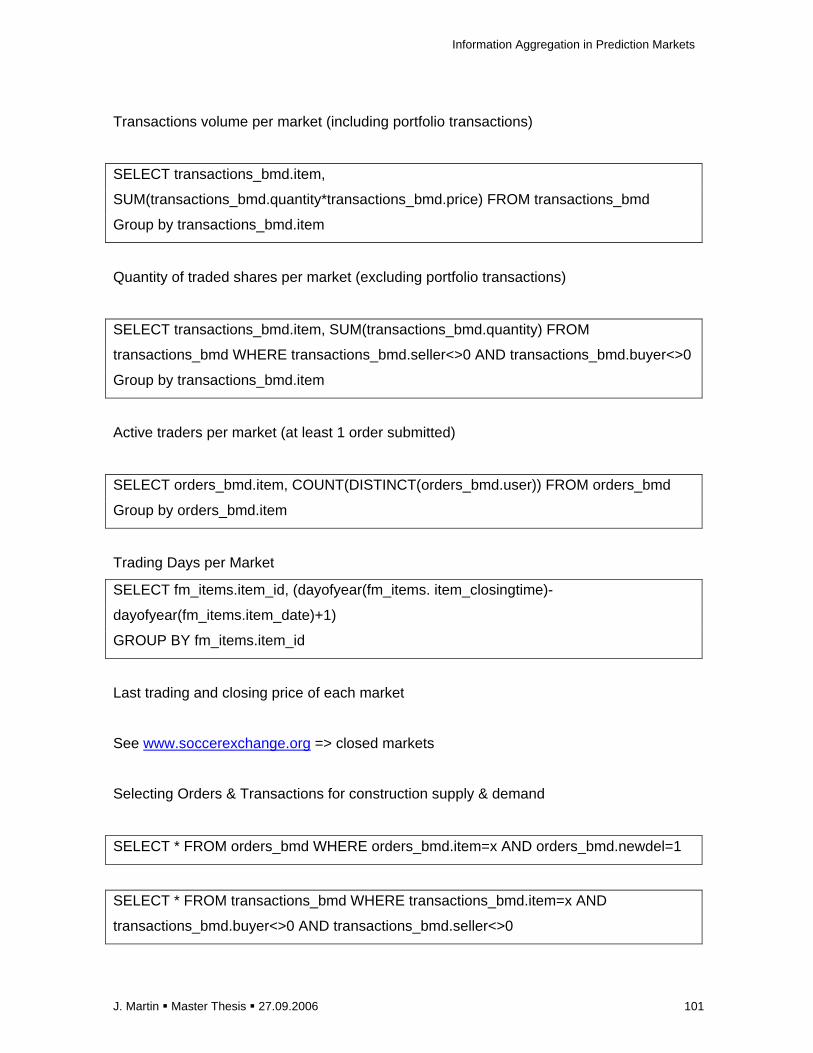
Information Aggregation in Prediction Markets
J. Martin � Master Thesis � 27.09.2006 101
Transactions volume per market (including portfolio transactions)
SELECT transactions_bmd.item,
SUM(transactions_bmd.quantity*transactions_bmd.price) FROM transactions_bmd
Group by transactions_bmd.item
Quantity of traded shares per market (excluding portfolio transactions)
SELECT transactions_bmd.item, SUM(transactions_bmd.quantity) FROM
transactions_bmd WHERE transactions_bmd.seller<>0 AND transactions_bmd.buyer<>0
Group by transactions_bmd.item
Active traders per market (at least 1 order submitted)
SELECT orders_bmd.item, COUNT(DISTINCT(orders_bmd.user)) FROM orders_bmd
Group by orders_bmd.item
Trading Days per Market
SELECT fm_items.item_id, (dayofyear(fm_items. item_closingtime)-
dayofyear(fm_items.item_date)+1)
GROUP BY fm_items.item_id
Last trading and closing price of each market
See www.soccerexchange.org => closed markets
Selecting Orders & Transactions for construction supply & demand
SELECT * FROM orders_bmd WHERE orders_bmd.item=x AND orders_bmd.newdel=1
SELECT * FROM transactions_bmd WHERE transactions_bmd.item=x AND
transactions_bmd.buyer<>0 AND transactions_bmd.seller<>0

Information Aggregation in Prediction Markets
J. Martin � Master Thesis � 27.09.2006 102
Calculating mean Average prediction error of all traders per market
SELECT orders_bmd.item, avg( abs( orders_bmd.prob - items.closingprice ) )
FROM transactions_bmd
JOIN orders_bmd ON ( transactions_bmd.buyorder = orders_bmd.id
OR transactions_bmd.sellorder = orders_bmd.id )
JOIN items ON ( items.id = orders_bmd.item ) WHERE NOT(orders_bmd.pref=2 AND
orders_bmd.prob=50 AND orders_bmd.source=1)
GROUP BY orders_bmd.item
Calculating mean Average prediction error of all traders per market
SELECT orders_bmd.item, avg( orders_bmd.prob )
FROM transactions_bmd
JOIN orders_bmd ON ( transactions_bmd.buyorder = orders_bmd.id
OR transactions_bmd.sellorder = orders_bmd.id )
JOIN items ON ( items.id = orders_bmd.item ) WHERE NOT(orders_bmd.pref=2 AND
orders_bmd.prob=50 AND orders_bmd.source=1)
GROUP BY orders_bmd.item
Number of individual predictions per market
SELECT Count(orders_bmd.id), avg( abs( orders_bmd.prob - items.closingprice ) )
FROM transactions_bmd
JOIN orders_bmd ON ( transactions_bmd.buyorder = orders_bmd.id
OR transactions_bmd.sellorder = orders_bmd.id )
JOIN items ON ( items.id = orders_bmd.item ) WHERE NOT(orders_bmd.pref=2 AND
orders_bmd.prob=50 AND orders_bmd.source=1)
GROUP BY orders_bmd.item
Mean absolute forecast accuracy according to utilized sources
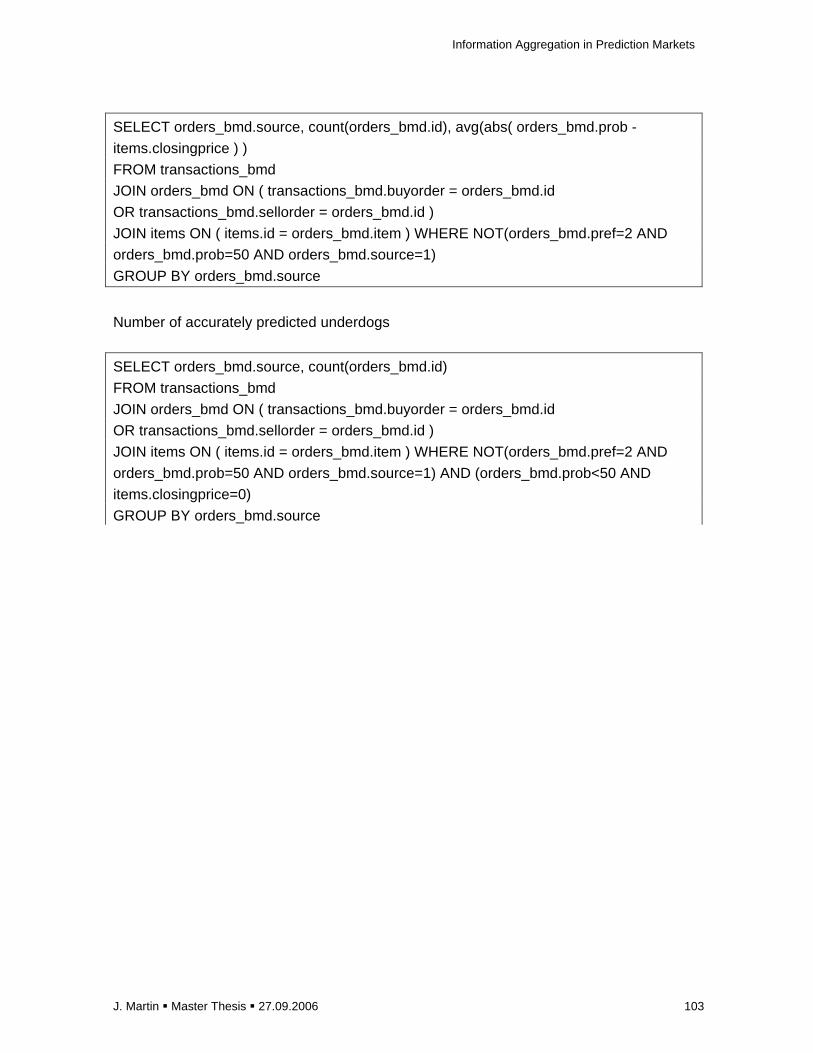
Information Aggregation in Prediction Markets
J. Martin � Master Thesis � 27.09.2006 103
SELECT orders_bmd.source, count(orders_bmd.id), avg(abs( orders_bmd.prob -
items.closingprice ) )
FROM transactions_bmd
JOIN orders_bmd ON ( transactions_bmd.buyorder = orders_bmd.id
OR transactions_bmd.sellorder = orders_bmd.id )
JOIN items ON ( items.id = orders_bmd.item ) WHERE NOT(orders_bmd.pref=2 AND
orders_bmd.prob=50 AND orders_bmd.source=1)
GROUP BY orders_bmd.source
Number of accurately predicted underdogs
SELECT orders_bmd.source, count(orders_bmd.id)
FROM transactions_bmd
JOIN orders_bmd ON ( transactions_bmd.buyorder = orders_bmd.id
OR transactions_bmd.sellorder = orders_bmd.id )
JOIN items ON ( items.id = orders_bmd.item ) WHERE NOT(orders_bmd.pref=2 AND
orders_bmd.prob=50 AND orders_bmd.source=1) AND (orders_bmd.prob<50 AND
items.closingprice=0)
GROUP BY orders_bmd.source

Information Aggregation in Prediction Markets
J. Martin � Master Thesis � 27.09.2006 104
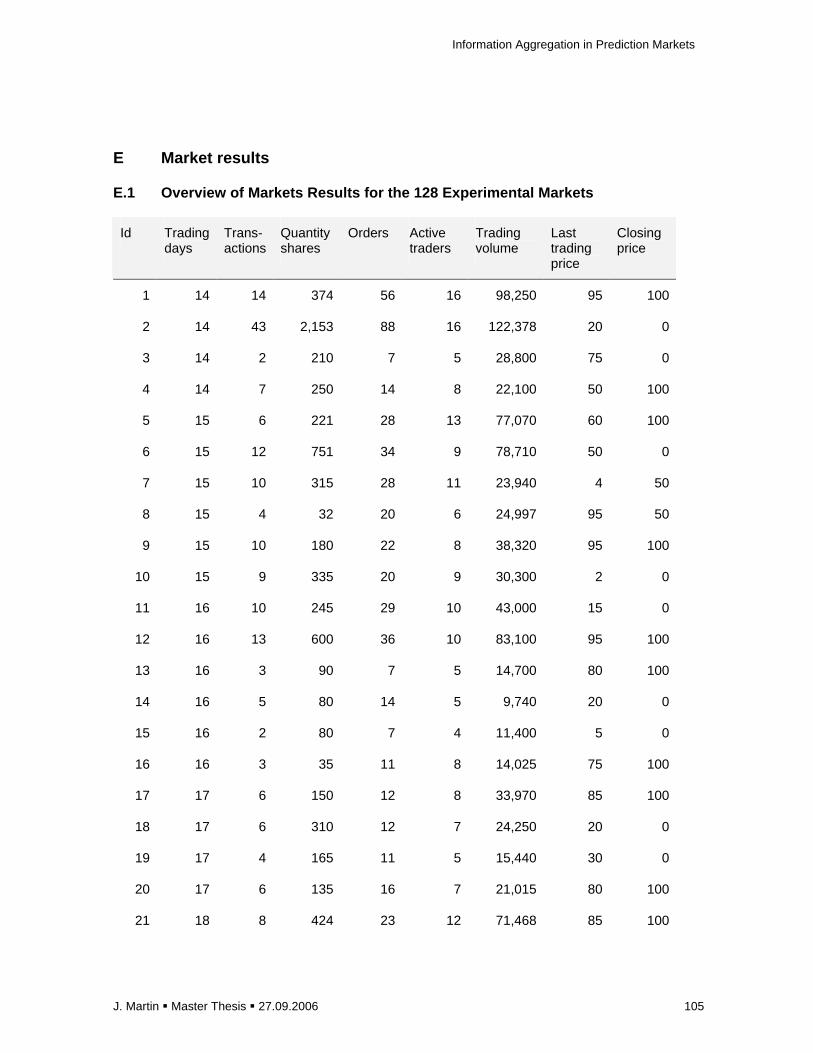
Information Aggregation in Prediction Markets
J. Martin � Master Thesis � 27.09.2006 105
E Market results
E.1 Overview of Markets Results for the 128 Experim ental Markets
Id Trading days
Trans-actions
Quantity shares
Orders Active traders
Trading volume
Last trading price
Closing price
1 14 14 374 56 16 98,250 95 100
2 14 43 2,153 88 16 122,378 20 0
3 14 2 210 7 5 28,800 75 0
4 14 7 250 14 8 22,100 50 100
5 15 6 221 28 13 77,070 60 100
6 15 12 751 34 9 78,710 50 0
7 15 10 315 28 11 23,940 4 50
8 15 4 32 20 6 24,997 95 50
9 15 10 180 22 8 38,320 95 100
10 15 9 335 20 9 30,300 2 0
11 16 10 245 29 10 43,000 15 0
12 16 13 600 36 10 83,100 95 100
13 16 3 90 7 5 14,700 80 100
14 16 5 80 14 5 9,740 20 0
15 16 2 80 7 4 11,400 5 0
16 16 3 35 11 8 14,025 75 100
17 17 6 150 12 8 33,970 85 100
18 17 6 310 12 7 24,250 20 0
19 17 4 165 11 5 15,440 30 0
20 17 6 135 16 7 21,015 80 100
21 18 8 424 23 12 71,468 85 100

Information Aggregation in Prediction Markets
J. Martin � Master Thesis � 27.09.2006 106
22 18 13 1,070 30 9 57,700 7 0
23 17 6 175 17 8 25,060 70 100
24 17 5 190 19 6 25,400 60 0
25 18 12 325 31 10 85,250 85 50
26 18 20 912 40 11 73,735 30 50
27 18 9 212 30 12 38,788 74 100
28 18 4 330 14 5 36,200 35 0
29 19 6 370 18 13 75,700 85 100
30 19 7 390 17 11 52,050 20 0
31 19 3 60 8 5 17,950 80 50
32 19 3 109 9 5 14,485 15 50
33 19 4 365 12 6 53,550 90 100
34 19 3 110 7 4 23,850 20 0
35 20 4 95 9 5 13,550 75 100
36 20 4 80 9 5 8,500 10 0
37 20 5 150 13 9 41,000 95 100
38 20 8 470 16 7 31,450 5 0
39 20 6 290 20 6 47,100 80 100
40 20 3 50 10 5 25,320 11 0
41 21 6 350 22 9 82,100 85 100
42 21 9 510 23 7 62,900 15 0
43 21 19 1,111 40 13 159,245 95 100
44 21 8 291 26 8 71,887 15 0
45 21 5 240 17 6 87,700 95 50
46 21 3 302 13 2 67,232 1 50
47 22 7 310 18 7 62,190 94 100
48 22 5 44 18 4 35,560 15 0
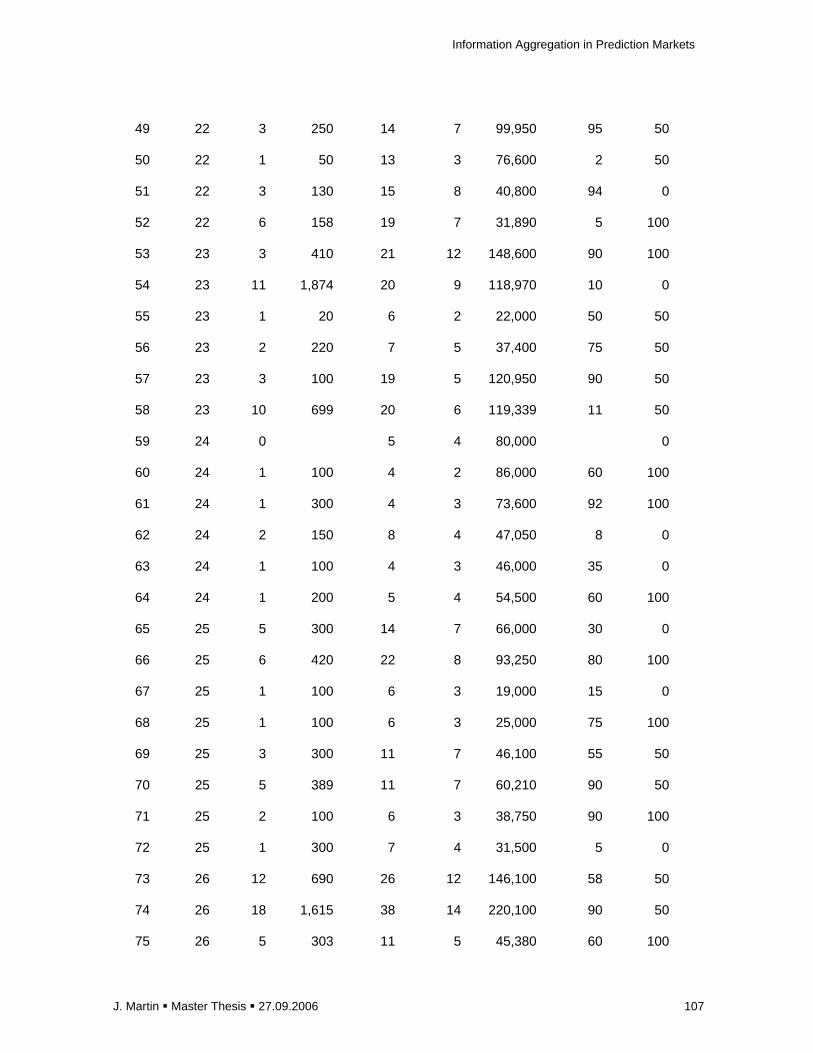
Information Aggregation in Prediction Markets
J. Martin � Master Thesis � 27.09.2006 107
49 22 3 250 14 7 99,950 95 50
50 22 1 50 13 3 76,600 2 50
51 22 3 130 15 8 40,800 94 0
52 22 6 158 19 7 31,890 5 100
53 23 3 410 21 12 148,600 90 100
54 23 11 1,874 20 9 118,970 10 0
55 23 1 20 6 2 22,000 50 50
56 23 2 220 7 5 37,400 75 50
57 23 3 100 19 5 120,950 90 50
58 23 10 699 20 6 119,339 11 50
59 24 0 5 4 80,000 0
60 24 1 100 4 2 86,000 60 100
61 24 1 300 4 3 73,600 92 100
62 24 2 150 8 4 47,050 8 0
63 24 1 100 4 3 46,000 35 0
64 24 1 200 5 4 54,500 60 100
65 25 5 300 14 7 66,000 30 0
66 25 6 420 22 8 93,250 80 100
67 25 1 100 6 3 19,000 15 0
68 25 1 100 6 3 25,000 75 100
69 25 3 300 11 7 46,100 55 50
70 25 5 389 11 7 60,210 90 50
71 25 2 100 6 3 38,750 90 100
72 25 1 300 7 4 31,500 5 0
73 26 12 690 26 12 146,100 58 50
74 26 18 1,615 38 14 220,100 90 50
75 26 5 303 11 5 45,380 60 100
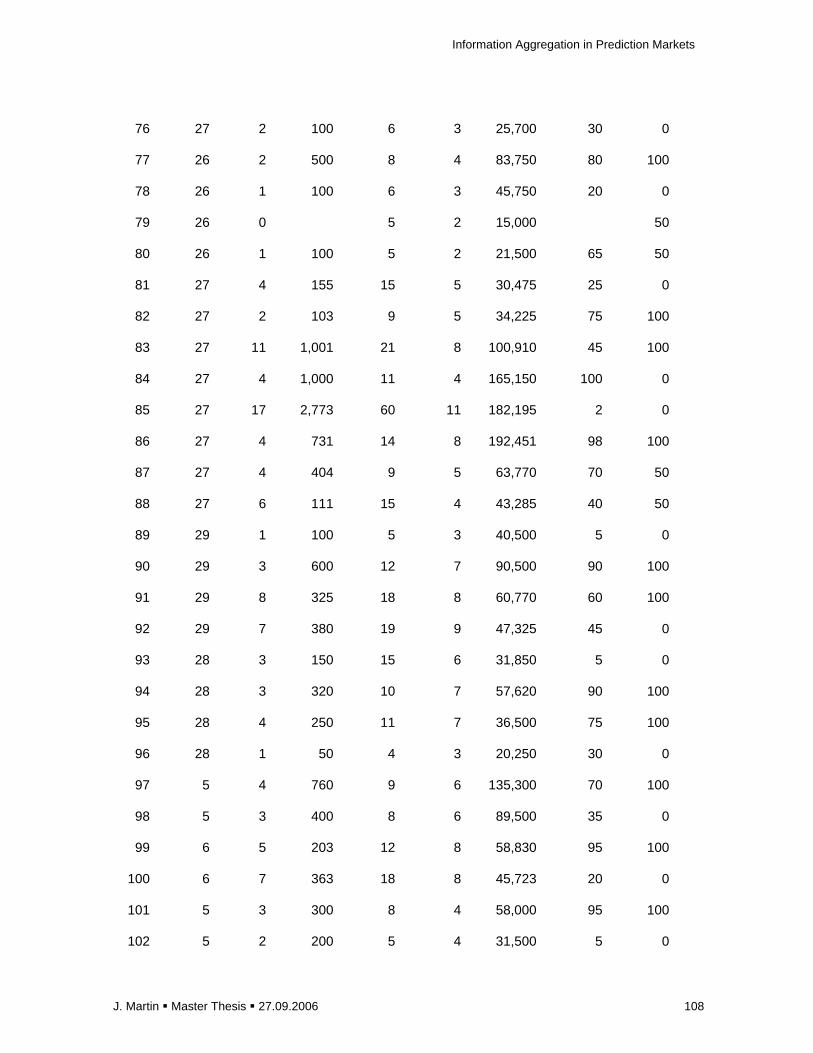
Information Aggregation in Prediction Markets
J. Martin � Master Thesis � 27.09.2006 108
76 27 2 100 6 3 25,700 30 0
77 26 2 500 8 4 83,750 80 100
78 26 1 100 6 3 45,750 20 0
79 26 0 5 2 15,000 50
80 26 1 100 5 2 21,500 65 50
81 27 4 155 15 5 30,475 25 0
82 27 2 103 9 5 34,225 75 100
83 27 11 1,001 21 8 100,910 45 100
84 27 4 1,000 11 4 165,150 100 0
85 27 17 2,773 60 11 182,195 2 0
86 27 4 731 14 8 192,451 98 100
87 27 4 404 9 5 63,770 70 50
88 27 6 111 15 4 43,285 40 50
89 29 1 100 5 3 40,500 5 0
90 29 3 600 12 7 90,500 90 100
91 29 8 325 18 8 60,770 60 100
92 29 7 380 19 9 47,325 45 0
93 28 3 150 15 6 31,850 5 0
94 28 3 320 10 7 57,620 90 100
95 28 4 250 11 7 36,500 75 100
96 28 1 50 4 3 20,250 30 0
97 5 4 760 9 6 135,300 70 100
98 5 3 400 8 6 89,500 35 0
99 6 5 203 12 8 58,830 95 100
100 6 7 363 18 8 45,723 20 0
101 5 3 300 8 4 58,000 95 100
102 5 2 200 5 4 31,500 5 0
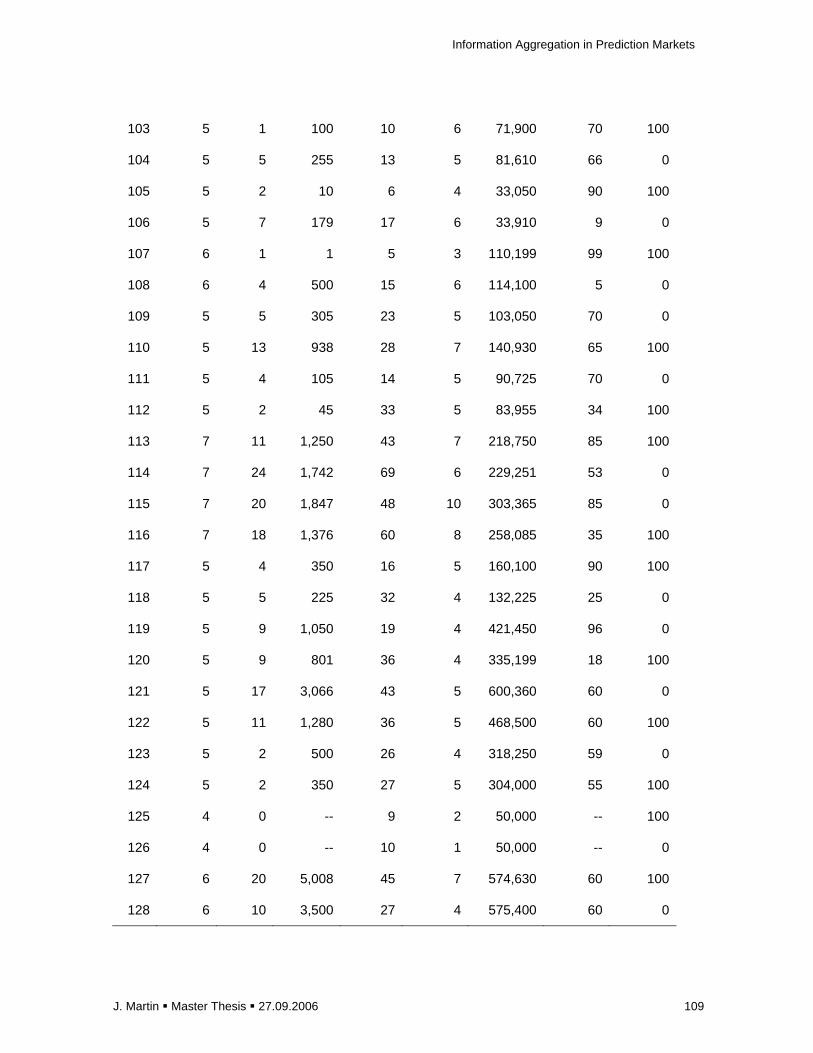
Information Aggregation in Prediction Markets
J. Martin � Master Thesis � 27.09.2006 109
103 5 1 100 10 6 71,900 70 100
104 5 5 255 13 5 81,610 66 0
105 5 2 10 6 4 33,050 90 100
106 5 7 179 17 6 33,910 9 0
107 6 1 1 5 3 110,199 99 100
108 6 4 500 15 6 114,100 5 0
109 5 5 305 23 5 103,050 70 0
110 5 13 938 28 7 140,930 65 100
111 5 4 105 14 5 90,725 70 0
112 5 2 45 33 5 83,955 34 100
113 7 11 1,250 43 7 218,750 85 100
114 7 24 1,742 69 6 229,251 53 0
115 7 20 1,847 48 10 303,365 85 0
116 7 18 1,376 60 8 258,085 35 100
117 5 4 350 16 5 160,100 90 100
118 5 5 225 32 4 132,225 25 0
119 5 9 1,050 19 4 421,450 96 0
120 5 9 801 36 4 335,199 18 100
121 5 17 3,066 43 5 600,360 60 0
122 5 11 1,280 36 5 468,500 60 100
123 5 2 500 26 4 318,250 59 0
124 5 2 350 27 5 304,000 55 100
125 4 0 -- 9 2 50,000 -- 100
126 4 0 -- 10 1 50,000 -- 0
127 6 20 5,008 45 7 574,630 60 100
128 6 10 3,500 27 4 575,400 60 0

Information Aggregation in Prediction Markets
J. Martin � Master Thesis � 27.09.2006 110
E.2 Supply and Demand Graphs of Selected Markets
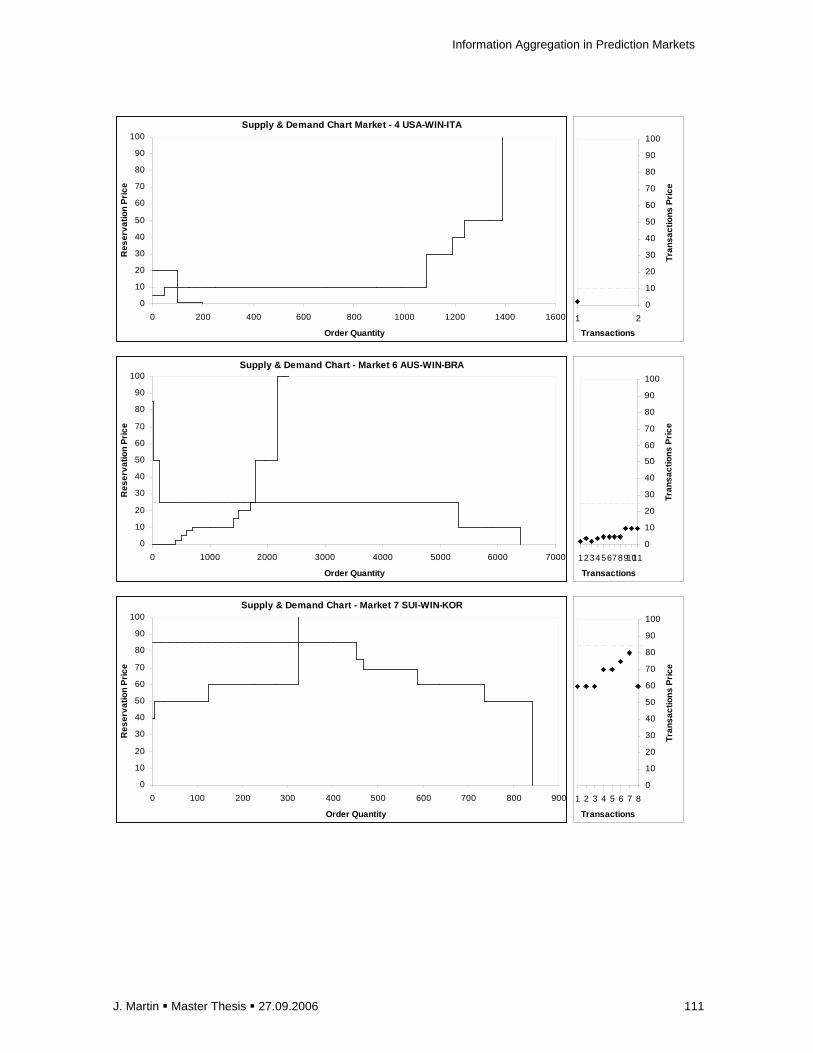
Information Aggregation in Prediction Markets
J. Martin � Master Thesis � 27.09.2006 111
Supply & Demand Chart Market - 4 USA-WIN-ITA
0
10
20
30
40
50
60
70
80
90
100
0 200 400 600 800 1000 1200 1400 1600
Order Quantity
Res
erva
tion
Pric
e
0
10
20
30
40
50
60
70
80
90
100
1 2
Transactions
Tran
sact
ions
Pric
e
Supply & Demand Chart - Market 6 AUS-WIN-BRA
0
10
20
30
40
50
60
70
80
90
100
0 1000 2000 3000 4000 5000 6000 7000
Order Quantity
Res
erva
tion
Pric
e
0
10
20
30
40
50
60
70
80
90
100
1234567891011
Transactions
Tran
sact
ions
Pric
e
0
10
20
30
40
50
60
70
80
90
100
1 2 3 4 5 6 7 8
Transactions
Tran
sact
ions
Pric
e
Supply & Demand Chart - Market 7 SUI-WIN-KOR
0
10
20
30
40
50
60
70
80
90
100
0 100 200 300 400 500 600 700 800 900
Order Quantity
Res
erva
tion
Pric
e
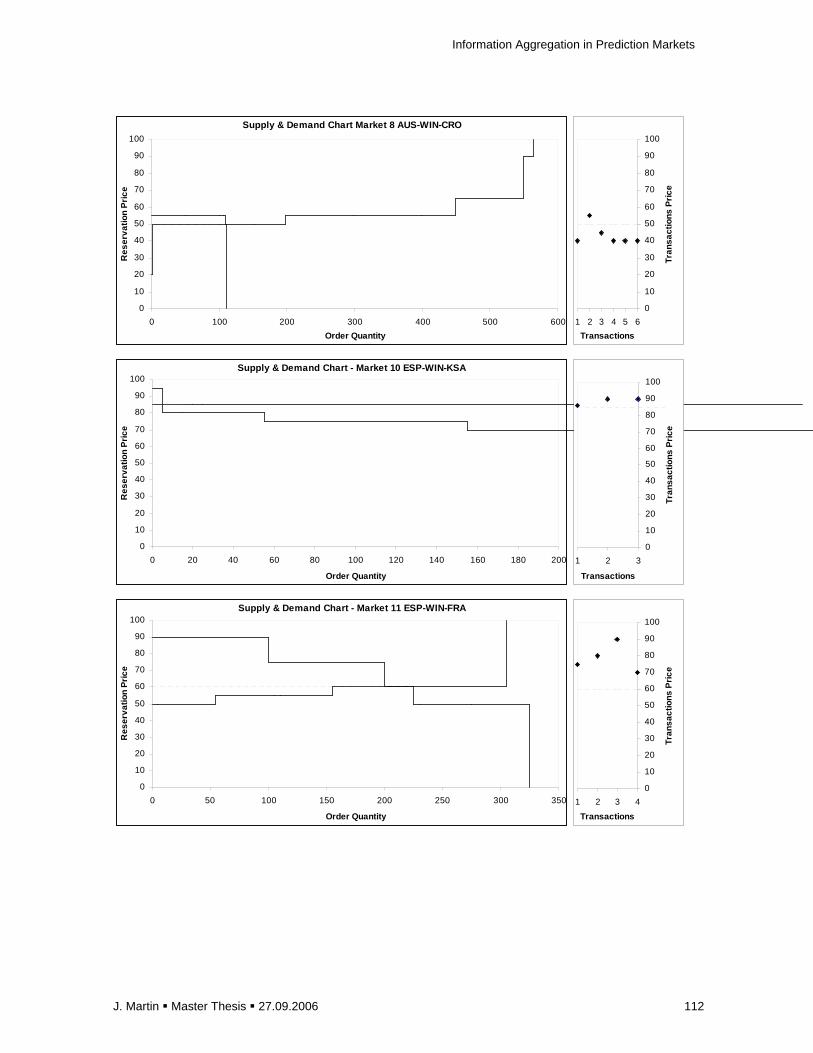
Information Aggregation in Prediction Markets
J. Martin � Master Thesis � 27.09.2006 112
Supply & Demand Chart Market 8 AUS-WIN-CRO
0
10
20
30
40
50
60
70
80
90
100
0 100 200 300 400 500 600
Order Quantity
Res
erva
tion
Pric
e
0
10
20
30
40
50
60
70
80
90
100
1 2 3 4 5 6
Transactions
Tran
sact
ions
Pric
e
Supply & Demand Chart - Market 10 ESP-WIN-KSA
0
10
20
30
40
50
60
70
80
90
100
0 20 40 60 80 100 120 140 160 180 200
Order Quantity
Res
erva
tion
Pric
e
0
10
20
30
40
50
60
70
80
90
100
1 2 3
Transactions
Tran
sact
ions
Pric
e
Supply & Demand Chart - Market 11 ESP-WIN-FRA
0
10
20
30
40
50
60
70
80
90
100
0 50 100 150 200 250 300 350
Order Quantity
Res
erva
tion
Pric
e
0
10
20
30
40
50
60
70
80
90
100
1 2 3 4
Transactions
Tran
sact
ions
Pric
e
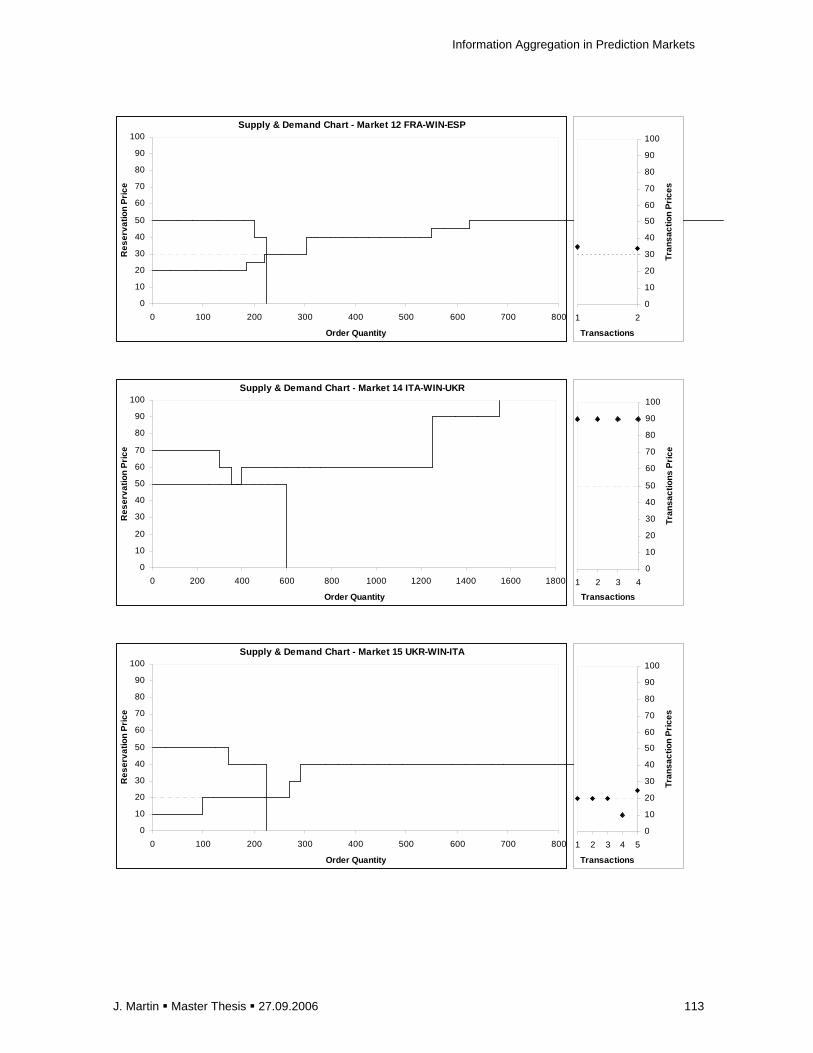
Information Aggregation in Prediction Markets
J. Martin � Master Thesis � 27.09.2006 113
Supply & Demand Chart - Market 12 FRA-WIN-ESP
0
10
20
30
40
50
60
70
80
90
100
0 100 200 300 400 500 600 700 800
Order Quantity
Res
erva
tion
Pric
e
0
10
20
30
40
50
60
70
80
90
100
1 2
Transactions
Tran
sact
ion
Pric
es
Supply & Demand Chart - Market 14 ITA-WIN-UKR
0
10
20
30
40
50
60
70
80
90
100
0 200 400 600 800 1000 1200 1400 1600 1800
Order Quantity
Res
erva
tion
Pric
e
0
10
20
30
40
50
60
70
80
90
100
1 2 3 4
Transactions
Tran
sact
ions
Pric
e
Supply & Demand Chart - Market 15 UKR-WIN-ITA
0
10
20
30
40
50
60
70
80
90
100
0 100 200 300 400 500 600 700 800
Order Quantity
Res
erva
tion
Pric
e
0
10
20
30
40
50
60
70
80
90
100
1 2 3 4 5
Transactions
Tran
sact
ion
Pric
es
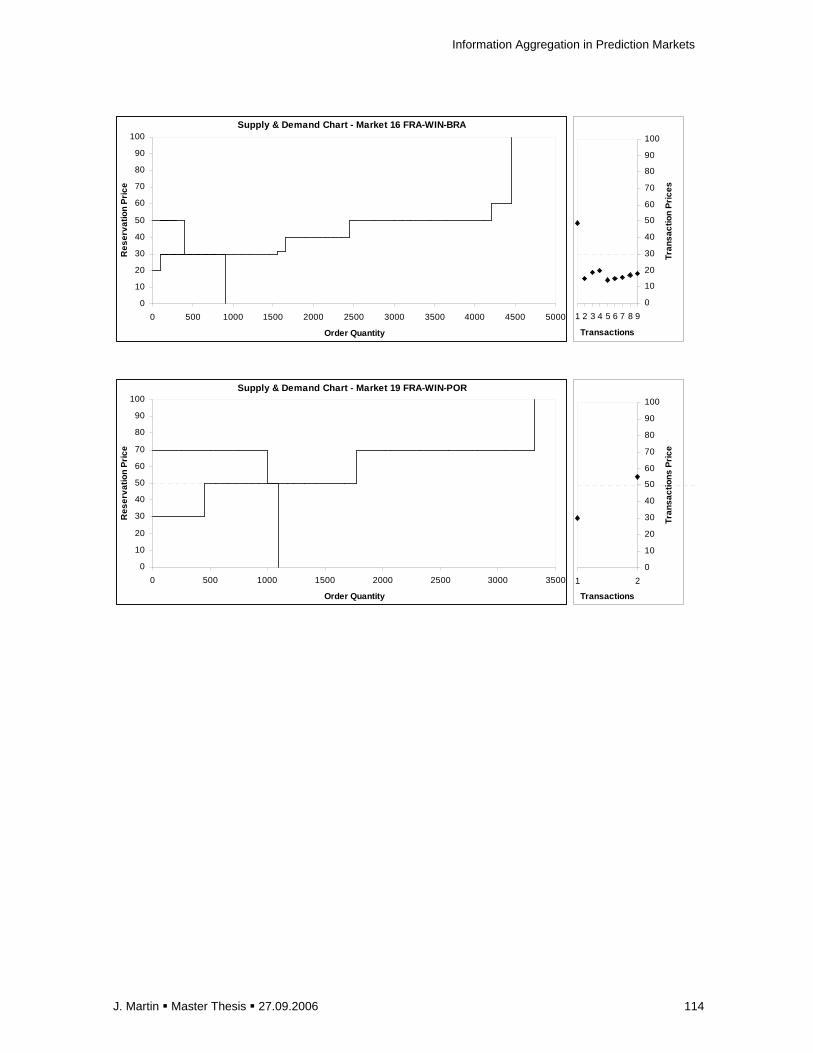
Information Aggregation in Prediction Markets
J. Martin � Master Thesis � 27.09.2006 114
Supply & Demand Chart - Market 16 FRA-WIN-BRA
0
10
20
30
40
50
60
70
80
90
100
0 500 1000 1500 2000 2500 3000 3500 4000 4500 5000
Order Quantity
Res
erva
tion
Pric
e
0
10
20
30
40
50
60
70
80
90
100
1 2 3 4 5 6 7 8 9
Transactions
Tran
sact
ion
Pric
es
Supply & Demand Chart - Market 19 FRA-WIN-POR
0
10
20
30
40
50
60
70
80
90
100
0 500 1000 1500 2000 2500 3000 3500
Order Quantity
Res
erva
tion
Pric
e
0
10
20
30
40
50
60
70
80
90
100
1 2
Transactions
Tran
sact
ions
Pric
e
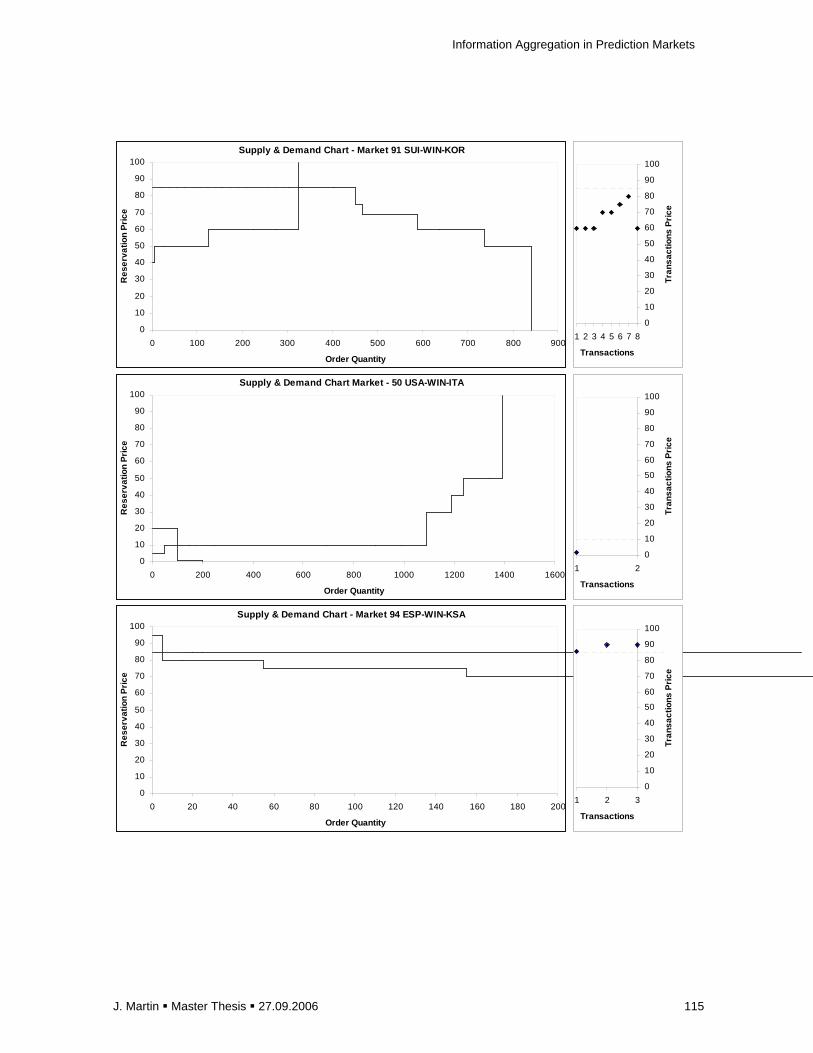
Information Aggregation in Prediction Markets
J. Martin � Master Thesis � 27.09.2006 115
0
10
20
30
40
50
60
70
80
90
100
1 2 3 4 5 6 7 8
Transactions
Tran
sact
ions
Pric
e
Supply & Demand Chart - Market 91 SUI-WIN-KOR
0
10
20
30
40
50
60
70
80
90
100
0 100 200 300 400 500 600 700 800 900
Order Quantity
Res
erva
tion
Pric
e
Supply & Demand Chart Market - 50 USA-WIN-ITA
0
10
20
30
40
50
60
70
80
90
100
0 200 400 600 800 1000 1200 1400 1600
Order Quantity
Res
erva
tion
Pric
e
0
10
20
30
40
50
60
70
80
90
100
1 2
Transactions
Tran
sact
ions
Pric
e
Supply & Demand Chart - Market 94 ESP-WIN-KSA
0
10
20
30
40
50
60
70
80
90
100
0 20 40 60 80 100 120 140 160 180 200
Order Quantity
Res
erva
tion
Pric
e
0
10
20
30
40
50
60
70
80
90
100
1 2 3
Transactions
Tran
sact
ions
Pric
e