Embed Size (px)
Citation preview
Petroleum Exploration ReportsThis file contains scanned images of hardcopy reportsdata submitted to the Northern Territory Government under Petroleum Legislation
Bringing Forward DiscoveryThis information is made available to assist future petroleum explorers and may be distributed freely
Scanning informationThe quality of the scan reflects the condition of the original hardcopy reportdata
InfoCentreCall +61 8 8999 6443
Click geoscienceinfontgovauwwwmineralsntgovau
Visit 3rd floorCentrepoint BuildingSmith Street MallDarwin Northern Territory 0800
InfoCentreNT Minerals and Energy
BRINGING FORWARD DISCOVERYIN AUSTRALIArsquoS NORTHERN TERRITORY
A09-093indd
DATA PROCESSING REPORT
MEREENIE SEISMIC SURVEY
OP175178
FI1 ~~ ~~ iii M 4~-i - 1_ -~1n~~ 1 lJ i 1( X ~ I
~4~~ t~~l~v--lt~iJ 1 ~1 Airaquoow ~
or~SHORE
Geophysical Service Int
Apri 1 1983
bull
e
1 INTRODUCTION
The Mereenie seismic reflection survey in OP17S and OP178 in the Northern Territory also designated NTL4 and NTLS was recorded in January 1981 by SeismographService Limited using a vibrator energy source and 48 trace recorder Data were generally recorded for 12 fold COP coverage Details of field parameters are included as Plate II Initial processing was performed by Geosource
One line was International
reprocessedin Sydney
by Geophysicalin December 1982
Service and the
remainder of the survey in March and April 1983
Digital processing utilised an IBM 3033 computer and the TIPEX software system
The following processing sequence was usedshy
Minimum Phase Correlation Field Record Display
True Amplitude Recovery Edit Pre-Deconvolution Ramp Velocity Filter DesignatureTime Variant Scaling Velocity Analysis - VELPAC Brute Stack
Automatic Residual Static ComputationsVelocity Analysis - VELSCAN
Application of NMO Residual and Datum Statics 12-Fold COP Stack Time Variant Filter Time Variant Scaling Gould DisplayMigration of Stack Section Time Variant Filter Time Variant Scaling Dip Filter Film Display of Dip Filtered Migrated Section
Trademark of Texas Instruments Inc
- 1 - MEREENIE
GSI-709
-----------~--- 2 EXPERIMENTAL PROCESSING
Prior to production of the initial line in December 1982 a comprehensive series of tests was carried out to determine the optimum sequence to be followed A report on these tests was submitted to Magellan with that data
Additional filter tests were made at several locations over the prospect to evaluate the suitability of those filters originally chosen for use over the whole prospect After these had been studied it was decided to make no change to the original choice
Line 18 over the well East Mereenie 8 was selected as a tri al 1i ne to test the effectiveness of complex trace processing in the prospect area Colour plots were made of the Instantaneous Phase Frequency and Amplitudeof the section derived from the complex form of the migrated stack data The input for the Instantaneous Phase and Frequency sections was also dip filtered Sections were processed to 19sec record time and di sp1ayed at twi ce the producti on scales
l
- 2 - MEREENIE
G51-709
r-------------e ~
3 CONCLUSIONS AND RECOMMENDATIONS
The final sections produced were a significantimprovement over those from the initial processing It is likely that changed collection parameters would further improve data for future surveys Some of the factors to be considered are shy
Static Corrections It might not be necessary to use a full LVL crew but some upho1e data would increase confidence in the absolute values of datum statics These upho1es would need to be so spaced as to give a good regional picture
Sweep Frequency The filter analyses all showed that signal containingthe maximum sweep frequency used (50Hz) was present well below 1sec record time Tests should be made to ascertain maximum frequencies obtainable in the area
Spread Configuration Severa 1 1 i nes had steeply di ppi ng ref1 ectors The groupinterval of 50m used would have caused some cancellation of signal in these areas With 96 trace recording becoming standard shorter group intervals and arrays could be used without losing coverage
Line Length and MigrationMigration was effective on most of the lines however some of the lines with steeply dipping section wer~ veryshort and showed severe edge effects after migrationThe benefits obtained from migration would be enhanced if such lines were extended beyond the areas of steep dip on the flanks of the structure
Attribute Processing Interpretative evaluation of the Lithcomp sections should indicate the potential value of the package in this area It is also felt that the inversion packageG-Log might be helpful in defining the extent of target structures and it is recommended that trial processingbe performed over a known structure
Respectfully submitted GEOPHYSICAL SERVICE INTERNATIONAL
~ ~~ ~~ c
(Processing Party Chief)
- 3 - MEREENIE
GSI-709
~APPENDIX A PRODUCTION PARAMETERS
Typical parameters are listed below and also appended to each final display section
Processing was at 4msec sample rate to 4 seconds StacKing functions used were annotated on each section
TAR - Alpha 5dbsec~ T2 40sec
PDR OffsetStart time pairs were 150m005sec 1400m048sec
Vel oci ty Fil ter Positive cut 3125 msec (16msectrace) Negative cut 12500 msec ( 4msectrace)
Trace equalisation gates were 1000msec long
Trace edit - from field records
Designature - one wavelet was estimated for each record
StacK RampThe following post nmo time(msec) and offset(m) pairs were used- (-150~0) (-50~150) (5001400)
Time Variant Filter TIME(msec) FREQUENCY(hz)
o 16-50 1500 16-50 2500 16-40
Scaling after stacK Regular lx200msec 1x300msec lx500msec and 3xl000msec gates with no overlap were used
Velocity analyses ~ relative statics only were applied for VELPAC analyses and relative plus residuals for VELSCANS
Residual Statics Space and time variant gates based on prominentreflectors were picKed Four iterations of computations were performed and a 16-40Hz filter used
Display Scale Mode VAWIVertical scale 10 cmsecHorizontal scale 24 TPI
- 4 - MEREENIE
GSI-709
APPENDIX B DESCRIPTION OF BASIC PROCESSES bull Datum statics were supplied by Magellan to a datum of 650m ASl
Minimum Phase Correlation
Most deconvolution processes assume thatmiddot reflection wavelets are minimum phase Thus it is desirable to have a correlation programme that collapses the Vibroseis sweep to a minimum phase wavelet rather than zero phaseThe minimum phase correlation process can be visualized as a series of operations in the frequency domain as follows
a Fourier Transform both trace and sweep
b Multiply the trace by the sweep amplitude spectra and subtract the sweep phase spectrumfrom the trace phase spectrum to accomplishconventional zero phase correlation
c Divide amplitude spectrum from b by itself plus white noise - leaving the phase spectrumunchanged This is the inverse filter
d Compute the mimimum phase spectrum for the effective source wavelet from c and add this to the phase spectrum from c - leaving the amplitude spectrum unchanged
e rnversetransform the amplitude and phase trace spectra from d) This gives the minimum phase correlated trace
True Amplitude Recovery - TAR
TAR was app 11 ed to all fi e 1 d records Thi s removed the floating point gain applied by the Serce1 field systemand corrected for signal loss by inelastic attenuation and spherical divergence
Pre-Deconvolution Ramp - PDR
PDR removes unwanted first arrival noise from the front end of seismic records and is applied prior to deconvolution design
Velocity Filtering - VEF
Velocity filtering is a mu1tichanel process that has been combined with designature into one executable load module Multichannel filtering is a two dimensional
- 5 - MEREENIE
GSI-709
frequency wave number operation used to discriminate against specified velocities on pre-stacked data or against specified dips on stacked data Velocity filtering processing requires shot organised data that has a group interval representing adequatespatial sampling Also the receiver interval should be less than or equal to the shot interval to avoid aliasingThe process transforms the data from the space-timedomain (X-T) to the frequency-wave number domain (F-K)where the filter is applied After filter applicationthe data is transformed back to the X-T domain for the application of further conventional processingThe apparent horizontal velocity of the noise must be adequately separated from the primary signal for the process to be effective Examples of noise alignmentthat can be removed are ground roll and air blast The user supplies a window of primary dip zones to keep negative dip noise and positive dip noise outside of the keep zone are rejected Thus it is important that the primary dip on the field records should be known - it should be remembered that moveout is a major factor influencing the selection of keep zones
Designature
Designature is a generic name for processess which attempt to replace an arbitrary source wavelet convolved with the reflection sequence by a shorter wavelet of improved resolving capability DESIG is an alternative to conventional pre-stackdeconvolution (TVD) Common features of DESIG and conventional TVD include
a Both estimate the input wavelet from seismic traces b Both assume the wavelet to be removed is minimum phase c Both assume the reflection sequence is random
Significant differencesareshya DESIG is a Rlllti channel process that can use the entire record to estimate the wavelet For land data the process uses the whole record TVD is a single channel process that uses only a portion of the trace to design an operatorb TVD is time and offset variant whereas DESIG is not time variant but has the capability to bemiddot offset dependent c DESIG compensates for the field system low cut phase response and provides a more accurate and stable operator design than conventional single channel deconvolution because of the much greater statistical base for the source wavelet estimation The assumptionof randomness of the reflection sequence is fulfilled
- 6 - MEREENIE
Ill
11
bull
I f t r I I
( I
t t [
I I I I
1
GS-709
using a record that is not HMO corrected rather than part of a single trace Thus DESIG is less likely to attempt to remove the periodicity of the signal itself
Trace Equalisation
A gate of length 1000ms was used The scalers were determined such that the average absolute values of data words in the design gate was equal to 2exp10
Velociy Analysis - VELPAC
The VELPAC Velocity Module was applied in the spot analysis mode using 12 adjacent depth pointsBasic steps of the programme for each analysis include - Application of normal moveout (NMO) corrections corresponding to several different constant velocities or velocity functions to a set of adjacent depth points - A stack for each velocity of each depth point in the set - A time gated power based search to provide picks as functions of time amplitude and moveout (which is another expression of velocity) - Display of selected depth point gather traces stacks and power picks shyVelocities determined by the VELPAC analyses were used in the residual processing l
Preliminary Stack (Brute)
Brute stack velocities were obtained from prio~ processing In addition to the stack Near Trace Gather and lOOt coverage sections were also produced These sections had two usesshy1 As a quality control cneck of the preprocessing 2 To enable selection of design gates for residual static computation
Velocity Analysis - VELSCAN
The VELSCAN module was applied in the spot mode using 11 adjacent depth points The following is a brief description of the process The VELSCAN module generates events as functions of time amplitude moveout and dip The event picking proceeds in the following manner
NMO Static and Residual Static corrections corresponding to a series of velocity functions are applied to a set of depth point traces For each velocity function the NMO corrected traces are stacked The resulting traces consist of amplitudes as functions of time and moveout
- 7 - MEREENIE
to
G51-109
- Identical operations are applied to adjacent depth pOints adding the dimension of space - Dip is applied and for each value of dip the traces are stacked across depth points The result is a set of amplitudes as functions of time moveout and dip - An-event is located by searching for an amplitude extremum in the time moveout and dip domains An extremum may be either a maximum or minimumthat is both peaks and troughs are picked The event attributes of time amplitude moveout and dip are assigned to the centre depth point
- Prior to display the events are subjected to various sorting and classification algorithms The powerfulpicking of VELSCAN yields good results even in relatively poor data areas Where quality or accuracyrequirements permit options are chosen to reduce computer run time and hence cost The major processing options for event picking for each analysis are as follows
OPTION A Specification of time gatesSeveral time gates may be selected for independent definition In each gate the bandpass filters number of depth points and the dip range may be different
OPTION B Number of depth points to processThere may vary in each time g~te from 3 to 24
OPTION C Dip range in each gate selected
OPTION D Time variant velocity bounds which determine the boundaries of the moveout scans
OPTION E Sorting and grading of events Events may be classified in terms of Time Amplitude Moveout and DipAs aids to interpretation the VELSCAN module also generates and displays gathers stacks and velocityfunctions in a manner similar to VELPAC The specifications for this capability are independant of the specifications for the event picking The majoroptions for each analysis are
OPTION F Number of velocity functions applied - up to 30 constant or variable in time
OPTION G Number of depth points to display - up to 24
OPTION H Display of gather traces - Display of centre depth point for each function - Display of gather traces for each depth point for centre function only
- 8 - MEREENIE
~
GSI-709
Also displayed are stacks for all depth points for each velocity function and the centre depth point gather without statics and NMO applied
Automatic Residual Static Computations
The method is based upon the use of cross-correlation functi ons to measure the rel ative time shi fts for each of the traces within a common depth point set Each of the traces of a COP set is correlated with a reference trace formed by stacking the other traces within the set
The location of the peak value of the cross-correlation function gives an estimate of the time shift of the static shifted trace The time shift measured by the cross-correlation is the sum of several effects namelyi Residual shot static ii Residual receiver static iii Residual normal moveout iv Noise
The correlation functions are computed over gates which are chosen such that the signal to noise ratio is high and little or no residual moveout is present
The time shifts obtained from the correlation functions for each trace are then plac~d in tables of common shot and surface positions and a statistical analysiscarried out to determine a unique residual source correction for each shot and a unique residual group correction for each receiver This ensures that at all times statics which are applied to data are surface consistent
Finally the statics to be applied are synthesised from the estimates of the individual shot and receiver statics by averaging the values along common source and receivers
The process is iterative and several rounds are applied to achieve upgraded estimates of the residual statics to apply - the input to successive iterations being the output from the preceding round To enable a QC of the results apart from the computed statics being listed a plot is made of the selected gates with the computed residual statics applied after each iteration
Application of Datum Statics
The application of datum statics was performed in the following mannershyPrior to application of normal moveout corrections a mean datum static was computed for each depth point
- 9 - MEREENIE
GSI-709
and a relaUve datum static computed for each trace within that common depth point set The relative static was simply the difference between the mean datum static and the individual trace datum statics The relative datum statics thus computed were then applied togetherwith the residual statics to the traces prior to the application of normal moveout corrections A consequence of this method of datum static applicationis that velocity functions for normal moveout corrections are expressed relative to the surface and not rel ati ve to the datum plane
Normal Moveout Corrections
Normal moveout correcti ons are applied to remove increased reflection time on an event caused by spread geometry The magnitude of the event determined by the following equationshy
correction is
T =J T02 + X2 shy To
y2 where
T = Normal Moveout To = Time of the event at zero offset X = Offset of a trace Y = Root mean squa re veloci ty to the event shy
Common Depth Point Stack
In this process the traces for each depth point are mi xed to gi ve one output trace for each depth poi nt Prior to the mix first break energy plus the early portion of the traces where NMO corrections have caused severe stretching resulting in significant frequencychanges are suppressed The result being that the stacking multiplicity varies as a function of record time
Time Variant Filtering - TYF
Filtering was applied in a time variant manner to take account of the higher frequency content of shallow data and the lower frequency content at depth and to reject unwanted frequencies or noise
Migration
Wave equation migration was performed in the KIRCHOFF FshyK domain The principal advantages of the wave equation migration areshyMigrates properly in the presence of lateral velocity variation Has a practical dip limit approaching 90deg
- 10 - MEREENIE
GSI-709
Prevents induced aliasing on flat data where there is a large sample interval The routine uses tne F-K transform for the migration rather than the moveout and stack of an aperture of traces in the time domain Aliasing of flat events resulting from too large an aperture in the moveout and stack method does not occur in the F-K method
Dip Filter
Dip filter in the F-K domain was used as a means of improving the signal to noise ratio by reducing random any organised noise outside dip bounds selected from the stack section
Lithcomp
LITHCOMP is designed to compute the complex attributes of a seismic trace Instantaneous amplitude frequency and phase may infer geologic information not readily seen on a conventional display_ Each attribute is inspected separately and displayed against time Displays are in colour to assist interpretation Brief descriptions of each characteristic followsshyInstantaneous Amplitude This is also referred to as reflection strength and is a measure of amplitude independent of phase This is the key to its use since situations occur where the amplitude of a peak or trough vary laterally due to wavelet phase changes not caused by changes in reflection amplitude and hence reflection coefficient Instantaneous Phase This is a measure of phase with respect to time not frequency as in conventional spectral analyses It emphasises continuity of events and being independentof amplitude shows weak coherant events just as well as strong ones Instantaneous Frequency This is in a way the measure of the predominant frequency of a reflection or a comp1ex series of reflections It will change not only with the reflection wavelet change but also for a complex sequence of reflections This latter change might also be caused by changes in bed thickness or of velocity within a sequence caused ~y such things as trapped hydrocarbons
- 11 - MEREENIE
~ U
G51-709
APPENDIX C TAPE INVENTORY bull
Stack Data all on VSN 501142 ==========
File Name SLMEREENIESTKTRSVILINENOLRI Format DemultiplexedUngapped1600 BPI(segy) Data Raw Stack 0-3996 at 4 msecs
File VI LineNO COP range SPN range 1 VI MMS2-1A 1030-1604 1290-1000 2 VI MMS2-1B 1030-1392 l1S5-1001 3 VI MMS2-2 1031-1356 1000-1166 4 VI MMS2-3 1030-11S4 lOS2-1002 5 VI MMS2-4 1030-1324 1000-1150 6 VI MM82-5 1030-1316 1120-974 7 VI MM82-6 1030-1372 1006-11S0 8 VI MM82-7 1030-1476 1250-1024 9 VI MMS2-8 1034-1366 1000-1170
10 VI tlMS2-9 1030-1336 1163-1007 MM82-10 1030-1344 1090-930t~ ~t MMS2-11 1030-2036 1510-1004
13 VI MM82-12 1030-1216 1097-1001
14 VI r+t82-13 1030-1416 1000-1200 15 VI t+182-14 10-30-1172 1001-1075 16 V2 MMS2-14 1030-1172 1001-1075 17 V1 MMS2-15 1030-1572 1016-1290 18 VI MM82-16 1030-1195 1000-10S6 19 VI MMS2-18 1030-1214 1096-1001 20 Vl MM82-20 1030-1360 1169-1001 21 VI MM82-22 1030-1352 1165-1001 22 V1 MM82-24 1030-1320 1149-1001
- 12 - MEREENIE
GSI-709
r--------
Correlated Field Data ===================== Line NI Tape Nfl Rec I SPNrange MM82-1A G43 1-155 1290-1000
-lB G72 1-93 1185-1001 -2 G21 1-84 1000-1166 -3 G7 1-41 1082-1002 -4 G124 1-79 1000-1150 -5 G18 1-74 1120-974 -6 G45 1-90 1006-1180 -7 G47 1-144 1250-1024 -8 G34 1-104 1000-1170 -9 G35 1-83 1163-1007 -10 G38 1-47 1090-930 -lOX G83 1-44 1013-928 -11 G51 1-161 1510-1202
G48 1-64 1200-1074 G138 1-35 1072-1004
-12 G57 1-52 1097-1001 -13 661 1-125 1000-1200 -14 G70 1-38 1001-1075 -15 G86 1-151 1016-1290 -16 G88 1-54 1000-1086 -18 G109 1-51 1096-1001 -20 G116 1-85 1169-1001 -22 G1l9 1-89 1165-1001 -24 G121 175 1149-1001
- 13 - MEREENIE
GSJ-709
bull bull
Ishyt) W 0shy00 o 0 0shy
l1 o 0shylaquo ~
H
W
~ -J 0shy
MEREENIE OIL amp GAS FIELD
bull Oil WElL DRILLED SINCE JANUARY 11982
-3 GAS WEll DRillED PRIOR TO JANUARY 1 1982
bull OIL WEll
A PLUGGED amp
N I
M2 Q( S EM-9
E~
~~i
Y ABANDONED
o PROPOSED LOCATIONS
--- STRUCTURE CONTOURS ON TOP PACOOTA (P-l) -- I feel below meon seo level)
- - FAULT
KILOMETRES 10o 2 3 5
1
~ ~
L-________~-------------------------------------------------------------------------------------------------------------------------________________________________________________~I~
I
PLATE II FIELD
SOURCE VIBROSEIS PATTERN
GEOPHONE TypEFREQUENCY NOTRACEINTERVAL
RECORDING INSTRUMENTS
lt TAPE FORMAT
RECORD LENGTH SWEEP LENGTH UPSWEEP FREQUENCY SAMPLE RATE FILTERS
GEOMETRY SPL IT SPREAD SHOT INTERVAL GROUP INTERVAL FOLD
PARAMETERS 0 3 Y900 x 30 METRE SPACE
8 SWEEPS IN-LINE
SM4-PE-3 10 HZ 24 39 METRES
SERCEL 338HR 48 TRs 67 CH 12 INCH 9 TRACK SEG B 1600 BPI 20 SEC 16 SEC 50-16 HZ 4 MSECS LOW 125 HZ - 12 DBOCTHIGH 625 HZ - 72DBOCT
1300 - 150 - 0 - 150 - 1300 METERS 100 M 50 M 12
- 15 - MEREENIE
GSI-709
bull
e
1 INTRODUCTION
The Mereenie seismic reflection survey in OP17S and OP178 in the Northern Territory also designated NTL4 and NTLS was recorded in January 1981 by SeismographService Limited using a vibrator energy source and 48 trace recorder Data were generally recorded for 12 fold COP coverage Details of field parameters are included as Plate II Initial processing was performed by Geosource
One line was International
reprocessedin Sydney
by Geophysicalin December 1982
Service and the
remainder of the survey in March and April 1983
Digital processing utilised an IBM 3033 computer and the TIPEX software system
The following processing sequence was usedshy
Minimum Phase Correlation Field Record Display
True Amplitude Recovery Edit Pre-Deconvolution Ramp Velocity Filter DesignatureTime Variant Scaling Velocity Analysis - VELPAC Brute Stack
Automatic Residual Static ComputationsVelocity Analysis - VELSCAN
Application of NMO Residual and Datum Statics 12-Fold COP Stack Time Variant Filter Time Variant Scaling Gould DisplayMigration of Stack Section Time Variant Filter Time Variant Scaling Dip Filter Film Display of Dip Filtered Migrated Section
Trademark of Texas Instruments Inc
- 1 - MEREENIE
GSI-709
-----------~--- 2 EXPERIMENTAL PROCESSING
Prior to production of the initial line in December 1982 a comprehensive series of tests was carried out to determine the optimum sequence to be followed A report on these tests was submitted to Magellan with that data
Additional filter tests were made at several locations over the prospect to evaluate the suitability of those filters originally chosen for use over the whole prospect After these had been studied it was decided to make no change to the original choice
Line 18 over the well East Mereenie 8 was selected as a tri al 1i ne to test the effectiveness of complex trace processing in the prospect area Colour plots were made of the Instantaneous Phase Frequency and Amplitudeof the section derived from the complex form of the migrated stack data The input for the Instantaneous Phase and Frequency sections was also dip filtered Sections were processed to 19sec record time and di sp1ayed at twi ce the producti on scales
l
- 2 - MEREENIE
G51-709
r-------------e ~
3 CONCLUSIONS AND RECOMMENDATIONS
The final sections produced were a significantimprovement over those from the initial processing It is likely that changed collection parameters would further improve data for future surveys Some of the factors to be considered are shy
Static Corrections It might not be necessary to use a full LVL crew but some upho1e data would increase confidence in the absolute values of datum statics These upho1es would need to be so spaced as to give a good regional picture
Sweep Frequency The filter analyses all showed that signal containingthe maximum sweep frequency used (50Hz) was present well below 1sec record time Tests should be made to ascertain maximum frequencies obtainable in the area
Spread Configuration Severa 1 1 i nes had steeply di ppi ng ref1 ectors The groupinterval of 50m used would have caused some cancellation of signal in these areas With 96 trace recording becoming standard shorter group intervals and arrays could be used without losing coverage
Line Length and MigrationMigration was effective on most of the lines however some of the lines with steeply dipping section wer~ veryshort and showed severe edge effects after migrationThe benefits obtained from migration would be enhanced if such lines were extended beyond the areas of steep dip on the flanks of the structure
Attribute Processing Interpretative evaluation of the Lithcomp sections should indicate the potential value of the package in this area It is also felt that the inversion packageG-Log might be helpful in defining the extent of target structures and it is recommended that trial processingbe performed over a known structure
Respectfully submitted GEOPHYSICAL SERVICE INTERNATIONAL
~ ~~ ~~ c
(Processing Party Chief)
- 3 - MEREENIE
GSI-709
~APPENDIX A PRODUCTION PARAMETERS
Typical parameters are listed below and also appended to each final display section
Processing was at 4msec sample rate to 4 seconds StacKing functions used were annotated on each section
TAR - Alpha 5dbsec~ T2 40sec
PDR OffsetStart time pairs were 150m005sec 1400m048sec
Vel oci ty Fil ter Positive cut 3125 msec (16msectrace) Negative cut 12500 msec ( 4msectrace)
Trace equalisation gates were 1000msec long
Trace edit - from field records
Designature - one wavelet was estimated for each record
StacK RampThe following post nmo time(msec) and offset(m) pairs were used- (-150~0) (-50~150) (5001400)
Time Variant Filter TIME(msec) FREQUENCY(hz)
o 16-50 1500 16-50 2500 16-40
Scaling after stacK Regular lx200msec 1x300msec lx500msec and 3xl000msec gates with no overlap were used
Velocity analyses ~ relative statics only were applied for VELPAC analyses and relative plus residuals for VELSCANS
Residual Statics Space and time variant gates based on prominentreflectors were picKed Four iterations of computations were performed and a 16-40Hz filter used
Display Scale Mode VAWIVertical scale 10 cmsecHorizontal scale 24 TPI
- 4 - MEREENIE
GSI-709
APPENDIX B DESCRIPTION OF BASIC PROCESSES bull Datum statics were supplied by Magellan to a datum of 650m ASl
Minimum Phase Correlation
Most deconvolution processes assume thatmiddot reflection wavelets are minimum phase Thus it is desirable to have a correlation programme that collapses the Vibroseis sweep to a minimum phase wavelet rather than zero phaseThe minimum phase correlation process can be visualized as a series of operations in the frequency domain as follows
a Fourier Transform both trace and sweep
b Multiply the trace by the sweep amplitude spectra and subtract the sweep phase spectrumfrom the trace phase spectrum to accomplishconventional zero phase correlation
c Divide amplitude spectrum from b by itself plus white noise - leaving the phase spectrumunchanged This is the inverse filter
d Compute the mimimum phase spectrum for the effective source wavelet from c and add this to the phase spectrum from c - leaving the amplitude spectrum unchanged
e rnversetransform the amplitude and phase trace spectra from d) This gives the minimum phase correlated trace
True Amplitude Recovery - TAR
TAR was app 11 ed to all fi e 1 d records Thi s removed the floating point gain applied by the Serce1 field systemand corrected for signal loss by inelastic attenuation and spherical divergence
Pre-Deconvolution Ramp - PDR
PDR removes unwanted first arrival noise from the front end of seismic records and is applied prior to deconvolution design
Velocity Filtering - VEF
Velocity filtering is a mu1tichanel process that has been combined with designature into one executable load module Multichannel filtering is a two dimensional
- 5 - MEREENIE
GSI-709
frequency wave number operation used to discriminate against specified velocities on pre-stacked data or against specified dips on stacked data Velocity filtering processing requires shot organised data that has a group interval representing adequatespatial sampling Also the receiver interval should be less than or equal to the shot interval to avoid aliasingThe process transforms the data from the space-timedomain (X-T) to the frequency-wave number domain (F-K)where the filter is applied After filter applicationthe data is transformed back to the X-T domain for the application of further conventional processingThe apparent horizontal velocity of the noise must be adequately separated from the primary signal for the process to be effective Examples of noise alignmentthat can be removed are ground roll and air blast The user supplies a window of primary dip zones to keep negative dip noise and positive dip noise outside of the keep zone are rejected Thus it is important that the primary dip on the field records should be known - it should be remembered that moveout is a major factor influencing the selection of keep zones
Designature
Designature is a generic name for processess which attempt to replace an arbitrary source wavelet convolved with the reflection sequence by a shorter wavelet of improved resolving capability DESIG is an alternative to conventional pre-stackdeconvolution (TVD) Common features of DESIG and conventional TVD include
a Both estimate the input wavelet from seismic traces b Both assume the wavelet to be removed is minimum phase c Both assume the reflection sequence is random
Significant differencesareshya DESIG is a Rlllti channel process that can use the entire record to estimate the wavelet For land data the process uses the whole record TVD is a single channel process that uses only a portion of the trace to design an operatorb TVD is time and offset variant whereas DESIG is not time variant but has the capability to bemiddot offset dependent c DESIG compensates for the field system low cut phase response and provides a more accurate and stable operator design than conventional single channel deconvolution because of the much greater statistical base for the source wavelet estimation The assumptionof randomness of the reflection sequence is fulfilled
- 6 - MEREENIE
Ill
11
bull
I f t r I I
( I
t t [
I I I I
1
GS-709
using a record that is not HMO corrected rather than part of a single trace Thus DESIG is less likely to attempt to remove the periodicity of the signal itself
Trace Equalisation
A gate of length 1000ms was used The scalers were determined such that the average absolute values of data words in the design gate was equal to 2exp10
Velociy Analysis - VELPAC
The VELPAC Velocity Module was applied in the spot analysis mode using 12 adjacent depth pointsBasic steps of the programme for each analysis include - Application of normal moveout (NMO) corrections corresponding to several different constant velocities or velocity functions to a set of adjacent depth points - A stack for each velocity of each depth point in the set - A time gated power based search to provide picks as functions of time amplitude and moveout (which is another expression of velocity) - Display of selected depth point gather traces stacks and power picks shyVelocities determined by the VELPAC analyses were used in the residual processing l
Preliminary Stack (Brute)
Brute stack velocities were obtained from prio~ processing In addition to the stack Near Trace Gather and lOOt coverage sections were also produced These sections had two usesshy1 As a quality control cneck of the preprocessing 2 To enable selection of design gates for residual static computation
Velocity Analysis - VELSCAN
The VELSCAN module was applied in the spot mode using 11 adjacent depth points The following is a brief description of the process The VELSCAN module generates events as functions of time amplitude moveout and dip The event picking proceeds in the following manner
NMO Static and Residual Static corrections corresponding to a series of velocity functions are applied to a set of depth point traces For each velocity function the NMO corrected traces are stacked The resulting traces consist of amplitudes as functions of time and moveout
- 7 - MEREENIE
to
G51-109
- Identical operations are applied to adjacent depth pOints adding the dimension of space - Dip is applied and for each value of dip the traces are stacked across depth points The result is a set of amplitudes as functions of time moveout and dip - An-event is located by searching for an amplitude extremum in the time moveout and dip domains An extremum may be either a maximum or minimumthat is both peaks and troughs are picked The event attributes of time amplitude moveout and dip are assigned to the centre depth point
- Prior to display the events are subjected to various sorting and classification algorithms The powerfulpicking of VELSCAN yields good results even in relatively poor data areas Where quality or accuracyrequirements permit options are chosen to reduce computer run time and hence cost The major processing options for event picking for each analysis are as follows
OPTION A Specification of time gatesSeveral time gates may be selected for independent definition In each gate the bandpass filters number of depth points and the dip range may be different
OPTION B Number of depth points to processThere may vary in each time g~te from 3 to 24
OPTION C Dip range in each gate selected
OPTION D Time variant velocity bounds which determine the boundaries of the moveout scans
OPTION E Sorting and grading of events Events may be classified in terms of Time Amplitude Moveout and DipAs aids to interpretation the VELSCAN module also generates and displays gathers stacks and velocityfunctions in a manner similar to VELPAC The specifications for this capability are independant of the specifications for the event picking The majoroptions for each analysis are
OPTION F Number of velocity functions applied - up to 30 constant or variable in time
OPTION G Number of depth points to display - up to 24
OPTION H Display of gather traces - Display of centre depth point for each function - Display of gather traces for each depth point for centre function only
- 8 - MEREENIE
~
GSI-709
Also displayed are stacks for all depth points for each velocity function and the centre depth point gather without statics and NMO applied
Automatic Residual Static Computations
The method is based upon the use of cross-correlation functi ons to measure the rel ative time shi fts for each of the traces within a common depth point set Each of the traces of a COP set is correlated with a reference trace formed by stacking the other traces within the set
The location of the peak value of the cross-correlation function gives an estimate of the time shift of the static shifted trace The time shift measured by the cross-correlation is the sum of several effects namelyi Residual shot static ii Residual receiver static iii Residual normal moveout iv Noise
The correlation functions are computed over gates which are chosen such that the signal to noise ratio is high and little or no residual moveout is present
The time shifts obtained from the correlation functions for each trace are then plac~d in tables of common shot and surface positions and a statistical analysiscarried out to determine a unique residual source correction for each shot and a unique residual group correction for each receiver This ensures that at all times statics which are applied to data are surface consistent
Finally the statics to be applied are synthesised from the estimates of the individual shot and receiver statics by averaging the values along common source and receivers
The process is iterative and several rounds are applied to achieve upgraded estimates of the residual statics to apply - the input to successive iterations being the output from the preceding round To enable a QC of the results apart from the computed statics being listed a plot is made of the selected gates with the computed residual statics applied after each iteration
Application of Datum Statics
The application of datum statics was performed in the following mannershyPrior to application of normal moveout corrections a mean datum static was computed for each depth point
- 9 - MEREENIE
GSI-709
and a relaUve datum static computed for each trace within that common depth point set The relative static was simply the difference between the mean datum static and the individual trace datum statics The relative datum statics thus computed were then applied togetherwith the residual statics to the traces prior to the application of normal moveout corrections A consequence of this method of datum static applicationis that velocity functions for normal moveout corrections are expressed relative to the surface and not rel ati ve to the datum plane
Normal Moveout Corrections
Normal moveout correcti ons are applied to remove increased reflection time on an event caused by spread geometry The magnitude of the event determined by the following equationshy
correction is
T =J T02 + X2 shy To
y2 where
T = Normal Moveout To = Time of the event at zero offset X = Offset of a trace Y = Root mean squa re veloci ty to the event shy
Common Depth Point Stack
In this process the traces for each depth point are mi xed to gi ve one output trace for each depth poi nt Prior to the mix first break energy plus the early portion of the traces where NMO corrections have caused severe stretching resulting in significant frequencychanges are suppressed The result being that the stacking multiplicity varies as a function of record time
Time Variant Filtering - TYF
Filtering was applied in a time variant manner to take account of the higher frequency content of shallow data and the lower frequency content at depth and to reject unwanted frequencies or noise
Migration
Wave equation migration was performed in the KIRCHOFF FshyK domain The principal advantages of the wave equation migration areshyMigrates properly in the presence of lateral velocity variation Has a practical dip limit approaching 90deg
- 10 - MEREENIE
GSI-709
Prevents induced aliasing on flat data where there is a large sample interval The routine uses tne F-K transform for the migration rather than the moveout and stack of an aperture of traces in the time domain Aliasing of flat events resulting from too large an aperture in the moveout and stack method does not occur in the F-K method
Dip Filter
Dip filter in the F-K domain was used as a means of improving the signal to noise ratio by reducing random any organised noise outside dip bounds selected from the stack section
Lithcomp
LITHCOMP is designed to compute the complex attributes of a seismic trace Instantaneous amplitude frequency and phase may infer geologic information not readily seen on a conventional display_ Each attribute is inspected separately and displayed against time Displays are in colour to assist interpretation Brief descriptions of each characteristic followsshyInstantaneous Amplitude This is also referred to as reflection strength and is a measure of amplitude independent of phase This is the key to its use since situations occur where the amplitude of a peak or trough vary laterally due to wavelet phase changes not caused by changes in reflection amplitude and hence reflection coefficient Instantaneous Phase This is a measure of phase with respect to time not frequency as in conventional spectral analyses It emphasises continuity of events and being independentof amplitude shows weak coherant events just as well as strong ones Instantaneous Frequency This is in a way the measure of the predominant frequency of a reflection or a comp1ex series of reflections It will change not only with the reflection wavelet change but also for a complex sequence of reflections This latter change might also be caused by changes in bed thickness or of velocity within a sequence caused ~y such things as trapped hydrocarbons
- 11 - MEREENIE
~ U
G51-709
APPENDIX C TAPE INVENTORY bull
Stack Data all on VSN 501142 ==========
File Name SLMEREENIESTKTRSVILINENOLRI Format DemultiplexedUngapped1600 BPI(segy) Data Raw Stack 0-3996 at 4 msecs
File VI LineNO COP range SPN range 1 VI MMS2-1A 1030-1604 1290-1000 2 VI MMS2-1B 1030-1392 l1S5-1001 3 VI MMS2-2 1031-1356 1000-1166 4 VI MMS2-3 1030-11S4 lOS2-1002 5 VI MMS2-4 1030-1324 1000-1150 6 VI MM82-5 1030-1316 1120-974 7 VI MM82-6 1030-1372 1006-11S0 8 VI MM82-7 1030-1476 1250-1024 9 VI MMS2-8 1034-1366 1000-1170
10 VI tlMS2-9 1030-1336 1163-1007 MM82-10 1030-1344 1090-930t~ ~t MMS2-11 1030-2036 1510-1004
13 VI MM82-12 1030-1216 1097-1001
14 VI r+t82-13 1030-1416 1000-1200 15 VI t+182-14 10-30-1172 1001-1075 16 V2 MMS2-14 1030-1172 1001-1075 17 V1 MMS2-15 1030-1572 1016-1290 18 VI MM82-16 1030-1195 1000-10S6 19 VI MMS2-18 1030-1214 1096-1001 20 Vl MM82-20 1030-1360 1169-1001 21 VI MM82-22 1030-1352 1165-1001 22 V1 MM82-24 1030-1320 1149-1001
- 12 - MEREENIE
GSI-709
r--------
Correlated Field Data ===================== Line NI Tape Nfl Rec I SPNrange MM82-1A G43 1-155 1290-1000
-lB G72 1-93 1185-1001 -2 G21 1-84 1000-1166 -3 G7 1-41 1082-1002 -4 G124 1-79 1000-1150 -5 G18 1-74 1120-974 -6 G45 1-90 1006-1180 -7 G47 1-144 1250-1024 -8 G34 1-104 1000-1170 -9 G35 1-83 1163-1007 -10 G38 1-47 1090-930 -lOX G83 1-44 1013-928 -11 G51 1-161 1510-1202
G48 1-64 1200-1074 G138 1-35 1072-1004
-12 G57 1-52 1097-1001 -13 661 1-125 1000-1200 -14 G70 1-38 1001-1075 -15 G86 1-151 1016-1290 -16 G88 1-54 1000-1086 -18 G109 1-51 1096-1001 -20 G116 1-85 1169-1001 -22 G1l9 1-89 1165-1001 -24 G121 175 1149-1001
- 13 - MEREENIE
GSJ-709
bull bull
Ishyt) W 0shy00 o 0 0shy
l1 o 0shylaquo ~
H
W
~ -J 0shy
MEREENIE OIL amp GAS FIELD
bull Oil WElL DRILLED SINCE JANUARY 11982
-3 GAS WEll DRillED PRIOR TO JANUARY 1 1982
bull OIL WEll
A PLUGGED amp
N I
M2 Q( S EM-9
E~
~~i
Y ABANDONED
o PROPOSED LOCATIONS
--- STRUCTURE CONTOURS ON TOP PACOOTA (P-l) -- I feel below meon seo level)
- - FAULT
KILOMETRES 10o 2 3 5
1
~ ~
L-________~-------------------------------------------------------------------------------------------------------------------------________________________________________________~I~
I
PLATE II FIELD
SOURCE VIBROSEIS PATTERN
GEOPHONE TypEFREQUENCY NOTRACEINTERVAL
RECORDING INSTRUMENTS
lt TAPE FORMAT
RECORD LENGTH SWEEP LENGTH UPSWEEP FREQUENCY SAMPLE RATE FILTERS
GEOMETRY SPL IT SPREAD SHOT INTERVAL GROUP INTERVAL FOLD
PARAMETERS 0 3 Y900 x 30 METRE SPACE
8 SWEEPS IN-LINE
SM4-PE-3 10 HZ 24 39 METRES
SERCEL 338HR 48 TRs 67 CH 12 INCH 9 TRACK SEG B 1600 BPI 20 SEC 16 SEC 50-16 HZ 4 MSECS LOW 125 HZ - 12 DBOCTHIGH 625 HZ - 72DBOCT
1300 - 150 - 0 - 150 - 1300 METERS 100 M 50 M 12
- 15 - MEREENIE
GSI-709
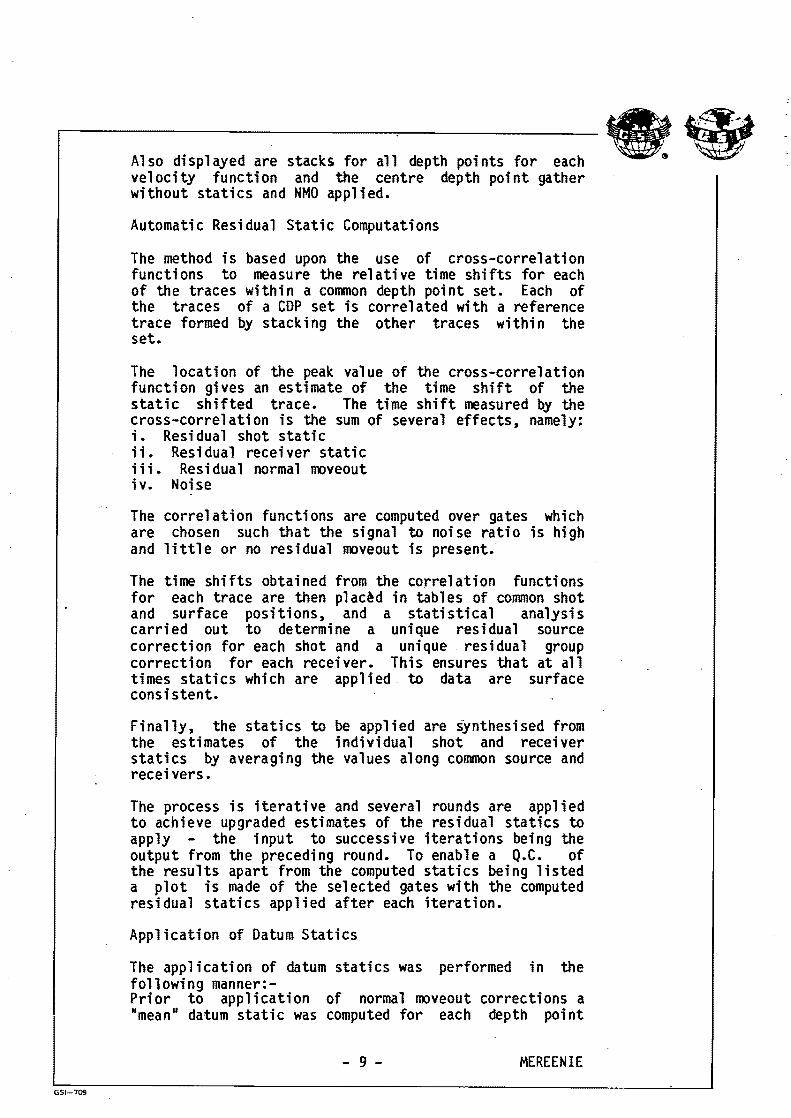
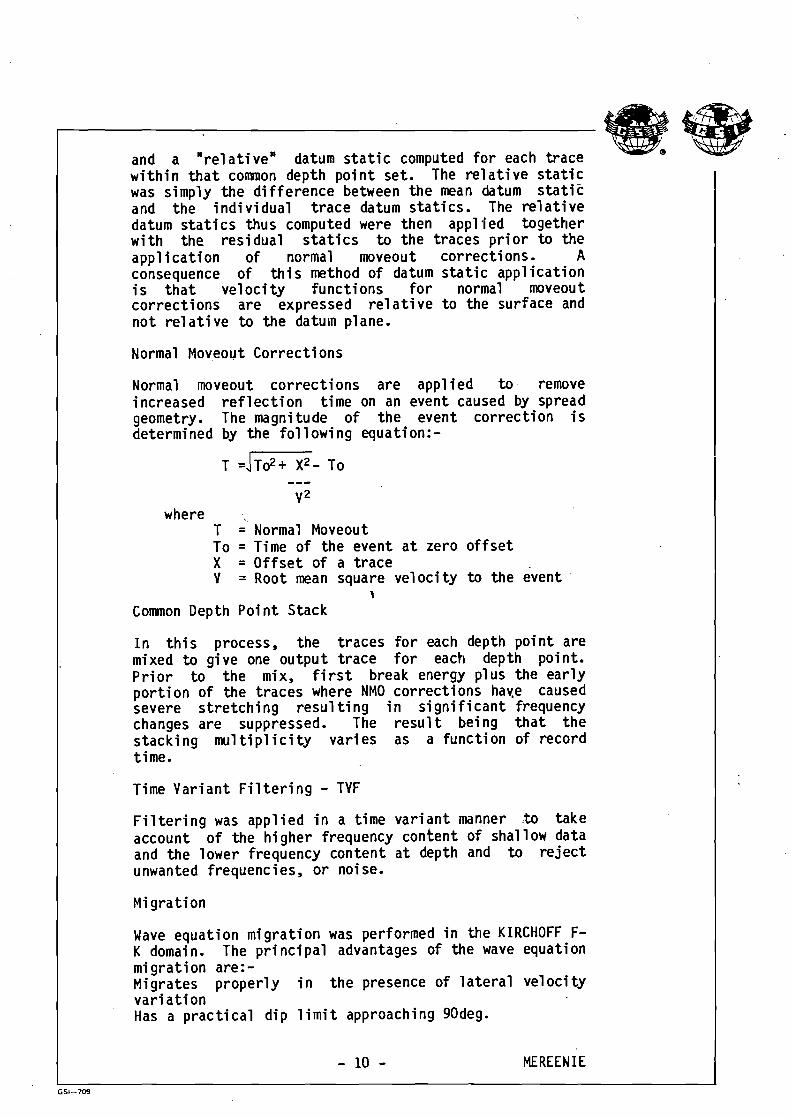
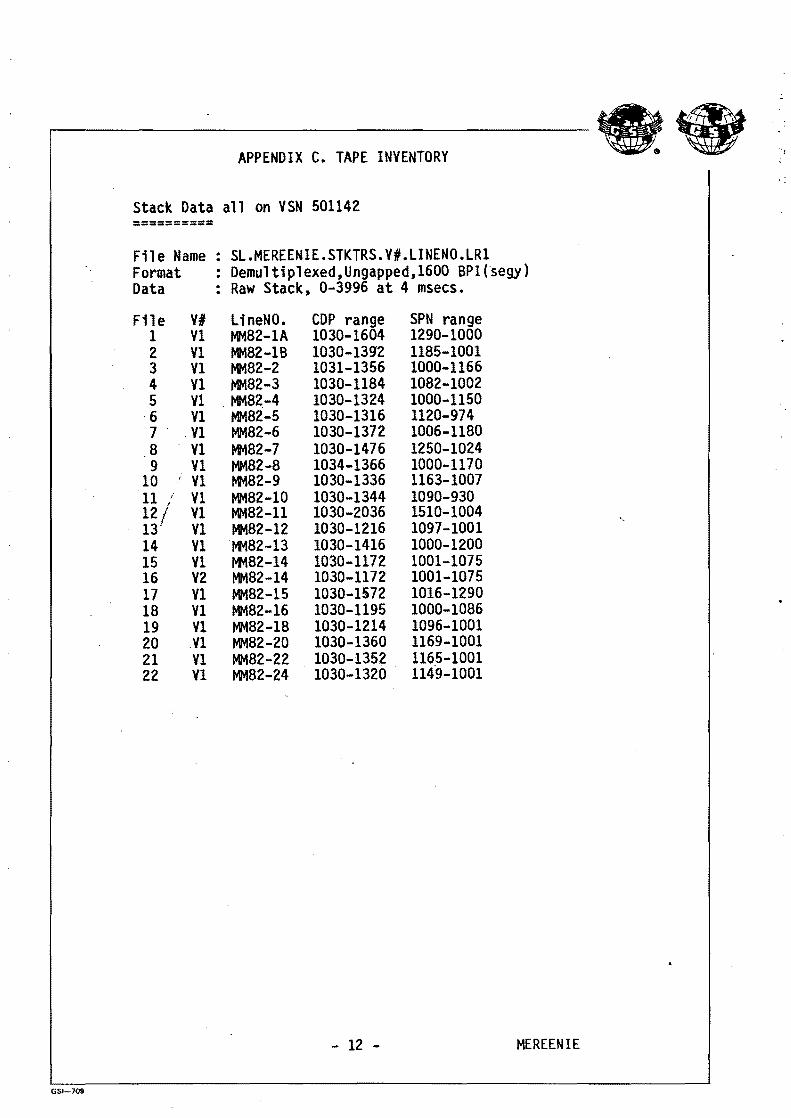
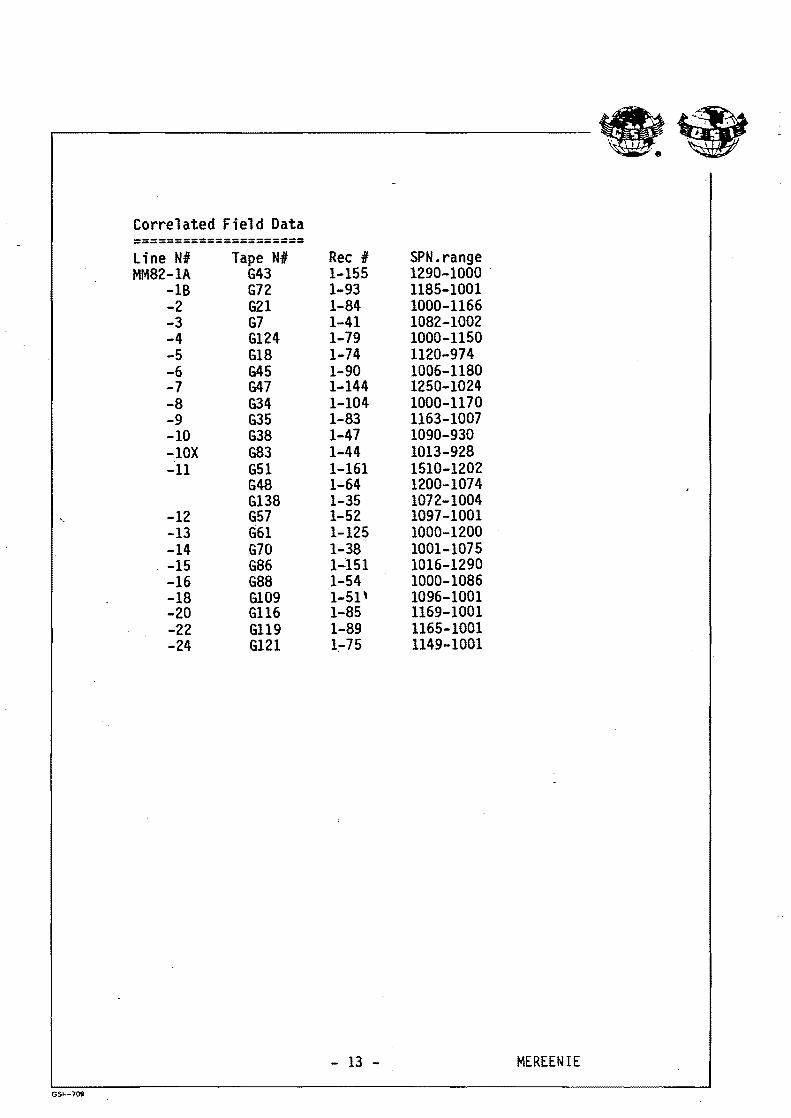
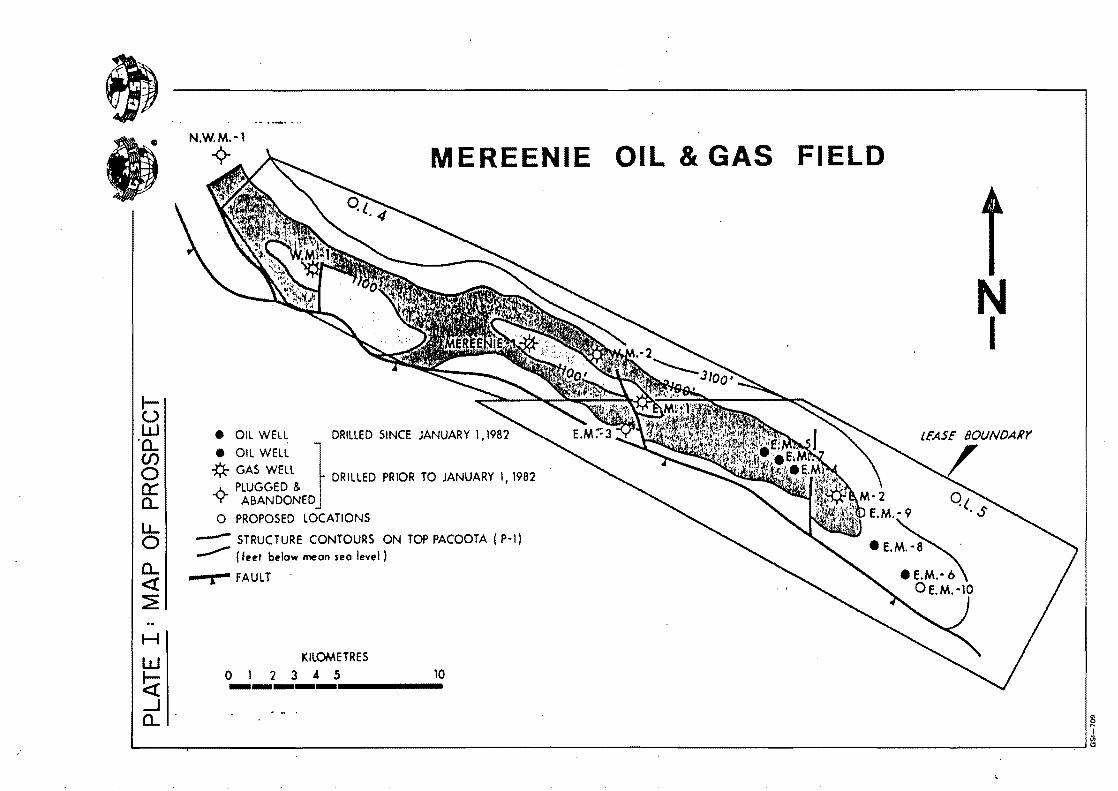
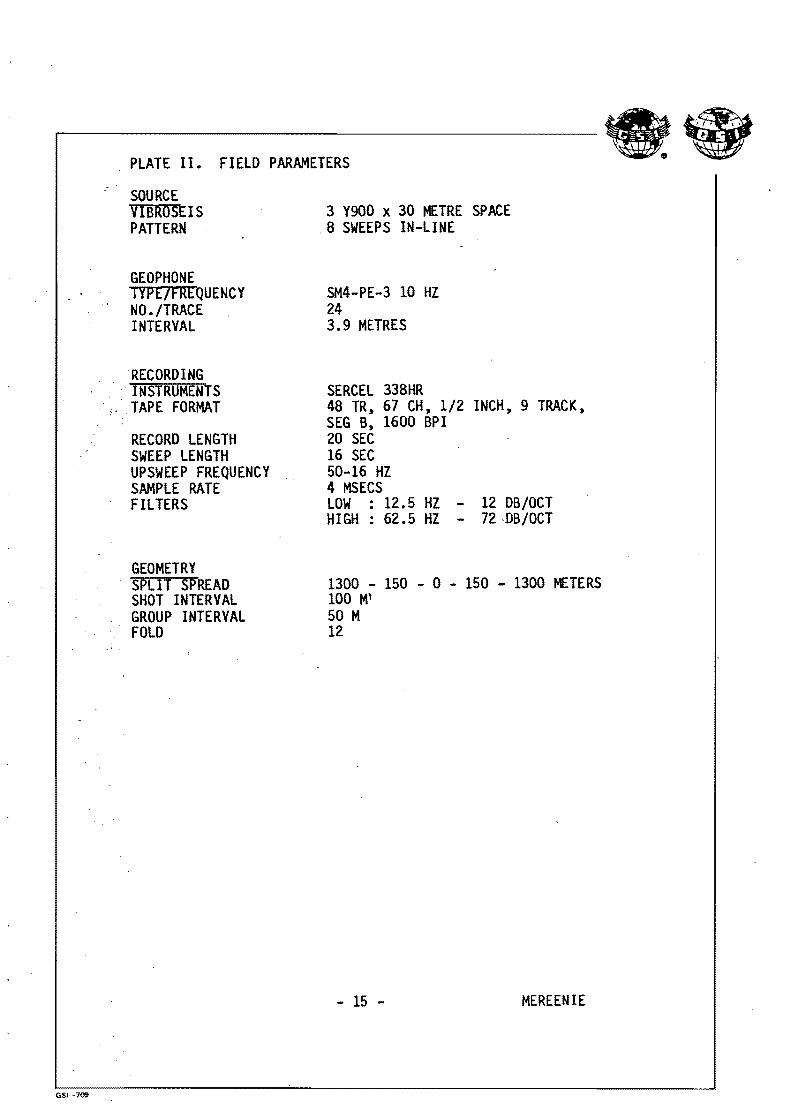