Embed Size (px)
Citation preview
Weekly / Vol. 61 / No. 7 February 24, 2012
U.S. Department of Health and Human ServicesCenters for Disease Control and Prevention
Morbidity and Mortality Weekly Report
Because influenza can be especially severe during pregnancy, the American College of Obstetricians and Gynecologists (ACOG) and the Advisory Committee on Immunization Practices (ACIP) recommend influenza vaccination for women who will be pregnant during the influenza season, regardless of trimester (1,2). During the 2009–10 influenza season, pregnant women were at increased risk for severe disease and mortality from influenza A (H1N1)pdm09 (pH1N1) pandemic virus infection (3). Anticipating this risk, both the inactivated trivalent seasonal and monovalent pH1N1 vaccinations were recommended for pregnant women (2,4). To estimate state-specific seasonal and pH1N1 influenza vaccination cover-age among pregnant women, CDC analyzed data from the Pregnancy Risk Assessment Monitoring System (PRAMS). This report provides estimates from 29 states and New York City (NYC) for women who had live births during September 2009–May 2010. Median state coverage was 47.1% for sea-sonal and 40.4% for pH1N1 influenza vaccination. Overall, women who reported that a health-care provider offered them influenza vaccination or told them to get it during their preg-nancy were more likely to be vaccinated than those without an offer or recommendation (prevalence ratio [PR] = 5.2 for seasonal, and PR = 14.4 for pH1N1). Substantial variation across areas was observed for prevalence of a provider offer or recommendation during pregnancy and for influenza vaccina-tion. These findings highlight the need for state-specific strate-gies that optimize provider involvement to increase influenza vaccination of pregnant women.
CDC analyzed data from PRAMS,* an ongoing, population-based survey that collects data on a range of maternal behaviors and experiences before, during, and after pregnancy among women who recently delivered a live-born infant. PRAMS surveys currently are administered by 40 states and NYC. The monthly surveys take stratified random samples of 100–300
women with recent live births from each state birth certificate registry. The selected mothers are mailed a questionnaire after delivery; those who do not respond by mail within 2 months are contacted by telephone, and 15 attempts are made with viable telephone numbers to reach the respondents. During the 2009–10 influenza season, 29 states and NYC agreed to add a supplemental vaccination question module to their PRAMS survey. For this report, CDC analyzed data from women who had a live birth from September 1, 2009, through May 31, 2010 (27,153 women for seasonal vaccination and 27,372 women for pH1N1 vaccination). The state median response rate was 69.1% (range: 53.7%–85.0%).
CDC estimated† state-specific seasonal and pH1N1 vaccina-tion coverage,§ overall and stratified by self-reported receipt of a health-care provider offer or recommendation for influenza vaccination during pregnancy. CDC also estimated the overall PR of vaccination coverage for women with and without a pro-vider offer or recommendation and the population attributable
Influenza Vaccination Coverage Among Pregnant Women — 29 States and New York City, 2009–10 Season
* Additional information is available at http://www.cdc.gov/prams.
† Questions on the PRAMS supplement included the following: “At any time during your most recent pregnancy, did a doctor, nurse, or other health-care worker offer you a seasonal flu shot or tell you to get one?” and “At any time during your most recent pregnancy, did a doctor, nurse, or other health-care worker offer you an H1N1 flu shot or tell you to get one?”
§ Questions on the PRAMS supplement included the following: “During your most recent pregnancy, did you get an H1N1 flu shot?” and “Since September 2009, did you get a seasonal flu shot? This is different than the H1N1 flu shot.”
INSIDE119 Fatal Exposure to Methylene Chloride Among
Bathtub Refinishers — United States, 2000–2011 123 Update: Influenza Activity — United States,
October 2, 2011–February 11, 2012 129 Announcement 130 QuickStats
Morbidity and Mortality Weekly Report
114 MMWR / February 24, 2012 / Vol. 61 / No. 7
The MMWR series of publications is published by the Office of Surveillance, Epidemiology, and Laboratory Services, Centers for Disease Control and Prevention (CDC), U.S. Department of Health and Human Services, Atlanta, GA 30333.Suggested citation: Centers for Disease Control and Prevention. [Article title]. MMWR 2012;61:[inclusive page numbers].
Centers for Disease Control and PreventionThomas R. Frieden, MD, MPH, Director
Harold W. Jaffe, MD, MA, Associate Director for ScienceJames W. Stephens, PhD, Director, Office of Science Quality
Stephen B. Thacker, MD, MSc, Deputy Director for Surveillance, Epidemiology, and Laboratory ServicesStephanie Zaza, MD, MPH, Director, Epidemiology and Analysis Program Office
MMWR Editorial and Production StaffRonald L. Moolenaar, MD, MPH, Editor, MMWR Series
John S. Moran, MD, MPH, Deputy Editor, MMWR SeriesTeresa F. Rutledge, Managing Editor, MMWR Series
Douglas W. Weatherwax, Lead Technical Writer-EditorDonald G. Meadows, MA, Jude C. Rutledge, Writer-Editors
Martha F. Boyd, Lead Visual Information Specialist
Maureen A. Leahy, Julia C. Martinroe, Stephen R. Spriggs, Terraye M. Starr
Visual Information SpecialistsQuang M. Doan, MBA, Phyllis H. King
Information Technology Specialists
MMWR Editorial BoardWilliam L. Roper, MD, MPH, Chapel Hill, NC, Chairman
Matthew L. Boulton, MD, MPH, Ann Arbor, MIVirginia A. Caine, MD, Indianapolis, IN
Jonathan E. Fielding, MD, MPH, MBA, Los Angeles, CADavid W. Fleming, MD, Seattle, WA
William E. Halperin, MD, DrPH, MPH, Newark, NJKing K. Holmes, MD, PhD, Seattle, WADeborah Holtzman, PhD, Atlanta, GATimothy F. Jones, MD, Nashville, TN
Dennis G. Maki, MD, Madison, WIPatricia Quinlisk, MD, MPH, Des Moines, IA
Patrick L. Remington, MD, MPH, Madison, WIJohn V. Rullan, MD, MPH, San Juan, PR
William Schaffner, MD, Nashville, TNDixie E. Snider, MD, MPH, Atlanta, GA
John W. Ward, MD, Atlanta, GA
risk¶ associated with provider offer or recommendation. To examine the context of observed variation in vaccination cov-erage among women with live births, CDC analyzed correla-tions between estimates for pregnant women using PRAMS data and estimates for women aged 18–49 years and adults aged ≥18 years from the same 29 states using data from the Behavioral Risk Factor Surveillance System (BRFSS).** The data were weighted to adjust for complex survey design and nonresponse. To account for the PRAMS sampling design, analyses were performed using statistical software.
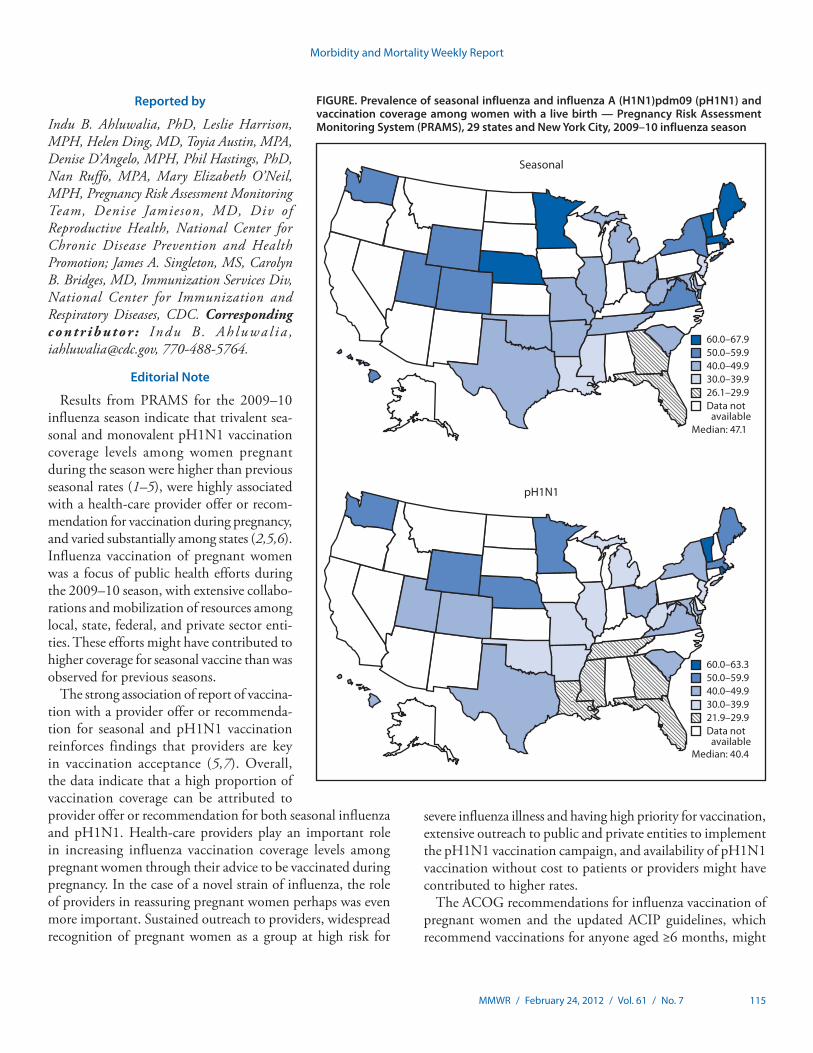
Seasonal and pH1N1 influenza vaccination coverage among women with live births varied among the participating states (Figure). Among the 29 states and NYC, the estimated median percentage of women with live births reporting receipt of both seasonal and pH1N1 vaccinations was 28.5% (range: 15.0%–49.9%). The median percentage of women with live births reporting receipt of seasonal or pH1N1 vaccinations was 59.3% (range: 38.9%–80.2%). Overall correlation between
PRAMS data and state coverage among adult women aged 18–49 years was high (r = 0.88 for seasonal and r = 0.80 for pH1N1); for all adults, the correlation also was high (r = 0.80 for seasonal and r = 0.88 for pH1N1).
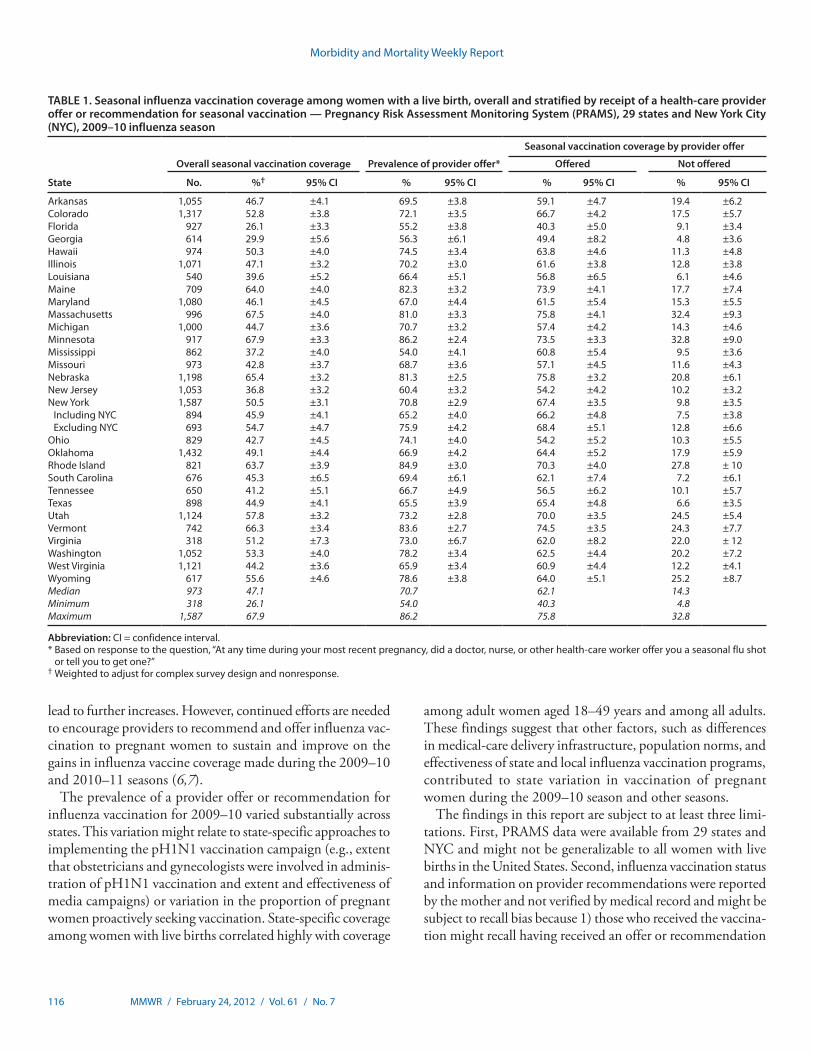
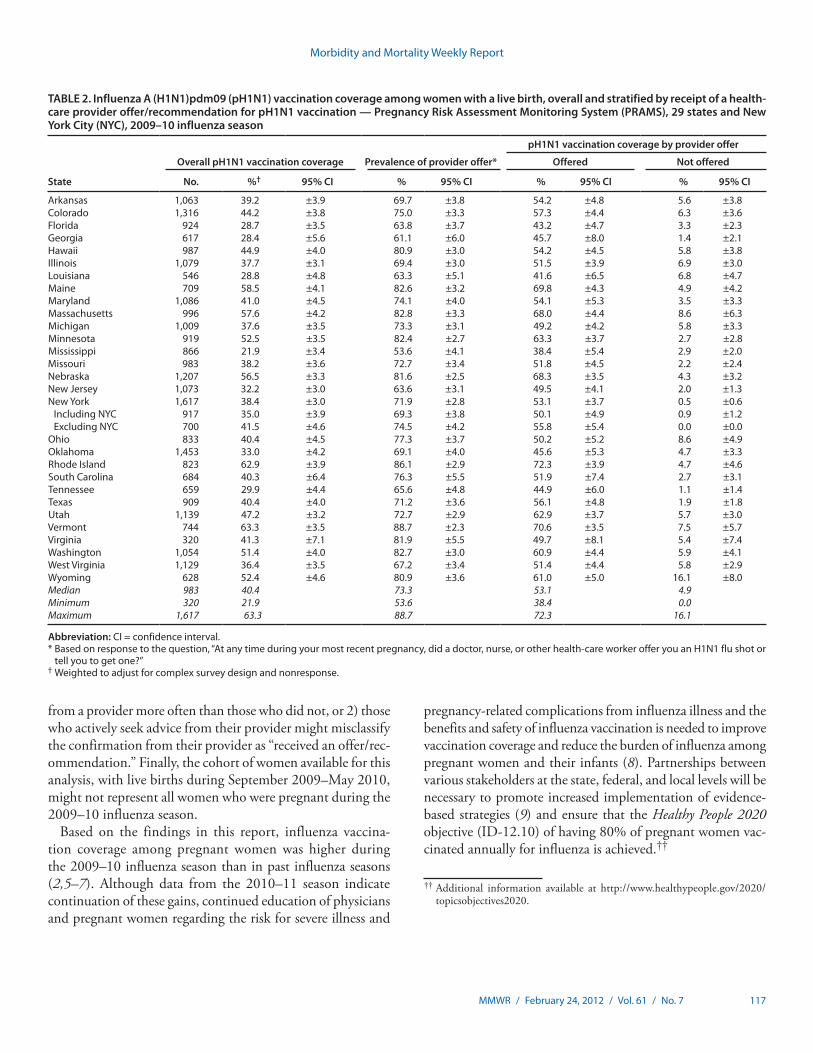
The estimated median seasonal vaccination coverage among women with a live birth was 47.1% (range: 26.1% in Florida to 67.9% in Minnesota) (Table 1). Variation in coverage was observed for pH1N1 (Figure). Median prevalence of provider offer or recommendation for seasonal vaccination was 70.7% (range: 54.0% in Mississippi to 86.2% in Minnesota). Median pH1N1 coverage was 40.4% (range: 21.9% in Mississippi to 63.3% in Vermont) (Figure, Table 2). Median prevalence of provider offer or recommendation for pH1N1 vaccination was 73.3% (range: 53.6% in Mississippi to 88.7% in Vermont).
Vaccination coverage was higher in each state for those with a provider offer or recommendation (median: 62.1% for seasonal [Table 1] and 53.1% for pH1N1 [Table 2]), compared with those without an offer or recommendation (median: 14.3% for seasonal [Table 1] and 4.9% for pH1N1 [Table 2]). Overall, PRs of vaccination coverage for those with versus those without a provider offer or recommendation were 5.2 (95% confidence interval [CI] = 4.7–5.7) for seasonal and 14.4 (CI = 12.1–17.2) for pH1N1. The proportion of vaccination coverage that could be attributed to provider offer or recommendation was 74% for seasonal and 89% for pH1N1.
¶ Population attributable risk is a measure to assess the potential contribution of provider offer or recommendation to the observed vaccination level and was calculated using the formula: P (PR-1) / [P (PR-1)+1], where P was the prevalence of receiving a provider offer or recommendation for influenza vaccination and PR was the prevalence ratio of vaccination by provider offer or recommendation.
** Information on the data sources and analytic methods used for women aged 18–49 years and adults aged ≥18 years is available at http://www.cdc.gov/flu/professionals/vaccination/coverage_1011estimates.htm.
Morbidity and Mortality Weekly Report
MMWR / February 24, 2012 / Vol. 61 / No. 7 115
Reported by
Indu B. Ahluwalia, PhD, Leslie Harrison, MPH, Helen Ding, MD, Toyia Austin, MPA, Denise D’Angelo, MPH, Phil Hastings, PhD, Nan Ruffo, MPA, Mary Elizabeth O’Neil, MPH, Pregnancy Risk Assessment Monitoring Team, Denise Jamieson, MD, Div of Reproductive Health, National Center for Chronic Disease Prevention and Health Promotion; James A. Singleton, MS, Carolyn B. Bridges, MD, Immunization Services Div, National Center for Immunization and Respiratory Diseases, CDC. Corresponding contr ibutor : Indu B . Ah luwa l i a , [email protected], 770-488-5764.
Editorial Note
Results from PRAMS for the 2009–10 influenza season indicate that trivalent sea-sonal and monovalent pH1N1 vaccination coverage levels among women pregnant during the season were higher than previous seasonal rates (1–5), were highly associated with a health-care provider offer or recom-mendation for vaccination during pregnancy, and varied substantially among states (2,5,6). Influenza vaccination of pregnant women was a focus of public health efforts during the 2009–10 season, with extensive collabo-rations and mobilization of resources among local, state, federal, and private sector enti-ties. These efforts might have contributed to higher coverage for seasonal vaccine than was observed for previous seasons.
The strong association of report of vaccina-tion with a provider offer or recommenda-tion for seasonal and pH1N1 vaccination reinforces findings that providers are key in vaccination acceptance (5,7). Overall, the data indicate that a high proportion of vaccination coverage can be attributed to provider offer or recommendation for both seasonal influenza and pH1N1. Health-care providers play an important role in increasing influenza vaccination coverage levels among pregnant women through their advice to be vaccinated during pregnancy. In the case of a novel strain of influenza, the role of providers in reassuring pregnant women perhaps was even more important. Sustained outreach to providers, widespread recognition of pregnant women as a group at high risk for
severe influenza illness and having high priority for vaccination, extensive outreach to public and private entities to implement the pH1N1 vaccination campaign, and availability of pH1N1 vaccination without cost to patients or providers might have contributed to higher rates.
The ACOG recommendations for influenza vaccination of pregnant women and the updated ACIP guidelines, which recommend vaccinations for anyone aged ≥6 months, might
FIGURE. Prevalence of seasonal influenza and influenza A (H1N1)pdm09 (pH1N1) and vaccination coverage among women with a live birth — Pregnancy Risk Assessment Monitoring System (PRAMS), 29 states and New York City, 2009–10 influenza season
60.0–63.350.0–59.940.0–49.930.0–39.921.9–29.9Data not available
pH1N1
60.0–67.950.0–59.940.0–49.930.0–39.926.1–29.9Data not available
Seasonal
Median: 47.1
Median: 40.4
Morbidity and Mortality Weekly Report
116 MMWR / February 24, 2012 / Vol. 61 / No. 7
lead to further increases. However, continued efforts are needed to encourage providers to recommend and offer influenza vac-cination to pregnant women to sustain and improve on the gains in influenza vaccine coverage made during the 2009–10 and 2010–11 seasons (6,7).
The prevalence of a provider offer or recommendation for influenza vaccination for 2009–10 varied substantially across states. This variation might relate to state-specific approaches to implementing the pH1N1 vaccination campaign (e.g., extent that obstetricians and gynecologists were involved in adminis-tration of pH1N1 vaccination and extent and effectiveness of media campaigns) or variation in the proportion of pregnant women proactively seeking vaccination. State-specific coverage among women with live births correlated highly with coverage
among adult women aged 18–49 years and among all adults. These findings suggest that other factors, such as differences in medical-care delivery infrastructure, population norms, and effectiveness of state and local influenza vaccination programs, contributed to state variation in vaccination of pregnant women during the 2009–10 season and other seasons.
The findings in this report are subject to at least three limi-tations. First, PRAMS data were available from 29 states and NYC and might not be generalizable to all women with live births in the United States. Second, influenza vaccination status and information on provider recommendations were reported by the mother and not verified by medical record and might be subject to recall bias because 1) those who received the vaccina-tion might recall having received an offer or recommendation
TABLE 1. Seasonal influenza vaccination coverage among women with a live birth, overall and stratified by receipt of a health-care provider offer or recommendation for seasonal vaccination — Pregnancy Risk Assessment Monitoring System (PRAMS), 29 states and New York City (NYC), 2009–10 influenza season
State
Overall seasonal vaccination coverage Prevalence of provider offer*
Seasonal vaccination coverage by provider offer
Offered Not offered
No. %† 95% CI % 95% CI % 95% CI % 95% CI
Arkansas 1,055 46.7 ±4.1 69.5 ±3.8 59.1 ±4.7 19.4 ±6.2Colorado 1,317 52.8 ±3.8 72.1 ±3.5 66.7 ±4.2 17.5 ±5.7Florida 927 26.1 ±3.3 55.2 ±3.8 40.3 ±5.0 9.1 ±3.4Georgia 614 29.9 ±5.6 56.3 ±6.1 49.4 ±8.2 4.8 ±3.6Hawaii 974 50.3 ±4.0 74.5 ±3.4 63.8 ±4.6 11.3 ±4.8Illinois 1,071 47.1 ±3.2 70.2 ±3.0 61.6 ±3.8 12.8 ±3.8Louisiana 540 39.6 ±5.2 66.4 ±5.1 56.8 ±6.5 6.1 ±4.6Maine 709 64.0 ±4.0 82.3 ±3.2 73.9 ±4.1 17.7 ±7.4Maryland 1,080 46.1 ±4.5 67.0 ±4.4 61.5 ±5.4 15.3 ±5.5Massachusetts 996 67.5 ±4.0 81.0 ±3.3 75.8 ±4.1 32.4 ±9.3Michigan 1,000 44.7 ±3.6 70.7 ±3.2 57.4 ±4.2 14.3 ±4.6Minnesota 917 67.9 ±3.3 86.2 ±2.4 73.5 ±3.3 32.8 ±9.0Mississippi 862 37.2 ±4.0 54.0 ±4.1 60.8 ±5.4 9.5 ±3.6Missouri 973 42.8 ±3.7 68.7 ±3.6 57.1 ±4.5 11.6 ±4.3Nebraska 1,198 65.4 ±3.2 81.3 ±2.5 75.8 ±3.2 20.8 ±6.1New Jersey 1,053 36.8 ±3.2 60.4 ±3.2 54.2 ±4.2 10.2 ±3.2New York 1,587 50.5 ±3.1 70.8 ±2.9 67.4 ±3.5 9.8 ±3.5
Including NYC 894 45.9 ±4.1 65.2 ±4.0 66.2 ±4.8 7.5 ±3.8Excluding NYC 693 54.7 ±4.7 75.9 ±4.2 68.4 ±5.1 12.8 ±6.6
Ohio 829 42.7 ±4.5 74.1 ±4.0 54.2 ±5.2 10.3 ±5.5Oklahoma 1,432 49.1 ±4.4 66.9 ±4.2 64.4 ±5.2 17.9 ±5.9Rhode Island 821 63.7 ±3.9 84.9 ±3.0 70.3 ±4.0 27.8 ± 10South Carolina 676 45.3 ±6.5 69.4 ±6.1 62.1 ±7.4 7.2 ±6.1Tennessee 650 41.2 ±5.1 66.7 ±4.9 56.5 ±6.2 10.1 ±5.7Texas 898 44.9 ±4.1 65.5 ±3.9 65.4 ±4.8 6.6 ±3.5Utah 1,124 57.8 ±3.2 73.2 ±2.8 70.0 ±3.5 24.5 ±5.4Vermont 742 66.3 ±3.4 83.6 ±2.7 74.5 ±3.5 24.3 ±7.7Virginia 318 51.2 ±7.3 73.0 ±6.7 62.0 ±8.2 22.0 ± 12Washington 1,052 53.3 ±4.0 78.2 ±3.4 62.5 ±4.4 20.2 ±7.2West Virginia 1,121 44.2 ±3.6 65.9 ±3.4 60.9 ±4.4 12.2 ±4.1Wyoming 617 55.6 ±4.6 78.6 ±3.8 64.0 ±5.1 25.2 ±8.7Median 973 47.1 70.7 62.1 14.3Minimum 318 26.1 54.0 40.3 4.8Maximum 1,587 67.9 86.2 75.8 32.8
Abbreviation: CI = confidence interval.* Based on response to the question, “At any time during your most recent pregnancy, did a doctor, nurse, or other health-care worker offer you a seasonal flu shot
or tell you to get one?Ӡ Weighted to adjust for complex survey design and nonresponse.
Morbidity and Mortality Weekly Report
MMWR / February 24, 2012 / Vol. 61 / No. 7 117
†† Additional information available at http://www.healthypeople.gov/2020/topicsobjectives2020.
from a provider more often than those who did not, or 2) those who actively seek advice from their provider might misclassify the confirmation from their provider as “received an offer/rec-ommendation.” Finally, the cohort of women available for this analysis, with live births during September 2009–May 2010, might not represent all women who were pregnant during the 2009–10 influenza season.
Based on the findings in this report, influenza vaccina-tion coverage among pregnant women was higher during the 2009–10 influenza season than in past influenza seasons (2,5–7). Although data from the 2010–11 season indicate continuation of these gains, continued education of physicians and pregnant women regarding the risk for severe illness and
pregnancy-related complications from influenza illness and the benefits and safety of influenza vaccination is needed to improve vaccination coverage and reduce the burden of influenza among pregnant women and their infants (8). Partnerships between various stakeholders at the state, federal, and local levels will be necessary to promote increased implementation of evidence-based strategies (9) and ensure that the Healthy People 2020 objective (ID-12.10) of having 80% of pregnant women vac-cinated annually for influenza is achieved.††
TABLE 2. Influenza A (H1N1)pdm09 (pH1N1) vaccination coverage among women with a live birth, overall and stratified by receipt of a health-care provider offer/recommendation for pH1N1 vaccination — Pregnancy Risk Assessment Monitoring System (PRAMS), 29 states and New York City (NYC), 2009–10 influenza season
State
Overall pH1N1 vaccination coverage Prevalence of provider offer*
pH1N1 vaccination coverage by provider offer
Offered Not offered
No. %† 95% CI % 95% CI % 95% CI % 95% CI
Arkansas 1,063 39.2 ±3.9 69.7 ±3.8 54.2 ±4.8 5.6 ±3.8Colorado 1,316 44.2 ±3.8 75.0 ±3.3 57.3 ±4.4 6.3 ±3.6Florida 924 28.7 ±3.5 63.8 ±3.7 43.2 ±4.7 3.3 ±2.3Georgia 617 28.4 ±5.6 61.1 ±6.0 45.7 ±8.0 1.4 ±2.1Hawaii 987 44.9 ±4.0 80.9 ±3.0 54.2 ±4.5 5.8 ±3.8Illinois 1,079 37.7 ±3.1 69.4 ±3.0 51.5 ±3.9 6.9 ±3.0Louisiana 546 28.8 ±4.8 63.3 ±5.1 41.6 ±6.5 6.8 ±4.7Maine 709 58.5 ±4.1 82.6 ±3.2 69.8 ±4.3 4.9 ±4.2Maryland 1,086 41.0 ±4.5 74.1 ±4.0 54.1 ±5.3 3.5 ±3.3Massachusetts 996 57.6 ±4.2 82.8 ±3.3 68.0 ±4.4 8.6 ±6.3Michigan 1,009 37.6 ±3.5 73.3 ±3.1 49.2 ±4.2 5.8 ±3.3Minnesota 919 52.5 ±3.5 82.4 ±2.7 63.3 ±3.7 2.7 ±2.8Mississippi 866 21.9 ±3.4 53.6 ±4.1 38.4 ±5.4 2.9 ±2.0Missouri 983 38.2 ±3.6 72.7 ±3.4 51.8 ±4.5 2.2 ±2.4Nebraska 1,207 56.5 ±3.3 81.6 ±2.5 68.3 ±3.5 4.3 ±3.2New Jersey 1,073 32.2 ±3.0 63.6 ±3.1 49.5 ±4.1 2.0 ±1.3New York 1,617 38.4 ±3.0 71.9 ±2.8 53.1 ±3.7 0.5 ±0.6
Including NYC 917 35.0 ±3.9 69.3 ±3.8 50.1 ±4.9 0.9 ±1.2Excluding NYC 700 41.5 ±4.6 74.5 ±4.2 55.8 ±5.4 0.0 ±0.0
Ohio 833 40.4 ±4.5 77.3 ±3.7 50.2 ±5.2 8.6 ±4.9Oklahoma 1,453 33.0 ±4.2 69.1 ±4.0 45.6 ±5.3 4.7 ±3.3Rhode Island 823 62.9 ±3.9 86.1 ±2.9 72.3 ±3.9 4.7 ±4.6South Carolina 684 40.3 ±6.4 76.3 ±5.5 51.9 ±7.4 2.7 ±3.1Tennessee 659 29.9 ±4.4 65.6 ±4.8 44.9 ±6.0 1.1 ±1.4Texas 909 40.4 ±4.0 71.2 ±3.6 56.1 ±4.8 1.9 ±1.8Utah 1,139 47.2 ±3.2 72.7 ±2.9 62.9 ±3.7 5.7 ±3.0Vermont 744 63.3 ±3.5 88.7 ±2.3 70.6 ±3.5 7.5 ±5.7Virginia 320 41.3 ±7.1 81.9 ±5.5 49.7 ±8.1 5.4 ±7.4Washington 1,054 51.4 ±4.0 82.7 ±3.0 60.9 ±4.4 5.9 ±4.1West Virginia 1,129 36.4 ±3.5 67.2 ±3.4 51.4 ±4.4 5.8 ±2.9Wyoming 628 52.4 ±4.6 80.9 ±3.6 61.0 ±5.0 16.1 ±8.0Median 983 40.4 73.3 53.1 4.9Minimum 320 21.9 53.6 38.4 0.0Maximum 1,617 63.3 88.7 72.3 16.1
Abbreviation: CI = confidence interval.* Based on response to the question, “At any time during your most recent pregnancy, did a doctor, nurse, or other health-care worker offer you an H1N1 flu shot or
tell you to get one?Ӡ Weighted to adjust for complex survey design and nonresponse.
Morbidity and Mortality Weekly Report
118 MMWR / February 24, 2012 / Vol. 61 / No. 7
Acknowledgments
Members of the PRAMS working group: Izza Afgan, MPH, Kathy Perham-Hester, Mary McGehee, PhD, Alyson Shupe, PhD, George Yocher, MS, Cynthia Ulysee, MPH, Yan Li, MD, Emily Roberson, MPH, Theresa Sandidge, MA, Amy Zapata, MPH, Tom Patenaude, Diana Cheng, MD, Emily Lu, MPH, Violanda Grigorescu, MD, Judy Punyko, PhD, Brenda Hughes, MPPA, Venkata Garikapaty, PhD, Brenda Coufal, Lakota Kruse, MD, Eirian Coronado, MA, Anne Radigan-Garcia, Candace Mulready-Ward, MPH, Kathleen Jones-Vessey, MS, Connie Geidenberger, PhD, Alicia Lincoln, MSW, MSPH, Kenneth Rosenberg, MD, Tony Norwood, Sam Viner-Brown, PhD, Mike Smith, MSPH, Rochelle Kingsley, MPH, David Law, PhD, Laurie Baksh, MPH, Peggy Brozicevic, Marilyn Wenner, Linda Lohdefinck, Melissa Baker, MA, Katherine Kvale, PhD, Angi Crotsenberg, MA; members of the CDC PRAMS Team; Mary D. Brantley, MPH, Div of Reproductive Health, National Center for Chronic Disease Prevention and Health Promotion, CDC.
What is already known on this topic?
Since 2004, the American College of Obstetricians and Gynecologists (ACOG) and the Advisory Committee on Immunization Practices (ACIP) have recommended that all pregnant women be given seasonal influenza vaccine during any trimester of pregnancy. Before the 2009–10 influenza season, the prevalence of pregnant women who were vacci-nated against seasonal influenza was low.
What is added by this report?
Among recently pregnant women from 29 states and New York City participating in the Pregnancy Risk Assessment Monitoring System (PRAMS), median state vaccination coverage was 47.1% for seasonal influenza and 40.4% for influenza A (H1N1)pdm09. Overall, women who reported that a health-care provider offered them influenza vaccination or told them to get it during their pregnancy were more likely to be vaccinated than those without an offer or recommendation. Substantial variation among states was observed for prevalence of a provider offer or recommenda-tion during pregnancy and for influenza vaccination coverage.
What are the implications for public health practice?
Influenza vaccination of pregnant women was a focus of public health efforts during the 2009–10 influenza season, with extensive collaborations with obstetricians and gynecologists and mobilization of resources among local, state, federal, and private sector entities. These efforts likely resulted in increased vaccination coverage during the 2009–10 season but did not reach the Healthy People 2020 target of 80% vaccination. Further efforts are needed that recognize the substantial differences in vaccination rates among states and the importance of health-care providers recommending and offering vaccination.
References 1. ACOG Committee on Obstetric Practice. ACOG committee opinion
number 468, October 2011. Influenza vaccination during pregnancy. Obstet Gynecol 2011;116:1006–7.
2. CDC. Prevention and control of influenza with vaccines: recommendations of the Advisory Committee on Immunization Practices (ACIP), 2010. MMWR 2010;59(No. RR-8).
3. Jamieson DJ, Honein MA, Rasmussen SA, et al. H1N1 2009 influenza virus infection during pregnancy in the USA. Lancet 2009;374:451–8.
4. CDC. Use of influenza A (H1N1) 2009 monovalent vaccine: recommendations of the Advisory Committee on Immunization Practices (ACIP), 2009. MMWR 2009;58(No. RR-10).
5. Ahluwalia IB, Jamieson DJ, Rasmussen SA, et al. Correlates of seasonal influenza vaccine among pregnant women in Georgia and Rhode Island. Obstet Gynecol 2010;116:949–55.
6. CDC. Seasonal influenza and 2009 H1N1 vaccination coverage among pregnant women—10 states, 2009–10 season. MMWR 2010;59:1541–5.
7. CDC. Influenza vaccination coverage among pregnant women—United States, 2010–11 influenza season. MMWR 2011;60:1078–82.
8. Moro PL, Broder K, Zheteyeva Y, et al. Adverse events in pregnant women following administration of trivalent inactivated influenza vaccine and live attenuated influenza vaccine in the vaccine adverse event reporting system, 1990–2009. Am J Obstet Gynecol 2011;204:146.e1–7.
9. CDC. Vaccinations to prevent diseases: universally recommended vaccinations. Community Guide systematic reviews. Atlanta, GA: US Department of Health and Human Services, CDC; 2011. Available at http://www.thecommunityguide.org/vaccines/universally/index.html. Accessed February 16, 2012.
Morbidity and Mortality Weekly Report
MMWR / February 24, 2012 / Vol. 61 / No. 7 119
In 2010, the Michigan Fatality Assessment and Control Evaluation program conducted an investigation into the death of a bathtub refinisher who used a methylene chloride–based paint stripping product marketed for use in aircraft mainte-nance. The program identified two earlier, similar deaths in Michigan. Program staff members notified CDC’s National Institute for Occupational Safety and Health (NIOSH), which in turn notified the Occupational Safety and Health Administration (OSHA). In addition to the three deaths, OSHA identified 10 other bathtub refinisher fatalities associ-ated with methylene chloride stripping agents that had been investigated in nine states during 2000–2011. Each death occurred in a residential bathroom with inadequate ventila-tion. Protective equipment, including a respirator, either was not used or was inadequate to protect against methylene chloride vapor, which has been recognized as potentially fatal to furniture strippers and factory workers (1,2) but has not been reported previously as a cause of death among bathtub refinishers. Worker safety agencies, public health agencies, methylene chloride–based stripper manufacturers, and trade organizations should communicate the extreme hazards of using methylene chloride–based stripping products in bathtub refinishing to employers, workers, and consumers. Employers should strongly consider alternative methods of bathtub strip-ping and always ensure worker safety protections that reduce the risk for health hazards to acceptable levels. Employers choosing to use methylene chloride–based stripping products must comply with OSHA’s standard to limit methylene chlo-ride exposures to safe levels.
The Michigan program is one of nine state Fatality Assessment and Control Evaluation programs funded by NIOSH to identify work-related injury deaths, conduct investigations to identify contributory factors, and develop recommendations for preventing deaths in similar situations. The findings of these investigations and subsequent recom-mendations are summarized in narrative reports broadly dis-seminated to employer and worker groups and posted at the NIOSH Fatality Assessment and Control Evaluation website.*
OSHA Investigation OSHA and OSHA-approved State Occupational Safety and
Health Plans† conduct investigations of worker deaths and
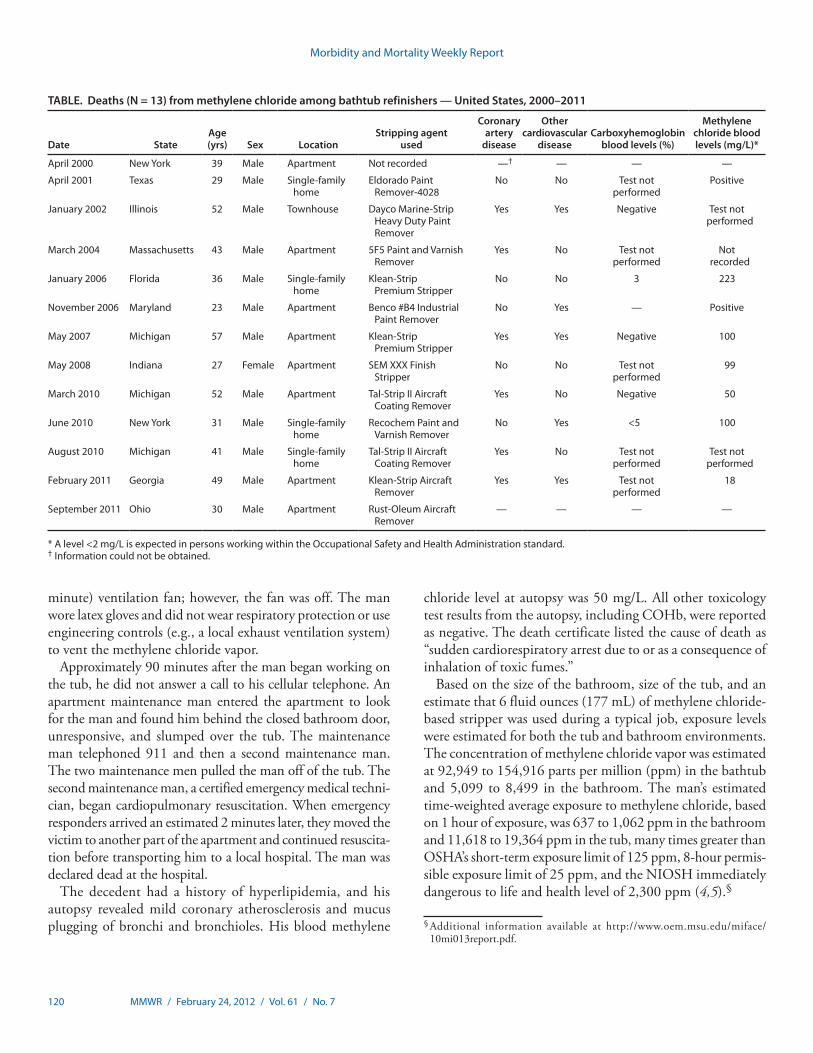
enforce compliance with worker safety and health regulations. A review of the Integrated Management Information System (IMIS), a database for federal and state OSHA investigations, identified 12 methylene chloride–related deaths associated with professional bathtub refinishing operations during 2000–2011. One of the three deaths identified by the Michigan program was not in IMIS because the decedent was self-employed and therefore outside OSHA’s enforcement jurisdiction. The ages of the 13 decedents ranged from 23 to 57 years (median = 39 years) (Table). Twelve were male.
Ten different products were associated with the 13 deaths. Six of the products were marketed for use in the aircraft industry, the rest for use on wood, metal, glass, and masonry. None of the product labels mentioned bathtub refinishing. The percentage of methylene chloride in the products ranged from 60% to 100%.
Toxicology tests from specimens collected at autopsy indi-cated methylene chloride blood levels ranging from 18 to 223 mg/L in the six decedents for whom values were recorded; a level of <2 mg/L is expected in a person working within the OSHA allowable air standard for exposure to methylene chlo-ride fumes (3). Among the five decedents whose carboxyhemo-globin (COHb) levels were tested, levels ranged from absent to mildly elevated (range: zero to 5%) (Table), indicating that carbon monoxide was unlikely to have been the primary cause of death (although the durations of exposure to methylene chloride and receipt of oxygen during resuscitation efforts, two factors that can affect COHb levels, were not known).
Analysis of IMIS data regarding deaths from methylene chloride showed an increase in cases involving bathtub refin-ishing since 2000. During 1976–1999, only two (8%) of all methylene chloride deaths investigated by OSHA were linked to bathtub refinishing. Since 2000, 13 (75%) of the methylene chloride deaths investigated by OSHA occurred during bathtub refinishing. Following is an illustrative case report.
Case Report In March 2010, the co-owner of a Michigan-based bathtub
refinishing company, aged 52 years, was refinishing a bathtub in an apartment bathroom that was approximately 5 feet by 8 feet (1.5 meters by 2.4 meters) with an 8-foot (2.4-meter) ceiling. He was using an aircraft paint stripper product that contained 60%–100% methylene chloride. The bathroom ceiling had a 50 cubic feet per minute (1.4 cubic meters per
Fatal Exposure to Methylene Chloride Among Bathtub Refinishers — United States, 2000–2011
* Additional information available at http://www.cdc.gov/niosh/face. † Additional information available at http://www.osha.gov/dcsp/osp/index.html.
Morbidity and Mortality Weekly Report
120 MMWR / February 24, 2012 / Vol. 61 / No. 7
minute) ventilation fan; however, the fan was off. The man wore latex gloves and did not wear respiratory protection or use engineering controls (e.g., a local exhaust ventilation system) to vent the methylene chloride vapor.
Approximately 90 minutes after the man began working on the tub, he did not answer a call to his cellular telephone. An apartment maintenance man entered the apartment to look for the man and found him behind the closed bathroom door, unresponsive, and slumped over the tub. The maintenance man telephoned 911 and then a second maintenance man. The two maintenance men pulled the man off of the tub. The second maintenance man, a certified emergency medical techni-cian, began cardiopulmonary resuscitation. When emergency responders arrived an estimated 2 minutes later, they moved the victim to another part of the apartment and continued resuscita-tion before transporting him to a local hospital. The man was declared dead at the hospital.
The decedent had a history of hyperlipidemia, and his autopsy revealed mild coronary atherosclerosis and mucus plugging of bronchi and bronchioles. His blood methylene
chloride level at autopsy was 50 mg/L. All other toxicology test results from the autopsy, including COHb, were reported as negative. The death certificate listed the cause of death as “sudden cardiorespiratory arrest due to or as a consequence of inhalation of toxic fumes.”
Based on the size of the bathroom, size of the tub, and an estimate that 6 fluid ounces (177 mL) of methylene chloride-based stripper was used during a typical job, exposure levels were estimated for both the tub and bathroom environments. The concentration of methylene chloride vapor was estimated at 92,949 to 154,916 parts per million (ppm) in the bathtub and 5,099 to 8,499 in the bathroom. The man’s estimated time-weighted average exposure to methylene chloride, based on 1 hour of exposure, was 637 to 1,062 ppm in the bathroom and 11,618 to 19,364 ppm in the tub, many times greater than OSHA’s short-term exposure limit of 125 ppm, 8-hour permis-sible exposure limit of 25 ppm, and the NIOSH immediately dangerous to life and health level of 2,300 ppm (4,5).§
TABLE. Deaths (N = 13) from methylene chloride among bathtub refinishers — United States, 2000–2011
Date StateAge (yrs) Sex Location
Stripping agent used
Coronary artery
disease
Other cardiovascular
diseaseCarboxyhemoglobin
blood levels (%)
Methylene chloride blood levels (mg/L)*
April 2000 New York 39 Male Apartment Not recorded —† — — —
April 2001 Texas 29 Male Single-family home
Eldorado Paint Remover-4028
No No Test not performed
Positive
January 2002 Illinois 52 Male Townhouse Dayco Marine-Strip Heavy Duty Paint Remover
Yes Yes Negative Test not performed
March 2004 Massachusetts 43 Male Apartment 5F5 Paint and Varnish Remover
Yes No Test not performed
Not recorded
January 2006 Florida 36 Male Single-family home
Klean-Strip Premium Stripper
No No 3 223
November 2006 Maryland 23 Male Apartment Benco #B4 Industrial Paint Remover
No Yes — Positive
May 2007 Michigan 57 Male Apartment Klean-Strip Premium Stripper
Yes Yes Negative 100
May 2008 Indiana 27 Female Apartment SEM XXX Finish Stripper
No No Test not performed
99
March 2010 Michigan 52 Male Apartment Tal-Strip II Aircraft Coating Remover
Yes No Negative 50
June 2010 New York 31 Male Single-family home
Recochem Paint and Varnish Remover
No Yes <5 100
August 2010 Michigan 41 Male Single-family home
Tal-Strip II Aircraft Coating Remover
Yes No Test not performed
Test not performed
February 2011 Georgia 49 Male Apartment Klean-Strip Aircraft Remover
Yes Yes Test not performed
18
September 2011 Ohio 30 Male Apartment Rust-Oleum Aircraft Remover
— — — —
* A level <2 mg/L is expected in persons working within the Occupational Safety and Health Administration standard.† Information could not be obtained.
§ Additional information available at http://www.oem.msu.edu/miface/ 10mi013report.pdf.
Morbidity and Mortality Weekly Report
MMWR / February 24, 2012 / Vol. 61 / No. 7 121
Reported by
Debra Chester, MS, Kenneth D. Rosenman, MD, Div of Occupational and Environmental Medicine, Michigan State Univ. George R. Grimes, MD, Uniformed Svcs Univ of the Health Sciences, Bethesda, Maryland. Kathleen Fagan, MD, Occupational Safety and Health Admin. Dawn N. Castillo, MPH, Div of Safety Research, National Institute for Occupational Safety and Health, CDC. Corresponding contributor: Kenneth D. Rosenman, [email protected], 517-353-1846.
Editorial Note
Methylene chloride is a highly volatile, colorless, toxic chemi-cal that is widely used as a degreaser, process catalyst, and paint remover (6). Because methylene chloride vapors are heavier than air, in the case described in this report they likely remained in the bathtub after application. To use products containing methylene chloride safely, work areas must be well-ventilated, and when levels of methylene chloride exceed exposure limits even after implementation of engineering and work practice controls, workers must use respiratory protective equipment, such as tight-fitting, full-face, supplied-air respirators (4). OSHA’s standard for methylene chloride, which was promulgated in 1997, covers all occupational exposures to the chemical (e.g., general industry, shipyard employment, and construction). The standard mandates that air monitoring, medical surveillance, hazard communication, and personal protective equipment be in place where methylene chloride is used.
Methylene chloride primarily is absorbed via inhalation, although it also is absorbed effectively by intact skin. To protect against skin absorption, butyl rubber or polyvinyl alcohol gloves must be worn; latex gloves like those used in the case described in this report will not protect against skin absorption. Methylene chloride is metabolized to formaldehyde and carbon monoxide (6,7) and is categorized as a carcinogen (8).
COHb levels in the blood as great as 10%–12% can result from methylene chloride exposure (2,6). COHb levels in this range can cause headache, nausea, or dizziness. Arrhythmias have been reported at COHb levels as low as 4%–6%, angina at levels as low as 3.9%, and electrocardiographic changes at levels as low as 2.0% (6,9). In the 13 deaths analyzed in this report, the data indicate that carbon monoxide was not likely the cause of death. Because methylene chloride, like many solvents, acts as a central nervous system depressant causing narcosis at high concentrations, the decedents likely lost consciousness and died from respiratory depression. Consistent with this conclusion were the high methylene chloride blood levels at the time of autopsy found in the six persons whose methylene chloride blood levels were quantified (Table). However, because eight of the 13 decedents had cardiac disease (six with coronary artery disease and five with a cardiomyopathy or valvular disease), the arrhythmogenic effect of the methylene chloride itself or of its metabolite, carbon monoxide, might have been a contributing factor in their deaths.
Methylene chloride–based stripping products usually are applied with a paint brush or aerosol can. The products cause the bathtub coating to pucker, allowing it to be easily scraped away so that a new finish can be applied. In a small, enclosed bathroom, it is unlikely that a methylene chloride stripping agent can be used safely. Alternative methods of bathtub strip-ping, such as sanding, should be used. Alternative chemicals that could be used include petroleum distillates, acetate, min-eral spirits, caustic paste, and acid-based formulas. However, these other methods and chemicals have their own hazards, and all employers and employees should be well aware of their risks (10). Potential worker exposures should be evaluated to determine whether the work process is safe and to ensure that workers are protected.
The findings in this report are subject to at least three limita-tions. First, the number of deaths identified by OSHA likely is an underestimate because the IMIS database does not include all occupational deaths and injuries (e.g., those of self-employed workers). Second, the data examined in this report are limited to workers and do not address potential risks to consumers who have access to some of these products. Finally, additional deaths
What is already known on this topic?
Methylene chloride is a volatile, toxic, organic solvent used in cleaning and paint stripping and shown to be potentially fatal to furniture strippers and factory workers unless used in strict compliance with safety precautions.
What is added by this report?
Methylene chloride–based paint stripping agents used in bathtub refinishing have caused at least 13 deaths in the United States since 2000 among professional bathtub refinish-ers. Because of inadequate ventilation, safe use of a methylene chloride stripping agent in a small bathroom is unlikely.
What are the implications for public health practice?
Worker safety agencies, public health agencies, manufacturers of methylene chloride containing products, and trade organiza-tions should clearly communicate to employers, workers, and the general public the extreme hazards of using methylene chloride–based stripping products in bathtub refinishing. Safer methods of bathtub stripping should be recommended.
Morbidity and Mortality Weekly Report
122 MMWR / February 24, 2012 / Vol. 61 / No. 7
among bathtub refinishers might have been ascribed to heart disease when they were actually caused by methylene chloride.
Both OSHA and NIOSH are issuing communications regarding the risk for death from bathtub refinishing using methylene chloride strippers and the availability of safer prod-ucts. The Michigan program distributed an investigation report and a hazard alert (10) after identifying bathtub refinishers in Michigan through Internet directories.
Methylene chloride also presents a risk to persons among the general public who seek to do their own bathtub refinish-ing. A review of the OSHA IMIS system, the Internet, and hardware stores, found 42 stripping products, 26 (62%) of which are readily available on the Internet or at local hardware stores. Many of these stripping products contain 60%–90% methylene chloride. Many Internet sites promote do-it-yourself bathtub stripping, and no state or federal restrictions exist on the use of methylene chloride stripping agents. The widespread availability of these products and their effectiveness puts both professional bathtub refinishers and do-it-yourselfers at risk. Public health agencies, worker safety agencies, manufactur-ers, and trade organizations should clearly communicate the extreme hazard posed by using methylene chloride–based stripping products in bathtub refinishing.
References 1. Hall AH, Rumack BH. Methylene chloride exposure in furniture-stripping
shops: ventilation and respirator practices. J Occup Med 1990;32:33–7. 2. Mahmud M, Kales SN. Methylene chloride poisoning in a cabinet
worker. Environ Health Perspect 1999;107:769–72. 3. Agency for Toxic Substances and Disease Registry. Case studies in
environmental medicine: methylene chloride. Atlanta, GA: US Department of Health and Human Services, Public Health Service, Agency for Toxic Substances and Disease Registry; 1990.
4. Occupational Safety and Health Administration. Occupational safety and health standards: methylene chloride. Washington, DC: US Department of Labor, Occupational Safety and Health Administration. Available at http://www.osha.gov/pls/oshaweb/owadisp.show_document?p_table=standards&p_id=10094. Accessed February 17, 2012.
5. National Institute for Occupational Safety and Health. Pocket guide to chemical hazards. Cincinnati, OH: US Department of Health and Human Services, CDC, National Institute for Occupational Safety and Health; 1997.
6. Agency for Toxic Substances and Disease Registry. Toxicological profile for methylene chloride (update): draft for public comment. Atlanta, GA: US Department of Health and Human Services, Public Health Service, Agency for Toxic Substances and Disease Registry; 1998.
7. DiVincenzo GD, Kaplan CJ. Uptake, metabolism and elimination of methylene chloride vapor by humans. Toxicol AppI Pharmacol 1981;59:130–40.
8. National Toxicology Program. Report on carcinogens. 12th ed. Research Triangle Park, NC: US Department of Health and Human Services, Public Health Service, National Toxicology Program; 2011. Available at http://ntp.niehs.nih.gov/ntp/roc/twelfth/roc12.pdf. Accessed February 17, 2012.
9. Rosenman KD. Cardiovascular disorders. In: Levy BS, Wegman DH, Baron SL, Sokas RK, eds. Occupational and environmental health. 6th ed. New York, NY: Oxford University Press; 2011:492–504.
10. Michigan Fatality Assessment and Control Evaluation. Methylene chloride causes death of 3 MI bathtub refinishers. East Lansing, MI: Michigan State University; 2011. Available at http://www.oem.msu.edu/userfiles/bathtubrefinishingha14.pdf. Accessed February 17, 2012.
Morbidity and Mortality Weekly Report
MMWR / February 24, 2012 / Vol. 61 / No. 7 123
This report summarizes U.S. influenza activity* since the beginning of the 2011–12 influenza season (October 2, 2011) and updates the previous report (1). From October through early January, influenza activity remained low throughout the United States. Activity increased slightly in early February 2012, but remains low. Influenza A (H1N1)pdm09 (pH1N1), influenza A (H3N2), and influenza B viruses all have been identified thus far this influenza season, and the majority of viruses in circulation are antigenically similar to strains included in the 2011–12 vaccine.
Viral Surveillance During October 2, 2011–February 11, 2012, approximately
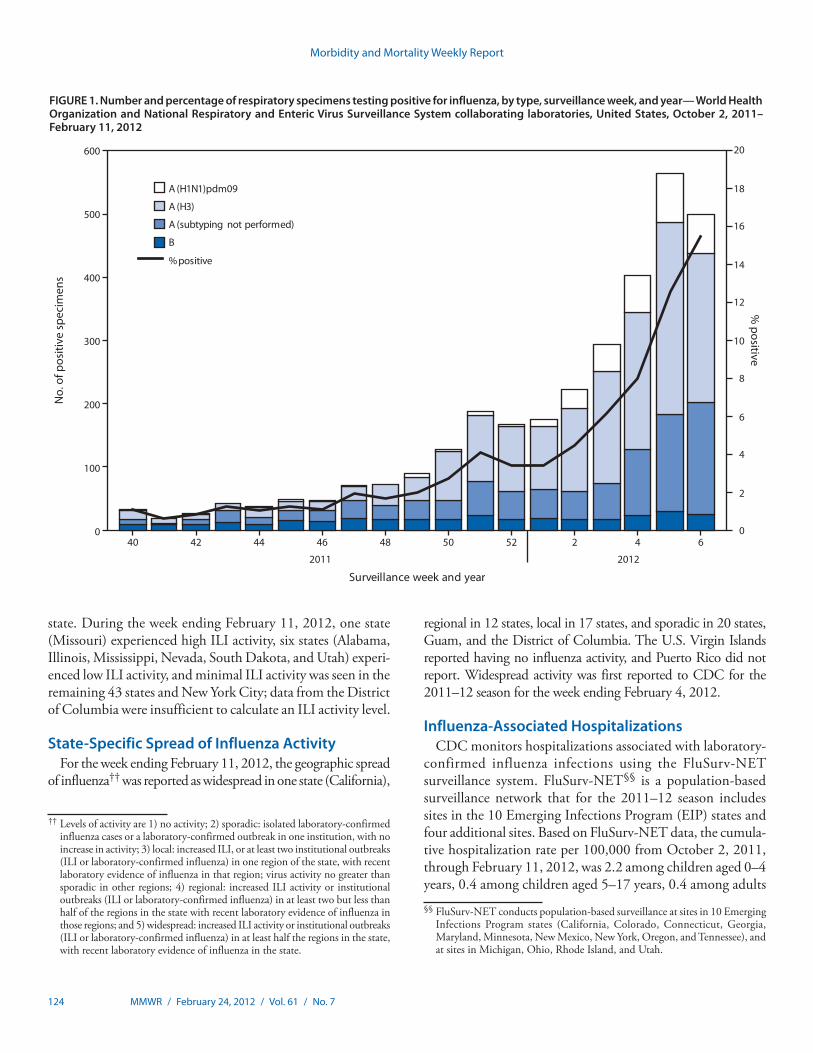
140 World Health Organization (WHO) and National Respiratory and Enteric Virus Surveillance System (NREVSS) collaborating laboratories in the United States tested 78,783 respiratory specimens for influenza viruses; 3,120 (4%) were positive for influenza (Figure 1). Of these, 2,807 (90%) were influenza A viruses, and 313 (10%) were influenza B viruses. A total of 1,934 (69%) of the influenza A viruses were subtyped; 1,624 (84%) were influenza A (H3N2) viruses, and 310 (16%) were pH1N1 viruses.
Influenza virus-positive test results have been reported from all 50 states. Influenza activity slowly began to increase in December 2011. Although influenza activity is monitored in many ways, influenza season is considered to have begun when >10% of respiratory specimens tested by participating laboratories are positive for influenza. The weekly percentage of specimens testing positive for influenza did not exceed 10% until the week ending February 4, 2012. During the week ending February 11, 2012, 15% of specimens tested positive for influenza.
Influenza A (H3N2) viruses have predominated this sea-son, although pH1N1 and influenza B viruses also have been detected. The relative proportion of each type or subtype has
varied by date and U.S. Department of Health and Human Services (HHS) region.† Although influenza A (H3N2) viruses have been reported more frequently throughout the season, pH1N1 viruses have been increasing in recent weeks, especially in Regions 4, 6, and 9 (southern regions).
Outpatient Illness Surveillance Since October 2, 2011, the weekly percentage of outpatient
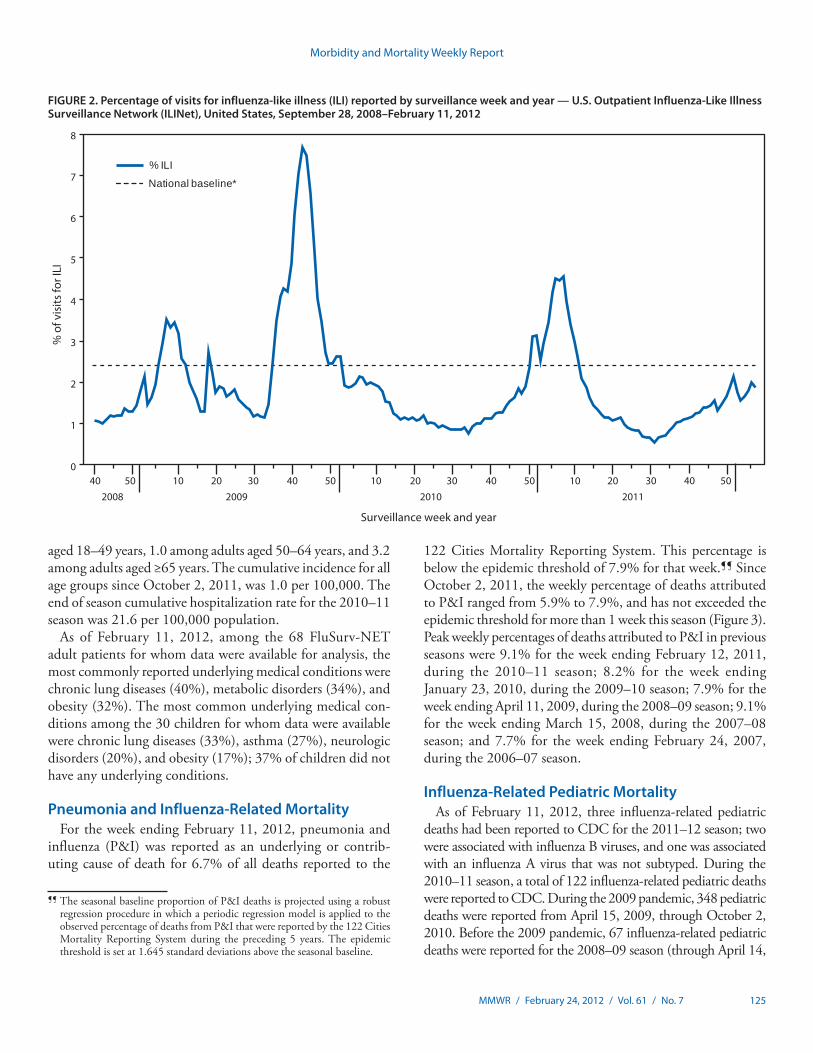
visits for influenza-like illness (ILI)§ reported by approximately 1,800 U.S. Outpatient ILI Surveillance Network (ILINet) pro-viders in 50 states, New York City, Chicago, and the District of Columbia that comprise ILINet, has ranged from 1.1% to 2.1%. The percentage has not exceeded the national baseline of 2.4% (Figure 2). Peak weekly percentages of outpatient visits for ILI ranged from 3.1% to 7.6% from the 1997–98 through 2010–11 seasons, excluding the 2009–10 pandemic. On a regional level,¶ the percentage of outpatient visits for ILI ranged from 0.7% to 3.0% during the week ending February 11, 2012. As of the week ending February 11, 2012, Region 7 (Midwest) was the only HHS region with sustained increases in ILI activity above region-specific baseline levels for ≥2 consecutive weeks since October 2, 2011. Data collected in ILINet are used to produce a measure of ILI activity** by
Update: Influenza Activity — United States, October 2, 2011–February 11, 2012
* The CDC influenza surveillance system collects five categories of information from eight data sources: 1) viral surveillance (World Health Organization collaborating U.S. laboratories, the National Respiratory and Enteric Virus Surveillance System, and novel influenza A virus case reporting), 2) outpatient illness surveillance (U.S. Outpatient ILI Surveillance Network), 3) mortality (122 Cities Mortality Reporting System and influenza-associated pediatric mortality reports), 4) hospitalizations (FluSurv-NET), and 5) summary of geographic spread of influenza (state and territorial epidemiologist reports).
† The 10 regions include the following states and territories: Region 1: Connecticut, Maine, Massachusetts, New Hampshire, Rhode Island, and Vermont; Region 2: New Jersey, New York, Puerto Rico, and the U.S. Virgin Islands; Region 3: Delaware, District of Columbia, Maryland, Pennsylvania, Virginia, and West Virginia; Region 4: Alabama, Florida, Georgia, Kentucky, Mississippi, North Carolina, South Carolina, and Tennessee; Region 5: Illinois, Indiana, Michigan, Minnesota, Ohio, and Wisconsin; Region 6: Arkansas, Louisiana, New Mexico, Oklahoma, and Texas; Region 7: Iowa, Kansas, Missouri, and Nebraska; Region 8: Colorado, Montana, North Dakota, South Dakota, Utah, and Wyoming; Region 9: Arizona, California, Hawaii, Nevada, American Samoa, Commonwealth of the Northern Mariana Islands, Federated States of Micronesia, Guam, Marshall Islands, and Republic of Palau; Region 10: Alaska, Idaho, Oregon, and Washington.
§ Defined as a temperature of ≥100.0°F (≥37.8°C), oral or equivalent, and cough or sore throat, in the absence of a known cause other than influenza.
¶ The national and regional baselines are the mean percentage of visits for ILI during noninfluenza weeks for the previous three seasons plus two standard deviations. A noninfluenza week is a week during which <10% of specimens tested positive for influenza. National and regional percentages of patient visits for ILI are weighted on the basis of state population. Use of the national baseline for regional data is not appropriate.
** Activity levels are based on the percentage of outpatient visits in a state attributed to ILI and are compared with the average percentage of ILI visits that occur during spring and fall weeks with little or no influenza virus circulation. Activity levels range from minimal, which would correspond to ILI activity from outpatient clinics being at or below the average, to high, which would correspond to ILI activity from outpatient clinics being much higher than the average. Because the clinical definition of ILI is general, not all ILI is caused by influenza; however, when combined with laboratory data, the information on ILI activity provides a clearer picture of influenza activity in the United States.
Morbidity and Mortality Weekly Report
124 MMWR / February 24, 2012 / Vol. 61 / No. 7
state. During the week ending February 11, 2012, one state (Missouri) experienced high ILI activity, six states (Alabama, Illinois, Mississippi, Nevada, South Dakota, and Utah) experi-enced low ILI activity, and minimal ILI activity was seen in the remaining 43 states and New York City; data from the District of Columbia were insufficient to calculate an ILI activity level.
State-Specific Spread of Influenza Activity For the week ending February 11, 2012, the geographic spread
of influenza†† was reported as widespread in one state (California),
regional in 12 states, local in 17 states, and sporadic in 20 states, Guam, and the District of Columbia. The U.S. Virgin Islands reported having no influenza activity, and Puerto Rico did not report. Widespread activity was first reported to CDC for the 2011–12 season for the week ending February 4, 2012.
Influenza-Associated Hospitalizations CDC monitors hospitalizations associated with laboratory-
confirmed influenza infections using the FluSurv-NET surveillance system. FluSurv-NET§§ is a population-based surveillance network that for the 2011–12 season includes sites in the 10 Emerging Infections Program (EIP) states and four additional sites. Based on FluSurv-NET data, the cumula-tive hospitalization rate per 100,000 from October 2, 2011, through February 11, 2012, was 2.2 among children aged 0–4 years, 0.4 among children aged 5–17 years, 0.4 among adults
Surveillance week and year
A (H1N1)pdm09
A (H3)
A (subtyping not performed)
B
% positive
% positive
No.
of p
ositi
ve s
peci
men
s
2011 2012
0
4
8
12
16
20
2
6
10
14
18
0
100
200
300
400
500
600
40 42 44 46 48 50 52 2 4 6
FIGURE 1. Number and percentage of respiratory specimens testing positive for influenza, by type, surveillance week, and year— World Health Organization and National Respiratory and Enteric Virus Surveillance System collaborating laboratories, United States, October 2, 2011–February 11, 2012
†† Levels of activity are 1) no activity; 2) sporadic: isolated laboratory-confirmed influenza cases or a laboratory-confirmed outbreak in one institution, with no increase in activity; 3) local: increased ILI, or at least two institutional outbreaks (ILI or laboratory-confirmed influenza) in one region of the state, with recent laboratory evidence of influenza in that region; virus activity no greater than sporadic in other regions; 4) regional: increased ILI activity or institutional outbreaks (ILI or laboratory-confirmed influenza) in at least two but less than half of the regions in the state with recent laboratory evidence of influenza in those regions; and 5) widespread: increased ILI activity or institutional outbreaks (ILI or laboratory-confirmed influenza) in at least half the regions in the state, with recent laboratory evidence of influenza in the state.
§§ FluSurv-NET conducts population-based surveillance at sites in 10 Emerging Infections Program states (California, Colorado, Connecticut, Georgia, Maryland, Minnesota, New Mexico, New York, Oregon, and Tennessee), and at sites in Michigan, Ohio, Rhode Island, and Utah.
Morbidity and Mortality Weekly Report
MMWR / February 24, 2012 / Vol. 61 / No. 7 125
aged 18–49 years, 1.0 among adults aged 50–64 years, and 3.2 among adults aged ≥65 years. The cumulative incidence for all age groups since October 2, 2011, was 1.0 per 100,000. The end of season cumulative hospitalization rate for the 2010–11 season was 21.6 per 100,000 population.
As of February 11, 2012, among the 68 FluSurv-NET adult patients for whom data were available for analysis, the most commonly reported underlying medical conditions were chronic lung diseases (40%), metabolic disorders (34%), and obesity (32%). The most common underlying medical con-ditions among the 30 children for whom data were available were chronic lung diseases (33%), asthma (27%), neurologic disorders (20%), and obesity (17%); 37% of children did not have any underlying conditions.
Pneumonia and Influenza-Related Mortality For the week ending February 11, 2012, pneumonia and
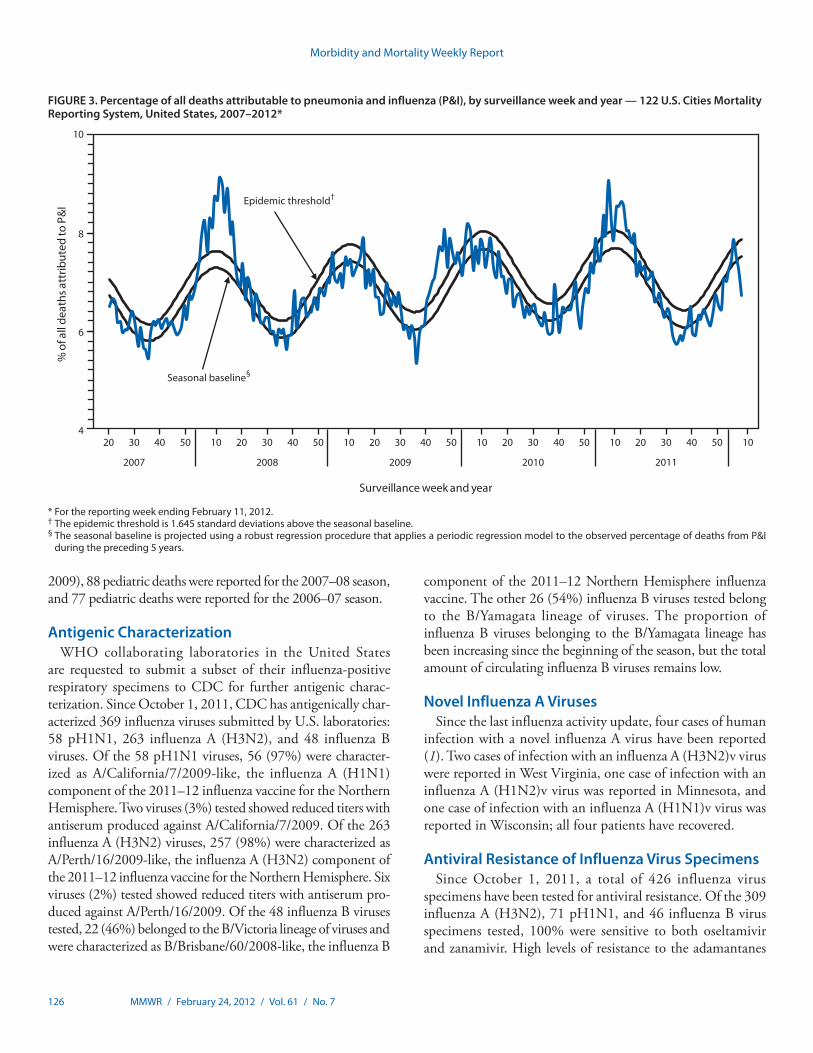
influenza (P&I) was reported as an underlying or contrib-uting cause of death for 6.7% of all deaths reported to the
122 Cities Mortality Reporting System. This percentage is below the epidemic threshold of 7.9% for that week.¶¶ Since October 2, 2011, the weekly percentage of deaths attributed to P&I ranged from 5.9% to 7.9%, and has not exceeded the epidemic threshold for more than 1 week this season (Figure 3). Peak weekly percentages of deaths attributed to P&I in previous seasons were 9.1% for the week ending February 12, 2011, during the 2010–11 season; 8.2% for the week ending January 23, 2010, during the 2009–10 season; 7.9% for the week ending April 11, 2009, during the 2008–09 season; 9.1% for the week ending March 15, 2008, during the 2007–08 season; and 7.7% for the week ending February 24, 2007, during the 2006–07 season.
Influenza-Related Pediatric Mortality As of February 11, 2012, three influenza-related pediatric
deaths had been reported to CDC for the 2011–12 season; two were associated with influenza B viruses, and one was associated with an influenza A virus that was not subtyped. During the 2010–11 season, a total of 122 influenza-related pediatric deaths were reported to CDC. During the 2009 pandemic, 348 pediatric deaths were reported from April 15, 2009, through October 2, 2010. Before the 2009 pandemic, 67 influenza-related pediatric deaths were reported for the 2008–09 season (through April 14,
¶¶ The seasonal baseline proportion of P&I deaths is projected using a robust regression procedure in which a periodic regression model is applied to the observed percentage of deaths from P&I that were reported by the 122 Cities Mortality Reporting System during the preceding 5 years. The epidemic threshold is set at 1.645 standard deviations above the seasonal baseline.
0
1
2
3
4
5
6
7
8
% o
f vis
its fo
r ILI
Surveillance week and year
% ILI
National baseline*
40
2008 2009 2010
5040 50 10 20 30 40 50 10 20 30 40 50 10
2011
20 30
FIGURE 2. Percentage of visits for influenza-like illness (ILI) reported by surveillance week and year — U.S. Outpatient Influenza-Like Illness Surveillance Network (ILINet), United States, September 28, 2008–February 11, 2012
Morbidity and Mortality Weekly Report
126 MMWR / February 24, 2012 / Vol. 61 / No. 7
2009), 88 pediatric deaths were reported for the 2007–08 season, and 77 pediatric deaths were reported for the 2006–07 season.
Antigenic Characterization WHO collaborating laboratories in the United States
are requested to submit a subset of their influenza-positive respiratory specimens to CDC for further antigenic charac-terization. Since October 1, 2011, CDC has antigenically char-acterized 369 influenza viruses submitted by U.S. laboratories: 58 pH1N1, 263 influenza A (H3N2), and 48 influenza B viruses. Of the 58 pH1N1 viruses, 56 (97%) were character-ized as A/California/7/2009-like, the influenza A (H1N1) component of the 2011–12 influenza vaccine for the Northern Hemisphere. Two viruses (3%) tested showed reduced titers with antiserum produced against A/California/7/2009. Of the 263 influenza A (H3N2) viruses, 257 (98%) were characterized as A/Perth/16/2009-like, the influenza A (H3N2) component of the 2011–12 influenza vaccine for the Northern Hemisphere. Six viruses (2%) tested showed reduced titers with antiserum pro-duced against A/Perth/16/2009. Of the 48 influenza B viruses tested, 22 (46%) belonged to the B/Victoria lineage of viruses and were characterized as B/Brisbane/60/2008-like, the influenza B
component of the 2011–12 Northern Hemisphere influenza vaccine. The other 26 (54%) influenza B viruses tested belong to the B/Yamagata lineage of viruses. The proportion of influenza B viruses belonging to the B/Yamagata lineage has been increasing since the beginning of the season, but the total amount of circulating influenza B viruses remains low.
Novel Influenza A Viruses Since the last influenza activity update, four cases of human
infection with a novel influenza A virus have been reported (1). Two cases of infection with an influenza A (H3N2)v virus were reported in West Virginia, one case of infection with an influenza A (H1N2)v virus was reported in Minnesota, and one case of infection with an influenza A (H1N1)v virus was reported in Wisconsin; all four patients have recovered.
Antiviral Resistance of Influenza Virus Specimens Since October 1, 2011, a total of 426 influenza virus
specimens have been tested for antiviral resistance. Of the 309 influenza A (H3N2), 71 pH1N1, and 46 influenza B virus specimens tested, 100% were sensitive to both oseltamivir and zanamivir. High levels of resistance to the adamantanes
4
6
8
10
% o
f all
deat
hs a
ttrib
uted
to P
&I
Surveillance week and year
Epidemic threshold†
Seasonal baseline§
2007 2008 2009 20112010
20 30 40 50 10 20 30 40 50 10 20 30 40 50 10 20 30 40 50 10 20 30 40 50 10
* For the reporting week ending February 11, 2012. † The epidemic threshold is 1.645 standard deviations above the seasonal baseline. § The seasonal baseline is projected using a robust regression procedure that applies a periodic regression model to the observed percentage of deaths from P&I
during the preceding 5 years.
FIGURE 3. Percentage of all deaths attributable to pneumonia and influenza (P&I), by surveillance week and year — 122 U.S. Cities Mortality Reporting System, United States, 2007–2012*
Morbidity and Mortality Weekly Report
MMWR / February 24, 2012 / Vol. 61 / No. 7 127
What is already known on this topic?
Percentages of outpatient visits for influenza-like illness and rates of influenza-associated hospitalizations have remained low this season. Influenza A (H3N2), influenza A (H1N1)pdm09, and influenza B viruses have cocirculated this season. Most circulating influenza viruses are closely related to components included in the 2011–12 influenza vaccine.
What is added by this report?
The percentage of respiratory specimens reported by CDC that have tested positive for influenza started to increase in February 2012. Rates of influenza-associated hospitalization this season have been highest in children aged 0–4 years and adults aged ≥65 years, as observed in the 2010–11 season.
What are the implications for public health practice?
Health-care providers should continue to offer vaccine to all unvaccinated persons aged ≥6 months throughout the influenza season and provide timely empiric antiviral treatment for patients with severe, complicated, or progressive influenza illness, or at higher risk for influenza complications.
(amantadine and rimantadine) persist among pH1N1 and influenza A (H3N2) viruses currently circulating.
Reported by
World Health Organization Collaborating Center for Surveillance, Epidemiology, and Control of Influenza. Lynnette Brammer, MPH, Scott Epperson, MPH, Krista Kniss, MPH, Desiree Mustaquim, MPH, Amber Bishop, MPH, Rosaline Dhara, MPH, Michael Jhung, MD, Lenee Blanton, MPH, Teresa Wallis, MS, Sandra S. Chaves, MD, Lyn Finelli, DrPH, Larisa Gubareva, PhD, Joseph Bresee, MD, Alexander Klimov, PhD, Nancy Cox, PhD, Influenza Div, National Center for Immunization and Respiratory Diseases; Adena Greenbaum, MD, EIS Officer, CDC. Corresponding contributor: Adena Greenbaum, [email protected], 404-639-3747.
Editorial Note
Influenza activity, as measured across all CDC influenza surveillance systems in the United States, has remained low this season, but began to increase in early February 2012. Although the timing of influenza activity is not predictable, peak activity in the United States most commonly occurs in February; however, substantial activity can occur as late as May (2). Vaccination remains the most effective method to prevent influenza and its complications. Health-care providers should continue to offer vaccine to all unvaccinated persons aged ≥6 months throughout the influenza season.
Influenza A (H3N2), pH1N1, and influenza B viruses have cocirculated this influenza season, but influenza A (H3N2) has predominated overall. Thus far this season, the majority of pH1N1 and influenza A (H3N2) viruses in circulation that were tested are closely related to components included in the 2011–12 Northern Hemisphere influenza vaccine. Although the proportion of influenza B viruses in the Yamagata lineage characterized by CDC, which is not included in the 2011–12 influenza vaccine, is increasing, it makes up a small proportion of circulating viruses. It is too early in the influenza season to determine how well the circulating influenza viruses will match the influenza vaccine.
Since August 2011, CDC has received reports of 14 U.S. cases of human infection with novel influenza A viruses from seven states, including 12 cases of influenza A (H3N2)v infection. Although limited human-to-human transmission was identified among some cases of influenza A (H3N2)v, no cases of novel influenza A have been identified in the United States since November 2011 (3,4).
One notable aspect of this influenza season to date has been the late increase in influenza activity. Influenza season is considered to have begun when >10% of respiratory specimens test positive for influenza. In the past 29 years, the 1987–88 season, in which influenza A (H3N2) was also predominant, is the only other season
in which the percentage of respiratory specimens testing positive for influenza first exceeded the 10% threshold as late as February.
Efforts to vaccinate should be ongoing while activity is still low. According to 2011 recommendations of the Advisory Committee on Immunization Practices (ACIP), health-care providers should offer influenza vaccination to all persons aged ≥6 months throughout the influenza season (5). Although influenza vaccine strains for the 2011–12 season are the same as those in the 2010–11 vaccine, annual vaccination is recom-mended, even for those who were vaccinated last season. All children aged 6 months–8 years who receive a seasonal influenza vaccine for the first time should receive 2 doses. In the past, ACIP recommended that children who received only 1 dose of a seasonal influenza vaccine in the first influenza season that they were vaccinated should receive 2 doses in the following influenza season. However, because the 2011–12 vaccine strains are the same as the 2010–11 vaccine, children in this age group who received at least 1 dose of the 2010–11 seasonal vaccine will require only 1 dose of the 2011–12 vaccine (5).
Higher overall and age-specific rates of hospitalization often are observed during influenza A (H3N2)–predominant seasons (6). Based on FluSurv-NET surveillance data thus far, rates of hospitalization among patients with laboratory-confirmed influ-enza are low compared with previous seasons, but increasing.
Antiviral medications continue to be an important adjunct to vaccination for reducing the health impact of influenza. On January 21, 2011, new ACIP recommendations on use of antiviral agents for treatment and chemoprophylaxis of influ-enza were released (7). Antiviral treatment is recommended as soon as possible for patients with confirmed or suspected
Morbidity and Mortality Weekly Report
128 MMWR / February 24, 2012 / Vol. 61 / No. 7
influenza who have severe, complicated, or progressive illness; who require hospitalization; or who are at higher risk for influenza complications (7–10). Antiviral treatment also may be considered for outpatients with confirmed or suspected influenza who do not have known risk factors for severe illness, if treatment can be initiated within 48 hours of illness onset. Recommended antiviral medications include oseltamivir and zanamivir. All samples tested for the 2011–12 season since October 1, 2011, have been susceptible to these medications. Amantadine and rimantadine should not be used because of the high levels of resistance to these drugs among circulating influenza A viruses (7). Influenza B viruses are not susceptible to amantadine or rimantadine.
Influenza surveillance reports for the United States are posted online weekly during October–May and are available at http://www.cdc.gov/flu/weekly/fluactivitysurv.htm. Additional information regarding influenza viruses, influenza surveillance, influenza vaccine, influenza antiviral medications, and novel influenza A infections in humans is available at http://www.cdc.gov/flu.
Acknowledgments
Participating state and territorial health departments and state public health laboratories; World Health Organization collaborating laboratories; National Respiratory and Enteric Virus Surveillance System collaborating laboratories; US Outpatient ILI Surveillance Network; FluSurv-NET; Influenza Associated Pediatric Mortality Surveillance System; 122 Cities Mortality Reporting System.
References 1. CDC. Update: influenza activity—United States, October 2–November
26, 2011.MMWR 2011;60:1646–9. 2. CDC. Prevention and control of influenza with vaccines: recommendations
of the Advisory Committee on Immunization Practices (ACIP). MMWR 2010;59(No. RR-8).
3. CDC. Limited human-to-human transmission of novel influenza A (H3N2) virus—Iowa, November 2011. MMWR 2011;60:1615–7.
4. CDC. Update: influenza A (H3N2)v transmission and guidelines—five states, 2011. MMWR 2011;60:1741–4.
5. CDC. Prevention and control of influenza with vaccines: recommendations of the Advisory Committee on Immunization Practices (ACIP), 2011. MMWR 2011;60:1128–32.
6. Dao CN, Kamimoto L, Nowell M, et al. Adult hospitalizations for laboratory-positive influenza during the 2005–2006 through 2007–2008 seasons in the United States. J Infect Dis 2010;202:881–8.
7. CDC. Antiviral agents for the treatment and chemoprophylaxis of influenza: recommendations of the Advisory Committee on Immunization Practices (ACIP). MMWR 2011;60(No. RR-1).
8. CDC. Deaths related to 2009 pandemic influenza A (H1N1) among American Indian/Alaska Natives—12 states, 2009. MMWR 2009; 58:1341–4.
9. Jain S, Kamimoto L, Bramley AM, et al. Hospitalized patients with 2009 H1N1 influenza in the United States, April–June 2009. N Engl J Med 2009;361:1935–44.
10. Morgan OW, Bramley A, Fowlkes A, et al. Morbid obesity as a risk factor for hospitalization and death due to 2009 pandemic influenza A(H1N1) disease. PLoS ONE 2010;5:e9694.
Morbidity and Mortality Weekly Report
MMWR / February 24, 2012 / Vol. 61 / No. 7 129
Announcement
Release of Online U.S. and State Trend Data for Health-Related Quality of Life
CDC has released 1993–2010 overall U.S. and state trend data for Health-Related Quality of Life (HRQOL).* CDC’s HRQOL questions ask about recent perceived physical and mental health and activity limitations (1). Overall U.S. and state estimates are available by sex, age group, and race/ethnic-ity. Healthy People 2000, 2010, and 2020 identified quality of life improvement as a central public health goal (2). HRQOL enables health agencies to address broader areas of health-related public policy around a common theme, in collaboration with a wider circle of health partners, including social service agencies, health-care systems, community planners, and busi-ness groups. Measuring HRQOL will help monitor progress in achieving the nation’s health objectives.
References 1. CDC. Measuring healthy days. Atlanta, GA: US Department of Health
and Human Services, CDC; 2000. Available at http://www.cdc.gov/hrqol/pdfs/mhd.pdf. Accessed February 16, 2012.
2. US Department of Health and Human Services. Healthy people 2020. Washington, DC: US Department of Health and Human Services; 2011. Available at http://healthypeople.gov/2020/about/genhealthabout.aspx. Accessed February 16, 2012.
* Available at http://apps.nccd.cdc.gov/hrqol.
Morbidity and Mortality Weekly Report
130 MMWR / February 24, 2012 / Vol. 61 / No. 7
QuickStats
FROM THE NATIONAL CENTER FOR HEALTH STATISTICS
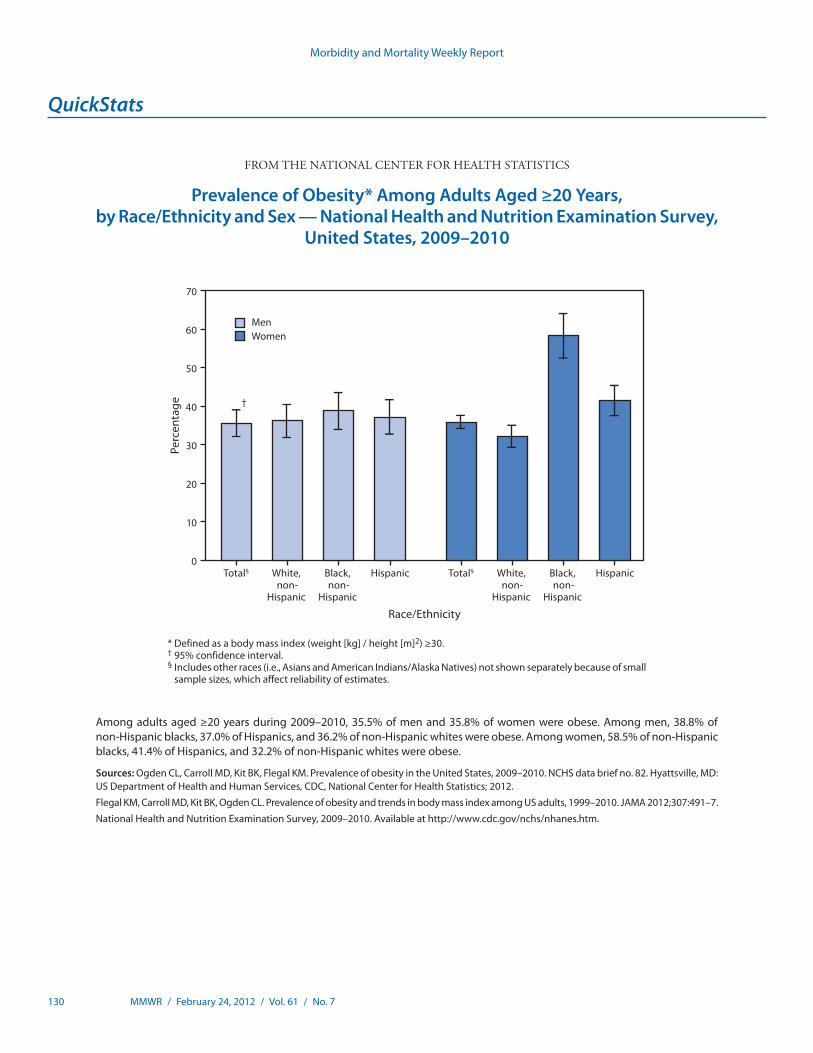
* Defined as a body mass index (weight [kg] / height [m]2) ≥30.† 95% confidence interval. § Includes other races (i.e., Asians and American Indians/Alaska Natives) not shown separately because of small
sample sizes, which affect reliability of estimates.
Among adults aged ≥20 years during 2009–2010, 35.5% of men and 35.8% of women were obese. Among men, 38.8% of non-Hispanic blacks, 37.0% of Hispanics, and 36.2% of non-Hispanic whites were obese. Among women, 58.5% of non-Hispanic blacks, 41.4% of Hispanics, and 32.2% of non-Hispanic whites were obese.
Sources: Ogden CL, Carroll MD, Kit BK, Flegal KM. Prevalence of obesity in the United States, 2009–2010. NCHS data brief no. 82. Hyattsville, MD: US Department of Health and Human Services, CDC, National Center for Health Statistics; 2012.
Flegal KM, Carroll MD, Kit BK, Ogden CL. Prevalence of obesity and trends in body mass index among US adults, 1999–2010. JAMA 2012;307:491–7.
National Health and Nutrition Examination Survey, 2009–2010. Available at http://www.cdc.gov/nchs/nhanes.htm.
Total§ White, non-
Hispanic
Black, non-
Hispanic
Hispanic Total§ White, non-
Hispanic
Black, non-
Hispanic
Hispanic
Perc
enta
ge
0
10
20
30
40
50
60
70
MenWomen
Race/Ethnicity
†
Prevalence of Obesity* Among Adults Aged ≥20 Years, by Race/Ethnicity and Sex — National Health and Nutrition Examination Survey,
United States, 2009–2010
Morbidity and Mortality Weekly Report
ND-86 MMWR / February 24, 2012 / Vol. 61 / No. 7
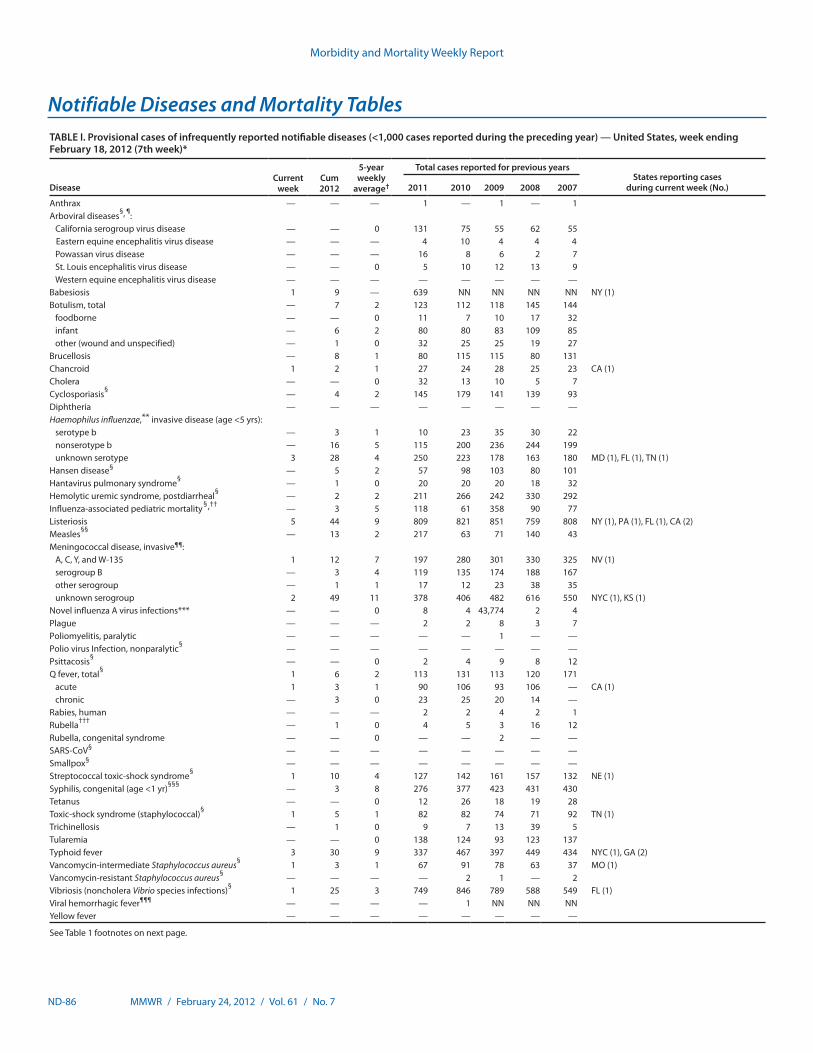
TABLE I. Provisional cases of infrequently reported notifiable diseases (<1,000 cases reported during the preceding year) — United States, week ending February 18, 2012 (7th week)*
DiseaseCurrent
weekCum 2012
5-year weekly
average†
Total cases reported for previous yearsStates reporting cases
during current week (No.)2011 2010 2009 2008 2007
Anthrax — — — 1 — 1 — 1Arboviral diseases§, ¶:
California serogroup virus disease — — 0 131 75 55 62 55Eastern equine encephalitis virus disease — — — 4 10 4 4 4Powassan virus disease — — — 16 8 6 2 7St. Louis encephalitis virus disease — — 0 5 10 12 13 9Western equine encephalitis virus disease — — — — — — — —
Babesiosis 1 9 — 639 NN NN NN NN NY (1)Botulism, total — 7 2 123 112 118 145 144
foodborne — — 0 11 7 10 17 32infant — 6 2 80 80 83 109 85other (wound and unspecified) — 1 0 32 25 25 19 27
Brucellosis — 8 1 80 115 115 80 131Chancroid 1 2 1 27 24 28 25 23 CA (1)Cholera — — 0 32 13 10 5 7Cyclosporiasis§ — 4 2 145 179 141 139 93Diphtheria — — — — — — — —Haemophilus influenzae,** invasive disease (age <5 yrs):
serotype b — 3 1 10 23 35 30 22nonserotype b — 16 5 115 200 236 244 199unknown serotype 3 28 4 250 223 178 163 180 MD (1), FL (1), TN (1)
Hansen disease§ — 5 2 57 98 103 80 101Hantavirus pulmonary syndrome§ — 1 0 20 20 20 18 32Hemolytic uremic syndrome, postdiarrheal§ — 2 2 211 266 242 330 292Influenza-associated pediatric mortality§,†† — 3 5 118 61 358 90 77Listeriosis 5 44 9 809 821 851 759 808 NY (1), PA (1), FL (1), CA (2)Measles§§ — 13 2 217 63 71 140 43Meningococcal disease, invasive¶¶:
A, C, Y, and W-135 1 12 7 197 280 301 330 325 NV (1)serogroup B — 3 4 119 135 174 188 167other serogroup — 1 1 17 12 23 38 35unknown serogroup 2 49 11 378 406 482 616 550 NYC (1), KS (1)
Novel influenza A virus infections*** — — 0 8 4 43,774 2 4Plague — — — 2 2 8 3 7Poliomyelitis, paralytic — — — — — 1 — —Polio virus Infection, nonparalytic§ — — — — — — — —Psittacosis§ — — 0 2 4 9 8 12Q fever, total§ 1 6 2 113 131 113 120 171
acute 1 3 1 90 106 93 106 — CA (1)chronic — 3 0 23 25 20 14 —
Rabies, human — — — 2 2 4 2 1Rubella††† — 1 0 4 5 3 16 12Rubella, congenital syndrome — — 0 — — 2 — —SARS-CoV§ — — — — — — — —Smallpox§ — — — — — — — —Streptococcal toxic-shock syndrome§ 1 10 4 127 142 161 157 132 NE (1)Syphilis, congenital (age <1 yr)§§§ — 3 8 276 377 423 431 430Tetanus — — 0 12 26 18 19 28Toxic-shock syndrome (staphylococcal)§ 1 5 1 82 82 74 71 92 TN (1)Trichinellosis — 1 0 9 7 13 39 5Tularemia — — 0 138 124 93 123 137Typhoid fever 3 30 9 337 467 397 449 434 NYC (1), GA (2)Vancomycin-intermediate Staphylococcus aureus§ 1 3 1 67 91 78 63 37 MO (1)Vancomycin-resistant Staphylococcus aureus§ — — — — 2 1 — 2Vibriosis (noncholera Vibrio species infections)§ 1 25 3 749 846 789 588 549 FL (1)Viral hemorrhagic fever¶¶¶ — — — — 1 NN NN NNYellow fever — — — — — — — —
See Table 1 footnotes on next page.
Notifiable Diseases and Mortality Tables
Morbidity and Mortality Weekly Report
MMWR / February 24, 2012 / Vol. 61 / No. 7 ND-87
Notifiable Disease Data Team and 122 Cities Mortality Data Team
Jennifer Ward Deborah A. AdamsWillie J. Anderson Lenee BlantonRosaline Dhara Diana Harris OnwehPearl C. Sharp Michael S. Wodajo
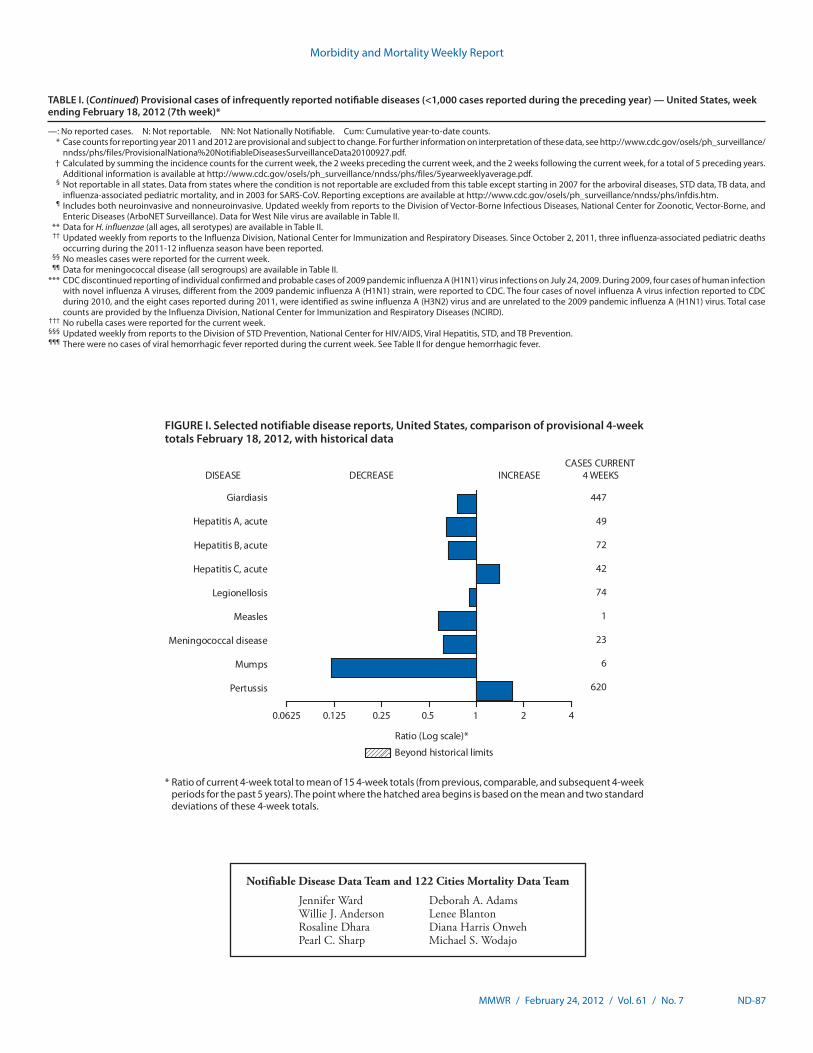
* Ratio of current 4-week total to mean of 15 4-week totals (from previous, comparable, and subsequent 4-week periods for the past 5 years). The point where the hatched area begins is based on the mean and two standard deviations of these 4-week totals.
FIGURE I. Selected notifiable disease reports, United States, comparison of provisional 4-week totals February 18, 2012, with historical data
420.1250.0625 1
Beyond historical limits
DISEASE
Ratio (Log scale)*
DECREASE INCREASECASES CURRENT
4 WEEKS
Hepatitis A, acute
Hepatitis B, acute
Hepatitis C, acute
Legionellosis
Measles
Mumps
Pertussis
Giardiasis
Meningococcal disease
447
49
72
42
74
1
23
6
620
0.25 0.5
TABLE I. (Continued) Provisional cases of infrequently reported notifiable diseases (<1,000 cases reported during the preceding year) — United States, week ending February 18, 2012 (7th week)*
—: No reported cases. N: Not reportable. NN: Not Nationally Notifiable. Cum: Cumulative year-to-date counts. * Case counts for reporting year 2011 and 2012 are provisional and subject to change. For further information on interpretation of these data, see http://www.cdc.gov/osels/ph_surveillance/
nndss/phs/files/ProvisionalNationa%20NotifiableDiseasesSurveillanceData20100927.pdf. † Calculated by summing the incidence counts for the current week, the 2 weeks preceding the current week, and the 2 weeks following the current week, for a total of 5 preceding years.
Additional information is available at http://www.cdc.gov/osels/ph_surveillance/nndss/phs/files/5yearweeklyaverage.pdf. § Not reportable in all states. Data from states where the condition is not reportable are excluded from this table except starting in 2007 for the arboviral diseases, STD data, TB data, and
influenza-associated pediatric mortality, and in 2003 for SARS-CoV. Reporting exceptions are available at http://www.cdc.gov/osels/ph_surveillance/nndss/phs/infdis.htm. ¶ Includes both neuroinvasive and nonneuroinvasive. Updated weekly from reports to the Division of Vector-Borne Infectious Diseases, National Center for Zoonotic, Vector-Borne, and
Enteric Diseases (ArboNET Surveillance). Data for West Nile virus are available in Table II. ** Data for H. influenzae (all ages, all serotypes) are available in Table II. †† Updated weekly from reports to the Influenza Division, National Center for Immunization and Respiratory Diseases. Since October 2, 2011, three influenza-associated pediatric deaths
occurring during the 2011-12 influenza season have been reported. §§ No measles cases were reported for the current week. ¶¶ Data for meningococcal disease (all serogroups) are available in Table II. *** CDC discontinued reporting of individual confirmed and probable cases of 2009 pandemic influenza A (H1N1) virus infections on July 24, 2009. During 2009, four cases of human infection
with novel influenza A viruses, different from the 2009 pandemic influenza A (H1N1) strain, were reported to CDC. The four cases of novel influenza A virus infection reported to CDC during 2010, and the eight cases reported during 2011, were identified as swine influenza A (H3N2) virus and are unrelated to the 2009 pandemic influenza A (H1N1) virus. Total case counts are provided by the Influenza Division, National Center for Immunization and Respiratory Diseases (NCIRD).
††† No rubella cases were reported for the current week. §§§ Updated weekly from reports to the Division of STD Prevention, National Center for HIV/AIDS, Viral Hepatitis, STD, and TB Prevention. ¶¶¶ There were no cases of viral hemorrhagic fever reported during the current week. See Table II for dengue hemorrhagic fever.
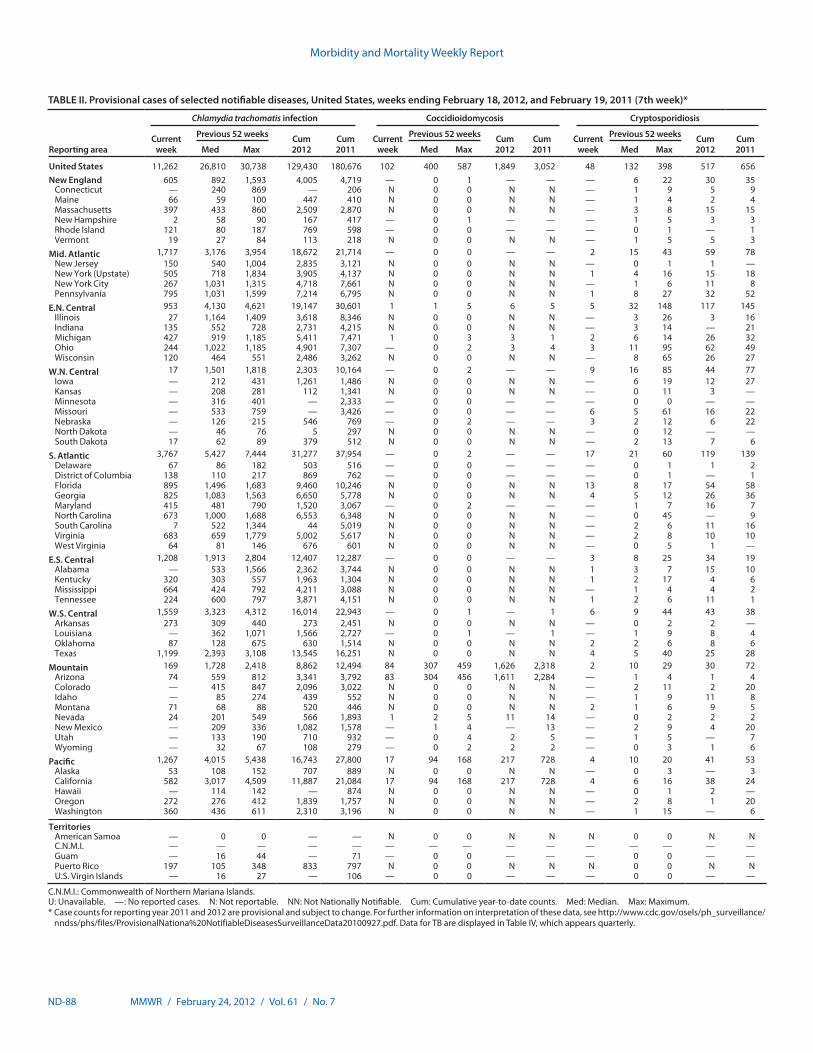
Morbidity and Mortality Weekly Report
ND-88 MMWR / February 24, 2012 / Vol. 61 / No. 7
TABLE II. Provisional cases of selected notifiable diseases, United States, weeks ending February 18, 2012, and February 19, 2011 (7th week)*
Reporting area
Chlamydia trachomatis infection Coccidioidomycosis Cryptosporidiosis
Current week
Previous 52 weeks Cum 2012
Cum 2011
Current week
Previous 52 weeks Cum 2012
Cum 2011
Current week
Previous 52 weeks Cum 2012
Cum 2011Med Max Med Max Med Max
United States 11,262 26,810 30,738 129,430 180,676 102 400 587 1,849 3,052 48 132 398 517 656New England 605 892 1,593 4,005 4,719 — 0 1 — — — 6 22 30 35
Connecticut — 240 869 — 206 N 0 0 N N — 1 9 5 9Maine 66 59 100 447 410 N 0 0 N N — 1 4 2 4Massachusetts 397 433 860 2,509 2,870 N 0 0 N N — 3 8 15 15New Hampshire 2 58 90 167 417 — 0 1 — — — 1 5 3 3Rhode Island 121 80 187 769 598 — 0 0 — — — 0 1 — 1Vermont 19 27 84 113 218 N 0 0 N N — 1 5 5 3
Mid. Atlantic 1,717 3,176 3,954 18,672 21,714 — 0 0 — — 2 15 43 59 78New Jersey 150 540 1,004 2,835 3,121 N 0 0 N N — 0 1 1 —New York (Upstate) 505 718 1,834 3,905 4,137 N 0 0 N N 1 4 16 15 18New York City 267 1,031 1,315 4,718 7,661 N 0 0 N N — 1 6 11 8Pennsylvania 795 1,031 1,599 7,214 6,795 N 0 0 N N 1 8 27 32 52
E.N. Central 953 4,130 4,621 19,147 30,601 1 1 5 6 5 5 32 148 117 145Illinois 27 1,164 1,409 3,618 8,346 N 0 0 N N — 3 26 3 16Indiana 135 552 728 2,731 4,215 N 0 0 N N — 3 14 — 21Michigan 427 919 1,185 5,411 7,471 1 0 3 3 1 2 6 14 26 32Ohio 244 1,022 1,185 4,901 7,307 — 0 2 3 4 3 11 95 62 49Wisconsin 120 464 551 2,486 3,262 N 0 0 N N — 8 65 26 27
W.N. Central 17 1,501 1,818 2,303 10,164 — 0 2 — — 9 16 85 44 77Iowa — 212 431 1,261 1,486 N 0 0 N N — 6 19 12 27Kansas — 208 281 112 1,341 N 0 0 N N — 0 11 3 —Minnesota — 316 401 — 2,333 — 0 0 — — — 0 0 — —Missouri — 533 759 — 3,426 — 0 0 — — 6 5 61 16 22Nebraska — 126 215 546 769 — 0 2 — — 3 2 12 6 22North Dakota — 46 76 5 297 N 0 0 N N — 0 12 — —South Dakota 17 62 89 379 512 N 0 0 N N — 2 13 7 6
S. Atlantic 3,767 5,427 7,444 31,277 37,954 — 0 2 — — 17 21 60 119 139Delaware 67 86 182 503 516 — 0 0 — — — 0 1 1 2District of Columbia 138 110 217 869 762 — 0 0 — — — 0 1 — 1Florida 895 1,496 1,683 9,460 10,246 N 0 0 N N 13 8 17 54 58Georgia 825 1,083 1,563 6,650 5,778 N 0 0 N N 4 5 12 26 36Maryland 415 481 790 1,520 3,067 — 0 2 — — — 1 7 16 7North Carolina 673 1,000 1,688 6,553 6,348 N 0 0 N N — 0 45 — 9South Carolina 7 522 1,344 44 5,019 N 0 0 N N — 2 6 11 16Virginia 683 659 1,779 5,002 5,617 N 0 0 N N — 2 8 10 10West Virginia 64 81 146 676 601 N 0 0 N N — 0 5 1 —
E.S. Central 1,208 1,913 2,804 12,407 12,287 — 0 0 — — 3 8 25 34 19Alabama — 533 1,566 2,362 3,744 N 0 0 N N 1 3 7 15 10Kentucky 320 303 557 1,963 1,304 N 0 0 N N 1 2 17 4 6Mississippi 664 424 792 4,211 3,088 N 0 0 N N — 1 4 4 2Tennessee 224 600 797 3,871 4,151 N 0 0 N N 1 2 6 11 1
W.S. Central 1,559 3,323 4,312 16,014 22,943 — 0 1 — 1 6 9 44 43 38Arkansas 273 309 440 273 2,451 N 0 0 N N — 0 2 2 —Louisiana — 362 1,071 1,566 2,727 — 0 1 — 1 — 1 9 8 4Oklahoma 87 128 675 630 1,514 N 0 0 N N 2 2 6 8 6Texas 1,199 2,393 3,108 13,545 16,251 N 0 0 N N 4 5 40 25 28
Mountain 169 1,728 2,418 8,862 12,494 84 307 459 1,626 2,318 2 10 29 30 72Arizona 74 559 812 3,341 3,792 83 304 456 1,611 2,284 — 1 4 1 4Colorado — 415 847 2,096 3,022 N 0 0 N N — 2 11 2 20Idaho — 85 274 439 552 N 0 0 N N — 1 9 11 8Montana 71 68 88 520 446 N 0 0 N N 2 1 6 9 5Nevada 24 201 549 566 1,893 1 2 5 11 14 — 0 2 2 2New Mexico — 209 336 1,082 1,578 — 1 4 — 13 — 2 9 4 20Utah — 133 190 710 932 — 0 4 2 5 — 1 5 — 7Wyoming — 32 67 108 279 — 0 2 2 2 — 0 3 1 6
Pacific 1,267 4,015 5,438 16,743 27,800 17 94 168 217 728 4 10 20 41 53Alaska 53 108 152 707 889 N 0 0 N N — 0 3 — 3California 582 3,017 4,509 11,887 21,084 17 94 168 217 728 4 6 16 38 24Hawaii — 114 142 — 874 N 0 0 N N — 0 1 2 —Oregon 272 276 412 1,839 1,757 N 0 0 N N — 2 8 1 20Washington 360 436 611 2,310 3,196 N 0 0 N N — 1 15 — 6
TerritoriesAmerican Samoa — 0 0 — — N 0 0 N N N 0 0 N NC.N.M.I. — — — — — — — — — — — — — — —Guam — 16 44 — 71 — 0 0 — — — 0 0 — —Puerto Rico 197 105 348 833 797 N 0 0 N N N 0 0 N NU.S. Virgin Islands — 16 27 — 106 — 0 0 — — — 0 0 — —
C.N.M.I.: Commonwealth of Northern Mariana Islands.U: Unavailable. —: No reported cases. N: Not reportable. NN: Not Nationally Notifiable. Cum: Cumulative year-to-date counts. Med: Median. Max: Maximum.* Case counts for reporting year 2011 and 2012 are provisional and subject to change. For further information on interpretation of these data, see http://www.cdc.gov/osels/ph_surveillance/
nndss/phs/files/ProvisionalNationa%20NotifiableDiseasesSurveillanceData20100927.pdf. Data for TB are displayed in Table IV, which appears quarterly.
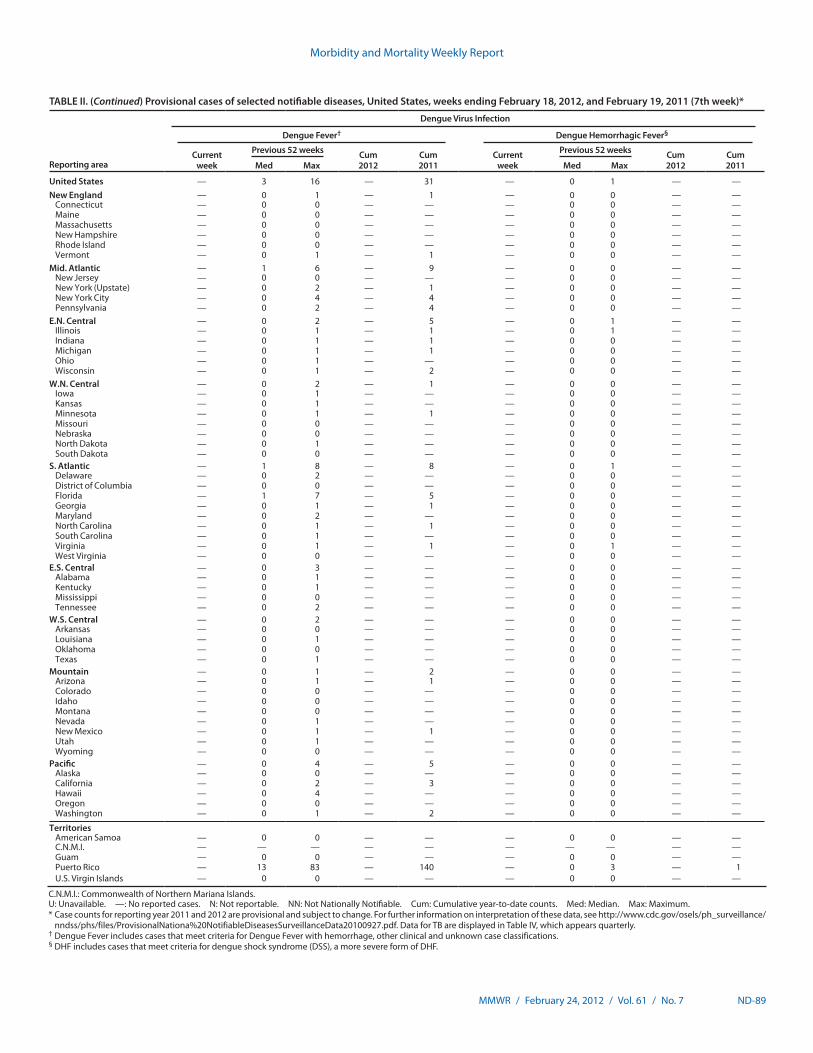
Morbidity and Mortality Weekly Report
MMWR / February 24, 2012 / Vol. 61 / No. 7 ND-89
TABLE II. (Continued) Provisional cases of selected notifiable diseases, United States, weeks ending February 18, 2012, and February 19, 2011 (7th week)*
Reporting area
Dengue Virus Infection
Dengue Fever† Dengue Hemorrhagic Fever§
Current week
Previous 52 weeks Cum 2012
Cum 2011
Current week
Previous 52 weeks Cum 2012
Cum 2011Med Max Med Max
United States — 3 16 — 31 — 0 1 — —New England — 0 1 — 1 — 0 0 — —
Connecticut — 0 0 — — — 0 0 — —Maine — 0 0 — — — 0 0 — —Massachusetts — 0 0 — — — 0 0 — —New Hampshire — 0 0 — — — 0 0 — —Rhode Island — 0 0 — — — 0 0 — —Vermont — 0 1 — 1 — 0 0 — —
Mid. Atlantic — 1 6 — 9 — 0 0 — —New Jersey — 0 0 — — — 0 0 — —New York (Upstate) — 0 2 — 1 — 0 0 — —New York City — 0 4 — 4 — 0 0 — —Pennsylvania — 0 2 — 4 — 0 0 — —
E.N. Central — 0 2 — 5 — 0 1 — —Illinois — 0 1 — 1 — 0 1 — —Indiana — 0 1 — 1 — 0 0 — —Michigan — 0 1 — 1 — 0 0 — —Ohio — 0 1 — — — 0 0 — —Wisconsin — 0 1 — 2 — 0 0 — —
W.N. Central — 0 2 — 1 — 0 0 — —Iowa — 0 1 — — — 0 0 — —Kansas — 0 1 — — — 0 0 — —Minnesota — 0 1 — 1 — 0 0 — —Missouri — 0 0 — — — 0 0 — —Nebraska — 0 0 — — — 0 0 — —North Dakota — 0 1 — — — 0 0 — —South Dakota — 0 0 — — — 0 0 — —
S. Atlantic — 1 8 — 8 — 0 1 — —Delaware — 0 2 — — — 0 0 — —District of Columbia — 0 0 — — — 0 0 — —Florida — 1 7 — 5 — 0 0 — —Georgia — 0 1 — 1 — 0 0 — —Maryland — 0 2 — — — 0 0 — —North Carolina — 0 1 — 1 — 0 0 — —South Carolina — 0 1 — — — 0 0 — —Virginia — 0 1 — 1 — 0 1 — —West Virginia — 0 0 — — — 0 0 — —
E.S. Central — 0 3 — — — 0 0 — —Alabama — 0 1 — — — 0 0 — —Kentucky — 0 1 — — — 0 0 — —Mississippi — 0 0 — — — 0 0 — —Tennessee — 0 2 — — — 0 0 — —
W.S. Central — 0 2 — — — 0 0 — —Arkansas — 0 0 — — — 0 0 — —Louisiana — 0 1 — — — 0 0 — —Oklahoma — 0 0 — — — 0 0 — —Texas — 0 1 — — — 0 0 — —
Mountain — 0 1 — 2 — 0 0 — —Arizona — 0 1 — 1 — 0 0 — —Colorado — 0 0 — — — 0 0 — —Idaho — 0 0 — — — 0 0 — —Montana — 0 0 — — — 0 0 — —Nevada — 0 1 — — — 0 0 — —New Mexico — 0 1 — 1 — 0 0 — —Utah — 0 1 — — — 0 0 — —Wyoming — 0 0 — — — 0 0 — —
Pacific — 0 4 — 5 — 0 0 — —Alaska — 0 0 — — — 0 0 — —California — 0 2 — 3 — 0 0 — —Hawaii — 0 4 — — — 0 0 — —Oregon — 0 0 — — — 0 0 — —Washington — 0 1 — 2 — 0 0 — —
TerritoriesAmerican Samoa — 0 0 — — — 0 0 — —C.N.M.I. — — — — — — — — — —Guam — 0 0 — — — 0 0 — —Puerto Rico — 13 83 — 140 — 0 3 — 1U.S. Virgin Islands — 0 0 — — — 0 0 — —
C.N.M.I.: Commonwealth of Northern Mariana Islands.U: Unavailable. —: No reported cases. N: Not reportable. NN: Not Nationally Notifiable. Cum: Cumulative year-to-date counts. Med: Median. Max: Maximum.* Case counts for reporting year 2011 and 2012 are provisional and subject to change. For further information on interpretation of these data, see http://www.cdc.gov/osels/ph_surveillance/
nndss/phs/files/ProvisionalNationa%20NotifiableDiseasesSurveillanceData20100927.pdf. Data for TB are displayed in Table IV, which appears quarterly.† Dengue Fever includes cases that meet criteria for Dengue Fever with hemorrhage, other clinical and unknown case classifications.§ DHF includes cases that meet criteria for dengue shock syndrome (DSS), a more severe form of DHF.
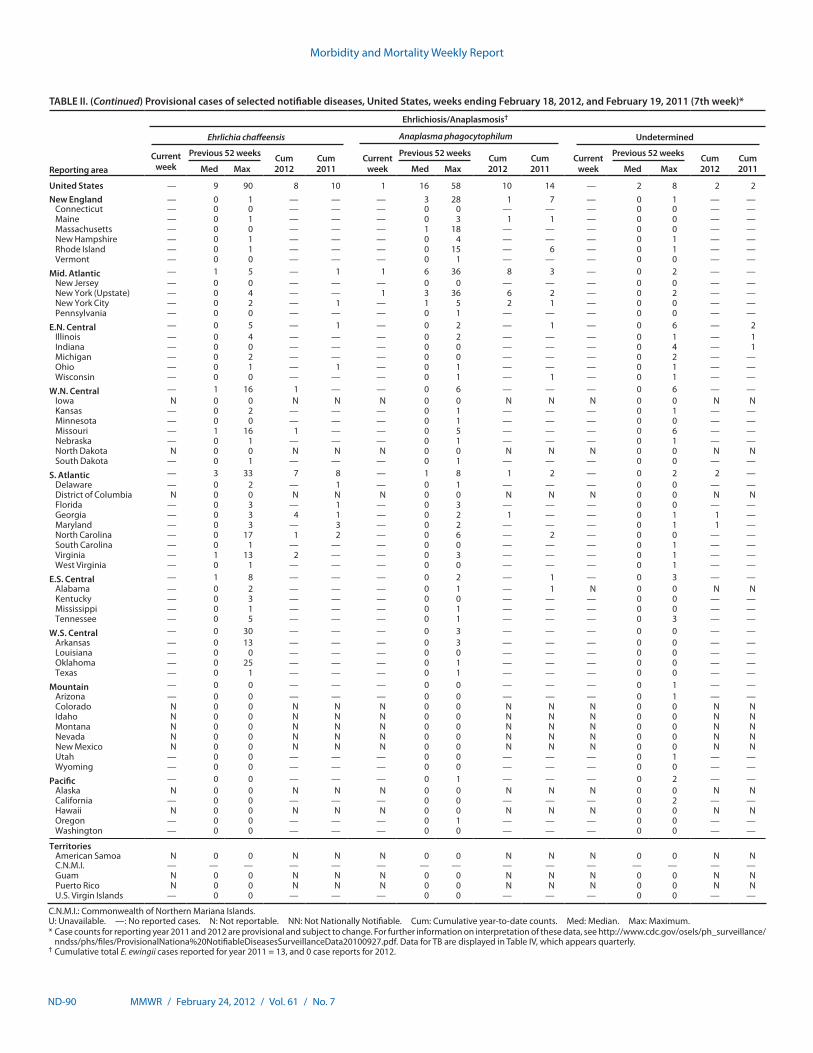
Morbidity and Mortality Weekly Report
ND-90 MMWR / February 24, 2012 / Vol. 61 / No. 7
TABLE II. (Continued) Provisional cases of selected notifiable diseases, United States, weeks ending February 18, 2012, and February 19, 2011 (7th week)*
Reporting area
Ehrlichiosis/Anaplasmosis†
Ehrlichia chaffeensis Anaplasma phagocytophilum Undetermined
Current week
Previous 52 weeks Cum 2012
Cum 2011
Current week
Previous 52 weeks Cum 2012
Cum 2011
Current week
Previous 52 weeks Cum 2012
Cum 2011Med Max Med Max Med Max
United States — 9 90 8 10 1 16 58 10 14 — 2 8 2 2New England — 0 1 — — — 3 28 1 7 — 0 1 — —
Connecticut — 0 0 — — — 0 0 — — — 0 0 — —Maine — 0 1 — — — 0 3 1 1 — 0 0 — —Massachusetts — 0 0 — — — 1 18 — — — 0 0 — —New Hampshire — 0 1 — — — 0 4 — — — 0 1 — —Rhode Island — 0 1 — — — 0 15 — 6 — 0 1 — —Vermont — 0 0 — — — 0 1 — — — 0 0 — —
Mid. Atlantic — 1 5 — 1 1 6 36 8 3 — 0 2 — —New Jersey — 0 0 — — — 0 0 — — — 0 0 — —New York (Upstate) — 0 4 — — 1 3 36 6 2 — 0 2 — —New York City — 0 2 — 1 — 1 5 2 1 — 0 0 — —Pennsylvania — 0 0 — — — 0 1 — — — 0 0 — —
E.N. Central — 0 5 — 1 — 0 2 — 1 — 0 6 — 2Illinois — 0 4 — — — 0 2 — — — 0 1 — 1Indiana — 0 0 — — — 0 0 — — — 0 4 — 1Michigan — 0 2 — — — 0 0 — — — 0 2 — —Ohio — 0 1 — 1 — 0 1 — — — 0 1 — —Wisconsin — 0 0 — — — 0 1 — 1 — 0 1 — —
W.N. Central — 1 16 1 — — 0 6 — — — 0 6 — —Iowa N 0 0 N N N 0 0 N N N 0 0 N NKansas — 0 2 — — — 0 1 — — — 0 1 — —Minnesota — 0 0 — — — 0 1 — — — 0 0 — —Missouri — 1 16 1 — — 0 5 — — — 0 6 — —Nebraska — 0 1 — — — 0 1 — — — 0 1 — —North Dakota N 0 0 N N N 0 0 N N N 0 0 N NSouth Dakota — 0 1 — — — 0 1 — — — 0 0 — —
S. Atlantic — 3 33 7 8 — 1 8 1 2 — 0 2 2 —Delaware — 0 2 — 1 — 0 1 — — — 0 0 — —District of Columbia N 0 0 N N N 0 0 N N N 0 0 N NFlorida — 0 3 — 1 — 0 3 — — — 0 0 — —Georgia — 0 3 4 1 — 0 2 1 — — 0 1 1 —Maryland — 0 3 — 3 — 0 2 — — — 0 1 1 —North Carolina — 0 17 1 2 — 0 6 — 2 — 0 0 — —South Carolina — 0 1 — — — 0 0 — — — 0 1 — —Virginia — 1 13 2 — — 0 3 — — — 0 1 — —West Virginia — 0 1 — — — 0 0 — — — 0 1 — —
E.S. Central — 1 8 — — — 0 2 — 1 — 0 3 — —Alabama — 0 2 — — — 0 1 — 1 N 0 0 N NKentucky — 0 3 — — — 0 0 — — — 0 0 — —Mississippi — 0 1 — — — 0 1 — — — 0 0 — —Tennessee — 0 5 — — — 0 1 — — — 0 3 — —
W.S. Central — 0 30 — — — 0 3 — — — 0 0 — —Arkansas — 0 13 — — — 0 3 — — — 0 0 — —Louisiana — 0 0 — — — 0 0 — — — 0 0 — —Oklahoma — 0 25 — — — 0 1 — — — 0 0 — —Texas — 0 1 — — — 0 1 — — — 0 0 — —
Mountain — 0 0 — — — 0 0 — — — 0 1 — —Arizona — 0 0 — — — 0 0 — — — 0 1 — —Colorado N 0 0 N N N 0 0 N N N 0 0 N NIdaho N 0 0 N N N 0 0 N N N 0 0 N NMontana N 0 0 N N N 0 0 N N N 0 0 N NNevada N 0 0 N N N 0 0 N N N 0 0 N NNew Mexico N 0 0 N N N 0 0 N N N 0 0 N NUtah — 0 0 — — — 0 0 — — — 0 1 — —Wyoming — 0 0 — — — 0 0 — — — 0 0 — —
Pacific — 0 0 — — — 0 1 — — — 0 2 — —Alaska N 0 0 N N N 0 0 N N N 0 0 N NCalifornia — 0 0 — — — 0 0 — — — 0 2 — —Hawaii N 0 0 N N N 0 0 N N N 0 0 N NOregon — 0 0 — — — 0 1 — — — 0 0 — —Washington — 0 0 — — — 0 0 — — — 0 0 — —
TerritoriesAmerican Samoa N 0 0 N N N 0 0 N N N 0 0 N NC.N.M.I. — — — — — — — — — — — — — — —Guam N 0 0 N N N 0 0 N N N 0 0 N NPuerto Rico N 0 0 N N N 0 0 N N N 0 0 N NU.S. Virgin Islands — 0 0 — — — 0 0 — — — 0 0 — —
C.N.M.I.: Commonwealth of Northern Mariana Islands.U: Unavailable. —: No reported cases. N: Not reportable. NN: Not Nationally Notifiable. Cum: Cumulative year-to-date counts. Med: Median. Max: Maximum.* Case counts for reporting year 2011 and 2012 are provisional and subject to change. For further information on interpretation of these data, see http://www.cdc.gov/osels/ph_surveillance/
nndss/phs/files/ProvisionalNationa%20NotifiableDiseasesSurveillanceData20100927.pdf. Data for TB are displayed in Table IV, which appears quarterly.† Cumulative total E. ewingii cases reported for year 2011 = 13, and 0 case reports for 2012.
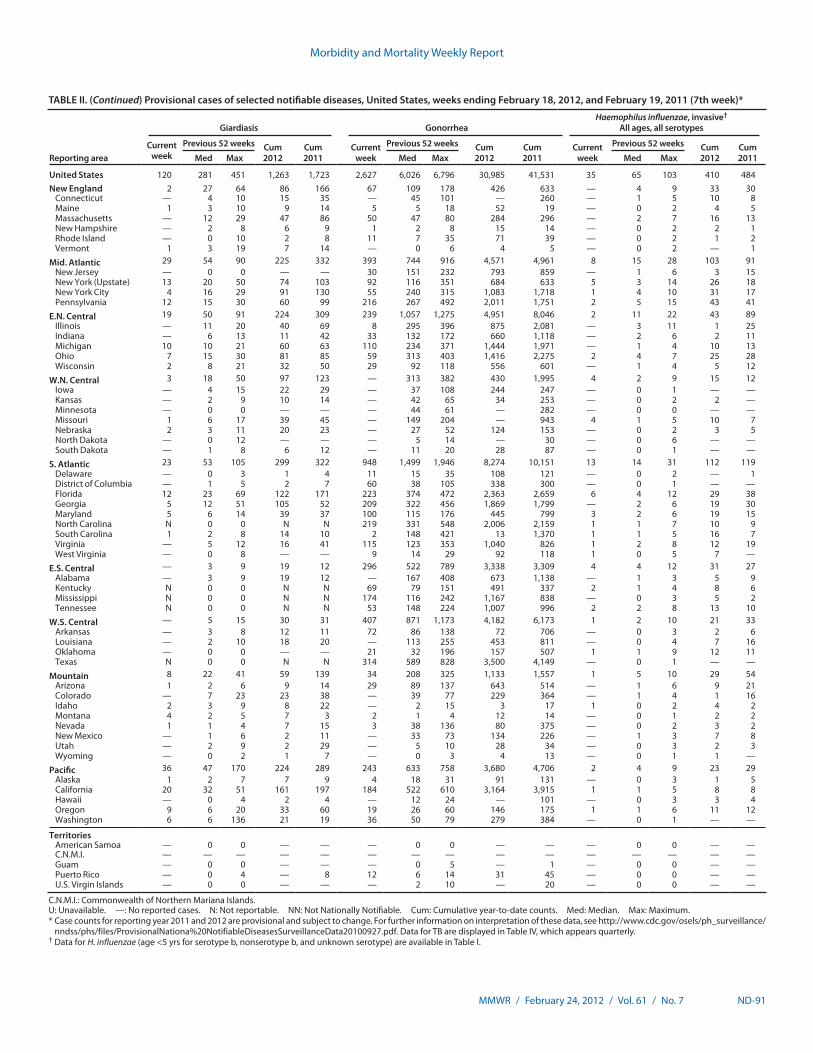
Morbidity and Mortality Weekly Report
MMWR / February 24, 2012 / Vol. 61 / No. 7 ND-91
TABLE II. (Continued) Provisional cases of selected notifiable diseases, United States, weeks ending February 18, 2012, and February 19, 2011 (7th week)*
Reporting area
Giardiasis GonorrheaHaemophilus influenzae, invasive†
All ages, all serotypes
Current week
Previous 52 weeks Cum 2012
Cum 2011
Current week
Previous 52 weeks Cum 2012
Cum 2011
Current week
Previous 52 weeks Cum 2012
Cum 2011Med Max Med Max Med Max
United States 120 281 451 1,263 1,723 2,627 6,026 6,796 30,985 41,531 35 65 103 410 484New England 2 27 64 86 166 67 109 178 426 633 — 4 9 33 30
Connecticut — 4 10 15 35 — 45 101 — 260 — 1 5 10 8Maine 1 3 10 9 14 5 5 18 52 19 — 0 2 4 5Massachusetts — 12 29 47 86 50 47 80 284 296 — 2 7 16 13New Hampshire — 2 8 6 9 1 2 8 15 14 — 0 2 2 1Rhode Island — 0 10 2 8 11 7 35 71 39 — 0 2 1 2Vermont 1 3 19 7 14 — 0 6 4 5 — 0 2 — 1
Mid. Atlantic 29 54 90 225 332 393 744 916 4,571 4,961 8 15 28 103 91New Jersey — 0 0 — — 30 151 232 793 859 — 1 6 3 15New York (Upstate) 13 20 50 74 103 92 116 351 684 633 5 3 14 26 18New York City 4 16 29 91 130 55 240 315 1,083 1,718 1 4 10 31 17Pennsylvania 12 15 30 60 99 216 267 492 2,011 1,751 2 5 15 43 41
E.N. Central 19 50 91 224 309 239 1,057 1,275 4,951 8,046 2 11 22 43 89Illinois — 11 20 40 69 8 295 396 875 2,081 — 3 11 1 25Indiana — 6 13 11 42 33 132 172 660 1,118 — 2 6 2 11Michigan 10 10 21 60 63 110 234 371 1,444 1,971 — 1 4 10 13Ohio 7 15 30 81 85 59 313 403 1,416 2,275 2 4 7 25 28Wisconsin 2 8 21 32 50 29 92 118 556 601 — 1 4 5 12
W.N. Central 3 18 50 97 123 — 313 382 430 1,995 4 2 9 15 12Iowa — 4 15 22 29 — 37 108 244 247 — 0 1 — —Kansas — 2 9 10 14 — 42 65 34 253 — 0 2 2 —Minnesota — 0 0 — — — 44 61 — 282 — 0 0 — —Missouri 1 6 17 39 45 — 149 204 — 943 4 1 5 10 7Nebraska 2 3 11 20 23 — 27 52 124 153 — 0 2 3 5North Dakota — 0 12 — — — 5 14 — 30 — 0 6 — —South Dakota — 1 8 6 12 — 11 20 28 87 — 0 1 — —
S. Atlantic 23 53 105 299 322 948 1,499 1,946 8,274 10,151 13 14 31 112 119Delaware — 0 3 1 4 11 15 35 108 121 — 0 2 — 1District of Columbia — 1 5 2 7 60 38 105 338 300 — 0 1 — —Florida 12 23 69 122 171 223 374 472 2,363 2,659 6 4 12 29 38Georgia 5 12 51 105 52 209 322 456 1,869 1,799 — 2 6 19 30Maryland 5 6 14 39 37 100 115 176 445 799 3 2 6 19 15North Carolina N 0 0 N N 219 331 548 2,006 2,159 1 1 7 10 9South Carolina 1 2 8 14 10 2 148 421 13 1,370 1 1 5 16 7Virginia — 5 12 16 41 115 123 353 1,040 826 1 2 8 12 19West Virginia — 0 8 — — 9 14 29 92 118 1 0 5 7 —
E.S. Central — 3 9 19 12 296 522 789 3,338 3,309 4 4 12 31 27Alabama — 3 9 19 12 — 167 408 673 1,138 — 1 3 5 9Kentucky N 0 0 N N 69 79 151 491 337 2 1 4 8 6Mississippi N 0 0 N N 174 116 242 1,167 838 — 0 3 5 2Tennessee N 0 0 N N 53 148 224 1,007 996 2 2 8 13 10
W.S. Central — 5 15 30 31 407 871 1,173 4,182 6,173 1 2 10 21 33Arkansas — 3 8 12 11 72 86 138 72 706 — 0 3 2 6Louisiana — 2 10 18 20 — 113 255 453 811 — 0 4 7 16Oklahoma — 0 0 — — 21 32 196 157 507 1 1 9 12 11Texas N 0 0 N N 314 589 828 3,500 4,149 — 0 1 — —
Mountain 8 22 41 59 139 34 208 325 1,133 1,557 1 5 10 29 54Arizona 1 2 6 9 14 29 89 137 643 514 — 1 6 9 21Colorado — 7 23 23 38 — 39 77 229 364 — 1 4 1 16Idaho 2 3 9 8 22 — 2 15 3 17 1 0 2 4 2Montana 4 2 5 7 3 2 1 4 12 14 — 0 1 2 2Nevada 1 1 4 7 15 3 38 136 80 375 — 0 2 3 2New Mexico — 1 6 2 11 — 33 73 134 226 — 1 3 7 8Utah — 2 9 2 29 — 5 10 28 34 — 0 3 2 3Wyoming — 0 2 1 7 — 0 3 4 13 — 0 1 1 —
Pacific 36 47 170 224 289 243 633 758 3,680 4,706 2 4 9 23 29Alaska 1 2 7 7 9 4 18 31 91 131 — 0 3 1 5California 20 32 51 161 197 184 522 610 3,164 3,915 1 1 5 8 8Hawaii — 0 4 2 4 — 12 24 — 101 — 0 3 3 4Oregon 9 6 20 33 60 19 26 60 146 175 1 1 6 11 12Washington 6 6 136 21 19 36 50 79 279 384 — 0 1 — —
TerritoriesAmerican Samoa — 0 0 — — — 0 0 — — — 0 0 — —C.N.M.I. — — — — — — — — — — — — — — —Guam — 0 0 — — — 0 5 — 1 — 0 0 — —Puerto Rico — 0 4 — 8 12 6 14 31 45 — 0 0 — —U.S. Virgin Islands — 0 0 — — — 2 10 — 20 — 0 0 — —
C.N.M.I.: Commonwealth of Northern Mariana Islands.U: Unavailable. —: No reported cases. N: Not reportable. NN: Not Nationally Notifiable. Cum: Cumulative year-to-date counts. Med: Median. Max: Maximum.* Case counts for reporting year 2011 and 2012 are provisional and subject to change. For further information on interpretation of these data, see http://www.cdc.gov/osels/ph_surveillance/
nndss/phs/files/ProvisionalNationa%20NotifiableDiseasesSurveillanceData20100927.pdf. Data for TB are displayed in Table IV, which appears quarterly.† Data for H. influenzae (age <5 yrs for serotype b, nonserotype b, and unknown serotype) are available in Table I.
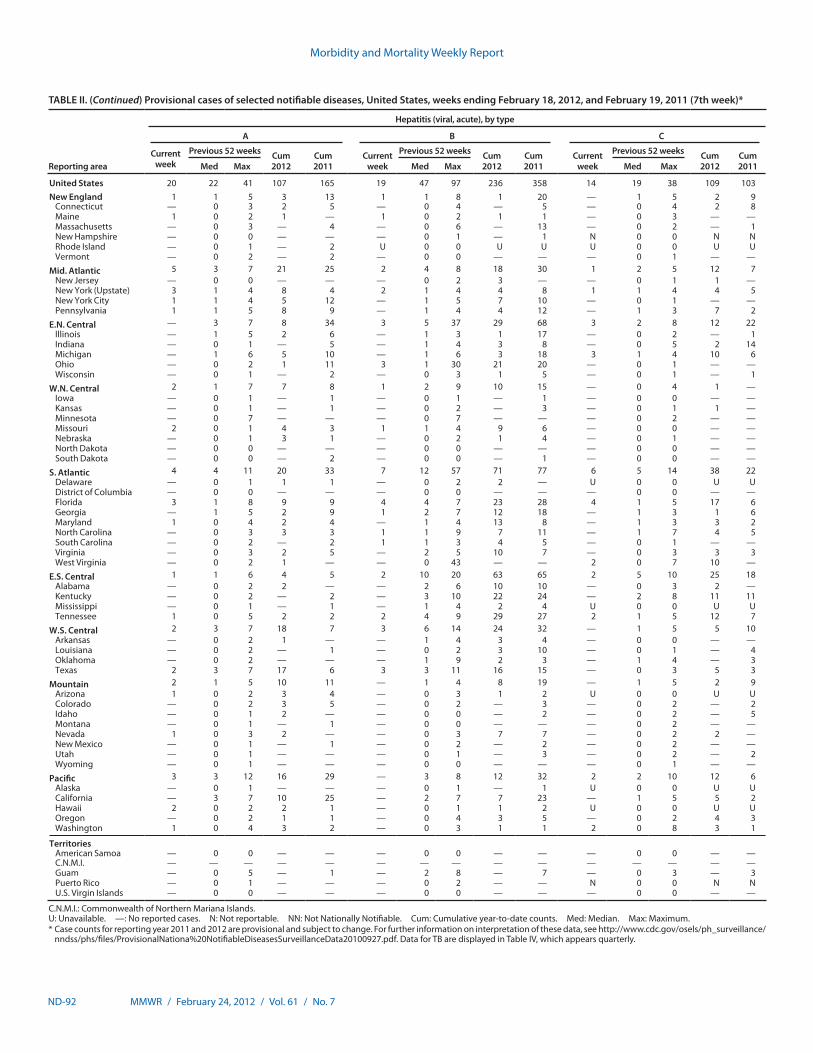
Morbidity and Mortality Weekly Report
ND-92 MMWR / February 24, 2012 / Vol. 61 / No. 7
TABLE II. (Continued) Provisional cases of selected notifiable diseases, United States, weeks ending February 18, 2012, and February 19, 2011 (7th week)*
Reporting area
Hepatitis (viral, acute), by type
A B C
Current week
Previous 52 weeks Cum 2012
Cum 2011
Current week
Previous 52 weeks Cum 2012
Cum 2011
Current week
Previous 52 weeks Cum 2012
Cum 2011Med Max Med Max Med Max
United States 20 22 41 107 165 19 47 97 236 358 14 19 38 109 103New England 1 1 5 3 13 1 1 8 1 20 — 1 5 2 9
Connecticut — 0 3 2 5 — 0 4 — 5 — 0 4 2 8Maine 1 0 2 1 — 1 0 2 1 1 — 0 3 — —Massachusetts — 0 3 — 4 — 0 6 — 13 — 0 2 — 1New Hampshire — 0 0 — — — 0 1 — 1 N 0 0 N NRhode Island — 0 1 — 2 U 0 0 U U U 0 0 U UVermont — 0 2 — 2 — 0 0 — — — 0 1 — —
Mid. Atlantic 5 3 7 21 25 2 4 8 18 30 1 2 5 12 7New Jersey — 0 0 — — — 0 2 3 — — 0 1 1 —New York (Upstate) 3 1 4 8 4 2 1 4 4 8 1 1 4 4 5New York City 1 1 4 5 12 — 1 5 7 10 — 0 1 — —Pennsylvania 1 1 5 8 9 — 1 4 4 12 — 1 3 7 2
E.N. Central — 3 7 8 34 3 5 37 29 68 3 2 8 12 22Illinois — 1 5 2 6 — 1 3 1 17 — 0 2 — 1Indiana — 0 1 — 5 — 1 4 3 8 — 0 5 2 14Michigan — 1 6 5 10 — 1 6 3 18 3 1 4 10 6Ohio — 0 2 1 11 3 1 30 21 20 — 0 1 — —Wisconsin — 0 1 — 2 — 0 3 1 5 — 0 1 — 1
W.N. Central 2 1 7 7 8 1 2 9 10 15 — 0 4 1 —Iowa — 0 1 — 1 — 0 1 — 1 — 0 0 — —Kansas — 0 1 — 1 — 0 2 — 3 — 0 1 1 —Minnesota — 0 7 — — — 0 7 — — — 0 2 — —Missouri 2 0 1 4 3 1 1 4 9 6 — 0 0 — —Nebraska — 0 1 3 1 — 0 2 1 4 — 0 1 — —North Dakota — 0 0 — — — 0 0 — — — 0 0 — —South Dakota — 0 0 — 2 — 0 0 — 1 — 0 0 — —
S. Atlantic 4 4 11 20 33 7 12 57 71 77 6 5 14 38 22Delaware — 0 1 1 1 — 0 2 2 — U 0 0 U UDistrict of Columbia — 0 0 — — — 0 0 — — — 0 0 — —Florida 3 1 8 9 9 4 4 7 23 28 4 1 5 17 6Georgia — 1 5 2 9 1 2 7 12 18 — 1 3 1 6Maryland 1 0 4 2 4 — 1 4 13 8 — 1 3 3 2North Carolina — 0 3 3 3 1 1 9 7 11 — 1 7 4 5South Carolina — 0 2 — 2 1 1 3 4 5 — 0 1 — —Virginia — 0 3 2 5 — 2 5 10 7 — 0 3 3 3West Virginia — 0 2 1 — — 0 43 — — 2 0 7 10 —
E.S. Central 1 1 6 4 5 2 10 20 63 65 2 5 10 25 18Alabama — 0 2 2 — — 2 6 10 10 — 0 3 2 —Kentucky — 0 2 — 2 — 3 10 22 24 — 2 8 11 11Mississippi — 0 1 — 1 — 1 4 2 4 U 0 0 U UTennessee 1 0 5 2 2 2 4 9 29 27 2 1 5 12 7
W.S. Central 2 3 7 18 7 3 6 14 24 32 — 1 5 5 10Arkansas — 0 2 1 — — 1 4 3 4 — 0 0 — —Louisiana — 0 2 — 1 — 0 2 3 10 — 0 1 — 4Oklahoma — 0 2 — — — 1 9 2 3 — 1 4 — 3Texas 2 3 7 17 6 3 3 11 16 15 — 0 3 5 3
Mountain 2 1 5 10 11 — 1 4 8 19 — 1 5 2 9Arizona 1 0 2 3 4 — 0 3 1 2 U 0 0 U UColorado — 0 2 3 5 — 0 2 — 3 — 0 2 — 2Idaho — 0 1 2 — — 0 0 — 2 — 0 2 — 5Montana — 0 1 — 1 — 0 0 — — — 0 2 — —Nevada 1 0 3 2 — — 0 3 7 7 — 0 2 2 —New Mexico — 0 1 — 1 — 0 2 — 2 — 0 2 — —Utah — 0 1 — — — 0 1 — 3 — 0 2 — 2Wyoming — 0 1 — — — 0 0 — — — 0 1 — —
Pacific 3 3 12 16 29 — 3 8 12 32 2 2 10 12 6Alaska — 0 1 — — — 0 1 — 1 U 0 0 U UCalifornia — 3 7 10 25 — 2 7 7 23 — 1 5 5 2Hawaii 2 0 2 2 1 — 0 1 1 2 U 0 0 U UOregon — 0 2 1 1 — 0 4 3 5 — 0 2 4 3Washington 1 0 4 3 2 — 0 3 1 1 2 0 8 3 1
TerritoriesAmerican Samoa — 0 0 — — — 0 0 — — — 0 0 — —C.N.M.I. — — — — — — — — — — — — — — —Guam — 0 5 — 1 — 2 8 — 7 — 0 3 — 3Puerto Rico — 0 1 — — — 0 2 — — N 0 0 N NU.S. Virgin Islands — 0 0 — — — 0 0 — — — 0 0 — —
C.N.M.I.: Commonwealth of Northern Mariana Islands.U: Unavailable. —: No reported cases. N: Not reportable. NN: Not Nationally Notifiable. Cum: Cumulative year-to-date counts. Med: Median. Max: Maximum.* Case counts for reporting year 2011 and 2012 are provisional and subject to change. For further information on interpretation of these data, see http://www.cdc.gov/osels/ph_surveillance/
nndss/phs/files/ProvisionalNationa%20NotifiableDiseasesSurveillanceData20100927.pdf. Data for TB are displayed in Table IV, which appears quarterly.
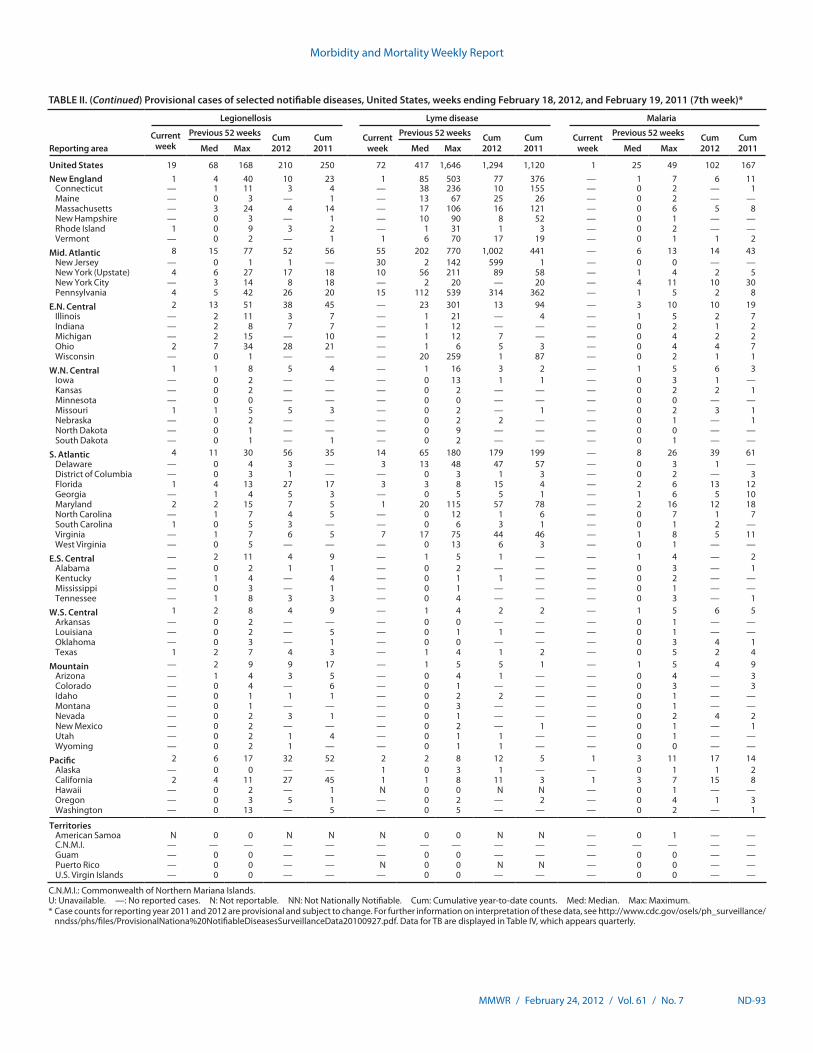
Morbidity and Mortality Weekly Report
MMWR / February 24, 2012 / Vol. 61 / No. 7 ND-93
TABLE II. (Continued) Provisional cases of selected notifiable diseases, United States, weeks ending February 18, 2012, and February 19, 2011 (7th week)*
Reporting area
Legionellosis Lyme disease Malaria
Current week
Previous 52 weeks Cum 2012
Cum 2011
Current week
Previous 52 weeks Cum 2012
Cum 2011
Current week
Previous 52 weeks Cum 2012
Cum 2011Med Max Med Max Med Max
United States 19 68 168 210 250 72 417 1,646 1,294 1,120 1 25 49 102 167New England 1 4 40 10 23 1 85 503 77 376 — 1 7 6 11
Connecticut — 1 11 3 4 — 38 236 10 155 — 0 2 — 1Maine — 0 3 — 1 — 13 67 25 26 — 0 2 — —Massachusetts — 3 24 4 14 — 17 106 16 121 — 0 6 5 8New Hampshire — 0 3 — 1 — 10 90 8 52 — 0 1 — —Rhode Island 1 0 9 3 2 — 1 31 1 3 — 0 2 — —Vermont — 0 2 — 1 1 6 70 17 19 — 0 1 1 2
Mid. Atlantic 8 15 77 52 56 55 202 770 1,002 441 — 6 13 14 43New Jersey — 0 1 1 — 30 2 142 599 1 — 0 0 — —New York (Upstate) 4 6 27 17 18 10 56 211 89 58 — 1 4 2 5New York City — 3 14 8 18 — 2 20 — 20 — 4 11 10 30Pennsylvania 4 5 42 26 20 15 112 539 314 362 — 1 5 2 8
E.N. Central 2 13 51 38 45 — 23 301 13 94 — 3 10 10 19Illinois — 2 11 3 7 — 1 21 — 4 — 1 5 2 7Indiana — 2 8 7 7 — 1 12 — — — 0 2 1 2Michigan — 2 15 — 10 — 1 12 7 — — 0 4 2 2Ohio 2 7 34 28 21 — 1 6 5 3 — 0 4 4 7Wisconsin — 0 1 — — — 20 259 1 87 — 0 2 1 1
W.N. Central 1 1 8 5 4 — 1 16 3 2 — 1 5 6 3Iowa — 0 2 — — — 0 13 1 1 — 0 3 1 —Kansas — 0 2 — — — 0 2 — — — 0 2 2 1Minnesota — 0 0 — — — 0 0 — — — 0 0 — —Missouri 1 1 5 5 3 — 0 2 — 1 — 0 2 3 1Nebraska — 0 2 — — — 0 2 2 — — 0 1 — 1North Dakota — 0 1 — — — 0 9 — — — 0 0 — —South Dakota — 0 1 — 1 — 0 2 — — — 0 1 — —
S. Atlantic 4 11 30 56 35 14 65 180 179 199 — 8 26 39 61Delaware — 0 4 3 — 3 13 48 47 57 — 0 3 1 —District of Columbia — 0 3 1 — — 0 3 1 3 — 0 2 — 3Florida 1 4 13 27 17 3 3 8 15 4 — 2 6 13 12Georgia — 1 4 5 3 — 0 5 5 1 — 1 6 5 10Maryland 2 2 15 7 5 1 20 115 57 78 — 2 16 12 18North Carolina — 1 7 4 5 — 0 12 1 6 — 0 7 1 7South Carolina 1 0 5 3 — — 0 6 3 1 — 0 1 2 —Virginia — 1 7 6 5 7 17 75 44 46 — 1 8 5 11West Virginia — 0 5 — — — 0 13 6 3 — 0 1 — —
E.S. Central — 2 11 4 9 — 1 5 1 — — 1 4 — 2Alabama — 0 2 1 1 — 0 2 — — — 0 3 — 1Kentucky — 1 4 — 4 — 0 1 1 — — 0 2 — —Mississippi — 0 3 — 1 — 0 1 — — — 0 1 — —Tennessee — 1 8 3 3 — 0 4 — — — 0 3 — 1
W.S. Central 1 2 8 4 9 — 1 4 2 2 — 1 5 6 5Arkansas — 0 2 — — — 0 0 — — — 0 1 — —Louisiana — 0 2 — 5 — 0 1 1 — — 0 1 — —Oklahoma — 0 3 — 1 — 0 0 — — — 0 3 4 1Texas 1 2 7 4 3 — 1 4 1 2 — 0 5 2 4
Mountain — 2 9 9 17 — 1 5 5 1 — 1 5 4 9Arizona — 1 4 3 5 — 0 4 1 — — 0 4 — 3Colorado — 0 4 — 6 — 0 1 — — — 0 3 — 3Idaho — 0 1 1 1 — 0 2 2 — — 0 1 — —Montana — 0 1 — — — 0 3 — — — 0 1 — —Nevada — 0 2 3 1 — 0 1 — — — 0 2 4 2New Mexico — 0 2 — — — 0 2 — 1 — 0 1 — 1Utah — 0 2 1 4 — 0 1 1 — — 0 1 — —Wyoming — 0 2 1 — — 0 1 1 — — 0 0 — —
Pacific 2 6 17 32 52 2 2 8 12 5 1 3 11 17 14Alaska — 0 0 — — 1 0 3 1 — — 0 1 1 2California 2 4 11 27 45 1 1 8 11 3 1 3 7 15 8Hawaii — 0 2 — 1 N 0 0 N N — 0 1 — —Oregon — 0 3 5 1 — 0 2 — 2 — 0 4 1 3Washington — 0 13 — 5 — 0 5 — — — 0 2 — 1
TerritoriesAmerican Samoa N 0 0 N N N 0 0 N N — 0 1 — —C.N.M.I. — — — — — — — — — — — — — — —Guam — 0 0 — — — 0 0 — — — 0 0 — —Puerto Rico — 0 0 — — N 0 0 N N — 0 0 — —U.S. Virgin Islands — 0 0 — — — 0 0 — — — 0 0 — —
C.N.M.I.: Commonwealth of Northern Mariana Islands.U: Unavailable. —: No reported cases. N: Not reportable. NN: Not Nationally Notifiable. Cum: Cumulative year-to-date counts. Med: Median. Max: Maximum.* Case counts for reporting year 2011 and 2012 are provisional and subject to change. For further information on interpretation of these data, see http://www.cdc.gov/osels/ph_surveillance/
nndss/phs/files/ProvisionalNationa%20NotifiableDiseasesSurveillanceData20100927.pdf. Data for TB are displayed in Table IV, which appears quarterly.
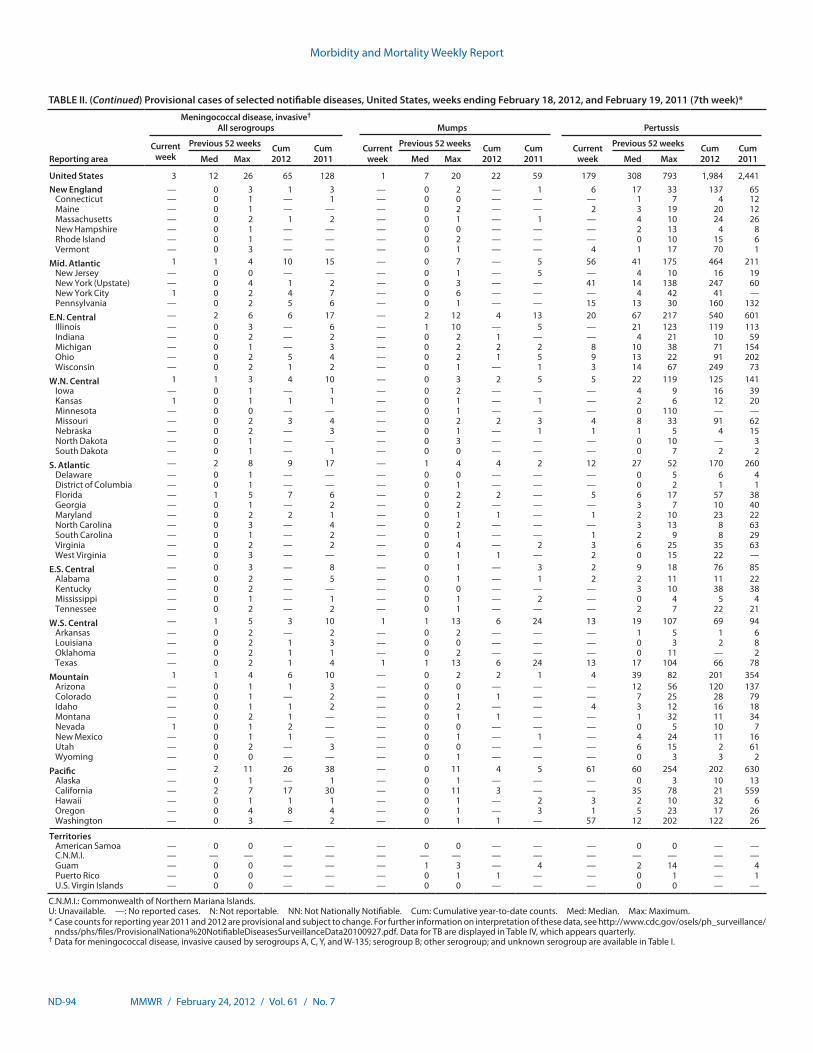
Morbidity and Mortality Weekly Report
ND-94 MMWR / February 24, 2012 / Vol. 61 / No. 7
TABLE II. (Continued) Provisional cases of selected notifiable diseases, United States, weeks ending February 18, 2012, and February 19, 2011 (7th week)*
Reporting area
Meningococcal disease, invasive† All serogroups Mumps Pertussis
Current week
Previous 52 weeks Cum 2012
Cum 2011
Current week
Previous 52 weeks Cum 2012
Cum 2011
Current week
Previous 52 weeks Cum 2012
Cum 2011Med Max Med Max Med Max
United States 3 12 26 65 128 1 7 20 22 59 179 308 793 1,984 2,441New England — 0 3 1 3 — 0 2 — 1 6 17 33 137 65
Connecticut — 0 1 — 1 — 0 0 — — — 1 7 4 12Maine — 0 1 — — — 0 2 — — 2 3 19 20 12Massachusetts — 0 2 1 2 — 0 1 — 1 — 4 10 24 26New Hampshire — 0 1 — — — 0 0 — — — 2 13 4 8Rhode Island — 0 1 — — — 0 2 — — — 0 10 15 6Vermont — 0 3 — — — 0 1 — — 4 1 17 70 1
Mid. Atlantic 1 1 4 10 15 — 0 7 — 5 56 41 175 464 211New Jersey — 0 0 — — — 0 1 — 5 — 4 10 16 19New York (Upstate) — 0 4 1 2 — 0 3 — — 41 14 138 247 60New York City 1 0 2 4 7 — 0 6 — — — 4 42 41 —Pennsylvania — 0 2 5 6 — 0 1 — — 15 13 30 160 132
E.N. Central — 2 6 6 17 — 2 12 4 13 20 67 217 540 601Illinois — 0 3 — 6 — 1 10 — 5 — 21 123 119 113Indiana — 0 2 — 2 — 0 2 1 — — 4 21 10 59Michigan — 0 1 — 3 — 0 2 2 2 8 10 38 71 154Ohio — 0 2 5 4 — 0 2 1 5 9 13 22 91 202Wisconsin — 0 2 1 2 — 0 1 — 1 3 14 67 249 73
W.N. Central 1 1 3 4 10 — 0 3 2 5 5 22 119 125 141Iowa — 0 1 — 1 — 0 2 — — — 4 9 16 39Kansas 1 0 1 1 1 — 0 1 — 1 — 2 6 12 20Minnesota — 0 0 — — — 0 1 — — — 0 110 — —Missouri — 0 2 3 4 — 0 2 2 3 4 8 33 91 62Nebraska — 0 2 — 3 — 0 1 — 1 1 1 5 4 15North Dakota — 0 1 — — — 0 3 — — — 0 10 — 3South Dakota — 0 1 — 1 — 0 0 — — — 0 7 2 2
S. Atlantic — 2 8 9 17 — 1 4 4 2 12 27 52 170 260Delaware — 0 1 — — — 0 0 — — — 0 5 6 4District of Columbia — 0 1 — — — 0 1 — — — 0 2 1 1Florida — 1 5 7 6 — 0 2 2 — 5 6 17 57 38Georgia — 0 1 — 2 — 0 2 — — — 3 7 10 40Maryland — 0 2 2 1 — 0 1 1 — 1 2 10 23 22North Carolina — 0 3 — 4 — 0 2 — — — 3 13 8 63South Carolina — 0 1 — 2 — 0 1 — — 1 2 9 8 29Virginia — 0 2 — 2 — 0 4 — 2 3 6 25 35 63West Virginia — 0 3 — — — 0 1 1 — 2 0 15 22 —
E.S. Central — 0 3 — 8 — 0 1 — 3 2 9 18 76 85Alabama — 0 2 — 5 — 0 1 — 1 2 2 11 11 22Kentucky — 0 2 — — — 0 0 — — — 3 10 38 38Mississippi — 0 1 — 1 — 0 1 — 2 — 0 4 5 4Tennessee — 0 2 — 2 — 0 1 — — — 2 7 22 21
W.S. Central — 1 5 3 10 1 1 13 6 24 13 19 107 69 94Arkansas — 0 2 — 2 — 0 2 — — — 1 5 1 6Louisiana — 0 2 1 3 — 0 0 — — — 0 3 2 8Oklahoma — 0 2 1 1 — 0 2 — — — 0 11 — 2Texas — 0 2 1 4 1 1 13 6 24 13 17 104 66 78
Mountain 1 1 4 6 10 — 0 2 2 1 4 39 82 201 354Arizona — 0 1 1 3 — 0 0 — — — 12 56 120 137Colorado — 0 1 — 2 — 0 1 1 — — 7 25 28 79Idaho — 0 1 1 2 — 0 2 — — 4 3 12 16 18Montana — 0 2 1 — — 0 1 1 — — 1 32 11 34Nevada 1 0 1 2 — — 0 0 — — — 0 5 10 7New Mexico — 0 1 1 — — 0 1 — 1 — 4 24 11 16Utah — 0 2 — 3 — 0 0 — — — 6 15 2 61Wyoming — 0 0 — — — 0 1 — — — 0 3 3 2
Pacific — 2 11 26 38 — 0 11 4 5 61 60 254 202 630Alaska — 0 1 — 1 — 0 1 — — — 0 3 10 13California — 2 7 17 30 — 0 11 3 — — 35 78 21 559Hawaii — 0 1 1 1 — 0 1 — 2 3 2 10 32 6Oregon — 0 4 8 4 — 0 1 — 3 1 5 23 17 26Washington — 0 3 — 2 — 0 1 1 — 57 12 202 122 26
TerritoriesAmerican Samoa — 0 0 — — — 0 0 — — — 0 0 — —C.N.M.I. — — — — — — — — — — — — — — —Guam — 0 0 — — — 1 3 — 4 — 2 14 — 4Puerto Rico — 0 0 — — — 0 1 1 — — 0 1 — 1U.S. Virgin Islands — 0 0 — — — 0 0 — — — 0 0 — —
C.N.M.I.: Commonwealth of Northern Mariana Islands.U: Unavailable. —: No reported cases. N: Not reportable. NN: Not Nationally Notifiable. Cum: Cumulative year-to-date counts. Med: Median. Max: Maximum.* Case counts for reporting year 2011 and 2012 are provisional and subject to change. For further information on interpretation of these data, see http://www.cdc.gov/osels/ph_surveillance/
nndss/phs/files/ProvisionalNationa%20NotifiableDiseasesSurveillanceData20100927.pdf. Data for TB are displayed in Table IV, which appears quarterly.† Data for meningococcal disease, invasive caused by serogroups A, C, Y, and W-135; serogroup B; other serogroup; and unknown serogroup are available in Table I.
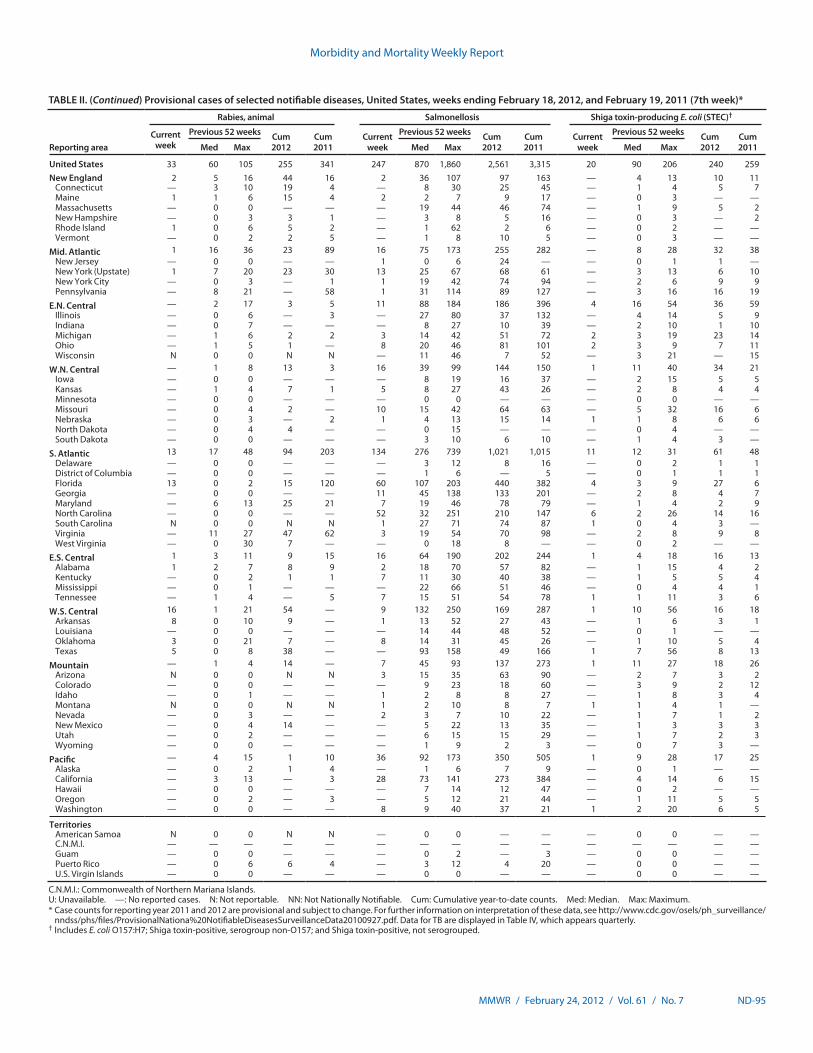
Morbidity and Mortality Weekly Report
MMWR / February 24, 2012 / Vol. 61 / No. 7 ND-95
TABLE II. (Continued) Provisional cases of selected notifiable diseases, United States, weeks ending February 18, 2012, and February 19, 2011 (7th week)*
Reporting area
Rabies, animal Salmonellosis Shiga toxin-producing E. coli (STEC)†
Current week
Previous 52 weeks Cum 2012
Cum 2011
Current week
Previous 52 weeks Cum 2012
Cum 2011
Current week
Previous 52 weeks Cum 2012
Cum 2011Med Max Med Max Med Max
United States 33 60 105 255 341 247 870 1,860 2,561 3,315 20 90 206 240 259New England 2 5 16 44 16 2 36 107 97 163 — 4 13 10 11
Connecticut — 3 10 19 4 — 8 30 25 45 — 1 4 5 7Maine 1 1 6 15 4 2 2 7 9 17 — 0 3 — —Massachusetts — 0 0 — — — 19 44 46 74 — 1 9 5 2New Hampshire — 0 3 3 1 — 3 8 5 16 — 0 3 — 2Rhode Island 1 0 6 5 2 — 1 62 2 6 — 0 2 — —Vermont — 0 2 2 5 — 1 8 10 5 — 0 3 — —
Mid. Atlantic 1 16 36 23 89 16 75 173 255 282 — 8 28 32 38New Jersey — 0 0 — — 1 0 6 24 — — 0 1 1 —New York (Upstate) 1 7 20 23 30 13 25 67 68 61 — 3 13 6 10New York City — 0 3 — 1 1 19 42 74 94 — 2 6 9 9Pennsylvania — 8 21 — 58 1 31 114 89 127 — 3 16 16 19
E.N. Central — 2 17 3 5 11 88 184 186 396 4 16 54 36 59Illinois — 0 6 — 3 — 27 80 37 132 — 4 14 5 9Indiana — 0 7 — — — 8 27 10 39 — 2 10 1 10Michigan — 1 6 2 2 3 14 42 51 72 2 3 19 23 14Ohio — 1 5 1 — 8 20 46 81 101 2 3 9 7 11Wisconsin N 0 0 N N — 11 46 7 52 — 3 21 — 15
W.N. Central — 1 8 13 3 16 39 99 144 150 1 11 40 34 21Iowa — 0 0 — — — 8 19 16 37 — 2 15 5 5Kansas — 1 4 7 1 5 8 27 43 26 — 2 8 4 4Minnesota — 0 0 — — — 0 0 — — — 0 0 — —Missouri — 0 4 2 — 10 15 42 64 63 — 5 32 16 6Nebraska — 0 3 — 2 1 4 13 15 14 1 1 8 6 6North Dakota — 0 4 4 — — 0 15 — — — 0 4 — —South Dakota — 0 0 — — — 3 10 6 10 — 1 4 3 —
S. Atlantic 13 17 48 94 203 134 276 739 1,021 1,015 11 12 31 61 48Delaware — 0 0 — — — 3 12 8 16 — 0 2 1 1District of Columbia — 0 0 — — — 1 6 — 5 — 0 1 1 1Florida 13 0 2 15 120 60 107 203 440 382 4 3 9 27 6Georgia — 0 0 — — 11 45 138 133 201 — 2 8 4 7Maryland — 6 13 25 21 7 19 46 78 79 — 1 4 2 9North Carolina — 0 0 — — 52 32 251 210 147 6 2 26 14 16South Carolina N 0 0 N N 1 27 71 74 87 1 0 4 3 —Virginia — 11 27 47 62 3 19 54 70 98 — 2 8 9 8West Virginia — 0 30 7 — — 0 18 8 — — 0 2 — —
E.S. Central 1 3 11 9 15 16 64 190 202 244 1 4 18 16 13Alabama 1 2 7 8 9 2 18 70 57 82 — 1 15 4 2Kentucky — 0 2 1 1 7 11 30 40 38 — 1 5 5 4Mississippi — 0 1 — — — 22 66 51 46 — 0 4 4 1Tennessee — 1 4 — 5 7 15 51 54 78 1 1 11 3 6
W.S. Central 16 1 21 54 — 9 132 250 169 287 1 10 56 16 18Arkansas 8 0 10 9 — 1 13 52 27 43 — 1 6 3 1Louisiana — 0 0 — — — 14 44 48 52 — 0 1 — —Oklahoma 3 0 21 7 — 8 14 31 45 26 — 1 10 5 4Texas 5 0 8 38 — — 93 158 49 166 1 7 56 8 13
Mountain — 1 4 14 — 7 45 93 137 273 1 11 27 18 26Arizona N 0 0 N N 3 15 35 63 90 — 2 7 3 2Colorado — 0 0 — — — 9 23 18 60 — 3 9 2 12Idaho — 0 1 — — 1 2 8 8 27 — 1 8 3 4Montana N 0 0 N N 1 2 10 8 7 1 1 4 1 —Nevada — 0 3 — — 2 3 7 10 22 — 1 7 1 2New Mexico — 0 4 14 — — 5 22 13 35 — 1 3 3 3Utah — 0 2 — — — 6 15 15 29 — 1 7 2 3Wyoming — 0 0 — — — 1 9 2 3 — 0 7 3 —
Pacific — 4 15 1 10 36 92 173 350 505 1 9 28 17 25Alaska — 0 2 1 4 — 1 6 7 9 — 0 1 — —California — 3 13 — 3 28 73 141 273 384 — 4 14 6 15Hawaii — 0 0 — — — 7 14 12 47 — 0 2 — —Oregon — 0 2 — 3 — 5 12 21 44 — 1 11 5 5Washington — 0 0 — — 8 9 40 37 21 1 2 20 6 5
TerritoriesAmerican Samoa N 0 0 N N — 0 0 — — — 0 0 — —C.N.M.I. — — — — — — — — — — — — — — —Guam — 0 0 — — — 0 2 — 3 — 0 0 — —Puerto Rico — 0 6 6 4 — 3 12 4 20 — 0 0 — —U.S. Virgin Islands — 0 0 — — — 0 0 — — — 0 0 — —
C.N.M.I.: Commonwealth of Northern Mariana Islands.U: Unavailable. —: No reported cases. N: Not reportable. NN: Not Nationally Notifiable. Cum: Cumulative year-to-date counts. Med: Median. Max: Maximum.* Case counts for reporting year 2011 and 2012 are provisional and subject to change. For further information on interpretation of these data, see http://www.cdc.gov/osels/ph_surveillance/
nndss/phs/files/ProvisionalNationa%20NotifiableDiseasesSurveillanceData20100927.pdf. Data for TB are displayed in Table IV, which appears quarterly.† Includes E. coli O157:H7; Shiga toxin-positive, serogroup non-O157; and Shiga toxin-positive, not serogrouped.
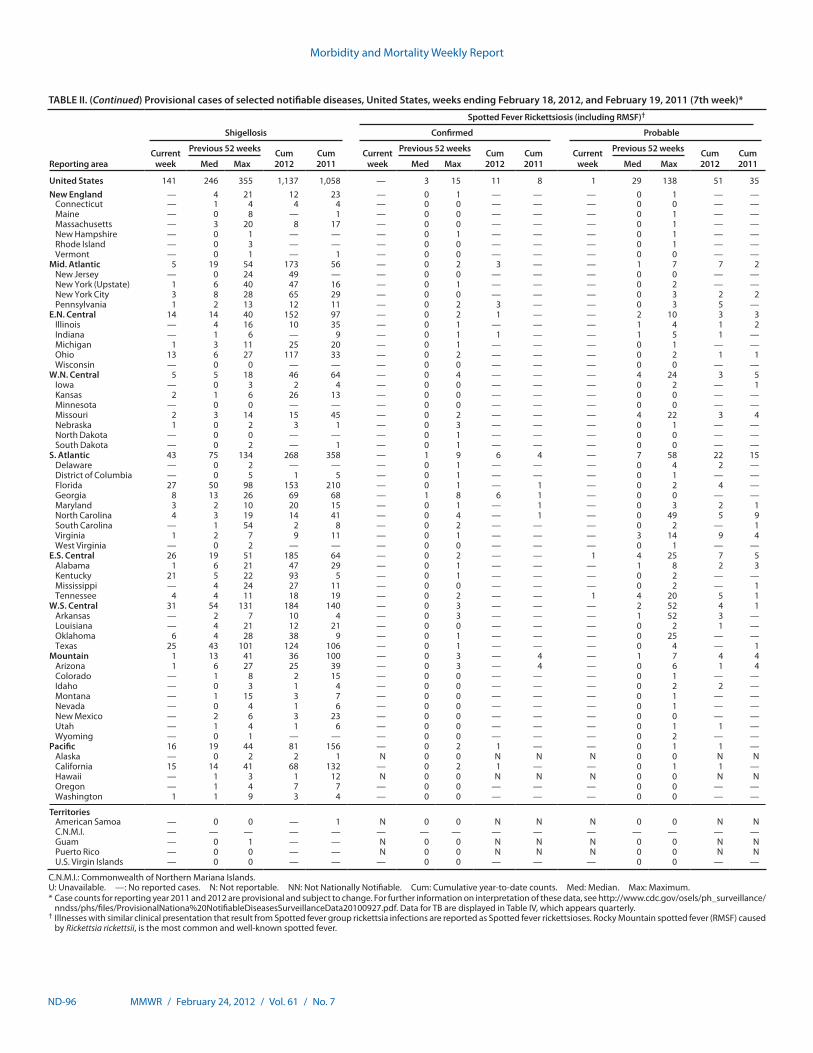
Morbidity and Mortality Weekly Report
ND-96 MMWR / February 24, 2012 / Vol. 61 / No. 7
TABLE II. (Continued) Provisional cases of selected notifiable diseases, United States, weeks ending February 18, 2012, and February 19, 2011 (7th week)*
Reporting area
Shigellosis
Spotted Fever Rickettsiosis (including RMSF)†
Confirmed Probable
Current week
Previous 52 weeks Cum 2012
Cum 2011
Current week
Previous 52 weeks Cum 2012
Cum 2011
Current week
Previous 52 weeks Cum 2012
Cum 2011Med Max Med Max Med Max
United States 141 246 355 1,137 1,058 — 3 15 11 8 1 29 138 51 35New England — 4 21 12 23 — 0 1 — — — 0 1 — —
Connecticut — 1 4 4 4 — 0 0 — — — 0 0 — —Maine — 0 8 — 1 — 0 0 — — — 0 1 — —Massachusetts — 3 20 8 17 — 0 0 — — — 0 1 — —New Hampshire — 0 1 — — — 0 1 — — — 0 1 — —Rhode Island — 0 3 — — — 0 0 — — — 0 1 — —Vermont — 0 1 — 1 — 0 0 — — — 0 0 — —
Mid. Atlantic 5 19 54 173 56 — 0 2 3 — — 1 7 7 2New Jersey — 0 24 49 — — 0 0 — — — 0 0 — —New York (Upstate) 1 6 40 47 16 — 0 1 — — — 0 2 — —New York City 3 8 28 65 29 — 0 0 — — — 0 3 2 2Pennsylvania 1 2 13 12 11 — 0 2 3 — — 0 3 5 —
E.N. Central 14 14 40 152 97 — 0 2 1 — — 2 10 3 3Illinois — 4 16 10 35 — 0 1 — — — 1 4 1 2Indiana — 1 6 — 9 — 0 1 1 — — 1 5 1 —Michigan 1 3 11 25 20 — 0 1 — — — 0 1 — —Ohio 13 6 27 117 33 — 0 2 — — — 0 2 1 1Wisconsin — 0 0 — — — 0 0 — — — 0 0 — —
W.N. Central 5 5 18 46 64 — 0 4 — — — 4 24 3 5Iowa — 0 3 2 4 — 0 0 — — — 0 2 — 1Kansas 2 1 6 26 13 — 0 0 — — — 0 0 — —Minnesota — 0 0 — — — 0 0 — — — 0 0 — —Missouri 2 3 14 15 45 — 0 2 — — — 4 22 3 4Nebraska 1 0 2 3 1 — 0 3 — — — 0 1 — —North Dakota — 0 0 — — — 0 1 — — — 0 0 — —South Dakota — 0 2 — 1 — 0 1 — — — 0 0 — —
S. Atlantic 43 75 134 268 358 — 1 9 6 4 — 7 58 22 15Delaware — 0 2 — — — 0 1 — — — 0 4 2 —District of Columbia — 0 5 1 5 — 0 1 — — — 0 1 — —Florida 27 50 98 153 210 — 0 1 — 1 — 0 2 4 —Georgia 8 13 26 69 68 — 1 8 6 1 — 0 0 — —Maryland 3 2 10 20 15 — 0 1 — 1 — 0 3 2 1North Carolina 4 3 19 14 41 — 0 4 — 1 — 0 49 5 9South Carolina — 1 54 2 8 — 0 2 — — — 0 2 — 1Virginia 1 2 7 9 11 — 0 1 — — — 3 14 9 4West Virginia — 0 2 — — — 0 0 — — — 0 1 — —
E.S. Central 26 19 51 185 64 — 0 2 — — 1 4 25 7 5Alabama 1 6 21 47 29 — 0 1 — — — 1 8 2 3Kentucky 21 5 22 93 5 — 0 1 — — — 0 2 — —Mississippi — 4 24 27 11 — 0 0 — — — 0 2 — 1Tennessee 4 4 11 18 19 — 0 2 — — 1 4 20 5 1
W.S. Central 31 54 131 184 140 — 0 3 — — — 2 52 4 1Arkansas — 2 7 10 4 — 0 3 — — — 1 52 3 —Louisiana — 4 21 12 21 — 0 0 — — — 0 2 1 —Oklahoma 6 4 28 38 9 — 0 1 — — — 0 25 — —Texas 25 43 101 124 106 — 0 1 — — — 0 4 — 1
Mountain 1 13 41 36 100 — 0 3 — 4 — 1 7 4 4Arizona 1 6 27 25 39 — 0 3 — 4 — 0 6 1 4Colorado — 1 8 2 15 — 0 0 — — — 0 1 — —Idaho — 0 3 1 4 — 0 0 — — — 0 2 2 —Montana — 1 15 3 7 — 0 0 — — — 0 1 — —Nevada — 0 4 1 6 — 0 0 — — — 0 1 — —New Mexico — 2 6 3 23 — 0 0 — — — 0 0 — —Utah — 1 4 1 6 — 0 0 — — — 0 1 1 —Wyoming — 0 1 — — — 0 0 — — — 0 2 — —
Pacific 16 19 44 81 156 — 0 2 1 — — 0 1 1 —Alaska — 0 2 2 1 N 0 0 N N N 0 0 N NCalifornia 15 14 41 68 132 — 0 2 1 — — 0 1 1 —Hawaii — 1 3 1 12 N 0 0 N N N 0 0 N NOregon — 1 4 7 7 — 0 0 — — — 0 0 — —Washington 1 1 9 3 4 — 0 0 — — — 0 0 — —
TerritoriesAmerican Samoa — 0 0 — 1 N 0 0 N N N 0 0 N NC.N.M.I. — — — — — — — — — — — — — — —Guam — 0 1 — — N 0 0 N N N 0 0 N NPuerto Rico — 0 0 — — N 0 0 N N N 0 0 N NU.S. Virgin Islands — 0 0 — — — 0 0 — — — 0 0 — —
C.N.M.I.: Commonwealth of Northern Mariana Islands.U: Unavailable. —: No reported cases. N: Not reportable. NN: Not Nationally Notifiable. Cum: Cumulative year-to-date counts. Med: Median. Max: Maximum.* Case counts for reporting year 2011 and 2012 are provisional and subject to change. For further information on interpretation of these data, see http://www.cdc.gov/osels/ph_surveillance/
nndss/phs/files/ProvisionalNationa%20NotifiableDiseasesSurveillanceData20100927.pdf. Data for TB are displayed in Table IV, which appears quarterly.† Illnesses with similar clinical presentation that result from Spotted fever group rickettsia infections are reported as Spotted fever rickettsioses. Rocky Mountain spotted fever (RMSF) caused
by Rickettsia rickettsii, is the most common and well-known spotted fever.
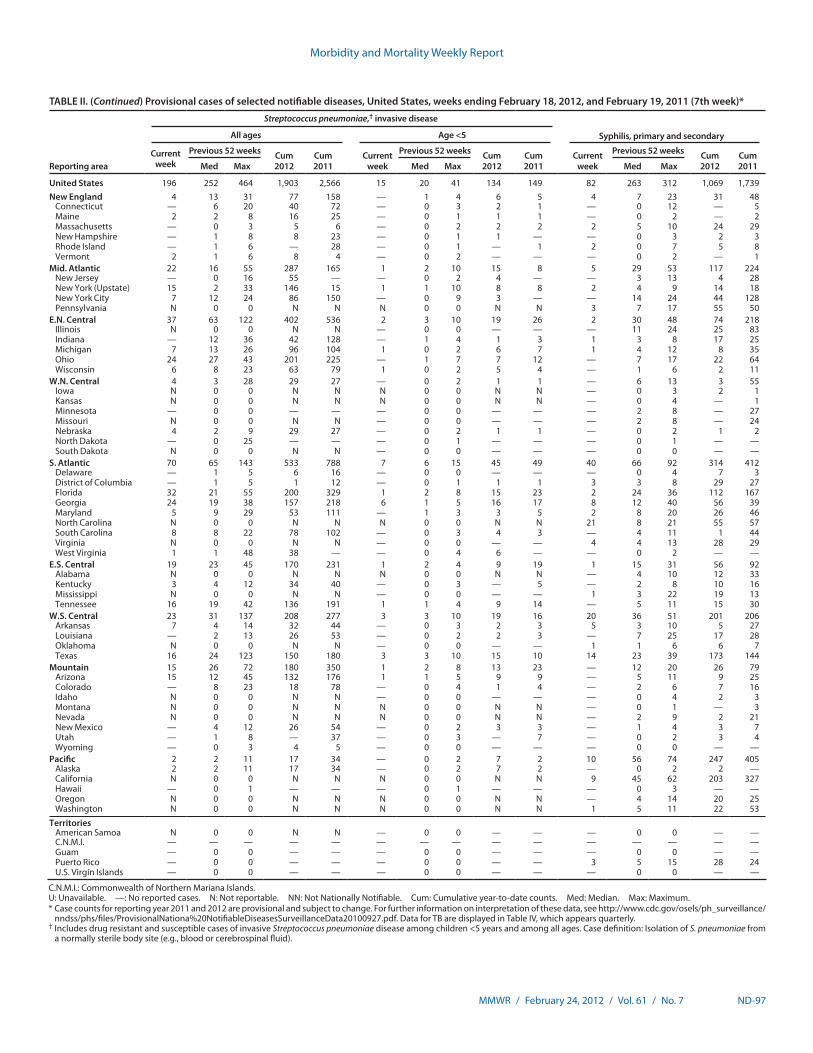
Morbidity and Mortality Weekly Report
MMWR / February 24, 2012 / Vol. 61 / No. 7 ND-97
TABLE II. (Continued) Provisional cases of selected notifiable diseases, United States, weeks ending February 18, 2012, and February 19, 2011 (7th week)*
Reporting area
Streptococcus pneumoniae,† invasive disease
Syphilis, primary and secondaryAll ages Age <5
Current week
Previous 52 weeks Cum 2012
Cum 2011
Current week
Previous 52 weeks Cum 2012
Cum 2011
Current week
Previous 52 weeks Cum 2012
Cum 2011Med Max Med Max Med Max
United States 196 252 464 1,903 2,566 15 20 41 134 149 82 263 312 1,069 1,739New England 4 13 31 77 158 — 1 4 6 5 4 7 23 31 48
Connecticut — 6 20 40 72 — 0 3 2 1 — 0 12 — 5Maine 2 2 8 16 25 — 0 1 1 1 — 0 2 — 2Massachusetts — 0 3 5 6 — 0 2 2 2 2 5 10 24 29New Hampshire — 1 8 8 23 — 0 1 1 — — 0 3 2 3Rhode Island — 1 6 — 28 — 0 1 — 1 2 0 7 5 8Vermont 2 1 6 8 4 — 0 2 — — — 0 2 — 1
Mid. Atlantic 22 16 55 287 165 1 2 10 15 8 5 29 53 117 224New Jersey — 0 16 55 — — 0 2 4 — — 3 13 4 28New York (Upstate) 15 2 33 146 15 1 1 10 8 8 2 4 9 14 18New York City 7 12 24 86 150 — 0 9 3 — — 14 24 44 128Pennsylvania N 0 0 N N N 0 0 N N 3 7 17 55 50
E.N. Central 37 63 122 402 536 2 3 10 19 26 2 30 48 74 218Illinois N 0 0 N N — 0 0 — — — 11 24 25 83Indiana — 12 36 42 128 — 1 4 1 3 1 3 8 17 25Michigan 7 13 26 96 104 1 0 2 6 7 1 4 12 8 35Ohio 24 27 43 201 225 — 1 7 7 12 — 7 17 22 64Wisconsin 6 8 23 63 79 1 0 2 5 4 — 1 6 2 11
W.N. Central 4 3 28 29 27 — 0 2 1 1 — 6 13 3 55Iowa N 0 0 N N N 0 0 N N — 0 3 2 1Kansas N 0 0 N N N 0 0 N N — 0 4 — 1Minnesota — 0 0 — — — 0 0 — — — 2 8 — 27Missouri N 0 0 N N — 0 0 — — — 2 8 — 24Nebraska 4 2 9 29 27 — 0 2 1 1 — 0 2 1 2North Dakota — 0 25 — — — 0 1 — — — 0 1 — —South Dakota N 0 0 N N — 0 0 — — — 0 0 — —
S. Atlantic 70 65 143 533 788 7 6 15 45 49 40 66 92 314 412Delaware — 1 5 6 16 — 0 0 — — — 0 4 7 3District of Columbia — 1 5 1 12 — 0 1 1 1 3 3 8 29 27Florida 32 21 55 200 329 1 2 8 15 23 2 24 36 112 167Georgia 24 19 38 157 218 6 1 5 16 17 8 12 40 56 39Maryland 5 9 29 53 111 — 1 3 3 5 2 8 20 26 46North Carolina N 0 0 N N N 0 0 N N 21 8 21 55 57South Carolina 8 8 22 78 102 — 0 3 4 3 — 4 11 1 44Virginia N 0 0 N N — 0 0 — — 4 4 13 28 29West Virginia 1 1 48 38 — — 0 4 6 — — 0 2 — —
E.S. Central 19 23 45 170 231 1 2 4 9 19 1 15 31 56 92Alabama N 0 0 N N N 0 0 N N — 4 10 12 33Kentucky 3 4 12 34 40 — 0 3 — 5 — 2 8 10 16Mississippi N 0 0 N N — 0 0 — — 1 3 22 19 13Tennessee 16 19 42 136 191 1 1 4 9 14 — 5 11 15 30
W.S. Central 23 31 137 208 277 3 3 10 19 16 20 36 51 201 206Arkansas 7 4 14 32 44 — 0 3 2 3 5 3 10 5 27Louisiana — 2 13 26 53 — 0 2 2 3 — 7 25 17 28Oklahoma N 0 0 N N — 0 0 — — 1 1 6 6 7Texas 16 24 123 150 180 3 3 10 15 10 14 23 39 173 144
Mountain 15 26 72 180 350 1 2 8 13 23 — 12 20 26 79Arizona 15 12 45 132 176 1 1 5 9 9 — 5 11 9 25Colorado — 8 23 18 78 — 0 4 1 4 — 2 6 7 16Idaho N 0 0 N N — 0 0 — — — 0 4 2 3Montana N 0 0 N N N 0 0 N N — 0 1 — 3Nevada N 0 0 N N N 0 0 N N — 2 9 2 21New Mexico — 4 12 26 54 — 0 2 3 3 — 1 4 3 7Utah — 1 8 — 37 — 0 3 — 7 — 0 2 3 4Wyoming — 0 3 4 5 — 0 0 — — — 0 0 — —
Pacific 2 2 11 17 34 — 0 2 7 2 10 56 74 247 405Alaska 2 2 11 17 34 — 0 2 7 2 — 0 2 2 —California N 0 0 N N N 0 0 N N 9 45 62 203 327Hawaii — 0 1 — — — 0 1 — — — 0 3 — —Oregon N 0 0 N N N 0 0 N N — 4 14 20 25Washington N 0 0 N N N 0 0 N N 1 5 11 22 53
TerritoriesAmerican Samoa N 0 0 N N — 0 0 — — — 0 0 — —C.N.M.I. — — — — — — — — — — — — — — —Guam — 0 0 — — — 0 0 — — — 0 0 — —Puerto Rico — 0 0 — — — 0 0 — — 3 5 15 28 24U.S. Virgin Islands — 0 0 — — — 0 0 — — — 0 0 — —
C.N.M.I.: Commonwealth of Northern Mariana Islands.U: Unavailable. —: No reported cases. N: Not reportable. NN: Not Nationally Notifiable. Cum: Cumulative year-to-date counts. Med: Median. Max: Maximum.* Case counts for reporting year 2011 and 2012 are provisional and subject to change. For further information on interpretation of these data, see http://www.cdc.gov/osels/ph_surveillance/
nndss/phs/files/ProvisionalNationa%20NotifiableDiseasesSurveillanceData20100927.pdf. Data for TB are displayed in Table IV, which appears quarterly.† Includes drug resistant and susceptible cases of invasive Streptococcus pneumoniae disease among children <5 years and among all ages. Case definition: Isolation of S. pneumoniae from
a normally sterile body site (e.g., blood or cerebrospinal fluid).
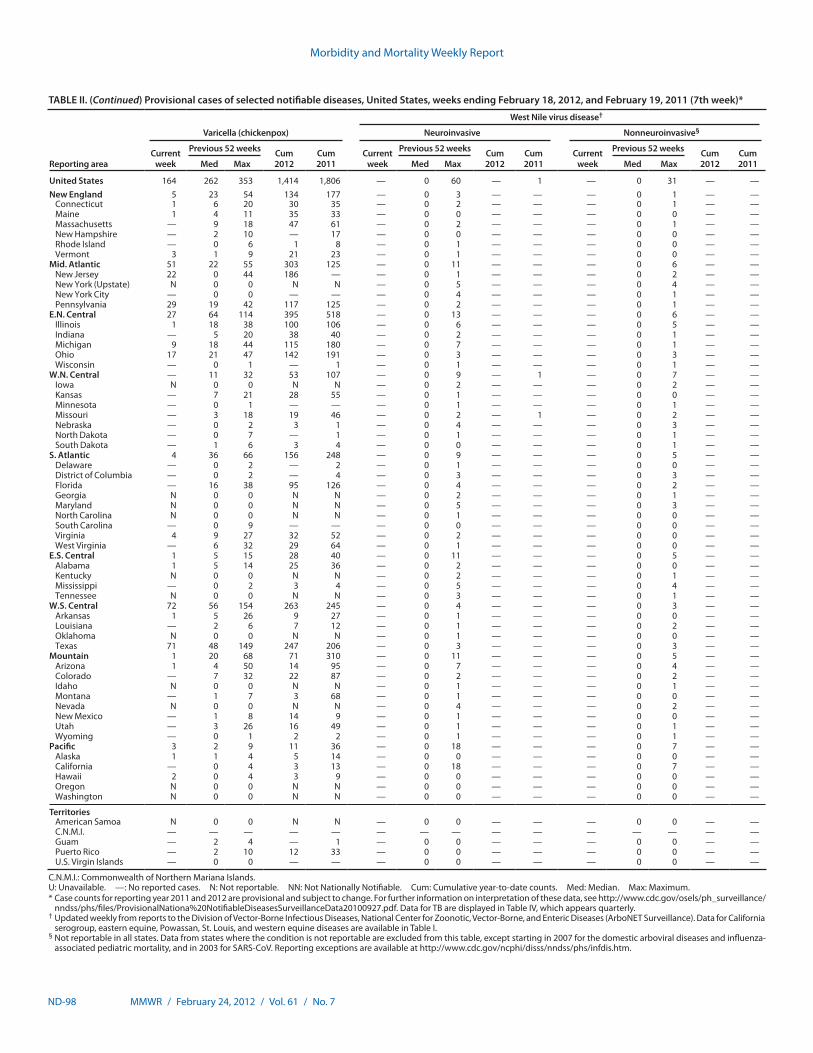
Morbidity and Mortality Weekly Report
ND-98 MMWR / February 24, 2012 / Vol. 61 / No. 7
TABLE II. (Continued) Provisional cases of selected notifiable diseases, United States, weeks ending February 18, 2012, and February 19, 2011 (7th week)*
Reporting area
Varicella (chickenpox)
West Nile virus disease†
Neuroinvasive Nonneuroinvasive§
Current week
Previous 52 weeks Cum 2012
Cum 2011
Current week
Previous 52 weeks Cum 2012
Cum 2011
Current week
Previous 52 weeks Cum 2012
Cum 2011Med Max Med Max Med Max
United States 164 262 353 1,414 1,806 — 0 60 — 1 — 0 31 — —New England 5 23 54 134 177 — 0 3 — — — 0 1 — —
Connecticut 1 6 20 30 35 — 0 2 — — — 0 1 — —Maine 1 4 11 35 33 — 0 0 — — — 0 0 — —Massachusetts — 9 18 47 61 — 0 2 — — — 0 1 — —New Hampshire — 2 10 — 17 — 0 0 — — — 0 0 — —Rhode Island — 0 6 1 8 — 0 1 — — — 0 0 — —Vermont 3 1 9 21 23 — 0 1 — — — 0 0 — —
Mid. Atlantic 51 22 55 303 125 — 0 11 — — — 0 6 — —New Jersey 22 0 44 186 — — 0 1 — — — 0 2 — —New York (Upstate) N 0 0 N N — 0 5 — — — 0 4 — —New York City — 0 0 — — — 0 4 — — — 0 1 — —Pennsylvania 29 19 42 117 125 — 0 2 — — — 0 1 — —
E.N. Central 27 64 114 395 518 — 0 13 — — — 0 6 — —Illinois 1 18 38 100 106 — 0 6 — — — 0 5 — —Indiana — 5 20 38 40 — 0 2 — — — 0 1 — —Michigan 9 18 44 115 180 — 0 7 — — — 0 1 — —Ohio 17 21 47 142 191 — 0 3 — — — 0 3 — —Wisconsin — 0 1 — 1 — 0 1 — — — 0 1 — —
W.N. Central — 11 32 53 107 — 0 9 — 1 — 0 7 — —Iowa N 0 0 N N — 0 2 — — — 0 2 — —Kansas — 7 21 28 55 — 0 1 — — — 0 0 — —Minnesota — 0 1 — — — 0 1 — — — 0 1 — —Missouri — 3 18 19 46 — 0 2 — 1 — 0 2 — —Nebraska — 0 2 3 1 — 0 4 — — — 0 3 — —North Dakota — 0 7 — 1 — 0 1 — — — 0 1 — —South Dakota — 1 6 3 4 — 0 0 — — — 0 1 — —
S. Atlantic 4 36 66 156 248 — 0 9 — — — 0 5 — —Delaware — 0 2 — 2 — 0 1 — — — 0 0 — —District of Columbia — 0 2 — 4 — 0 3 — — — 0 3 — —Florida — 16 38 95 126 — 0 4 — — — 0 2 — —Georgia N 0 0 N N — 0 2 — — — 0 1 — —Maryland N 0 0 N N — 0 5 — — — 0 3 — —North Carolina N 0 0 N N — 0 1 — — — 0 0 — —South Carolina — 0 9 — — — 0 0 — — — 0 0 — —Virginia 4 9 27 32 52 — 0 2 — — — 0 0 — —West Virginia — 6 32 29 64 — 0 1 — — — 0 0 — —
E.S. Central 1 5 15 28 40 — 0 11 — — — 0 5 — —Alabama 1 5 14 25 36 — 0 2 — — — 0 0 — —Kentucky N 0 0 N N — 0 2 — — — 0 1 — —Mississippi — 0 2 3 4 — 0 5 — — — 0 4 — —Tennessee N 0 0 N N — 0 3 — — — 0 1 — —
W.S. Central 72 56 154 263 245 — 0 4 — — — 0 3 — —Arkansas 1 5 26 9 27 — 0 1 — — — 0 0 — —Louisiana — 2 6 7 12 — 0 1 — — — 0 2 — —Oklahoma N 0 0 N N — 0 1 — — — 0 0 — —Texas 71 48 149 247 206 — 0 3 — — — 0 3 — —
Mountain 1 20 68 71 310 — 0 11 — — — 0 5 — —Arizona 1 4 50 14 95 — 0 7 — — — 0 4 — —Colorado — 7 32 22 87 — 0 2 — — — 0 2 — —Idaho N 0 0 N N — 0 1 — — — 0 1 — —Montana — 1 7 3 68 — 0 1 — — — 0 0 — —Nevada N 0 0 N N — 0 4 — — — 0 2 — —New Mexico — 1 8 14 9 — 0 1 — — — 0 0 — —Utah — 3 26 16 49 — 0 1 — — — 0 1 — —Wyoming — 0 1 2 2 — 0 1 — — — 0 1 — —
Pacific 3 2 9 11 36 — 0 18 — — — 0 7 — —Alaska 1 1 4 5 14 — 0 0 — — — 0 0 — —California — 0 4 3 13 — 0 18 — — — 0 7 — —Hawaii 2 0 4 3 9 — 0 0 — — — 0 0 — —Oregon N 0 0 N N — 0 0 — — — 0 0 — —Washington N 0 0 N N — 0 0 — — — 0 0 — —
TerritoriesAmerican Samoa N 0 0 N N — 0 0 — — — 0 0 — —C.N.M.I. — — — — — — — — — — — — — — —Guam — 2 4 — 1 — 0 0 — — — 0 0 — —Puerto Rico — 2 10 12 33 — 0 0 — — — 0 0 — —U.S. Virgin Islands — 0 0 — — — 0 0 — — — 0 0 — —
C.N.M.I.: Commonwealth of Northern Mariana Islands.U: Unavailable. —: No reported cases. N: Not reportable. NN: Not Nationally Notifiable. Cum: Cumulative year-to-date counts. Med: Median. Max: Maximum.* Case counts for reporting year 2011 and 2012 are provisional and subject to change. For further information on interpretation of these data, see http://www.cdc.gov/osels/ph_surveillance/
nndss/phs/files/ProvisionalNationa%20NotifiableDiseasesSurveillanceData20100927.pdf. Data for TB are displayed in Table IV, which appears quarterly.† Updated weekly from reports to the Division of Vector-Borne Infectious Diseases, National Center for Zoonotic, Vector-Borne, and Enteric Diseases (ArboNET Surveillance). Data for California
serogroup, eastern equine, Powassan, St. Louis, and western equine diseases are available in Table I.§ Not reportable in all states. Data from states where the condition is not reportable are excluded from this table, except starting in 2007 for the domestic arboviral diseases and influenza-
associated pediatric mortality, and in 2003 for SARS-CoV. Reporting exceptions are available at http://www.cdc.gov/ncphi/disss/nndss/phs/infdis.htm.
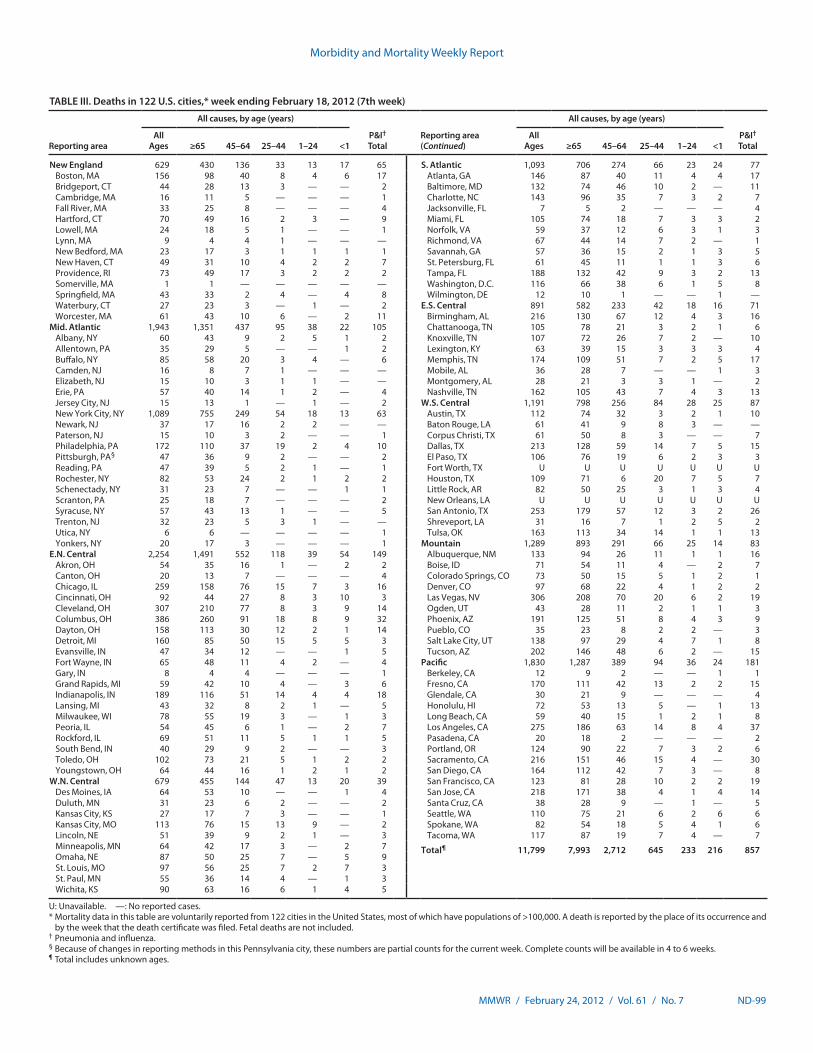
Morbidity and Mortality Weekly Report
MMWR / February 24, 2012 / Vol. 61 / No. 7 ND-99
TABLE III. Deaths in 122 U.S. cities,* week ending February 18, 2012 (7th week)
Reporting area
All causes, by age (years)
P&I† Total
Reporting area (Continued)
All causes, by age (years)
P&I† Total
All Ages ≥65 45–64 25–44 1–24 <1
All Ages ≥65 45–64 25–44 1–24 <1
New England 629 430 136 33 13 17 65 S. Atlantic 1,093 706 274 66 23 24 77Boston, MA 156 98 40 8 4 6 17 Atlanta, GA 146 87 40 11 4 4 17Bridgeport, CT 44 28 13 3 — — 2 Baltimore, MD 132 74 46 10 2 — 11Cambridge, MA 16 11 5 — — — 1 Charlotte, NC 143 96 35 7 3 2 7Fall River, MA 33 25 8 — — — 4 Jacksonville, FL 7 5 2 — — — 4Hartford, CT 70 49 16 2 3 — 9 Miami, FL 105 74 18 7 3 3 2Lowell, MA 24 18 5 1 — — 1 Norfolk, VA 59 37 12 6 3 1 3Lynn, MA 9 4 4 1 — — — Richmond, VA 67 44 14 7 2 — 1New Bedford, MA 23 17 3 1 1 1 1 Savannah, GA 57 36 15 2 1 3 5New Haven, CT 49 31 10 4 2 2 7 St. Petersburg, FL 61 45 11 1 1 3 6Providence, RI 73 49 17 3 2 2 2 Tampa, FL 188 132 42 9 3 2 13Somerville, MA 1 1 — — — — — Washington, D.C. 116 66 38 6 1 5 8Springfield, MA 43 33 2 4 — 4 8 Wilmington, DE 12 10 1 — — 1 —Waterbury, CT 27 23 3 — 1 — 2 E.S. Central 891 582 233 42 18 16 71Worcester, MA 61 43 10 6 — 2 11 Birmingham, AL 216 130 67 12 4 3 16
Mid. Atlantic 1,943 1,351 437 95 38 22 105 Chattanooga, TN 105 78 21 3 2 1 6Albany, NY 60 43 9 2 5 1 2 Knoxville, TN 107 72 26 7 2 — 10Allentown, PA 35 29 5 — — 1 2 Lexington, KY 63 39 15 3 3 3 4Buffalo, NY 85 58 20 3 4 — 6 Memphis, TN 174 109 51 7 2 5 17Camden, NJ 16 8 7 1 — — — Mobile, AL 36 28 7 — — 1 3Elizabeth, NJ 15 10 3 1 1 — — Montgomery, AL 28 21 3 3 1 — 2Erie, PA 57 40 14 1 2 — 4 Nashville, TN 162 105 43 7 4 3 13Jersey City, NJ 15 13 1 — 1 — 2 W.S. Central 1,191 798 256 84 28 25 87New York City, NY 1,089 755 249 54 18 13 63 Austin, TX 112 74 32 3 2 1 10Newark, NJ 37 17 16 2 2 — — Baton Rouge, LA 61 41 9 8 3 — —Paterson, NJ 15 10 3 2 — — 1 Corpus Christi, TX 61 50 8 3 — — 7Philadelphia, PA 172 110 37 19 2 4 10 Dallas, TX 213 128 59 14 7 5 15Pittsburgh, PA§ 47 36 9 2 — — 2 El Paso, TX 106 76 19 6 2 3 3Reading, PA 47 39 5 2 1 — 1 Fort Worth, TX U U U U U U URochester, NY 82 53 24 2 1 2 2 Houston, TX 109 71 6 20 7 5 7Schenectady, NY 31 23 7 — — 1 1 Little Rock, AR 82 50 25 3 1 3 4Scranton, PA 25 18 7 — — — 2 New Orleans, LA U U U U U U USyracuse, NY 57 43 13 1 — — 5 San Antonio, TX 253 179 57 12 3 2 26Trenton, NJ 32 23 5 3 1 — — Shreveport, LA 31 16 7 1 2 5 2Utica, NY 6 6 — — — — 1 Tulsa, OK 163 113 34 14 1 1 13Yonkers, NY 20 17 3 — — — 1 Mountain 1,289 893 291 66 25 14 83
E.N. Central 2,254 1,491 552 118 39 54 149 Albuquerque, NM 133 94 26 11 1 1 16Akron, OH 54 35 16 1 — 2 2 Boise, ID 71 54 11 4 — 2 7Canton, OH 20 13 7 — — — 4 Colorado Springs, CO 73 50 15 5 1 2 1Chicago, IL 259 158 76 15 7 3 16 Denver, CO 97 68 22 4 1 2 2Cincinnati, OH 92 44 27 8 3 10 3 Las Vegas, NV 306 208 70 20 6 2 19Cleveland, OH 307 210 77 8 3 9 14 Ogden, UT 43 28 11 2 1 1 3Columbus, OH 386 260 91 18 8 9 32 Phoenix, AZ 191 125 51 8 4 3 9Dayton, OH 158 113 30 12 2 1 14 Pueblo, CO 35 23 8 2 2 — 3Detroit, MI 160 85 50 15 5 5 3 Salt Lake City, UT 138 97 29 4 7 1 8Evansville, IN 47 34 12 — — 1 5 Tucson, AZ 202 146 48 6 2 — 15Fort Wayne, IN 65 48 11 4 2 — 4 Pacific 1,830 1,287 389 94 36 24 181Gary, IN 8 4 4 — — — 1 Berkeley, CA 12 9 2 — — 1 1Grand Rapids, MI 59 42 10 4 — 3 6 Fresno, CA 170 111 42 13 2 2 15Indianapolis, IN 189 116 51 14 4 4 18 Glendale, CA 30 21 9 — — — 4Lansing, MI 43 32 8 2 1 — 5 Honolulu, HI 72 53 13 5 — 1 13Milwaukee, WI 78 55 19 3 — 1 3 Long Beach, CA 59 40 15 1 2 1 8Peoria, IL 54 45 6 1 — 2 7 Los Angeles, CA 275 186 63 14 8 4 37Rockford, IL 69 51 11 5 1 1 5 Pasadena, CA 20 18 2 — — — 2South Bend, IN 40 29 9 2 — — 3 Portland, OR 124 90 22 7 3 2 6Toledo, OH 102 73 21 5 1 2 2 Sacramento, CA 216 151 46 15 4 — 30Youngstown, OH 64 44 16 1 2 1 2 San Diego, CA 164 112 42 7 3 — 8
W.N. Central 679 455 144 47 13 20 39 San Francisco, CA 123 81 28 10 2 2 19Des Moines, IA 64 53 10 — — 1 4 San Jose, CA 218 171 38 4 1 4 14Duluth, MN 31 23 6 2 — — 2 Santa Cruz, CA 38 28 9 — 1 — 5Kansas City, KS 27 17 7 3 — — 1 Seattle, WA 110 75 21 6 2 6 6Kansas City, MO 113 76 15 13 9 — 2 Spokane, WA 82 54 18 5 4 1 6Lincoln, NE 51 39 9 2 1 — 3 Tacoma, WA 117 87 19 7 4 — 7Minneapolis, MN 64 42 17 3 — 2 7 Total¶ 11,799 7,993 2,712 645 233 216 857Omaha, NE 87 50 25 7 — 5 9St. Louis, MO 97 56 25 7 2 7 3St. Paul, MN 55 36 14 4 — 1 3Wichita, KS 90 63 16 6 1 4 5
U: Unavailable. —: No reported cases.* Mortality data in this table are voluntarily reported from 122 cities in the United States, most of which have populations of >100,000. A death is reported by the place of its occurrence and
by the week that the death certificate was filed. Fetal deaths are not included.† Pneumonia and influenza.§ Because of changes in reporting methods in this Pennsylvania city, these numbers are partial counts for the current week. Complete counts will be available in 4 to 6 weeks.¶ Total includes unknown ages.
U.S. Government Printing Office: 2012-523-043/21105 Region IV ISSN: 0149-2195
The Morbidity and Mortality Weekly Report (MMWR) Series is prepared by the Centers for Disease Control and Prevention (CDC) and is available free of charge in electronic format. To receive an electronic copy each week, visit MMWR’s free subscription page at http://www.cdc.gov/mmwr/mmwrsubscribe.html. Paper copy subscriptions are available through the Superintendent of Documents, U.S. Government Printing Office, Washington, DC 20402; telephone 202-512-1800.
Data presented by the Notifiable Disease Data Team and 122 Cities Mortality Data Team in the weekly MMWR are provisional, based on weekly reports to CDC by state health departments. Address all inquiries about the MMWR Series, including material to be considered for publication, to Editor, MMWR Series, Mailstop E-90, CDC, 1600 Clifton Rd., N.E., Atlanta, GA 30333 or to [email protected].
All material in the MMWR Series is in the public domain and may be used and reprinted without permission; citation as to source, however, is appreciated.
Use of trade names and commercial sources is for identification only and does not imply endorsement by the U.S. Department of Health and Human Services.
References to non-CDC sites on the Internet are provided as a service to MMWR readers and do not constitute or imply endorsement of these organizations or their programs by CDC or the U.S. Department of Health and Human Services. CDC is not responsible for the content of these sites. URL addresses listed in MMWR were current as of the date of publication.
Morbidity and Mortality Weekly Report