Embed Size (px)
DESCRIPTION
Multi-wire submerged arc welding (SAW) process is conventionally used for long welds with large cross sections in tubular steel tower manufacturing. By applying non-vacuum electron beam welding (NVEBW), the number of passes and the heat input can be notably reduced. For plate thicknesses of 20 mm or more the continuous appearance of solidification cracks inside the weld cross section rouse a great challenge. The fatigue resistance is reduced significantly and the safety of the component cannot be ensured. In this paper analytical and experimental investigations are discussed for predicting fatigue life of defective welds.
Citation preview
Procedia Engineering 66 ( 2013 ) 508 – 521
Available online at www.sciencedirect.com
1877-7058 © 2013 The Authors. Published by Elsevier Ltd. Selection and peer-review under responsibility of CETIM doi: 10.1016/j.proeng.2013.12.103
ScienceDirect
5th Fatigue Design Conference, Fatigue Design 2013
Fatigue of structures in mechanical vibratory environment. From mission profiling to fatigue life prediction.
M. Bennebacha*, H. Rognona, O. Bardoua aCETIM, 52 avenue felix Louat, 60304 Senlis cedex, France
Abstract
The durability of components operating in a mechanical vibratory environment is usually validated on shaker rigs, using an accelerated simplified test derived from mission profiling and test synthesis process. The basis of this method is damage equivalence, the accelerated test leading to the same fatigue damage content as that observed in real service conditions. Numerical simulation can help optimizing this process, allowing verifying that the synthetic test is realistic, and giving the damage distribution based on real material behaviour laws. The complete approach will be described in this paper and illustrated by some real applications. Extension of classical spectral methods to confined plasticity is also presented with laboratory experimental validation.
© 2013 The Authors. Published by Elsevier Ltd. Selection and peer-review under responsibility of CETIM, Direction de l'Agence de Programme.
Keywords: mission synthesis; vibration fatigue; spectral methods
1. Introduction
Many components in service need to be designed in order to withstand a mechanical vibratory environment all along their service life. Their validation is usually done by accelerated laboratory testing and can be optimized by numerical simulation. The process has been initially based on specifications given by national or international standards. However most of the time these prove to be too conservative and inadequate for design optimization. Achieving this goal is only possible when using specifications based on real service conditions, through a
* Corresponding author. Tel.: +33 3 44 67 47 06 E-mail address: [email protected]
© 2013 The Authors. Published by Elsevier Ltd. Open access under CC BY-NC-ND license.Selection and peer-review under responsibility of CETIM
Open access under CC BY-NC-ND license.
509 M. Bennebach et al. / Procedia Engineering 66 ( 2013 ) 508 – 521
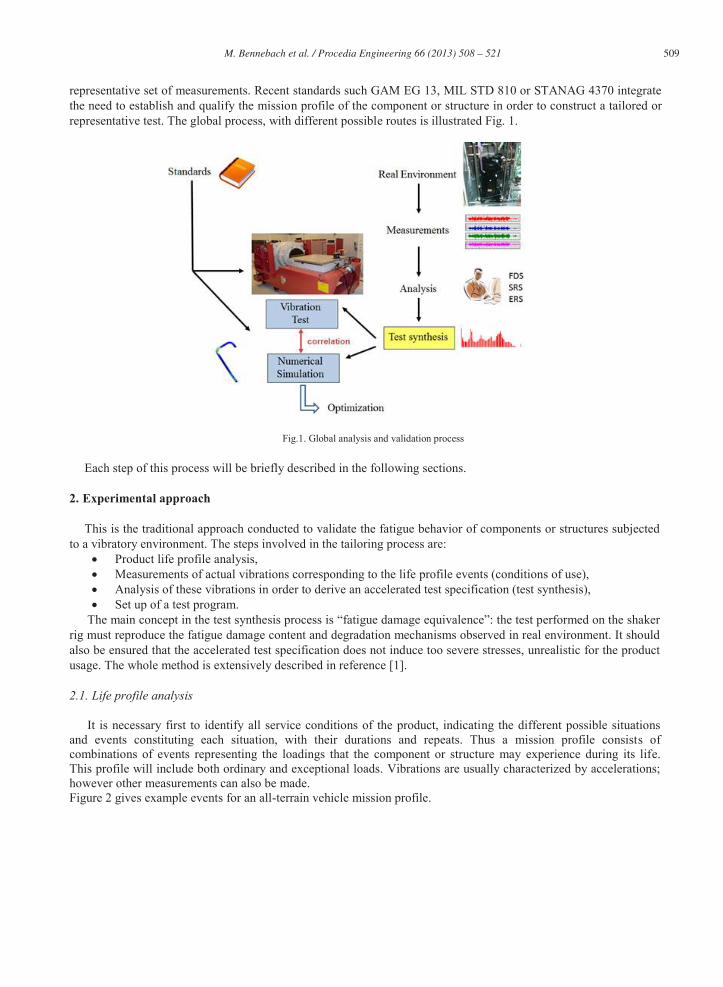
representative set of measurements. Recent standards such GAM EG 13, MIL STD 810 or STANAG 4370 integrate the need to establish and qualify the mission profile of the component or structure in order to construct a tailored or representative test. The global process, with different possible routes is illustrated Fig. 1.
Fig.1. Global analysis and validation process
Each step of this process will be briefly described in the following sections.
2. Experimental approach
This is the traditional approach conducted to validate the fatigue behavior of components or structures subjected to a vibratory environment. The steps involved in the tailoring process are:
Product life profile analysis, Measurements of actual vibrations corresponding to the life profile events (conditions of use), Analysis of these vibrations in order to derive an accelerated test specification (test synthesis), Set up of a test program.
The main concept in the test synthesis process is “fatigue damage equivalence”: the test performed on the shaker rig must reproduce the fatigue damage content and degradation mechanisms observed in real environment. It should also be ensured that the accelerated test specification does not induce too severe stresses, unrealistic for the product usage. The whole method is extensively described in reference [1].
2.1. Life profile analysis
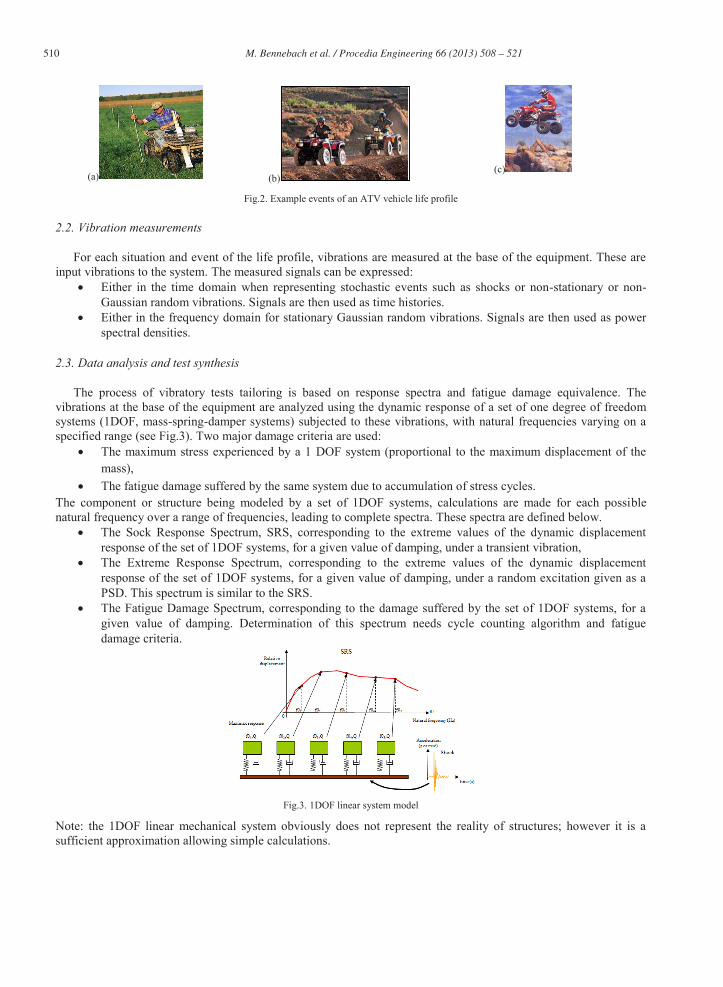
It is necessary first to identify all service conditions of the product, indicating the different possible situations and events constituting each situation, with their durations and repeats. Thus a mission profile consists of combinations of events representing the loadings that the component or structure may experience during its life. This profile will include both ordinary and exceptional loads. Vibrations are usually characterized by accelerations; however other measurements can also be made. Figure 2 gives example events for an all-terrain vehicle mission profile.
510 M. Bennebach et al. / Procedia Engineering 66 ( 2013 ) 508 – 521
(a) (b) (c)
Fig.2. Example events of an ATV vehicle life profile
2.2. Vibration measurements
For each situation and event of the life profile, vibrations are measured at the base of the equipment. These are input vibrations to the system. The measured signals can be expressed:
Either in the time domain when representing stochastic events such as shocks or non-stationary or non-Gaussian random vibrations. Signals are then used as time histories.
Either in the frequency domain for stationary Gaussian random vibrations. Signals are then used as power spectral densities.
2.3. Data analysis and test synthesis
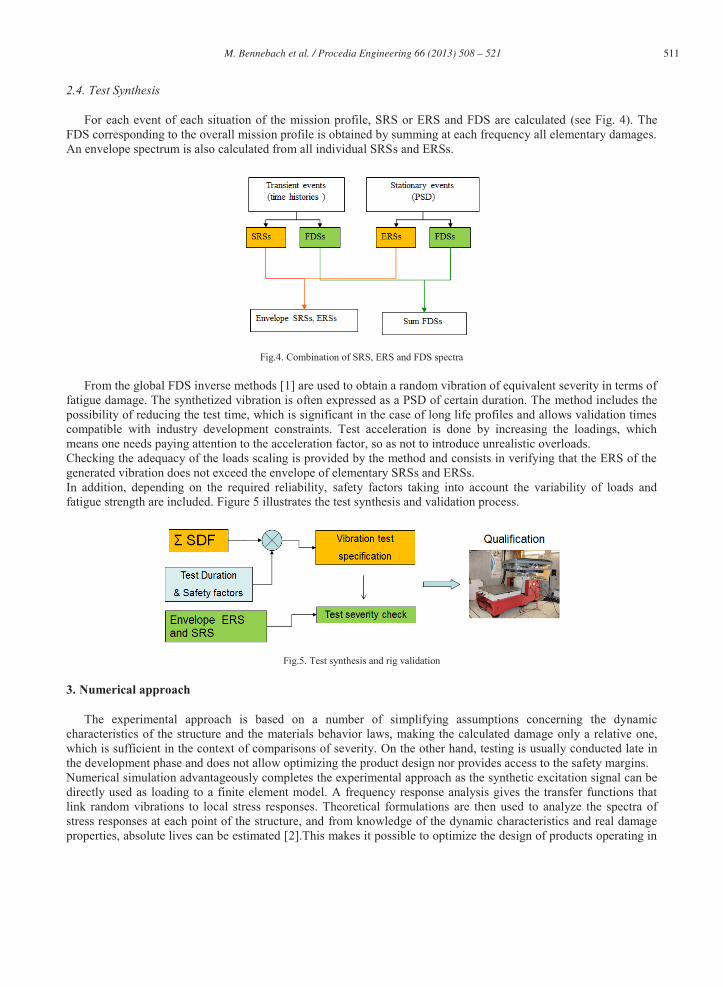
The process of vibratory tests tailoring is based on response spectra and fatigue damage equivalence. The vibrations at the base of the equipment are analyzed using the dynamic response of a set of one degree of freedom systems (1DOF, mass-spring-damper systems) subjected to these vibrations, with natural frequencies varying on a specified range (see Fig.3). Two major damage criteria are used:
The maximum stress experienced by a 1 DOF system (proportional to the maximum displacement of the mass),
The fatigue damage suffered by the same system due to accumulation of stress cycles. The component or structure being modeled by a set of 1DOF systems, calculations are made for each possible natural frequency over a range of frequencies, leading to complete spectra. These spectra are defined below.
The Sock Response Spectrum, SRS, corresponding to the extreme values of the dynamic displacement response of the set of 1DOF systems, for a given value of damping, under a transient vibration,
The Extreme Response Spectrum, corresponding to the extreme values of the dynamic displacement response of the set of 1DOF systems, for a given value of damping, under a random excitation given as a PSD. This spectrum is similar to the SRS.
The Fatigue Damage Spectrum, corresponding to the damage suffered by the set of 1DOF systems, for a given value of damping. Determination of this spectrum needs cycle counting algorithm and fatigue damage criteria.
Fig.3. 1DOF linear system model
Note: the 1DOF linear mechanical system obviously does not represent the reality of structures; however it is a sufficient approximation allowing simple calculations.
511 M. Bennebach et al. / Procedia Engineering 66 ( 2013 ) 508 – 521
2.4. Test Synthesis
For each event of each situation of the mission profile, SRS or ERS and FDS are calculated (see Fig. 4). The FDS corresponding to the overall mission profile is obtained by summing at each frequency all elementary damages. An envelope spectrum is also calculated from all individual SRSs and ERSs.
Fig.4. Combination of SRS, ERS and FDS spectra
From the global FDS inverse methods [1] are used to obtain a random vibration of equivalent severity in terms of fatigue damage. The synthetized vibration is often expressed as a PSD of certain duration. The method includes the possibility of reducing the test time, which is significant in the case of long life profiles and allows validation times compatible with industry development constraints. Test acceleration is done by increasing the loadings, which means one needs paying attention to the acceleration factor, so as not to introduce unrealistic overloads. Checking the adequacy of the loads scaling is provided by the method and consists in verifying that the ERS of the generated vibration does not exceed the envelope of elementary SRSs and ERSs. In addition, depending on the required reliability, safety factors taking into account the variability of loads and fatigue strength are included. Figure 5 illustrates the test synthesis and validation process.
Fig.5. Test synthesis and rig validation
3. Numerical approach
The experimental approach is based on a number of simplifying assumptions concerning the dynamic characteristics of the structure and the materials behavior laws, making the calculated damage only a relative one, which is sufficient in the context of comparisons of severity. On the other hand, testing is usually conducted late in the development phase and does not allow optimizing the product design nor provides access to the safety margins. Numerical simulation advantageously completes the experimental approach as the synthetic excitation signal can be directly used as loading to a finite element model. A frequency response analysis gives the transfer functions that link random vibrations to local stress responses. Theoretical formulations are then used to analyze the spectra of stress responses at each point of the structure, and from knowledge of the dynamic characteristics and real damage properties, absolute lives can be estimated [2].This makes it possible to optimize the design of products operating in
512 M. Bennebach et al. / Procedia Engineering 66 ( 2013 ) 508 – 521
vibratory environment and validate the acceleration factors applied at the experimental level, ensuring that they do not lead to unrealistic stresses.
Stress and damage analysis.
The starting point of any fatigue analysis is the response of the structure or component in terms of stresses or strains. In the case of vibrations, where significant dynamic effects may occur, transient or random vibration analysis methods must be used. Transient analysis is performed in the time domain and proves to be computationally intensive, which generally restricts it to short discrete events. Random vibration analysis concerns the frequency domain, with loads being specified in terms of power spectral density functions. This form of analysis is relatively quick as it is based on a simple transfer function calculation.
The basis of the fatigue life calculation is the stress range histogram obtained from the local stress response. In the time domain approach, this histogram is derived using the Rainflow counting algorithm [3]. In the frequency domain, where a transfer function analysis allows calculating a local stress PSD response from an acceleration PSD excitation, spectral methods are used to compute the stress histogram from the moments n of the stress PSD. Once this histogram obtained, fatigue damage can be calculated using a damage accumulation rule and a material life curve, such as respectively the Palmgren-Miner rule and Wöhler curve.
Among numerous spectral models proposed to estimate the probability density function of stress range P( )[2], Lalanne’s formulation based on a weighted sum of Rayleigh and Gauss distribution is given here as illustration:
)1.(.2.1
.2exp.
.2.
)1(.2exp.
..21)(
200
2
02
0
2
0
2
erfP
(1)
Where is the regularity factor calculated by 40
2
. .
The moments of the PSD are calculated from: 0
)( dffGf nn , Gσσ(f) value of the single sided stress PSD
at frequency f (Hz).
The error function is given by: x
dttxerf0
2 ).exp(2)(
The number of cycles of stress range σ expected in time T is given by: TPn a .).()(
Where a is the expected number of peaks: 2
4a
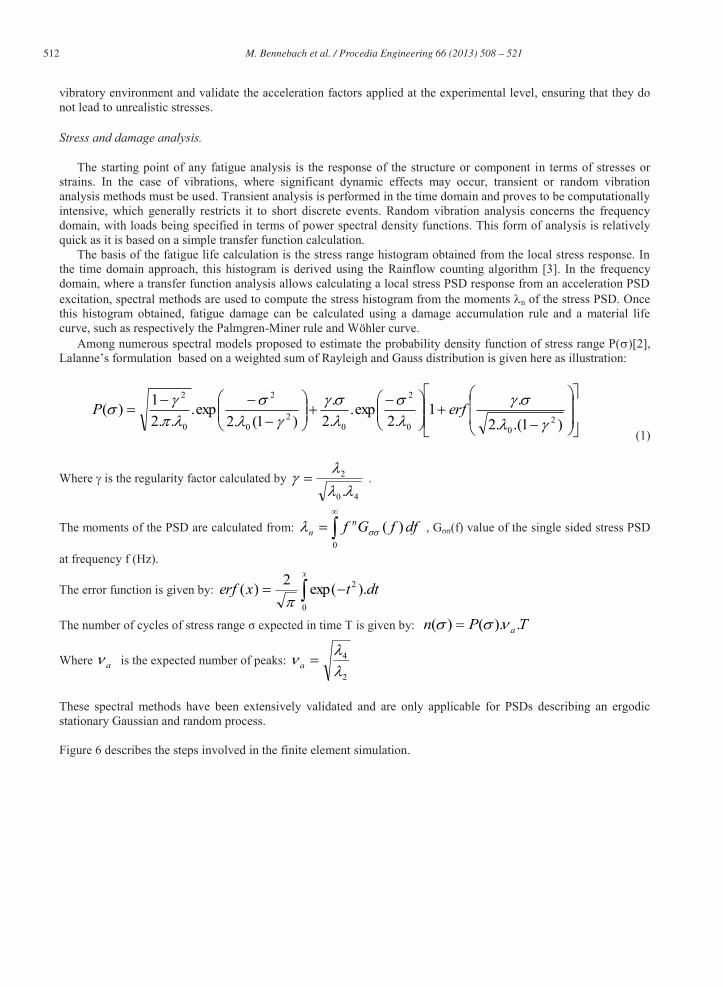
These spectral methods have been extensively validated and are only applicable for PSDs describing an ergodic stationary Gaussian and random process. Figure 6 describes the steps involved in the finite element simulation.
513 M. Bennebach et al. / Procedia Engineering 66 ( 2013 ) 508 – 521
Fig.6. Global numerical simulation process
4. Application cases
Mixed experimental and numerical approaches applied to frigorific machines tubes are presented. These tubes are submitted to vibrations of different kinds: starting and stopping shocks, periodic vibrations in stabilized regime, defrosting cycles; the main source being the compressor driving the machine. The equipment is characterized by a long expected life (>10 years), and to guarantee this life, special attention must be paid to the fatigue behavior of the tubing, and more specifically to the ones that are directly connected to the compressor.
4.1. Example 1: frigorific machines compressor discharge copper tube
Mission profile analysis of the tubes
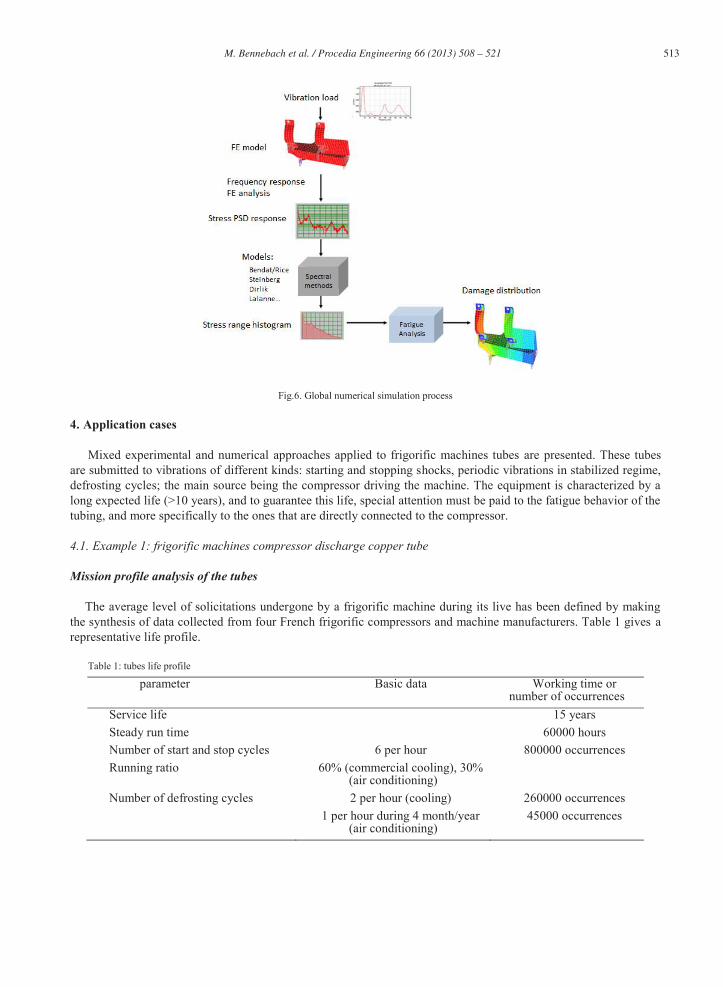
The average level of solicitations undergone by a frigorific machine during its live has been defined by making the synthesis of data collected from four French frigorific compressors and machine manufacturers. Table 1 gives a representative life profile.
Table 1: tubes life profile
parameter Basic data Working time or number of occurrences
Service life 15 years Steady run time 60000 hours Number of start and stop cycles 6 per hour 800000 occurrences Running ratio 60% (commercial cooling), 30%
(air conditioning)
Number of defrosting cycles 2 per hour (cooling) 1 per hour during 4 month/year
(air conditioning)
260000 occurrences 45000 occurrences
514 M. Bennebach et al. / Procedia Engineering 66 ( 2013 ) 508 – 521
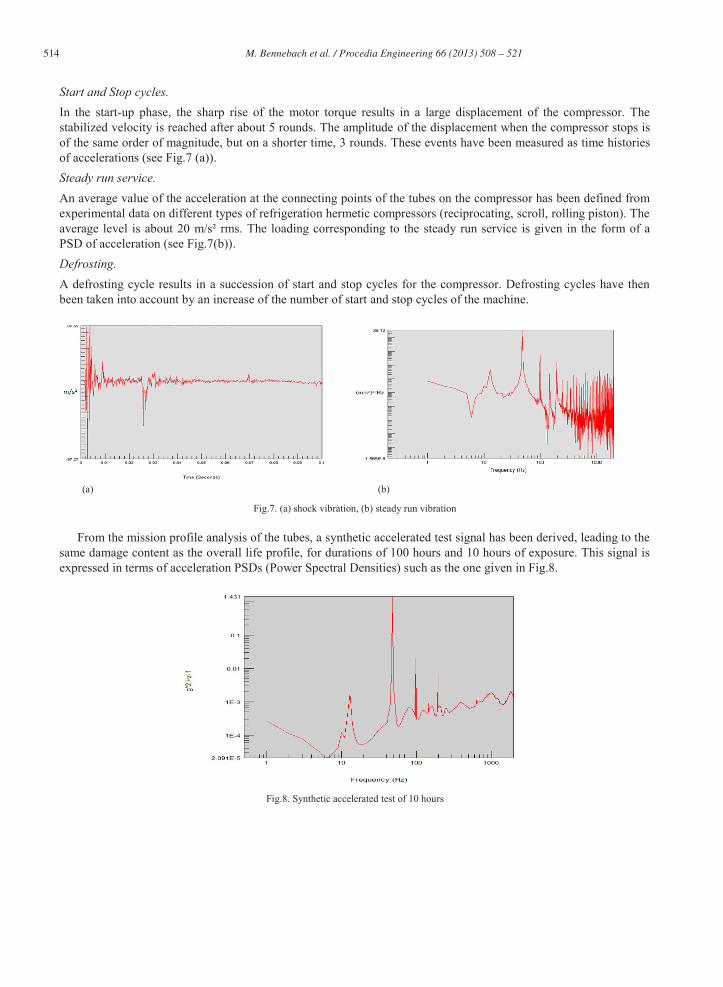
Start and Stop cycles. In the start-up phase, the sharp rise of the motor torque results in a large displacement of the compressor. The stabilized velocity is reached after about 5 rounds. The amplitude of the displacement when the compressor stops is of the same order of magnitude, but on a shorter time, 3 rounds. These events have been measured as time histories of accelerations (see Fig.7 (a)). Steady run service. An average value of the acceleration at the connecting points of the tubes on the compressor has been defined from experimental data on different types of refrigeration hermetic compressors (reciprocating, scroll, rolling piston). The average level is about 20 m/s² rms. The loading corresponding to the steady run service is given in the form of a PSD of acceleration (see Fig.7(b)). Defrosting. A defrosting cycle results in a succession of start and stop cycles for the compressor. Defrosting cycles have then been taken into account by an increase of the number of start and stop cycles of the machine.
(a) (b)
Fig.7. (a) shock vibration, (b) steady run vibration
From the mission profile analysis of the tubes, a synthetic accelerated test signal has been derived, leading to the same damage content as the overall life profile, for durations of 100 hours and 10 hours of exposure. This signal is expressed in terms of acceleration PSDs (Power Spectral Densities) such as the one given in Fig.8.
Fig.8. Synthetic accelerated test of 10 hours
515 M. Bennebach et al. / Procedia Engineering 66 ( 2013 ) 508 – 521
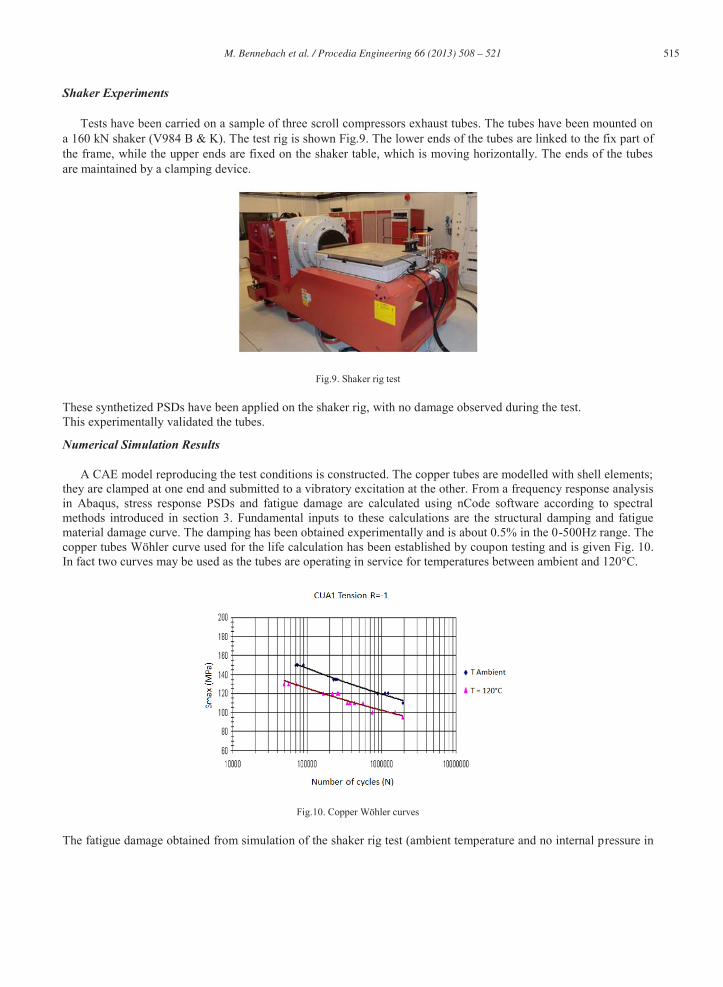
Shaker Experiments
Tests have been carried on a sample of three scroll compressors exhaust tubes. The tubes have been mounted on a 160 kN shaker (V984 B & K). The test rig is shown Fig.9. The lower ends of the tubes are linked to the fix part of the frame, while the upper ends are fixed on the shaker table, which is moving horizontally. The ends of the tubes are maintained by a clamping device.
Fig.9. Shaker rig test
These synthetized PSDs have been applied on the shaker rig, with no damage observed during the test. This experimentally validated the tubes.
Numerical Simulation Results
A CAE model reproducing the test conditions is constructed. The copper tubes are modelled with shell elements; they are clamped at one end and submitted to a vibratory excitation at the other. From a frequency response analysis in Abaqus, stress response PSDs and fatigue damage are calculated using nCode software according to spectral methods introduced in section 3. Fundamental inputs to these calculations are the structural damping and fatigue material damage curve. The damping has been obtained experimentally and is about 0.5% in the 0-500Hz range. The copper tubes Wöhler curve used for the life calculation has been established by coupon testing and is given Fig. 10. In fact two curves may be used as the tubes are operating in service for temperatures between ambient and 120°C.
Fig.10. Copper Wöhler curves
The fatigue damage obtained from simulation of the shaker rig test (ambient temperature and no internal pressure in
516 M. Bennebach et al. / Procedia Engineering 66 ( 2013 ) 508 – 521
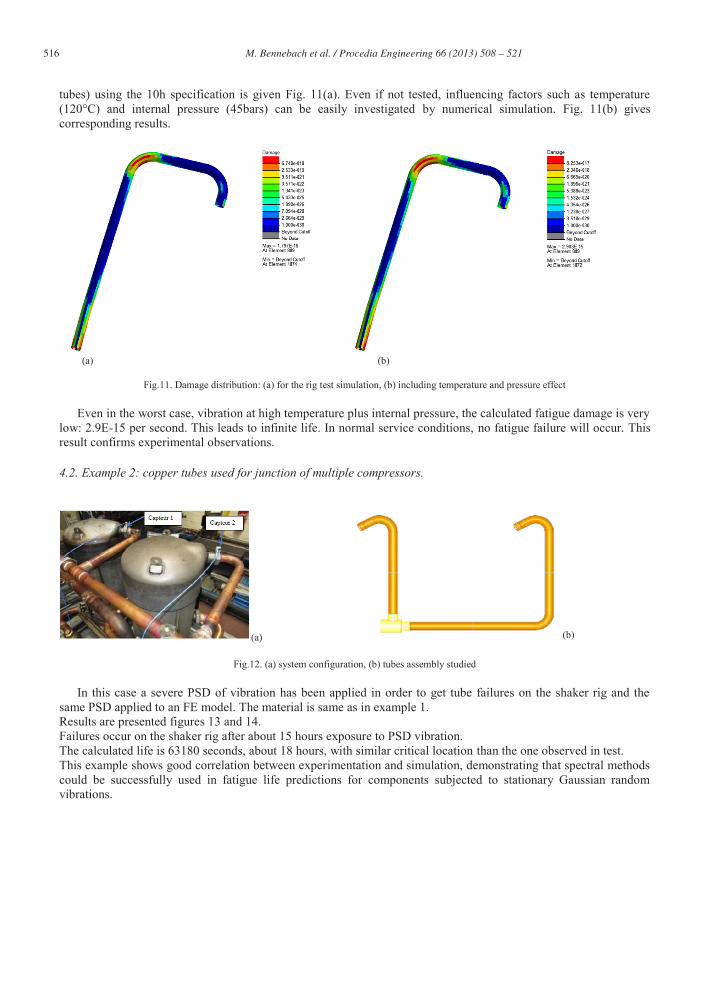
tubes) using the 10h specification is given Fig. 11(a). Even if not tested, influencing factors such as temperature (120°C) and internal pressure (45bars) can be easily investigated by numerical simulation. Fig. 11(b) gives corresponding results.
(a) (b)
Fig.11. Damage distribution: (a) for the rig test simulation, (b) including temperature and pressure effect
Even in the worst case, vibration at high temperature plus internal pressure, the calculated fatigue damage is very low: 2.9E-15 per second. This leads to infinite life. In normal service conditions, no fatigue failure will occur. This result confirms experimental observations.
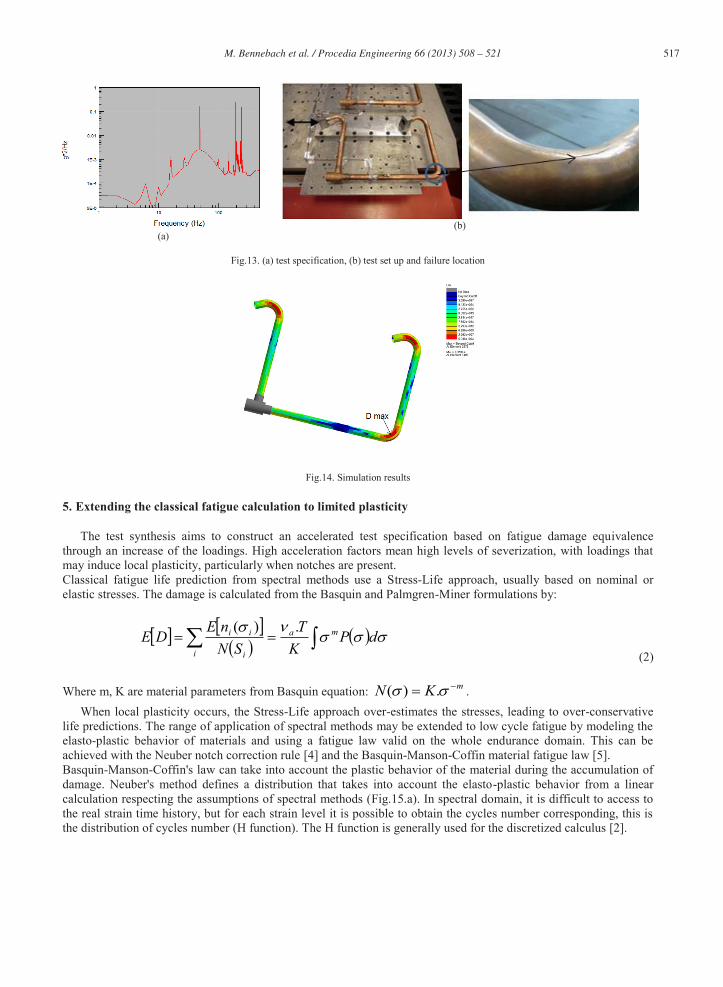
4.2. Example 2: copper tubes used for junction of multiple compressors.
(a) (b)
Fig.12. (a) system configuration, (b) tubes assembly studied
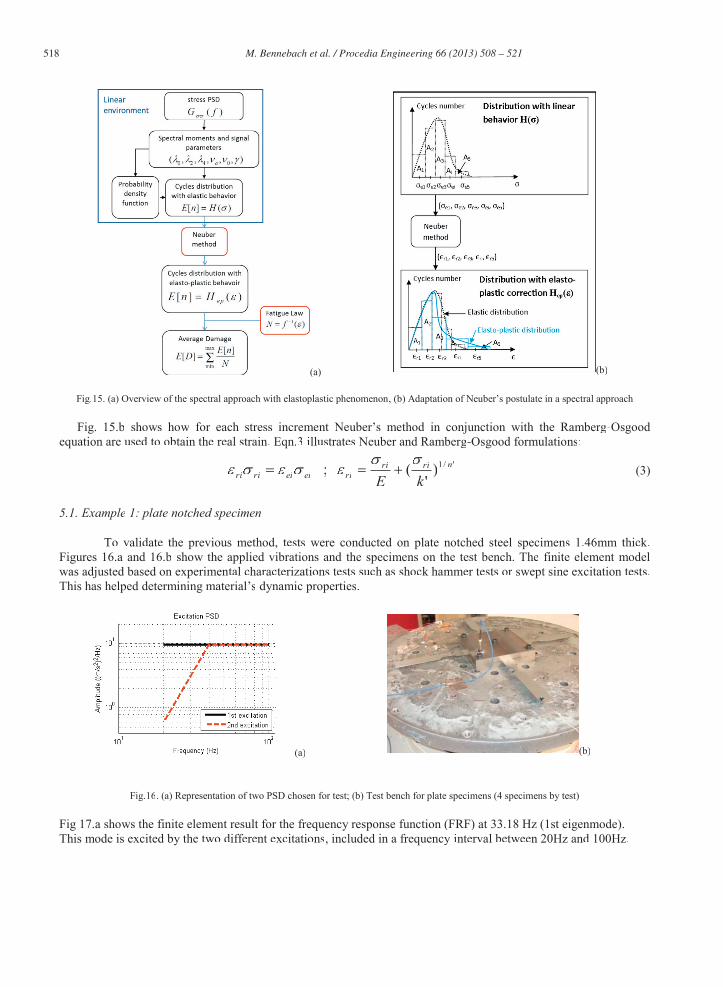
In this case a severe PSD of vibration has been applied in order to get tube failures on the shaker rig and the same PSD applied to an FE model. The material is same as in example 1. Results are presented figures 13 and 14. Failures occur on the shaker rig after about 15 hours exposure to PSD vibration. The calculated life is 63180 seconds, about 18 hours, with similar critical location than the one observed in test. This example shows good correlation between experimentation and simulation, demonstrating that spectral methods could be successfully used in fatigue life predictions for components subjected to stationary Gaussian random vibrations.
517 M. Bennebach et al. / Procedia Engineering 66 ( 2013 ) 508 – 521
(a)
(b)
Fig.13. (a) test specification, (b) test set up and failure location
Fig.14. Simulation results
5. Extending the classical fatigue calculation to limited plasticity
The test synthesis aims to construct an accelerated test specification based on fatigue damage equivalence through an increase of the loadings. High acceleration factors mean high levels of severization, with loadings that may induce local plasticity, particularly when notches are present. Classical fatigue life prediction from spectral methods use a Stress-Life approach, usually based on nominal or elastic stresses. The damage is calculated from the Basquin and Palmgren-Miner formulations by:
dPK
TSN
nEDE ma
i i
ii .)(
(2)
Where m, K are material parameters from Basquin equation: mKN .)( . When local plasticity occurs, the Stress-Life approach over-estimates the stresses, leading to over-conservative
life predictions. The range of application of spectral methods may be extended to low cycle fatigue by modeling the elasto-plastic behavior of materials and using a fatigue law valid on the whole endurance domain. This can be achieved with the Neuber notch correction rule [4] and the Basquin-Manson-Coffin material fatigue law [5]. Basquin-Manson-Coffin's law can take into account the plastic behavior of the material during the accumulation of damage. Neuber's method defines a distribution that takes into account the elasto-plastic behavior from a linear calculation respecting the assumptions of spectral methods (Fig.15.a). In spectral domain, it is difficult to access to the real strain time history, but for each strain level it is possible to obtain the cycles number corresponding, this is the distribution of cycles number (H function). The H function is generally used for the discretized calculus [2].
518 M. Bennebach et al. / Procedia Engineering 66 ( 2013 ) 508 – 521
Fig.15. (a) Overview of the spectral approach with elastoplastic phenomenon, (b) Adaptation of Neuber’s postulate in a spectral approach
Fig. 15.b shows how for each stress increment Neuber’s method in conjunction with the Ramberg-Osgoodequation are used to obtain the real strain. Eqn.3 illustrates Neuber and Ramberg-Osgood formulations:
'/1)'
(; nriririeieiriri kE
(3)
5.1. Example 1: plate notched specimen
To validate the previous method, tests were conducted on plate notched steel specimens 1.46mm thick.Figures 16.a and 16.b show the applied vibrations and the specimens on the test bench. The finite element modelwas adjusted based on experimental characterizations tests such as shock hammer tests or swept sine excitation tests. This has helped determining material’s dynamic properties.
Fig.16. (a) Representation of two PSD chosen for test; (b) Test bench for plate specimens (4 specimens by test)
Fig 17.a shows the finite element result for the frequency response function (FRF) at 33.18 Hz (1st eigenmode).This mode is excited by the two different excitations, included in a frequency interval between 20Hz and 100Hz.
(a) (b)
(a) (b)
519 M. Bennebach et al. / Procedia Engineering 66 ( 2013 ) 508 – 521
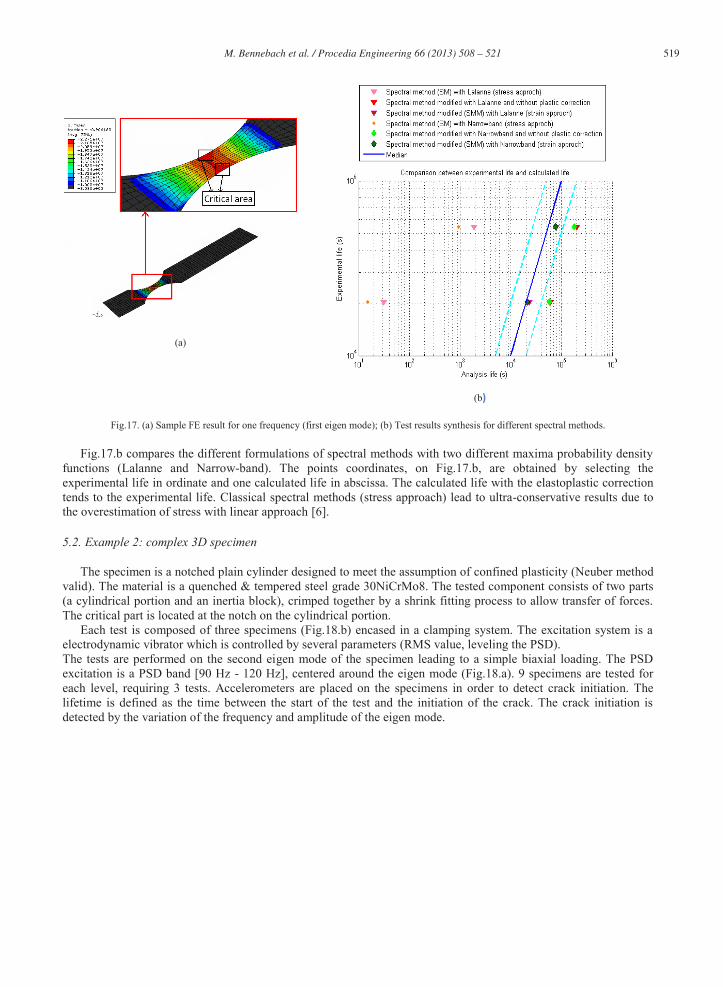
Fig.17. (a) Sample FE result for one frequency (first eigen mode); (b) Test results synthesis for different spectral methods.
Fig.17.b compares the different formulations of spectral methods with two different maxima probability density functions (Lalanne and Narrow-band). The points coordinates, on Fig.17.b, are obtained by selecting the experimental life in ordinate and one calculated life in abscissa. The calculated life with the elastoplastic correction tends to the experimental life. Classical spectral methods (stress approach) lead to ultra-conservative results due to the overestimation of stress with linear approach [6].
5.2. Example 2: complex 3D specimen
The specimen is a notched plain cylinder designed to meet the assumption of confined plasticity (Neuber method valid). The material is a quenched & tempered steel grade 30NiCrMo8. The tested component consists of two parts (a cylindrical portion and an inertia block), crimped together by a shrink fitting process to allow transfer of forces. The critical part is located at the notch on the cylindrical portion.
Each test is composed of three specimens (Fig.18.b) encased in a clamping system. The excitation system is a electrodynamic vibrator which is controlled by several parameters (RMS value, leveling the PSD). The tests are performed on the second eigen mode of the specimen leading to a simple biaxial loading. The PSD excitation is a PSD band [90 Hz - 120 Hz], centered around the eigen mode (Fig.18.a). 9 specimens are tested for each level, requiring 3 tests. Accelerometers are placed on the specimens in order to detect crack initiation. The lifetime is defined as the time between the start of the test and the initiation of the crack. The crack initiation is detected by the variation of the frequency and amplitude of the eigen mode.
(a)
(b)
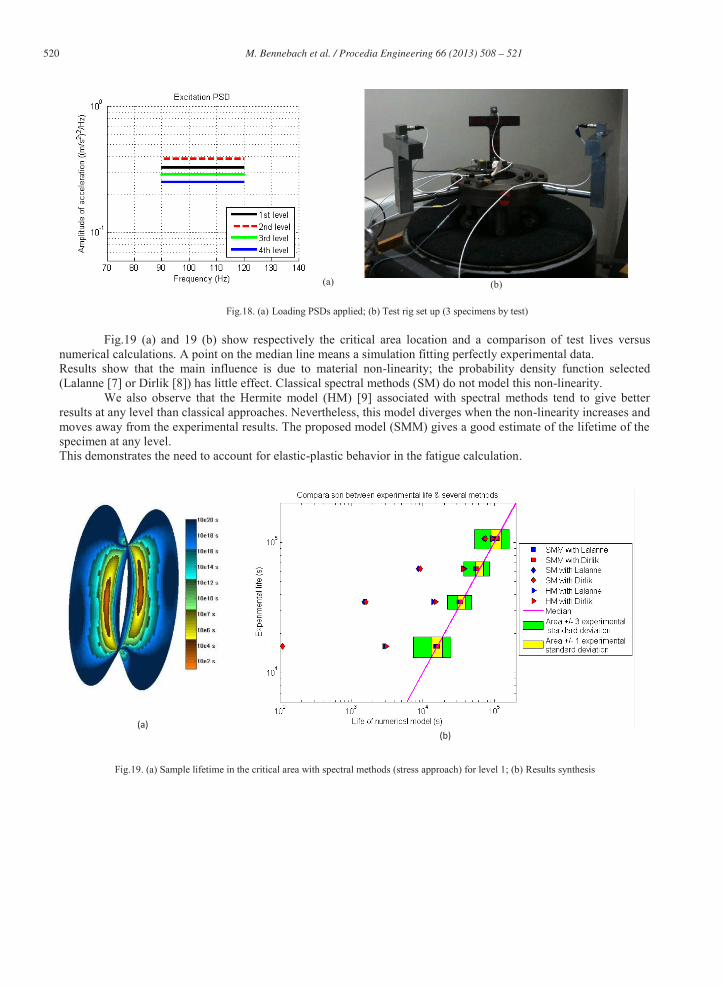
520 M. Bennebach et al. / Procedia Engineering 66 ( 2013 ) 508 – 521
(a) (b)
Fig.18. (a) Loading PSDs applied; (b) Test rig set up (3 specimens by test)
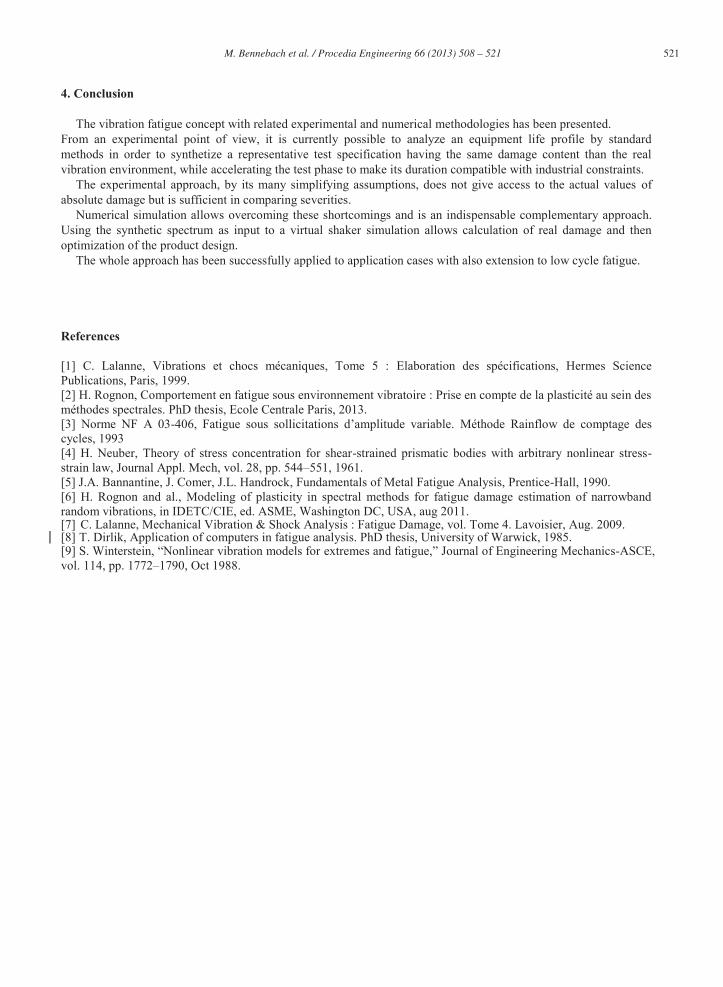
Fig.19 (a) and 19 (b) show respectively the critical area location and a comparison of test lives versus numerical calculations. A point on the median line means a simulation fitting perfectly experimental data. Results show that the main influence is due to material non-linearity; the probability density function selected (Lalanne [7] or Dirlik [8]) has little effect. Classical spectral methods (SM) do not model this non-linearity.
We also observe that the Hermite model (HM) [9] associated with spectral methods tend to give better results at any level than classical approaches. Nevertheless, this model diverges when the non-linearity increases and moves away from the experimental results. The proposed model (SMM) gives a good estimate of the lifetime of the specimen at any level. This demonstrates the need to account for elastic-plastic behavior in the fatigue calculation.
(a) (b)
Fig.19. (a) Sample lifetime in the critical area with spectral methods (stress approach) for level 1; (b) Results synthesis
521 M. Bennebach et al. / Procedia Engineering 66 ( 2013 ) 508 – 521
4. Conclusion
The vibration fatigue concept with related experimental and numerical methodologies has been presented. From an experimental point of view, it is currently possible to analyze an equipment life profile by standard methods in order to synthetize a representative test specification having the same damage content than the real vibration environment, while accelerating the test phase to make its duration compatible with industrial constraints.
The experimental approach, by its many simplifying assumptions, does not give access to the actual values of absolute damage but is sufficient in comparing severities.
Numerical simulation allows overcoming these shortcomings and is an indispensable complementary approach. Using the synthetic spectrum as input to a virtual shaker simulation allows calculation of real damage and then optimization of the product design.
The whole approach has been successfully applied to application cases with also extension to low cycle fatigue.
References
[1] C. Lalanne, Vibrations et chocs mécaniques, Tome 5 : Elaboration des spécifications, Hermes Science Publications, Paris, 1999. [2] H. Rognon, Comportement en fatigue sous environnement vibratoire : Prise en compte de la plasticité au sein des méthodes spectrales. PhD thesis, Ecole Centrale Paris, 2013. [3] Norme NF A 03-406, Fatigue sous sollicitations d’amplitude variable. Méthode Rainflow de comptage des cycles, 1993 [4] H. Neuber, Theory of stress concentration for shear-strained prismatic bodies with arbitrary nonlinear stress-strain law, Journal Appl. Mech, vol. 28, pp. 544–551, 1961. [5] J.A. Bannantine, J. Comer, J.L. Handrock, Fundamentals of Metal Fatigue Analysis, Prentice-Hall, 1990. [6] H. Rognon and al., Modeling of plasticity in spectral methods for fatigue damage estimation of narrowband random vibrations, in IDETC/CIE, ed. ASME, Washington DC, USA, aug 2011. [7] C. Lalanne, Mechanical Vibration & Shock Analysis : Fatigue Damage, vol. Tome 4. Lavoisier, Aug. 2009. [8] T. Dirlik, Application of computers in fatigue analysis. PhD thesis, University of Warwick, 1985. [9] S. Winterstein, “Nonlinear vibration models for extremes and fatigue,” Journal of Engineering Mechanics-ASCE, vol. 114, pp. 1772–1790, Oct 1988.