Embed Size (px)
Citation preview
Influence of transient-state on evaluation of thermal insulation quality of overhead pipeline with the use of infrared camera measurement results
by T. Kruczek*, A. Fic*, A. Sachajdak*
*Institute of Thermal Technology, Silesian Technical University, Konarskiego 22, 44-100 Gliwice, Poland, [email protected]; [email protected]; [email protected]
Abstract
The convective and radiation heat transfer take place between thermal pipelines and their surroundings. These phenomena bring about the heat losses from the pipelines. In the case of a low sky temperature, the radiation heat exchange is very intensive and the temperature of the top part of the horizontal pipeline is lower than the temperature of the bottom part of this pipeline. Sometimes this temperature is also lower than the temperature of the surrounding atmospheric air. In the case of overhead heat pipelines placed in open air space the surroundings constitute natural environment with its meteorological conditions. These conditions are usually unstable. These conditions cause temperature fluctuations of the outer shell of the pipeline. The aforementioned phenomena bring about difficulties during infrared inspections of the pipeline shell temperature and calculation of the heat losses from the pipeline. The aim of the work is recognition of these processes in order to draw proper conclusions concerning the quality of pipeline thermal insulation on the basis of infrared measurement results. Numerical analysis of the heat transfer in the system pipeline – environment is the subject of the paper. CFD package ANSYS Fluent has been employed for this purpose. The numerical results have been compared with the results of the measurements performed with use of an experimental unit especially designed and built for this purpose.
1. Introduction
The determination of heat losses from the thermal pipelines is an important practical problem. They depend distinctly on a quality of their thermal insulation. Application of the infrared thermography is a very effective and modern method that can be used nowadays to examine this insulation and the heat losses. Unfortunately, the results of the infrared measurements are influenced by many parameters, especially by the emissivity of the examined surface and various, fluctuating temperatures of the surrounding elements. Convective and radiative heat transfer takes place between thermal pipelines and its surrounding [1, 6, 7]. Generally, the surrounding of the external overhead pipeline consists of two surfaces: hypothetical sky surface and ground surface [2, 3]. Normally, the temperatures of these elements are different. In the case of low temperature of the sky, due to very intensive radiative emission of the heat, the temperature of some parts of the pipeline shell may drop below the temperature of the atmosphere [3, 4, 5]. This phenomenon has been confirmed by measurements and calculations carried out by means of CFD Fluent software. The aforementioned phenomenon causes difficulties during evaluation of the quality of the thermal insulation of the pipeline and determination of the pipeline heat losses.
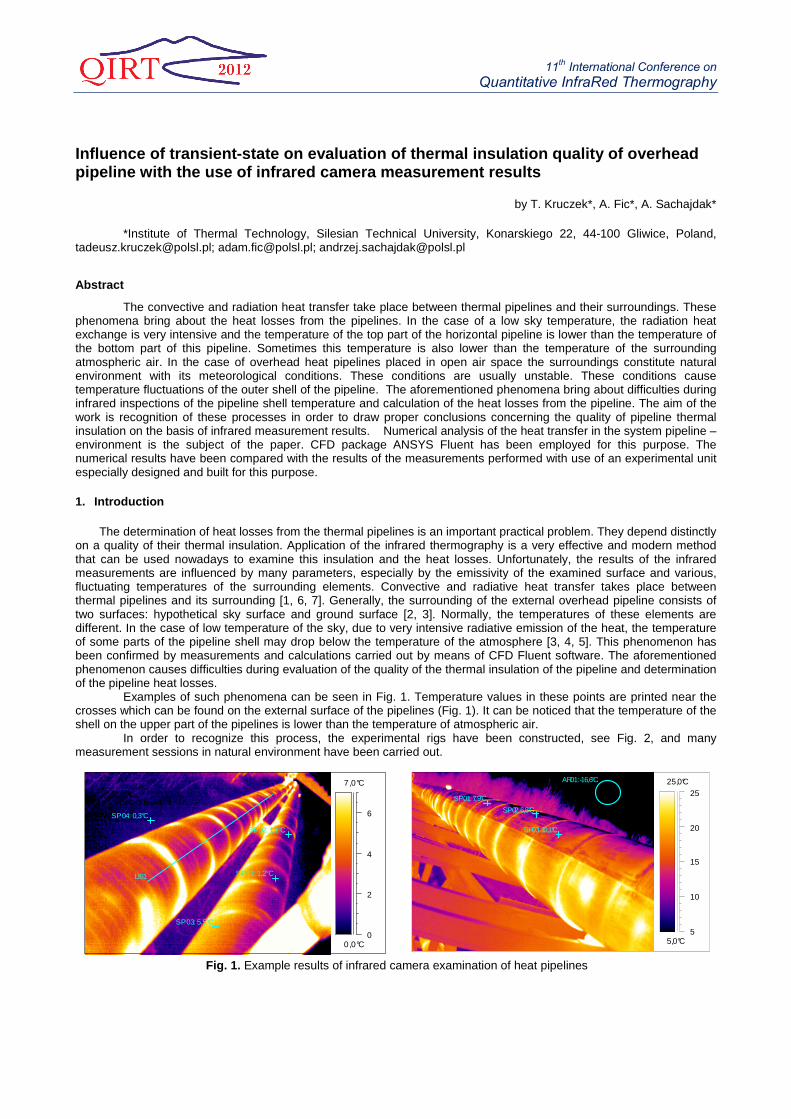
Examples of such phenomena can be seen in Fig. 1. Temperature values in these points are printed near the crosses which can be found on the external surface of the pipelines (Fig. 1). It can be noticed that the temperature of the shell on the upper part of the pipelines is lower than the temperature of atmospheric air.
In order to recognize this process, the experimental rigs have been constructed, see Fig. 2, and many measurement sessions in natural environment have been carried out.
0,0°C
7,0°C
0
2
4
6
SP01: 1,2°C
SP02: 1,1°C
SP03: 5,5°C
SP04: 0,3°C
LI01
Fig. 1. Example results of infrared camera examination of heat pipelines
5,0°C
25,0°C
5
10
15
20
25SP01: 7,9°C
SP02: 6,8°C
AR01: -16,6°C
SP03: 10,1°C
11th International Conference on
Quantitative InfraRed Thermography
Generally, the goal of the investigation is to identify the heat exchange processes on the external shell of the pipelines and the heat losses applying the infrared camera measurements. During the calculations of heat losses from the heat pipelines on the basis of infrared camera measurement results usually a steady thermal state of the pipeline insulation is assumed. In order to find periods during the operation time of the pipelines with the distribution of the temperature inside the thermal insulation the most similar to steady state, the analysis of the temperature changes inside the insulation has been carried out. For this purpose the numerical simulations of the heat transfer inside the thermal insulation has been done. CFD package ANSYS-FLUENT 12.1.4 has been employed for this purpose. Both the heat transfer by conduction between the inner pipeline tube and outer pipeline shell and heat accumulation inside the pipeline elements have been taken into account. The measurement results of the temperature of inner pipeline tube and outer pipeline shell gathered during the operation of the experimental units were the input data for these numerical simulations. .
2. Description of the experimental units and measurements
Two experimental units with different inner pipeline tube diameters were used. First experimental unit, denoted by U1 has the inner tube with diameter amounting to 371 mm, and the second unit denoted by U2 has diameter of inner tube amounting to 273 mm.
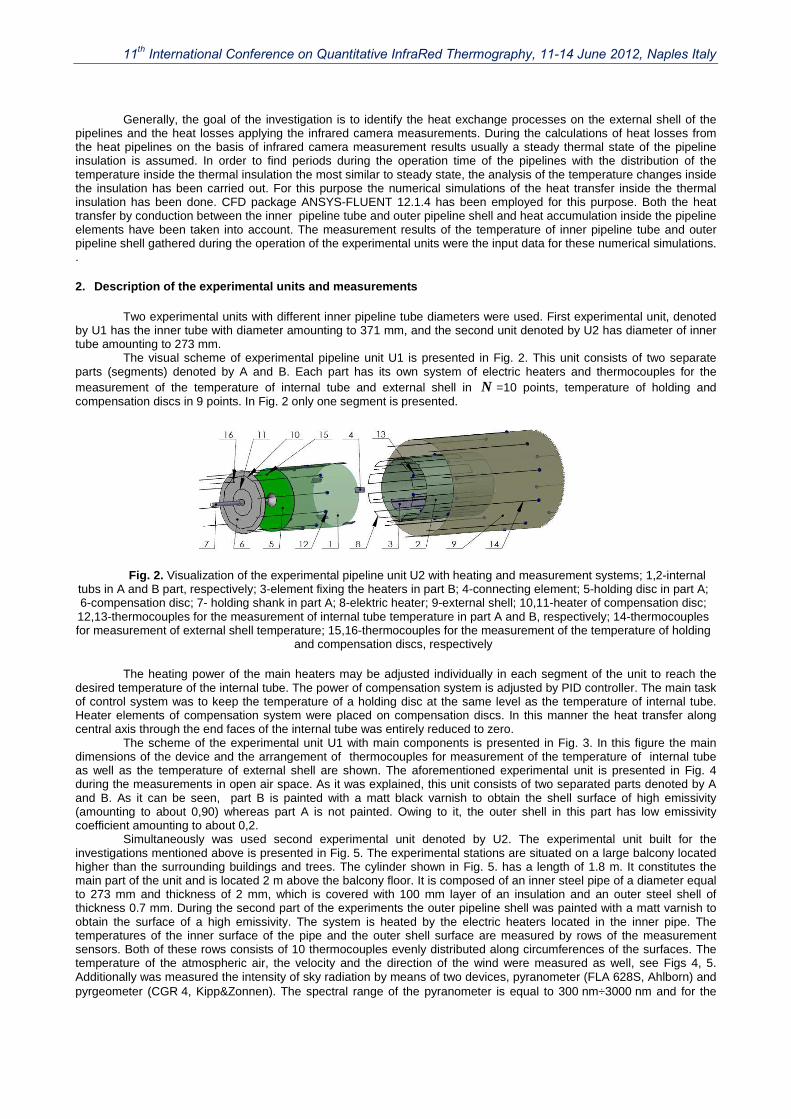
The visual scheme of experimental pipeline unit U1 is presented in Fig. 2. This unit consists of two separate parts (segments) denoted by A and B. Each part has its own system of electric heaters and thermocouples for the measurement of the temperature of internal tube and external shell in N =10 points, temperature of holding and compensation discs in 9 points. In Fig. 2 only one segment is presented.
Fig. 2. Visualization of the experimental pipeline unit U2 with heating and measurement systems; 1,2-internal
tubs in A and B part, respectively; 3-element fixing the heaters in part B; 4-connecting element; 5-holding disc in part A; 6-compensation disc; 7- holding shank in part A; 8-elektric heater; 9-external shell; 10,11-heater of compensation disc; 12,13-thermocouples for the measurement of internal tube temperature in part A and B, respectively; 14-thermocouples for measurement of external shell temperature; 15,16-thermocouples for the measurement of the temperature of holding
and compensation discs, respectively
The heating power of the main heaters may be adjusted individually in each segment of the unit to reach the desired temperature of the internal tube. The power of compensation system is adjusted by PID controller. The main task of control system was to keep the temperature of a holding disc at the same level as the temperature of internal tube. Heater elements of compensation system were placed on compensation discs. In this manner the heat transfer along central axis through the end faces of the internal tube was entirely reduced to zero.
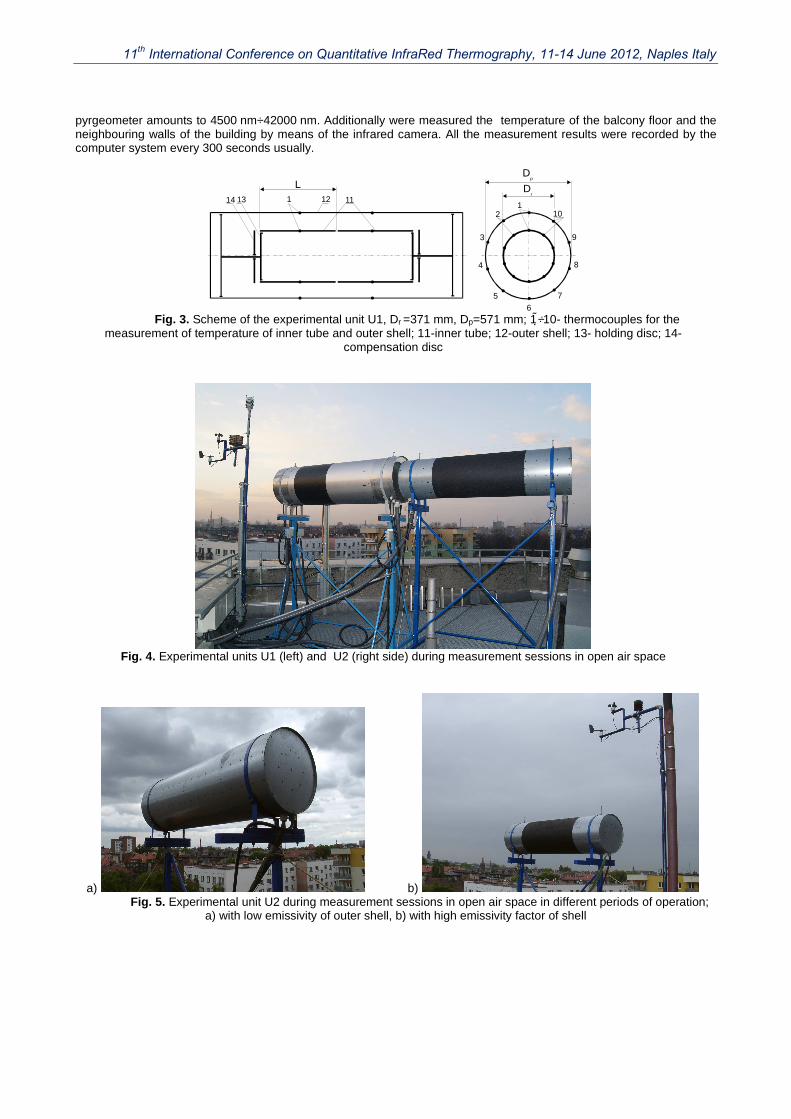
The scheme of the experimental unit U1 with main components is presented in Fig. 3. In this figure the main dimensions of the device and the arrangement of thermocouples for measurement of the temperature of internal tube as well as the temperature of external shell are shown. The aforementioned experimental unit is presented in Fig. 4 during the measurements in open air space. As it was explained, this unit consists of two separated parts denoted by A and B. As it can be seen, part B is painted with a matt black varnish to obtain the shell surface of high emissivity (amounting to about 0,90) whereas part A is not painted. Owing to it, the outer shell in this part has low emissivity coefficient amounting to about 0,2.
Simultaneously was used second experimental unit denoted by U2. The experimental unit built for the investigations mentioned above is presented in Fig. 5. The experimental stations are situated on a large balcony located higher than the surrounding buildings and trees. The cylinder shown in Fig. 5. has a length of 1.8 m. It constitutes the main part of the unit and is located 2 m above the balcony floor. It is composed of an inner steel pipe of a diameter equal to 273 mm and thickness of 2 mm, which is covered with 100 mm layer of an insulation and an outer steel shell of thickness 0.7 mm. During the second part of the experiments the outer pipeline shell was painted with a matt varnish to obtain the surface of a high emissivity. The system is heated by the electric heaters located in the inner pipe. The temperatures of the inner surface of the pipe and the outer shell surface are measured by rows of the measurement sensors. Both of these rows consists of 10 thermocouples evenly distributed along circumferences of the surfaces. The temperature of the atmospheric air, the velocity and the direction of the wind were measured as well, see Figs 4, 5. Additionally was measured the intensity of sky radiation by means of two devices, pyranometer (FLA 628S, Ahlborn) and pyrgeometer (CGR 4, Kipp&Zonnen). The spectral range of the pyranometer is equal to 300 nm÷3000 nm and for the
11th International Conference on Quantitative InfraRed Thermography, 11-14 June 2012, Naples Italy
pyrgeometer amounts to 4500 nm÷42000 nm. Additionally were measured the temperature of the balcony floor and the neighbouring walls of the building by means of the infrared camera. All the measurement results were recorded by the computer system every 300 seconds usually.
12
3
4
1213 11114
L Dr
Dp
56
7
8
9
10
Fig. 3. Scheme of the experimental unit U1, Dr =371 mm, Dp=571 mm; 1��÷10- thermocouples for the
measurement of temperature of inner tube and outer shell; 11-inner tube; 12-outer shell; 13- holding disc; 14- compensation disc
Fig. 4. Experimental units U1 (left) and U2 (right side) during measurement sessions in open air space
a) b) Fig. 5. Experimental unit U2 during measurement sessions in open air space in different periods of operation;
a) with low emissivity of outer shell, b) with high emissivity factor of shell
11th International Conference on Quantitative InfraRed Thermography, 11-14 June 2012, Naples Italy
3. Examples of measurement results
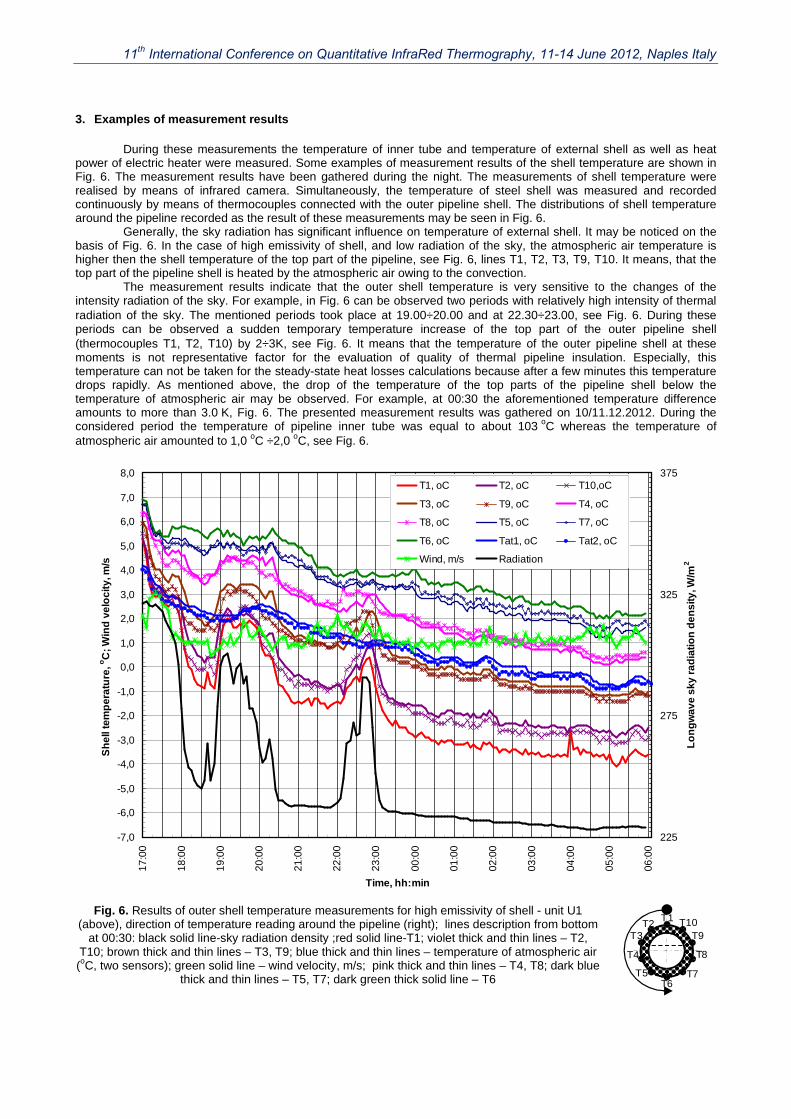
During these measurements the temperature of inner tube and temperature of external shell as well as heat power of electric heater were measured. Some examples of measurement results of the shell temperature are shown in Fig. 6. The measurement results have been gathered during the night. The measurements of shell temperature were realised by means of infrared camera. Simultaneously, the temperature of steel shell was measured and recorded continuously by means of thermocouples connected with the outer pipeline shell. The distributions of shell temperature around the pipeline recorded as the result of these measurements may be seen in Fig. 6.
Generally, the sky radiation has significant influence on temperature of external shell. It may be noticed on the basis of Fig. 6. In the case of high emissivity of shell, and low radiation of the sky, the atmospheric air temperature is higher then the shell temperature of the top part of the pipeline, see Fig. 6, lines T1, T2, T3, T9, T10. It means, that the top part of the pipeline shell is heated by the atmospheric air owing to the convection.
The measurement results indicate that the outer shell temperature is very sensitive to the changes of the intensity radiation of the sky. For example, in Fig. 6 can be observed two periods with relatively high intensity of thermal radiation of the sky. The mentioned periods took place at 19.00÷20.00 and at 22.30÷23.00, see Fig. 6. During these periods can be observed a sudden temporary temperature increase of the top part of the outer pipeline shell (thermocouples T1, T2, T10) by 2÷3K, see Fig. 6. It means that the temperature of the outer pipeline shell at these moments is not representative factor for the evaluation of quality of thermal pipeline insulation. Especially, this temperature can not be taken for the steady-state heat losses calculations because after a few minutes this temperature drops rapidly. As mentioned above, the drop of the temperature of the top parts of the pipeline shell below the temperature of atmospheric air may be observed. For example, at 00:30 the aforementioned temperature difference amounts to more than 3.0 K, Fig. 6. The presented measurement results was gathered on 10/11.12.2012. During the considered period the temperature of pipeline inner tube was equal to about 103 oC whereas the temperature of atmospheric air amounted to 1,0 oC ÷2,0 oC, see Fig. 6.
-7,0
-6,0
-5,0
-4,0
-3,0
-2,0
-1,0
0,0
1,0
2,0
3,0
4,0
5,0
6,0
7,0
8,0
17:0
0
18:0
0
19:0
0
20:0
0
21:0
0
22:0
0
23:0
0
00:0
0
01:0
0
02:0
0
03:0
0
04:0
0
05:0
0
06:0
0
Time, hh:min
Sh
ell t
emp
erat
ure
, oC
; Win
d v
elo
city
, m/s
225
275
325
375
Lo
ng
wav
e sk
y ra
dia
tion
den
sity
, W/m
2
T1, oC T2, oC T10,oC
T3, oC T9, oC T4, oC
T8, oC T5, oC T7, oC
T6, oC Tat1, oC Tat2, oC
Wind, m/s Radiation
Fig. 6. Results of outer shell temperature measurements for high emissivity of shell - unit U1
(above), direction of temperature reading around the pipeline (right); lines description from bottom at 00:30: black solid line-sky radiation density ;red solid line-T1; violet thick and thin lines – T2,
T10; brown thick and thin lines – T3, T9; blue thick and thin lines – temperature of atmospheric air (oC, two sensors); green solid line – wind velocity, m/s; pink thick and thin lines – T4, T8; dark blue
thick and thin lines – T5, T7; dark green thick solid line – T6
T1T2T3
T4
T5T6
T7
T8
T9T10
11th International Conference on Quantitative InfraRed Thermography, 11-14 June 2012, Naples Italy
Simultaneously with stable conditions of radiation of the pipeline surroundings a monotonous dropping of the atmospheric air temperature and pipeline shell temperature may be observed, Fig. 6. These circumstances have an influence on the final evaluation of actual technical state of pipeline insulation. In order to examine this problem, numerical calculations have been carried out as well.
4. Description and analysis of numerical calculation results
In order to analyse the influence of changeable weather conditions on thermal state of pipelines, numerical simulations have been carried out on the basis of data gathered during the aforementioned measurements. For this purpose a period consisting of 3 successive days has been taken into consideration. The measurement data were values of temperature around the outer shell and inner pipeline tube recorded every 5 minutes during the whole measurement time. The calculations were carried out on the basis of measurement results between the days 5.03.2012, 12.00 a.m. and 8.03.2012, 12.00 a.m., i.e. for 72 hours. These measurements were made with the use of experimental unit U1. The calculations were done by means of ANSYS-FLUENT 12.1.4 package. The aim of these calculations was the determination of difference between the amount of heat accumulated inside the thermal insulation for real state (transient) of insulation and for hypothetical steady-state temperature distribution within the insulation. During these calculations the values of temperature in 10 points around the pipeline shell as well as around inner pipeline tube gathered during the measurement period were assumed as the input data. For the mentioned calculations the two-dimension numerical mesh in cross section of the thermal insulation was created. The main task of the calculations was determination of the temperature distribution in cross-section of the insulation for transient and steady states. Information about the temperature in all cells of numerical mesh allows to calculate amount of heat accumulated in thermal insulation in reality with comparison of steady-state of insulation. Additionally, heat flux absorbed on inner cylindrical surface of thermal insulation as well as heat flux flowing out from outer surface of insulation may be determined for transient- and steady thermal states.
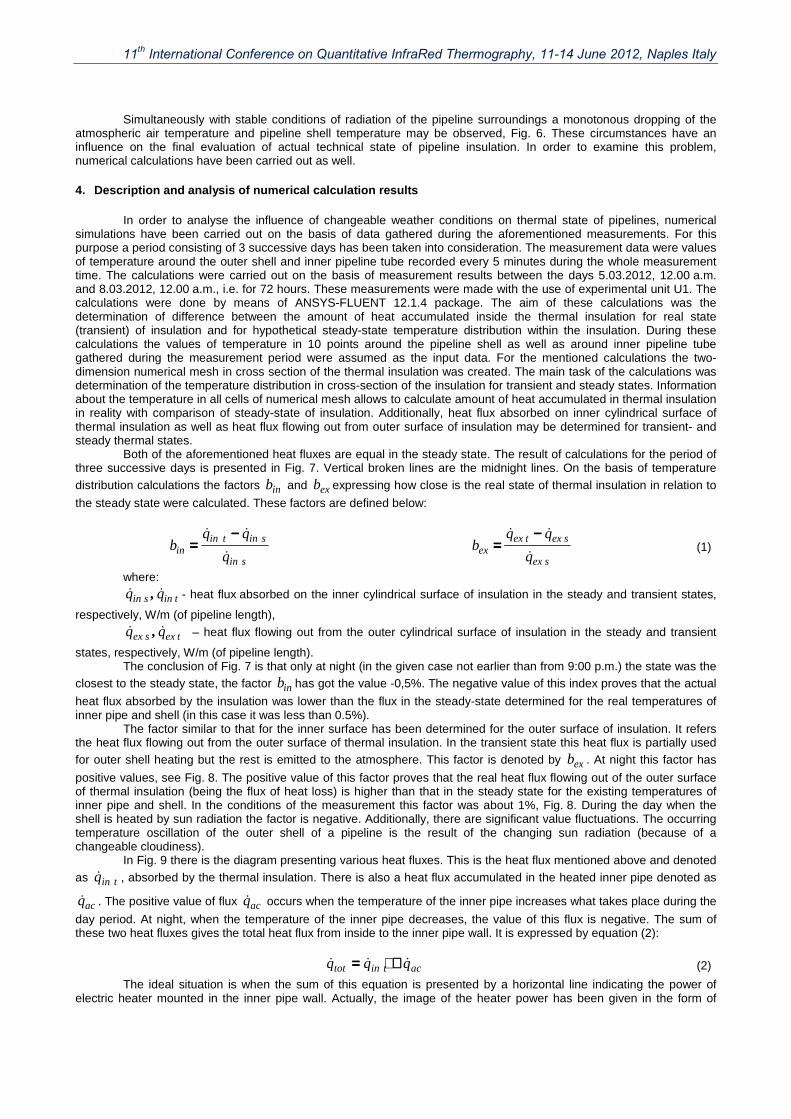
Both of the aforementioned heat fluxes are equal in the steady state. The result of calculations for the period of three successive days is presented in Fig. 7. Vertical broken lines are the midnight lines. On the basis of temperature distribution calculations the factors inb and exb expressing how close is the real state of thermal insulation in relation to
the steady state were calculated. These factors are defined below:
sin
sintinin q
qqb
&
&& −−−−====
sex
sextexex q
qqb
&
&& −−−−==== (1)
where:
tinsin qq && , - heat flux absorbed on the inner cylindrical surface of insulation in the steady and transient states,
respectively, W/m (of pipeline length),
texsex qq && , – heat flux flowing out from the outer cylindrical surface of insulation in the steady and transient
states, respectively, W/m (of pipeline length). The conclusion of Fig. 7 is that only at night (in the given case not earlier than from 9:00 p.m.) the state was the
closest to the steady state, the factor inb has got the value -0,5%. The negative value of this index proves that the actual
heat flux absorbed by the insulation was lower than the flux in the steady-state determined for the real temperatures of inner pipe and shell (in this case it was less than 0.5%).
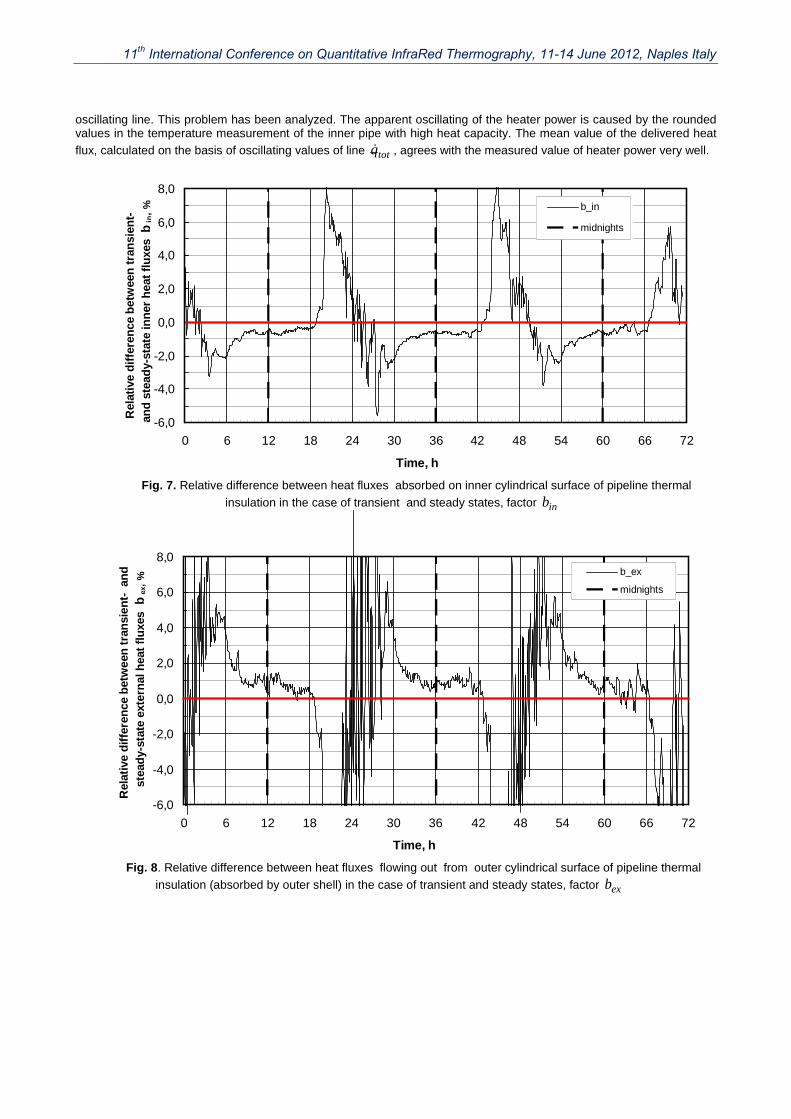
The factor similar to that for the inner surface has been determined for the outer surface of insulation. It refers the heat flux flowing out from the outer surface of thermal insulation. In the transient state this heat flux is partially used for outer shell heating but the rest is emitted to the atmosphere. This factor is denoted by exb . At night this factor has
positive values, see Fig. 8. The positive value of this factor proves that the real heat flux flowing out of the outer surface of thermal insulation (being the flux of heat loss) is higher than that in the steady state for the existing temperatures of inner pipe and shell. In the conditions of the measurement this factor was about 1%, Fig. 8. During the day when the shell is heated by sun radiation the factor is negative. Additionally, there are significant value fluctuations. The occurring temperature oscillation of the outer shell of a pipeline is the result of the changing sun radiation (because of a changeable cloudiness).
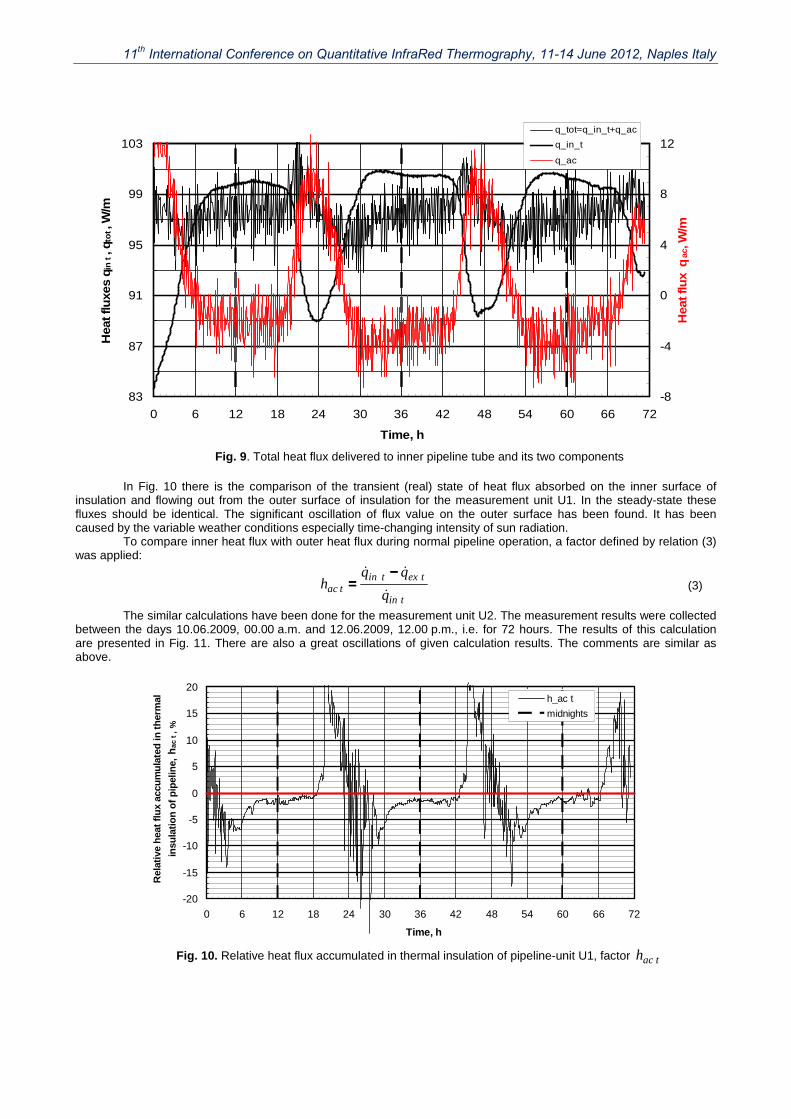
In Fig. 9 there is the diagram presenting various heat fluxes. This is the heat flux mentioned above and denoted as tinq& , absorbed by the thermal insulation. There is also a heat flux accumulated in the heated inner pipe denoted as
acq& . The positive value of flux acq& occurs when the temperature of the inner pipe increases what takes place during the
day period. At night, when the temperature of the inner pipe decreases, the value of this flux is negative. The sum of these two heat fluxes gives the total heat flux from inside to the inner pipe wall. It is expressed by equation (2):
actintot qqq &&& ++++==== (2)
The ideal situation is when the sum of this equation is presented by a horizontal line indicating the power of electric heater mounted in the inner pipe wall. Actually, the image of the heater power has been given in the form of
11th International Conference on Quantitative InfraRed Thermography, 11-14 June 2012, Naples Italy
oscillating line. This problem has been analyzed. The apparent oscillating of the heater power is caused by the rounded values in the temperature measurement of the inner pipe with high heat capacity. The mean value of the delivered heat flux, calculated on the basis of oscillating values of line totq& , agrees with the measured value of heater power very well.
-6,0
-4,0
-2,0
0,0
2,0
4,0
6,0
8,0
0 6 12 18 24 30 36 42 48 54 60 66 72
Time, h
Rel
ativ
e d
iffe
ren
ce b
etw
een
tra
nsi
ent-
an
d s
tead
y-st
ate
inn
er h
eat
flu
xes
bin
, % b_in
midnights
Fig. 7. Relative difference between heat fluxes absorbed on inner cylindrical surface of pipeline thermal
insulation in the case of transient and steady states, factor inb
-6,0
-4,0
-2,0
0,0
2,0
4,0
6,0
8,0
0 6 12 18 24 30 36 42 48 54 60 66 72
Time, h
Rel
ativ
e d
iffe
ren
ce b
etw
een
tra
nsi
ent-
an
d
stea
dy-
stat
e ex
tern
al h
eat
flu
xes
bex
, % b_ex
midnights
Fig. 8. Relative difference between heat fluxes flowing out from outer cylindrical surface of pipeline thermal
insulation (absorbed by outer shell) in the case of transient and steady states, factor exb
11th International Conference on Quantitative InfraRed Thermography, 11-14 June 2012, Naples Italy
83
87
91
95
99
103
0 6 12 18 24 30 36 42 48 54 60 66 72
Time, h
Hea
t flu
xes
q in
t, q
tot,
W/m
-8
-4
0
4
8
12
Hea
t flu
x q
ac, W
/m
q_tot=q_in_t+q_ac
q_in_t
q_ac
Fig. 9. Total heat flux delivered to inner pipeline tube and its two components
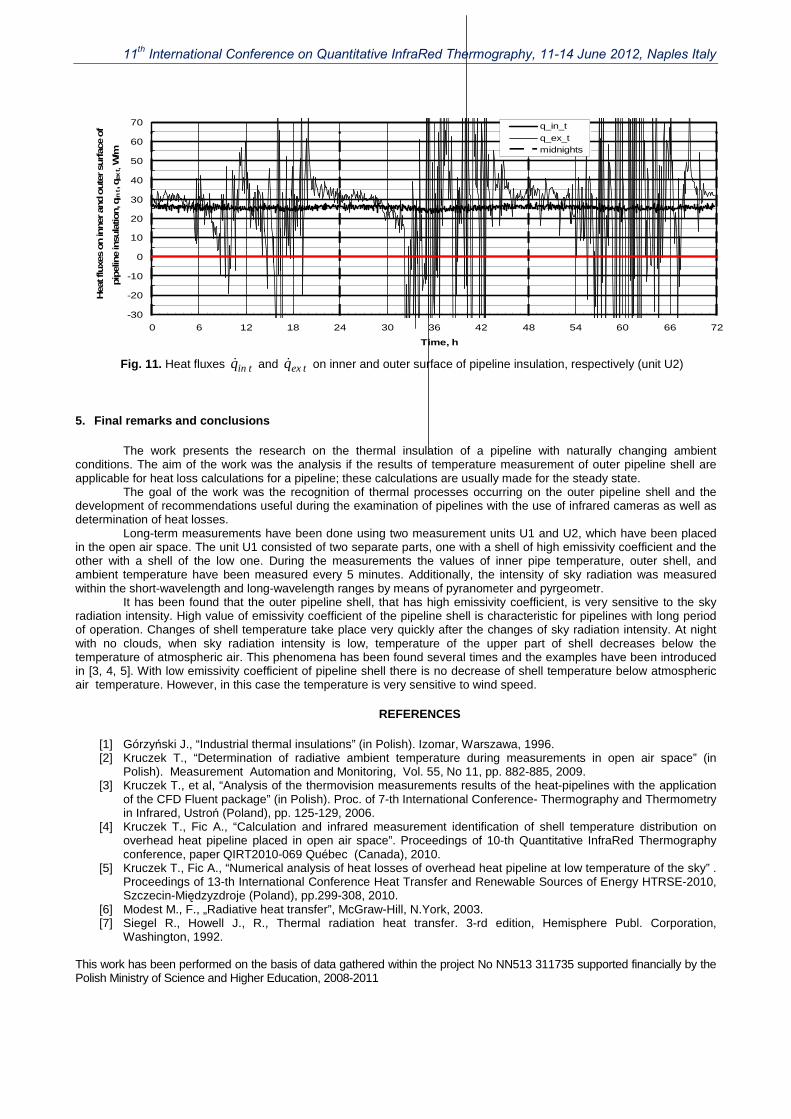
In Fig. 10 there is the comparison of the transient (real) state of heat flux absorbed on the inner surface of insulation and flowing out from the outer surface of insulation for the measurement unit U1. In the steady-state these fluxes should be identical. The significant oscillation of flux value on the outer surface has been found. It has been caused by the variable weather conditions especially time-changing intensity of sun radiation.
To compare inner heat flux with outer heat flux during normal pipeline operation, a factor defined by relation (3) was applied:
tin
textintac q
qqh
&
&& −−−−==== (3)
The similar calculations have been done for the measurement unit U2. The measurement results were collected between the days 10.06.2009, 00.00 a.m. and 12.06.2009, 12.00 p.m., i.e. for 72 hours. The results of this calculation are presented in Fig. 11. There are also a great oscillations of given calculation results. The comments are similar as above.
-20
-15
-10
-5
0
5
10
15
20
0 6 12 18 24 30 36 42 48 54 60 66 72
Time, h
Rel
ativ
e h
eat
flu
x ac
cum
ula
ted
in t
her
mal
insu
lati
on
of
pip
elin
e, h
ac t
, %
h_ac t
midnights
Fig. 10. Relative heat flux accumulated in thermal insulation of pipeline-unit U1, factor tach
11th International Conference on Quantitative InfraRed Thermography, 11-14 June 2012, Naples Italy
-30
-20
-10
0
10
20
30
40
50
60
70
0 6 12 18 24 30 36 42 48 54 60 66 72
Time, h
Hea
t flu
xes
on in
ner
and o
ute
r su
rfac
e of
pip
elin
e in
sula
tion, q
in t, q
ex t, W
/mq_in_t
q_ex_tmidnights
Fig. 11. Heat fluxes tinq& and texq& on inner and outer surface of pipeline insulation, respectively (unit U2)
5. Final remarks and conclusions
The work presents the research on the thermal insulation of a pipeline with naturally changing ambient conditions. The aim of the work was the analysis if the results of temperature measurement of outer pipeline shell are applicable for heat loss calculations for a pipeline; these calculations are usually made for the steady state.
The goal of the work was the recognition of thermal processes occurring on the outer pipeline shell and the development of recommendations useful during the examination of pipelines with the use of infrared cameras as well as determination of heat losses.
Long-term measurements have been done using two measurement units U1 and U2, which have been placed in the open air space. The unit U1 consisted of two separate parts, one with a shell of high emissivity coefficient and the other with a shell of the low one. During the measurements the values of inner pipe temperature, outer shell, and ambient temperature have been measured every 5 minutes. Additionally, the intensity of sky radiation was measured within the short-wavelength and long-wavelength ranges by means of pyranometer and pyrgeometr.
It has been found that the outer pipeline shell, that has high emissivity coefficient, is very sensitive to the sky radiation intensity. High value of emissivity coefficient of the pipeline shell is characteristic for pipelines with long period of operation. Changes of shell temperature take place very quickly after the changes of sky radiation intensity. At night with no clouds, when sky radiation intensity is low, temperature of the upper part of shell decreases below the temperature of atmospheric air. This phenomena has been found several times and the examples have been introduced in [3, 4, 5]. With low emissivity coefficient of pipeline shell there is no decrease of shell temperature below atmospheric air temperature. However, in this case the temperature is very sensitive to wind speed.
REFERENCES
[1] Górzyński J., “Industrial thermal insulations” (in Polish). Izomar, Warszawa, 1996. [2] Kruczek T., “Determination of radiative ambient temperature during measurements in open air space” (in
Polish). Measurement Automation and Monitoring, Vol. 55, No 11, pp. 882-885, 2009. [3] Kruczek T., et al, “Analysis of the thermovision measurements results of the heat-pipelines with the application
of the CFD Fluent package” (in Polish). Proc. of 7-th International Conference- Thermography and Thermometry in Infrared, Ustroń (Poland), pp. 125-129, 2006.
[4] Kruczek T., Fic A., “Calculation and infrared measurement identification of shell temperature distribution on overhead heat pipeline placed in open air space”. Proceedings of 10-th Quantitative InfraRed Thermography conference, paper QIRT2010-069 Québec (Canada), 2010.
[5] Kruczek T., Fic A., “Numerical analysis of heat losses of overhead heat pipeline at low temperature of the sky” . Proceedings of 13-th International Conference Heat Transfer and Renewable Sources of Energy HTRSE-2010, Szczecin-Międzyzdroje (Poland), pp.299-308, 2010.
[6] Modest M., F., „Radiative heat transfer”, McGraw-Hill, N.York, 2003. [7] Siegel R., Howell J., R., Thermal radiation heat transfer. 3-rd edition, Hemisphere Publ. Corporation,
Washington, 1992. This work has been performed on the basis of data gathered within the project No NN513 311735 supported financially by the Polish Ministry of Science and Higher Education, 2008-2011
11th International Conference on Quantitative InfraRed Thermography, 11-14 June 2012, Naples Italy