Embed Size (px)
Citation preview
General rights Copyright and moral rights for the publications made accessible in the public portal are retained by the authors and/or other copyright owners and it is a condition of accessing publications that users recognise and abide by the legal requirements associated with these rights.
Users may download and print one copy of any publication from the public portal for the purpose of private study or research.
You may not further distribute the material or use it for any profit-making activity or commercial gain
You may freely distribute the URL identifying the publication in the public portal If you believe that this document breaches copyright please contact us providing details, and we will remove access to the work immediately and investigate your claim.
Downloaded from orbit.dtu.dk on: Mar 16, 2022
Influence of the control system on wind turbine reliability in extreme turbulence
Abdallah, Imad; Natarajan, Anand; Sørensen, J. D.
Published in:Journal of Physics: Conference Series (Online)
Link to article, DOI:10.1088/1742-6596/524/1/012069
Publication date:2014
Document VersionPublisher's PDF, also known as Version of record
Link back to DTU Orbit
Citation (APA):Abdallah, I., Natarajan, A., & Sørensen, J. D. (2014). Influence of the control system on wind turbine reliability inextreme turbulence. Journal of Physics: Conference Series (Online), 524(1), [012069].https://doi.org/10.1088/1742-6596/524/1/012069

This content has been downloaded from IOPscience. Please scroll down to see the full text.
Download details:
IP Address: 192.38.90.17
This content was downloaded on 20/06/2014 at 09:01
Please note that terms and conditions apply.
Influence of the control system on wind turbine reliability in extreme turbulence
View the table of contents for this issue, or go to the journal homepage for more
2014 J. Phys.: Conf. Ser. 524 012069
(http://iopscience.iop.org/1742-6596/524/1/012069)
Home Search Collections Journals About Contact us My IOPscience
Influence of the control system on wind turbine reliability in extreme turbulence
I. Abdallah1, A. Natarajan2, J.D. Sørensen3 1MiTa Teknik Håndværkervej 1 DK-8840 Rødkærsbro, Denmark; Technical University of Denmark, Department of Wind Energy, Risø Campus, DK-4000 Roskilde, Denmark 2Technical University of Denmark, Department of Wind Energy, Risø Campus, DK-4000 Roskilde, Denmark 3Aalborg University, Department of Civil Engineering, Sohngårdsholmsvej 57, DK-9000 Aalborg, Denmark E-mail: [email protected] Abstract. One of the critical design driving load cases for modern large onshore/offshore wind turbines is power production in extreme turbulence. According to the IEC 61400-1 edition 3 design standard, the normal production extreme loads are extrapolated and compared to the extreme loads obtained under extreme turbulence input. This study shows that using a probabilistic approach and the first order reliability method, wind turbine structural reliability can be assessed when the extreme turbulence model is uncertain. The structural reliability is assessed for a wind turbine with/without structural load alleviation control features. It is shown that large uncertainties in inflow conditions and turbulence can be significantly reduced while maintaining an acceptable structural reliability through the use of advanced structural load alleviation control features. However, that comes at a cost of increased controller complexity and loss in annual energy production.
1. Introduction The extreme turbulence load case (DLC1.3ETM in the IEC61400-1 [1]) generally ranks as a top design driving case for extreme loading on wind turbine components. Special load alleviation control features are designed by manufacturers to specifically reduce the adverse effects of this load case. The motivating questions in this paper are: how does the structural reliability of the wind turbine change if the extreme turbulence model is uncertain? In the presence of such uncertainty how does the structural reliability change with/without advanced load alleviation features? The objective of this paper is to investigate the structural reliability of a wind turbine in the presence of uncertainties in the extreme turbulence model when increasing levels of complexity of the load alleviation features in the control system are employed. First the turbulence model and the control features are described, then the load probabilistic model is derived and finally the structural reliability is performed using the First Order Reliability Method (FORM).
1 To whom any correspondence should be addressed.
The Science of Making Torque from Wind 2014 (TORQUE 2014) IOP PublishingJournal of Physics: Conference Series 524 (2014) 012069 doi:10.1088/1742-6596/524/1/012069
Content from this work may be used under the terms of the Creative Commons Attribution 3.0 licence. Any further distributionof this work must maintain attribution to the author(s) and the title of the work, journal citation and DOI.
Published under licence by IOP Publishing Ltd 1
2. The IEC61400-1 extreme turbulence model The background for the extreme turbulence model in [1] is described below based on environmental contours derived through the Inverse FORM methodology (IFORM). The annual distribution of the 10 minute mean wind speed, denoted by random variable V, is given by a Rayleigh distribution defined as:
𝑓𝑓𝑉𝑉(𝑣𝑣) = 2𝑣𝑣
�2𝜇𝜇𝑉𝑉 √𝜋𝜋⁄ �2 𝑒𝑒𝑒𝑒𝑒𝑒 �− �
𝑣𝑣2𝜇𝜇𝑉𝑉 √𝜋𝜋⁄
�2� (1)
Where 𝑣𝑣 is the hub wind speed and 𝜇𝜇𝑉𝑉 is the mean wind speed. The standard deviation of the 10-minute wind speed is taken as the measure of turbulence, whose longitudinal component is denoted by σ1. The long term conditional distribution of turbulence σ1 given the wind speed 𝑉𝑉 is assumed to follow the lognormal distribution:
𝑓𝑓𝜎𝜎1|𝑉𝑉(𝜎𝜎1|𝑣𝑣) = 1√2𝜋𝜋𝜁𝜁𝜎𝜎1
𝑒𝑒𝑒𝑒𝑒𝑒 �− 12�ln(𝜎𝜎1)−𝜆𝜆
𝜁𝜁�2� (2)
where the parameters of the lognormal distribution, λ and ζ, are defined as:
𝜁𝜁 = �ln (𝛿𝛿𝜎𝜎1|𝑉𝑉2 + 1) (3)
𝜆𝜆 = ln�𝜇𝜇𝜎𝜎1|𝑉𝑉� −12𝜁𝜁2 (4)
With the coefficient of variation 𝛿𝛿𝜎𝜎1|𝑉𝑉 =𝜎𝜎𝜎𝜎1|𝑉𝑉
𝜇𝜇𝜎𝜎1|𝑉𝑉.
The conditional mean and standard deviation of turbulence are given by the equations [1]:
𝜇𝜇𝜎𝜎1|𝑉𝑉 = 𝐼𝐼𝑟𝑟𝑟𝑟𝑟𝑟(0.75𝑣𝑣 + 𝑐𝑐) (5) 𝜎𝜎𝜎𝜎1|𝑉𝑉 = 1.44𝐼𝐼𝑟𝑟𝑟𝑟𝑟𝑟 (6)
The parameters Iref and c are found in table 1 for turbulence class A through C.
The joint PDF of wind speed and turbulence is obtained by multiplying Equations 1 and 2:
𝑓𝑓𝜎𝜎1,𝑉𝑉(𝜎𝜎1, 𝑣𝑣) = 𝑓𝑓𝜎𝜎1|𝑉𝑉(𝜎𝜎1|𝑣𝑣)𝑓𝑓𝑉𝑉(𝑣𝑣) (7)
The resulting joint PDF for class IEC-IB is shown in figure 1a. Now assuming a probability of failure, Pf, defined in terms of the return period r, an “environmental contour” can be constructed in the standard Normal u-space which represents all points on a circle such that
�𝑢𝑢12 + 𝑢𝑢22 = 𝛽𝛽𝑟𝑟 (8)
where the reliability index βr and the probability of failure Pf are defined as follows Φ(−𝛽𝛽𝑟𝑟) = 𝑃𝑃𝑟𝑟 with Φ(∙) being the distribution function for the standardized Normal distribution. The independent standard Normal random variables U1 and U2 can be transformed into contours in the physical space utilizing the above equations and the following Rosenblatt transformations:
Φ(𝑢𝑢1) = 𝐹𝐹𝑉𝑉(𝑣𝑣);→ 𝑣𝑣 = 𝐹𝐹𝑉𝑉−1(Φ(𝑢𝑢1)) (9) Φ(𝑢𝑢2) = 𝐹𝐹𝜎𝜎1|𝑉𝑉(𝜎𝜎1|𝑣𝑣);→ 𝑡𝑡 = 𝐹𝐹𝜎𝜎1|𝑉𝑉
−1 �Φ(𝑢𝑢2)� (10)
Table 1. Iref and c for turbulence classes A-C.
Turbulence Class Iref c [m/s]
A 0.16 3.8 B 0.14 3.8 C 0.12 3.8
The Science of Making Torque from Wind 2014 (TORQUE 2014) IOP PublishingJournal of Physics: Conference Series 524 (2014) 012069 doi:10.1088/1742-6596/524/1/012069
2
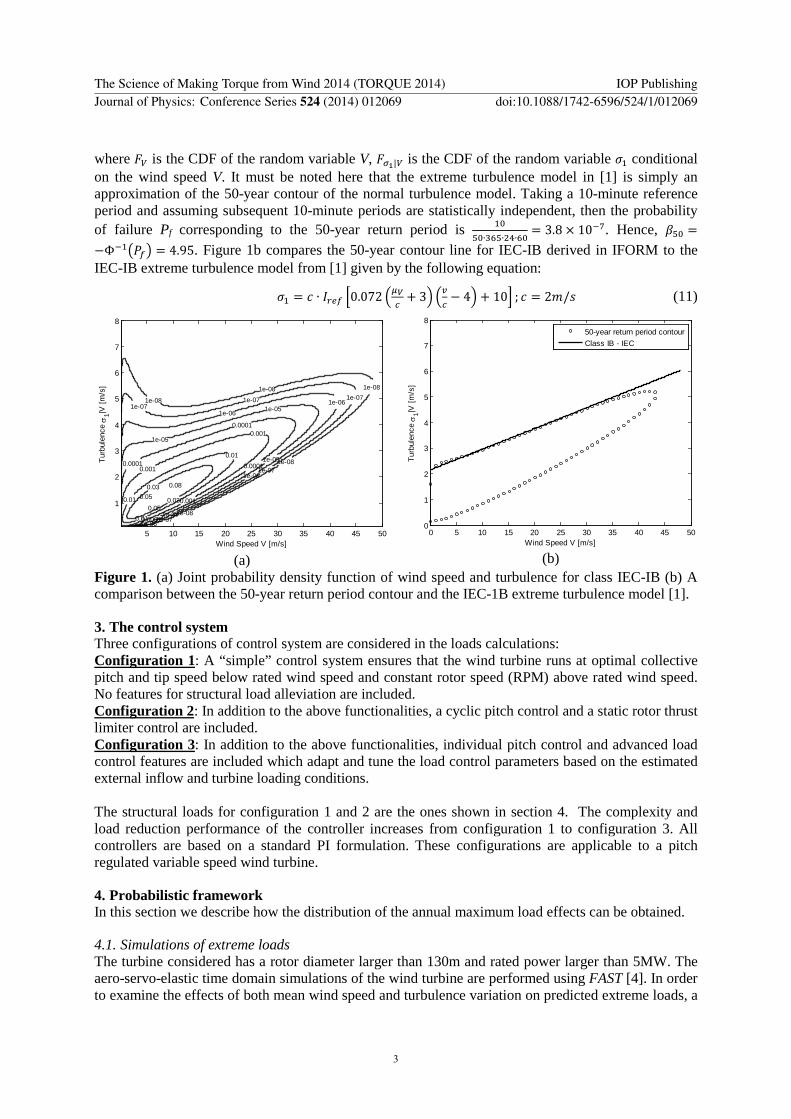
where 𝐹𝐹𝑉𝑉 is the CDF of the random variable V, 𝐹𝐹𝜎𝜎1|𝑉𝑉 is the CDF of the random variable 𝜎𝜎1 conditional on the wind speed V. It must be noted here that the extreme turbulence model in [1] is simply an approximation of the 50-year contour of the normal turbulence model. Taking a 10-minute reference period and assuming subsequent 10-minute periods are statistically independent, then the probability of failure Pf corresponding to the 50-year return period is 10
50∙365∙24∙60= 3.8 × 10⁻⁷. Hence, 𝛽𝛽50 =
−Φ−1�𝑃𝑃𝑟𝑟� = 4.95. Figure 1b compares the 50-year contour line for IEC-IB derived in IFORM to the IEC-IB extreme turbulence model from [1] given by the following equation:
𝜎𝜎1 = 𝑐𝑐 ∙ 𝐼𝐼𝑟𝑟𝑟𝑟𝑟𝑟 �0.072 �𝜇𝜇𝑉𝑉𝑐𝑐
+ 3� �𝑣𝑣𝑐𝑐− 4� + 10� ; 𝑐𝑐 = 2𝑚𝑚/𝑠𝑠 (11)
(a)
(b)
Figure 1. (a) Joint probability density function of wind speed and turbulence for class IEC-IB (b) A comparison between the 50-year return period contour and the IEC-1B extreme turbulence model [1].
3. The control system Three configurations of control system are considered in the loads calculations: Configuration 1: A “simple” control system ensures that the wind turbine runs at optimal collective pitch and tip speed below rated wind speed and constant rotor speed (RPM) above rated wind speed. No features for structural load alleviation are included. Configuration 2: In addition to the above functionalities, a cyclic pitch control and a static rotor thrust limiter control are included. Configuration 3: In addition to the above functionalities, individual pitch control and advanced load control features are included which adapt and tune the load control parameters based on the estimated external inflow and turbine loading conditions. The structural loads for configuration 1 and 2 are the ones shown in section 4. The complexity and load reduction performance of the controller increases from configuration 1 to configuration 3. All controllers are based on a standard PI formulation. These configurations are applicable to a pitch regulated variable speed wind turbine.
4. Probabilistic framework In this section we describe how the distribution of the annual maximum load effects can be obtained.
4.1. Simulations of extreme loads The turbine considered has a rotor diameter larger than 130m and rated power larger than 5MW. The aero-servo-elastic time domain simulations of the wind turbine are performed using FAST [4]. In order to examine the effects of both mean wind speed and turbulence variation on predicted extreme loads, a
1e-08
1e-08
1e-081e-08
1e-08
1e-07
1e-07
1e-071e-071e-07
1e-06
1e-06
1e-061e-06
1e-05
1e-05
1e-05
1e-05
0.0001
0.0001
0.0001
0.00010.001
0.001
0.0010.01
0.01
0.01
0.03
0.030.05
0.05
0.08
Wind Speed V [m/s]
Turb
ulen
ce σ
1|V [m
/s]
p
5 10 15 20 25 30 35 40 45 50
1
2
3
4
5
6
7
8
0 5 10 15 20 25 30 35 40 45 500
1
2
3
4
5
6
7
8
Wind Speed V [m/s]
Turb
ulen
ce σ
1|V [m
/s]
50-year return period contourClass IB - IEC
The Science of Making Torque from Wind 2014 (TORQUE 2014) IOP PublishingJournal of Physics: Conference Series 524 (2014) 012069 doi:10.1088/1742-6596/524/1/012069
3
large data set of wind simulations was compiled. Wind simulations were run over a range of mean wind speeds between 4–25 m/s in 1-m/s increments and turbulence levels between 1–8 m/s in 1m/s increments. Each wind speed and turbulence level combination is repeated using 48 stochastic seeds, resulting in a total of 8448 10-minute simulations. The output used from the simulations are the blade root flapwise bending moment, and the tower bottom fore-aft bending moment. The maxima of the bending moment data are extracted using the method of the Global Maxima for each 10 minute time series. These maxima are further used as the basis for determining probability models of the extreme loads: 𝑓𝑓𝐿𝐿(𝑙𝑙|𝜎𝜎1 ,𝑣𝑣): PDF of the load effect 𝑙𝑙 given turbulence and wind speed, determined using the load
simulations. 𝑓𝑓𝜎𝜎1,𝑉𝑉(𝜎𝜎1,𝑣𝑣) = 𝑓𝑓𝜎𝜎1|𝑉𝑉(𝜎𝜎1|𝑣𝑣)𝑓𝑓𝑉𝑉(𝑣𝑣): Joint PDF of wind speed and turbulence determined as described
in section 2 (figure 1a).
4.2. Loads extrapolations In order to analyse the structural reliability in the presence of uncertainties in the turbulence model, it is necessary to derive the probability distribution of the load with a yearly reference period. This distribution is derived through the long term extrapolated probability distribution. The long term probability distribution for the maximum 10-minute load effect 𝑙𝑙 conditional on wind speed 𝑣𝑣 and turbulence 𝜎𝜎1 is modelled as follows:
𝐹𝐹𝑠𝑠ℎ𝑜𝑜𝑟𝑟𝑜𝑜.𝑜𝑜𝑟𝑟𝑟𝑟𝑡𝑡(𝑙𝑙|𝑇𝑇10𝑡𝑡𝑚𝑚𝑚𝑚,𝑣𝑣,𝜎𝜎1) = 𝐹𝐹𝑙𝑙𝑜𝑜𝑐𝑐𝑙𝑙𝑙𝑙(𝑙𝑙|𝑇𝑇10𝑡𝑡𝑚𝑚𝑚𝑚,𝑣𝑣,𝜎𝜎1)𝑚𝑚(𝜎𝜎1,𝑣𝑣) 𝐹𝐹𝑙𝑙𝑜𝑜𝑚𝑚𝑙𝑙.𝑜𝑜𝑟𝑟𝑟𝑟𝑡𝑡(𝑙𝑙|𝑇𝑇10𝑡𝑡𝑚𝑚𝑚𝑚) = ∫ ∫ 𝐹𝐹𝑠𝑠ℎ𝑜𝑜𝑟𝑟𝑜𝑜.𝑜𝑜𝑟𝑟𝑟𝑟𝑡𝑡(𝑙𝑙|𝑇𝑇10𝑡𝑡𝑚𝑚𝑚𝑚,𝑣𝑣,𝜎𝜎1)𝑓𝑓𝜎𝜎1|𝑉𝑉(𝜎𝜎1|𝑣𝑣)𝑓𝑓𝑉𝑉(𝑣𝑣)𝑑𝑑𝜎𝜎1𝑑𝑑𝑉𝑉
∞0
𝑉𝑉𝑜𝑜𝑜𝑜𝑜𝑜𝑉𝑉𝑖𝑖𝑖𝑖
(12)
where 𝑛𝑛(𝜎𝜎1,𝑣𝑣) is the expected number of uncorrelated maxima in 10 minutes. 𝐹𝐹𝑙𝑙𝑜𝑜𝑐𝑐𝑙𝑙𝑙𝑙 is the local probability distribution for the load process which is chosen to be a 3-parameter Weibull distribution function [3]. The long-term probability of exceedance is then computed by integrating all of the short-term loads distributions with the joint PDF of wind speed and turbulence. The annual maximum probability distribution is finally derived as follows2:
𝐹𝐹𝑙𝑙𝑜𝑜𝑚𝑚𝑙𝑙.𝑜𝑜𝑟𝑟𝑟𝑟𝑡𝑡�𝑙𝑙|𝑇𝑇1𝑦𝑦𝑟𝑟𝑙𝑙𝑟𝑟� = 𝐹𝐹𝑙𝑙𝑜𝑜𝑚𝑚𝑙𝑙. 𝑜𝑜𝑟𝑟𝑟𝑟𝑡𝑡(𝑙𝑙|𝑇𝑇10𝑡𝑡𝑚𝑚𝑚𝑚)𝑁𝑁 (13)
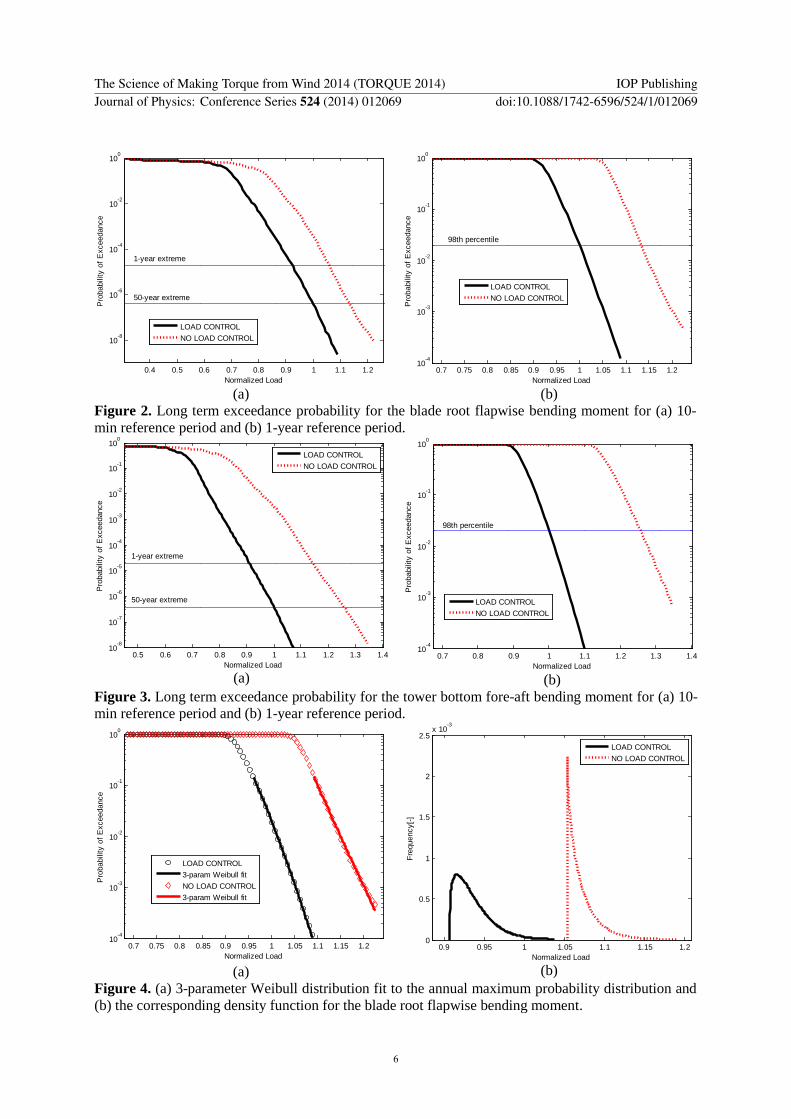
where N is the number of 10min periods in one year (=365·24·60min/10min). The annual maximum distributions for the load effect are plotted in figures 2-3 for the blade root flapwise bending moment and tower bottom fore-aft bending moment respectively3. The plots indicate that the resulting long term distributions with/without load alleviation control features differ significantly. At the fifty year return period, the observed reduction in the blade flapwise extreme bending moment is approximately 14% while the observed reduction in the tower bottom fore-aft extreme bending moment is approximately 25%. A conclusion can be drawn at this point: A turbine designer should assess the impact of the controller on structural reliability of the wind turbine. Should a total control failure take place, an increase in exceedance probability occurs. The sophistication and performance of the structural load control system could vary drastically amongst manufacturers. We will investigate this issue further in section 5.
2 Say 𝐿𝐿 = max (𝑋𝑋1,𝑋𝑋2,⋅⋅⋅,𝑋𝑋𝑁𝑁) where X is a random variable with distribution 𝐹𝐹𝑋𝑋. Using the accumulation of probability in independent repeated trials, the distribution of L can be written as:𝐹𝐹𝐿𝐿(𝑒𝑒) = 𝑃𝑃(max𝑋𝑋𝑚𝑚 ≤𝑒𝑒 {𝑖𝑖 = 1, … ,𝑁𝑁}) = 𝑃𝑃(𝑋𝑋1 ≤ 𝑒𝑒⋂𝑋𝑋2 ≤ 𝑒𝑒⋂ ⋅⋅⋅ 𝑋𝑋𝑁𝑁 ≤ 𝑒𝑒) ⇒ 𝐹𝐹𝐿𝐿(𝑒𝑒) = ∏ 𝑃𝑃(𝑋𝑋𝑚𝑚 ≤ 𝑒𝑒)𝑁𝑁
𝑚𝑚=1 = 𝐹𝐹𝑋𝑋(𝑒𝑒)𝑁𝑁. If 𝐹𝐹𝐿𝐿 is the distribution (non-exceedance probability) of maximum load in a reference period tr and 𝐹𝐹𝑋𝑋is the distribution of maximum load occurring in much shorter period 𝜏𝜏, the exponent 𝑛𝑛 is then equal to 𝑡𝑡𝑟𝑟/ 𝜏𝜏. Example: the 50-year non-exceedance probability with a reference period of 10min corresponds to 0.98 non-exceedance probability with a reference period of 1 year. 3 The extrapolated loads are normalized with the 50-year extrapolated load level derived from the simulations with control configuration 2.
The Science of Making Torque from Wind 2014 (TORQUE 2014) IOP PublishingJournal of Physics: Conference Series 524 (2014) 012069 doi:10.1088/1742-6596/524/1/012069
4
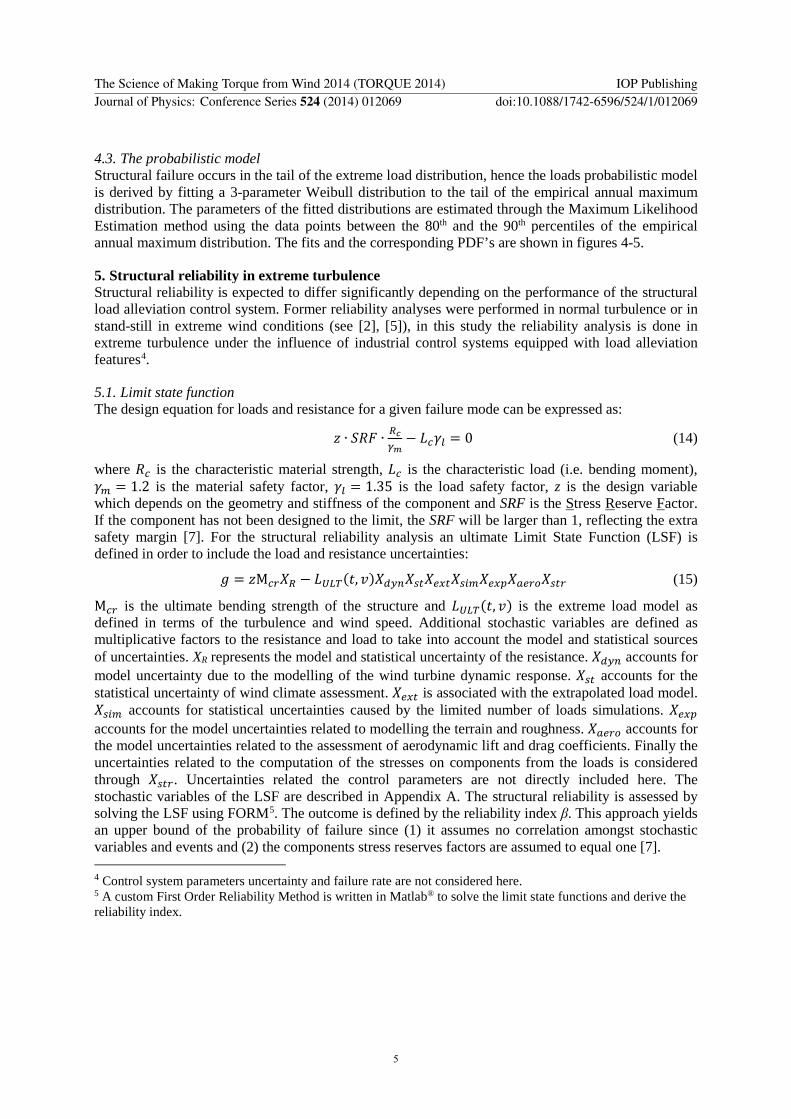
4.3. The probabilistic model Structural failure occurs in the tail of the extreme load distribution, hence the loads probabilistic model is derived by fitting a 3-parameter Weibull distribution to the tail of the empirical annual maximum distribution. The parameters of the fitted distributions are estimated through the Maximum Likelihood Estimation method using the data points between the 80th and the 90th percentiles of the empirical annual maximum distribution. The fits and the corresponding PDF’s are shown in figures 4-5.
5. Structural reliability in extreme turbulence Structural reliability is expected to differ significantly depending on the performance of the structural load alleviation control system. Former reliability analyses were performed in normal turbulence or in stand-still in extreme wind conditions (see [2], [5]), in this study the reliability analysis is done in extreme turbulence under the influence of industrial control systems equipped with load alleviation features4.
5.1. Limit state function The design equation for loads and resistance for a given failure mode can be expressed as:
𝑧𝑧 ∙ 𝑆𝑆𝑆𝑆𝐹𝐹 ∙ 𝑅𝑅𝑐𝑐𝛾𝛾𝑚𝑚− 𝐿𝐿𝑐𝑐𝛾𝛾𝑙𝑙 = 0 (14)
where 𝑆𝑆𝑐𝑐 is the characteristic material strength, 𝐿𝐿𝑐𝑐 is the characteristic load (i.e. bending moment), 𝛾𝛾𝑡𝑡 = 1.2 is the material safety factor, 𝛾𝛾𝑙𝑙 = 1.35 is the load safety factor, z is the design variable which depends on the geometry and stiffness of the component and SRF is the Stress Reserve Factor. If the component has not been designed to the limit, the SRF will be larger than 1, reflecting the extra safety margin [7]. For the structural reliability analysis an ultimate Limit State Function (LSF) is defined in order to include the load and resistance uncertainties:
𝑔𝑔 = 𝑧𝑧M𝑐𝑐𝑟𝑟𝑋𝑋𝑅𝑅 − 𝐿𝐿𝑈𝑈𝐿𝐿𝑈𝑈(𝑡𝑡, 𝑣𝑣)𝑋𝑋𝑑𝑑𝑦𝑦𝑚𝑚𝑋𝑋𝑠𝑠𝑜𝑜𝑋𝑋𝑟𝑟𝑒𝑒𝑜𝑜𝑋𝑋𝑠𝑠𝑚𝑚𝑡𝑡𝑋𝑋𝑟𝑟𝑒𝑒𝑒𝑒𝑋𝑋𝑙𝑙𝑟𝑟𝑟𝑟𝑜𝑜𝑋𝑋𝑠𝑠𝑜𝑜𝑟𝑟 (15)
M𝑐𝑐𝑟𝑟 is the ultimate bending strength of the structure and 𝐿𝐿𝑈𝑈𝐿𝐿𝑈𝑈(𝑡𝑡, 𝑣𝑣) is the extreme load model as defined in terms of the turbulence and wind speed. Additional stochastic variables are defined as multiplicative factors to the resistance and load to take into account the model and statistical sources of uncertainties. XR represents the model and statistical uncertainty of the resistance. 𝑋𝑋𝑑𝑑𝑦𝑦𝑚𝑚 accounts for model uncertainty due to the modelling of the wind turbine dynamic response. 𝑋𝑋𝑠𝑠𝑜𝑜 accounts for the statistical uncertainty of wind climate assessment. 𝑋𝑋𝑟𝑟𝑒𝑒𝑜𝑜 is associated with the extrapolated load model. 𝑋𝑋𝑠𝑠𝑚𝑚𝑡𝑡 accounts for statistical uncertainties caused by the limited number of loads simulations. 𝑋𝑋𝑟𝑟𝑒𝑒𝑒𝑒 accounts for the model uncertainties related to modelling the terrain and roughness. 𝑋𝑋𝑙𝑙𝑟𝑟𝑟𝑟𝑜𝑜 accounts for the model uncertainties related to the assessment of aerodynamic lift and drag coefficients. Finally the uncertainties related to the computation of the stresses on components from the loads is considered through 𝑋𝑋𝑠𝑠𝑜𝑜𝑟𝑟. Uncertainties related the control parameters are not directly included here. The stochastic variables of the LSF are described in Appendix A. The structural reliability is assessed by solving the LSF using FORM5. The outcome is defined by the reliability index β. This approach yields an upper bound of the probability of failure since (1) it assumes no correlation amongst stochastic variables and events and (2) the components stress reserves factors are assumed to equal one [7].
4 Control system parameters uncertainty and failure rate are not considered here. 5 A custom First Order Reliability Method is written in Matlab® to solve the limit state functions and derive the reliability index.
The Science of Making Torque from Wind 2014 (TORQUE 2014) IOP PublishingJournal of Physics: Conference Series 524 (2014) 012069 doi:10.1088/1742-6596/524/1/012069
5
(a)
(b)
Figure 2. Long term exceedance probability for the blade root flapwise bending moment for (a) 10-min reference period and (b) 1-year reference period.
(a) (b)
Figure 3. Long term exceedance probability for the tower bottom fore-aft bending moment for (a) 10-min reference period and (b) 1-year reference period.
(a)
(b)
Figure 4. (a) 3-parameter Weibull distribution fit to the annual maximum probability distribution and (b) the corresponding density function for the blade root flapwise bending moment.
0.4 0.5 0.6 0.7 0.8 0.9 1 1.1 1.2
10-8
10-6
10-4
10-2
100
1-year extreme
50-year extreme
Normalized Load
Pro
babi
lity
of E
xcee
danc
e
LOAD CONTROLNO LOAD CONTROL
0.7 0.75 0.8 0.85 0.9 0.95 1 1.05 1.1 1.15 1.210
-4
10-3
10-2
10-1
100
98th percentile
Normalized Load
Pro
babi
lity
of E
xcee
danc
e
LOAD CONTROLNO LOAD CONTROL
0.5 0.6 0.7 0.8 0.9 1 1.1 1.2 1.3 1.410
-8
10-7
10-6
10-5
10-4
10-3
10-2
10-1
100
1-year extreme
50-year extreme
Normalized Load
Pro
babi
lity
of E
xcee
danc
e
LOAD CONTROLNO LOAD CONTROL
0.7 0.8 0.9 1 1.1 1.2 1.3 1.410
-4
10-3
10-2
10-1
100
98th percentile
Normalized Load
Pro
babi
lity
of E
xcee
danc
e
LOAD CONTROLNO LOAD CONTROL
0.7 0.75 0.8 0.85 0.9 0.95 1 1.05 1.1 1.15 1.210
-4
10-3
10-2
10-1
100
Normalized Load
Pro
babi
lity
of E
xcee
danc
e
LOAD CONTROL3-param Weibull fitNO LOAD CONTROL3-param Weibull fit
0.9 0.95 1 1.05 1.1 1.15 1.20
0.5
1
1.5
2
2.5x 10
-3
Normalized Load
Freq
uenc
y[-]
LOAD CONTROLNO LOAD CONTROL
The Science of Making Torque from Wind 2014 (TORQUE 2014) IOP PublishingJournal of Physics: Conference Series 524 (2014) 012069 doi:10.1088/1742-6596/524/1/012069
6
(a)
(b)
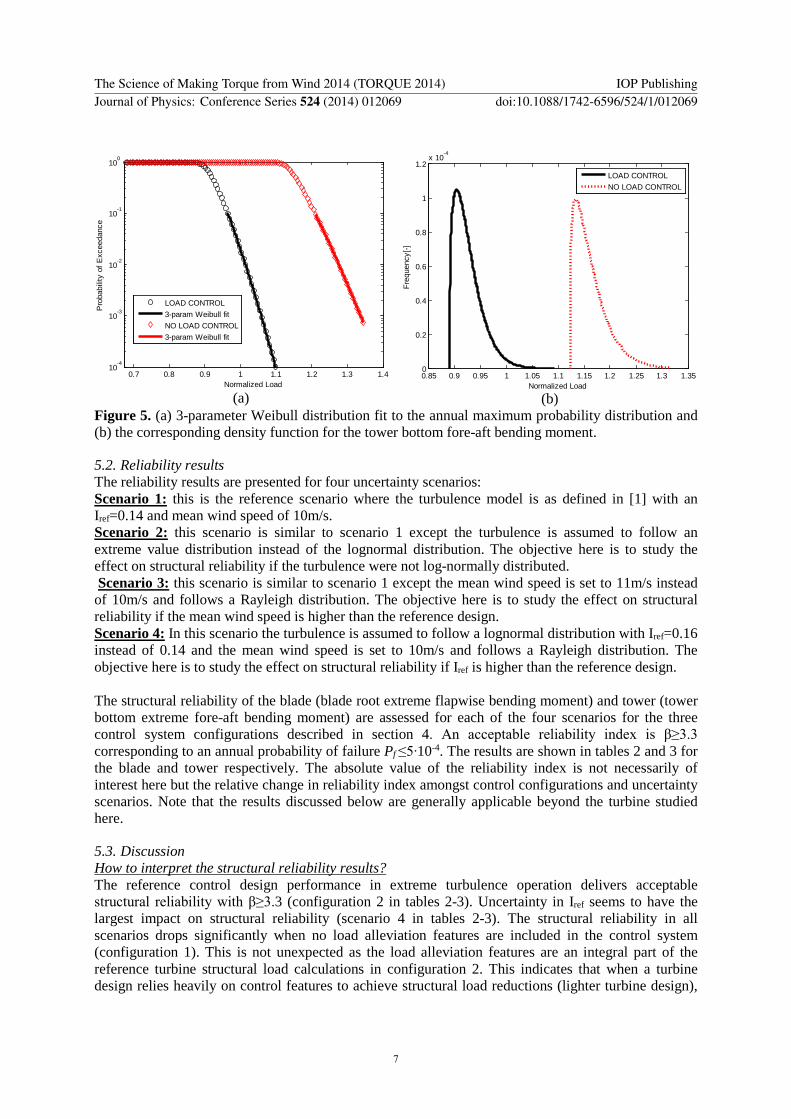
Figure 5. (a) 3-parameter Weibull distribution fit to the annual maximum probability distribution and (b) the corresponding density function for the tower bottom fore-aft bending moment.
5.2. Reliability results The reliability results are presented for four uncertainty scenarios: Scenario 1: this is the reference scenario where the turbulence model is as defined in [1] with an Iref=0.14 and mean wind speed of 10m/s. Scenario 2: this scenario is similar to scenario 1 except the turbulence is assumed to follow an extreme value distribution instead of the lognormal distribution. The objective here is to study the effect on structural reliability if the turbulence were not log-normally distributed. Scenario 3: this scenario is similar to scenario 1 except the mean wind speed is set to 11m/s instead of 10m/s and follows a Rayleigh distribution. The objective here is to study the effect on structural reliability if the mean wind speed is higher than the reference design. Scenario 4: In this scenario the turbulence is assumed to follow a lognormal distribution with Iref=0.16 instead of 0.14 and the mean wind speed is set to 10m/s and follows a Rayleigh distribution. The objective here is to study the effect on structural reliability if Iref is higher than the reference design. The structural reliability of the blade (blade root extreme flapwise bending moment) and tower (tower bottom extreme fore-aft bending moment) are assessed for each of the four scenarios for the three control system configurations described in section 4. An acceptable reliability index is β≥3.3 corresponding to an annual probability of failure Pf ≤5∙10-4. The results are shown in tables 2 and 3 for the blade and tower respectively. The absolute value of the reliability index is not necessarily of interest here but the relative change in reliability index amongst control configurations and uncertainty scenarios. Note that the results discussed below are generally applicable beyond the turbine studied here.
5.3. Discussion How to interpret the structural reliability results? The reference control design performance in extreme turbulence operation delivers acceptable structural reliability with β≥3.3 (configuration 2 in tables 2-3). Uncertainty in Iref seems to have the largest impact on structural reliability (scenario 4 in tables 2-3). The structural reliability in all scenarios drops significantly when no load alleviation features are included in the control system (configuration 1). This is not unexpected as the load alleviation features are an integral part of the reference turbine structural load calculations in configuration 2. This indicates that when a turbine design relies heavily on control features to achieve structural load reductions (lighter turbine design),
0.7 0.8 0.9 1 1.1 1.2 1.3 1.410
-4
10-3
10-2
10-1
100
Normalized Load
Pro
babi
lity
of E
xcee
danc
e
LOAD CONTROL3-param Weibull fitNO LOAD CONTROL3-param Weibull fit
0.85 0.9 0.95 1 1.05 1.1 1.15 1.2 1.25 1.3 1.350
0.2
0.4
0.6
0.8
1
1.2x 10
-4
Normalized Load
Freq
uenc
y[-]
LOAD CONTROLNO LOAD CONTROL
The Science of Making Torque from Wind 2014 (TORQUE 2014) IOP PublishingJournal of Physics: Conference Series 524 (2014) 012069 doi:10.1088/1742-6596/524/1/012069
7
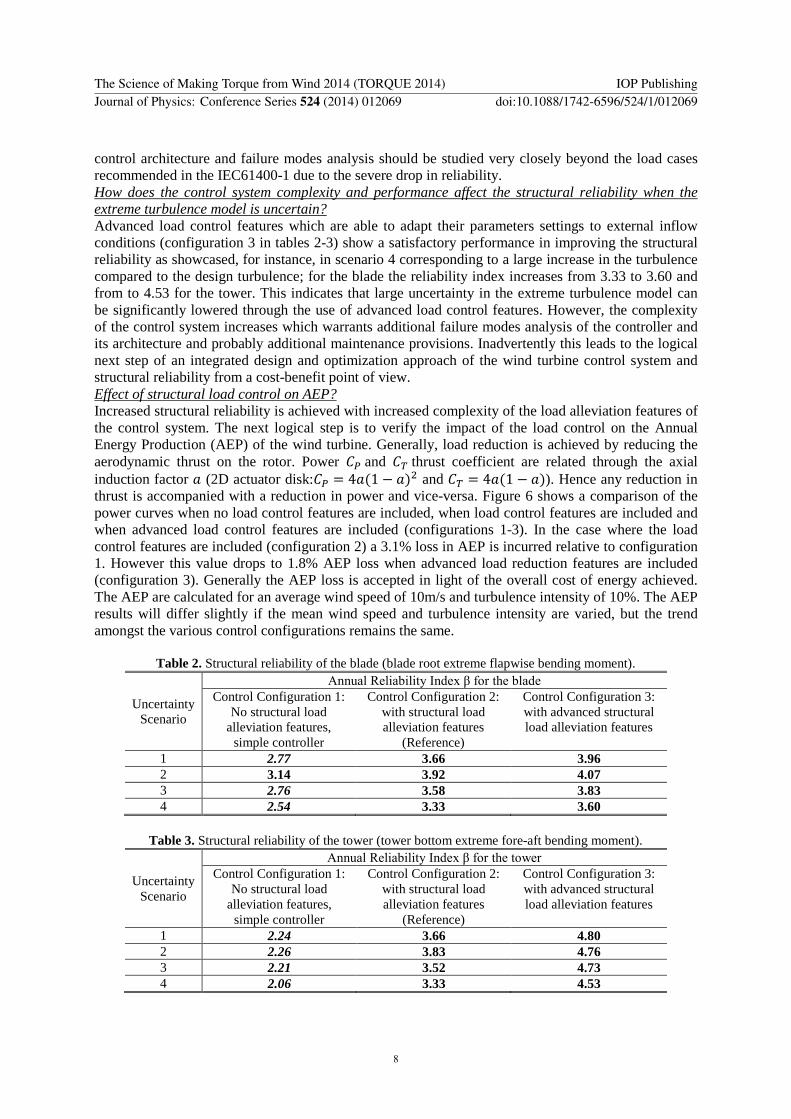
control architecture and failure modes analysis should be studied very closely beyond the load cases recommended in the IEC61400-1 due to the severe drop in reliability. How does the control system complexity and performance affect the structural reliability when the extreme turbulence model is uncertain? Advanced load control features which are able to adapt their parameters settings to external inflow conditions (configuration 3 in tables 2-3) show a satisfactory performance in improving the structural reliability as showcased, for instance, in scenario 4 corresponding to a large increase in the turbulence compared to the design turbulence; for the blade the reliability index increases from 3.33 to 3.60 and from to 4.53 for the tower. This indicates that large uncertainty in the extreme turbulence model can be significantly lowered through the use of advanced load control features. However, the complexity of the control system increases which warrants additional failure modes analysis of the controller and its architecture and probably additional maintenance provisions. Inadvertently this leads to the logical next step of an integrated design and optimization approach of the wind turbine control system and structural reliability from a cost-benefit point of view. Effect of structural load control on AEP? Increased structural reliability is achieved with increased complexity of the load alleviation features of the control system. The next logical step is to verify the impact of the load control on the Annual Energy Production (AEP) of the wind turbine. Generally, load reduction is achieved by reducing the aerodynamic thrust on the rotor. Power 𝐶𝐶𝑃𝑃 and 𝐶𝐶𝑈𝑈 thrust coefficient are related through the axial induction factor 𝑎𝑎 (2D actuator disk:𝐶𝐶𝑃𝑃 = 4𝑎𝑎(1 − 𝑎𝑎)2 and 𝐶𝐶𝑈𝑈 = 4𝑎𝑎(1 − 𝑎𝑎)). Hence any reduction in thrust is accompanied with a reduction in power and vice-versa. Figure 6 shows a comparison of the power curves when no load control features are included, when load control features are included and when advanced load control features are included (configurations 1-3). In the case where the load control features are included (configuration 2) a 3.1% loss in AEP is incurred relative to configuration 1. However this value drops to 1.8% AEP loss when advanced load reduction features are included (configuration 3). Generally the AEP loss is accepted in light of the overall cost of energy achieved. The AEP are calculated for an average wind speed of 10m/s and turbulence intensity of 10%. The AEP results will differ slightly if the mean wind speed and turbulence intensity are varied, but the trend amongst the various control configurations remains the same.
Table 2. Structural reliability of the blade (blade root extreme flapwise bending moment).
Uncertainty Scenario
Annual Reliability Index β for the blade Control Configuration 1:
No structural load alleviation features,
simple controller
Control Configuration 2: with structural load alleviation features
(Reference)
Control Configuration 3: with advanced structural load alleviation features
1 2.77 3.66 3.96 2 3.14 3.92 4.07 3 2.76 3.58 3.83 4 2.54 3.33 3.60
Table 3. Structural reliability of the tower (tower bottom extreme fore-aft bending moment).
Uncertainty Scenario
Annual Reliability Index β for the tower Control Configuration 1:
No structural load alleviation features,
simple controller
Control Configuration 2: with structural load alleviation features
(Reference)
Control Configuration 3: with advanced structural load alleviation features
1 2.24 3.66 4.80 2 2.26 3.83 4.76 3 2.21 3.52 4.73 4 2.06 3.33 4.53
The Science of Making Torque from Wind 2014 (TORQUE 2014) IOP PublishingJournal of Physics: Conference Series 524 (2014) 012069 doi:10.1088/1742-6596/524/1/012069
8
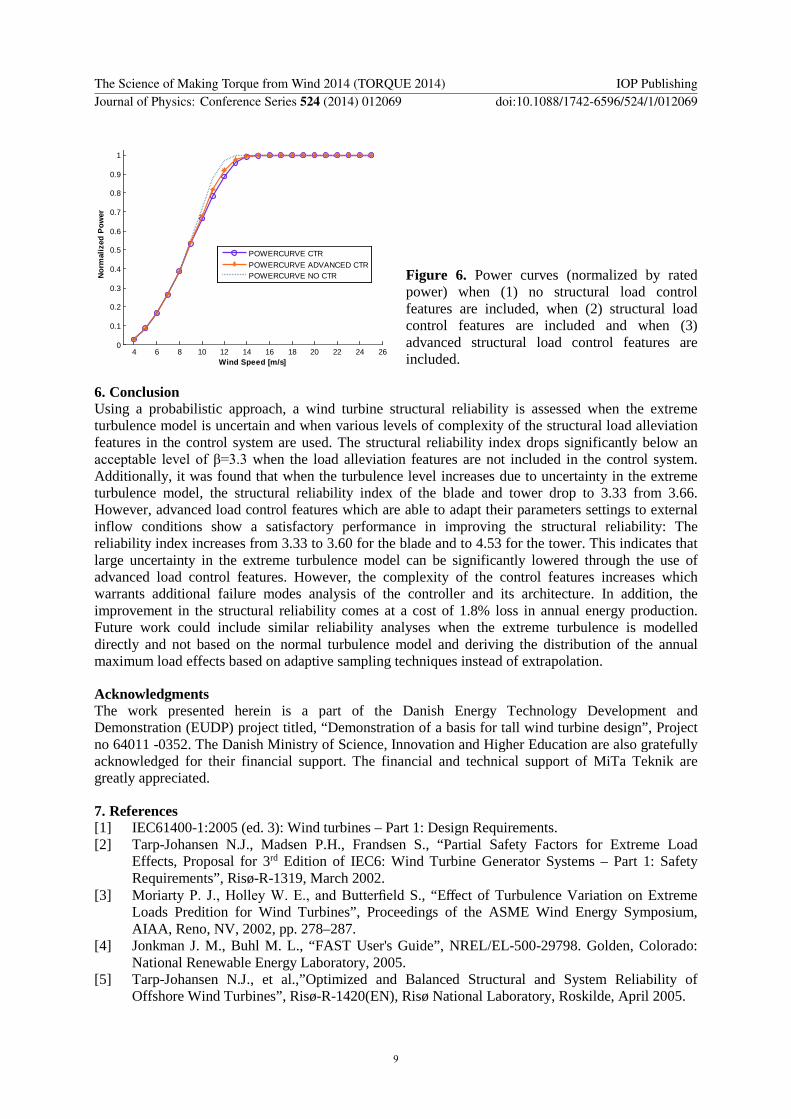
Figure 6. Power curves (normalized by rated power) when (1) no structural load control features are included, when (2) structural load control features are included and when (3) advanced structural load control features are included.
6. Conclusion Using a probabilistic approach, a wind turbine structural reliability is assessed when the extreme turbulence model is uncertain and when various levels of complexity of the structural load alleviation features in the control system are used. The structural reliability index drops significantly below an acceptable level of β=3.3 when the load alleviation features are not included in the control system. Additionally, it was found that when the turbulence level increases due to uncertainty in the extreme turbulence model, the structural reliability index of the blade and tower drop to 3.33 from 3.66. However, advanced load control features which are able to adapt their parameters settings to external inflow conditions show a satisfactory performance in improving the structural reliability: The reliability index increases from 3.33 to 3.60 for the blade and to 4.53 for the tower. This indicates that large uncertainty in the extreme turbulence model can be significantly lowered through the use of advanced load control features. However, the complexity of the control features increases which warrants additional failure modes analysis of the controller and its architecture. In addition, the improvement in the structural reliability comes at a cost of 1.8% loss in annual energy production. Future work could include similar reliability analyses when the extreme turbulence is modelled directly and not based on the normal turbulence model and deriving the distribution of the annual maximum load effects based on adaptive sampling techniques instead of extrapolation.
Acknowledgments The work presented herein is a part of the Danish Energy Technology Development and Demonstration (EUDP) project titled, “Demonstration of a basis for tall wind turbine design”, Project no 64011 -0352. The Danish Ministry of Science, Innovation and Higher Education are also gratefully acknowledged for their financial support. The financial and technical support of MiTa Teknik are greatly appreciated.
7. References [1] IEC61400-1:2005 (ed. 3): Wind turbines – Part 1: Design Requirements. [2] Tarp-Johansen N.J., Madsen P.H., Frandsen S., “Partial Safety Factors for Extreme Load
Effects, Proposal for 3rd Edition of IEC6: Wind Turbine Generator Systems – Part 1: Safety Requirements”, Risø-R-1319, March 2002.
[3] Moriarty P. J., Holley W. E., and Butterfield S., “Effect of Turbulence Variation on Extreme Loads Predition for Wind Turbines”, Proceedings of the ASME Wind Energy Symposium, AIAA, Reno, NV, 2002, pp. 278–287.
[4] Jonkman J. M., Buhl M. L., “FAST User's Guide”, NREL/EL-500-29798. Golden, Colorado: National Renewable Energy Laboratory, 2005.
[5] Tarp-Johansen N.J., et al.,”Optimized and Balanced Structural and System Reliability of Offshore Wind Turbines”, Risø-R-1420(EN), Risø National Laboratory, Roskilde, April 2005.
4 6 8 10 12 14 16 18 20 22 24 260
0.1
0.2
0.3
0.4
0.5
0.6
0.7
0.8
0.9
1
Wind Speed [m/s]
Norm
aliz
ed P
ower
POWERCURVE CTRPOWERCURVE ADVANCED CTRPOWERCURVE NO CTR
The Science of Making Torque from Wind 2014 (TORQUE 2014) IOP PublishingJournal of Physics: Conference Series 524 (2014) 012069 doi:10.1088/1742-6596/524/1/012069
9
[6] Florian M., Danciu G., “Assessment of Uncertainties in Wind Turbine Design Loads”,Master Thesis, MSc. Structural and Civil Engineering, Aalborg University, Spring 2013.
[7] de las Heras E.G., Gutiérrez R., Azagra1 E. Dalsgaard J., ”Assessment of wind turbine for site specific conditions using probabilistic methods”, EWEA 2013 Event – 4-7th February 2013 – Vienna (Austria).
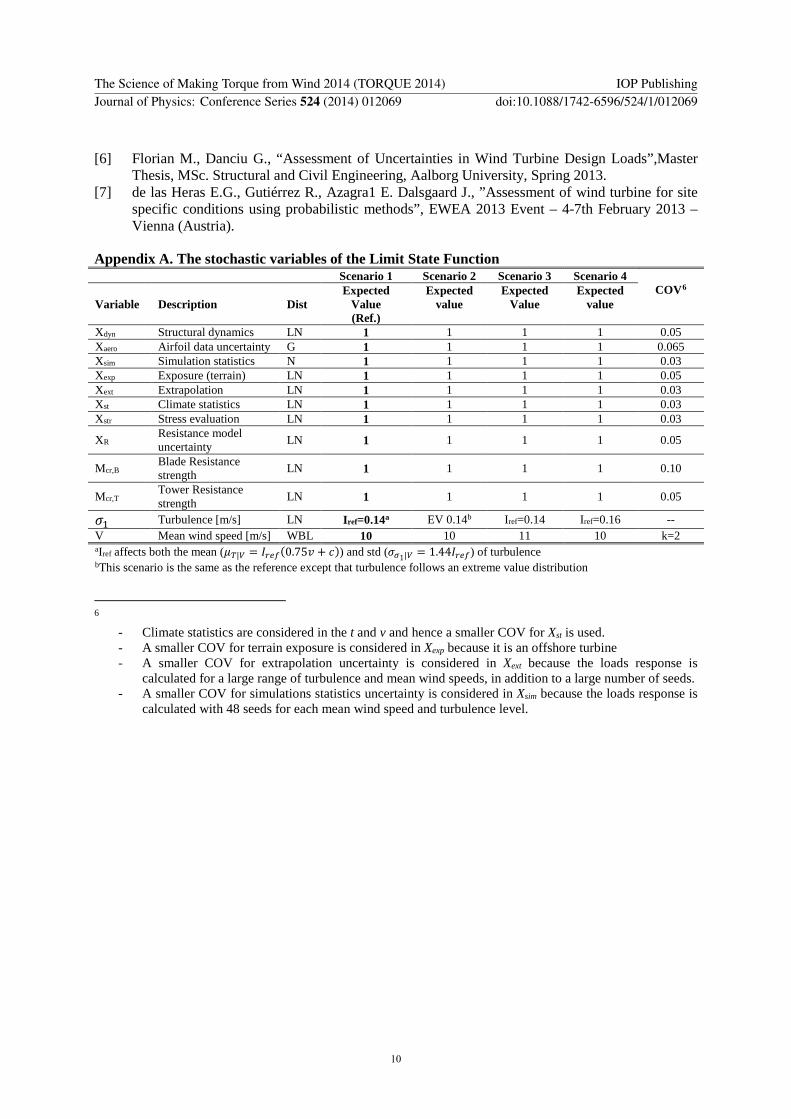
Appendix A. The stochastic variables of the Limit State Function Scenario 1 Scenario 2 Scenario 3 Scenario 4
COV6 Variable Description Dist
Expected Value (Ref.)
Expected value
Expected Value
Expected value
Xdyn Structural dynamics LN 1 1 1 1 0.05 Xaero Airfoil data uncertainty G 1 1 1 1 0.065 Xsim Simulation statistics N 1 1 1 1 0.03 Xexp Exposure (terrain) LN 1 1 1 1 0.05 Xext Extrapolation LN 1 1 1 1 0.03 Xst Climate statistics LN 1 1 1 1 0.03 Xstr Stress evaluation LN 1 1 1 1 0.03
XR Resistance model uncertainty LN 1 1 1 1 0.05
Mcr,B Blade Resistance strength LN 1 1 1 1 0.10
Mcr,T Tower Resistance strength LN 1 1 1 1 0.05
𝜎𝜎1 Turbulence [m/s] LN Iref=0.14a EV 0.14b Iref=0.14 Iref=0.16 -- V Mean wind speed [m/s] WBL 10 10 11 10 k=2 aIref affects both the mean (𝜇𝜇𝑈𝑈|𝑉𝑉 = 𝐼𝐼𝑟𝑟𝑟𝑟𝑟𝑟(0.75𝑣𝑣 + 𝑐𝑐)) and std (𝜎𝜎𝜎𝜎1|𝑉𝑉 = 1.44𝐼𝐼𝑟𝑟𝑟𝑟𝑟𝑟) of turbulence bThis scenario is the same as the reference except that turbulence follows an extreme value distribution
6 - Climate statistics are considered in the t and v and hence a smaller COV for Xst is used. - A smaller COV for terrain exposure is considered in Xexp because it is an offshore turbine - A smaller COV for extrapolation uncertainty is considered in Xext because the loads response is
calculated for a large range of turbulence and mean wind speeds, in addition to a large number of seeds. - A smaller COV for simulations statistics uncertainty is considered in Xsim because the loads response is
calculated with 48 seeds for each mean wind speed and turbulence level.
The Science of Making Torque from Wind 2014 (TORQUE 2014) IOP PublishingJournal of Physics: Conference Series 524 (2014) 012069 doi:10.1088/1742-6596/524/1/012069
10