Embed Size (px)
Citation preview

INFLUENCE OF SUPPLY CHAIN COLLABORATION ON
PERFORMANCE OF DAIRY PROCESSING FIRMS IN
KENYA
ZIPPORAH JEROP BERUT
DOCTOR OF PHILOSOPHY
(Suppy Chain Management)
JOMO KENYATTA UNIVERSITY OF
AGRICULTURE AND TECHNOLOGY
2020

Influence of Supply Chain Collaboration on Performance of Dairy
Processing Firms in Kenya
Zipporah Jerop Berut
A Thesis Submitted in Partial Fulfillment for the Degree of Doctor of
Philosophy in Supply Chain Management in the Jomo Kenyatta
University of Agriculture and Technology
2020

ii
DECLARATION
This thesis is my original work and has not been presented for a degree in any other
university.
Signature…………………………………….....................Date…………………………..
Zipporah Jerop Berut
This thesis has been submitted for examination with our approval as University
Supervisors.
Signature ……………………………………………….Date ……………………………
Prof. Gregory S. Namusonge, PhD
JKUAT,Kenya
Signature…………………………………………………...Date………………………..
Dr. Elizabeth MakokhaNambuswa, PhD
JKUAT,Kenya

iii
DEDICATION
Special dedication to my loving husband Mr. Amos Rotich, our beloved children; Mercy,
Kennedy, Timothy and Jeremy for their love and total support. I also dedicate to my
parents Mr. and Mrs. Samuel Bett and father in-law Mr. Paul Sitienel for their prayers,
encouragement and continued support throughout my studies. Wholeheartedly, I dedicate
to my late mother inlaw who passed on 1st April, 2019 while I was in my final stage of the
this study. Rest in peace my mother in love.You are the best family I could wish for.

iv
ACKNOWLEDGEMENT
Special thanks to my heavenly father for the provision of finances, the good health and
strength he has given me to pursue this doctorate degree. Reaching this far is not taken for
granted. I thank you lord.Iwould like also to extend my sincere appreciation to my
Supervisors Prof. Gregory Namusonge, and Dr. Elizabeth Nambuswa with whose
guidance,support and encouragement this research thesis has beencompleted.I am also
gratefulto the factory manager of KCC Kitale; Mr Julius Serem, Supervisor factory; Mr
John Keter and extension officer in charge of research ; Mr Obadiah Rutto, forproviding me
with requisite information while carrying out this study. I wishto extend mygratitudeto
all my friends and classmates fortheir valuable opinions, encouragement and support.My
colleague Dr. Prisca Choge, your voice in my academic journeyand other social
spheres is greatly acknowledged.Special thanks to the family of Mr Timothy kimalel
and entire family members for their moral and financial support. God bless you all.

v
TABLE OF CONTENTS
DECLARATION .............................................................................................................. ii
DEDICATION ................................................................................................................ iii
ACKNOWLEDGEMENT .............................................................................................. iv
TABLE OF CONTENTS................................................................................................. v
LIST OF TABLES ....................................................................................................... xvii
LIST OF FIGURES ................................................................................................... xxiii
LIST OF APPENDICES ............................................................................................ xxiv
LIST OF ACRONYMS AND ABBREVIATIONS ................................................... xxv
DEFINITION OF TERMS ........................................................................................ xxvii
ABSTRACT ................................................................................................................. xxxi
CHAPTER ONE .............................................................................................................. 1
INTRODUCTION ............................................................................................................ 1
1.1 Backgroundof the Study............................................................................................... 1
1.2 Statement of the Problem ........................................................................................... 11
1.3 Research Objectives ................................................................................................... 13

vi
1.3.1 General Objective.................................................................................................... 13
1.3.2 Specific Objectives.................................................................................................. 13
1.4 Research Questions .................................................................................................... 14
1.5 Hypotheses of the Study ............................................................................................ 14
1.6 Significance of the Study ........................................................................................... 15
1.6.1 Government and Policy Makers .............................................................................. 15
1.6.2 Dairy Processing Firms ........................................................................................... 15
1.6.3 The Community ...................................................................................................... 16
1.6.4 Grant Agencies ........................................................................................................ 17
1.6.5 Academic Field ....................................................................................................... 17
1.7 Scope of the Study ..................................................................................................... 17
1.8 Limitations of the Study ............................................................................................. 18
CHAPTER TWO ........................................................................................................... 20
LITERATURE REVIEW.............................................................................................. 20
2.1 Introduction ................................................................................................................ 20
2.2 Theoretical Framework .............................................................................................. 20
2.2.1 Supply ChainNetworkTheory ................................................................................. 20

vii
2.2.2 Transaction Cost Economics Theory ...................................................................... 22
2.2.3 Collaborative Network Theory ............................................................................... 24
2.2.4Relational Exchange Theory .................................................................................... 25
2.3 Conceptual Framework .............................................................................................. 26
2.4 Review of Variables ................................................................................................... 28
2.4.1 Supply Chain Information Sharing and Performance of Dairy Processing Firms .. 34
2.4.2 Supply Chain Decision Synchronization and Performance of Dairy Processing Firms
.............................................................................................................................. 38
2.4.3Supply Chain Incentive Alignment and Performance of Dairy Processing Firms. 40
2.4.4 Supply Chain Teamwork and Performance of Dairy Processing Firms ................. 42
2.4.5 Dairy Board Policies and Regulations ................................................................... 44
2.4.6 Performance of Dairy Processing Firms in Kenya ................................................. 47
2.5 Critique of Existing Literature ................................................................................... 52
2.6 Research Gaps ............................................................................................................ 52
2.7 Summary .................................................................................................................... 54
CHAPTER THREE ....................................................................................................... 56
RESEARCH METHODOLOGY ................................................................................. 56

viii
3.1 Introduction ................................................................................................................ 56
3.2 Research Design ......................................................................................................... 56
3.3Target Population ........................................................................................................ 57
3.4 Sampling Frame ......................................................................................................... 58
3.5Sample size and Sampling Technique ........................................................................ 59
3.6 Data CollectionsMethods ........................................................................................... 60
3.7 Data Collection Procedure ......................................................................................... 61
3.7.1 Field Observation .................................................................................................... 61
3.7.2 Interview Method .................................................................................................... 62
3.8 PilotStudy ................................................................................................................... 62
3.8.1 Validity of the Research Instrument ....................................................................... 63
3.8.2 Reliabilityof the Research Instrument ..................................................................... 64
3.9 Data Analysisand Presentation................................................................................... 65
3.9.1 Quantitative Data Analysis ..................................................................................... 66
3.9.2 Variable Definition and Measurement .................................................................... 68
3.10 Diagnostic Tests ....................................................................................................... 69
3.10.1 Testing for Linearity ............................................................................................ 70

ix
3.10.2 Testing for Heteroscedasticity .............................................................................. 70
3.10.3 Testing for Autocorrelation ................................................................................... 71
3.10.4 Testing for Multicolinearity .................................................................................. 71
3.10.5 Testing for Normality ............................................................................................ 72
CHAPTER FOUR .......................................................................................................... 73
RESEARCH FINDINGS AND DISCUSSION ............................................................ 73
4.1 Introduction ................................................................................................................ 73
4.2 Response Rate ............................................................................................................ 73
4.2.1 Suppliers Response Rate ......................................................................................... 74
4.2.2 Customers Response Rate ....................................................................................... 75
4.3 Pilot Results ............................................................................................................... 76
4.3.1 Suppliers Pilot Results ............................................................................................ 76
4.3.2 Customers Pilot Results .......................................................................................... 77
4.4 Reliability Statistics ................................................................................................... 78
4.4.1 Reliability Statistics of Suppliers ............................................................................ 78
4.4.2 Reliability Statistics of Customer............................................................................ 79
4.5 Firm Demographic ..................................................................................................... 80

x
4.5.1 Suppliers Gender Factor .......................................................................................... 80
4.5.2 Customers Gender Factor ........................................................................................ 81
4.5.3 Supplier Category.................................................................................................... 81
4.5.4 Brand Category ....................................................................................................... 82
4.5.5 Years Supplied Milk ............................................................................................... 83
4.5.6 Frequency of buying ............................................................................................... 83
4.6 Total Variance Explained on Supply Chain Information Sharing ............................. 84
4.6.1 Supplier Total Variance Explained on Supply Chain Information Sharing ............ 84
4.6.2 Customer Total Variance Explained on Supply ChainInformation Sharing ........... 85
4.7 Rotated Component Matrix on Supply chain information sharing ............................ 86
4.7.1 Supplier Rotated Component Matrixon Supply Chain Information Sharing .......... 86
4.7.2 Customer Rotated Component Matrix on Supply ChainInformation Sharing ........ 87
4.8 KMO and Bartlett's Test on Supply Chain Information Sharing ............................... 89
4.8.1 Supplier KMO and Bartlett's Test on Supply ChainInformation Sharing .............. 89
4.8.2 Customer KMO and Bartlett's Test on Supply Chain Information Sharing ........... 89
4.9 Total Variance Explained on Supply Chain Decision Synchronization .................... 90
4.9.1Supplier Total Variance Explained on Supply Chain Decision Synchronization .... 90

xi
4.9.2 Customer Total Variance Explained on Supply Chain Decision Synchronization . 91
4.10 Rotated Component Matrix on Supply Chain Decision Synchronization ............... 92
4.10.1 Supplier Rotated Component Matrix on Supply Chain Decision Synchronization
.............................................................................................................................. 92
4.10.2 Customer Rotated Component Matrix on Supply Chain Decision Synchronization
.............................................................................................................................. 93
4.11 KMO and Bartlett's Test on Chain Supply Decision Synchronization .................... 95
4.11.1 Supplier KMO and Bartlett's Test on Supply Chain Decision Synchronization ... 95
4.11.2Customer KMO and Bartlett's Test on Supply Chain Decision Synchronization .. 95
4.12 Total Variance Explained on Supply Chain Incentive Alignment ........................... 96
4.12.1 Suppliers Total Variance Explained on Supply Chain Incentive Alignment ........ 96
4.12.2 Customer Total Variance Explained on Supply Chain Incentive Alignment ....... 97
4.13 Supplier Rotated Component Matrix on Supply Chain Incentive Alignment ......... 98
4.14 KMO and Bartlett's Test on Supply Chain Incentive Alignment ............................ 99
4.14.1 Supplier KMO and Bartlett's Test on Chain Incentive Alignment ....................... 99
4.14.2 Customer KMO and Bartlett's Test on Supply Chain Incentive Alignment ....... 100
4.15 Total Variance Explained on Supply Chain Teamwork ........................................ 101
4.15.1 Supplier Total Variance Explained on Supply Chain Teamwork ....................... 101

xii
4.15.2 Customer Total Variance Explained on Supply Chain Teamwork ..................... 102
4.16 Rotated Component Matrix on Supply Chain Teamwork ..................................... 103
4.16.1 Supplier Rotated Component Matrix on Supply Chain Teamwork .................... 103
4.16.2 Customer Rotated Component Matrix on Supply Chain Teamwork .................. 104
4.17 KMO and Bartlett's Test on Supply Chain Teamwork .......................................... 105
4.17.1 Supplier KMO and Bartlett's Test on Supply Chain Teamwork ......................... 105
4.17.2 Customer KMO and Bartlett's Test on Supply Chain Teamwork ....................... 106
4.18 Total Variance Explained on Dairy Board ............................................................. 107
4.18.1 Supplier Total Variance Explained on Dairy Board Policies and Regulations ... 107
4.18.2 Customer Total Variance Explained on Dairy Board Policies and Regulations . 107
4.19 Rotated Component Matrix on Dairy Board Policies and Regulations ................. 108
4.19.1Supplier Rotated Component Matrix on Dairy Board Policies and Regulations . 108
4.20 KMO and Bartlett's Test ........................................................................................ 110
4.20.1 Supplier KMO and Bartlett's Test ....................................................................... 110
4.20.2 Customer KMO and Bartlett's Test on Dairy Board Policies and Regulations .. 111
4.21 Total Variance Explained on Performance of Dairy Processing Firms ................. 112
4.21.1 Supplier Total Variance Explained on Performance of Dairy Processing Firms 112

xiii
4.21.2 Customer Total Variance Explained on Performance of Dairy Processing Firms
............................................................................................................................ 113
4.22 Rotated Component Matrix on Performance of Dairy Processing Firms .............. 114
4.22.1 Supplier Rotated Component Matrix on Performance of Dairy Processing Firms
............................................................................................................................ 114
4.22.2 Customer Rotated Component Matrix on Performance of Dairy Processing Firms
............................................................................................................................ 116
4.23 KMO and Bartlett’s Test on Performance of Dairy Processing Firms .................. 117
4.23.1 Supplier KMO and Bartlett’s Test on Performance of Dairy Processing Firms . 117
4.23.2 Customer KMO and Bartlett's Test on Performance of Dairy Processing Firms118
4.24 Descriptive Statistics on Supply ChainInformation Sharing ................................. 119
4.24.1 Supplier descriptive Statistics on Supply Chain Information Sharing ................ 119
4.24.2 Customer Descriptive Statistics on Supply ChainInformation Sharing .............. 121
4.25 Descriptive Statistics on Supply Chain Decision Synchronization ....................... 124
4.25.1 Supplier Descriptive Statistics on Supply Chain Decision Synchronization ...... 124
4.25.2 Customer Descriptive Statistics on Supply Chain Decision Synchronization .... 126
4.26 Descriptive Statistics on Supply Chain Incentive Alignment ................................ 128
4.26.1 Supplier Descriptive Statistics on Supply Chain Incentive Alignment .............. 128

xiv
4.26.2 Customer Descriptive Statistics on Supply Chain Incentive Alignment ............ 131
4.27 Descriptive Statistics on Teamwork ...................................................................... 133
4.27.1 Supplier Descriptive Statistics on Supply Chain Teamwork .............................. 133
4.27.2 Customer Descriptive Statistics on Supply Chain Teamwork ............................ 135
4.28 Descriptive Statistics on Dairy Board Policies and Regulations ........................... 137
4.28.1 Supplier Descriptive Statistics on Dairy Board Policies and Regulations .......... 137
4.28.2 Customer Descriptive Statistics on Dairy Board Policies and Regulations ........ 140
4.29 Descriptive Statistics on Performance of Dairy Processing Firms ........................ 142
4.29.1 Suppliers Descriptive Statistics on Performance of Dairy Processing Firms ..... 142
4.29.2 Customer Descriptive Statistics on Performance of Dairy Processing Firms ..... 146
4.30 Quantitative Results ............................................................................................... 148
4.30.1 Supplier Correlations Results .............................................................................. 148
4.30.2 Customer Correlations Results of SCC on Performance of Dairy Processing Firms
............................................................................................................................ 150
4.30.3 Autocorrelation or Serial Test ............................................................................. 150
4.30.4 Supplier and Customer Normality Test of Variables ........................................ 151
4.30.5Supplier and Customer Normality Test of study Variables ................................. 152

xv
4.30.6 Test of Multicollinearityof Predictors ................................................................. 154
4.31 Regression Model Summary for SCC and Performance of Dairy Processing Firms
............................................................................................................................ 155
4.31.1 Supplier Regression Model Summary for SCC and Performance of Dairy
Processing Firms ................................................................................................ 155
4.31.2 Customer Model Summary for SCC and Performance of Dairy Processing Firms
............................................................................................................................ 157
4.32 Model Significance ................................................................................................ 159
4.32.1 Supplier Model Significance ............................................................................... 159
4.32.2 Customer Model Significance ............................................................................. 160
4.33 Coefficients of SCC on Performance of Dairy Processing Firms without Mediation
............................................................................................................................ 160
4.33.1 Supplier Regression Coefficients of SCC on Performance of Dairy Processing
Firms without Mediation .................................................................................... 161
4.33.2 Suppliers Regression Coefficients of SCC on Performance of Dairy Processing
Firms with Mediation ......................................................................................... 162
4.34 Regression Coefficients of SCC on Performance of Dairy Processing Firms without
Mediation ........................................................................................................... 164
4.34.1 Customer Regression Coefficients of SCC on Performance of Dairy Processing
Firms without Mediation ................................................................................... 164

xvi
4.34.2 Customer Regression Coefficients of SCC on Performance of Dairy Processing
Firms with Mediation ......................................................................................... 166
4.35 Tests of Hypotheses ............................................................................................... 168
4.35.1 Supplier Hypotheses Testing............................................................................... 169
4.35.2 Customer Hypotheses Testing ............................................................................ 174
CHAPTER FIVE.......................................................................................................... 179
SUMMARY, CONCLUSIONS AND RECOMMENDATIONS ............................. 179
5.1 Introduction .............................................................................................................. 179
5.2 Summary .................................................................................................................. 179
5.2.1Influence of Supply chain information sharing on Performance of Dairy Processing
Firms .................................................................................................................. 180
5.3 Conclusions of the Study ......................................................................................... 184
5.4 Recommendations of the Study ............................................................................... 186
5.4.1 Management Recommendations ........................................................................... 186
5.4.2 Policy Recommendations ...................................................................................... 188
5.5 Areas for Future Research ........................................................................................ 188
REFERENCES ............................................................................................................. 190
APPENDICES .............................................................................................................. 214

xvii
LIST OF TABLES
Table 3.1: Target Population ........................................................................................... 58
Table 3.2: Suppliers Distribution of Sample across Target Population .......................... 59
Table 3.3: Customers Distribution of Sample across target population .......................... 59
Table 3.4: Variable Definition and Measurement ........................................................... 69
Table 4.1: Response Rate ................................................................................................ 74
Table4.2: Suppliers Response Rate ................................................................................. 75
Table 4.3: Customers Response Rate .............................................................................. 76
Table4.4: Suppliers Pilot Results .................................................................................... 77
Table 4.5: Customer Pilot Results ................................................................................... 78
Table 4.6: Reliability Statistics of Supplier .................................................................... 79
Table4.7: Customer Reliability Statistics ........................................................................ 80
Table4.8: Suppliers Gender ............................................................................................. 81
Table4.9: Customers Respondents by Gender ................................................................ 81
Table4.110: Supplier Category ....................................................................................... 82
Table 4.11: Brand Category ............................................................................................ 83
Table 4.12: Years Supplied Milk .................................................................................... 83

xviii
Table 4.13: Customers on Buying Products .................................................................... 84
Table 4.14: Supplier Total Variance Explained on Supply Chain Information Sharing 85
Table 4.15: Customer Total Variance Explained on Supply Chain Information sharing86
Table 4.16: Supplier Rotated Component Matrix on Supply Chain information Sharing
.............................................................................................................................. 87
Table 4.17: Customer Rotated Component Matrix on Supply ChainInformation Sharing
.............................................................................................................................. 88
Table 4.18: Supplier KMO and Bartlett's Test on Supply ChainInformation Sharing ... 89
Table 4.19: Customer KMO and Bartlett's Test on Supply Chain Information Sharing 90
Table 4.20: Supplier Total Variance Explained on Supply Chain Decision
Synchronization.................................................................................................... 91
Table 4.21: Customer Total Variance Explained on Supply Chain Decision
Synchronization.................................................................................................... 92
Table 4.22: Supplier Rotated Component Matrix on Supply Chain Decision
Synchronization.................................................................................................... 93
Table 4.23: Customer Rotated Component Matrix on Supply Chain Decision
Synchronization.................................................................................................... 94
Table 4.24: Supplier KMO and Bartlett's Test on Supply Chain Decision Synchronization
.............................................................................................................................. 95
Table 4.25: Customer KMO and Bartlett's Test on Supply Chain Decision
xix
Synchronization.................................................................................................... 96
Table 4.26: Suppliers Total Variance Explained on Supply Chain Incentive Alignment
.............................................................................................................................. 97
Table 4.27: Customer Total Variance Explained on Supply Chain Incentive Alignment
.............................................................................................................................. 98
Table 4.28: Supplier Rotated Component Matrix on Supply Chain Incentive Alignment
.............................................................................................................................. 99
Table 4.29: Supplier KMO and Bartlett's Test on Supply Chain Incentive Alignment 100
Table 4.30: Customer KMO and Bartlett's Test on Supply Chain Incentive Alignment
............................................................................................................................ 101
Table 4.31:Supplier Total Variance Explained on Supply Chain Teamwork ............... 102
Table 4.32: Customer Total Variance Explained on Supply Chain Teamwork ............ 103
Table 4.33: Supplier Rotated Component Matrix on Supply Chain Teamwork ........... 104
Table 4.34: Customer Rotated Component Matrix on Supply Chain Teamwork ......... 105
Table 4.35:Supplier KMO and Bartlett's Test on Supply Chain Teamwork ................. 106
Table 4.36: Customer KMO and Bartlett's Test on Supply Chain Teamwork .............. 106
Table 4.37: Supplier Total Variance Explained on Dairy Board Policies and Regulations
............................................................................................................................ 107
Table 4.38: Customer Total Variance Explained on Dairy Board Policies and Regulations

xx
............................................................................................................................ 108
Table 4.39: Supplier Rotated Component Matrix on Dairy board Policies and Regulations
............................................................................................................................ 110
Table 4.40: Supplier KMO and Bartlett's Test on Dairy Board Policies and Regulations
............................................................................................................................ 111
Table 4.41: Customer KMO and Bartlett's Test on Dairy Board .................................. 111
Table 4.42: Supplier Total Variance Explained on Performance of Dairy Processing Firms
............................................................................................................................ 113
Table 4.43 : Customer Total Variance Explained on Performance of Dairy Processing
Firms .................................................................................................................. 114
Table 4.44: Supplier Rotated Component Matrix on Performance of Dairy Processing
Firms .................................................................................................................. 116
Table 4.45: Customer Rotated Component Matrix on Performance of Dairy Processing
Firms .................................................................................................................. 117
Table 4.46: Supplier KMO and Bartlett's Test on Performance of Dairy Processing Firms
............................................................................................................................ 118
Table 4.47: Customer KMO and Bartlett's Test on Performance of Dairy Processing Firms
............................................................................................................................ 119
Table 4.48: Supplier Descriptive Statistics on Supply ChainInformation Sharing ....... 121
Table 4.49: Customer Descriptive Statistics on Supply Chain Information Sharing .... 123

xxi
Table 4.50: Supplier Descriptive Statistics on Supply Chain Decision Synchronization
............................................................................................................................ 125
Table 4.51: Customer Descriptive Statistics on Supply Chain Decision Synchronization
............................................................................................................................ 128
Table 4.52: Supplier Descriptive statistics on Supply Chain Incentive Alignment ...... 131
Table 4.53: Customer Descriptive Statistics on Supply Chain Incentive Alignment ... 133
Table 4.54 : Supplier Descriptive Statistics on Supply Chain Teamwork .................... 135
Table 4.55: Customer Descriptive Statistics on Supply Chain Teamwork ................... 137
Table 4.56: Supplier Descriptive Statistics on Dairy Board Policies and Regulations . 139
Table 4.57: Customer Descriptive Statistics on Dairy Board Poloicies and Regulations
............................................................................................................................ 141
Table 4.58: Suppliers Descriptive Statistics on Performance of Dairy Processing Firms
............................................................................................................................ 145
Table 4.59: Customer Descriptive Statistics on Performance of Dairy Processing Firms
............................................................................................................................ 147
Table 4.60: Supplier Correlations Results .................................................................... 148
Table 4.61: Customer Correlations Results of SCC on Performance of Dairy Processing
Firms .................................................................................................................. 150
Table 4.62: Supplier Regression Models Summary for SCC and Performance ........... 157

xxii
Table 4.63: Customer Regression Model Summary for SCC and Performance ........... 158
Table 4.64: Supplier Model Significance ANOVA ...................................................... 159
Table 4.65: Customer Model Significance ANOVA .................................................... 160
Table 4.66: Supplier Regression Coefficients of SCC on Performance of Dairy Processing
Firms without Mediation .................................................................................... 162
Table 4.67: Supplier Coefficients of SCC on Performance of Dairy Processing Firms
............................................................................................................................ 164
Table 4.68: Customer Regression Coefficients of SCC on Performance of Dairy
Processing Firms without Mediation ................................................................. 166
Table 4.69: Customer Regression Coefficients of SCC on Performance of Dairy
Processing Firms with Mediation....................................................................... 168
Table 4.70: Supplier Summary of Hypotheses Testing................................................. 173
Table 4.71: Customer Summary of Hypotheses Testing............................................... 178

xxiii
LIST OF FIGURES
Figure 2.1: Conceptual Framework ................................................................................ 27
Figure 4.1: Supplier Normal P-P plot of Variables ....................................................... 152
Figure 4.2: Customer Normal P-P plot of Variables ..................................................... 152
Figure 4.3: Supplier Histogram of Normality Test of study Variables ......................... 153
Figure 4.4: Customer Histogram of Normality Test of study Variables ....................... 153
xxiv
LIST OF APPENDICES
Appendix I: Questionnaire for Milk Suppliers to Dairy Processing Firms .................. 214
Appendix II: Questionnaire for Customers of Processed Products of Dairy processing
firms ............................................................................................................ 220
Appendix III: Interview for Supply Chain Practitioners of Dairy Processing Firms ... 227
Appendix IV: List of Licensed DairyMilk Processors in Kenya .................................. 231
Appendix V: Dairy Supply Chain Collaborative Partners ............................................ 232
Appendix VI: Top Ten Dairy Suppliers’ for Second Quarter 2015 ............................. 233
Appendix VII: Proceed to Field Introduction Letter .................................................... 234
Appendix VIII: Approval of Research Proposal and Supervisors ............................... 235
Appendix IX: Approval of Intent to Submit PhD Thesis ............................................. 236

xxv
LIST OF ACRONYMS AND ABBREVIATIONS
AI Artificial Insemination
CBE Collection and Bulking Enterprises
CNT Collaborative Network Theory
Com Component
CSC Computer Science Corporation
CSCMP Council of Supply Chain Management Professionals
Cum Cumulative
DB Dairy Board
Deci Decision
DS Decision synchronization
FAO Food Agricultural Organization of the United Nations
FL Factor Loadings
GDP Gross Domestic Product
IA Incentive Alignment
Ince Incentive
Infor Supply chain information sharing
KCC Kenya Cooperative Creameries Limited
KDB Kenya Dairy Board
KMDP Kenya Market-led Dairy Program
KMO Kaiser-Meyer-Olkin
LB lower Bound
Max Maximum
Min Minimum
Per Performance
RBV Resource Based View
Stat Statistic

xxvi
SC Supply Chain
SCC Supply Chain Collaboration
SCM Supply Chain Management
SCMR Supply Chain Management Review
SDP Smallholder Dairy Project
SE Std. Error
SET Social Exchange Theory
SNV Kenya Netherlands Development Organization
Std Dev Std. Deviation
Team Teamwork
TCE Transaction Cost Economics
Tole Tolerance
UB Upper Bound
UHT Ultra High Temperature
Var Variance
Vet Veterinary
V.P Vice President

xxvii
DEFINITION OF TERMS
Baraza: Refers to public assemblies or meetings that are usually held outdoors
by state officials a range in size from huge rallies of several 100 women
and men to smaller gatherings of 100 or 50 individuals seated on the
grass in a countryside (Angelique, 1995).
Customers: Are persons who buy or consumes products of KCC (Government of
Kenya, 2016
Dairy: Comprissed the individual or firms that involved in milk production,
transportation, processing (packaging & storage) and delivery of milk
products to final consumer through addition of maximum value at
lowest possible cost (Muhammad, Akhter& Ullah, 2014).
Decision synchronisation: Joint decision making in planning and operational contexts
(Simatupang & Sridharan, 2005)
Incentive alignment:Supply chain incentive alignment is co-developing systems to
evaluate and publicize each other’s performance, share costs for
example loss on order changes, share benefits in form of saving on
reduced inventory costs. (Simatupang & Sridharan, 2005)
Influence: The act or power of producing an effect without apparent exertion of
force or direct exercise of command (Oteki, 2018).
Supply chain: Network of all the individuals, organizations, resources, activities and
technology involved in the creation and sale of a product, from the
delivery of source materials from the supplier to the manufacturer,
through to its eventual delivery to the end user (Oteki, 2018).

xxviii
Supply chain information sharing:Information sharing refers to the extent to which
information is exchanged among members across the supply chain
(Lee & Whang, 2004).
Kibbutz: A kibbutz is a cooperative Israeli farming community. The original
philosophy of kibbutzim was somewhat utopian, a belief in the creation
of a perfect, equal society, and based in socialist ideals of shared
ownership and a communal lifestyle. The word comes from the Modern
Hebrew qibbus, "a gathering."For the study are collective specialized
farmers using high tech technology and cut most form of cooperative
rural settlement in Israel. https://public.oed.com/blog/philippine-
english-in-the-september-2018-update/
Milk: Thenormal, clean and fresh secretions, without any addition or
subtraction, extracted from the udder of a healthy dairy cow and free
from colostrum (Government of Kenya, 2016)
Milk Collection Center: Any place, premises or establishment where raw milk is
received, collected, handled, stored or cooled and prepared for further
transportation (Government of Kenya, 2016)
Milk product: Any product in which milk is an ingredients and includes any dairy foods
made by modifying milk products, milk and milk products which have
been aseptically processed and packaged or those which has been
packaged and the processed by sterilization in a resort but not include
dietary products or infant formula (Government of Kenya, 2016)
Milk Processing Plant: Any place, premises or establishment where milk or milk
products are collected, handled, stored processed, packaged or
prepared for distribution (Government of Kenya, 2016)

xxix
Milk transporter: A person who transports milk and milk products from a firm, a milk
collection point, a milk collection center, a chilled raw milk storage
tank to or from a milk processing plant, receiving station or transfer
station or retail milk shop (Government of Kenya, 2016)
Performance: According to Chen and Paulraj (2004), a firm’s performance can be
measured in terms of financial performance and operational
performance. Performance can be also measured by cost, quality,
delivery and flexibility (Krause et al., 2007).
In the study, milk processing firm performance was measured
bymarket share, client satisfaction financial and competitive advantage
Suppliers: A supplier is a dairy farmer who supplies fresh milk to dairy processing
firms (Government of Kenya, 2016)
Supply Chain Collaboration:Supplychaincollaboration is defined as a long-term
relationship whereparticipants generallycooperate,shareinformation,
and work together to plan and even modifytheirbusiness practices to
improvejoint performance (Whipple et al., 2010). Supply chain
collaboration is where two or more autonomous firms work jointly to
plan and execute supply chain operations and the underlying objective
being delivery of substantial benefits and advantages to the involved
supply chain partners.
Supply Chain management:“SCM encompasses the planning and management of all
activities involved in sourcing and procurement, conversion, and all
logistics management activities. Importantly, it also includes
coordination and collaboration with channel partners, which can be
suppliers, intermediaries, third party service providers, and customers.

xxx
In essence, supply chain management integrates supply and demand
management within and across companies." (CSCMP, 2010)
Teamwork: Are collection of individuals, who highly communicate, directing their
energies towards a known defined goal, which is achieved through their
joint complementary efforts, for the benefit of all (Simatupang &
Sridharan 2005).

xxxi
ABSTRACT
The purpose of the study was to analyze the influence of supply chain collaboration on
performance of dairy processing firms in kenya.Specific objectives were:To determine the
influence of Supply chain information sharing on performance of dairy processing firms in
kenya, examine the influence of supply chain decision synchronization on performance of
dairy processing firms in kenya, investigate the influence of supply chain incentive
alignment on performance of dairy processing firms in kenya,assess the influence ofsupply
chain teamwork on performance of dairy processing firms in kenya and evaluate
theinfluencemediating of policies and regulations on the relationship between supply chain
collaboration and performance of dairy processing firms in kenya.Milk processing firm
performance was measured by market share, client satisfaction, profitability and
competitive advantage.The study was guided by the following theories: Supply Chain
Network Theory, Transaction Cost Economics Theory, Collaborative Network Theory and
Strategy-Structure Theory. The target population comprised dairy farmers who supply fresh
milk to Kenya Cooperative Creameries Limited and customers of processed milk products
buying at Nakumatt retail supermarket. The study adopted a mixed research design which
covered qualitativeand quantitative research.Qualitative research design applied to
qualitative data in analysis of interviewed and quantitative research design was applied on
quantitative data on the questionnaires.The study targeted 10,488 fresh milk suppliers and
13,906 customers of processed milk products.The sample size was 384 suppliers and 384
customers. Stratified sampling was used to select the suppliers of fresh milk and customers
of the processed milk. The survey was carried out in top ten milk supplies of dairy
processing firms . The study adopted Mugenda’s formula to calculate the sample size.
Structured questionnaire was used to collectprimary data while secondary data was obtain
from published sources such books, journals and research done by other scholars. Data was
analyzed with SPSS version 20. The research instrument was tested for reliability using
Cronbach alpha. Data was analyzed using descriptive and inferential statistics. The
correlation analysis was used to determine the strength and directions of association
between two variables while Multiple Regression was used to determine whether a group
of independent variables together predict a given dependent variable. Regression model
summary with respect to supplier R=.634 (without mediator), R=.642 (with mediator). With
respect to customer R=.627 (without mediator), R= .639 (with mediator). The coefficient
of determination or measure of amount of variability (R2) with respect to supplier
R2=.402(without mediator) and R2=.413 (with mediator); with respect to customer R2=.393
(without mediator) and R2=.399 (with mediator). All study variables had a positive and
significant correlation with performance of dairy processing firms . The study recommends
that dairy processing firms should exploit supply chain information sharing, incentive
alignment, teamworkand mediation dairy boardpolicies and regulations as it proved to be
crucial in the performanceof the dairy processing firms.The study also recommends
realignment of dairy processingfirms policies with other collaborative partners as is driving
force behind performance.

CHAPTER ONE
INTRODUCTION
1.1 Backgroundof the Study
Dairy industry worldwide has been changing due to more concerns over sustainability,
consumer demands and greater efficiency requirements. Dairy sector continuously strive
for efficiency due to the price and volume competition in various countries. Demand of
milk has been dramatically increasing in the world, therefore the dairy sector should
continuously look for innovative methodologies and solutions to address such trends and
improve performance through certain mechanisms. Collaborationbetween supply chain
partners is very critical in addressing the challenges inhibitingperformance of dairy
processing firms(Muhammad, Akhter& Ullah, 2014).Privatization and restructuring of
farms, processors, input suppliers and retailing companies has caused disruption in the
exchange relationships in the dairy supply chain i.e long payment delays or nonpayment
of delivered dairy products. Supply Chain Collaboration consists of members that have
specific objectives and each partner has unique characteristics. Moreover, supply chain
partners influence on the decision making or supply chain activities of others. Generally
stronger members can get more benefits from the supply chain in respect of profit gains
from lower cost and enhanced innovative capacity leading to clients satisfaction. Further
to this to this membership there is increased value leading to competitive advantage. The
Kenyan dairy industry is dominated by three major dairy processors: New KCC,
Brookside and SpinKnit.These three dairy processors have countrywide coverage interms
of milk collection, sales and distribution.These processors also have the capacity to
producea wide range of dairy products.However the NewKCC is the only process or with
milk powdering capabilities and is a public entity supported by the government of
kenya.The rest of the dairy industry is made up of medium or small-scale processors, with
limited product range and milk collection and distribution networks (KDB,2018).
Recently supply chain has been defined from operation management point of view.
2
According to that view, performance is based on resources categories such as (finance,
human, organization, innovation, technology, finance and production) and performance
produced in the categories of controls as (pricing, inventory operation, and information,
channel or distribution structure). In this way these kinds of performance categories have
produced power positions of dominated and dominant, interdependent and independent in
the structure of supply chain (Muhammad, Akhter& Ullah, 2014). The present study
performance was measured by market share, client satisfaction, profitability and
competitive advantage. In order for the industry to strive to remain competitive through
supply chain collaboration, an understanding of the complexity and dynamism of
performance of dairy processing firms has potential to provide the platform upon which
the success or failure of this important industry could be judged. Challenges faced by the
dairy firms in Kenya could be addressed if managers of firms were made aware of
influence of supply chain collaboration onperformance of dairy processing firms in kenya
and how they could impact on overall performance of these firms. This study has focused
on analysis of dairy processing firms in developing countries specifically in Kenya and
analysed the influence of supply chain information sharing, supply chain decision
sychronisation, supply chain incentive alignment and supply chain teamwork.
1.1.1 Global perspective of Supply chain Collaboration and Performance
A study done in Pakistan by Al.Doori (2019) on the Impact of Supply Chain Collaboration
on Performance in Automotive Industry notedthat “to compete globally, it is essential to
include all members and performance should be measured on supply chain level”. Firms
with better supply chain partners can be efficient and effective. Thus, for better
understanding, it is essential to understand all members of supply chain that has either
indirect or direct effects of performance.Another study in Italy by León-Bravo et al (2017)
on collaboration for sustainability in the food supply chain positthat “improving
sustainability in the food industry requires engagement of actors worldwide, in order to
cope with the challenges of consumer expectations, limited resources and international
policies and regulations”.Cao and Zhang (2010) in a study entitled “a firm’s perspective
of supply chain collaborative advantage” in United States of America (USA) have stated

3
that results of the structural analysis indicate that supply chain collaborative advantage
indeed has a bottom-line influence on firm performance.
Pakistan dairy sector plays a very significant role in the development of national economy
and its value of contributions is more than wheat and cotton sectors combined. Pakistan
livestock sector contributed 55.4% to the agricultural value added within the chain and
about 11.9% to the gross domestic product (GDP) during fiscal year 2012-13. Milk
production contributes in the livelihood, nutrition, and food security in that country
(Muhammad, Akhter& Ullah, 2014). Another study by Simatupang and Sridharan (2005)
highlighted the effects of decision synchronisation through a firm survey in New
Zealand. Their findings suggested that decision synchronisation has a significant impact
on collaboration level and operational performance (fulfilment, inventory and
responsiveness). Another similar study was conducted with US manufacturing firms
by Cao et al., (2010); the findings suggested that decision synchronisation had a positive
impact on collaboration, the same as in New Zealand. Firms need to identify the need of
supply chain collaborations as empirical evidence has shown the impacts on the
performance.Forum discussion paperdone by Banomyong (2018) noted many
researchers studied supply chain collaboration and its benefits since the early 2000s
(Zacharia, Nix &Lusch 2011; Lehoux,Amours &Langevin 2014). Firms that embrace
supply chain collaboration can improve their firms performance in form of clients
satisfaction, increased market share, gain more revenue and competitive advantage while
at the same time enhance the overall performance of firms.
In the UK, it was found that hotels collaborated with the local suppliers. Such
collaborative activities include building long-term commitment, providing training and
technical support. Collaborating with supply chain partners was found to enable the
delivery of the required quality and quantity of products (Font et al., 2008). In Australia
a study done by March and Wilkinson (2009) found that a hotel had successfully
collaborated with both travel agencies and tour operators by sharing their marketing
information. The study forecast on fresh dairy supply chain and the mediation of policies
and regulation on the relationship between variables.As firms seek to remain competitive

4
in today’s marketplace, they often look externally for assistance in meeting customer
expectations. One way this can be achieved is through supply chain collaboration.
Worldwide companies have successfully benefited from collaboration (Cooke, 2011) and
many others have struggled or even failed to do so (Benavides & de Eskinazis, 2012).
Facing uncertain environments, firms have strived to achieve greater supply chain
collaboration to leverage the resources and knowledge of their suppliers and customers.
For instance, Hewlett-Packard (HP), while collaborating with one of its major resellers
achieved improvement in fill rate, increase in inventory turnover and sales. Similarly,
Walmart attained mutual benefits of collaborative planning, forecasting and
replenishment by collaborating with Warner-Lambert (Parks, 2001). Collaborative
practices in Supply Chain Management (SCM) have established itself as successful and
sustainable business operations (Attaran &Attaran, 2007).Studies have shown that
collaboration offers promise for improved supply chain performance in several core areas,
including increased sales, improved forecasts, more accurate and timely information,
reduced costs, reduced inventory, and improved customer service (Angulo, Nachtman &
Waller, 2004). Many collaboration dynamics have been identified as being important in
improving supply chain performance. Collaboration may share large investments, pool
risks, and share resources, reasoning growth and return on investments. Collaboration is
the driving force behind effective supply chain management and, as such, it can be
considered as a core capability. However the scenario can be changed depending on the
policies, regulations and mandates of relevant institutions. Collaborative supply chain
initiatives continue to be developed and gain prominence based on closer inter-enterprise
relationships and enhanced information exchange, improved quality of decision-making,
reduce demand uncertainty and ultimately improve the performance of firms.
Collaborative relationships helped firms to share information and have joint planning
resources. Despite promising results from collaborative initiatives, the implementation in
general has been a challenge to Dairy Processing Firms because policies and regulations
are unpredictable.Fawcett, Magnan and McCarter (2008) stated that collaboration’s goal
is to have parties work cooperatively to devise and implement better approaches to solving

5
problems and delivering valuable clients expectations. They argued that collaboration
goes beyond managing transactions for efficiency to managing relationships for creativity
and continuous improvement. These collaborative relationships are long-term endeavors
where partners know the capabilities and needs of each other and actively seek to develop
or improve practices. While the above instance illustrates the positives of supply chain
collaboration from cost reduction to operational process enhancements, not all such
partnerships are beneficial.
In USA the fruits of performance of tourism companies through proper
information exchange have helped in increasing efficiency and effectiveness of
procurement and supply of operations in terms of good supplier-customer relationship
(Manuj & Mentzer, 2016). An efficient information exchange in tourism companies help
in improving business operations especially the supply chain activities which occupy
around 80% of the company operations. However, the dairy processing firms in Kenya
have been facing many challenges especially in the supply chain information sharing. It
is against this background that the currect study sought to examine influence of supply
chain information sharing on performance of dairy processing firms in Kenya.Sabath and
Fontanella (2002) discussed the unfulfilled promise of supply chain collaboration citing
an overreliance on technology, treating every client/partner the same, and a lack of trust
as barriers to successful collaborative results. Rick Jackson, Executive V.P. at Mast
Logistics and immediate past chair of the Council of Supply Chain Management
Professionals (CSCMP) Board of Directors, discussed collaboration in his opening
remarks at the 2013 CSCMP Global Conference. He noted that companies today espouse
the values of collaboration, but are often not organized for it. Compensation and incentive
structures do not encourage collaboration. Further, performance objectives and key
metrics are too often functionally based (Esper et al., 2010). Scholars have said, “ if
companies want to derive the benefits of collaboration, they have to be prepared for the
work that goes into collaborating”. Maintaining long-term strategic coordination between
partners, poor internal communication prior to collaboration, and the speed with which to
expect benefits have all lead to collaborative failures (Daugherty et al., 2006).

6
Additionally, desired collaborative benefits may actually prevent supply chain
collaboration from occurring. For instance some firms view one party’s collaborative as a
redistribution of expenses to other members in the supply chain. Managing the flow of
goods, information, and money from one part of the supply chain to the other requires a
smooth interplay between and among the stakeholders of the supply chain. Efficiency and
effectiveness of coordination of supply chain activities are needed to meet the clients’
requirements on time and accurately. Supply chain collaboration involves not only
external integration (suppliers-firm-customers) but also internal integration of the
different departments inside the firm such as purchasing, production, marketing,
information systems, and logistics (CSCMP, 2011).Anbanandam, Banwet and Shankar
(2011) similarly identified the following variables to constitute a collaboration index: top
management commitment, Supply chain information sharing, trust among supply chain
partners, long-term relationship, risk and reward sharing. The practices showed the
responsibilities that parties need to embrace for a partnership to work and to have an
impact on performance. Supply chain collaboration, however, is not developed overnight.
It is a long-term relationship wherein the partners are committed to achieve a common
goal. However the uncertainty of another partner like Suppliers’ delivery time going
wrong remains a big challenge and the study analyzed the influence of supply chain
decision sychronization on performance of Dairy Processing Firms .
1.1.2 Regional perspective of Supply Chain Collaboration and Performance
Regionally, study done in Ethiopia by Lemma, Singh and Kaur (2015) noted that “more
developed and well-organized supply chain coordination is ideal for consistent success
and profitability”. They reteirated that even if objectives and interests of different supply
chain members are varied, coordination among them becomes undeniably crucial to
determine the supply chain performance as a whole. This means that in order to achieve
performance of dairy processing firms, strategic adoption of such new concept as Supply
Chain Coordination whose emergence immensely enabled formation of successful
relationships across the supply chain.Dairy farming in East and southern Africa, for
example Kenya and Zimbabwe, started in the beginning of the century on medium to large

7
scale farms using imported cattle. Keeping dairy cattle on specialized farms requires
knowledgeable and skilled management. Private commercial farmers in Africa (Kenya,
Zambia and Zimbabwe) have proved that it is possible to achieve high milk production
levels but this has not always been true of parastatals. In general, private large-scale dairy
farming is limited to a few areas in sub-Saharan Africa and is not expanding. The common
experience is one of lack of capital and recurrent funds, including foreign exchange, and
insufficient freedom to set producer prices and to settle labour problems. The major
problems of most collection systems in Africa include the small volumes supplied per
producer, the pronounced seasonality of supplies, dispersed and relatively low-income
retail markets, high ambient temperatures, poorly developed transportation systems and
heavy seasonal rainfall. The main limiting factor for all systems is the time it takes for the
milk to reach the consumer or the processing unit(Kinyenje, 2013).The current study seeks
to establish the effects of decisions sychronised on performance of milk processing firms.
In Africa, many developing countries are yet to adopt the information exchange between
supplier-customer relationship,although the ones that have adopted the system are facing
challenges of information exchange between supplier-customer and also supplier-firm
which is acting as a barrier to performance of the business operations (Holmberg,
2010).Countries like Ghana and South Africa have adopted proper information exchange
in tour companies. This has helped the companies to manage the supply operations
properly hence increasing productivity of the companies and also making the tour industry
to be profitable (Chopra & Meindl, 2014).Areport by KDB (2014) showed that East
Africa Dairy Development Project (EADD) is a regional diary industry development
program implemented by Heifer International and a consortium of partners funded by the
Bill & Melinda Gates Foundation. The vision of success for the EADD is that the
lives of 179,000 families or approximately one million people are transformed by
doubling household dairy income through integrated intervention in dairy production,
market access and knowledge application. These are key partners in the dairy value
chain since they determine the market price of milk. The main buyers identified in the
study include individual buyers, hotels and milk bars, milk hawkers, small milk traders

8
who purchase between 1000-5000litres and large scale registered milk traders who
purchase over 10, 000litres from processors. The main processors as mentioned earlier are
New KCC, Brookside and Spin-Knit. A few farmers’ co-operatives (Lari Limuru and
Githunguri) are now active players in the formal processing sector. New KCC is one of
the leading buyer of milk and its presence in the region plays a major milk price
stabilisation role. In addition there are key service providers such as input suppliers,
agrovet shops, Artificial Insemination service provider’s, milk transporters and equipment
suppliers (KDB, 2014).
Ibrahim and Hamid (2012) conducted a study among manufacturing firms in Sudan
ostensibly to examine how management practices used among their supply chains affected
the performance of these supply chains. The authors sought to build on the understanding
that effectiveness in supply chain performance has potential to impact suppliers and
manufacturers both directly and indirectly. The study revealed that buyer-supplier
management, information sharing, and speed of responsiveness were critical practices for
the effectiveness of supply chain performance among manufacturing firms in Sudan. The
present study seeks to establish the effects of supply chain information sharing and supply
chain incentive alignment on performance of dairy processing firmrs in kenya. The nature
of products and demand in the market poss a challenge in the dairy sector. The
Performance of dairy processing will be determined by all supply chain partners in the
current study.

9
1.1.3 National perspective of Supply Chain Collaboration and Performance
The national perspective reveals the effect of other effective strategies on performance of
the firms. A study done by Mathae et al (2018) entitled “Effect of bullwhip on
performance of milk processing firms in kenya noted that in order to successfully compete
in the global market and networked economies, companies find that they must rely on
effective supply chains as a result of this concept of organizational performance.
Theabove study was done on effective strategies to address the mutual benefits of Supply
Chain Collaboration and sustained business operations. This current study was done on
influence of supply chain collaboration on performance of dairy processing firms.No
organization in any sector, can avoid the increasing demand for supply chain
collaboration. Today almost all organizations are in the process of adopting the strategy.
Hence the importance of the current study.
Dairy farming in East and southern Africa started in the beginning
ofthecenturyonmedium tolargescalefarmsusing imported cattle. Keeping dairy cattle on
specialized farms requires knowledgeable and skilled management. Private commercial
farmers inAfrica (Kenya,Zambiaand, Zimbabwe) have proved that it is possible to
achieve high milk production levels but this has not always been true of parastatals.
Ingeneral,privatelarge-scale dairy farming is limited to a few areas in sub-Saharan Africa
and is not expanding. Also lack of capital and recurrentfunds, including
foreignexchange,and insufficient freedom to set producer prices and to settle labour
problems. The major problems of most collection systems in Africa include the small
volumes supplied per producer, the pronounced seasonality of supplies, dispersed and
relatively low-incomeretail markets, high ambienttemperatures, poorlydeveloped
transportation systemsand heavyseasonal rainfall.The main limiting factor for all dairy
supply chain is the time I ttakes for the milk to reach the consumer or the processing unit
(Kinyenje, 2013).

10
1.1.4 Kenya Dairy Board and Milk Processing Firms in Kenya
Kenya has a robust dairy sector estimatedat 4% of the country’s GDP. The sector has
recorded an increase in dairy produce especially milk which is delivered to dairy
processing firms(KNBS, 2016). The sector has a complex value chain with diverse actors
that include farmers, traders vendors, collection centers, distributors, processors and
retailers. These also include a ploriferation of inputs, products and services (Radermaker
et al., 2016). Dairy processing firms as actors in the sector include few large processing
firms and a high number of small and medium processing firms. The dairy sector in Kenya
is a well-known example of successful smallholder dairy development. The establishment
of large-scale dairy farms during the colonial period led to the creation of a structure of
services, for example, Kenya Cooperative Creameries (KCC), research institutes, milk
recording schemes, herd books andKenya Farmers Association shops. Despite all these
developments, it is estimated that 56% of Kenya’s population live below the poverty line
(Republic of Kenya, 2014). KCC is the largest business entity in the dairy industry in East
Africa. The company is involved in food industry, processing and marketing milk products
and processes 450,000 litres of milk a day during the high season, and controls 37 percent
of the market share. The milk is sourced from approximately 120,000 suppliers. Seven
percent of these suppliers are commercial farmers and the rest (93%) are small scale
producers (Wambugu, Karimi & Opiyo 2011). The dairy subsector is dynamic and
occupies an important place in the agricultural economy of Kenya as milk consumption
levels in the country are among the highest in the developing world which aids in
contributing to an estimated 14% of agricultural Gross Domestic Product (GDP) and
approximately 4% of overall Kenya’s national GDP (KDB, 2014). Also significant
is the fact that Kenya is the second largest dairy producer and consumer in Sub- Saharan
Africa and is relatively self-reliant where it is dominated by very dairy industries and a
high number of smaller and medium processors leading to very stiff competition (Dairy
Report, 2016).
Kenya has about 27 licensed milk processors. Four of them are the KCC milk processors.
The industry’s growth and competitiveness are constrained by seasonality in milk

11
production, milk quality issues, a severe lack of knowledge and skills, sub-standard
service provision and input supply, as well as high fragmentation of the supply chain and
lack of inclusive business models. If these issues can be effectively addressed it will boost
further commercialization and growth of the sector. This will lead to creation of wealth,
employment across the value chain and food security ( KDB, 2012).The Milk Processing
Industry in Kenya has evolved over time and the collaboration of its supply chain is
increasingly becoming a challenge. One of the reasons for slow growth of the concept of
SCC is failure to broaden the vision of supply chain beyond the firm’s internal value
chain. The study investigated influence of supply chain collaboration on performance of
dairy processing firms . This study will enable the managers of the dairy processing firms
to devise ways of improving performance. However the performance of the dairy
processing firmshas faced challenges of ensuring that all products in the firm’s local dairy
case are fresh, safe and produced in the most efficient and environmentally-friendly way.
The dairy supply chai includes activities and processes from production, processing,
trading and consumption (Ngigi, 2004). Opportunities exist in production of high quality
powdered milk, cheese and butter; provision of affordable small-scale processing and
packaging technologies that tap the milk that currently goes to the market or to waste.
Milk processing also produces high value milk products such as Fresh milk; Long Life
milk e.g. UHT and other processed products.
1.2 Statement of the Problem
The aspirations of Second Medium Term Plan (MTP) (2013-2017) of Vision 2030 and the
Jubilee Manifesto touchedon the dairy industry. Currently, the dairy sub-sector is
experiencing one of the highest growth rates, estimated at 3 to 4 % annually and
contributing 40% of the agricultural GDP and 4% of the national GDP. The dairy
subsector is dynamic and occupies an important place in the agricultural economy of
Kenya as milk consumption levels in the country are among the highest in the developing
world which aids in contributing to an estimated 14% of agricultural Gross Domestic
Product (GDP) and approximately 4% of overall Kenya’s national GDP (KDB,
2014).However, the dairy industry’s growth and competitiveness are constrained by

12
seasonality in milk production, milk quality, lack of knowledge and skills, sub-standard
service provision and input supply as well as high fragmentation of the supply chain and
lack of inclusive business models (KDB, 2012).Despitethisrecognition,
challengesassociatedwithsupply chain collaboration continuetoinhibitperformance
ofdairy processing firms.TheKenyandairysectorhasexperiencedasignificantshiftin policy
environmentbothlocally,regionally andeveninternationally.Thesepolicies have had
varying impacts on the supply chain in the dairy industry over time. The Ministry of
Livestock Development has dairy policy draft for strategy towards the development of a
self- sustaining dairy industry. The policy aimed at guiding the dairy industry towards
liberalization and market economy. The policy intended to hand over commercial services
to farmers and the private sector while the Government provides policy and regulatory
framework for the industry. The policy did not, however, solve the problems of the dairy
industry mainly because there was no policy implementation programme and no adequate
funding was provided to implement the programmes (Dairy Draft Policy, 2018). As a
consequence of increased globalisation, the competition among companies is growing and
ways have to be found to ensure successful performance of the dairy processing firms in
kenya. Moreover, the search for mutual understanding of benefits and performance for all
the supply chain partners is still a challenge for both academicians (Fawcett et al., 2012)
and practitioners (Grocery Manufacturers Association, 2008).Supply chain management
literature has sought to identify empirical evidence of the role ofsupply chain collaboration
firms’ performance (Zacharia,Nix, &Lusch 2011). It is against this background that the
study seeks to establish the influence of Supply Chain Collaboration on performance of
Dairy Processing Firms in kenya and whether regulatory and policies mediate the
relationship. Collaboration of supply chain partners will enhance cooperation of members
participating along the supply chainhence improve the overall performance of the firm.
Kenya has about 27 licensed milk processors. Four of them are the KCCmilk processors.
The industry’s growth and competitiveness are constrained by seasonality in milk
production, milk quality issues, a severe lack of knowledge and skills, sub-standard
service provision and input supply, as well as high fragmentation of the supply chain and

13
lack of inclusive business models. Despite many successes (Hofman & Aronow, 2012),
supply chain collaboration failures have also been reported . Reasons for failures include
the lack of effective communication, lack of capital and investment and planning gaps
between supply chain partners (Fyall and Garrod, 2005). The general research problem
will be “Does the current supply chain collaboration influence the performance of Dairy
Processing Firms ?” Also, “Could the answer to performance of dairy processing firms lie
in supply chain collaboration?” Also establish if supply chain collaboration would
resulton performance when mediated by policies and regulations.This studyanalyzed
influence of SCC on performance of dairy processing firms and when the relationship is
mediated by policies and regulations of the goverment.
1.3 Research Objectives
1.3.1 General Objective
The general objective of the study was to analyze the influence of supply chain
collaboration on performance of dairy processing firms in Kenya.
1.3.2 Specific Objectives
The study was guided by the following specific research objectives:
1. To determine the influence of supply chain information sharing on performance of
dairy processing firms in Kenya.
2. To examine the influence of supply chain decision synchronization on performance
of dairy processing firms in Kenya.
3. To investigate the influence of supply chain incentive alignment on performance
of dairy processing firms in Kenya.
4. To assess the influence of supply chain teamworkon performance of dairy
processing firms in Kenya.

14
5.To evaluate the influence of mediation of policies and regulations on the
relationship between supply chain collaboration and performance of dairy
processing firms in Kenya.
1.4 Research Questions
1. Does supply chain information sharing have significant effect on performance of
dairy processing firms in Kenya?
2. Does supply supply chain decision synchronization have significant effect on
performance of dairy processing firms in Kenya?
3. Does supply chain incentive alignment have significant effect on Performance of
dairy processing firms in Kenya?
4. Does supply chain teamworkhave significant effect on performance of dairy
processing firms in Kenya?
5. Do policies and regulations have significantmediating effect on relationship
between supply chain collaboration and performance of dairy processing firms in
Kenya?
1.5 Hypotheses of the Study
1. H01 Supply chain information sharing does not have a significant effect on
performance of dairy processing firms in Kenya.
2. H02 Supply chain decision synchronization does not have a significant effect
on performance of dairy processing firms in Kenya.
3. H03 Supply chain incentive alignment does not have a significant effect on
Performance of dairy processing firms in Kenya.

15
4. H04 Supply chain teamwork does not have a significant effect on performance
of dairy processing firms in Kenya.
5. H05 Policies and regulations does not have a significant mediating influence on
relationship between supply chain collaboration and performance of dairy
processing firms in Kenya.
1.6 Significance of the Study
The findings of the study are therefore expected to create value addition to the following
stakeholders:
1.6.1 Government and Policy Makers
The study is in line with the aspirations of Second Medium Term Plan (MTP) (2013-2017)
of Vision 2030 and the Jubilee Manifesto. Currently, the dairy sub-sector is experiencing
one of the highest growth rates, estimated at 3 to 4 % annually and contributing 40% of
the agricultural GDP and 4% of the national GDP. The Ministry of Livestock
Development has drafted a dairy policy for strategy towards the development of a self-
sustaining dairy industry. The policy is aimed at guiding the dairy industry towards
liberalization and market economy. The policy did not, however, solve the problems of
the dairy industry mainly because there was no policy implementation programme and no
adequate funding provided to implement the programmes (Dairy Draft Policy, 2018).
According to the KDB, over 30 milk processors and 67 mini dairies with a total processing
capacity of about 3.75 million liters per day have been licensed to package and process
milk in the country.In 2018, approximately 46% of this capacity was utilized, where raw
milk intake by the small, medium and large-scale processors stood at 636 million liters
(11.35% of total annual production).
1.6.2 Dairy Processing Firms
Analyzing influence of supply chain collaboration on performance of dairy processing

16
firms delivers practical value to dairy processing firm managers by seeking methods to
increase supply chain collaboration success, identifying what factors lead to, or are
generated from, successful collaboration and determining firm performance benefits of
supply chain collaboration.This will enable the dairy sector meet country’s development
goals aspired in the Vision 2030. High performance of dairy processing firms is a
requirement to realization of Kenya’s Vision 2030. The dairy industry will be reformed
to respond to its challenges. The contributions made by the dairy and apparel sector
towards Kenya’s endeavor to meet its desired middle income status and the challenges
facing the industry as a whole informed the need to conduct this study. A lot of research
related to the field of supply chain has been conducted by various scholars.However, it
still remains unclear how the supply chain collaboration on dairy industry can be
harnessed to manage complexity and change and to be more trend responsive.This study
therefore intends to provide information that can inform exploitation of the dairy supply
chain for seamless operations and driving profitability
1.6.3 The Community
The entire communities within Trans Nzoia and its environs will reap the benefits from
the study findings. In the process of enhancing thes upply chain collaboration the firm
create savenues of generating morefunds which will be utilized to finance and expand
other viable projects. Additionally ultimate consumers o f da i r y p roduc ts stands
better chances of acquiring milk products which meet stheird emand expectations due to
improved quality, products availability because they are conveniently delivered and
products which are competitive compared with other milk products.

17
1.6.4 Grant Agencies
Local and international granting foundations provide funding resources to
government or non-governmental projects in partner developing nations as they tend to
design and implement their academic strategies. This study enables them to understand
the entire supply chain collaboration in order to make appropriate strategic decisions
pertaining funding.
1.6.5 Academic Field
To the academicians and other scholars, this study will shed more light in the field of
Performance of dairy processing firms by using it as a point of reference. The study
findings will benefitthe academic community by contributing to the increased body of
literature relevant to firms’ performance in the Kenyan perspective. Notably the study
recommendations provides more insight for continuing theoretical and empirical research
investigations in the field related to supply chain collaboration hence resolving of
emerging issues and practical improvement on firms’ performance.
1.7 Scope of the Study
The study analyzed the influence of supply chain collaboration on performance of dairy
processing firms in Kenya.The key study variables were:Supply chain information
sharing, decision synchronization, incentive alignment, supply chain team work and
mediation of policies and regulations. Selected dairy suppliers and customers buying dairy
products at Nakumatt retail supermarket responded to the survey questions. Supply chain
practitioners of the dairy processing firm werealso interviewed. The most important dairy
suppliers were individual farmers, Moi’s Bridge dairy and small holder farmers. This
study was conducted in Moi’s Bridge,Koitogos, Naitiri, Taito, Mbuthia, Ndalu, Dairy
farm of Charanganyi, North highlands Dairy,Meevoot Society and chepkoilel Collection
and Bulking Enterprises (CBEs)being suppliers of dairy milk toKCC in Trans-Nzoia
County (Appendix VI). Dairy Processing Firm factory is situated at Kitale west District,

18
along Maziwa road in Trans-Nzoia County. It produces dried skimmed milk Powder,
butter and Ghee. Kitale factory has an average daily intake of 31776 kg. The study covered
five constituencies in TransNzoia County. The county is located within the tropics
experiencing hot and wet climate which is conducive for both cereal and dairy farming.
1.8 Limitations of the Study
The study was limited to the dairy farmers and customers of dairy processing firms. The
scope was limited to: dependent variables focused on performance of Dairy Processing
Firms. However, the independent variables were limited to: Influence of Supply chain
information sharing, decision synchronization, incentive alignment, team work and
influence of mediation of policies and regulations. In reality there are other factors which
determine the performance of dairy processing firms. The generalizability of the current
findings may be limited because this present study was conducted only in dairy
processing firms in Trans-Nzoia County. This was solved by extensive empirical review
of current research and justification and scope of the study. Confidentiality policy of the
organization played a key role in limiting most of the respondents from answering some
of the questionnaires since they regarded the process to be against the organization
confidentiality policy which might expose confidential matters of an organization. They
were not ready to share important documentation because of suspicionnormally
associated with any kind of a researchstudy.This was solved by assuring the
respondenofut most confidentiality and disclosing the academic purpose and intention
ofthe study. To overcome the limitations, the researcher officially requested authority to
collect data and explained the reasons for undertaking research. It was also articulated by
assuring the respondents that information provided will be used for academic purposes
and treated with utmost confidentialty. Data collection relied mainly on the questionnaire
and interviews, administering questionnaires to respondents to fill them themselves was
limiting since some of the respondents may have given responses that were not well
thought out before answering. The researcher therefore recruited and trained research
assistants who were required to make a follow up on areas that respondents had
difficulties understanding. Moreover, the highnon-responserate associated with

19
questionnaire is known to interfere with the external validity.

20
CHAPTER TWO
LITERATURE REVIEW
2.1 Introduction
This chapter reviewed concepts of previous studies on related fields, acknowledging the
contributions made by other scholars. The review helped in identifying the gap and
provided the way forward. Theoretical framework as well as conceptual framework was
illustrated, Review of variables and empirical review was done and there afther critique
of relevant literature and summary of the research gaps established in the study. The
literature provided useful source of informationon influence of Supply Chain
Collaboration on Performance of Dairy Processing Firms .
2.2 Theoretical Framework
A theoretical framework refers to how theresearch is guided, its assumptions and under
pinnings and provides a structure of ideas on which the research is based (Saunders, Lewis
& Thornhill, 2019).A theoretical framework specifies the key variables influencing the
performance of Dairy Processing Firms , what variables to measure and the rationale
for relationships between variables.The study utilized the following theories:, Supply
ChainNetworkTheory(SCNT),Transaction Cost Economics Theory (TCE), Collaborative
Network Theory (CNT)and Relational Exchange Theory (RET). The theories explained
the Influence of supply chain collaboration on performance of dairy proccessing firms in
Kenya.
2.2.1 Supply ChainNetworkTheory
The supply chain network theory is founded on therational self-interest paradigm
advanced by Sociologist James Colemanin 1988 and noted by (Musau, 2018). The
assumption by proponents of the theory was that people form dyadic and group ties
austensibly to maximize their own individual preferences and desires.Supply Chain

21
Collaboration can be viewed in there alm of supply chain networks which Zuo and
Kajikawa(2017 )refer to as the new analytic paradigmin the management of the supply
chain. Zuo, Kajikawa and Mori (2016) argue that supply networks theory enables firms
to maintain existing partners active,while at the same time identifying other potential
cooperation partners. Hearnshaw and Wilson (2013) posit that supply chain scan be
modelledasa network by a set of “nodes” representing autonomous business units as firms
capable of exercisings overeign choices, and as sets of “connections” that link these
firms together for the purposes of creating products or services. The linkages between
firms represent exchange relationships and the underlying contract if present.The critical
collaboration aspects were supply chain information sharing, decision sychronisation,
incentive alignment and supply chain teamwork. Network theory is descriptive in nature
and has primarily been applied in Supply chain management to map activities, actors and
resources in a supply chain. The focus has been on developing long-term, trust-based
relationships between the supplychain members.There is a positive relationship between
collaboration and performance (Breuer, Siestrup,Haasis&Wildebrand,2013).Cloud
computing can facilitate not only inter-organisational collaborationin business processes,
butallow cross enterprise information sharing and collaborative work to enable people
from different locations and enterprises to share a single workflow (Balina, Baumgarte
& Salma, 2017). Therefore effective supply chain information sharing among partners is
key in determining performance of dairy processing firms.Vinodh etal.,(2014) contend
that network theory provides the idea lenvironment for nurturing relationships that
encourage trustful exchange making continuity in relationships possible. Choice of the
network theory for this study was therefore based on the premise that supply chain
collaboratoim influence performance needed b y d a i r y p r o c e s s i n g f i r m s to be
examined via policies and regulations aspects that play partin improvement of
relationships and by consequence,organizational performance (Chaplin & O’Rourke,
2014).For this study the supply chain network theory implies that those firms that adopt
supply chain information sharing are able to gain from the growth of effective
communication and technologies which enable real-time information sharing between
buyers, suppliers and online order processing systems which supports the building of

22
closer links with customers, suppliers and third-party vendors such as logistics service
providers. The firm will be able to reach out to other partners willing to collaborate and in
the long run the market share and client satisfaction will be to the benefit of dairy
processing firms.Supply Chain Network Theory also implies that dairy processing firm
adopting the theory will be able to build relationships and make effort to link these firms
together for the purposes of creating products or services.Moreover, there will be joint
decisions, planning and resolutions for mutual benefits.
2.2.2 Transaction Cost Economics Theory
Transaction Cost Economics is a theory that offers an alternative approach to the
traditional mainstream economics through a lens of “choice" (Williamson, 2002). This
alternative approach is to view the nature of the firm and its boundaries via the lens of
“contract" (Williamson, 2008). In a collaborative relationship, it has been found that asset
specificity and environmental uncertainty positively affect an intention for a long term
orientation between supply chain partners (Benavides, Luis &Versa de, 2012). The
underlying Assumption of the theory is that there is a transaction cost in any supply chain
interaction (Grover& Manoj, 2003). This is because of the assumptions of bounded
rationality and opportunistic behaviour (Williamson, 2008). The study established the
mediating effect dairy board through their policies, regulations and standards on
performance of dairy processing firms . It also established whether quality control
measures are understood by milk suppliers and its effect to the performance of dairy
processing firms . Based on the classical economics theory, it is assumed that humans
have perfect rationality of their behaviors. Therefore, bounded rationality is viewed as a
source of transaction costs because all factors cannot be considered in the decision making
process (Barros, 2010). It is expected that suppliers may deliver inferior goods if they
know that their clients cannot detect the difference (Wuyts & Geyskens, 2005; Morgan et
al., 2007). This opportunistic behavior leads to the cost of monitoring the outsourced
production processes and the quality of delivered products (Vieira et al., 2011). Although
the firm may not discover any opportunistic behaviour of its suppliers, quality checking
is still necessary as long as the expectation of opportunistic behavior still exists.The theory

23
contributed much to the study as it was established thata dairy processing firm has a
department for detecting quality aspects and if influences performance of the firm.
TCE has been applied to understand the behaviour in supply chain collaboration (Wilding
& Humphries, 2006) and its impacts on supply chain relationships and performance (Cao
&Qingyu, 2011; Nyaga&Judith, 2011). Hence TCE is considered to fit with the nature of
supply chain management research. It has been shown that lower transaction costs favour
outsourcing and higher transaction costs favour in-house operations (Williamson, 2008).
As an alternative for firmor market governance, collaboration arises as one of the hybrid
governance forms which can reduce transaction costs of factors such as opportunism and
monitoring activities or external uncertainty (Kinra & Kotzab, 2008). The concept of TCE
has been widely used to explain the existence and boundary of the firm as well as other
forms of economic governance (Williamson, 2005b). Moreover, seldom has the
antecedents of such transaction costs in supply chain collaborations been studied
(Williamson, 2010).
Studies have established that, not only does internal factors affect the collaboration but
the policies laid down by regulatory bodies seem to have an effect on performance of
firms.Transaction costs caused by partners’ opportunism behavior have been cited to
reduce the performance of the firms (Morgan et al., 2007). For this study the TCE theory
implies that dairy processing firms that adopt supply chain decision sychronization are
able to gain competive advantage compared to others. Different transaction options have
different costs and risks that will determine performance of the dairy processing firm.
Whether the transactions costs are lower or higher it will influence the sourcing decisions
of the dairy processing firms. TCE theory makes contributions on understanding of the
influence of SCC on performance of dairy processing firms . It suggests that reducing
complexity in transactions for example by seeking efficient governance structures and
clarifying capability roles e.g. reducing the incompleteness of contracts will enhance the
the overall performance of the firm.

24
2.2.3 Collaborative Network Theory
The key determinants of performance of firms does not only include the effectiveness of
the cooperation between the firm and its partners but also with the partners’ partners.
Collaborative Network Theory (CNT) is used as the foundation of the reciprocal effect in
inter-firm relationships. Hence, the interactions between firms and other players in the
tiers of the supply chain become more vital (Hakansson &David, 2002). An effective
relationship among supply chain partners can help facilitate a combination of the resources
owned by the firms. Resource combination results in better outcomes than those achieved
by a single firm acting alone (Halldórssonet al., 2007). CNT argues that the value of the
resources can be expanded by its combination with other resources, then building effective
inter-firm relationships within the network or supply chain can be more important than
resource possessions per se. Therefore, the efforts of the firms in terms of creating
successful relationships with their supply chain partners are important (Halldórsson et al.,
2007). The significant contribution of CNT to the determination of the inter-firm
relationships is the role played by supply chain partners who yield to trust via supply chain
collaboration such as formal communication as well as mutual adoption of integrated
management and culture hence the competive advantage of the firm.By establishing
Supply chain information sharing and collaborative communication, firms build the
relationships with their supply chain partners through the social exchange process to
improve their performance. In CNT, a network is believed to be in a state of dynamic
momentum, rather than a point of optimal equilibrium (Halldórssonet al., 2007). Hence
collaboration between firms and their supply chain partners aims to govern such
dynamics, which includes both exchange process e.g., information, products (goods and
services) and social exchange and adaptation process.In supply chain management, CNT
has been applied to map the supply chain in terms of activities, actors and the flow of
resources. The main focus of CNT is to develop long-term relationships based on building
mutual trust between supply chain partners (Fayezi, Andrew & Ambika,2012). The study
establishedthat the role the regulatory board and other institutions play in influencing the
relationship between supply chain partners and the performance of dairy processing firms

25
. The regulatory board preference influenced the performance of the firm from the supplies
of fresh dairy milk, dairy milk coolers or collection sheds, dairy processing firms and the
distributions of the processed dairy milk to clients in diffent retail outlets.
2.2.4Relational Exchange Theory
Relational exchange theory was presented by Morgan and Hunt in 1994,noted by Dyer
and Singh (1998) austensibly to model drivers of long term customer-bank relationship
to explain interpersonal exchange of benefits and costs.The theory explains competitive
advantage and superior performance by focusing on dyads and networks of companies as
units of analysis. The theory proposes that the greater the partners’ investment in inter-
firm knowledge sharing routines and relation-specific assets, the greater the potential will
be for relational rents.Consequently, when firms adopt standard norms for specific
systems, then they create relational norms as partners allowing for the application of the
relational exchange theory. Gachengo and Kyalo (2015) posit that relationism builds
economically viable relationships that result in financial performance. Moreover,
relationism provides an atmosphere that promotes communication of innovation in
technology (Xiaojun et al., 2015), which by extension allows for the integration of a
diversity of information systems. According to Blackhurst, Dunn and Craighead (2011)
relational competencies such as defined communication networks, developed supplier
relationship management programs and monitoring systems are positively related to
supply chain resilience. In the present study, the relational view was on the basis of
understanding effects ofsupply chain collaboration on performance of dairy processing
firms in kenya.Relational theory was particularly deemed relevant for the present study
due to the fact that it is well suited in adoption of information technology as well as
information systems such as those used in supply chains. Moreover, Inter-organizational
informational systemand supply chain informational infrastructure can disseminate real
time demand and supply information throughout the supply chain thus improving
performance of dairy processing firms. Also important is the collaborative planning,
forecasting and replenishment (CPFR) systems, vendor-managed inventory (VMI),
efficient consumer response (ECR) and quick response. The adoption of supply chain
26
information systems in any organization significantly influences its organizational
performance. (Moharana et al., 2014). The relative advantage in essence is that it improves
communication between stakeholders, improves information exchange and generally
improves the supply chain performance. However, the use of information systems in any
industry requires some innovativeness.
2.3 Conceptual Framework
Conceptual framework refers to a visual or written relationship between various variables
often derived from one or more theories and traces the in put-process-out put paradigm of
the study (Saunders, Lewis & Thornhill2019). According to Imenda (2014), a conceptual
framework is an end result of bringing together a number of related concepts to explain or
to predict a given event or give a broader understanding of the phenomenon of interest or
simply of a research problem.Dr. Kivunja (2018) said that Conceptual framework is the
logical conceptualization of your entire research project. Logical conceptualization meant
that a conceptual framework is a metacognitive, reflective and operational element of the
entire research.A conceptual framework is the total, logical orientation and associations
of anything and everything that forms the underlying thinking, structures, plans and
practices and implementation of your entire research project. It comprises thoughts on
identification of the research topic, the problem investigated, the questions asked, the
literature reviewed, the theories applied, the methodology used, the methods, procedures
and instruments, the data analysis and interpretation of findings, recommendations and
conclusions made. It is an illustrated representation of an idea or body knowledge based
on individual understanding of the relationships between the variables.

27
Fugure 2.1 presents conceptual framework of the current study:
Figure 2.1: Conceptual Framework
Mediating Variable
Supply Chain Decision
Synchronization
Joint decision
Joint planning
Joint resolution
Supply Chain Incentive
Alignment
Retail price
Order charges
Reduced
inventorycosts.
Performance of dairy
processing firms
Market share
Client satisfaction
Profitability
Competitive advantage
Dependent Variable
Independent Variables
Supply Chain Teamwork
Relationship
Effort
Trust
Policies and Regulations
Supply chain information sharing
Formalization
Integration
Order tracking
28
2.4 Review of Variables
The pertinent concepts included in this study formed the conceptual framework and
showed the relationship of the dependent variable (performance of dairy processing firms
in kenya) and independent variables (Supply Chain Collaboration) and mediated by
policies and Regulations. The study adopted a conceptual framework to describe the
relationship between variables. Based on there view of literature regarding the influence
of supply chain collaboration on performance of dairy processing firms , sets of variables
were distinguished to explain the variation on performance of dairy processing firms . The
first set of variables was the independent variables.An independent variable is a variable
that is expected to influence the dependent variable in some way (Zikmund et al., 2013).
Independent variables are those that probably cause, influence or affect outcomes and are
also called manipulated or predictor variable (Creswell, 2014) as they are manipulated by
the researcher to cause an effect on the dependent variable.
Supply chain collaboration is defined as a long-term relationship where participants
generally cooperate, share information, and work together to plan and even modify their
business practices to improve joint performance (Whipple et al., 2010). Supply chain
collaboration has been argued to enhance firm performance (Simatupang
andSridharan,2005). By working with supply chain partners, firms are expected to
multiply the outcomes of the effort from working alone (Wilding,2006). Such
outcomes include a better level of responsiveness and servicel evel improvements
from their supply chain collabortive programmes (Holweg etal.,2005). The concept of
Supply Chain Collaboration is considered as a regime for governing organizations. It is
believed that collaboration in supply chains could yield tremendous benefits
(Piboonrungroj, 2012).Cao and Zhang posit there are several forms of collaborations in
supply chains e.g., Supply chain information sharing, supply chain incentive
alignment,supply chain decision synchronization and supply chain teamwork. Moreover,
firms could achieve better performance, such as reducing cost and improving efficiency
by working collaboratively with their key partners (Piboonrungroj, 2012). Piboonrungroj
(2012) points firms working with supply chain partners multiply the outcomes of the effort

29
compared to working alone. Firms expect a better level of responsiveness and service level
improvements to result from their supply chain collaborative programmes. Many studies
have found that a higher level of supply chain collaboration can improve the performance
of firms (Nyaga et al., 2010).
Scholars suggest that coordinating supply chain activities, such as procurement, auction,
replenishment, payment, product change and collaborative product design, result in cost-
effective, speedy, reliable, and less error-prone supply chain operations (Lee & Whang,
2004). Specifically, operational coordination enables firms to streamline and automate
their operational activities across the supply chain (Lee & Whang, 2004). It facilitates the
design and manufacture, as well as quick and reliable delivery of products/services when
and where needed (Sanders, 2008). Furthermore, operational coordination allows firms to
share the rights to decide on how to reengineer business processes and routines across
organizational boundaries. The reapportionment of decision roles, rights and
responsibilities enhances the understanding of management decisions and the sharing of
risks and resources. Furthermore, the supply chain becomes more responsive to market
changes, enabling supply chain members to jointly explore markets and develop
products/services (Lau, Yam & Tang, 2010; Sanders, 2008).Fawcett, Magnan and
McCarter, (2008) emphasized the importance of a nurturing organizational culture to
achieve high collaboration. Hadaya and Cassivi (2007) however, observed that while a
strong relationship is necessary for collaboration to exist, joint decision-making activities
in fact strengthens even more an existing partnership. Supply chain collaboration,
however, is not developed overnight. Chen et al., (2004) reiterated that SCC is a long-
term relationship wherein the partners are committed to achieve a common goal. To enable
partners to engage in joint decision making and problem solving and to share information
with each other, a trustworthy relationship needs to be established.The independent
variable weresupply chain information sharing, supply chain decision synchronization,
supply chain incentive alignment and supply chain teamwork.
The first independent variable for the study was supply chain information sharing. Samadi
and Kassou (2016) ascertained that supply chain information systems have an indirect

30
effect on the performance of supply chains in manufacturing firms through systems such
as Enterprise Resource Planning, Supply Chain Management Systems and Manufacturing
Execution Systems. Connectivity and integration of ICT systems are also associated with
supply chain performance and by extension, with overall organizational performance
(Mulwa, 2015). There is a relationship between information systems and Supply chain
information sharing because the systems in place dictate the degree of Supply chain
information sharing, however the above studies were done in other firms not directly
related to the dairy industry processing firms. De Carmago and Charbel (2017) contend
that service information relating to customer service records and technical information on
equipment and data bases is brought together in a central data base from which field
service teams easily access information required to do their work efficiently. They are
therefore harnessed with the right platforms for doing their work. On the basis of such
evidence the study conceptualize Supply chain information sharing could equally have
direct influence on performance of dairy processing firms. Availability and accessibility
of updated dairy industry information is crucial for proper planning, management and
forecasting various issues in the industry. At the moment, KDB and other stakeholders
such as i-cow are piloting electronic-dairy (e-dairy) platforms for information gathering,
analysis and dissemination to dairy stakeholders. However; adoption of these technologies
has been limited due to lack of awareness, in addition to inadequate ICT infrastructure
and skills.In order to establish such a mechanism for the entire dairy industry, the
Government will facilitate implementation of e-dairy platforms to improve information
sharing among stakeholders. A strong linkage between universities, research institutions,
financial institutions, dairy farmer associations, and extension agents will be created to
promote dairy production in Kenya. In addition, the Government will set up a National
Dairy Information Center at KDB that will be equipped with a databank facility to
collection, and disseminate up-to-date information to dairy stakeholders(G.O.K, 2013)
31
The second independent variable was supply chain decision synchronization. This can be
defined as Joint decision making in planning and operational context (Simatupang &
Sridharan, 2005). According to Ataseven and Nair, (2017) Supply chain information
sharing, joint decision making and Supply chain teamworkare the major dimensions of
SCM approaches. By reviewed literature, it can be concluded that joint decision making
among other measures are the most important approaches. Additionally these approaches
have also been empirically verified by scholars in different industries. According to Flynn
et al. (2010), one of the measurementsScaleforsupply chaincollaboration was
Decision synchronization. This was measured in terms of jointly plannning on
promotional events, jointly developing demand forecasts and jointly working out
solutions. This was specified by Piboonrungroj (2012) in his Phd thesis entitlted
“Supply Chain Collaboration: Impacts and Mediation”. On the basis of such
evidence, the researcher conceptualized that Supply chain decision synchronization could
equally have a direct effect on performance of dairy processing firms and when mediated
by policies and regulations. Although not much exists in relation to the dairy industry, it
was prudent to conceptualize direct influence of supply chain decision synchronization on
performance of dairy processing firms with mediation of policies and regulations.
The third independent variable of interest was supply chain incentive alignment.
Appropriate alignment of the incentives for the supply chain partners build mutual trust
and develop commitment among the two parties (Simatu- pang and Sridharan, 2005). An
appropriate supply chain incentive alignment in the supply chains is expected to build trust
and commitment between collaborating firms. Moreover, this will also improve intention
of both partners to increase their performance to earn fair rewards. Furthermore, strong
relationships in the supply chain will also be a source of competitive advantage. The
scholars in their conceptual model had five independent variables specified as mutual
objectives, integrated policies, appropriate performance measure, supply chain
information sharing and incentive alignment. The other set of dependent variable was
collaboration. The current study conceptual model had four independent variablesand one
of them is supply chain incentive alignment. The dependent variable was performance of

32
dairy processing firms . It was therefore necessary to visualize Supply chain Supply chain
incentive alignment as having the potential to influence performance of the firm directly
and when mediated by policies and regulations. Literature by Simatupang and Sridharan,
(2005) noted that supply chain incentive alignment is co-developing systems to evaluate
and publicize each other’s performance, share costs for example loss on order changes
and share benefits in form of saving on reduced inventory costs. It was therefore prudent
to visualize supply chain incentive alignment as having the potential influence on
performance of dairy processing firms and when with mediated by policies and
regulations.The fourth independent variable was supply chain teamwork. Literature by
Nyaga et al (2010) noted Joint activities has having a joint team by conducting joint
planning to anticipate and resolve operational problems and making joint decisions about
ways to improve overall cost efficiency. One of the core values regulating board according
to strategic plan 2017-2022 is Teamwork. It was therefore prudent to conceptualize similar
influence of supply chain teamwork on performance of dairy processing firms.
The second set of variable involved the dependent variable. Dependent variable is the
variable measured, predicted, or otherwise monitored; expected by the researcher to be
affected by a manipulation of the independent variable (Cooper &Schindler, 2008).The
performance of dairy processing firms was measured by the market share, client
satisfaction, profitability and competitive advantage. Literature showed that measures
such as profitability, quality and quantity (Shepherd & Günter, 2012); time, cost,
flexibility and quality (Arif-Uz-Zaman & Ahsan, 2014); financial, internal processes,
innovation and improvement, and customers (Golrizgashti, 2014); and operations,
economic, social and environment (Zailani et al., 2012) are key indicators of
organizational performance. For this study, performance of dairy processing firms. Other
scholars have said that performance is measured by profitability, reliability,
responsiveness, flexibility, cost and asset management efficiency in line with suggestions
by Ganga and Carpinetti (2011 as cited in Leończuk, 2016). Literature also showed that
performance of firmswas measured in several ways supported by Chen and Paulraj
(2004b) who said “a firm’s performance can be measured in terms of financial

33
performance and operational performance”. Firm performance can be also viewed as
service effectiveness and cost effectiveness (Richey et al., 2010); cost, quality, delivery
and flexibility (Krause et al., 2007). The study conceptualized performance of dairy
processing firms with respect to Market share, client satisfaction, profitability and
competitive advantage.Competitive advantage remains a key focus among organizations
yearning to enhance their performance relative to their competitors. Studies point to the
desire to understand how to sustain competitive advantage among completing
organizations. Collaboration between supply chain partner’s i.e. dairy farmers, Milk shed
coolers; transporters of dairy milk, supply chain practitioners, distributors and the clients
lead to exploitation of the resources and in the long run improve the overall performance.
Sustainable Supply Chain Management demands collaboration and it is a requirement to
improve in market share and profitability.In the present study, the factors affecting
resource utilization included supply chain collaboration aspects and if proper utilized it
will lead to competitive advantage of dairy processing firms.Positive effects on
operational performance, operational coordination improves business performance.
Specifically, operational coordination streamlines and automates complex activities of the
supply chain (Lee & Whang, 2004; Lau, Yam & Tang, 2010). Further more, operational
coordination enables the well-coordinated movement of inventories across the supply
chain, which shortens lead time and reduces the bullwhip effect thereby increasing cash
flow to improve business performance supported by (Lee & Whang, 2004; Sanders,
2008). Moreover, operational coordination promotes resources, knowledge, and risk
sharing across the supply chain. It also reduces development and time-related costs to
redesign business processes and improve profit margins in product development (Lau,
Yam & Tang).
The third set of variable was mediating variable in form of Policies and Regulations
Mediating variables typically emerge in multiple regression analysis, where the
influenceof some independent variable (predictor) on the dependent variable (criterion) is
not direct, but mediated through the third variable (Milin&Hadzˇic´, 2011). According to
The Dairy Industry (Regulatory Permits and Levy) Regulations (2020), Regulations shall

34
apply to all matters relating to issuance of regulatory permit and imposition of regulatory
levy to dairy business operators. The Kenya Dairy Board was established under the Dairy
Industry Act ; ( Cap.336). The objects of Regulations are to provide for; defining the
manner and scope of issuing the Dairy regulatory permit, mechanisms for ensuring quality
and safety of marketed dairy produce, means for generation of resources to finance the
enforcement of the Act and its regulation and enabling environment for sustainable
investment in the dairy industry. Extensive review of existing literature on dairy board
policies and regulations showed the mandate of the board, the policies in place and the
underlying regulations. KDB strategic plan (2017-2022) articulates the shared vision,
mission and values and successful implementation of Strategic Plan is determined by the
commitment of all stakeholders hence the board provided appropriate governance and
policy direction. The management team coordinates the implementation process and
involvement of all staff is key to the success of the plan. Implementation responsibilities
of this strategy will, therefore, be cascaded to all levels in order to allow for maximum
participation of all the relevant stakeholders. Moreover one of the mandates of the board
is to develop policies, regulations and strategies to facilitate the growth of the dairy
industry (KDB, 2020). On the basis of such evidence policies and regulationswere
therefore conceptualizedas mediatingvariables in the current study.
2.4.1 Supply Chain Information Sharing and Performance of Dairy Processing
Firms
Supply Chain Information sharing refers to the extent to which information is exchanged
among members across the supply chain (Kulp, Lee & Ofek, 2004b; Lee & Whang, 2004).
It reflects the degree of information transparency and direct, real-time information
availability. In other words, supply chain information sharing involves sharing critical and
proprietary information among supply chain partners, whereas operational coordination
involves how firms jointly derive knowledge from the shared information and change
business processes as needed. For instance, empirical evidence shows that sharing
information in the supply chain helps firms derive competitive advantage in various ways,
such as increasing sensitivity to marke ttrends and customer demands, reducing total cycle

35
time and the cost of inventories and acquiring innovative ideas for products/services
(Kulpetal.,2004b;Lauetal.,2010; Lee & Whang,2004). Inaddition, Sanders(2008)
proposes that operational coordination result in cost-effective,speedy, reliable and a less
error prone supply chain operation,which helps firms respond to market uncertainties in
arapid and precise manner.
Information shared among supply chain partners and clients in real-time and/or in person
tend to improve business operations in terms of speed, agility, control, and client response
by focusing on communications, relationships and knowledge (Manthou et al.,2004).
However, critical supply chain information sharing can happen only if there is confidence
among supply chain partners. He noted that product and information flow among SC
partners allows them to work together to develop joint business plans. It can be carried
out as a formal practice that involves periodic meetings or can be done informally as
needed.Supply chain information sharing is also seen as the willingness to make strategic
and tactical data such as inventory levels, forecasts, sales promotion, strategies, and
marketing strategies available to firms forming supply chain nodes (Cao & Zhang, 2013).
The ability to see from one side of the channel to last is crucial, information is assumed
as blood for supply chaincollaboration. Supply chain information sharing may also include
logistics on formalization, integration and order tracking and performance of firms
measures like addressing customer, quality, time, market changes and design or
uncertainty (Singh, 2013). Supply chain information sharing has been investigated in
multiple industries and regions and revealed that it has a major contribution to enhancing
operational performance (Abdallah, Obeidat& Aqqad, 2014; Effendi, 2015). Supply chain
information sharing positive affects performance in many ways like enhanced service
levels, customer responsiveness, decreased costs, and reduced levels of complexity
(Flynn, Huo & Zhao, 2010).Huo, Zhao and Zhou, (2014) studiedsupply chain information
sharing with suppliers, customers and internal in Chinese manufacturing and revealed that
all have a positive effect on operational performance and internal information sharing also
has a positive relationship with external.The lack of information transparency in terms of
communication within the chain, lack of knowledge concerning true consumer demand

36
and delay in information transfer result in information asymmetry which is a situation
where different parties have different states of information about product demand and the
chain operations (Borut et al., 2014).According to Williamson (2010), an understanding
of transaction costs is central to the study of trust in organizations. According to this
theory, transaction costs are nil when there is perfect information. However in buyer-seller
relationships, perfect information is usually not available. Parties usually incur transaction
costs like search and information costs, bargaining costs, and enforcement costs. One
important aspect of Supply chain information sharing as it relates to collaboration is the
delineation of the kind of knowledge, explicit or tacit, that results from the exchange of
information. Collaborative arrangements involve knowledge transfer that is both explicit
(e.g. transactional) and tacit, which resides in “social interactions” (Lang, 2004). Strong
relationships increase the likelihood that firms will exchange critical information as
required to collaboratively plan and implement supply chain strategies. In order for this
sharing of critical information to occur, a high degree of trust must exist among the
collaborating partners.
Namusonge’s, Mukulu and Kirima (2015) in their thesis entitled “Supply chain
information sharing, Cooperative Behaviour and Hotel Performance” posits that the
starting point of supply chain collaboration is supply chain information sharing. They
conceptualized information sharing as the act of capturing and disseminating timely and
relevant information for decision makers to plan and control supply chain operations.
Supply chain information sharing provides visibility and helps in better decision making.
Various information content aspects are involved in the relationships between buyers and
sellers. Information can be communicated between the parties by electronic means, such
as: Electronic Data Interchange (EDI), Efficient Consumer Response (ECR), Vendor
Managed Inventory (VMI), or by personal communication channels, such as: electronic
mail (email) or phone (Chopra and Meindl, 2003). Technical and commercial information
exchange help in creating a collaboration environment, such as product development and
production plans between buying and selling companies (IMP Group, 2012). IMP Group
supports that information exchange formalization is important. The degree of formality

37
depends on the businesses characteristics and size affects the interaction process nature
and relationship as a whole. Leeand Whang (2004) contend, “the capability for all supply
chain partners to have access to share information on a timely basis is therefore key to
improving supply chain performance”.Therefore, supply chain information sharing is
critical fo roperational and business performance. Specifically,Supply chain information
sharing facilitates product delivery,market exploration and product /services promotion
(Devaraj, Krajewski & Wei,2007).
In the current market,this process is more salientdue to the open,real-time, and rich content
features of online information.With the availability of real-time and rich content
information, firms can sense and respond to market uncertainties rapidly and extensively
(Lee&Whang, 2004). For example,through sharing information in the supply chain, a firm
can quickly detect the problems related to customer demands, especially when customers
want to receive information directed to ward their special needs and interest at any time
and place. Such information will help the firm pro actively prepare for responding to such
demand changes, which is critical forits operational performance. Supply chain
information sharing reduces demand uncertainty and the phenomenon of increasing
variability of demand in a supply chain. In general,effective Supply chain information
sharing enhances mutual understanding, which reduces miscommunication and prevents
unnecessary mistakes, thereby decreasing transaction costs across the supply chain
(Frohlich, 2002; Lee & Whang, 2004). Increased information transparency allows firms
to choose suppliers with lower prices, enabling them to produce and deliver products or
services at lowercost (Chen, Paulraj & Lado, 2004). This process, inturn, createsa positive
effect on firms’business performance. Supply chain information sharing helps firms
increase profits by reducing the cost of inventorie and enhancing capital and cash flow
utilization,thereby improving firm’sperformance.Shared information and trust among
partners are required for effective supply chain collaboration and successful supply chain
integration. Collaborations between partners in Supply chain information sharing
facilitate Supply chain decision synchronization between these partners contributing
towards achieving significant firms’ performance (Simatupang, Tongar &Sridharan,

38
2005). Firms are therefore expected to cooperate on a long-term basis with firms where
information is more available. Partners that allow each other information access are able
to review their transactions, especially possible redundancies, thus reducing the
transaction costs. SCC is very important for success of the global business optimization,
and it is only achieved if supply chain members share their information unambiguously.
2.4.2 Supply Chain Decision Synchronization and Performance of Dairy Processing
Firms
Decision synchronisation is Joint decision making in planning and operational context
(Simatupang & Sridharan, 2005). Joint Decision Making is defined as the “process by
which supply chain partners coordinate activities in supply chain planning and operations
for optimizing the supply chain benefits (Cao & Zhang, 2013).It includes plans, combines
information, resolves problems and develops rules and regulation and procedures. An
effective strategic coalition and worthy relationship with customers and suppliers are
required and it should consist of trust, loyalty and positive relationship (Basu et al., 2017).
The aim of decision synchronisation is to align partners and to synchronize decisions on
order placement, inventory replenishment and order delivery. Every partner has its own
objectives and goals and sometimes very hard to come on mutual points that may cause
uncertainty (Kauppi et al., 2016); to reduce this uncertainty decision synchronisation has
become an important strategy for today business.Furthermore, it has also empirically
verified that Joint Decision Making has a positive effect on operational performance
(Effendi,2015). The decisions facing contemporary business managers increasingly
require consideration of influences originating both internally and externally to the
organization and beyond even first tier suppliers and customers.Supply chain decision
synchronisation is the driver of collaboration. Collaboration does not mean joint decision-
making but it is important that decisions taken by supply chain members are synchronized
in order to enable a supply chain to respond quickly to any changes or disruption.
Responsiveness is a key output of decision synchronisation and enables supply chains to
be more resilient because of the enhanced response speed. SCM involves supply chain
collaboration, which in turn is founded on long-term and trustworthy relationships (Ou et

39
al., 2010). When stakeholders in the supply chain such as the customers, suppliers and the
firm (whether manufacturing or service) collaborate, they are able to make joint decisions
and share benefits and costs from these decisions (Simatupang & Sridharan, 2005). The
study established decision synchronisation in terms of joint decision, joint planning and
joint resolutions in the dairy processing firms.
Becker T., et al., (2014) on his thesis entitled “Synchronization Measures in Job Shop
Manufacturing Environments”, said Synchronization is quantifiable, observable
phenomenon in logistics systems and in contrast to qualitative approaches. These
qualitative approaches under the term "synchronization" are mainly prevalent in supply
chain management and primarily include advice for managerial activities in the fields of
communication, collaboration, Supply chain information sharing, and supply chain
strategy. The aim of Supply chain decision synchronization is to align partners and to
synchronize decisions on order placement, inventory replenishment and order delivery.
Meanwhile, every partner has its own objectives and goals, so it is sometimes very hard to
come on mutual points that may cause uncertainty. To reduce this uncertainty, supply chain
decision synchronization has become an important strategy for firms today. Operational
coordination is the extent to which firms exchange decision rights, knowledge, and
resources across the supply chain to streamline supply chain activities (Lee and Whang,
2004). It reflects the extent to which a firm coordinates and collaborates with channel
partners to meet customer demands and seek opportunities to automatically execute tasks
(Sanders, 2008). Joint planning activities are very important in achieving collaboration as
these define the inter-organizational processes between the collaborating parties
(Simatupang & Sridharan, 2005). Trust and transparency are important in joint decision
making since it involves an exchange of information as well as sharing of resources and
processes (Biehl & Johnston, 2006; Potocan, 2009). Firms realize they need each other to
make collaborations work, or even survive in the competitive marketplace.
Interdependence refers to more than just accessing and utilizing partner capabilities; rather
organizations make joint decisions or look for synergistic capabilities impossible to
generate alone (Zacharia, Nix & Lusch, 2011). When firms realize they need each other

40
to be successful, operations can be enhanced and specific outcomes will be achieved. The
study established how decision synchronisation influences the performance of dairy
processing firms in kenya.
2.4.3Supply Chain Incentive Alignment and Performance of Dairy Processing
Firms
Slone et al., (2007) described incentive reward in the supply chain. The purpose of
incentives is to encourage and reward supply chain members who support overall supply
chain objectives. However collaboration requires more than just benefit sharing among
supply chain partners. Supply chain incentive alignment has been categorized into three
different types. The first type is reward as motivation to reach assigned targets. The
second is pay for performance. The last is fair sharing of benefit and cost. Supply chain
incentive alignment can be defined as "The degree to which supply chain members share
costs, risks and benefits" Supply chain incentive alignment can also be referred to as
mutually sharing risks and rewards. This sharing is a vital element for collaboration in
long-term relationships. They reiterated thatsupply chain incentive alignment
significantly impacts a supply chain’s operational performance and supported by
(Simatupang and Sridharan, 2005).
An appropriate supply chain incentive alignment in the supply chains is expected to build
trust and commitment between collaborating firms. Moreover, this will also improve
intention of both partners to increase their performance to earn fair rewards. Furthermore,
strong relationships in the supply chain will also be a source of competitive advantage
(Simatupang & Sridharan, 2005).A large empirical literature examines the role of
executive compensation in alleviating agency conflicts between top managers and
shareholders. Much of the empirical research on team-based contract design focuses on
implications of the distribution of pay levels across top executives. The consequences of
pay-level patterns across top executives for firm performance have been examined using
tournament theory (Kale, Reis & Venkateswaran, 2009), social comparison theory
(Henderson and Fredrickson, 2001). Recent theory suggests that firms incorporate

41
synergistic interrelationships among executives into optimal incentive design (Edmans,
Goldstein & Zhu, 2013). The study will establish supply chain incentive alignment process
of sharing costs, risks, and benefits among supply chain partners in the dairy processing
firms.While pay-level patterns are clearly important, a large literature also posits a critical
role for Pay Performance Sensitivities in aligning managerial incentives. To an extent
empirical literature on pay performance sensitivities primarily focuses on the design of
CEO incentives, motivated by a large agency theory literature that views contract design
from the perspective of a single agent in isolation. While this single agent perspective has
provided the basis for many important insights into optimal executive incentive design, it
largely ignores the possibility that boards also view executives as a team and incorporate
synergistic interrelationships among executives into optimal incentive design.
There is constant demand for superior service, increased value and competitive price. This
brings ever greater pressure for efficiency gains and performance improvement. Every
business entity strives to meet the needs of clients and to achieve this it requires an
optimization of entire supply chain. Collaboration in supply chain has been
conceptualized in various ways by researchers, as it can range from very shallow
transactional focused to highly integrated close relations (Goffin, Lemke & Szwejczewski,
2006); from collaborative communication to supplier development. The core message of
SCM is that companies in a supply chain will create a collaborative atmosphere which
will lead to more integrated supply chains where independent companies together act as
one single entity. Actions and strategic decisions in the supply chain when managed by
demand from end customers finally have a crucial impact on how successful the supply
chain members will be. A supply chain works well if its firm’s incentives are aligned i.e.
if the risks, costs and rewards of doing business are distributed fairly across the network.
If incentives aren’t in line the dairy processing firm will not optimize the supply chains’
performance, therefore the whole supply chain partners are supposed to be interlinked.
Selviaridis and Spring (2018) posit an effective supply chain strategy aligns a firm’s
performance priorities and objectives, and those of its suppliers, with the requirements of
clients. This view of alignment is arguably the defining concept of supply chain

42
management: they noted that if firms in a supply chain are aligned in achieving the end
customer’s requirements, then this benefits the supply chain as a whole, as it can improve
performance and hence competitive advantage of the organisation. Alignment is achieved
through inter-organisational relationships, which are governed by a combination of formal
contracts and relational norms (e.g. trust). These underpin more specific alignment
practices, including information sharing, increasing levels of integration and collaboration
and the design of compatible performance measures. To achieve the latter, firms must
define and jointly prioritise objectives to reflect supply chain performance requirements.
They must also align their own incentive systems with objectives, by designing payment
mechanisms for their suppliers that reward success or penalise failure (i.e., pay-for-
performance), and enable sharing of related gains and risks. Such mechanisms are
embodied in contracts, which have typically been seen as safeguarding tools that protect
against opportunism; increasingly however, contracts are also seen as enablers of inter-
firm coordination and alignment (Schepker et al., 2014). Firms in the supply chain may
simply not know how to achievethe ideal outcomes of the perfectly aligned supply
chain,orthey may not want to because of their diverging priorities and interests. Dairy
processing firms should try to align incentives with their key players. Supply chain
incentive alignment is key to performance of firms.
Dairy processing firms in Kenya have had little reward to their owners and employees
interms of output and revenue. The few studies done in the industry underscore full
potential of the dairy processing firms in Kenya; hence the need to research further on the
industry and explore all the conceptual constructs in the current study.
2.4.4 Supply Chain Teamwork and Performance of Dairy Processing Firms
A team is no longer a group of people working in the same area, using the same
equipment, dealing with the same clients within the same location. Nowdays a team is
compised of people from different organisations, located around the globe with a high
degree of interdependace geared toward the accomplishment of mutual goals. Supply
chain teamworkapproach goes beyond individual accomplishments (Waweru,

43
2018).Supply chain teamworkis a joint action regarded as akey contributor to performance
as it provides the means through which team players are able to integrate a multitude of
expertise required for successful completion of a project (Mendelson, 2008). Supply chain
teamworkis not only applied in manufacturing, but also in management and service
oriented activities. The team players in this study included producers (Dairy farmers),
transporters of fresh dairy milk, the stakeholders of cooler sheds, the milk processing
firms, the supermarkets and chain stores and customers of dairy milk
products.Teamleaders need to ensure that they align the strengths of individuals with
effective Supply chain team work and a focus on meaningful results.A team is a collection
of individuals, who highly communicate, directing their energies towards a known defined
goal, which is achieved through their joint complementary efforts, for the benefit of all.
Nobody is perfect but a team can be. According to Omid and Mehdi (2016),Supply chain
teamworkis critical in the attainment of project objectives in that the responsibility of
implementing various activities rests with project team members. In this study every team
member be it dairy milk suppliers, dairy farmers, milk collectors or coolers, milk
transporters, processing firms and retailers who are in touch of clientsnot only work to
ensure tasks are completed but also ensure that they do not let down collaborative spirit
as it has significant effect on the performance of dairy processing firms .Cohon and Bailey
(2017) showed that 85% of large organisations especially those with large number of
employees have embraced teamwork. Commitment of each team member towards a
common purpose in a team is very crucial. Also studies have shown that employees learn
best from tasks that are carried out in a social manner (Waweru, 2018).
According to Kerznerand Saladis (2013), there are challenges that can impede team spirit,
these include; poor communication channels, low motivation to workers, unclear targets
and poor project control. According to Waweru (2018), Supply chain team work support
employee exchange of ideas; sharing of work experiences; networking; information
dissemination and sharing; partnership among employees; closeness between employees
and managers; working on joint tasks and sharing of ideas have positive impact on supply
chain team performance. The impacts of such collaborative activities on inter-firm trust,

44
found in the case studies, concur with the findings in the literature (Min et al., 2005). Joint
activities could give rise to inter-partner trust in the supply chain. Firms that make
dedicated investment in systems, equipment and human resources can build and maintain
higher levels of inter-firm trust. Commitment builds inter-firm trust embedded in the
relationship provides a foundation for the collaborating firms to make a commitment to
their supply chain partners. In supply chain relationships, Supply chain teamworkbetween
supply chain partners is hardly established without trust.A supply chain network is
composed of independent actors who attempt to achieve individual objectives. It is often
that the decisions taken by an actor affect the performance of other participants in the
network (Moldoveanu & Baum, 2011). These typical interactions among independent
firms require coordination and alignment of their decision making processes. Participating
members who combine their heterogeneous competencies seek to create collaborative
advantages which benefit all members in the long run (Kotzab et al., 2011). Entering into
a collaborative relationship is often radical and can lead to a leadership with different
directions and capabilities. The companies that establish themselves as dominant players
in a supply chain network will often have strong influences on others to streamline supply
chain operations that can deliver excellent customer service levels. They also have
flexibility to standardize value added processes with lower costs and higher
responsiveness. Testimonies from previous studies have shown the success of
collaboration among Dell, Zara, Hewlett-Packard, Procter and Gamble, and Walmart in
creating a superior performance.
2.4.5 Dairy Board Policies and Regulations
Eeconomic Recovery Strategy of 2003–2007 identified the agricultural sector as key pillar
to reviving economic growth in Kenya. This led to the articulation of the sector-wide
Strategy for Revitalizing Agriculture (SRA, 2004-2014). Agricultural Sector
Development Strategy (ASDS 2008-2020) was developed in 2008 and vision of
Agricultural Sector Development Strategy 2008-2020 was to make Kenya a food-secure
and prosperous nation. The mission was to encourage innovative and commercially
oriented agriculture.SRA envisaged evolution of a globally and regionally competitive

45
agricultural sector through producers accessing quality inputs and services. However,
quality inputs and services can only be attained if stakeholders play their roles effectively.
SRA envisages government role as being limited to making policy. It emphasizes
separation of policy-making, regulation, commercial functions and service delivery.
These principles have major implications for the roles and functions of institutions in
various stages of the dairy industry development and value chain. In addition, the National
Livestock Policy (NLP 2008) provides an overarching policy framework for the entire
livestock sector, including the dairy industry. The new policy articulates and applies these
principles to different segments of the dairy industry.The focus of this policy is to create
the necessary framework, institutions and appropriate relationships for an efficient dairy
industry. The anticipated growth can only be achieved if proper marketing channel are
established and they are properly managed. Processing of long shelf life dairy products
provide an opportunity for marketing the surplus milk, therefore; there is need to promote
exportation of dairy milk and milk products in the region and even beyond(G.O.K, 2013).
The new policy also articulated Dairy Research issuesin place to solve the problem of
Underutilization of the existing dairy research capacity. The policy constraints were: Poor
prioritization of research agenda, Inadequate funding for dairy research, Lack of
comprehensive approach to disseminating available research findings andlack of research
focus on areas of the dairy industry. Moreover, research has rarely been client based.
However the proposed policy intervention were: The government to facilitate the
strengthening of research- extension-client linkage, feedback mechanisms and
institutionalize dairy research priority setting mechanisms; Restore and strengthen dairy
research to address issues of responsiveness and efficient technology development and
transfer. Prioritized research areas will include dairy product development, milk
packaging and dairy standards; Accelerate the formation of a Kenya Livestock Research
Institute; Increase budgetary allocation for livestock research; Enhance commercialization
of research products, including contracts and royalties for sustainability; Expand and
diversify sources of dairy research funds. The KDB has been instrumental in promotion,
co-ordination, lobbying, trade negotiations, formulation of dairy policy, regulatory and

46
inspectorate services for the dairy sector, research and development of private enterprise.
The activities coordinated by KDB have improved producer price of milk, lowered
consumer price and increased milk intake by the processors. However, there is need for a
clear separation of regulatory and developmental roles of KDB for the benefit of the
industry (G.O.K, 2013).Milk packaging is a critical component in milk marketing and
quality control, however; the conventional milk packaging materials are costly resulting
in high and unaffordable prices of packaged milk. As a result, there is a tendency to
package milk in non-food grade materials that are unhygienic and environmentally
unfriendly. Moreover, there has been a shift from packaged milk to unpackaged milk in
response to demands of low priced milk by the low-income groups. This has prompted
health and safety concerns that need to be addressed. To support and promote local milk
processing, the dairy cooperatives and private sector operators will continue to benefit
from tax rebates on new investments. This will includes review of recently introduced
value added tax on inputs (VAT Bill 2013) in addition to zero rating of milk processing
inputs. To address the milk packaging problem, priority areas of emphasis will be on
promotion of the development and adoption of cost effective milk packaging that is of
acceptable standards. Health and milk safety issues will be addressed through value chain
approach in addition to mainstreaming environmental issues. The government will also
explore ways and means of encouraging local initiatives and use of locally available
materials in milk packaging mainly through industrial research. Apart from developing
innovative ways of reducing processing costs, dairy processors must actively involve
producers in the collection of milk from the rural areas. In addition, producer prices based
on differences in quantities and quality of milk delivered by a given client (e.g. quantity
premiums) will be encouraged. Such quantity premiums will encourage large groups or
co-operative societies’ participation in dairy marketing in addition to improved breeding
practices.
While the Government has been able to ensure proper hygiene and quality control and
assurance for milk products in large-scale marketing enterprises, such assurance for dairy
products handled through informal marketing channels has been elusive. Milk testing and

47
quality control systems are critical components for the successful development of a
competitive dairy value chain. The high cost of milk testing equipment, lack of proper
skills on the use of this equipment, in adequate pre- harvest and post-harvest quality
management systems and institutional inefficiencies are also major hindrance to total
quality control and assurance in the dairy value chain. Consequently, priority measures
will be introduced to ensure that dairy producers, processors and manufacturers have put
in place quality control and assurance systems that conform to international standards.
Such measures will include animal feed and input quality control, provision of incentives
for milk testing equipment procurement and installation, stakeholder sensitisation on the
importance of safe use of antibiotics and other veterinary drugs, milk testing training and
strict enforcement of quality standards. Moreover, the relevant institutions will be
supported with the appropriate legal framework to enforce quality management along the
dairy value chain (G.O.K, 2013). Dairy farmers’ dependence on rain fed dairy production
often leads to milk surpluses during the wet seasons and severe shortages during dry
seasons. This leads to the wide variations in domestic milk supply over the years. This
phenomenon demands serious attention so that the country can stabilise the supply of milk
both for domestic and export market. In this regard, processors will be encouraged to offer
premium prices during dry seasons. The priority areas include promoting processing of
long-life milk products. Other areas are ensuring that dairy products are stocked in the
national food strategic reserves.
2.4.6 Performance of Dairy Processing Firms in Kenya
Performance measure is an indicator that establishes how well an organization
accomplishes its goals; it may include market orientation, customer satisfaction, financial
performan etc. Performance has been measured in numerous methods like firm
performance, operational performance and financial performance. However, it has been
established that competition is no more among organizations but among supply chains.
Thus, to compete globally, it is essential to include all members and performance should
be measured on supply chain level. An organization with better supply chain can keep the
business smooth, efficient and effective (Basu, et al, 2017). In order to achieve efficiency

48
and effectiveness managers must establish a complete supply chain approaches. There are
various approaches that positively affect the performance, the most effective if considered
is supply chain collaboration. In the 1950’s, organization performance was defined as the
extent to which organizations, viewed as a social framework, fulfilled their objectives
since its evaluation was focused on people, work and organizational structure (Jack et al,
2008). Later in the 1960’s and 1970’s, performance was described as an organization’s
ability to exploit its environment for acquiring and using limited resources since
organizations began to explore new ways to evaluate their performance and therefore
greater emphasis was employed into mass production so that manufacturers could
minimize their costs. Performance of the firm can be measured in several ways. According
to Chen and Paulraj (2004), a firm’s performance can be measured in terms of financial
performance and operational performance. Firm performance can be also viewed as
service effectiveness and cost effectiveness (Richey et al., 2010). A comprehensive review
revealed that for the good performance measure all the members should be considered.
Performance measure should consider both financial and non-financial items, all the levels
of supply chain must be considered and all process of supply chain should be included.
In Dairy Processing Firms , the performance was measured by market share (non-
financial)client satisfaction, and profitability (financial) and competive advantage.Jones
and Oliver (2006) posit that organizations in all sectors have a common need to manage
their business needs efficiently and effectively in line with their stated business objectives.
Effectiveness is measured by the extent to which stakeholders or customers‟ requirements
are met over time; while efficiency is measured in terms of how economically the
organization’s resources are utilized in providing a given level of stakeholder/customer
satisfaction. The key aspects of performance of Dairy Processing Firms include market
share, profitability and client satisfaction and existed constant demand for this aspects.
This brings ever greater pressure for milk processing firm’s performance and every firm
strives to meet the needs of customer and to achieve this it requires collaboration of the
entire supply chain.The dairy subsector is dynamic and occupies an important place in the
agricultural economy of Kenya as milk consumption levels in the country are among the
highest in the developing world which aids in contributing to an estimated 14% of

49
agricultural Gross Domestic Product (GDP) and approximately 4% of overall Kenya’s
national GDP (KDB, 2014). Also significant is the fact that Kenya is the second largest
dairy producer and consumer in Sub- Sahara Africa and is relatively self-reliant where it
is dominated by various dairy industries and a high number of smaller and medium
processors leading to very stiff competition (Dairy Report, 2016). Milk production has
grown at an average of 5.3% increasing from 3.2 billion litres in 2003 to 5.2 billion litres
in 2013 while volumes of value added and process sed milk has grown by an average 7%
per annum increasing from 197 million litres in 2003 to 523 million litres in 2013 (USAID,
2010).
Before independence, dairy was largely a preserve of large scale white settler farmers and
was export oriented. To ensure smooth development in the dairy industry, the Kenya Dairy
Board was established through an Act of Parliament in 1958, under the Dairy Industry Act
Cap 336 of the laws of Kenya with the overall objective of regulating the industry. After
independence, government policy focused mainly on including indigenous Kenyan
smallholders in production and marketing with highly subsidized interventions by the
government which has made small holder dairy farmers dominate the industry at
production level (Dairy Report, 2011). The liberalization of the marketing of milk in
Kenya in 1992, saw the entrance of a number of private milk processors and marketers
including the advent growth of the informal sector (Ngigi 2004). Other milk marketing
channels include co-operative societies and farmers’ group, informal traders, distributors
and retailers while consumers are the major players who have an important influence on
how the other players perform. Liberalization has since brought a lot of dynamism of the
dairy market and institutions where there is stiff competition in the milk processing sector
and therefore there is need to continually measure organizational performance so as to
effectively and efficiently operate in the market (Waema, 2013).The Kenya dairy farming
sub-sector is one of the most vibrant in East Africa and it has the highest milk per capita
availability and consumption (Ngigi, 2004).Kenyans including people from Mirangine
and Mauche are amongst the highest milk consumers in the developing world, consuming
an estimated 145 litres per person per year, more than five times milk consumption in

50
other East African countries. The good market prices resulted from the liberalization of
the dairy sector (Ngigi, 2004).
According to the report by Setpro Consult Ltd entitled “Kenya Market-led Dairy Program,
an inventory study of milk processors in kenya” , the Kenya’s dairy industry is private
sector driven and is the largest agricultural sub-sector which contributes 4% to GDP
(KDB, 2012). The sector is dynamic with high growth figures of marketed milk and
investments by dairy societies and processors mainly in the cold chain, production of long
life milk and milk powder. About 80% of Kenya’s total milk production per capita is 5
billion litres is produced on small scale farms. In the broader context of food security,
KMDP acknowledges the need for more efficient and competitive (dairy) value chains, to
assure enhanced access for consumers with lower income to safe and affordable milk
products. However, it poses huge challenges to the industry in terms of cost of production,
collection and cooling, seasonal fluctuations in supply, and the quality of raw milk. There
is however a fast growing number of medium-scale farmers/investors who invest in
modern and commercial dairy production. Currently the sector provides food, income and
employment for approx. 1.8 million people across the dairy value chain: farmers,
transporters, traders and vendors, employees of dairy societies, milk processors, input
suppliers and service providers, retailers and distributors. In terms of nutrition and food
security, almost all Kenyans consume milk on a daily basis with an average per capita
milk consumption of 115 litres per year (KDB, 2012).
A report by the Food and Agriculture Organisation (FAO) entitled “Dairy Development
in Kenya” (2012), cited that there are approximately 252 dairy cooperatives in Kenya.
One of the core functions of cooperatives in Kenya include marketing of members’
produce and over 76% of dairy produce is marketed through cooperatives, and facilitating
production through training, input supply, provision of financial services and milk
collection and bulking. The Kenyan dairy industry has grown tremendously since its
liberalization which has led to a rapid growth of the informal milk trade that mainly
consists of small scale operators dealing in marketing of raw milk. At that time, there was
an emergence of institutional arrangements in milk collection, processing and marketing,

51
which included hawkers, brokers, self-help groups, neighbors and business establishments
like hotels (Karanja, 2003). The informal markets controls an estimated 70 percent of the
total milk marketed in Kenya (Government of Kenya, 2016).
Until the 1990s, the Kenya Creameries Corporation processed all the milk in Kenya, but
its monopoly slowly decreased between 1993 and 1996 (Olok-Asobasi & Sserunjogi,
2001). Many private processors have joined the dairy business since 1992, and have
increased greatly since 1999. According to the industry statistics by the Kenya Dairy
Board (2012), there were an estimated 30 processors, 64 mini dairies, 78 cottage and 1138
milk bars. Investigating the influence of SCC on performance of Dairy Processing Firms
in kenya delivers practical value to managers by seeking methods to increase supply chain
collaboration success, identifying mediating effect of the regulatory play on milk
processing firm. Kenya is one of the largest producers of milk in Africa. According to e-
dairy project (2011) large-scale dairy farming accounts for 20 per cent of national milk
production and small scale farming 80 per cent. There is need for collaboration between
supply chain partners in order to eliminate inefficiencies and lower production and
processing costs, while simultaneously increasing milk quality from farm to consumer to
meet acceptable domestic and international standards that hinder business performance
both locally and in the regional market. In Kenya, SNV is implementing the Kenya
Market-led Dairy Programme (KMDP) that seeks to work with industry stakeholders and
value chain players towards the development of a vibrant dairy sub-sector, with
beneficiaries across the value chain. KMDP is a 4.5 year programme funded by the
Embassy of the Kingdom of the Netherlands and is implemented by SNV in collaboration
with stakeholders in the industry. The study noted that the sector faces a number of
challenges which this study tried to establish.
In 2012, milk consumption in Kenya was about 4 billion liters. The consumption is
estimated to rise by 3 to 4% annually driven by increases in population, urbanization and
income. It is anticipated that by the year 2018, the consumption will rise to 4.7 billion
litres. Currently, it is estimated that the annual per capita milk consumption is 120 litres.
This is below the recommended annual per capita milk consumption is 220 litres (FAO),

52
therefore; milk consumption should be promoted in Kenya. Kenya produces about 5.2
billion litres of milk annually. Milk production is projected to grow by 4.5 to 5 % annually
for the next ten years and it is envisaged to increase to about 12 billion litres by the year
2030. This is a clear indication of the dairy production potential in Kenya (G.O.K,2013)
2.5 Critique of Existing Literature
From empirical studies and theories the measures of SCC and performance of the firm
varied and it will be difficult to utilizing one theory because they have been found to work
better when matched. TCE theory frequently discussed in relation to supply chain
collaboration, transaction costs are generally considered as a mediator of supply chain
collaboration, but they are rarely included in empirical studies explicitly. Apart from TCE
there are other alternative theories which can be used to conceptualize supply chain
relationship such as principal agency theory, Social Exchange Theory (SET) and Resource
Dependency Theory (RDT).
There is constant demand for superior service, increased value and competitive price. This
brings ever greater pressure for efficiency gains and performance improvement.
Collaboration in supply chain has been conceptualized in various ways by researchers, as
it can range from very shallow transactional focused to highly integrated close relations
(Goffin, Lemke & Szwejczewski, 2006); from collaborative communication to supplier
development ( Oh &Rhee, 2008) or from inward facing to outward facing (Frohlich &
Westbrook, 2001).
2.6 Research Gaps
Studies examining the effects of supply chain collaboration on a firm’s performance have
shown inconsistent results (Ha et al., 2011).In Kenya and specifically Tranz-Nzoia
County; little has been done to address the challenges facing milk processing firms while
embracing supply chain collaboration. While scholarly research has been done in the area,
recent articles have called for more research, highlighting the importance of supply chain

53
collaboration to the business community (Daugherty, 2011). Against this background
dairy processing firms canenhance their performance through supply chain
collaboration.However, earlier study on SCC has paid little attention to conceptualizing
prominent collaborative practices that help the chain members to understand performance
drivers. Little has been done on influence of supply chain collaboration on performance
of milk processing firm in Kenya. This is a serious omission considering that the dairy
industry contributes substantial amount to the economy of the country. Supply chain
collaboration when understood better on how it affects the milk processing firms
performance would guide in decision making based on well documented and informed
evidence. This study seeks to shade more light on the need of dairy processing firms and
other milk processing firms embracing supply chain collaboration to enhance their
performance.
While scholarly research has been done in the area, recent articles have called for more
research, highlighting the importance of supply chain collaboration to the business
community (Daugherty, 2011). In addition, the research studies on the collaboration in the
context of supply chain are still sparse. Little has been done on the influence of supply
chain collaboration on performance of dairy processing firmsin kenya. This is a serious
omission considering that the dairy industry contributes substantial amount to the
economy of the country and therefore, worth investigating. Supply chain collaboration
when understood better on how it influences the milk performance of dairy processing
firmswill guide in decision making based on well documented and informed evidence.
The current study seeks to shade more light on the need of dairy processing firms and
other dairy processing firms embracing supply chain collaboration. A recent survey
conducted by Supply Chain Management Review and Computer Science Corporation
(SCMR and CSC, 2004) observes that collaboration is cited as the single most pressing
issue; but how to achieve it is not well understood. Studies examining the effects of SCC
on performance of dairy processing firms have also shown inconsistent results (Ha et al.,
2011).

54
2.7 Summary
This chapter has reviewed literature on influence of supply chain collaboration
performance of Dairy Processing Firms in general. The first section
inliteraturewastheoretical framework specifically, Resource Based View theory,
Transactions Economic, Collaborative Network Theory and Strategy-Structure Theory
theory. They were all linked to study variables. The Conception framework was visualized
and illustrated to show the relationship of variables.
Review of variables was done starting with independent variable, then mediating variable
and finally dependent variable. Independent variable wereSupply chain information
sharing, Decision Synchronization, Supply chain Supply chain incentive alignment and
teamwork. The mediating variable was dairy board policies and regulations. Finally
category was the dependent variable which was performance of of Dairy Processing
Firms. For all literate reviewed, there was linkage to expound on the relationships.
Empirical works was done and the researcher linked other scholars works with the current
study. Critique of existing was done on the theories in order to make informed discussion.
From the literature reviewed, it is evident that most of the research was done in other
countries and little has been in Kenya. Moreover, research on the influence of supply chain
collaboration on performance of Dairy Processing Firms has little documentary evidence
globally.
The study reviewed general literature regarding the key concepts of supply chain
collaboration and performance of dairy processing firms as well as empirical literature
specific variables were supply chain information sharing,supply chain decision
sychronisation, supply chain incentive alignment and supply chain teamwork. More so on
mediatin variable in terms of policies and regulation mediating effects on the relationship
betwee supply chain collaboration and performance of dairy processing firms. The review
clearly outlined that the noted supply chain collaboration are crucial on performance of
dairy processing firms in kenya. The review however revealed that the dairy processing
firmshad little empirical evidence in kenya. Moreover, the review revealed that the

55
descriptive research design dominates in most studies. The present study therefore sought
to fill the gap left by by using the mixed methods approach.

56
CHAPTER THREE
RESEARCH METHODOLOGY
3.1 Introduction
This chapter highlighted the methodology used to undertake research. The following
subtopics were highlighted: research design, target population, sampling frame, sampling
and sampling technique, data collection instruments and procedure, pilot-testing, and data
analysis and presentation,
3.2 Research Design
Research design is a plan outlining collection, measurement analysis that effectively and
efficiently enables research operations to be done with ease (Kothari & Gard, 2014). The
study adopted a mixed research design which covered qualitative (descriptive) and
quantitative research design in this regard qualitative research design applied to qualitative
data in analysis of interviewed data however quantitative research design was applied on
quantitative data on the questionnaires. Combining qualitative and quantitative methods
help to cross validate results of a paticular method (Batenburg, 2007). The inclusion of
qualitative methods in this study is to aid some processes and provide depth to the
research. The approach helped the researcher answer questions that were not answered
using qualitative or quantitative methods alone. It provided a more complete picture by
noting trends and generalisations as well as in-depth knowledge of participants’
perspectives.Moteover, mixed method research design was chosen because the research
hypotheses are best answered by both qualitative and quantitative data. This study
collected primary data by use of questionnaires and interviews were done to compare
results of the questionnaire information. Results from qualitative research method were
used to enhance, elaborate or clarify results from quantitative research method. Questions
of frequency may best be explored by quantitative methods, and perception and opinion
by qualitative. The questions dealt with both of these, and hence mixed methods were

57
preferred. This “mixing” or blending of data provides a stronger understanding of the
problem or question than either by itself. The mixed research design that consist both
qualitative and quantitative approaches allows researcher to collect information from the
people on their habits, opinions, attitudes and any other educational or social issues.
Creswell (2013) showed that both forms of data provide different types of information.
Each type of data collection has both limitations and strengths that can be combined to
develop a stronger understanding of the research problem or questions (and, as well,
overcome the limitations of each).
Qualitative data was collected from supply chain practitioners who provided information
on influence of Supply chain collaboration on performance of firm. The practitioners are
key informants on Supply Chain Collaboration of the firm. The researcher explored in
depth information on the area of interest. A semi structured interview method was used
to collect the data. The questions were relevant to the study and questions were mainly
open ended. The study also utilized correlational design where it indicated how one
variable factor or attributes varies in relationship to another (Mugenda,2008). Basically
was to ascertain the relationship among the variables.
3.3Target Population
Table 3.1shows the study target population for the current study. The target population
represents all casesof people or organizations which possess certain characteristics; it is
the large rgroup from which a sample is taken (Mugenda, 2008). A population can be
defined as including all people or items with the characteristic that a researcher wishes to
understand. The target population for the study was the dairy processing firms operating
in Transnzoia county. This target comprised of fresh milk suppliers to KCC processing
plant and customers of buying processed milk products of KCC at Nakumatt supermarket.
The study targeted 10,488 dairy farmers supplying to KCC and 13,906 customers buying
processed milk products. According to KCC Food Policy (2016), 80.3 percent of milk
intake is supplied by large and small groups while 25 percent supplied directly by
individual farmers. The largest and most important suppliers are individual farmers, and

58
small holder farmers. Nakumatt retailers’ monthly sales records of (2016) showed that the
products bought vary in quantity. This is a replica of the buying trends of processed milk
products. The study used customer’s frequency data for the most preferred KCC products:
KCC Fresh UHT milk TCA, Gold Crown Milk Whole TFA, Fresh milk TFA and Mala.
Table 3.1: Target Population
Category Target population
Suppliers 10,488
Customers 13,906
3.4 Sampling Frame
Table 3.2 and 3.3 shows suppliers and customers’ distribution of sample across target
Population. According to Orodho (2005) a sampling frame is a list of all those within
population who can be sampled. The sample frame comprised of farmers supplying milk
to of Dairy Processing Firms factories and customers of processed milk products buying
at Nakumatt supermarket. Stratified random sampling was used to select farmers and
customers who participated in the study. Stratified random sampling is a modification of
simple random in which you divide the population in to two or more relevant and
significant strata based on one or a number of attributes (Saunders, Lewis & Thornhill,
2019). The proportional distribution of suppliers and customers in the population was
retained in the sample. The following is a distribution of samples across the target
population. The choice of the cases was because of their contributions to the firms’ daily
intake and the customers’ frequency visits to by the varied fresh milk products.

59
Table 3.2: Suppliers Distribution of Sample across Target Population
Suppliers Target population Percentage Distribution
Large , Medium and small
scale groups
3457 33 127
Large scale, small individual
farmers
7031 67 257
Total 10,488 100 384
Table 3.3: Customers Distribution of Sample across target population
Item Description Customers Quantity Percentage Distribution
Fresh UHT Milk 2010 14 54
Gold Crown Milk Whole 2200 16 61
Fresh Milk TFA
Mala
4654
5042
34
36
131
138
Total 13,906 100 384
3.5Sample size and Sampling Technique
The following formula was adopted from (Mugenda, 2008) to determine the sample size:
𝑁 = 𝑍2 𝑝𝑞
𝑑2
Where:
N = the desired sample size if the target population is greater than 10,000
Z = the standard normal deviate at the required confidence level.

60
p = the proportion in the target population estimated to have characteristics (assume 50%
if unknown)
q = 1-p.
d = the level of statistical significance set or Alpha
There is no estimate available of the proportion in the target population assumed to have
the characteristics of interest; the 50% was used as recommended by Fisher et al.,
Therefore with the proportion of the target population being .50, then the z- statistics is
1.96. Consequently, the sample size was;
𝑛 = (1.96)2(0.50)(1 − 0.50)
(0.05)2 = 384
3.6 Data CollectionsMethods
For this study, questionnaire was the main tool used to collect data. The use of
questionnaires was preferred as it ensured confidentiality is upheld, save on time, and easy
to administer (Mugenda, 2008). The questionnaire as a tool of data collection is ideal
because the researcher will be able to collect information from a large sample. It also gives
a greater feeling of anonymity hence encouraging open responses to sensitive questions
and free from biasness and so accurate and valid data can be gathered. The questionnaire
was structured using the Likert format with the five-point response scale. In this Likert
scale type of questionnaire, the respondents were given five choices. Respondents were
asked to give an indication of processing firm performance levels in connection with SCC
employing a five-point Likert rating scale from “strongly agree” to “strongly disagree”
with “Neutral” as the midpoint (Appendix I and II).

61
The researcher interviewed supply chain participants on individual basis to gather more
in-depth information (Appendix III). Participants were; Field Service Officer, Regional
Sales Manager, Quality Assurance Officer, and Factory Manager. Interviews provided a
robust opportunity to learn more about influence of supply chain collaboration on
performance of of Dairy Processing Firmsalong with providing the opportunity to explore
what makes collaboration necessary and more successful. A number of data quality issues
identified in relation to the use of semi-structured relate to reliability, forms of bias and
validity and generalizability/external validity.
3.7 Data Collection Procedure
Data Collection Procedure was followed when administering the research instrument. The
questionnaires were administered on „drop and pick later‟ method. Follow up and
reminders were done through telephone calls and visits. This facilitated replication and
testing the findings to evaluate reliability. The questionnaire was group-administered in
the milk collection centres and customers were requested to fill when they visited the
supermarket and buy processed milk products. The questionnaire introduced why the
researcher wants the respondents to complete the survey and had instructions on how to
respond to the questionnaire. A structured interview followed with open ended questions
being asked and follow up determined based on the provided answers. Qualitative
interview elicited information about SCC. One to one face to face interview was preferred
to collect data. The questions elaborated on how to enhance dairy processing firms
performancein all study variables.
3.7.1 Field Observation
It is argued that all social research is a form of participant observation, because it is not
possible to study the social world without being a part of it (Cohen et al, 2002). It is also
assumed that human-as-instrument is the way to answer the complexity of a problem, and
this is to be achieved by ‘indwelling’ within these complexities. They asserted that such
beliefs enable the researcher to understand the context of incidents, to be open-ended and

62
inductive, to see things that might otherwise be unconsciously missed, to discover areas
that participants might not feel free to talk about in interview situations, and to move
beyond perception-based data. Observation has been a consistent part throughout the
whole research period.
From the beginning of the data collection process the study looked for information and
incidents that could improve the understanding of issues related to the cases. This was
more evident as the study visited the supplier’s collection centers to get an insight into
their practice. The day-to-day activities were observed during the specified days and notes
recorded into a research diary. Many incidences were observed that indicated how the of
Dairy Processing Firmsapproached and dealt with their suppliers and customers.
Customers we observed when they enter supermarket to establish the priority of milk
products
3.7.2 Interview Method
Qualitative interview elicited information about influence of SCC on performance of of
Dairy Processing Firms. One to one face to face interview was recommended to explore
in depth on the area you are interested (Saunders, Lewis & Thornhill, 2019). The
researchers interviewed participants on an individual basis to gather more in-depth
information (Appendix 2). The questions covered the effect of Supply chain information
sharing, decision synchronization, incentive alignment, Supply chain teamworkand
mediating effect of relationship between supply chain collaboration and performance of
dairy processing firms. For purposes of completeness of information gathered, the
researcher conducted face to face interviews with supply chain practitioners.
3.8 PilotStudy
According to Orodho (2005) a pilot test is necessary for testing the reliability of data
collection instruments. Pilot study is thus conducted to test the weakness in design and
instrumentation to provide proxy data for selection of sample. Reliability refers to the

63
consistency of a measure. A testis considered reliable if the same result is arrived at
repeatedly (Kothari, 2008). The preliminary analysis using a pilot test data was undertaken
to ensure that the data collected enabled the investigative questions to be answered
(Saunders, Lewis & Thornhill, 2019).
Prior to using the questionnaire to collect data, it was pilot tested. The purpose of the pilot
test was to refine the questionnaire so that respondents had no problem in answering the
questions and there was no problem in recording the data. This enabled the researcher to
obtain some assessment of the questions’ validity and the likely reliability of the data that
was collected. Initially the researcher asked an expert to comment on the
representativeness and sustainability of the study questions as well as allowing
suggestions to be made on the structure of the questionnaire, this helped establish content
validity and enable the researcher to make necessary prior to pilot testing with a group as
similar as possible to the final population in the sample. The researcher pilot tested to 20
respondents who were not part of the sample. After that the researcher checked for
completed pilot questionnaire to ensure that respondents hadn’t problems understanding
and answering questions and followed all instructions correctly. Their responses provided
an idea of reliability and suitability of the questions.
3.8.1 Validity of the Research Instrument
Validity is the degree to which research instrument serves the purpose for which it was
constructed; it is the degree to which results obtained from the analysis of the data actually
represents the phenomena under study (Mutai, 2000). The validity of the questionnaire
was determined using various methods, so as to ensure that what is supposed to be
measured and performed is achieved with minimal deviation.
Content validity refers to the extend to which the items on the test are fairly representative
of the entire domain the test seeks to measure. The questionnaire was formulated and
operationalized as per the study variables to ensure adequacy and representativeness of
the items in each variable in relation to the purpose and objectives of the study. Further,

64
content validity was verified through expert opinion from supervisors and practitioners.
The researcher examined what other researchers have coped with the research problem
for a similar secondary data set in a similar context. Other researchers have found
measures suitable then the researcher was more certain that they will be suitable for the
research questions and objectives as supported by (Saunders, Lewis & Thornhill, 2019).
Construct validity is the degree to which, a test measurean intended hypothetical construct
(Mugenda, 2008). Using a panel of experts familiar with the construct is a way in which
this type of validity can be assessed; the experts can examine the items and decide what
the specific item is intended to measure (Kothari, 2008). Construct validity was achieved
through restricting th equestions to the conceptualization of the variables and ensuring that
the indicators of each variable will fall within the same construct.The purpose of this check
is to ensure that each measure adequately assessed the construct it is purported to assess.
Experts undertaking the study (research assistants) were trained on the administration of
the instruments and to enhance construct validity, adequate definitions of measures were
given by operationalization of each objective and also provision of its measuring
scale.Consequently, to achieve a good level of instrument validity, a five-point Likert
scale questionnaire survey was revised after the pilot study. The initial pool of generated
items-by researcher, validated by supervisorswere revised. The objective of this revision
was to ensure that each construct was properly and accurately addressed. The respondents
were requested to provide feedback regarding the clarity of the questions as well as the
organisation, logic, and length of the questionnaire. This helped to refine the instrument.
Based on their feedback, redundant and ambiguous items were modified, eliminated, and
new items were added wherever necessary.
3.8.2 Reliabilityof the Research Instrument
Reliability is the extent to which measurements taken with a particular instrument are
repeatable (Hair et al., 2010). In order to test reliability of the instrument to be used in the
study, the test re-test was used. Test re-test estimates of reliability will be obtained by
correlating data collected with those from the same questionnaire collected under as near

65
equivalent conditions as possible (Saunders, Lewis & Thornhill, 2019). To successfully
evaluate internal consistency and reliability among items within two constructs,
independent runs was done for each of the five constructs using Cronbach’s alpha to test
reliability of the questionnaire. The draft questionnaire was pilot tested. According
Orodho, Abobo and Osero(2014) the reliability of an instrument is the measure of the
degree to which a research instrument yields consistent results or data after repeated trials.
In order to test the reliability of the instrument, the Cronbach alpha test which is a measure
of internal consistency will be used in which closely related sets of items are taken as a
group. The formula for Cronbach alpha is:𝛼 =𝐾�̅�
(1+(𝐾−1)�̅�)
Where K = numbers of indicators or number of items
r̅ = mean inter − indicator correlation.
The value one gets for 𝛼 usually indicates the percentage of the reliable variance. For
instance, if one gets a value of 0.7, it means that 70% of the variance in the scores is
reliable variance, which means that 30% is error variance (Tavakol and Derrick, 2011;
Cronbach, 1951).
3.9 Data Analysisand Presentation
Data analysis involves examining, categorizing, tabulating, testing or otherwise
recombining quatitative and qualitative evidence in order to address the population of the
study.Data Analysis involves actions and methods performed on data that help describe
facts, detect patterns, develop explanations and test hypotheses. It is the process of
systematically applying statistical and logical techniques to describe, illustrate and
evaluate data. Data processing in research is a set of methods that are used to input,
retrieve, verify, store, organize, analyse or interpret a set of data.To confirm if econometric
assumptions that relate to the OLS regression were fulfilled,the study conducted
diagnostic tests for each of the OLS regression models.Non-graphical tests for
homoskedasicity, multicollinearity, narmality and autocorrelation waere comstructed by

66
the study.Robust Standard Errors Technique was used to solve the problem of
heteroskedasticity that was found presenting the OLS regression models.After the
estimation of the OLS regression models for both direct effect and mediating effect,their
results were presented in form of tables to enhance efficiency interpretation.The results
derived from the te estimated OLS regression models were used to test the research
hypothesis of the study.To evaluate the strength of the relationship between the study
variables,the researcher tested hypothesis for both the direct and moderated OLS
regression models.
3.9.1 Quantitative Data Analysis
Quantitative Data was coded, organized to bring the meaning.Analysis of data was done
by the us of both descriptive and inferential statistics.The study used descriptive statistics
analysis to analyse the data so as to meet the objective of establishing the influence of
SCC on the performance of milk processing firms.Regression analysis was used to meet
the the objective of determining the relationship between SCC practices and performance
of milk processing firm.The study applied Statistical Package of Social Scientists (SPPSS)
version 20 to process and analyse the data.Data screening as well as cleaning was done
for the missing values and outliers.Some assumptions of the naormality that include
linearity,homoscedasticity,autocorrection and multicollinearity were also tested.In
determing the benefits of SCC on performance of Dairy Processing Firms,factor analysis
was applied. Qualitative views opinions were discussed simultaneously comparing the
results from quantitative data. This formed the basis for cross checking and comparing the
two sets of data and drawing conclusions of the study. Quantitative data was analyzed
using descriptive and inferential statistical. In addition, a multiple regression models on
the influence of supply chain collaboration versus performance of dairy processing
firmswas applied to examine the relationship between the variables. Inferential data was
done using Pearson Correlation Coefficient and regression analysis through enter method.
The model performance of of dairy processing firmsas the dependent variable and the
independent variables were supply chain information sharing, decision synchronization,
incentive alignment, and teamwork. Mediating variablewas policies and regulations. Prior

67
to measuring the respondents’ response on influence of supply chain collaboration on
performance of Dairy Processing Firms, the research conducted a measure of reliability
and factor analysis. The response on the influence of supply chain collaboration on
performance of of Dairy Processing Firms was measured by computing the indices based
on the responses derived from the Likert- scaled questions. Since percentages are the most
widely used descriptive analysis (Creswell, 2007). SPSS has a descriptive statistics feature
that assists in variable response comparison and gives a clear indication of the response
frequencies. Afterward the study gave a comprehensive summary of the estimated
regression results in tables for easy interpretation of the findings.According to Topal
(2014), a multiple regression model has one dependent and more independent variables.
The following multiple regression models was used to establish the relationship:
Regression models:
Y = β0 + β1X1 + β2X2 + β3X3 + β4X4 + ε .................(i)Without a mediator
Y = β0 + β1X1. Z + β2X2. Z + β3X3. Z + β4X4. Z + ε.............. (ii)With a mediator
Equation ii shows the effect of mediatorZ which is policies and regulations
Where:
Y= Performanceof Dairy Processing Firms (valueof
dependentvariable),
β0, β1, β2, β3, β4, are regression coefficients to be estimated.
Y = Performance of of Dairy Processing Firms
X1 = Supply chain information sharing
X2 = Decision Synchronisation
X3 = Incentive alignment
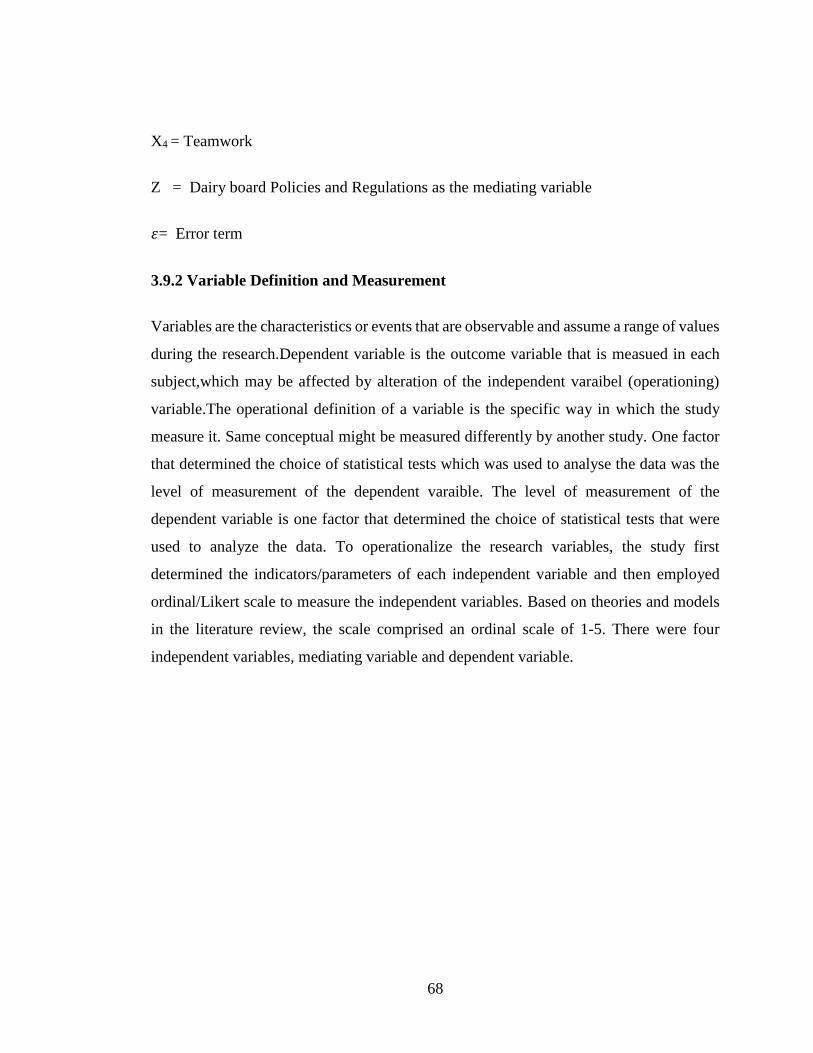
68
X4 = Teamwork
Z = Dairy board Policies and Regulations as the mediating variable
𝜀= Error term
3.9.2 Variable Definition and Measurement
Variables are the characteristics or events that are observable and assume a range of values
during the research.Dependent variable is the outcome variable that is measued in each
subject,which may be affected by alteration of the independent varaibel (operationing)
variable.The operational definition of a variable is the specific way in which the study
measure it. Same conceptual might be measured differently by another study. One factor
that determined the choice of statistical tests which was used to analyse the data was the
level of measurement of the dependent varaible. The level of measurement of the
dependent variable is one factor that determined the choice of statistical tests that were
used to analyze the data. To operationalize the research variables, the study first
determined the indicators/parameters of each independent variable and then employed
ordinal/Likert scale to measure the independent variables. Based on theories and models
in the literature review, the scale comprised an ordinal scale of 1-5. There were four
independent variables, mediating variable and dependent variable.
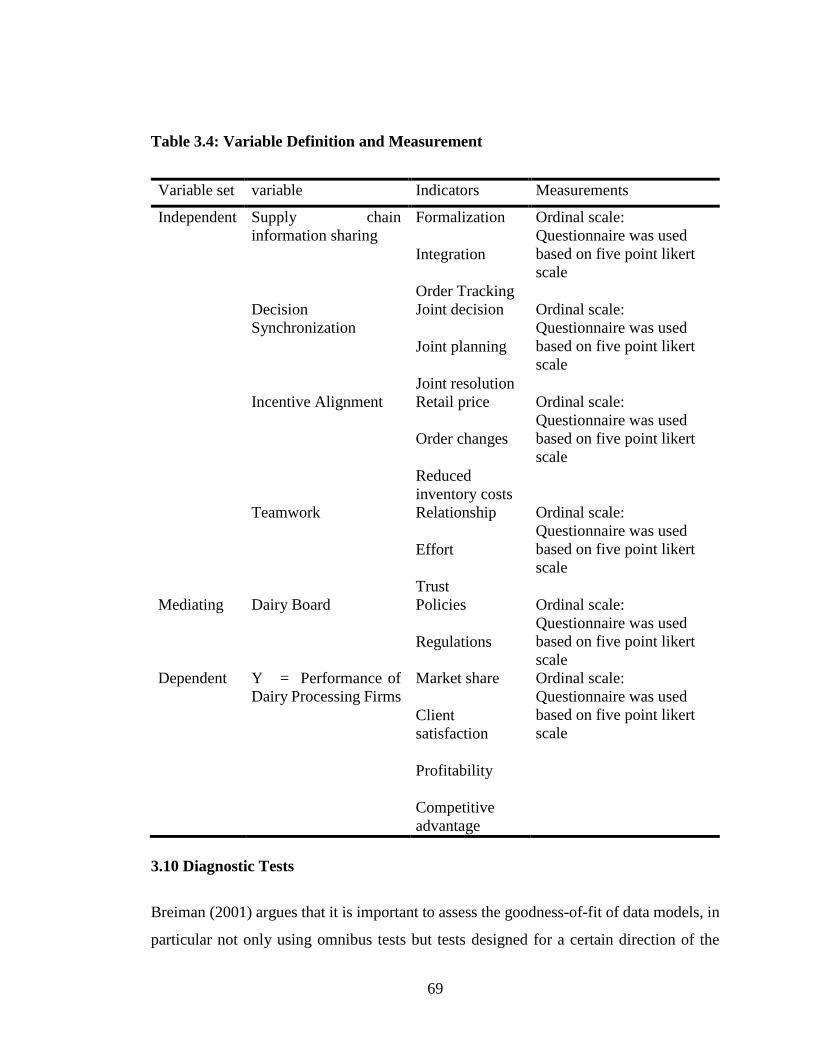
69
Table 3.4: Variable Definition and Measurement
Variable set variable Indicators Measurements
Independent Supply chain
information sharing
Formalization
Integration
Order Tracking
Ordinal scale:
Questionnaire was used
based on five point likert
scale
Decision
Synchronization
Joint decision
Joint planning
Joint resolution
Ordinal scale:
Questionnaire was used
based on five point likert
scale
Incentive Alignment Retail price
Order changes
Reduced
inventory costs
Ordinal scale:
Questionnaire was used
based on five point likert
scale
Teamwork Relationship
Effort
Trust
Ordinal scale:
Questionnaire was used
based on five point likert
scale
Mediating Dairy Board Policies
Regulations
Ordinal scale:
Questionnaire was used
based on five point likert
scale
Dependent Y = Performance of
Dairy Processing Firms
Market share
Client
satisfaction
Profitability
Competitive
advantage
Ordinal scale:
Questionnaire was used
based on five point likert
scale
3.10 Diagnostic Tests
Breiman (2001) argues that it is important to assess the goodness-of-fit of data models, in
particular not only using omnibus tests but tests designed for a certain direction of the

70
alternative. These diagnostic checks do not have to be seen as pure significance procedures
but also as an explorative tool to extract information about the structure of the data,
especially in connection with residual plots or other diagnostic plots.
Diagnostic tests help to verify the data nature as well as aiding to specify the model that
is applicable to the study.This help in ensuring that the regression results are not biased,are
consistent and also efficient.The study embarked on the model estimation,diagnostic tests
of importance were cariied out.Assumptions that relate to the ordinary Least Square (OLS)
panel regression model were checked by the use of diagnostic tests.Linearity,
heteroskedasticity, autocorrection, multicollinearity and normality were tests related to
testing for violation of panel error assumptions. One of the set procedure available for
regression analysis is the regression diagnostic (Oteki, 2018).To ensure that ordinary least
square provide reliable estimates of the parameters, assumptions of linear regression
models (OLS) were validated. Therefore through testing linearity, heteroscedasticity,
autocorrelation, multicollinearity and finally normality,these assumptions were evaluated.
3.10.1 Testing for Linearity
There must be a linear relationship between the outcome variable and the independent
variables. Prior to performing linear regression analysis, researcher tested the data for
linearity to find out whether data that was sampled from a population that relates the
variables of interest was in a linear fashion. Based on the ANOVA, value sig. deviation
from linearity of p-value greater than 0.05 it can be concluded that there is a linear
relationship between the dependent and in independent variables.
3.10.2 Testing for Heteroscedasticity
Heteroskedasticityrefers toregressiondisturbances whosevariances arenotconstant
acrossobservations (Meme,2017).The crucial assumption of classical linear regression
model is that the volatility that has occurred in the model should be uniform in nature
(homoscedasticity). If the assumption is not satisfied by the model, then one would have

71
to consider the model to have been exposed to heteroscedasticity problem. Based on the
Glejser’s test for heteroscedasticity,output sig. coefficients greater than 0.05, it can be
concluded that there is no heterscedasticity problem.
3.10.3 Testing for Autocorrelation
Time-series data often displays autocorrelation or serial correlation of the disturbances
across periods. Serial correlation is problematic to linear panel datamodels because its
presence renders the standard errors biased as well as making theestimated regression
coefficients consistent but inefficient .Therefore,to detect the presence of
autocorrelation, the study opted for the Durbin-Watson Test. The Durbin-Watson statistic
is a test of First Order Autocorrelation between the error and its immediate previous value.
The test aids todetermine whether the errors in different observations are correlated with
each other. The null hypothesis in Durbin-Watson test is that there is no serial correlation.
Another key assumption in regression model is that the error terms are independent of
each other. This study presents a simple test to determine whether there is autocorrelation
(serial correlation), i.e. where there is a (linear) correlation between the error term for one
observation and the next. When auto-correlation is present, it is suspected that t values for
regression parameter's estimates are unduly large making corresponding p-values unduly
small. In other words, in presence of auto-correlation, regression parameter's estimates
may wrongly be interpreted as significant. Durblin- Watson statistic should be between
1.5 and 2.5 and if the rule is true then the data is not auto correlated (Oteki, 2018)
3.10.4 Testing for Multicolinearity
Further to the reliability tests a multi-co linearity test was done to ensure that the accepted
independent variables did not exhibit co linearity amongst themselves. A situation in
which there is a high degree of association between independent variables is said to be a
problem of multi-co linearity which results into large standard errors of the coefficients
associated with the affected variables. According to Mugenda (2008), multi-co linearity

72
can occur in multiple regression models in which some of the independent variables are
significantly correlated among themselves. In a regression model that best fits the data,
independent variables correlate highly with dependent variables but correlate, at most,
minimally with each other. Multi-co linearity is associated with VIF above 5 and tolerance
below 0.2. VIF statistic above 5 is an indicator of multicollinearity and should be removed
from regression models(SPSS, Version 20).
3.10.5 Testing for Normality
Anassumption of the OLSregression model that impacts the validity of all tests is tha
tresiduals behavenormal (Oteki,2018).This study used the Shapiro Wilktest,a non-
graphical test for normality, so as to determine whether residuals behaved normally. The
Kolgomorov-Smirnov test is a non-parametric test that can be used to test the underlying
distribution of a given random variable. This was used to test whether the dependent
variable and independent variables followed a normal distribution. If the P- values are less
than 0.05 at 95% confidence, the study will conclude that the dependent variable and
independent variables follow a normal distributed and hence fitting a linear model to the
data was justified. An assumption of the OLS regression model that impacts the validity
of all tests is that residuals behave normal. This study used the Shapiro Wilk test, a non-
graphical test for normality, so as to determine whether residuals behaved normally. If the
p-value was found greater than 0.05 (p>0.05), the study would fail to reject the null (at
95%) and thereafter conclude that the residuals were normally distributed (Meme, 2017).

73
CHAPTER FOUR
RESEARCH FINDINGS AND DISCUSSION
4.1 Introduction
The chapter presents the findings in terms of response rate, pilot results, reliability
statistics, demographic composition of the study sample, factor analysis, descriptive
analysis of independent and dependent variables, inferential analysis of the relationships
and discussions thereof. Quantitative analysis of suppliers and customer results were
consecutively presented.
4.2 Response Rate
Table 4.5 shows the response rate of respondents. Orodho (2005) defines response rate as
the extent to which the final data sets includes all sample members and is calculated as
the number of respondents with whom interviews are completed and divided by the total
number of respondents in the entire sample including non-respondents. The researcher
distributed a total of 384 questionnaires to suppliers. Out of the 384 questionnaires, 342
from were filled correctly, returned and gave a response rate 89 percent. However for
customers, only 314 were correctly filled, returned and gave a response rate of 82 percent.
The response rate was sufficient to make generalizations. (Mugenda, 2008) reiterated that
a response rate of 50% is adequate for analysis; a rate of 60% is good and a response rate
of 70% and over is excellent. The response rate for the study was considered excellent for
further analysis. The remaining percentage comprised of non-response questionnaire
because they were not available and others were unwilling to participate in the study.
Others were also discarded by researcher because of incomplete answers.

74
Table 4.1: Response Rate
Respondents Questionnaires
Distributed
Questionnaires
Received
%
Response
Suppliers
Customers
384
384
342
314
89
82
4.2.1 Suppliers Response Rate
Table 6shows the suppliers’ response rate of respondents. A sample of 384 suppliers from
category large, medium and small scale groups and large scale, small individual farmers
were selected to participate in the study. Questionnaire was distributed respectively to
them and the actual response and percentages were described. The results revealed that
majority of the actual respondents were from large, small individual farmers with 70
percent while from large, medium and small scale farmers were only 30 percent. Empirical
studies by GOK (2003) showed that about 80 per cent of the milk consumed in the
domestic market is produced by small-scaleproducer. The interview response from supply
chain practitioners of the firm confirmed that the individual farmers delivering milk to the
firm had created a good relationship, trusted and delivers individually to the firm. They
also freely share information when they were requested.

75
Table4.2: Suppliers Response Rate
Suppliers Sampled
Respondents
Actual
Respondents
Percentage
Response
Large , Medium and small scale groups 127 103 30
Large scale, small individual farmers 257 239 70
Total 384 342 100
4.2.2 Customers Response Rate
Table 4.7shows customers’ response rate. The results showed four groups of customers
buying different brands. It reveals that customers who buy mala and Fresh Milk TFA had
highest representation 37 and 36 percent. Gold Crown Milk Whole constituted 19 percent
and UHT 8 percent. The report of KCC (2016) showed high demand of fresh milk
followed by mala. Supermarket list of priority of processed products of Y = Performance
of of Dairy Processing Firms was also used for the study. The highly demanded four in
priority was used for the study.

76
Table 4.3: Customers Response Rate
Item Description Sampled Respondents Actual
Response
Percentage
Fresh UHT Milk 54 26 8.0
Gold Crown Milk Whole 61 61 19
Fresh Milk TFA 131 113 36
Mala 138 114 37
Total 384 314 100
4.3 Pilot Results
4.3.1 Suppliers Pilot Results
Table 4.8 shows the output from pilot analysis.The data was collected, examined for
completeness, coded and analyzed for reliability. Thetable shows the reliability of
statements measuring each individual variable. Twenty questionnaires were distributed
to milk suppliers within Trans-Nzoia. The researcher coded the questionnaire and carried
out reliability analys is using Cronbach Alpha.Reliability is the extent to which a
measurement of an instrument or procedure yields the same result on repeated trials
(Malhotra, 2004). The reliability statistics for objective two (Decision synchronisation)
and three (incentive alignment) were slightly lower compared with other objectives.
The value of items in all variables were the same or nine items for all objectives, As a
standard of reliability, values of coefficient alpha above 0.70 are acceptable, those
above 0.80 to represent good reliability and those above 0.90 to represent
excellent,(Hair et al, 2010). The results showed that all the variables met the threshold
minimum alpha.

77
Table4.4: Suppliers Pilot Results
Reliability statistics No. ofitems Cronbach’s Alpha
Supply chain information sharing 9 0.865
Decision Synchronization 9 0.784
Incentive Alignment
9 0.701
Teamwork 9 0.947
Dairy Board 9 0.841
4.3.2 Customers Pilot Results
Table 4.9 shows the outputfrom pilot analysis. The table shows the reliability of
statements measuringe achindividual variable.Twenty questionnaires were distributed to
customers buying milk products in the supermarket.All questionnaires were filled and
later collected. The researcher coded the questionnaire and carried out reliability analysis
using Cronbach Alpha.The results showed that all the variables met the threshold
minimum alpha.

78
Table 4.5: Customer Pilot Results
Reliability statistics No. of items Cronbach’s Alpha
Supply chain information sharing 9 0.901
Decision Synchronization 8 0.711
Incentive Alignment
7 0.844
Teamwork 9 0.954
Dairy Board 9 0.899
4.4 Reliability Statistics
4.4.1 Reliability Statistics of Suppliers
Table 4.10 shows reliability statistics of suppliers of Dairy Processing Firms. Cronbach’s
Alpha test on reliability showed score of performance of Dairy Processing Firms (10
items), Supply chain information sharing (9 items), Supply chain decision synchronization
(9 items), Supply chain Supply chain incentive alignment (9 items), Supply chain
teamwork(9 items) and Dairy Board (9 items) were tested. Cronbach’s Alpha test on
reliability showed score on items was above the minimum limit of 0.7- 0.8 as
recommended by Field (2013). This indicates internal consistency and reliability of the
scales. He said, “If you are using a factor analyses to validate the questionnaire, it is useful
to check the reliability of your scale”. It just means that a scale should consistently reflect
the construct it is measuring.

79
Table 4.6: Reliability Statistics of Supplier
Variables Number of Items Cronbach’s Alpha
Performance of dairy processing firms 10 0.851
Supply chain Information sharing 9 0.826
Suipply Chain Decision synchronization 9 0.747
Supply Chain Incentive Alignment 9 0.702
Supply Chain Teamwork 9 0.898
Dairy Board Policies and Regulations 9 0.851
4.4.2 Reliability Statistics of Customer
Table 4.11shows Reliability Statistics of Customerof Dairy Processing Firms. Cronbach’s
Alpha test on reliability showed score of performance of Dairy Processing Firms (10
items), Supply chain information sharing (9 items), Supply chain decision synchronization
(8 items), Supply chain Supply chain incentive alignment (7 items), Supply chain
teamwork(9 items) and Dairy Board (9 items) were tested. Cronbach’s Alpha test on
reliability showed score on items was above the minimum limit of 0.7- 0.8 as
recommended by Field(2013). This indicates internal consistency and reliability of the
scales. He said, “If you are using a factor analyses to validate the questionnaire, it is useful
to check the reliability of your scale”. It just means that a scale should consistently reflect
the construct it is measuring.

80
Table4.7: Customer Reliability Statistics
Variables Number of Items Cronbach’s Alpha
Performance of Dairy Processing Firms 10 0.828
Supply chain information sharing 9 0.820
Supply Chain Decision Synchronization 8 0.824
Supply Chain Incentive Alignment 7 0.868
Supply Chain Teamwork 9 0.807
Dairy Board Policies and Regulations 9 0.904
4.5 Firm Demographic
In this section the research focused on suppliers and customers gender factor, supplier and
brand category, years of milk supply and frequency of buying.
4.5.1 Suppliers Gender Factor
Table 4.12 shows the frequencies of supplier’s participation by gender. The results
revealed that the male comprised 57.6 percent and female comprised 42.4 percent. From
the findings it showed that slightly male respondents were higher than female. This shows
gender parity on participation as more male participated on the study. This is supported
by KCC report monthly milk intake records where men are slightly more than female.
Empirical studies by Katothya (2017) on Gender assessment of dairy value chains showed
gaps regarding gender equality issues related to benefits and constraints along the dairy
value chain, value chain governance and scalability of dairy development. The report
showed gender parity in dairy value chain.

81
Table4.8: Suppliers Gender
Gender Frequency Valid Percent
Valid
Male 197 57.6
Female 145 42.4
Total 342 100.0
4.5.2 Customers Gender Factor
Table 4.13 shows the frequencies of customer’s participation by gender. The results
revealed that the male comprised 63.1 percent and female comprised 36.9 percent. From
the findings it showed that male respondents were higher than female. The results revealed
most of the customers were male. The results revealed that men who are customers of
Dairy Processing Firms products were willing to participate than female.
Table4.9: Customers Respondents by Gender
Gender Frequency Valid Percent
Valid Male 198 63.1
Female 116 36.9
Total 314 100.0
4.5.3 Supplier Category
Table 4.14 shows the farmer/supplier category. The study described two groups of farmer
category and results revealed that large scale, small individual farmers had highest
representation 77.5 percent and there however a small parentage of large medium and
small groups and comprised 21.8 percent of the respondents. The farmer category findings
agreed with the Committee Paper Number: TCP/KCC/14/05a Third Quarter report of
Kitale milk processing plant. This was also supported by Committee Paper No:

82
TCP/KCC/14/05a 3rdquarter report. The report showedlarge, medium and smallgroups’
form 25.1 percent and Large Scale, Small individual farmers’ form 74.9 percent.
Empirical studies conducted by Mwakida in (2009) indicate that small scale farmers
contribute 80 percent of the total milk produced and 70 percent of the marketed milk in
the country. Empirical evidence isin agreement with the study results. Also empirical
evidence from Wambugu, Kirimi and Opiyo(2011) showed Seven percent of suppliers
were commercial farmers and the rest 93 percent are small scale producers which are
almost in agreement with the results.
Table4.5: Supplier Category
Category Frequency Valid Percent
Valid Large, Medium and small Groups 86 25.1
Large scale, Small individual farmers 256 74.9
Total 342 100.0
4.5.4 Brand Category
Results from table 4.15shows the brand of milk products. The results showed four
common brand bought by customers. It reveals that customers who buy mala comprised
41.1 percent, Fresh Milk had highest representation 33.8percent, Gold Crown 19.7 percent
and UHT 5.4 percent. The report of KCC (2016) showed high demand of fresh milk
followed by mala. The documented evidence is almost in agreement with the study results
as the demand of products differs with a small percent.

83
Table 4.11: Brand Category
Category Frequency Valid Percent
Valid
Fresh UHT 17 5.4
Gold Crown 62 19.7
Fresh Milk 106 33.8
Mala 129 41.1
Total 314 100.0
4.5.5 Years Supplied Milk
Results from table 4.16 below presents the years the suppliers had supplied milk to the
firm. The suppliers who had supplied milk more than five years comprised of 59 percent,
1 to five years 30.7 percent, and less than one year 10.2 percent. From the results it showed
that majority of respondents 59.1 percent had supplied more than 5 years. The study
clearly shows suppliers loyalty to the firm. The results revealed that the firm has customers
which remained a challenge to maintain because possibly can be tempted to supply their
milk to other marketing channel.
Table 4.12: Years Supplied Milk
Years Frequency Valid Percent
Valid Less than one 35 10.2
1 to Five 105 30.7
More than Five 202 59.1
Total 342 100.0
4.5.6 Frequency of buying
Table 4.17 presents the frequency of customers on buying the products of KCC. The
customers who always buy milk comprised of 79.6 percent, rarely 19.1 percent, and for

84
the first time 1.3 percent. From the results it showed that majority of respondents 79.6
percent always buy the products. This clearly shows products that are of client satisfaction.
Table 4.13: Customers on Buying Products
Buying Frequency Valid Percent
Valid
Always 250 79.6
Rarely 60 19.1
First time 4 1.3
Total 314 100.0
4.6 Total Variance Explained on Supply Chain Information Sharing
4.6.1 Supplier Total Variance Explained on Supply Chain Information Sharing
The results from factor analysis on table 4.18 shows extractionof three components with
Eigen values greater than one and represented 69.335 percent of variance in Supply chain
information sharing. The “% of variance” column shows how much of the total variability
(in all of the variables together) can be accounted for by each of the factors. The relative
importance of three factors is equalized for this data. This means that IS can be explained
by first three components. Factor 1 account for 42 percent of the variability in all variables,
factor 2 accounted for 15percent and factor 3 accounted for 12 percent.

85
Table 4.6: Supplier Total Variance Explained on Supply Chain Information
Sharing
Component Initial Eigenvalues Extraction Sums of
Squared Loadings
Rotation Sums of
Squared Loadings
Total % of
Var
Cum % Total % of
Var
Cum % Total % of
Var
Cum %
1 3.792 42.138 42.138 3.792 42.138 42.138 2.554 28.375 28.375
2 1.353 15.029 57.167 1.353 15.029 57.167 1.955 21.727 50.102
3 1.095 12.168 69.335 1.095 12.168 69.335 1.731 19.233 69.335
4 .731 8.117 77.452
5 .655 7.273 84.724
6 .487 5.408 90.132
7 .378 4.198 94.330
8 .307 3.415 97.745
9 .203 2.255 100.000
Extraction Method: Principal Component Analysis.
4.6.2 Customer Total Variance Explained on Supply ChainInformation Sharing
With regard to customer, the results from factor analysis in table 4.19 shows three
components with Eigen values greater than one (1) were extracted, which represented
67.155 percent of Supply chain information sharing of Dairy Processing Firms. This
means that Performance of Dairy Processing Firms can be explained by first three
components. Factor 1 accounted for 41percent of the variability in all variables, factor 2
accounted for 13percent and factor three accounted for 11 percent.

86
Table 4.7: Customer Total Variance Explained on Supply Chain Information
sharing
Component Initial Eigenvalues Extraction Sums of
Squared Loadings
Rotation Sums of
Squared Loadings
Total % of
Var
Cum % Total % of
Var
Cum% Total % of
Var
Cum %
1 3.743 41.587 41.587 3.743 41.587 41.587 2.121 23.562 23.562
2 1.256 13.954 55.541 1.256 13.954 55.541 2.096 23.290 46.851
3 1.045 11.614 67.155 1.045 11.614 67.155 1.827 20.303 67.155
4 .732 8.137 75.291
5 .635 7.058 82.350
6 .510 5.668 88.018
7 .495 5.505 93.523
8 .336 3.736 97.259
9 .247 2.741 100.000
Extraction Method: Principal Component Analysis.
4.7 Rotated Component Matrix on Supply chain information sharing
4.7.1 Supplier Rotated Component Matrixon Supply Chain Information Sharing
The rotated component matrix in table 4.20 shows factor loadings (FL) of Supply chain
information sharing “Four items on the first factor include; Effective Information
technology, Information on product development shared, Farmers Know early on price
changes, Firm communicates about demand, had strong FL between 0.645 to 0.874. This
therefore shows that IS can be explained by “capability factors”. The factors loading on
the second factor included: Three items on the second factor include: Information about
supply disruptions shared, Farmers informed on changes of delivery, Exchange visits to
share information had strong FL (0.525 to 0.609). This can be explained by “delivery
factors” The factors loading on the third factor included: Farmers know early on price

87
changes, Information about market conditions shared, Information on Inventory shared
had strong FL (0.427 to 0.852). This can be explained by “market factors”.
Table 4.16: Supplier Rotated Component Matrix on Supply Chain information
Sharing
Statements Component
1 2 3
The firm communicates to dairy farmers about its demand .645 .525
Effective Information technology is used to communicate .876 .185
Dairy farmers are informed on any change of delivery schedules .148 .722 .128
Dairy farmers to know early enough on price changes .702 .113 .427
There is exchange visits to share information .321 .609 .269
Information on Inventory levels are shared with dairy farmers .175 .269 .800
Information about product developments is always shared .836 .251
Information about milk supply disruptions is always communicated .806 .159
Information about market conditions shared is always shared .137 .128 .852
Extraction Method: Principal Component Analysis.
Rotation Method: Varimax with Kaiser Normalization.
a. Rotation converged in 4 iterations.
4.7.2 Customer Rotated Component Matrix on Supply ChainInformation Sharing
Table 4.21 Shows Rotated Component Matrix on Supply chain information sharing. With
regards to customer, factor loadings of Supply chain information sharing, “Five items on
the first factor includeCustomers know about price changes, effective technology,
Customers informed on products, Customers informed about benefits and Company
aware customer complaints had FL between 0.364 to 0.800. This therefore shows that
Supply chain information sharing can be explained by “Customers know about price

88
changes”. The factors loading on the second factor included: Customers informed on
products, Customers know about varied products, Milk products conveniently delivered,
Company aware customer complaints had FL 0.364 to 0.774. This can be explained by
“Customers know about varied products” The factors loading on the third factor
included:Customers understand the products and Customers know where to buy had
strong FL between 0.756 and 0.894. This can be explained by “Customers know where to
buy”.
Table 4.17: Customer Rotated Component Matrix on Supply ChainInformation
Sharing
Statements Component
1 2 3
Customers informed on products introduced .643 .364 .104
and effective information technology as a mode of comm. .706 .231 .155
Milk products are conveniently delivered to customers .170 .774 .222
Customers get to know early enough about price changes .800
The company is aware about customer complaints and respond .329 .754
Customers are informed of the varied milk products .116 .822 .181
Customers are informed on the benefits of products .617 .111 .453
Customers know where to buy the firm’s products .136 .165 .878
Customers understand very well the products of dairy processing
firms .138 .138 .856
Extraction Method: Principal Component Analysis.
Rotation Method: Varimax with Kaiser Normalization.
a. Rotation converged in 5 iterations.

89
4.8 KMO and Bartlett's Test on Supply Chain Information Sharing
4.8.1 Supplier KMO and Bartlett's Test on Supply ChainInformation Sharing
Table 4.22 presents the results of Kaiser Meyer-Olkin (KMO) Measure of Sampling
Adequacy. Values between .7 and .8 are good and for these data the value is 0.719, which
falls in to range of good: so we should be confident that factor analysis is appropriate for
these data. Bartlett’s Test of Sphericity result is significant at 0.000 level indicating a
significant relationship among the variables and therefore suitable for factor analysis.
Table 4.18: Supplier KMO and Bartlett's Test on Supply ChainInformation
Sharing
Kaiser-Meyer-Olkin Measure of Sampling Adequacy. .719
Bartlett's Test of Sphericity
Approx. Chi-Square 1173.322
Df 36
Sig. .000
4.8.2 Customer KMO and Bartlett's Test on Supply Chain Information Sharing
With regards to customer, table 4.23 presentsthe value is 0.745, which falls in to range of
good: so we should be confident that factor analysis is appropriate for these data. Bartlett’s
Test of Sphericity result is significant at 0.000 level indicating a significant relationship
among the variables and therefore suitable for factor analysis.
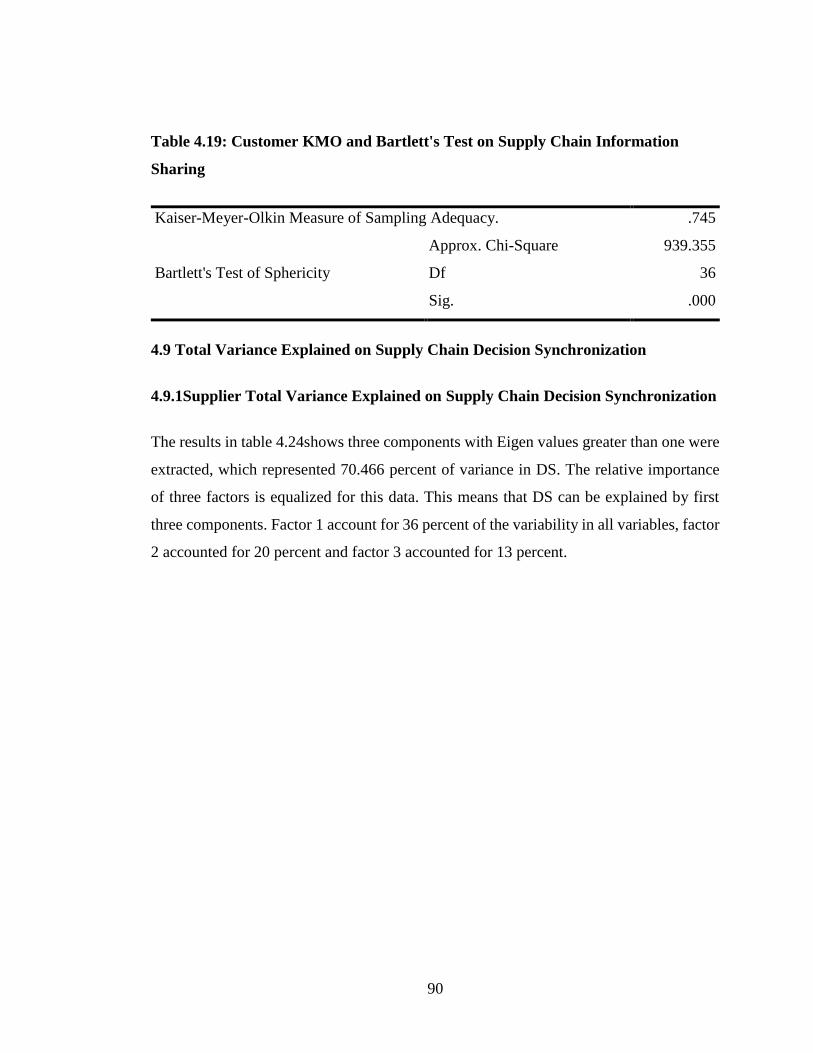
90
Table 4.19: Customer KMO and Bartlett's Test on Supply Chain Information
Sharing
Kaiser-Meyer-Olkin Measure of Sampling Adequacy. .745
Bartlett's Test of Sphericity
Approx. Chi-Square 939.355
Df 36
Sig. .000
4.9 Total Variance Explained on Supply Chain Decision Synchronization
4.9.1Supplier Total Variance Explained on Supply Chain Decision Synchronization
The results in table 4.24shows three components with Eigen values greater than one were
extracted, which represented 70.466 percent of variance in DS. The relative importance
of three factors is equalized for this data. This means that DS can be explained by first
three components. Factor 1 account for 36 percent of the variability in all variables, factor
2 accounted for 20 percent and factor 3 accounted for 13 percent.

91
Table 4.20: Supplier Total Variance Explained on Supply Chain Decision
Synchronization
Component Initial Eigenvalues Extraction Sums of
Squared Loadings
Rotation Sums of
Squared Loadings
Total % of
Var
Cum % Total % of
Var
Cum % Total % of
Var
Cum%
1 3.275 36.389 36.389 3.275 36.389 36.389 2.601 28.899 28.899
2 1.814 20.159 56.548 1.814 20.159 56.548 2.144 23.825 52.724
3 1.253 13.917 70.466 1.253 13.917 70.466 1.597 17.742 70.466
4 .819 9.101 79.567
5 .636 7.066 86.633
6 .431 4.790 91.422
7 .414 4.600 96.022
8 .196 2.177 98.200
9 .162 1.800 100.000
Extraction Method: Principal Component Analysis.
4.9.2 Customer Total Variance Explained on Supply Chain Decision
Synchronization
The findings on table 4.25 shows the customer total variance explained, two components
with Eigen values greater than one extracted represented 62.860 percent of Decision
Synchronization. This means that Supply chain decision synchronization can be explained
by first three components. Factor 1 accounted for 45 percent of the variability in all
variables and factor 2 accounted for 17 percent.

92
Table 4.21: Customer Total Variance Explained on Supply Chain Decision
Synchronization
Component Initial Eigenvalues Extraction Sums of
Squared Loadings
Rotation Sums of
Squared Loadings
Total % of
Var
Cum % Total % of
Var
Cum% Total % of
Var
Cum %
1 3.650 45.623 45.623 3.650 45.623 45.623 2.578 32.222 32.222
2 1.379 17.237 62.860 1.379 17.237 62.860 2.451 30.637 62.860
3 .970 12.123 74.983
4 .541 6.762 81.745
5 .520 6.505 88.250
6 .400 5.001 93.251
7 .291 3.635 96.886
8 .249 3.114 100.000
Extraction Method: Principal Component Analysis.
4.10 Rotated Component Matrix on Supply Chain Decision Synchronization
4.10.1 Supplier Rotated Component Matrix on Supply Chain Decision
Synchronization
The rotated component matrix in table 4.26 shows factor loadings (FL) of Decision
Synchronization. Five items loaded highly in the first factor. The items included:
Extension services to increase quality, Extension services to increase production Quality
control understood, Inventory levels are understood and Tenders to transporters done as
required. The items can be can be explained by; “services are understood” because we
can see that all variables are highly correlated with the first factor. The second factor can
be explained by “delivery factors” because the items loading highly measure delivery
related factors are highly correlated. The third factor can be explained by “demand for
milk” because the items loading highly measure market related factors.

93
Table 4.22: Supplier Rotated Component Matrix on Supply Chain Decision
Synchronization
Statements Component
1 2 3
Fixing of milk prices done are done as required .117 .827 -
.141
Weights disparities between farmers and Dairy Processing Firms are
well resolved
-
.313 .765
Quality control measures are understood by dairy farmers .657 .333
Extension services are offered to increase production of milk .830 -
.107
Extension services are offered to increase quality of milk .841 .140
Demand for early milk deliveries is understood by dairy farmers .248 .759
Dairy farmers receive record of their daily deliveries .900
Tenders offered to transporters, coolers are done as required .603 .641 .239
Product inventory levels are understood by dairy farmers .486 .653 .141
Extraction Method: Principal Component Analysis.
Rotation Method: Varimax with Kaiser Normalization.
a. Rotation converged in 4 iterations.
4.10.2 Customer Rotated Component Matrix on Supply Chain Decision
Synchronization
Table 4.27 Shows Rotated Component Matrix on Supply chain decision synchronization
.The rotated component matrix shows factor loadings (FL) of Supply chain decision
synchronization “Five items on the first factor include; Promotions according to
demands, Products offer solutions to customers, Products timely introduced, Promotions
done rightly in retail store, Promotions offered to increase demand, Quality of products
understood had strong FL between 0.579 to 0.853. This therefore shows that Supply

94
chain decision synchronization can be explained by “Promotions according to demands”.
The factors loading on the second factor included: Products timely introduced,
Promotions done rightly in retail store, Promotions offered to increase demand, Price
variations understood, Products prices reasonable, Quality of products understood had
FL (0.462 to 0.888). This can be explained by “Price variations understood”
Table 4.23: Customer Rotated Component Matrix on Supply Chain Decision
Synchronization
Statements Component
1 2
Dairy Processing Firms product prices are reasonable and understood .143 .874
Price variations between Dairy Processing Firms products and others are
understood .888
Quality of products are understood by customers .439 .493
Promotions services are offered to increase demand .418 .404
Promotions services are done according to customers’ demands .815 -.142
Dairy Processing Firms products offer solution to customers .806 .149
Firm’s products are timely introduced .687 .463
Promotions of products are done rightfully in the retail store .636 .484
Extraction Method: Principal Component Analysis.
Rotation Method: Varimax with Kaiser Normalization.
a. Rotation converged in 3 iterations.

95
4.11 KMO and Bartlett's Test on Chain Supply Decision Synchronization
4.11.1 Supplier KMO and Bartlett's Test on Supply Chain Decision
Synchronization
Table 4.28 shows the results of KMO and Bartlett's Test on Decision Synchronization.
Keiser, (1974) recommends accepting values greater than .5 as barely acceptable. Values
between .5 and .7 are mediocre, values between .7 and .8 are good, values between .8 and
.9 are great and values above .9 are superb (Field, 2013), for these data the value is 0.627,
which falls in to range of mediocre: so we should be certain that factor analysis is
appropriate for these data. Bartlett’s Test of Sphericity result is significant at 0.000 level
indicating a significant relationship among the variables and therefore suitable for factor
analysis.
Table 4.8: Supplier KMO and Bartlett's Test on Supply Chain Decision
Synchronization
Kaiser-Meyer-Olkin Measure of Sampling Adequacy. .627
Bartlett's Test of Sphericity
Approx. Chi-Square 1287.368
Df 36
Sig. .000
4.11.2Customer KMO and Bartlett's Test on Supply Chain Decision
Synchronization
With regards to customer,the results on table 4.29 shows 0.785, which falls in to range of
good: so we should be confident that factor analysis is appropriate for these data. Bartlett’s
Test of Sphericity result is significant at 0.000 level indicating a significant relationship
among the variables and therefore suitable for factor analysis.
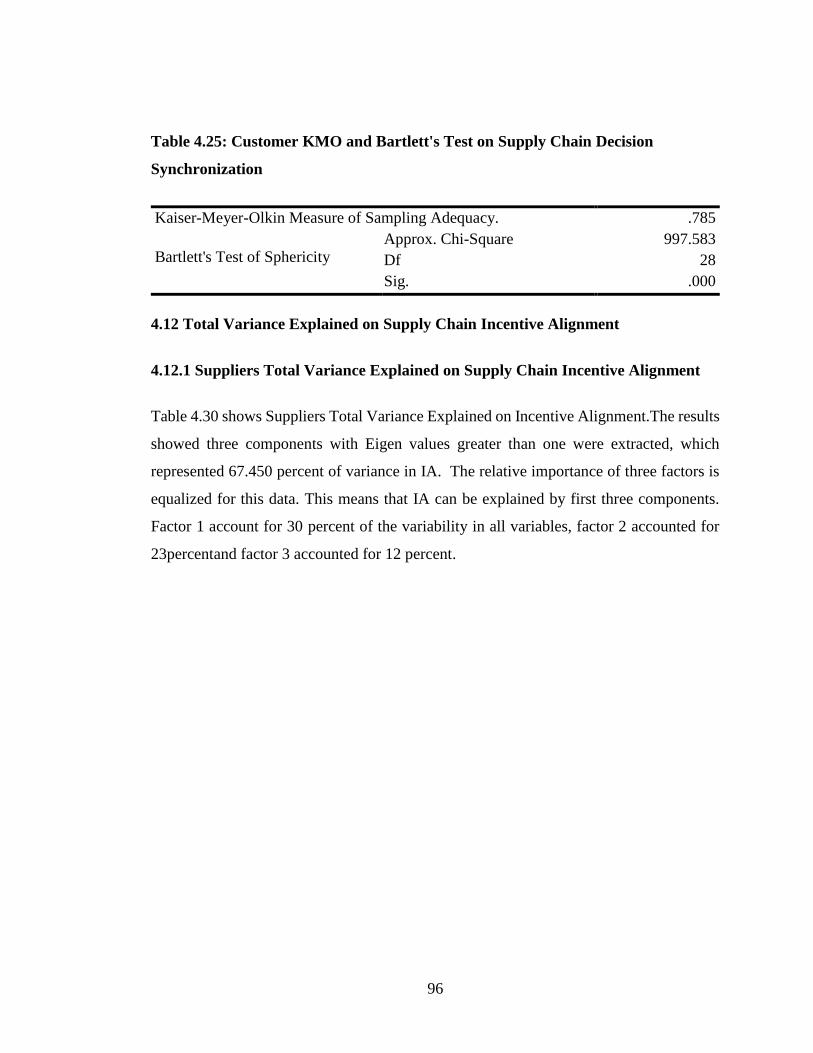
96
Table 4.25: Customer KMO and Bartlett's Test on Supply Chain Decision
Synchronization
Kaiser-Meyer-Olkin Measure of Sampling Adequacy. .785
Bartlett's Test of Sphericity Approx. Chi-Square 997.583
Df 28
Sig. .000
4.12 Total Variance Explained on Supply Chain Incentive Alignment
4.12.1 Suppliers Total Variance Explained on Supply Chain Incentive Alignment
Table 4.30 shows Suppliers Total Variance Explained on Incentive Alignment.The results
showed three components with Eigen values greater than one were extracted, which
represented 67.450 percent of variance in IA. The relative importance of three factors is
equalized for this data. This means that IA can be explained by first three components.
Factor 1 account for 30 percent of the variability in all variables, factor 2 accounted for
23percentand factor 3 accounted for 12 percent.

97
Table 4.26: Suppliers Total Variance Explained on Supply Chain Incentive
Alignment
Component Initial Eigenvalues Extraction Sums of
Squared Loadings
Rotation Sums of
Squared Loadings
Total % of
Var
Cum % Total % of
Var
Cum % Total % of
Var
Cum %
1 2.783 30.921 30.921 2.783 30.921 30.921 2.675 29.725 29.725
2 2.154 23.937 54.858 2.154 23.937 54.858 2.231 24.788 54.513
3 1.133 12.591 67.450 1.133 12.591 67.450 1.164 12.937 67.450
4 .903 10.036 77.485
5 .774 8.603 86.088
6 .411 4.570 90.658
7 .318 3.530 94.187
8 .269 2.984 97.171
9 .255 2.829 100.000
Extraction Method: Principal Component Analysis.
4.12.2 Customer Total Variance Explained on Supply Chain Incentive Alignment
With regards to customerthe results on table 4.31 shows factor analysis on Incentive
Alignment. It indicated that all components with Eigen values greater than one (1) were
extracted and was represented 100 % of Incentive Alignment. The results were not
possible to be rotated.
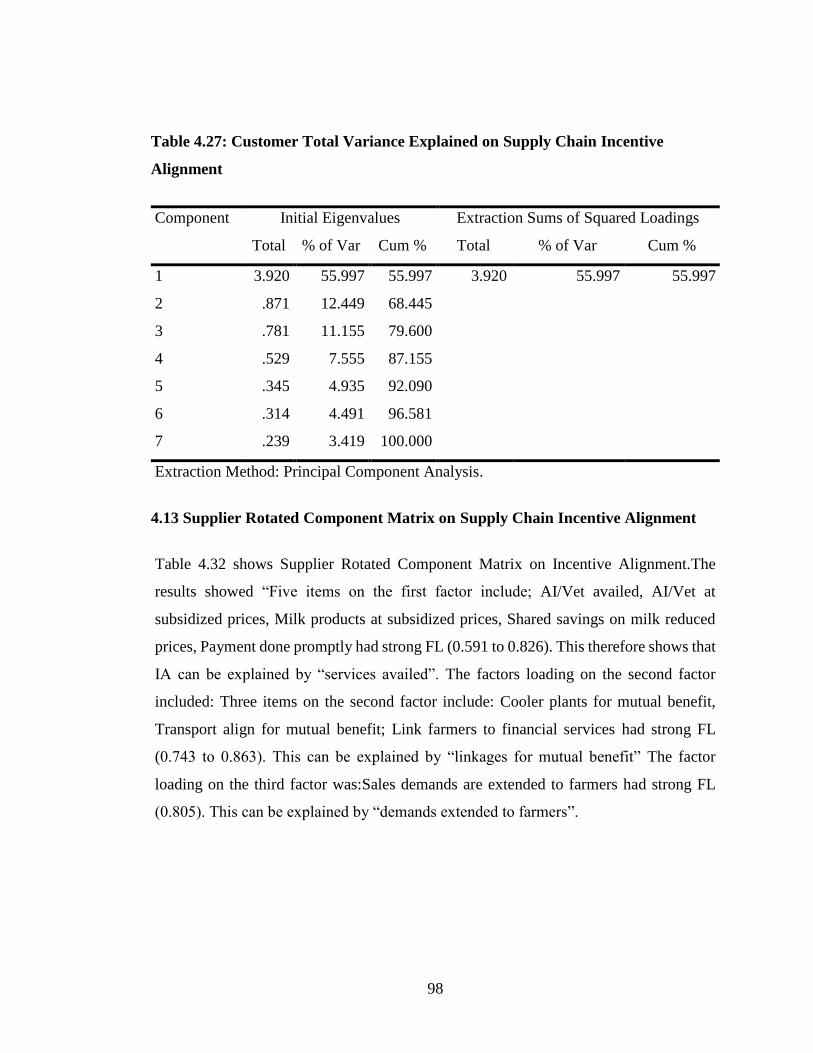
98
Table 4.27: Customer Total Variance Explained on Supply Chain Incentive
Alignment
Component Initial Eigenvalues Extraction Sums of Squared Loadings
Total % of Var Cum % Total % of Var Cum %
1 3.920 55.997 55.997 3.920 55.997 55.997
2 .871 12.449 68.445
3 .781 11.155 79.600
4 .529 7.555 87.155
5 .345 4.935 92.090
6 .314 4.491 96.581
7 .239 3.419 100.000
Extraction Method: Principal Component Analysis.
4.13 Supplier Rotated Component Matrix on Supply Chain Incentive Alignment
Table 4.32 shows Supplier Rotated Component Matrix on Incentive Alignment.The
results showed “Five items on the first factor include; AI/Vet availed, AI/Vet at
subsidized prices, Milk products at subsidized prices, Shared savings on milk reduced
prices, Payment done promptly had strong FL (0.591 to 0.826). This therefore shows that
IA can be explained by “services availed”. The factors loading on the second factor
included: Three items on the second factor include: Cooler plants for mutual benefit,
Transport align for mutual benefit; Link farmers to financial services had strong FL
(0.743 to 0.863). This can be explained by “linkages for mutual benefit” The factor
loading on the third factor was:Sales demands are extended to farmers had strong FL
(0.805). This can be explained by “demands extended to farmers”.

99
Table 4.28: Supplier Rotated Component Matrix on Supply Chain Incentive
Alignment
Statements Component
1 2 3
Increased sales demand are extended to dairy farmers .185 .118 .805
milk products are provided to farmers at a subsidized prices .721 -.405
AI/Vet programs are availed when required by the dairy farmers .826 .138 .154
AI/Vet programs are provided to farmers at subsidized price .777 -.114 .307
The firm link farmers to dairy farmers to financial services .743
Payment for milk produce is done promptly .591 .287 -.517
The establishment of the cooler plants is for mutual benefit .865
Savings as a result of reduced production costs are shared .682 .233
Transport services are aligned for mutual benefit .149 .764 .345
Extraction Method: Principal Component Analysis.
Rotation Method: Varimax with Kaiser Normalization.
a. Rotation converged in 5 iterations.
4.14 KMO and Bartlett's Test on Supply Chain Incentive Alignment
4.14.1 Supplier KMO and Bartlett's Test on Chain Incentive Alignment
Table 4.33 shows the results Supplier KMO and Bartlett's Test on Incentive Alignment.
Keiser, (1974) recommends accepting values greater than .5 as barely acceptable. Values
between .5 and .7 are mediocre, values between .7 and .8 are good, values between .8 and
.9 are great and values above .9 are superb (Field, 2013) and for these data the value is
0.642, which falls in to range of mediocre: so we should be certain that factor analysis
is appropriate for these data. Bartlett’s Test of Sphericity result is significant at 0.000 level
indicating a significant relationship among the variables and therefore suitable for factor
analysis.

100
Table 4.29: Supplier KMO and Bartlett's Test on Supply Chain Incentive
Alignment
Kaiser-Meyer-Olkin Measure of Sampling Adequacy. .642
Bartlett's Test of Sphericity
Approx. Chi-Square 1065.340
Df 36
Sig. .000
4.14.2 Customer KMO and Bartlett's Test on Supply Chain Incentive Alignment
Table 4.34 shows Customer KMO and Bartlett's Test on Incentive Alignment. Keiser,
(1974) recommends accepting values greater than .5 as barely acceptable. Values between
.5 and .7 are mediocre, values between .7 and .8 are good, values between .8 and .9 are
great and values above .9 are superb (Field, 2013) and for these data the value is 0.834,
which falls in to range of great: so we should be confident that factor analysis is
appropriate for these data. Bartlett’s Test of Sphericity result is significant at 0.000 level
indicating a significant relationship among the variables and therefore suitable for factor
analysis.

101
Table 4.30: Customer KMO and Bartlett's Test on Supply Chain Incentive
Alignment
Kaiser-Meyer-Olkin Measure of Sampling Adequacy. .834
Bartlett's Test of Sphericity
Approx. Chi-Square 1024.329
Df 21
Sig. .000
4.15 Total Variance Explained on Supply Chain Teamwork
4.15.1 Supplier Total Variance Explained on Supply Chain Teamwork
The results in table 4.35shows Supplier Total Variance Explained on Teamwork. The
results show two componentsextractedand represented 67.684percent of variance. The
relative importance of two factors is equalized for this data. This means that T can be
explained by first three components. Factor 1 account for 56 percent of the variability in
all variables and factor 2 accounted for 11percent of the variability.

102
Table 4.9:Supplier Total Variance Explained on Supply Chain Teamwork
Component Initial Eigenvalues Extraction Sums of
Squared Loadings
Rotation Sums of
Squared Loadings
Total % of
Var
Cum % Total % of
Var
Cum% Total % of
Var
Cum %
1 5.079 56.438 56.438 5.079 56.438 56.438 3.687 40.963 40.963
2 1.012 11.246 67.684 1.012 11.246 67.684 2.405 26.721 67.684
3 .807 8.970 76.654
4 .641 7.124 83.778
5 .560 6.217 89.994
6 .327 3.638 93.633
7 .279 3.098 96.731
8 .175 1.948 98.680
9 .119 1.320 100.000
Extraction Method: Principal Component Analysis.
4.15.2 Customer Total Variance Explained on Supply Chain Teamwork
Table 4.36 shows Customer Total Variance Explained on Teamwork.With regard to
customer three components were extracted and represented 66.093percent of Teamwork.
This means that Supply chain teamworkcan be explained by first three components. Factor
1 accounted for 40 percent of the variability in all variables and factor 2 accounted for 13
percent and factor 3 accounted for 12percent of the variability.

103
Table 4.32: Customer Total Variance Explained on Supply Chain Teamwork
Component Initial Eigenvalues Extraction Sums of
Squared Loadings
Rotation Sums of
Squared Loadings
Total % of
Var
Cum % Total % of
Var
Cum% Total % of
Var
Cum %
1 3.623 40.258 40.258 3.623 40.258 40.258 2.296 25.513 25.513
2 1.215 13.503 53.762 1.215 13.503 53.762 2.049 22.770 48.283
3 1.110 12.331 66.093 1.110 12.331 66.093 1.603 17.810 66.093
4 .872 9.684 75.777
5 .699 7.771 83.548
6 .569 6.326 89.874
7 .409 4.545 94.419
8 .326 3.618 98.037
9 .177 1.963 100.000
Extraction Method: Principal Component Analysis.
4.16 Rotated Component Matrix on Supply Chain Teamwork
4.16.1 Supplier Rotated Component Matrix on Supply Chain Teamwork
Table 4.37showsSupplier Rotated Component Matrix on Teamwork. The results showed
eight items on the first factor. This include Cordial relationships, Firm enhances
coordination, there are joint efforts, Spirit of being togetherness, Firm committed
improving services, Firm committed to the growth of the industry, mutual trust, all
parties along the chain plan, Mutual trust, had strong FL between 0.400 to 0.850. This
therefore shows that IS can be explained by “Cordial relationships”. The factors loading
on the second factor included: Three seven items on the second factor include: There
are joint efforts; Spirit of being togetherness, Firm committed improving services, Firm
committed to the growth of the industry, Supply alliances, all parties along the chain

104
plan, mutual trust; had strong FL (0.328 to 0.949). This can be explained by “All parties
plan” Shows Rotated Component Matrix on Performance of teamwork.
Table 4.10: Supplier Rotated Component Matrix on Supply Chain Teamwork
Statements Component
1 2
The firm committed to the growth of the industry .459 .379
The firm committed to improving services to milk suppliers .712 .350
There is joint efforts to increase milk production .749 .328
The firm enhances coordination through teamwork .829 .299
All parties along the chain plan together .400 .755
There is cordial relationship between the firm and milk suppliers .850
There is supply alliances with all the parties within the chain .100 .949
There is mutual trust between the firm and milk suppliers .522 .592
There is spirit of togetherness between the firm and milk suppliers .745 .343
Extraction Method: Principal Component Analysis.
Rotation Method: Varimax with Kaiser Normalization.
a. Rotation converged in 3 iterations.
4.16.2 Customer Rotated Component Matrix on Supply Chain Teamwork
Table 4.38presentsCustomer Rotated Component Matrix on Teamwork. “Four items on
the first factor Loadings (FL) include; Products high in quality Firm committed improving
quality, Firm committed to needs of customers, Firm enhances cooperation and Cordial
relationship had strong FL (0.632 to 0.805). This shows that Supply chain teamworkcan
be explained by “Firm committed in improving quality”. The factors on the secondfactor
included: coordinated promotion, firm has measures, Joint efforts to increase market share
and all parties along the chain promote had FL (0.326 to 0.896). This can be explained by
“Coordinated promotions” The factors on the third factor included:Cordial relationship,

105
Supply alliances with all parties, Joint efforts to increase market share and All parties
along the chain promote had FL (0.451 to 0.881) and can be explained by “Supply
alliances with all parties”.
Table 4.11: Customer Rotated Component Matrix on Supply Chain Teamwork
Statements Component
1 2 3
The firm is committed to needs of customers .742 .238
The firm is committed to improving quality of their products .805 .326 -.104
There is joint efforts to increase the market share .188 .429 .528
Firm enhances cooperation to deliver required products .711 .302
All the parties along the chain promote the products .273 .456 .497
There is cordial relationship between the firm and customers .632 .451
There is supply alliances with all parties within the chain .881
The firm has measures to ensure customers trust their products .286 .804 .123
Through coordinated promotion the customers are informed and
retained .896 .105
Extraction Method: Principal Component Analysis.
Rotation Method: Varimax with Kaiser Normalization.
a. Rotation converged in 4 iterations.
4.17 KMO and Bartlett's Test on Supply Chain Teamwork
4.17.1 Supplier KMO and Bartlett's Test on Supply Chain Teamwork
Table 4.39shows Supplier KMO and Bartlett's Test on Teamwork. Keiser, (1974)
recommends accepting values greater than .5 as barely acceptable. Values between .5 and
.7 are mediocre, values between .7 and .8 are good, values between .8 and .9 are great and
values above .9 are superb (Field, 2013), for these data the value is 0.774, which falls in

106
to range of good: so we should be confident that factor analysis is appropriate for these
data. Bartlett’s Test of Sphericity result is significant at 0.000 level indicating a significant
relationship among the variables and therefore suitable for factor analysis.
Table 4.35:Supplier KMO and Bartlett's Test on Supply Chain Teamwork
Kaiser-Meyer-Olkin Measure of Sampling Adequacy. .774
Bartlett's Test of Sphericity
Approx. Chi-Square 1977.954
Df 36
Sig. .000
4.17.2 Customer KMO and Bartlett's Test on Supply Chain Teamwork
Table 4.40 shows Customer KMO and Bartlett's Test on Teamwork. Keiser, (1974)
recommends accepting values greater than .5 as barely acceptable. Values between .5 and
.7 are mediocre, values between .7 and .8 are good, values between .8 and .9 are great and
values above .9 are superb (Field, 2013), for these data the value is 0.628, which falls in
to range of mediocre: so we should be certain that factor analysis is appropriate for these
data. Bartlett’s Test of Sphericity result is significant at 0.000 level indicating a significant
relationship among the variables and therefore suitable for factor analysis.
Table 4.36: Customer KMO and Bartlett's Test on Supply Chain Teamwork
Kaiser-Meyer-Olkin Measure of Sampling Adequacy. .628
Bartlett's Test of Sphericity
Approx. Chi-Square 995.847
Df 36
Sig. .000

107
4.18 Total Variance Explained on Dairy Board
4.18.1 Supplier Total Variance Explained on Dairy Board Policies and Regulations
The results in table 4.41presentSupplier Total Variance Explained on Dairy Board. Two
components were extracted and represented 64.788 percent of variance in Dairy Board.
The relative importance of three factors was equalized for this data. Dairy Boardwas
explained by first two components. Factor 1 account for 46 percent of the variability in all
variables and factor 2 accounted for 18percent of the variability.
Table 4.37: Supplier Total Variance Explained on Dairy Board Policies and
Regulations
Component Initial Eigenvalues Extraction Sums of
Squared Loadings
Rotation Sums of
Squared Loadings
Total % of
Var
Cum % Total % of
Var
Cum % Total % of
Var
Cum %
1 4.207 46.750 46.750 4.207 46.750 46.750 3.533 39.260 39.260
2 1.623 18.039 64.788 1.623 18.039 64.788 2.298 25.528 64.788
3 .871 9.678 74.467
4 .701 7.783 82.250
5 .513 5.700 87.950
6 .463 5.139 93.089
7 .285 3.168 96.257
8 .207 2.295 98.552
9 .130 1.448 100.000
Extraction Method: Principal Component Analysis.
4.18.2 Customer Total Variance Explained on Dairy Board Policies and

108
Regulations
Table 4.42 shows Customer Total Variance Explained on Dairy Board.With regards to
customer, all components with Eigen values greater than one (1) were extracted, which
represented 100percent of Dairy Board. This means that Dairy Board can be explained by
all components. The results then were not possible to be rotated.
Table 4.38: Customer Total Variance Explained on Dairy Board Policies and
Regulations
Component Initial Eigenvalues Extraction Sums of Squared Loadings
Total % of
Variance
Cumulative
%
Total % of
Variance
Cumulative
%
1 5.116 56.840 56.840 5.116 56.840 56.840
2 .872 9.693 66.533
3 .697 7.742 74.275
4 .622 6.912 81.187
5 .474 5.264 86.451
6 .431 4.784 91.235
7 .287 3.194 94.429
8 .276 3.063 97.492
9 .226 2.508 100.000
Extraction Method: Principal Component Analysis.
4.19 Rotated Component Matrix on Dairy Board Policies and Regulations
4.19.1Supplier Rotated Component Matrix on Dairy Board Policies and
Regulations
Table 4.43presentsSupplier Rotated Component Matrix on Dairy Board. Seven items on
the first factor include:The dairy board Act influences the growth of industry, The dairy

109
board organs improve the services of milk suppliers, The dairy board delivers its mandate
to increase milk production, The dairy board guidelines enhances teamwork, The dairy
board policies are in line to chain parties performance, DB Regulates, The dairy board
regulates the prices of dairy produce, had strong FL between 0.645 to 0.874. This
therefore shows that IS can be explained by “capability factors”. The factors loading on
the second factor included: The dairy board improves the quality of milk produce, there
is mutual trust between dairy board and milk suppliers, the dairy board work in
association with other participants had strong FL (0.324 to 0.938). This can be explained
by “Dairy Board work in association with others”.

110
Table 4.12: Supplier Rotated Component Matrix on Dairy board Policies and
Regulations
Statements Component
1 2
The dairy board Act influences the growth of industry .816
The dairy board organs improve the services of milk suppliers .691 .324
The dairy board delivers its mandate to increase milk production .818 .143
The dairy board guidelines enhances teamwork .709 .412
The dairy board policies are in line to chain parties performance .401 .691
The dairy board regulates the prices of dairy produce .754
The dairy board improves the quality of milk produce .661 .249
There is mutual trust between dairy board and milk suppliers .208 .762
The dairy board work in association with other participants .938
Extraction Method: Principal Component Analysis.
Rotation Method: Varimax with Kaiser Normalization.
a. Rotation converged in 3 iterations.
4.20 KMO and Bartlett's Test
4.20.1 Supplier KMO and Bartlett's Test
Table 4.44presentsSupplier KMO and Bartlett's Test. Keiser, (1974) recommends
accepting values greater than .5 as barely acceptable. Values between .5 and .7 are
mediocre, values between .7 and .8 are good, values between .8 and .9 are great and values
above .9 are superb (Field, 2013), for these data the value is 0.695, which falls in to range
of mediocre: so we should be certain that factor analysis is appropriate for these data.
Bartlett’s Test of Sphericity result is significant at 0.000 level indicating a significant
relationship among the variables and therefore suitable for factor analysis.

111
Table 4.40: Supplier KMO and Bartlett's Test on Dairy Board Policies and
Regulations
Kaiser-Meyer-Olkin Measure of Sampling Adequacy. .695
Bartlett's Test of Sphericity
Approx. Chi-Square 1645.739
Df 36
Sig. .000
4.20.2 Customer KMO and Bartlett's Test on Dairy Board Policies and Regulations
The functionality of factor analysis was measured using Kaiser-Meyer-Olkin. Table 4.45
shows the results of KMO Measure of Sampling Adequacy. Keiser, (1974) recommends
accepting values greater than .5 as barely acceptable. Values between .5 and .7 are
mediocre, values between .7 and .8 are good, values between .8 and .9 are great and values
above .9 are superb (Field, 2013), for these data the value is 0.893, which falls in to range
of great: so we should be confident that factor analysis is appropriate for these data.
Bartlett’s Test of Sphericity result is significant at 0.000 level indicating a significant
relationship among the variables and therefore suitable for factor analysis.
Table 4.41: Customer KMO and Bartlett's Test on Dairy Board
Kaiser-Meyer-Olkin Measure of Sampling Adequacy. .893
Bartlett's Test of Sphericity
Approx. Chi-Square 1531.502
Df 36
Sig. .000
112
4.21 Total Variance Explained on Performance of Dairy Processing Firms
4.21.1 Supplier Total Variance Explained on Performance of Dairy Processing
Firms
Results from table 4.46 presents supplier total variance explained on performance of Dairy
Processing Firms .Factor analyses attempts to cluster items or characteristics that seem to
collate highly with each other in defining a particular construct (Mugenda, 2008). Factor
analyses are a powerful procedure used to validate hypothetical constructs. The results
from factor analysis on Performance of Dairy Processing Firms shows that three
components with Eigen values greater than one (1) were extracted, which represented
72.333percent of variance in Performance of Dairy Processing Firms . This means that
Performance of Dairy Processing Firms can be explained by first three components. The
“% of variance” column shows how much of the total variability (in all of the variables
together) can be accounted for by each of the factors. Factor 1 accounted for 45percent of
the variability in all variables, factor 2 accounted for 14percent and factor three accounted
for 12percent

113
Table 4.42: Supplier Total Variance Explained on Performance of Dairy Processing
Firms
Component Initial Eigenvalues Extraction Sums of
Squared Loadings
Rotation Sums of
Squared Loadings
Total % of
Var
Cum % Total % of
Var
Cum % Total % of
Var
Cum %
1 4.524 45.245 45.245 4.524 45.245 45.245 2.689 26.895 26.895
2 1.416 14.162 59.407 1.416 14.162 59.407 2.480 24.801 51.696
3 1.293 12.926 72.333 1.293 12.926 72.333 2.064 20.637 72.333
4 .900 9.002 81.335
5 .490 4.898 86.233
6 .367 3.675 89.908
7 .344 3.435 93.343
8 .305 3.054 96.397
9 .277 2.765 99.162
10 .084 .838 100.000
Extraction Method: Principal Component Analysis.
4.21.2 Customer Total Variance Explained on Performance of Dairy Processing
Firms
Results from table 4.47 shows customer total variance explained on performance of Dairy
Processing Firms . With regards to customer, factor analysis showed three components
with Eigen values greater than one (1) were extracted, which represented 67.365 percent
of variance in Performance of dairy processing firms . This means that Performance of
dairy processing firms can be explained by first three components. The “% of variance”
column shows how much of the total variability (in all of the variables together) can be
accounted for by each of the factors. Factor 1 accounted for 39percent of the variability in
all variables, factor 2 accounted for 16 percent and factor three accounted for 10 percent.

114
Table 4.43 : Customer Total Variance Explained on Performance of Dairy
Processing Firms
Component Initial Eigenvalues Extraction Sums of
Squared Loadings
Rotation Sums of
Squared Loadings
Total % of
Var
Cum % Total % of
Var
Cum
%
Total % of
Var
Cum
%
1 3.996 39.961 39.961 3.996 39.961 39.961 2.841 28.409 28.409
2 1.664 16.642 56.603 1.664 16.642 56.603 2.189 21.887 50.295
3 1.076 10.762 67.365 1.076 10.762 67.365 1.707 17.070 67.365
4 .842 8.422 75.787
5 .664 6.636 82.423
6 .528 5.281 87.704
7 .426 4.263 91.967
8 .326 3.256 95.224
9 .269 2.688 97.911
10 .209 2.089 100.000
Extraction Method: Principal Component Analysis.
4.22 Rotated Component Matrix on Performance of Dairy Processing Firms
4.22.1 Supplier Rotated Component Matrix on Performance of Dairy Processing
Firms
Results from table 4.48 shows rotated components matrix on performance of dairy
processing firms . To better interpret Construct validity, factor rotation analysis was used
with principle component, Varimax rotation method with Keiser Normalization. Varimax
rotation attempts to maximize the spread of factor loadings for a variable across all factors.
Rotation has the effect of optimizing the factor structure and consequence for these data
is that the relative importance of three factors is equalized. The research adopted
Tabachnick and Fidell, (2013) by interpreting factor loadings of .32 or higher. This was
115
good rule of the thumb according to them. The results shows; “Five items on the first
factor include; the firm focuses on existing milk suppliers for growth, focuses on existing
milk suppliers for expansion, focuses on establishing itself in markets, has served its milk
suppliers according to various market, and considers how products are manufactured had
strong FL between 0.480 to 0.899. This therefore shows that Performance of dairy
processing firms can be explained by “Focus milk existing milk suppliers for growth and
expansion”.The factors loading on the second factor included: Focus in establishing itself
in markets, Outreach efforts through establishment of coolers, Serve milk suppliers
according to various market, considers how products are manufactured and considers how
products are transported had strong FL between 0.502 to 0.848. This can be explained by
“Outreach efforts through establishment of coolers” The factors loading on the third factor
included:The firm considers how products are manufactured, Considered how products
are transported, aware about dairy farmers complaints, farmers satisfied with the price
paid and market share of the firm is sizeable compared to others had strong FL between
0.395 to 0.767. This can be explained by “The Company aware of dairy farmer’s
complaints”.

116
Table 4.13: Supplier Rotated Component Matrix on Performance of Dairy
Processing Firms
Statements Component
1 2 3
The firm focuses on existing milk suppliers for business growth .856 .106 .317
The firm focuses on existing milk suppliers for business expansion .899 .277
The firm focuses on establishing itself in markets .710 .502
Outreach efforts through the establishment of coolers .227 .848
The firm has served its milk suppliers according to various market .486 .721
The firm considers how products are manufactured .480 .521 .395
The firm considered how product s are transported -.142 .792 .424
The company is aware about dairy farmer’s complaints .247 .202 .767
Dairy farmers are satisfied with the price paid .211 .745
The market share of the firm is sizeable compared to other firms .166 .633
Extraction Method: Principal Component Analysis.
Rotation Method: Varimax with Kaiser Normalization.
a. Rotation converged in 9 iterations.
4.22.2 Customer Rotated Component Matrix on Performance of Dairy Processing
Firms
Results from table 4.49 shows customer rotated matrix on performance of dairy processing
firms . With regards to customerfactor loadings (FL) of Performance of dairy processing
firms showed “Five items on the first factor include; Products high in quality, Firms
products highly reliable, Wide range of products, Products are competitive and effectively
promotes its products had FL between 0.579 to 0.853. This therefore shows that
Performance of dairy processing firms can be explained by “Products high in quality”.
The factors loading on the second factor included: Products are competitive, products
conveniently delivered, Firm improved of existing milk products, Products meets various

117
market segments, and Respond to customer complaints had FL (0.442 to 0.741). This can
be explained by “Firm improved existing products” The factors loading on the third factor
included:Respond to customer expectations and Respond to customer complaints had
strong FL between 0.756 and 0.894. This can be explained by “Respond to customer
expectations”.
Table 4.45: Customer Rotated Component Matrix on Performance of Dairy
Processing Firms
Statements Component
1 2 3
The firm has improved on existing milk products .166 .741
The firms’ products meets various market segments .280 .617 .385
The firm offers products that are highly reliable .852
The firm offers products that are of high quality .853
The firm offers a wide range of products to the market .693 .155 .231
The firm quickly respond to customer expectations .246 .894
The firm quickly respond to customer complaints .442 .756
Milk products are conveniently delivered to customers .842 .178
The firm effectively promotes its products .579 .269 .312
Firms products are competitive compared to others .637 .502
Extraction Method: Principal Component Analysis.
Rotation Method: Varimax with Kaiser Normalization.
a. Rotation converged in 5 iterations.
4.23 KMO and Bartlett’s Test on Performance of Dairy Processing Firms
4.23.1 Supplier KMO and Bartlett’s Test on Performance of Dairy Processing

118
Firms
The functionality of factor analysis was measured using Kaiser-Meyer-Olkin. Table 4.50
shows the results of KMO Measure of Sampling Adequacy. Keiser, (1974) recommends
accepting values greater than .5 as barely acceptable. Values between .5 and .7 are
mediocre, values between .7 and .8 are good, values between .8 and .9 are great and values
above .9 are superb (Field, 2013), for these data the value is 0.775, which falls in to range
of good: so we should be confident that factor analysis is appropriate for these data.
Bartlett’s Test of Sphericity result is significant at 0.000 level indicating a significant
relationship among the variables and therefore suitable for factor analysis.
Table 4.14: Supplier KMO and Bartlett's Test on Performance of Dairy Processing
Firms
Kaiser-Meyer-Olkin Measure of Sampling Adequacy. .775
Bartlett's Test of Sphericity
Approx. Chi-Square 1928.500
Df 45
Sig. .000
4.23.2 Customer KMO and Bartlett's Test on Performance of Dairy Processing
Firms
With regards to customer, the value is 0.727, which falls in to range of good as shown on
table 4.51. This implied factor analysis was appropriate for these data. Bartlett’s Test of
Sphericity result is significant at 0.000 level indicating a significant relationship among
the variables and therefore suitable for factor analysis.
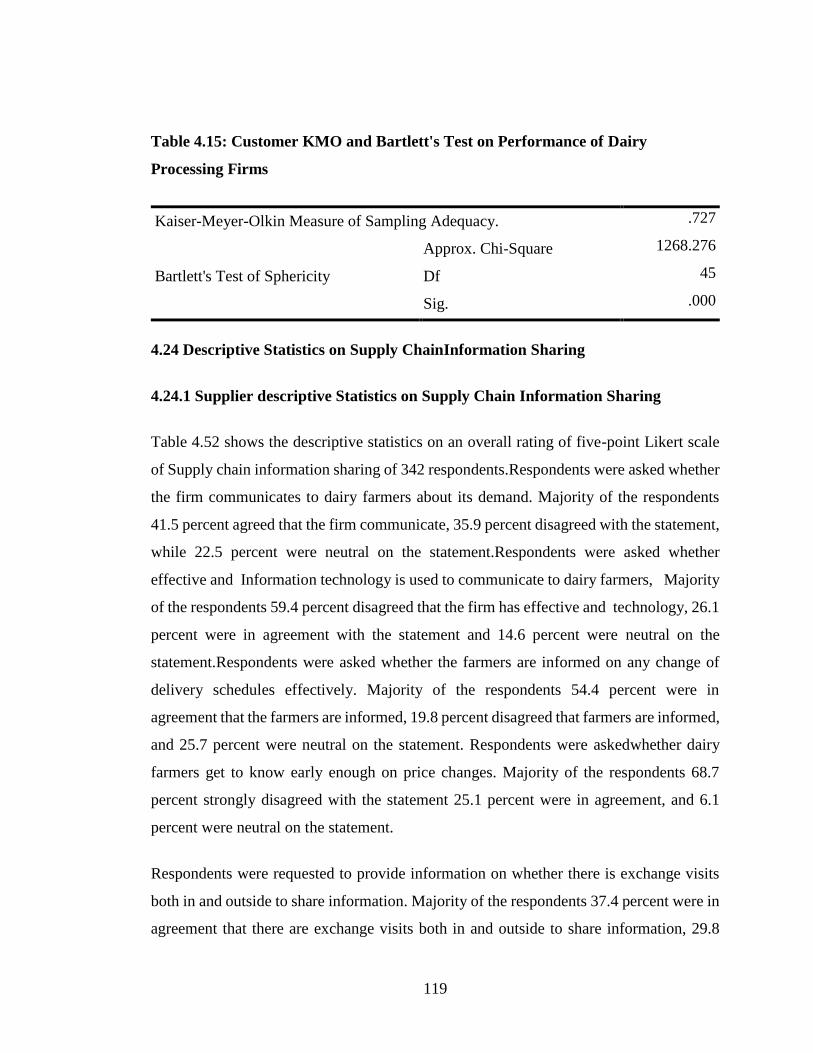
119
Table 4.15: Customer KMO and Bartlett's Test on Performance of Dairy
Processing Firms
Kaiser-Meyer-Olkin Measure of Sampling Adequacy. .727
Bartlett's Test of Sphericity
Approx. Chi-Square 1268.276
Df 45
Sig. .000
4.24 Descriptive Statistics on Supply ChainInformation Sharing
4.24.1 Supplier descriptive Statistics on Supply Chain Information Sharing
Table 4.52 shows the descriptive statistics on an overall rating of five-point Likert scale
of Supply chain information sharing of 342 respondents.Respondents were asked whether
the firm communicates to dairy farmers about its demand. Majority of the respondents
41.5 percent agreed that the firm communicate, 35.9 percent disagreed with the statement,
while 22.5 percent were neutral on the statement.Respondents were asked whether
effective and Information technology is used to communicate to dairy farmers, Majority
of the respondents 59.4 percent disagreed that the firm has effective and technology, 26.1
percent were in agreement with the statement and 14.6 percent were neutral on the
statement.Respondents were asked whether the farmers are informed on any change of
delivery schedules effectively. Majority of the respondents 54.4 percent were in
agreement that the farmers are informed, 19.8 percent disagreed that farmers are informed,
and 25.7 percent were neutral on the statement. Respondents were askedwhether dairy
farmers get to know early enough on price changes. Majority of the respondents 68.7
percent strongly disagreed with the statement 25.1 percent were in agreement, and 6.1
percent were neutral on the statement.
Respondents were requested to provide information on whether there is exchange visits
both in and outside to share information. Majority of the respondents 37.4 percent were in
agreement that there are exchange visits both in and outside to share information, 29.8

120
percent disagreed with the statement, and 32.7 percent were neutral on the statement.
Respondents were requested to provide information on whether Information about
Inventory levels is shared with dairy farmers. Majority of the respondents 53.9 percent
disagreed with the statement, 11.4 percent were in agreement on the statement, and 39.8
percent were neutral on the statement.Respondentswere asked whether Information on
product development is always shared with milk suppliers. Majority of the respondents
61.2 percent disagreed with the statement, 17.0 percent were in agreement on the
statement, and 17.8 percent were neutral on the statement. Respondents were requested to
provide information on whether Information about milk supply disruptions is always
communicated to farmers. Majority of the respondents 71.3 percent were agreement 13.4
percent disagreed with the statement and 15.2 percent were neutral on the statement.
Respondents were requested to provide information on whether Information about market
conditions is always shared to milk supplier. Majority of the respondents 59.0 percent
disagreed that Information about market conditions is always shared to milk suppliers, 9.6
percent were in agreement on the statement and 31.3 percent were neutral on the
statement. The supply chain practitioners gave their opinions on the key supply chain
partners to include farmers, service providers, transporters, AI services personnel,
suppliers of packaging materials and the consumers of dairy processing firms products.
They commended that information is key for the success of the firm. From the results the
firm has not done well in disseminating information or sharing of the information.
Empirical evidence by Namusonge’s, Mukulu and Kirima (2015) in their thesis entitled
“Supply chain information sharing, Cooperative Behaviour and Hotel Performance”
posits that the starting point of supply chain collaboration is Supply chain information
sharing. This shows that the firm has not been good enough in Supply chain information
sharing and should consider enhancing its performance.

121
Table 4.16: Supplier Descriptive Statistics on Supply ChainInformation Sharing
Statements SD
%
D
%
N
%
A
%
SA
%
Total
%
The firm communicates to dairy farmers about
its demand
7.0 28.9 22.5 36.8 4.7 100.0
Effective and Information Technology is used
to communicate to dairy farmers
23.7 35.7 14.6 21.1 5.0 100.0
Dairy Farmers are informed on any change of
delivery schedules effectively
2.0 17.8 25.7 36.0 18.4 100.0
Dairy Farmers get to know early enough about
price changes
35.4 33.3 6.1 21.3 3.8 100.0
There is exchange visits both in and outside to
share information
10.2 19.6 32.7 34.5 2.9 100.0
Information about inventory levels is shared
with dairy farmers
24.9 24.0 39.8 9.6 1.8 100.0
Information about product developments is
always shared with our milk suppliers/farmers
41.2 24.0 17.8 12.6 4.4 100.0
Information about milk supply disruptions is
always communicated to farmers
2.9 10.5 15.2 45.3 26.0 100.0
Information about market conditions is
always shared to milk suppliers/farmers
22.5 36.5 31.3 6.1 3.5 100.0
Key: SD-Strongly Disagree; D-Disagree; N- Neutral; A- Agree; SA- Strongly Agree
4.24.2 Customer Descriptive Statistics on Supply ChainInformation Sharing
Table 4.53 shows the descriptive statistics on an overall rating of five-point Likert scale
of Supply chain information sharing of 314 respondents. Respondents were requested to
provide information on whether Customers are informed on products introduced, majority

122
respondents 49.4 percent were in agreement, 23.9 disagreed on the statement and 26.8
percent were neutral on the statement. On the item, effective information technology as a
mode of communication is used to inform customers on products, majority respondents
53.9 percent were in agreement, 26.1 disagreed on the statement and 20.1 percent were
neutral on the statement. On the item,milk products are conveniently delivered to
customers, majority respondents 57.0 percent were in agreement, 10.9 disagreed on the
statement and 32.2 percent were neutral on the statement. On the item customers get to
know early enough about price changes, majority respondents 44.6 percent were in
agreement, 35.4 disagreed on the statement and 20.1 percent were neutral on the
statement. On the item the Company is aware about customer complaints and responds on
time, majority respondents 41.8 percent were in agreement, 35.9 disagreed on the
statement and 22.3 percent were neutral on the statement.Respondents were requested to
provide information whether customers are informed of the varied milk products, majority
respondents 49.4 percent were in agreement, 26.4 disagreed on the statement and 24.2
percent were neutral on the statement. On the item customers informed on the benefits of
products, majority respondents 40.1 percent were in agreement, 30.9 disagreed on the
statement and 29.0 percent were neutral on the statement. On the item, customers know
where to buy the firm’s, majority respondents 66.2 percent were in agreement, 12.1
disagreed on the statement and 21.7 percent were neutral on the statement. On the item,
customers understand very well the products of dairy processing firms , majority
respondents 63.0 percent were in agreement, 14.3 disagreed on the statement and 22.6
percent were neutral on the statement.
It appeared that most of the customers we in agreement that the firm Supply chain
information sharing on products of dairy processing firms was fairly done. This shows
that the firm has fairly tried in reaching to customers and explained the benefits of the
products. It also shows that the customers have really understood and know where to buy
the products. Empirical evidence shows the firm is trying to achieving Vision 2030 by
offering high quality products for all its citizens/customers.
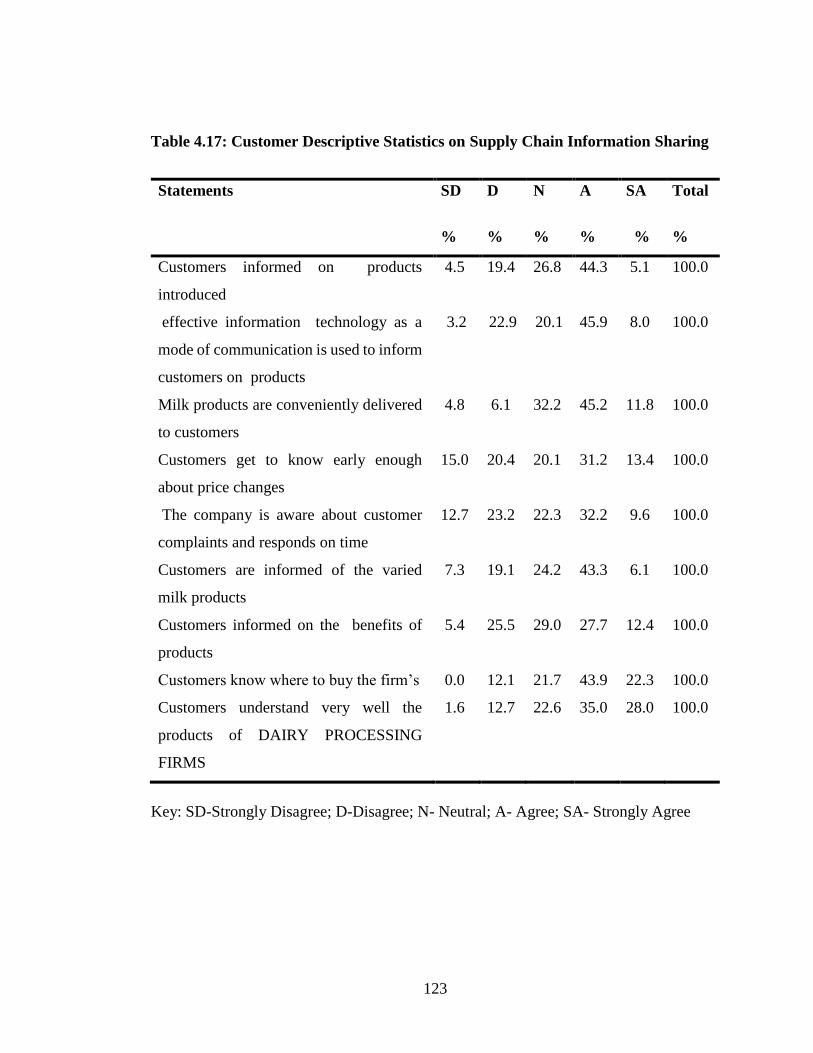
123
Table 4.17: Customer Descriptive Statistics on Supply Chain Information Sharing
Statements SD
%
D
%
N
%
A
%
SA
%
Total
%
Customers informed on products
introduced
4.5 19.4 26.8 44.3 5.1 100.0
effective information technology as a
mode of communication is used to inform
customers on products
3.2 22.9 20.1 45.9 8.0 100.0
Milk products are conveniently delivered
to customers
4.8 6.1 32.2 45.2 11.8 100.0
Customers get to know early enough
about price changes
15.0 20.4 20.1 31.2 13.4 100.0
The company is aware about customer
complaints and responds on time
12.7 23.2 22.3 32.2 9.6 100.0
Customers are informed of the varied
milk products
7.3 19.1 24.2 43.3 6.1 100.0
Customers informed on the benefits of
products
5.4 25.5 29.0 27.7 12.4 100.0
Customers know where to buy the firm’s 0.0 12.1 21.7 43.9 22.3 100.0
Customers understand very well the
products of DAIRY PROCESSING
FIRMS
1.6 12.7 22.6 35.0 28.0 100.0
Key: SD-Strongly Disagree; D-Disagree; N- Neutral; A- Agree; SA- Strongly Agree

124
4.25 Descriptive Statistics on Supply Chain Decision Synchronization
4.25.1 Supplier Descriptive Statistics on Supply Chain Decision Synchronization
Table 4.54 shows the descriptive statistics on an overall rating of five-point Likert scale
of Supply chain decision synchronization of 342 respondents. Respondents were
requested to provide information whether fixing of milk prices are done as required,
Majority of the respondents 73.6 percent strongly disagreed that fixing of milk prices are
done as required, 17.3 percent agreed on the statement and 11.1 percent were neutral on
the statement. On the item, weights disparities between dairy farmers and dairy processing
firms are well resolved, Majority of the respondents 70.1 percent strongly disagreed that
weights disparities between dairy farmers and dairy processing firms are well resolved,
16.7 percent were in agreement on the statement and 13.2 percent were neutral on the
statement.
Respondents were asked on whether quality control measures are understood by dairy
farmers. Majority of the respondents 79.9 percent were agreement that Quality control
measures are understood by dairy farmers, 10.2 percent disagree with the statement and
9.9 percent were neutral on the statement. On the item, extension services are offered to
increase production of milk, Majority of the respondents 53.2 percent were in agreement
that extension services are offered to increase production of milk, 34.5 percent disagreed
that extension services are offered to increase production of milk and 12.3 percent were
neutral on the statement. On the item, Extension services are offered to increase to increase
quality, 38.3 percent of the respondents were in agreement that extension services are
offered to increase to increase quality, 42.7 percent disagree with the statement, and 19.0
percent were neutral on the statement. On the item, Demand for early milk deliveries is
understood by dairy farmers, Majority of the respondents 85.1 percent were in agreement
that Demand for early milk deliveries is understood by dairy farmers, 8.8 percent
disagreed on the statement and 6.1 percent were neutral on the statement. On the item,
Dairy farmers receive record their daily deliveries, 92.6 percent of the respondents agreed
that Dairy farmers receive record their daily deliveries, 2.6 percent of the respondents

125
disagreed with the statement and were neutral on the statement.
The respondents were asked whether tenders offered to transporters, coolers are done as
done as required, 25.1 of the respondents percent were in agreement that tenders offered
to transporters, coolers are done as done as required, majority 49.4 percent were neutral
on the statement.However the respondents disagreed with the statement product inventory
levels are understood farmers, Majority of the respondents 38.9 percent disagreed that
Product inventory levels are understood farmers, 23.1 percent agreed on the statement and
majority 38.0 percent were neutral on the statement. Empirical studies by Lianget
al.,(2015) studies of participatory governance in co-operatives in China which showed
that in reality, participation in decision-making is only nominal as most decisions are
made by board members and management.
Table 4.50: Supplier Descriptive Statistics on Supply Chain Decision
Synchronization
Statements SD
%
D
%
N
%
A
%
SA
%
Total
%
Fixing of milk prices are done as required 36.8 34.8 11.1 13.5 3.8 100.0
Weight disparities between dairy farmers and
dairy processing firms are well resolved
37.4 32.7 13.2 16.7 0.0 100.0
Quality control measures are understood by
dairy farmers
6.1 4.1 9.9 70.5 9.4 100.0
Extension services are offered to increase
production of milk
10.8 23.7 12.3 46.5 6.7 100.0
Extension services are offered to increase
quality of milk
14.6 28.1 19.0 32.5 5.8 100.0
Demand for early milk deliveries is
understood by the dairy farmers
0.3 8.5 6.1 50.6 34.5 100.0
Dairy farmers receive record of their daily 0.3 2.3 4.7 56.1 36.5 100.0

126
deliveries
Tenders offered to transporters , coolers are
done as required
11.7 13.7 49.4 19.3 5.8 100.0
Product inventory levels are understood by
dairy farmers
15.2 23.7 38.0 17.0 6.1 100.0
Key: SD-Strongly Disagree; D-Disagree; N- Neutral; A- Agree; SA- Strongly Agree
4.25.2 Customer Descriptive Statistics on Supply Chain Decision Synchronization
Table 4.55presents the descriptive statistics on an overall rating of five-point Likert scale
of Supply chain decision synchronization of 314 respondents. Respondents were
requested to provide information on whether dairy processing firms Products prices are
reasonable and understood, majority respondents 58.6 percent were in agreement, 16.5
disagreed on the statement and 24.8 percent were neutral on the statement. The
respondents were asked whether price variation between dairy processing firms products
and others are understood by customers, majority respondents 57.0 percent were in
agreement, 17.9 disagreed on the statement and 25.2 percent were neutral on the
statement. On the item Quality of products are understood by customers, majority
respondents 70.7 percent were in agreement, 8.6percent disagreed on the statement and
20.7 percent were neutral on the statement.
Respondents were requested to provide information on whether Promotion services are
offered to increase demand, majority respondents 52.2 percent were in agreement, 11.7
disagreed on the statement and 36.0 percent were neutral on the statement. On the item
promotion efforts are done according to customers’ demands, respondents 31.5 percent
were in agreement, 36.9 disagreed on the statement and 31.5 percent were neutral on the
statement.Respondents were requested to provide information on whether dairy
processing firms products offer solutions to customer’s demands, majority respondents
50.0 percent were in agreement, 27.4 disagreed on the statement and 22.6 percent were
neutral on the statement. On the item, firm’s products are introduced timely, majority

127
respondents 58.2 percent were in agreement, 23.6 disagreed on the statement and 18.2
percent were neutral on the statement. On the item, promotion of products are done
rightfully in the retail store, majority respondents 59.9 percent were in agreement, 28.0
disagreed on the statement and 12.1 percent were neutral on the statement.
The role of the firm on decisions cannot be underestimated has it has effect on its
performance. This was supported by exploratorystudy ofFrench co-operatives by
Allemand (2013) when they recommended the use of one-to-one interviews and
observation during meetingsand debatesaswellassemi-structuredinterviews. Essential
information will assist in customer participation and decision making.

128
Table 4.51: Customer Descriptive Statistics on Supply Chain Decision
Synchronization
Statements SD
%
D
%
N
%
A
%
SA
%
Total
Dairy Processing Firms Products prices are
reasonable and understood
2.5 14.0 24.8 42.7 15.9 100.0
Price variation between Dairy Processing
Firms products and others are understood by
customers
4.5 13.4 25.2 49.7 7.3 100.0
Quality of products are understood by
customers
0.3 8.3 20.7 51.3 19.4 100.0
Promotion services are offered to increase
demand
.6 11.1 36.0 40.4 11.8 100.0
Promotion efforts are done according to
customers’ demands
8.9 28.0 31.5 23.2 8.3 100.0
Dairy Processing Firms products offer
solutions to customers
4.5 22.9 22.6 41.7 8.3 100.0
Firm’s products are introduced timely 6.4 17.2 18.2 50.6 7.6 100.0
Promotion of products are done rightfully in
the retail store
5.7 22.3 12.1 48.4 11.5 100.0
Key: SD-Strongly Disagree; D-Disagree; N- Neutral; A- Agree; SA- Strongly Agree
4.26 Descriptive Statistics on Supply Chain Incentive Alignment
4.26.1 Supplier Descriptive Statistics on Supply Chain Incentive Alignment
Table 4.56 shows the descriptive statistics on an overall rating of five-point Likert scale
of Supply chain Supply chain incentive alignment of 342 respondents.Respondents were

129
requested to provide information on whether increased Sales demands are extended to
farmers, majority of the respondents 53.5 disagreed that Increased Sales demands are
extended to farmers, 22.2 percent were in agreement with the statement and 24.3 percent
were neutral on the statement. On the item, Milk products provided to dairy farmers at
subsidized prices, majority of the respondents 84.2 percent disagreed that Milk products
provided to dairy farmers at a subsidized prices, 10 percent were on agreement on the
statement and 5.5 percent were neutral on the statement. The item Artificial
Insemination/Veterinary programs availed when required, majority of the respondents
67.3 percent disagreed with the statement, 22.2 percent were in agreement with the
statement and 10.5 percent were neutral on the statement. The item Artificial
Insemination/Veterinary programs provided at subsidized prices, majority of the
respondents 63.5 percent strongly disagreed that Artificial Insemination/Veterinary
programs provided at subsidized prices, 20.2 percent were in agreement on the statement
and 16.4 percent were neutral on the statement.
Respondents were asked whether the firm link dairy farmers to financial services, majority
of the respondents 55.8 percent agreed that Firm link dairy farmers to financial services,
28.1 percent disagreed with the statement and 16.1 percent were neutral on the statement.
On the item, Payment for milk produce done promptly, 50.6 percent of the respondents
disagreed that Payment for milk produce done promptly, 42.4 percent were in agreement
with the statement and 7.0 percent were neutral on the statement. The item, Establishment
of cooler plants for mutual benefit, 57.3 percent of the respondents were in agreement that
establishment of cooler plants is for mutual benefit, 17.2 percent of the respondents
disagreed with the statement and 25.4 percent were neutral on the statement.
On the item Shared savings on milk reduced prices, majority of the respondents 51.8
percent disagreed that Shared savings on milk reduced prices, 17.5 percent agreed on the
statement and 30.7 percent were neutral on the statement. Respondents were asked
whether transport services are aligned for mutual benefit, majority of the respondents 50.0
percent were in agreement that Transport services are aligned for mutual benefit, 23.7
percent disagreed on the statement and 26.3 percent were neutral on the statement.

130
Other scholars suggest that long-term orientation has to do with incentivizing managers
to make decisions that benefit the organization in the long run, even at the cost of forgoing
short-term profits in order to avoid short-termism and managerial myopia (Bouwens et
al., 2013; Flammer and Bansal, 2017). It is a focus on future benefits and reflects a desire
to build and maintain long-term relationships (Hwang, Chung, and Jin, 2013; Malekiand
de Jong, 2014).). Moreover, Pay-for-performance contracts, in particular, emphasise
incentive alignment (Kim et al., 2007; Datta and Roy, 2011), motivating suppliers to
achieve the buyer’s objectives e.g. cost reduction or innovation (Sumo et al., 2016). It has
also been established that about 80% of the milk sold in Kenya goes through the informal
channels (Karanja, 2004). Therefore the improvement of these marketing channels will
also play an important role in improving the marketing and also the profitability of
farmers.

131
Table 4.18: Supplier Descriptive statistics on Supply Chain Incentive Alignment
Statements SD
%
D
%
N
%
A
%
SA
%
Total
Increased sales demand are extended to dairy
farmers
16.4 37.1 24.3 22.2 0.0 100.0
milk products are provided to dairy farmers
at subsidized prices
60.8 23.4 5.0 8.8 2.0 100.0
Artificial Insemination/Veterinary programs
are availed when required by the dairy farmers
38.6 28.7 10.5 17.5 4.7 100.0
Artificial Insemination/Veterinary programs
are provided to the dairy farmer at subsidized
price
39.5 24.0 16.4 20.2 0.0 100.0
The firm link dairy farmers to financial
services
7.0 21.1 16.1 48.2 7.6 100.0
Payment for milk produce is done promptly 6.4 44.2 7.0 31.0 11.4 100.0
The establishment of the cooler plants is for
mutual benefit
6.1 11.1 25.4 47.7 9.6 100.0
Savings as a result of reduced milk production
costs are shared
31.0 20.8 30.7 17.5 0.0 100.0
Transport services are aligned for mutual
benefit
7.0 16.7 26.3 43.3 6.7 100.0
Key: SD-Strongly Disagree; D-Disagree; N- Neutral; A- Agree; SA- Strongly Agree
4.26.2 Customer Descriptive Statistics on Supply Chain Incentive Alignment
Table 4.57 shows the descriptive statistics on an overall rating of five-point Likert scale
of Supply chain Supply chain incentive alignment of 314 respondents. Respondents were
requested to provide information on whethersales demand are aligned to the customers’

132
requirements, majority respondents 59.9 percent were in agreement, 8.9 disagreed on the
statement and 31.2 percent were neutral on the statement. On the item,milk products
accessed to customers, majority respondents 71.3 percent were in agreement, 15.9
disagreed on the statement and 12.7 percent were neutral on the statement. On the item,
the firm pricing is demand driven, majority respondents 46.2 percent were in agreement,
18.4 disagreed on the statement and 35.4 percent were neutral on the statement. On the
item, there is shared cost on high demand of products, majority respondents 46.8 percent
were in agreement, 25.8 disagreed on the statement and 27.4 percent were neutral on the
statement. On the item the product prices are align to the demand, majority respondents
49.0 percent were in agreement, 24.6 disagreed on the statement and 26.4 percent were
neutral on the statement.Respondents were also requested to provide information on
whether prices of the products are align to quality, majority respondents 60.5 percent were
in agreement, 18.8 disagreed on the statement and 20.7 percent were neutral on the
statement. On the item promotion of the products are align to the contents of the products,
majority respondents 65.3 percent were in agreement, 13.4 disagreed on the statement and
21.3 percent were neutral on the statement.

133
Table 4.19: Customer Descriptive Statistics on Supply Chain Incentive Alignment
Statements SD
%
D
%
N
%
A
%
SA
%
Total
Sales demand are aligned to the customers’
requirements
0.6 8.3 31.2 47.8 12.1 100.0
milk products accessed to customers 5.4 10.5 12.7 59.2 12.1 100.0
The firm pricing is demand driven 5.7 12.7 35.4 36.6 9.6 100.0
There is shared cost on high demand of
products
10.2 15.6 27.4 36.6 10.2 100.0
The product prices are align to the demand 6.1 18.5 26.4 38.2 10.8 100.0
Prices of the products are align to quality 5.1 13.7 20.7 53.2 7.3 100.0
Promotion of the products are align to the
contents of the products
3.5 9.9 21.3 48.1 17.2 100.0
Key: SD-Strongly Disagree; D-Disagree; N- Neutral; A- Agree; SA- Strongly Agree
4.27 Descriptive Statistics on Teamwork
4.27.1 Supplier Descriptive Statistics on Supply Chain Teamwork
Table 4.58 shows the descriptive statistics on an overall rating of five-point Likert scale
of Supply chain teamworkof 342 respondents. Respondents were requested to provide
information on whether the firm is committed to the growth of the industry, Majority of
the respondents 52.9 percent agreed that firm committed to the growth of the industry,
24.9 percent disagreed on the statement and 22.2 percent were neutral on the statement.
On the item, the firm committed to improving services to milk suppliers, Majority of the
respondents 36.3 percent disagreed that Firm committed to improving services to milk
suppliers, 26.6 percent were in agreement with the statement and 37.1 percent were neutral
on the statement. On the item there are joint efforts to increase milk production, Majority

134
of the respondents 48.5 percent disagreed that there are joint efforts to increase milk
production, 26.9 percent were in agreement with statement and 24.6 percent were neutral
on the statement. The item firm enhances coordination through teamwork. 24.3 percent of
the respondents were in agreement that firm enhances coordination through teamwork,
23.4 percent disagreed on the statement and majority 52.3 percent was neutral on the
statement. On the item,all the parties along the chain plan together, Majority of the
respondents 39.8 percent of the respondents disagreed that all the parties along the chain
plan together, 27.5 percent were in agreement with the statement and 42.7 percent were
neutral on the statement.
On the item, there is Cordial relationship between firm and milk suppliers. 59.7 percent
of the respondents were in agreement that there is Cordial relationship between firm and
milk suppliers, 24.5 percent disagreed on the statement and majority 25.8 percent was
neutral on the statement. Respondents were asked whether there are supply alliances with
all parties within the chain. 28.9 percent of the respondents were in agreement that there
is there are supply alliances with all parties within the chain, 21.1 percent disagreed on
the statement and majority 50.0 percent was neutral on the statement. On the item there is
mutual trust between firm and milk suppliers. 35.4 percent of the respondents were in
agreement that there is there is mutual trust between firm and milk suppliers, 31.3 percent
disagreed on the statement and majority 33.3 percent was neutral on the statement. On the
item there is spirit of togetherness between firm and milk suppliers. 56.4 percent of the
respondents were in agreement that there is there is spirit of togetherness between firm
and milk suppliers, 18.1 percent disagreed on the statement and majority 25.4 percent was
neutral on the statement. Empirical studies by Simatupang andSridharan (2005) support
this study. The scholars noted that Collaborations between trading partners in Supply
chain information sharingfacilitates Supply chain decision synchronization between these
partners contributing towards achieving significant business performance.

135
Table 4.20 : Supplier Descriptive Statistics on Supply Chain Teamwork
Statements SD
%
D
%
N
%
A
%
SA
%
Total
%
The firm is committed to the growth of the
industry
0.3 24.6 22.2 30.7 22.2 100.0
The firm is committed to improving the
services to milk suppliers
0.0 36.3 37.1 21.9 4.7 100.0
There is joint efforts to increase milk
production
5.8 42.7 24.6 20.5 6.4 100.0
The firm enhances coordination through
teamwork
4.4 19.0 52.3 20.5 3.8 100.0
All the parties along the chain plan together 13.2 26.6 42.7 13.7 3.8 100.0
There is Cordial relationship between the firm
and milk suppliers
2.6 21.9 25.8 45.9 3.8 100.0
There is supply alliances with all the parties
within the chain
9.4 11.7 50.0 25.1 3.8 100.0
There is mutual trust between the firm and
milk suppliers
4.7 26.6 33.3 29.8 5.6 100.0
There is the spirit of togetherness between the
firm and milk suppliers
2.6 15.5 25.4 52.6 3.8 100.0
Key: SD-Strongly Disagree; D-Disagree; N- Neutral; A- Agree; SA- Strongly Agree
4.27.2 Customer Descriptive Statistics on Supply Chain Teamwork
Table 4.59 below shows the descriptive statistics on an overall rating of five-point Likert
scale of Supply chain teamworkof 314 respondents.Respondents were requested to
provide information on whether the firm is committed to needs of customers, majority
respondents 69.1 percent were in agreement, 10.8 disagreed on the statement and 20.1

136
percent were neutral on the statement. On the item the firm is committed to improving the
quality of their products, majority respondents 72.3 percent were in agreement, 11.1
disagreed on the statement and 16.6 percent were neutral on the statement. On the item
there is joint effort to increase market share, majority respondents 65.3 percent were in
agreement, 8.6 disagreed on the statement and 26.1 percent were neutral on the statement.
On the item the firm enhances cooperation to deliver required products, majority
respondents 69.4 percent were in agreement, 5.4 disagreed on the statement and 25.2
percent were neutral on the statement. On the item all the parties along the chain promote
the products, majority respondents 59.2 percent were in agreement, 18.7 disagreed on the
statement and 22.0 percent were neutral on the statement. Respondents were asked on
whether there is Cordial relationship between the firm and customers, majority
respondents 67.5 percent were in agreement, 10.8 disagreed on the statement and 21.7
percent were neutral on the statement. On the item there is supply alliances with all the
parties within the chain, majority respondents 53.8 percent were in agreement, 17.5
disagreed on the statement and 28.7 percent were neutral on the statement. On the item,
the firm has measures to ensure customers trust their products, majority respondents 58.0
percent were in agreement, 16.5 disagreed on the statement and 25.5 percent were neutral
on the statement. On the item, through coordinated promotion the customers are informed
and retained, majority respondents 51.3 percent were in agreement, 26.8 disagreed on the
statement and 22.0 percent were neutral on the statement.
The results showed divergent opinions on the statements although majority were in
agreement with the statements. Scholars have saidthat “different stakeholders from
different functional areas or organizations are involved in a working team, such as an SCM
team, contradictory interests, assumptions, expectations, knowledge and perceptions
may seriously jeopardize team processes” (Elias and Zwikael, 2007) Similarly. Holweg et
al. (2005) state that firms often have diverging interests in the shortterm, and such conflicts
of interest mitigate the commitment of SC collaboration and fully sharing demand
information.

137
Table 4.21: Customer Descriptive Statistics on Supply Chain Teamwork
Statements SD
%
D
%
N
%
A
%
SA
%
Total
The firm is committed to needs of customers 0.0 10.8 20.1 58.6 10.5 100.0
The firm is committed to improving the quality
of their products
0.0 11.1 16.6 58.9 13.4 100.0
There is joint effort to increase market share 2.5 6.1 26.1 56.1 9.2 100.0
The firm enhances cooperation to deliver
required products
0.0 5.4 25.2 54.8 14.6 100.0
All the parties along the chain promote the
products
2.5 16.2 22.0 51.6 7.6 100.0
There is Cordial relationship between the firm
and customers
2.2 8.6 21.7 52.5 15.0 100.0
There is supply alliances with all the parties
within the chain
2.9 14.6 28.7 43.3 10.5 100.0
The firm has measures to ensure customers
trust their products
4.1 12.4 25.5 43.0 15.0 100.0
Through coordinated promotion the customers
are informed and retained
2.9 23.9 22.0 43.3 8.0 100.0
Key: SD-Strongly Disagree; D-Disagree; N- Neutral; A- Agree; SA- Strongly Agree
4.28 Descriptive Statistics on Dairy Board Policies and Regulations
4.28.1 Supplier Descriptive Statistics on Dairy Board Policies and Regulations
Table 4.60 shows the descriptive statistics on an overall rating of five-point Likert scale
of Dairy Board of 342 respondents. Respondents were requested to provide information
on whether the Dairy Board Act influences growth of industry, 43.2 percent of the

138
respondents were in agreement, 36.5 percent disagreed with the statement and 20.3
percent were neutral on the statement. On the item Dairy Board Organs improve services
of milk suppliers, Majority of the respondent’s 56.5 percent s disagreed that Dairy Board
Organs improve services of milk suppliers, 21.1 percent agreed on the statement and 22.5
percent were neutral on the statement.
Respondents were asked whether the Dairy Board delivers its mandate to increase milk
production, Majority of the respondents 51.2 percent s disagreed that Dairy Board delivers
its mandate to increase milk production, 18.1 percent agreed on the statement and 30.7
percent were neutral on the statement. The item Dairy Board Guidelines enhances
teamwork, Majority of the respondents 45.1 percent disagreed that Dairy Board
Guidelines enhances teamwork, 24.0 percent agreed on the statement and 31.0 percent
were neutral on the statement.
Respondents were asked to provide information on whether the Dairy Board Policies are
in line to chain parties’ performance, Majority of the respondents 32.1 were in agreement
that Dairy Board Policies are in line to chain parties’ performance, 31.0 percent disagreed
with the statement and 36.8 percent were neutral on the statement. On statement, Dairy
Board regulates the prices of dairy produce, 37.7 percent of the respondents were in
agreement that Dairy Board regulates the prices of dairy produce, 41.5 percent disagreed
with the statement and 20.8 percent were neutral on the statement. On the statement, Dairy
Board improves the quality of milk produce, 35.1 of the respondents were in agreement
that Dairy Board improves the quality of milk produce, 43.3 percent disagreed with the
statement and 21.6 percent were neutral on the statement.
Respondents were asked on whether there is mutual trust between Dairy Board and milk
Suppliers, Majority of the respondents 51.4 percent disagreed that there is mutual trust
between Dairy Board and milk Suppliers, 15.2 percent agreed on the statement and 33.3
percent were neutral on the statement. Respondents were asked on whetherthe Dairy
Board work in association with other participants, Majority of the respondents 36.5
percent disagreed on the statement Dairy Board work in association with other

139
participants, 20.0 percent agreed on the statement and 43.6 percent were neutral on the
statement.
Empirical studies by Makoni et al. (2013) shows that over 28 dairy processors are
organized under the relatively Kenya Dairy Processors’ Association, which is more
focused on members’ interests than a shared vision for the dairy industry. This might have
contributed to the divergent views of the respondents.It is worthwhile to mention affront
that the dairy board regulations still remain a challenge, particularly to milk supplies who
normally demand better prices compared to the prices offered by themilk processors. The
main reason is that farmers want the cash for their immediate use and at a better price.
Table 4.22: Supplier Descriptive Statistics on Dairy Board Policies and Regulations
Statements SD
%
D
%
N
%
A
%
SA
%
Total
%
The Dairy Board Act influences the growth of
industry
15.2 21.3 20.3 37.1 6.1 100.0
The Dairy Board organs improve the services
of milk suppliers
12.9 43.6 22.5 17.3 3.8 100.0
The Dairy Board delivers its mandate to
increase milk production
12.0 39.2 30.7 16.1 2.0 100.0
The Dairy Board guidelines enhances
teamwork
13.2 31.9 31.0 19.9 4.1 100.0
The Dairy Board policies are in line to chain
parties performance
7.0 24.0 36.8 30.1 2.0 100.0
The Dairy Board regulates the prices of dairy
produce
18.1 23.4 20.8 30.7 7.0 100.0
The Dairy Board improves the quality of milk
produce
8.2 35.1 21.6 27.2 7.9 100.0
There is mutual trust between Dairy Board and 9.9 41.5 33.3 15.2 0.0 100.0

140
milk Suppliers
The Dairy Board work in association with other
participants
7.0 29.5 43.6 19.9 0.0 100.0
Key: SD-Strongly Disagree; D-Disagree; N- Neutral; A- Agree; SA- Strongly Agree
4.28.2 Customer Descriptive Statistics on Dairy Board Policies and Regulations
Table 4.61 shows the descriptive statistics on an overall rating of five-point Likert scale
of Dairy Board of 314 respondents. Respondents were requested to provide information
on whether the Dairy Board influences customer satisfaction, majority respondents 34.4
percent were in agreement, 32.2 disagreed on the statement and 33.3 percent were neutral
on the statement. On the item, the Dairy Board organs improve services of customers,
respondents 40.8 percent were in agreement, 42.1 disagreed on the statement and 17.2
percent were neutral on the statement. On the item the Dairy Board embraces joint effort
to increase milk production, majority respondents 41.7 percent were in agreement, 25.1
percent disagreed on the statement and 33.1 percent were neutral on the statement.
Respondents were requested to provide information on whether the Dairy Board
guidelines enhances teamwork, respondents 28.9 percent were in agreement, 29.3
disagreed on the statement and 41.7 percent were neutral on the statement.Respondents
were also requested to provide information on whether the Dairy Board policies are in line
to chain parties’ performance, respondents 36.4 percent were in agreement, 42.3 disagreed
on the statement and 21.3 percent were neutral on the statement. On the item the Dairy
Board regulates the prices of dairy products, majority respondents 41.4 percent were in
agreement, 22.3 disagreed on the statement and 36.3 percent were neutral on the
statement. On the item, the Dairy Board improves the quality of milk products, majority
respondents 47.4 percent were in agreement, 29.0 disagreed on the statement and 23.6
percent were neutral on the statement. On the item there is mutual trust between dairy
board and milk customers, majority respondents 44.0 percent were in agreement, 24.5
percent disagreed on the statement and 31.5 percent were neutral on the statement. On the

141
item, the Dairy board work in association with other participants in milk chain to enhance
customer satisfaction, majority respondents 39.2 percent were in agreement, 33.8 percent
disagreed on the statement and 27.1 percent were neutral on the statement.
Table 4.57: Customer Descriptive Statistics on Dairy Board Poloicies and
Regulations
Statements SD
%
D
%
N
%
A
%
SA
%
Total
Dairy Board influences customer satisfaction 4.8 27.4 33.4 28.7 5.7 100.0
The Dairy Board organs improve services of
customers
1.3 40.8 17.2 37.3 3.5 100.0
The Dairy Board embraces joint effort to
increase milk production
0.6 24.5 33.1 31.8 9.9 100.0
The Dairy Board guidelines enhances
teamwork
2.5 26.8 41.7 24.8 4.1 100.0
The Dairy Board policies are in line to chain
parties performance
3.8 38.5 21.3 30.3 6.1 100.0
The Dairy Board regulates the prices of dairy
products
6.7 15.6 36.3 29.6 11.8 100.0
The Dairy Board improves the quality of milk
products
2.9 26.1 23.6 36.9 10.5 100.0
There is mutual trust between dairy board and
milk customers
1.6 22.9 31.5 34.1 9.9 100.0
The Dairy board work in association with other
participants in milk chain to enhance customer
satisfaction
5.1 28.7 27.1 34.7 4.5 100.0
Key: SD-Strongly Disagree; D-Disagree; N- Neutral ; A- Agree; SA- Strongly Agree

142
4.29 Descriptive Statistics on Performance of Dairy Processing Firms
4.29.1 Suppliers Descriptive Statistics on Performance of Dairy Processing Firms
Table 4.62shows the descriptive statistics on an overall rating of five-point Likert scale of
performance of dairy processing firms of 342 respondents.Respondents were requested to
provide information on whether the firm focuses on existing milk supplies for business
growth. Majority of the respondents 48.5 percent were in agreement with the statement,
20.1 percent disagreed with the statement while 31.3 percent were neutral on the
statement. On the item; firm focuses on existing milk suppliers for business expansion.
38.0 percent respondents were in agreement with the statement, 23.6 percent disagreed
with the statement while 38.3 percent were neutral on the statement. On the item; the firm
focuses on establishing itself in market, majority of the respondents 58.2 percent were in
agreement that the firm focuses on establishing itself in markets for business growth and
expansion, 10.5 disagreed with the statement and 31.3 percent were neutral on the
statement. Empirical studies conducted by mwakida in (2009) indicate that the dairy sub-
sector achieved improved growth because of the turnaround strategies adopted. The
growth of the dairy subsector happened concurrently with the growth of dairy processing
firms .
The respondents were asked whether outreach effort through the establishment of coolers
has led to business growth, majority of the respondents 77.5 percent were in agreement,
22.2 percent were neutral on the statement. Only 0.3 percent disagreed that outreach
efforts through establishment of coolers has led to business growth. On the item; the firm
has served its milk suppliers according to various; majority of the respondents 55.9 percent
were in agreement with the statement, 10 percent disagreed on the statement while 34.2
percent were neutral on the statement. On the item, the firm considers how products are
manufactured by extending their services to the dairy farmers 34.8 percent were in
agreement that the firm does, 54.9 percent disagreed on the statement while 32.2 percent
were neutral on the statement. On the item; the firm considers how products are
transported from milk suppliers in respective localities majority of the respondents 46.7

143
percent were in agreement that the firm does, 32.4 percent disagreed that the firm
considers how products are transported from milk suppliers in respective localities while
20.8 percent were neutral on the statement.
Crook and Combs (2007) found that strong members reap most of the direct benefits, weak
members can often gain by building switching costs with strong members, leveraging
SCM outside the focal chain, and increasing survival chances. The results are not in
agreement with the opinions of supply chain practitioners when they were interviewed.
They gave their opinions on the programmes they have in place to expand the market, they
said “formation of cooperative farms for example kibbutz, to increase milk volume,
exporting products to different countries, they also teach farmers on quality of milk. To
maintain and improve profits they have programmes for extension services, have
programmes on reduction of cost of production. The supply chain practitioner’s opinions
were a cover up considering the actual results from farmers (suppliers).Respondents were
asked to provide information on whether the firm considers the company is aware about
dairy farmer’s complaints and respond on time as a performance indicator. Majority of the
respondents 73.7 percent disagreed on the statement, 12.6 percent we in agreement while
13.7 percent were neutral on the statement. The item, dairy farmers are satisfied with the
price paid to milk produce as a performance indicator. Majority of the respondents 81.0
percent strongly disagreed that the firm does, 9.4 percent were in agreement and 9.6
neutral on the statement. The item, the Market share of the firm is sizeable compared to
other processing firms, 34.8 percent of the respondent was in agreement that the firm does,
Majority of the respondents 42.1 percent were neutral on the statement. However, 23.1
percent disagreed that the share of the firm is sizeable compared to other processing firms.
The results are in agreement with supply chain practitioners that the market is sizeable.
They gave their opinions on firm’s performance, according to the managers they say the
company is making profits. On justification they said “the market is always available for
our products. In fact Dairy Processing Firms products are always competitive”. However
none could approximate the profits of the firm for the last years. They said the records on
the same were in the main office Nairobi. They also gave their opinions on the positioning

144
of the firm. According to majority they said is position two after close competitor from
private milk processing firm Brookside.

145
Table 4.58: Suppliers Descriptive Statistics on Performance of Dairy Processing
Firms
Statements SD
%
D
%
N
%
A
%
SA
%
Total
%
The firm focuses on existing milk suppliers
for business growth
6.1 14.0 31.3 40.6 7.9 100.0
The firm focuses on existing milk suppliers
for business expansion
5.8 17.8 38.3 30.1 7.9 100.0
The firm focuses on establishing itself in
markets for business growth and expansion
2.3 8.2 31.3 47.4 10.8 100.0
Outreach efforts through establishment of
coolers has led to business growth
0.0 0.3 22.2 64.6 12.9 100.0
The firm has served its milk suppliers
according to various market segments
0.6 9.4 34.2 43.9 12.0 100.0
The firm considers how products are
manufactured by extending their services the
to the dairy farmers
29.8 25.1 10.2 22.8 12.0 100.0
The firm considers how products are
transported from milk suppliers in respective
localities
10.2 22.2 20.8 36.8 9.9 100.0
The company is aware about dairy farmers
complaints and responds on time
14.9 58.8 13.7 8.8 3.8 100.0
Dairy farmers are satisfied with the price paid
to milk produce
59.9 21.1 9.6 5.3 4.1 100.0
The market share of the firm is sizeable
compared to other processing firms
2.0 21.1 42.1 26.9 7.9 100.0
Key: SD-Strongly Disagree; D-Disagree; N- Neutral; A- Agree; SA- Strongly Agree

146
4.29.2 Customer Descriptive Statistics on Performance of Dairy Processing Firms
Table 4.63 shows the descriptive statistics on an overall rating of five-point Likert scale
of performance of dairy processing firms of 314 respondents. Respondents were requested
to provide information of Likert scale1-5. On the item; the firm has improved on existing
milk products, majority respondents 69.1 percent were in agreement, 18.1 disagreed on
the statement and only 12.7 percent were neutral on the statement. On the item, the firm’s
products meets various market segments majority respondents 64.0 percent were in
agreement, 8.8 disagreed on the statement and only 27.1 percent were neutral on the
statement. On the item, the firm offers products that are highly reliable majority
respondents 78.1 percent were in agreement, 9.6 disagreed on the statement and only 12.4
percent were neutral on the statement. On the item, the firm offers products that are of
high in quality respondents 72.6 percent were in agreement, 4.1 disagreed on the statement
and only 23.2 percent were neutral on the statement. On the item, the firm offers a wide
range of products to the market compared to its competitor’s majority respondents 57.3
percent were in agreement, 14.6 disagreed on the statement and only 28.6 percent were
neutral on the statement.
The respondents were asked whether the firm quickly responds to customer expectations
majority respondents 58.3 percent were in agreement, 17.2 disagreed on the statement and
only 24.5 percent were neutral on the statement. On the item the firm quickly responds to
customer complaints majority respondents 45.5 percent were in agreement, 23.3 disagreed
on the statement and only 31.2 percent were neutral on the statement. On the item, milk
products are conveniently delivered to customer’s majority respondents 64.7 percent were
in agreement, 16.2 disagreed on the statement and only 19.1 percent were neutral on the
statement. On the item, the firm effectively promotes its products majority respondents
60.8 percent were in agreement, 18.8 disagreed on the statement and only 20.4 percent
were neutral on the statement.
Since majority of the respondent were in agreement with the performance of the firm then
it clearly shows that customers are satisfied with products of dairy processing firms.

147
Customer responsiveness is key on customer orders and requests. Several researches
pointed out that customer responsiveness is one of the most important factors that can be
measured in the performance of SC. This tudy is is consistent with findings by scholars
by sayin that effective performance measurement can be achieved based on SC metrics
linked to customer satisfaction particularly (Banomyong & Supatn, 2011). Therefore,
responsiveness is usually related with innovative products or products with short lead
time, which describes the level of collaboration needed (Ramanathan et al., 2011).
Table 4.59: Customer Descriptive Statistics on Performance of Dairy Processing
Firms
Statements SD
%
D
%
N
%
A
%
SA
%
Total
%
The firm has improved on existing milk
products
4.1 14.0 12.7 61.1 8.0 100.0
The firms products meets various market
segments
5.1 3.8 27.1 52.5 11.5 100.0
The firm offers products that are highly
reliable
1.0 8.6 12.4 63.1 15.0 100.0
The firm offers products that are of high in
quality
0.0 4.1 23.2 58.9 13.7 100.0
The firm offers a wide range of products to the
market compared to its competitors
1.9 12.7 28.0 38.2 19.1 100.0
The firm quickly respond to customer
expectations
4.5 12.7 24.5 51.0 7.3 100.0
The firm quickly respond to customer
complaints
6.7 16.6 31.2 33.1 12.4 100.0
Milk products are conveniently delivered to
customers
2.5 13.7 19.1 52.9 11.8 100.0
The firm effectively promotes its products 1.0 17.8 20.4 48.1 12.7 100.0
Products are competitive compared to others 4.8 12.4 19.7 51.0 12.1 100.0
Key: SD-Strongly Disagree; D-Disagree; N- Neutral; A- Agree; SA- Strongly Agree

148
4.30 Quantitative Results
4.30.1 Supplier Correlations Results
The results on the Table 4.64 shows supplier correlations.Saunders, Lewis and Thornhill
(2015) assert that, correlation coefficients enable a researcher to quantify the strength of
the linear relationship between two or more variables.Correlation is often used to explore
the relationship among a group of variables and in turn helping in testing for
Multicollinearity(Pallant, 2010). Multicollinearity is the undesirable situation where the
correlations among the independent variables are strong. Multicollinearity misleadingly
bloats the standard errors thus making some variables statistically insignificant while they
should be else significant (Martz, 2013).
Numbers are Pearson correlation coefficients, which go from -1 to 1. The closer to 1 means
strong correlation. A negative value indicates an inverse relationship. The correlation
analysis of the study revealed that IS (r=.151, p=.03), DS (r= .094, p=.042) and IA
(r=.0148, p=.003) indicating there positive relationship on Performance of Dairy
Processing Firms while T(r=.632, p=.000) and DB (r=.247, p=.000) indicating a strong
positive relationship on Performance of Dairy Processing Firms .
Table 4.23: Supplier Correlations Results
Variables Performance Information Decision Incentive Team Dairy
Pearson
Correlation
Performance 1.000
Information .151
Decision .094
Incentive .148
Teamwork .632
Dairy .247
Sig. (1-
tailed)
Performance .
Information .003 .
Decision .042 .000 .
Incentive .003 .000 .000 .

149
Teamwork .000 .000 .000 .000 .
Dairy .000 .000 .000 .000 .000 .
Correlation is significant at 0.05 level (1-tailed)

150
4.30.2 Customer Correlations Results of SCC on Performance of Dairy Processing
Firms
Table 4.65 shows the Pearson correlation matrix for all variables of the study model.
Numbers are Pearson correlation coefficients, which go from -1 to 1. The closer to 1 means
strong correlation. A negative value indicates an inverse relationship. The correlation
analysis of the study revealed that IS (r=.448, p=.000), DS (r= .269, p=.000) and IA
(r=.556, p=.000), T(r=.558, p=.000) and DB (r=.413, p=.000) all indicating a strong
positive relationship on Performance of Dairy Processing Firms .
Table 4.24: Customer Correlations Results of SCC on Performance of Dairy
Processing Firms
Variables Performance Information Decision Incentive Team Dairy
Pearson
Correlation
Performance 1.000
Information .448
Decision .269
Incentive .556
Teamwork .558
Dairy .413
Sig.(1-
tailed)
Performance .
Information .000 .
Decision .000 .000 .
Incentive .000 .000 .000 .
Teamwork .000 .000 .000 .000 .
Dairy .000 .000 .000 .000 .000 .
Correlation is significant at 0.05 level of confidence(1-tailed)
4.30.3 Autocorrelation or Serial Test
Autocorrelation occur when the residuals are not independent from each other
(Tabachnick & Fidell, 2013). The assumption of independence means that the errors in
the model or in equation are not related to each other. The equation that is used to estimate
the standard error is valid only if observations are independent (Field, 2013). From the

151
regression model summary on table 4.66 with respect to supplier and 4.67 with respect to
customer autocorrelation was tested using Durbin-Watson. As a conservative rule, values
less than 1 or greater than 3 raise alarm. The closer to 2 the value is, the better. The data
for the study with respect to supplier gave values 1.911 without mediator and 1.949 with
mediator. With respect to customer the values were 1.860 without mediator and 1.820
without mediator. As a rule of the thumb values showed that there is no autocorrelation in
the data.
4.30.4 Supplier and Customer Normality Test of Variables
Figures 4.2and 4.3 shows the selected variables matches the test distribution as the points
cluster around a straight line. Performance of Dairy Processing Firms was conceptualized
as the dependent variable in the present study. Performance was measured using nine
items. The P-P plot presented in figures shows that plotted points were close to the
diagonal line on either side. This shows that the distribution for performance of Dairy
Processing Firms was normal. Hence the variable was used in its original form.

152
Figure 4.1: Supplier Normal P-P plot of Variables
Figure 4.2: Customer Normal P-P plot of Variables
4.30.5Supplier and Customer Normality Test of study Variables
The histogram shownin figures 4.4 and 4.5 shows the variables normality. According to
Abebe & Angriawan (2013) the residual should a mean of zero and a standard deviation
of 1 for a normal distribution. For the study (mean -1.91 and std. Dev. 0.993) for supplier
and (mean-1.12 and std. Dev. 0.992) for the customer.

153
Figure 4.3: Supplier Histogram of Normality Test of study Variables
Figure 4.4: Customer Histogram of Normality Test of study Variables

154
4.30.6 Test of Multicollinearityof Predictors
Multicollinearity exists when there is a strong correlation between two or more predictors
(Field, 2013). Correlation matrix gives correlation coefficients between a single factor and
every other factor in the investigation. The correlation coefficient between a factor and
itself is always 1; hence the principal diagonal of the matrix containts 1s’. This therefore
means it is an identity matrix (Khotari, 2014). Table 4.64 and 4.65 shows there was no
Multicollinearity amongst the observed factors for the variable under investigation.
According to Field (2013) posit another way of checking Multicollinearity is by use of
SPSSdiagnostic Variance Inflation Factor (VIF). The VIF indicates whether a predictor
has a strong linier relationship with other predictors. Related to the VIF is the tolerance
statistic, which is its reciprocal (1/VIF). The general guidelines “ if the largest VIF is
greater than 10 then there is cause for concern; If the average VIF is substantially greater
than 1 then the regression may be biased; tolerance below 0.1 indicates a serious problem
and tolerance below 0.2 indicates a potential problem”. The results of the study VIF with
respect to supplier without mediator range between (1.122- 2.227) and (1.128 - 2.182)
with mediator. All this showed no cause for concern hence no Multicollinearity as
indicated in table 4.70 and 4.71. Tolerance range between (0.447 - 0.891) without
mediator and (0.458 - 0.886) with the mediator. All values not below 0.1 hence no
Multicollinearity.
With respect to customer, VIF without mediator range between (1.288- 1.886) and (1.372
– 1.943) with mediator. All this showed no cause for concern hence no Multicollinearity
as indicated in table 4.72 and 4.73. Tolerance range between (0.447 - 0.891) without
mediator and (0.530 - 0.776) with the mediator. All values not below 0.1 hence no
Multicollinearity.

155
4.31 Regression Model Summary for SCC and Performance of Dairy Processing
Firms
Multiple linear regression analyses were employed to develop models relating the
fourindependent variables, one mediating variable and one dependent variable. In the first
model, the model is without mediator and the secondmodel with mediator.
4.31.1 Supplier Regression Model Summary for SCC and Performance of Dairy
Processing Firms
Table 4.66 shows a multiple regression summary. A multiple regression is an extension
of simple linear regression. A multiple linear regression was carried out to ascertain the
extent to which Supply chain information sharing, Decision Synchronization, Incentive
Alignment, Supply chain teamworkand mediating effect of Dairy board can predict
Performance of dairy processing firms .
R is a Pearson correlation between predicted values and actual values of the dependent
variable. R2 is multiple correlation coefficients that represent the amount of variance of
performance of dairy processing firms is explained by four predictor variables: Supply
chain information sharing, Decision Synchronization, Incentive Alignment, and
Teamwork.The magnitude of the beta coefficients associated with the independent
variables can be compared to determine the strongest independent variable in predicting
the dependent variable (Mugenda, 2008).
The findings of the study revealed that R (.634) without the effect of mediation variable
and (.642) with the effect mediation. This was the correlation between the predictors and
the outcome. The Multiple correlation coefficient known as the coefficient of
determination, (R2) is a measure of the amount of variability in one variable that is
explained by the other (Field, 2013). The adjusted R2 gives some idea of how well the
model. In this case generalizes and its value should be close to the value of R2. The R2
value tells us that our model accounts 40.2 percent without the effect of mediating variable

156
and 41.3 percent with mediating variable. This was the variance in the influence of SCC
on performance of dairy processing firms. The coefficient of determination R2indicated
that the model explained only 40.2percent without effect of mediation and 41.3 percent
with mediation of the variation or change in dependent variable. Conversely, that means
that 58.7 percent with the effect of mediating variable and 59.8 percent without the effect
of the mediating variable was the variability in performance of dairy processing firms
shared with other factors than those measured on the Questionnaire. A study should be
done to establish other factors
From these findings the model generalizes well and it is close to the adjusted. The change
statistic tells whether the in R2 is significant. The significance of an R2 can be tested by F-
ratio. The model causes R2 to change from zero to .413 with mediation 0402 without
mediation. The change is the amount of variance explained and gives rise to F-ratio 47.195
with mediation and which is significant with a probability less than .005. Durbin-Watson
statistic informs whether the assumption of independent errors is tenable. As a
conservative rule values less than 1 or greater than 3 should definitely raise alarm. The
closer to 2 that the value is, the better, and data for the study gave the value 1.949 close to
2 then the assumption has almost certainly been met.

157
Table 4.62: Supplier Regression Models Summary for SCC and Performance
Model 1
Without
Mediation
R R
Square
Adjusted
R
Square
Std.
Error of
the
Estimate
Change Statistics Durbin-
Watson R
Square
Change
F
Change
df1 df2 Sig. F
Change
1 .634a .402 .394 .61338 .402 56.535 4 3377 .000 1.911
a. Predictors: (Constant), Teamwork, Decision, Incentive, Information
b. Dependent Variable: Performance
Model 2
With
Mediation
.642b .413 .404 .60863 .413 47.195 5 336 .000 1.949
a. Predictors: (Constant), Dairy, Decision, Teamwork, Incentive, Information
b. Dependent Variable: Performance
4.31.2 Customer Model Summary for SCC and Performance of Dairy Processing
Firms
R is a Pearson correlation between predicted values and actual values of the dependent
variable. R2 is multiple correlation coefficient that represents the amount of variance of
performance of dairy processing firms is explained by five predictor variables: Supply
chain information sharing, Decision Synchronization, Incentive Alignment, Supply chain
teamworkand Dairy board.
The magnitude of the beta coefficients associated with the independent variables can be
compared to determine the strongest independent variable in predicting the dependent
variable (Mugenda , 2008). The Multiple correlation coefficient known as the coefficient
of determination, (R2) is a measure of the amount of variability in one variable that is
explained by the other (Field, 2013). The adjusted R2 gives some idea of how well the
model. In this case generalizes and its value should be close to the value of R2. The
findings of the study reveal that R without mediation 62.7 percent and with mediation 63.9

158
is the correlation between the predictors and the outcome. The R2 value tells us that our
model accounts 39.3 percent without the effect of mediating variable and 40.9 percent
with mediating variable.The coefficient of determination R2indicated that the model
explained only 39.3percent without effect of mediation and 40.9 percent with mediation
of the variation or change in dependent variable. From these findings the model
generalizes well and it is close to the adjusted. The change statistic tells whether the in R2
is significant. The significance of anR2 can be tested by F-ratio. The model causes R2 to
change from zero to .409 and the change is the amount of variance explained and gives
rise to an F-ratio 47.195 which is significant with a probability less than .005. Durbin-
Watson statistic informs whether the assumption of independent errors is tenable. As a
conservative rule values less than 1 or greater than 3 should definitely raise alarm. The
closer to 2 that te value is, the better, and data for the study gave the value 1.820 close to
2 then the assumption has almost certainly been met. They are presented on table 4.67.
Table 4.63: Customer Regression Model Summary for SCC and Performance
Model
R R
Square
Adjusted
R Square
Std.
Error of
the
Estimate
Change Statistics Durbin-
Watson R
Square
Change
F
Change
df1 df2 Sig. F
Change
1 Without
Mediation
.627a .393 .385 .54578 .393 50.025 4 309 .000 1.860
a. Predictors: (Constant), Teamwork, Decision, Information, Incentive
b. Dependent Variable: Performance
2 With
Mediation
.639b .409 .399 .53952 .409 42.595 5 308 .000 1.820
a. Predictors: (Constant), Dairy, Incentive, Decision, Information, Teamwork
b. Dependent Variable: Performance
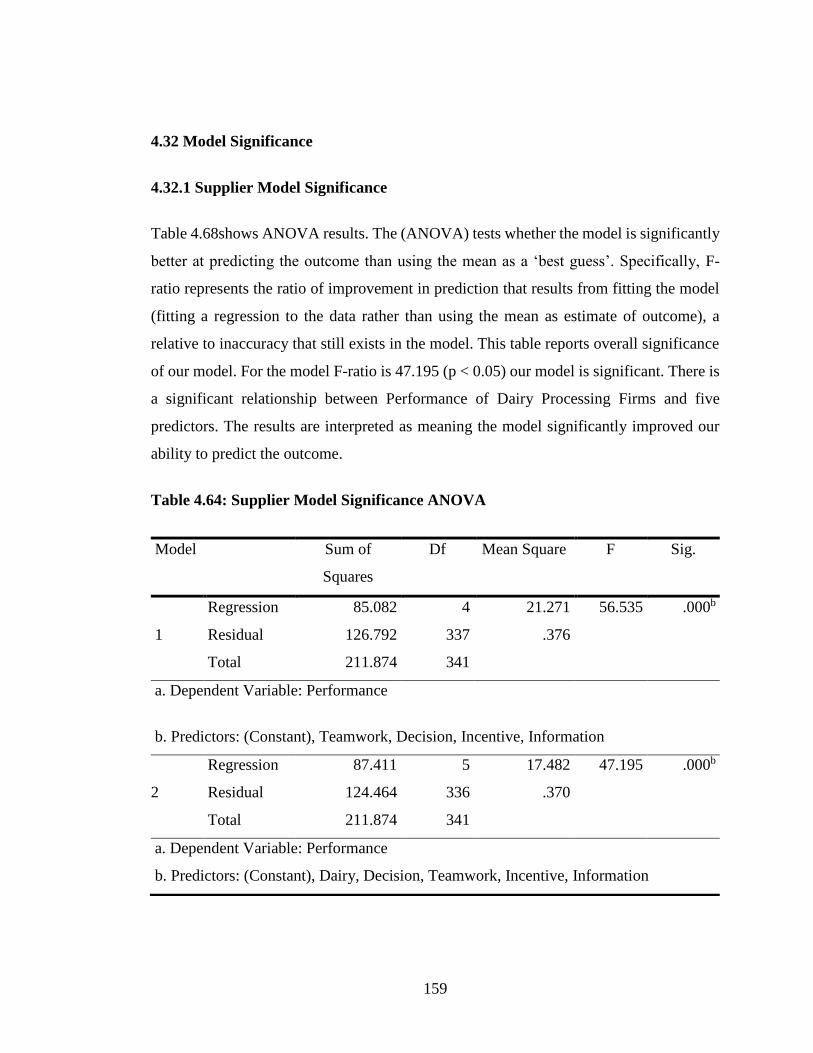
159
4.32 Model Significance
4.32.1 Supplier Model Significance
Table 4.68shows ANOVA results. The (ANOVA) tests whether the model is significantly
better at predicting the outcome than using the mean as a ‘best guess’. Specifically, F-
ratio represents the ratio of improvement in prediction that results from fitting the model
(fitting a regression to the data rather than using the mean as estimate of outcome), a
relative to inaccuracy that still exists in the model. This table reports overall significance
of our model. For the model F-ratio is 47.195 (p < 0.05) our model is significant. There is
a significant relationship between Performance of Dairy Processing Firms and five
predictors. The results are interpreted as meaning the model significantly improved our
ability to predict the outcome.
Table 4.64: Supplier Model Significance ANOVA
Model Sum of
Squares
Df Mean Square F Sig.
1
Regression 85.082 4 21.271 56.535 .000b
Residual 126.792 337 .376
Total 211.874 341
a. Dependent Variable: Performance
b. Predictors: (Constant), Teamwork, Decision, Incentive, Information
Regression 87.411 5 17.482 47.195 .000b
2 Residual 124.464 336 .370
Total 211.874 341
a. Dependent Variable: Performance
b. Predictors: (Constant), Dairy, Decision, Teamwork, Incentive, Information

160
4.32.2 Customer Model Significance
Table 4.69 shows ANOVA results with regards to customer. (ANOVA) tests whether the
model is significantly better at predicting the outcome than using the mean as a ‘best
guess’. Specifically, F-ratio represents the ratio of improvement in prediction that results
from fitting the model (fitting a regression to the data rather than using the mean as
estimate of outcome), a relative to inaccuracy that still exists in the model. This table
reports overall significance of our model. For the model F-ratio is 42.595 (p < 0.05) our
model is significant. There is a significant relationship between Performance of Dairy
Processing Firms and five predictors. The results are interpreted as meaning the model
significantly improved our ability to predict the outcome.
Table 4.65: Customer Model Significance ANOVA
4.33 Coefficients of SCC on Performance of Dairy Processing Firms without
Model Sum of
Squares
Df Mean Square F Sig.
1
Regression 59.604 4 14.901 50.025 .000b
Residual 92.042 309 .298
Total 151.646 313
a. Dependent Variable: Performance
b. Predictors: (Constant), Teamwork, Decision, Information, Incentive
Regression 61.993 5 12.399 42.595 .000b
2 Residual 89.653 308 .291
Total 151.646 313
a. Dependent Variable: Performance
b. Predictors: (Constant), Dairy, Incentive, Decision, Information, Teamwork

161
Mediation
According to IBM SPSS Manual Linear regression is used to model the value of a
dependent scale variable based on its linear relationship on one or more predictors. The
study predictors without mediation were four.
4.33.1 Supplier Regression Coefficients of SCC on Performance of Dairy
Processing Firms without Mediation
Table 4.7 shows supplier Coefficients table without mediation. The study concluded that
the independent variable; Supply chain teamworkinfluence Performance of dairy
processing firms. Supply chain teamworkp 0.000 < 0.05 which is significant at 0.05
(5%) Hence the multiple Regression coefficient of performance of dairy processing
firms with respect to Supplier:
𝑌 = β0 + β1X1 + β2X2 + β3X3 + β4X4 + ε................. (i)Without a mediator
can be explained as: Y =1.540 + 0.044X1 − 0.050X2 − 0.019X3 + 0.588X4 +
0.51 .................(i)Without a mediator
Where Y is the dependent variable (performance of dairy processing firms ) X1 is the
Supply chain information sharing , X2 Decision Synchronization, X3 is Incentive
alignment, X4 is and Teamwork. Taking all independent variables constant at zero, the
performance of dairy processing firms will be 1.540. The data findings also showed that
taking all other independent variables at zero, a unit increase in the Supply chain
teamworkwill lead to a 0 .588x4 increase in the performance of the dairy processing firms
. The t-values test the hypothesis that the coefficient is different from 0. To reject this, you
need a t-value greater than 1.96 (for 95% confidence). The t-values also show the
importance of a variable in the model. The t-values for Supply chain teamwork
(T=14.210). 14.210>1.96 implying HO4 is rejected and accepting that there is significant
effect between Supply chain teamworkand Performance of Dairy Processing Firms .

162
Table 4.66: Supplier Regression Coefficients of SCC on Performance of Dairy
Processing Firms without Mediation
Model Unstandardized
Coefficients
Standardized
Coefficients
T Sig. 95.0%
Confidence
Interval for B
Collinearity
Statistics
B Std.
Error
Beta Lower
Bound
Upper
Bound
Tolerance VIF
1
(Constant) 1.540 .151 10.169 .000 1.242 1.838
Information .044 .047 .060 .945 .345 -.048 .135 .447 2.237
Decision -.050 .048 -.064 -1.026 .306 -.145 .046 .462 2.164
Incentive -.019 .036 -.024 -.517 .605 -.089 .052 .801 1.248
Teamwork .588 .041 .634 14.210 .000 .507 .670 .891 1.122
a. Dependent Variable: Performance
4.33.2 Suppliers Regression Coefficients of SCC on Performance of Dairy
Processing Firms with Mediation
Table 4.71 shows supplier Coefficients table with mediation. The study predictors were
four plus theZ value which is the mediador. It is concluded that the independent
variables; Supply chain teamworkand Dairy Board, influence Performance of Dairy
Processing Firms. Supply chain teamworkp 0.000 < 0.05 which is significant at 0.05 (5%).
Mediation of Dairy board p 0.009 < 0.05 which is significant at 0.05 (5%).

163
Regression coefficient of performance of dairy processing firms with respect to Supplier:
: Y = β0 + β1X1. Z + β2X2. Z + β3X3. Z + β4X4. Z + ε.............. With a mediator can be
explained as Y =1.402-.015X1. Z -0.011X2 . Z-0.050X3. Z + 0 .580X4. Z + 0.158 with a
mediatorResults shows that Supply chain information sharing (T =-.323 , p>.05), Supply
chain decision synchronization (T =-.240 , P>.05), Supply chain Supply chain incentive
alignment (T =-1.327 , p >.05) didn’t made significant contribution to the model,
however Supply chain teamwork(T=14.075 ,p=< 0.05) and Dairy Board (T =2.644 , P <
.05) made significant contributions to the model.Where Y is the dependent variable
(performance of dairy processing firms ) X1 is the Supply chain information sharing , X2
Decision Synchronization, X3 is Incentive alignment, and X4 is Supply chain teamworkZ
is mediating influence of dairy board policies, regulations and mandate. Taking all
independent variables constant at zero, the performance of dairy processing firms will be
1.402. The data findings also showed that taking all other independent variables at zero, a
unit increase in the Supply chain teamworkwill lead to a 0 .580x4 increase in the
performance of the dairy processing firms . The t-values for Supply chain
teamwork(T=14.075). 14.075>1.96 implying HO4 is rejected and accepting that there is
significant effect between Supply chain teamworkand Performance of Dairy Processing
Firms . (DB=2.644) |2.644|>1.96 implying HO5 is rejected and accepting that there is
significant effect between DB and Performance of Dairy Processing Firms .

164
Table 4.67: Supplier Coefficients of SCC on Performance of Dairy Processing
Firms
Model Unstandardized
Coefficients
Standardized
Coefficients
T Sig. 95.0%
Confidence
Interval for B
Collinearity
Statistics
B Std. Error Beta LB UB Tole VIF
1
(Constant) 1.402 .158 8.873 .000 1.091 1.713
Information -.015 .047 -.020 -.323 .747 -.108 .078 .458 2.182
Decision -.011 .047 -.014 -.240 .811 -.103 .081 .485 2.061
Incentive -.050 .038 -.066 -1.327 .186 -.124 .024 .711 1.407
Teamwork .580 .041 .625 14.075 .000 .499 .661 .886 1.128
Dairy .107 .041 .129 2.644 .009 .027 .187 .732 1.366
a. Dependent Variable: Performance
4.34 Regression Coefficients of SCC on Performance of Dairy Processing Firms
without Mediation
4.34.1 Customer Regression Coefficients of SCC on Performance of Dairy
Processing Firms without Mediation
Table 4.72 shows customer coefficient table without mediation. The study concluded
that the independent variables; Supply chain Supply chain incentive alignment p 0.000 <
0.05 which is significant at 0.05 (5%) and Supply chain teamworkp 0.000 < 0.05 which
is significant at 0.05 (5%) both Supply chain teamworkinfluence Performance of dairy
processing firms. Hence the multiple Regression coefficient of performance of dairy
processing firms with respect to Supplier: 𝑌 = 𝛽0 + 𝛽1𝑋1 + 𝛽2𝑋2 + 𝛽3𝑋3 + 𝛽4𝑋4 +
𝜀.................(i) Without a mediator
can be explained as: Y =𝑌1.414 + 0.130𝑋1 − 0.023𝑋2 + .0219𝑋3 + 0.293 𝑋4 +
0.183 ................(i) Without a mediator

165
Where Y is the dependent variable (performance of dairy processing firms ) X1 is the
Supply chain information sharing , X2 Decision Synchronization, X3 is Incentive
alignment, and X4 is and Teamwork. Taking all independent variables constant at zero,
the performance of dairy processing firms will be 1.414. The data findings also showed
that taking all other independent variables at zero, a unit increase Supply chain
information sharing will lead to 0.130 X1 increase in the performance of the dairy
processing firms, a unit increase Supply chain Supply chain incentive alignment will lead
to 0.219 X3 increase in the performance of the dairy processing firms , and a unit increase
in Supply chain teamworkwill lead to 0.293 X4. The t-values test the hypothesis that the
coefficient is different from 0. To reject this, you need a t-value greater than 1.96 (for 95%
confidence). The t-values forSupply chain information sharing (T=2.696) 2.696>1.96
implying HO1 is rejected and accepting that there is significant effect between Supply
chain information sharing and performance of dairy processing firms , Supply chain
Supply chain incentive alignment (T=4.791) 4.791>1.96 implying HO3 is rejected and
accepting that there is significant effect between Supply chain Supply chain incentive
alignment and performance of dairy processing firms. Supply chain teamwork(T=5.093).
5,093>1.96 implying HO4 is rejected and accepting that there is significant effect between
Supply chain teamworkand Performance of Dairy Processing Firms .

166
Table 4.68: Customer Regression Coefficients of SCC on Performance of Dairy
Processing Firms without Mediation
Model Unstandardized
Coefficients
Standardized
Coefficients
t Sig. 95.0%
Confidence
Interval for B
Collinearity
Statistics
B Std.
Error
Beta Lower
Bound
Upper
Bound
Tolerance VIF
1
(Constant) 1.414 .183 7.739 .000 1.055 1.774
Information .130 .048 .149 2.696 .007 .035 .225 .644 1.552
Decision -.023 .043 -.027 -.528 .598 -.108 .062 .776 1.288
Incentive .219 .046 .292 4.791 .000 .129 .309 .530 1.886
Teamwork .293 .057 .307 5.093 .000 .180 .406 .539 1.855
a. Dependent Variable: Performance
4.34.2 Customer Regression Coefficients of SCC on Performance of Dairy
Processing Firms with Mediation
Table 4.73 shows customer coefficient table with mediationIncentive p 0.000 < 0.05 is
significant at 0.05, Supply chain teamworkp 0.000 < 0.05 which is significant at 0.05 and
Dairy board p 0.004 < 0.05 also significant at 0.05. Information p 0.25> 0.05 was not
significant at 0.05; Supply chain decision synchronization p 0.211 was also not significant
at 0.05. Hence the multiple regression equation:
Y = β0 + β1X1. Z + β2X2. Z + β3X3. Z + β4X4. Z + ε............................ With a mediator
can be explained as:
Y =1.394 +.109𝑋1 .𝑍 -0.054𝑋2.𝑍 + 0.212𝑋3.𝑍 + 0.116𝑋4.𝑍 +𝜀With a mediator
Results shows that Supply chain decision synchronization (T =-1.226 , P>.05) didn’t made
significant contribution to the model, , However Supply chain information sharing (T
=2.255 , p <.05), Supply chain Supply chain incentive alignment (T =4.683 , p < .05)

167
Supply chain teamwork(T=4.424 ,p=< 0.05) and Dairy Board (T =2.865 , P < .05) made
significant contribution to the model.
Where Y is the dependent variable (performance of dairy processing firms) X1 is the
Supply chain information sharing, X2 is Decision Synchronization, X3 is Incentive
Alignment, X4 is Supply chain teamworkand X5. Taking all independent variables
constant at zero, the performance of dairy processing firms will be 1.394. The data
findings also showed that taking all other independent variables at zero, a unit increase in
Supply chain information sharing will lead to a 0.109 increase in the performance of dairy
processing firms ; a unit increase in Supply chain Supply chain incentive alignment will
lead to a 0.212 increase in the performance of the dairy processing firms ; a unit increase
in Supply chain teamworkwill lead to 0 .257 increase in the performance of the dairy
processing firms ; a unit increase in mediation of dairy board increase in the performance
of the dairy processing firms ; While a unit increase in Supply chain decision
synchronization will lead to a -0.054 decrease in the performance of the dairy processing
firms . This means that for every unit increase SCC will influence performance of dairy
processing firms by 40.9% as results in table 71 shows.
The t-values test the hypothesis that the coefficient is different from 0. To reject this, you
need a t-value greater than 1.96 (for 95% confidence). The t-values also show the
importance of a variable in the model. The t-values for the study were (IS= 2.255),|-
2.255|>1.96 implying HO1 is rejected and accepting and there is significant effect between
IS and Performance of Dairy Processing Firms . (DS= -1.226), |-1.226|<1.96 implying HO2
is accepted and there is no significant effect between DS and Performance of Dairy
Processing Firms . (IA= 4.683), |4.683|>1.96 implying H3 is rejected accepting and there
is significant effect between IS and Performance of Dairy Processing Firms . (T=4.424).
|4.424|>1.96 implying HO4 is rejected and accepting that there is significant effect between
T and Performance of Dairy Processing Firms . (DB=2.863) |2.863|>1.96 implying HO5 is
rejected and accepting that there is significant effect between DB and Performance of
Dairy Processing Firms .

168
Table 4.25: Customer Regression Coefficients of SCC on Performance of Dairy
Processing Firms with Mediation
Model Unstandardized
Coefficients
Standardized
Coefficients
t Sig. 95.0%
Confidence
Interval for B
Collinearity
Statistics
B Std.
Error
Beta LB UB Tole VIF
1
(Constant) 1.394 .181 7.711 .000 1.038 1.750
Informatio
n .109 .048 .125 2.255 .025 .014 .204 .629 1.590
Decision -.054 .044 -.063 -1.226 .221 -.141 .033 .729 1.372
Incentive .212 .045 .282 4.683 .000 .123 .301 .529 1.891
Teamwork .257 .058 .270 4.424 .000 .143 .371 .515 1.943
Dairy .116 .040 .151 2.865 .004 .036 .195 .691 1.448
a. Dependent Variable: Performance
4.35 Tests of Hypotheses
Inferential analyses were conducted to specifically ascertain the effect of the
conceptualized supply chain collaboration on performance of dairy processing firmsby
testing the formulated hypotheses.Multiple linear regressionanalysiswasdone and the
coefficients was usedtotestthe hypotheses.
Statistical significance of each of the independent tests on unstandardized coefficients are
equal to 0 (zero) in the population (i.e for each of the coefficients, H0: β=0 versus Ha:β ≠
0 is conducted). If p> 0.05, the coefficients are statistically significantly different to 0
(Dhakal, 2016).The t-values also test the hypothesis that the coefficient is different from
0. To reject this, the t-value should be greater than 1.96(for 95 percent confidence). T is
calculated difference represented in units of error. The greater the magnitude of t value i.e
Ieither positive or negativeI, the greater the evidence against the null hypothesis that there
is no significant different (Runkel,2017). Test of hypothesis was done on independent
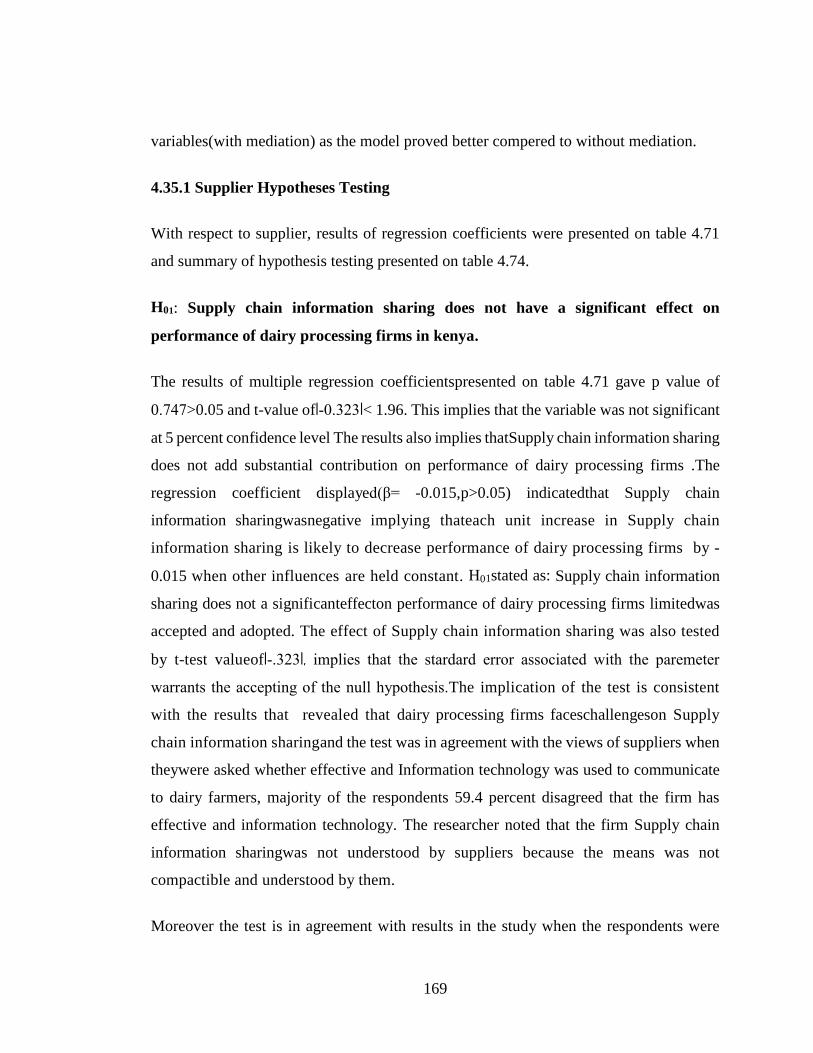
169
variables(with mediation) as the model proved better compered to without mediation.
4.35.1 Supplier Hypotheses Testing
With respect to supplier, results of regression coefficients were presented on table 4.71
and summary of hypothesis testing presented on table 4.74.
H01: Supply chain information sharing does not have a significant effect on
performance of dairy processing firms in kenya.
The results of multiple regression coefficientspresented on table 4.71 gave p value of
0.747>0.05 and t-value ofI-0.323I< 1.96. This implies that the variable was not significant
at 5 percent confidence level The results also implies thatSupply chain information sharing
does not add substantial contribution on performance of dairy processing firms .The
regression coefficient displayed(β= -0.015,p>0.05) indicatedthat Supply chain
information sharingwasnegative implying thateach unit increase in Supply chain
information sharing is likely to decrease performance of dairy processing firms by -
0.015 when other influences are held constant. H01stated as: Supply chain information
sharing does not a significanteffecton performance of dairy processing firms limitedwas
accepted and adopted. The effect of Supply chain information sharing was also tested
by t-test valueofI-.323I, implies that the stardard error associated with the paremeter
warrants the accepting of the null hypothesis.The implication of the test is consistent
with the results that revealed that dairy processing firms faceschallengeson Supply
chain information sharingand the test was in agreement with the views of suppliers when
theywere asked whether effective and Information technology was used to communicate
to dairy farmers, majority of the respondents 59.4 percent disagreed that the firm has
effective and information technology. The researcher noted that the firm Supply chain
information sharingwas not understood by suppliers because the means was not
compactible and understood by them.
Moreover the test is in agreement with results in the study when the respondents were

170
asked whether they get to know ealry enougn on price changes, majority 68.7 percent
disagreed on the measure.This was not consistent with findings by Namusonge (2015)
done in an hotel (service industry) which showed that supply chain information systems
positively and significantly contributes to organizational performance through its ability
to drive procurement. The current study was done in dairy industry and gave a divergent
views. The perspectives of respondents in an hotel will not be same as those in processing
firm and touching the suppliers/customers in form suppliers of milk and those buying milk
products in retail supermarkets. It also shows that the firm has not been good in Supply
chain information sharing and should consider sharing in a more compatible and
understood means.
H02: Supply chain decision synchronization does not have a significant effect on
performance of dairy processing firms in kenya.
The results of multiple regression coefficients presented on table 4.71 indicated that p
value of 0.811 > 0.05 and t-value ofI-.240I<1.96 implyingH02stated that:Supply chain
decision synchronization does not a significanteffecton performance of dairy processing
firms wasthereforeaccepted.The variable was not significant at 5 percent confidence,
regression coefficient displayed(β= -0.011,p > 0.05) indicated that Supply chain decision
synchronization wasnegativehenceno significantinfluence on performance of dairy
processing firms . This shows thateach unit increase in Supply chain decision
synchronization is likely to decrease performance of dairy processing firms by -0.011
when other influences are held constant.T value ofI-.240I implies that the stardard error
associated with the paremeter warrants the accepting of the null hypothesis.The
implications of the test was consistent with the results that showed dairy processing
firms faceschallengesintermsof milk prices, weignt desperities and extention services.
Findings in the present study regarding fixing of milk prices done as required majority of
the respondentst 73.6 percent disagreed, also wheights deperities resolved majority 70.1
percent disagreed and extention services offere to increase quality majority 42.7
disagreed.Empirical studies have shownthat suppliers’ involvement needs to identify

171
buyers’ expectations in terms of quality, quantity, delivery, service and price, and can help
firms to improve them in overall quality, reduce costs and competition (Morrisey &
Pitaway, 2006);when the expectations are met, this relationship becomes valuable and it
turns into a useful tool that helps the company achieve its objectives (Fierro & Rendondo,
2008).
H03: Supply chain incentive alignment does not have a significant effect on
performance of dairy processing firms in kenya
The results of multiple regression coefficients presented on table 4.71 indicated that p
value of 0.186> 0.05 and t-value .I-1.327I< 1.96 implying H03stated that:Supply chain
Supply chain incentive alignment does not a significanteffecton performance of dairy
processing firmswasaccepted and adopted. The regression coefficientforSupply chain
Supply chain incentive alignment wasnegative, (β= -0.050,p > 0.05)implies no
significantinfluence on performance of dairy processing firms .The regression coefficient
displayedimplies that each unit increase in Supply chain Supply chain incentive
alignment is likely to decrease performance of dairy processing firms by -0.050 when
other influences are held constant. T value ofI-1.327I implies that the stardard error
associated with the paremeter warrants the accepting of the null hypothesis.The test in the
present study is in agreement with the findings regarding milk products providedto
farmers at subsidized prices ,where majority of the respondents 84.2 percent disagreed
and on Artificial Insemination programs provided at susidised prices, majority 67.3
percent of the respondents disagreed.
H04: Supply chain teamworkdoes not have a significant effect on performance of
dairy processing firms in kenya
The results of multiple regression coefficients presented on table 4.71 indicated that p
value of 0 .000< 0.05 and t-value of I14.075I> 1.96 implying H04stated that:Supply chain
teamworkdoes not a significanteffecton performance of dairy processing firmswasrejected
and adopting alternative hypothesis. The regression coefficient displayedindicatesthat
Supply chain teamworkwaspositiveinplies significantinfluence on performance of dairy

172
processing firms (β= 0.580,p < 0.05).The influence of Supply chain teamworkwas also
tested by t-test value ofI14.075I which implies that the stardard error associated with the
paremeter warrants the rejecting of the null hypothesis and adopting the alternative
hypothesis.This shows thateach unit increase in Supply chain teamworkis likely to
increase performance of dairy processing firms by 0.580when other influences are held
constant. Dairy Processing Firms are committed to the growth of industry and there is
spirit of togetherness between the firm anf suppliers. The results of the test are in
agreement with suppliers views when respondents were asked whether the firm was
committed to the growth of the industry and Majority of the respondents 52.9 percent
were in agreemen. Also the respondents were asked wether there is spirit of togetherness
between firm and milk supplies, majority 56.4 were in agreement.
The results of the test are also in agreement with the findings previously establishedfrom
studies which showed thatjoint activities could give rise to inter-partner trust in the supply
chain. Commitment builds inter-firm trust embedded in the relationship and this provides
a foundation for the collaborating firms to make a commitment to their supply chain
partners. In supply chain relationships, Supply chain teamworkbetween supply chain
partners is hardly established without trust between the two (Chen et al., 2017).
H05: Dairy Board policies and regulations does not have significant mediating
influence on relationship between supply chain collaboration and Performance of
Dairy Processing firms in Kenya.
The results of multiple regression presented on table 4.71 indicated that p value of 0
.009< 0.05 and t-value of I2.644I> 1.96 implying H05stated that:Dairy board does not a
significantmediating effecton performance of dairy processing firms
wasthereforerejected and adopted the alternative hypothesis. The regression coefficients
displayedindicatesthat dairy boardwerepositiveand there was significantinfluence on
performance of dairy processing firms (β= 0.107,p < 0.05).This shows thateach unit
increase in dairy board policies and regulationsis likely to increase performance of dairy
processing firms by 0.107when other influences are held constant.Dairy Processing

173
Firms are committed to the growth of industry and there is spirit of togetherness between
the firm anf suppliers. Theresearcher noted that the firm Supply chain information
sharingwas not understood by suppliers because the means was not compactible to
them.T value ofI2.644Iimplies that the stardard error associated with the paremeter
warrants the rejecting of the null hypothesis.The results of the test are in agreement with
suppliers views when respondents were asked whether dairy board policies were inline
with supply chain parties when majority 32.1 percent were in agreement. The results of
the test are also consistent with dairy board Regulations (2020) which showed
ininspection, licencing and quality sur of milk in compliance with the requirements of the
dairy Act CAP 366.
Table 4.26: Supplier Summary of Hypotheses Testing
Hypothesis Findings Decision
t-values Sig.
H01
Supply chain information sharing does not have
a significant effect on Performance of Dairy
Processing Firms
-.323 .747 Accepted
H02
Supply chain decision synchronization does not
have a significant effect on Performance of Dairy
Processing Firms
-.240 .811 Accepted
H03
Supply chain incentive alignment does not have
a significant effect on Performance of Dairy
Processing Firms
-1.327 .186 Accepted
H04
Supply Chain Teamworkdoes not have a
significant effect on Performance of Dairy
Processing Firms
14.075 .000 Rejected
H05 Dairy Board does not have a significant
mediating effect on Performance of Dairy
Processing Firms
2.644 .009 Rejected

174
4.35.2 Customer Hypotheses Testing
With respect to customer, results of regression coefficients were presented on table 4.73
and summary of hypothesis testing presented on table 4.75.
H01: Supply chain information sharing does not have a significant effect on
performance of dairy processing firms in kenya.
The results of multiple regression presented on table 4.73 indicated that p value of 0.025<
0.05 and t-value ofI2.255I> 1.96 implying H01 stated that:Supply chain information
sharing does not a significanteffecton performance of dairy processing firms
wasthereforerejected and adopting the alternative hypothesis.The regression coefficients
displayed indicated that Supply chain information sharing were positive implies
significant influence on performance of dairy processing firms (β= -0.109,p<0.05).The
influence of Supply chain information sharing was also tested by t-test valuewhich
gaveI2.255I implying that the stardard error associated with the paremeter warrants the
rejecting the null hypothesis. The researcher noted that the firm customers are informed
on new products introduced, new effective mode of communication is used to inform
customers, milk products are conveniently delivered, customers get to know ealy enough
about price changes, customers aware of customers complaints, and respond on time,
customers informed of varied products, they know where to buy and understand the
products of dairy processing firms . The results of the study indicated most of the
customers were in agreement that the firm Supply chain information sharing on products
of dairy processing firms was fairly done. This shows that the firm has fairly tried in
reaching to customers and explained the benefits of the products. It also shows that the
customers have really understood and know where to buy the products. Empirical
evidence shows the firm is trying to achieving Vision 2030 by offering high quality
products for all its citizens/customers.
The results of the test are also in agreement with are consistent studies established by
other scholars showing that “Sharing information can reduce uncertainty in demand and

175
supply and significantly improvesupply chain service levels, decrease inventory levels,
lower stockouts ,increase product freshness, and greatly reduce product wastage due to
time expiry (Kaipiaetal.,2013).
H02: Supply chain decision synchronization does not have a significant effect on
performance of dairy processing firms in kenya.
The results of multiple regression presented on table 4.73 indicated that p value of 0.221>
0.05 and t-value ofI-.054I< 1.96.Thehypothesisstated that:Supply chain decision
synchronization does not a significanteffecton performance of dairy processing firms
wasthereforeaccepted. The regression coefficients displayedindicatedthat Supply chain
decision synchronization werenegativeand and no significantinfluence on performance of
dairy processing firms (β= 0.221 > 0.05).The influence of Supply chain decision
synchronization was tested by t-test value ofI-.240I which implies that the stardard error
associated with the paremeter warrants the accepting of the null hypothesis.The results of
the test are in agreement with empirical studies by Weele (2010) when he considers that
the top management commitment and internal cross-functional coordination of
collaborating parties are very important especially in decision making.
He reiterated that the uncertainty of another partner on aspects of their expectations and
for the firm at times can be achallenge.This study is consistet with a study done by Kenon
and Palsole (2019)on Developing an Agile Global Worforce. They noted that said
impending market changes make it necessary for organisations to be higly adaptable.They
was discussion on challenges and critical success factors affecting the management.

176
H03: Supply chain Supply chain incentive alignment does not have a significant
effect on performance of dairy processing firms in kenya
The results of multiple regression presented on table 4.73 indicated that p value of 0
.000< 0.05 and t-value .I4.683I> 1.96 implying H03stated that:Supply chain Supply chain
incentive alignment does not a significanteffecton performance of dairy processing
firmswasthereforerejected. The regression coefficients displayedimpliesthat Supply
chain Supply chain incentive alignment werepositivehence significantinfluence on
performance of dairy processing firms (β= 0.212,p < 0.05).The influence of Supply chain
Supply chain incentive alignment was also tested by t-test valueand implied that the
stardard error associated with the paremeter warrants the rejecting of the null hypothesis
and adopting the alternative hypothesis.The results of the test are in agreement with the
views of the respondents when they were askedwether sales demand are aligned to the
customers’ requirements, majority respondents 59.9 percent were in agreement, wether
new milk products accessed to customers, majority respondents 71.3 percent were in
agreement, wether the firm pricing is demand driven, majority respondents 46.2 percent
were in agreement, wether there is shared cost on high demand of products, majority
respondents 46.8 percent were in agreement, wether the product prices are align to the
demand, majority respondents 49.0 percent were in agreement and Respondents were also
requested to provide information on whether prices of the products are align to quality,
majority respondents 60.5 percent were in agreement.
H04: Supply chain teamworkdoes not have a significant effect on performance of
dairy processing firms in kenya
The results of multiple regression presented on table 4.73 indicated that p value of 0
.000< 0.05 and t-value of I4.424I> 1.96.Thehypothesisstated that:Supply chain
teamworkdoes not a significanteffecton performance of dairy processing
firmswasthereforerejected and adopted the alternative hypothesis. The regression
coefficients displayedindicatesthat Supply chain teamworkwerepositiveand there is
significantinfluence on performance of dairy processing firms. the influence of Supply

177
chain teamworkwas tested by t-test value ofI14.075I.(β= 0.257,p < 0.05) which implies
that the stardard error associated with the paremeter warrants the rejecting of the null
hypothesis.
The results of the test are in agreement with empirical studies showing participating
members who combine their heterogeneous competencies seek to create collaborative
advantages which benefit all members in the long run (Khoja et al., 2011). Hence, entering
into a collaborative relationship is often radical and can lead to a new leadership with
different directions and capabilities. The companies that establish themselves as dominant
players in a supply chain network will often have strong influences on others to streamline
supply chain operations that can deliver excellent customer service levels.
H05: Dairy Board policies and regulations does not have significant influence on
relationship between supply chain collaboration and Performance of Dairy
Processing firms in Kenya.
The results of multiple regression presented on table 4.73 indicated that p value of 0 .004<
0.05 and t-value of I2.865I> 1.96. Thehypothesisstated that:Dairy board does not a
significanteffecton performance of dairy processing firmswasthereforerejected and
adopted the alternative hypothesis . The regression coefficients
displayedindicatesthat dairy boardwerepositiveand there was significantinfluence on
performance of dairy processing firms (β= 0.116,p < 0.05).The influence of Dairy
Boardwas tested by t-test value ofI2.865Iwhich implies that the stardard error associated
with the paremeter warrants the rejecting of the null hypothesis.
The results of the test wassupported by views of respondents when they were asked
onwhether the Dairy Board influences customer satisfaction, majority respondents 34.4
percent were in agreement, Dairy Board embraces joint effort to increase milk production,
majority respondents 41.7 percent were in agreement, Dairy Board regulates the prices of
dairy products, majority respondents 41.4 percent were in agreement, Dairy Board
improves the quality of milk products, majority respondents 47.4 percent were in
agreement, there is mutual trust between dairy board and milk customers, majority
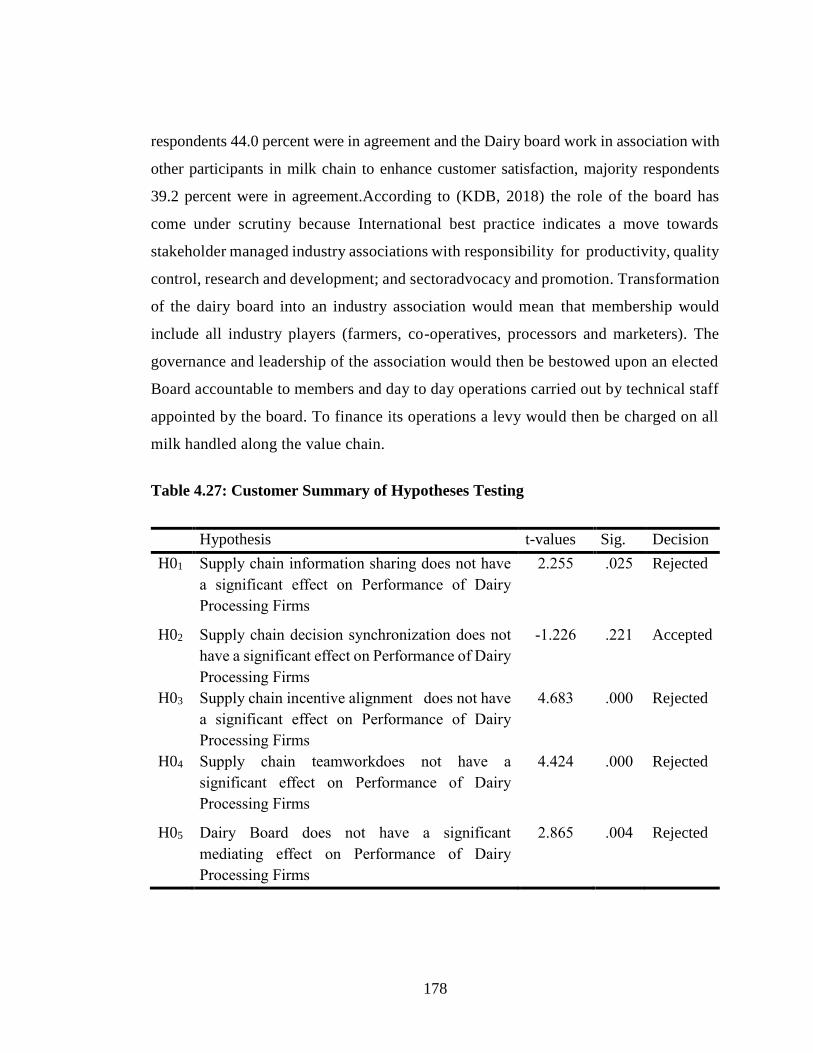
178
respondents 44.0 percent were in agreement and the Dairy board work in association with
other participants in milk chain to enhance customer satisfaction, majority respondents
39.2 percent were in agreement.According to (KDB, 2018) the role of the board has
come under scrutiny because International best practice indicates a move towards
stakeholder managed industry associations with responsibility for productivity, quality
control, research and development; and sectoradvocacy and promotion. Transformation
of the dairy board into an industry association would mean that membership would
include all industry players (farmers, co-operatives, processors and marketers). The
governance and leadership of the association would then be bestowed upon an elected
Board accountable to members and day to day operations carried out by technical staff
appointed by the board. To finance its operations a levy would then be charged on all
milk handled along the value chain.
Table 4.27: Customer Summary of Hypotheses Testing
Hypothesis t-values Sig. Decision
H01
Supply chain information sharing does not have
a significant effect on Performance of Dairy
Processing Firms
2.255 .025 Rejected
H02
Supply chain decision synchronization does not
have a significant effect on Performance of Dairy
Processing Firms
-1.226 .221 Accepted
H03
Supply chain incentive alignment does not have
a significant effect on Performance of Dairy
Processing Firms
4.683 .000 Rejected
H04
Supply chain teamworkdoes not have a
significant effect on Performance of Dairy
Processing Firms
4.424 .000 Rejected
H05
Dairy Board does not have a significant
mediating effect on Performance of Dairy
Processing Firms
2.865 .004 Rejected

179
CHAPTER FIVE
SUMMARY, CONCLUSIONS AND RECOMMENDATIONS
5.1 Introduction
This chapter gives the summary of findings and discussions of the study which sought to
analyze the influence of supply chain collaboration on performance of dairy processing
firms in kenya. This was based on objectives and hypothesis of the study. The chapter
captures the summary of the research findings;conclusions drawn from the study findings
in relation to the literature reviewed, policy recommendations and areas of further
research.
5.2 Summary
The study sought to establish the influence of Supply Chain Collaboration on Performance
of Dairy Processing Firms . The purpose of the study was to test the influence of Supply
chain Collaboration on Performance of Dairy Processing Firms . The study analyzed the
influence of SCC on Performance of Dairy Processing Firms . This was important for the
firm to realize the influence of SCC on firm’s performance and consider its implications
to the firm.
The relationship between SCC and Performance of Dairy Processing Firms was
determined by critically examining the five specific objectives: the influence of Supply
chain information sharing on Performance of Dairy Processing Firms , influence of Supply
chain decision synchronization on Performance of Dairy Processing Firms , the influence
of Supply chain Supply chain incentive alignment on Performance of Dairy Processing
Firms, the influence of Supply chain teamworkon Performance of Dairy Processing Firms
and influence of Dairy Board on Performance of Dairy Processing firms in Kenya. The
summary of the findings was derived from research objectives with corresponding
hypothesis.

180
5.2.1Influence of Supply chain information sharing on Performance of Dairy
Processing Firms.
Supplier’s results on the item the firm does communicate to dairy farmers about its
demand majority disagreed with the statement. On Information technology is used to
communicate to dairy farmers majority disagreed and only few agreed. The degree of
influence on Supply chain information sharing was low and the firm has to take measures
to increase the level of influence.
However from customers, on items; they are informed on products introduced, effective
information technology as a mode of communication is used to inform customers on
products, and milk products are conveniently delivered to customer’s majority
respondents were in agreement. The results showed that the firm has shared substantially
information to the customers of dairy processing firms . They have to maintain and strive
to improve for continued client satisfaction.
The supply chain practitioner’s respondents gave their opinions on the way the firm share
information to milk suppliers. The respondent’s respondent that “The firm share
information through extension agents and the transporters of milk. They also said
sometimes give them pamphlets with important information. They also share through
“barazas”, exhibitions, field days, exchange visits and sending messages to farmers”.
More so, the kind of information they share is related to prices, feeding technology and
when payments are made. Also share information on feeding of dairy cows, and milk
hygiene. The effect of sharing information according to supply chain practitioners is the
increase on supply of milk to the processing firm, increase farmers confidence and loyalty
to the firm.

181
5.2.2 Influence of Supply chain decision synchronization on Performance of Dairy
Processing Firms.
Suppliers indicated on items; fixing of milk prices done as required by Majority of the
respondents disagreed, on weights disparities between dairy farmers and dairy processing
firms are well resolved strongly on the statement, on Quality control measures
understood by dairy farmers, Majority of the respondents were agreement with the
statement. They also indicated that, extension services are offered to increase production
of milk and the Dairy farmers receive record their daily deliveries by agreeing on the
statements.
Customer’s respondents indicated on the items; Dairy processing firms Products prices
are reasonable and understood majority respondents in agreement on the statement. On
the item price variation between dairy processing firms products and others are understood
by customers, majority respondents were in agreement on the statement, on the item
Quality of products are understood by customers, majority respondents were in agreement
on the statement.
Concerning Supply chain decision synchronization supply chain practitioners gave their
opinions that they arrive at join decision when there is oversupply and the market is not
good and thus agree on price reduction. Also when supply exceed demand the firm sit
with the farmers to agree on price reduction. They also gave their opinions on instances
they incorporate supply chain partners. They said when there is long drought resulting to
low supply of milk they mobilize. They also pointed instances of making join resolutions
with supply chain partners “is when there is shortage of milk”. They said another instance
to make join resolution with supply chain partners is during the dry season when the
animal feeds are inadequate. The effect of Supply chain Supply chain incentive alignment
according to them is “the milk volume will go up’. The farmers also will deliver the milk
because the feeds will be available.

182
5.2.3 Influence of Supply chain Supply chain incentive alignment on Performance
of Dairy Processing Firms.
Supplier’s respondents on item Increased Sales demands are extended to farmers revealed
the majority disagreed that Increased Sales demands are extended to farmers. Also on
Milk products provided to dairy farmers at subsidized prices, Majority of the respondents
disagreed that Milk products provided to dairy farmers at a subsidized prices. On Artificial
Insemination/Veterinary programs availed when required, Majority of the respondents
disagreed with the statement. However on, item firm link dairy farmers to financial
services, Majority of the respondents agreed that Firm link dairy farmers to financial
services, on Payment for milk produce done promptly, majority respondents disagreed
that Payment for milk produce done promptly, on establishment of cooler plants for
mutual benefit, majority respondents were in agreement that Establishment of cooler
plants is for mutual benefit.
Customer respondents provided information Incentive Alignment; On Sales demand
aligned to the customers’ requirements, majority respondents were in agreement, on milk
products accessed to customers, on the item milk products accessed to customers,
majority respondents were in agreement, on the item the firm pricing is demand driven,
majority were in agreement, On the item there is shared cost on high demand of products,
majority respondents were in agreement, On the item the product prices are align to the
demand, majority respondents were in agreement on the statement
Supply chain practitioners gave their opinions on Supply chain Supply chain incentive
alignment they respondent that “programs are like sponsoring farmers to field days,
shows, benchmarking with other countries like Israel”. Another incentive they said was
“facilitating linkages between the farmers and service providers. The effect Supply chain
Supply chain incentive alignment according to them is “the milk volume will go up,
confidence of milk suppliers and trust.

183
5.2.4 Influence of Supply chain teamworkon Performance of Kenya Co-operative
Creameries.
The supplier’s results showed that firm committed to the growth of the industry by
Majority of the respondents agreeing that firm committed to the growth of the industry.
Also, the firm committed to improving services to milk suppliers by Majority of the
respondents disagreed that Firm committed to improving services to milk suppliers, on
there are joint efforts to increase milk production, Majority of the respondents also
disagreed that there are joint efforts to increase milk production. The item firm enhances
coordination through Supply chain teamworkfrom the results.
Customer’s results revealed that firm is committed to needs of customers by majority
respondents in agreement on the statement. Also on Cordial relationship between the firm
and customers majority respondents were in agreement on the statement, on there is supply
alliances with all the parties within the chain by majority respondents were in agreement
on the statement. The firm has measures to ensure customers trust their products, majority
respondents were in agreement on the statement.
Pertaining teamwork, the suppliers gave opinions that “they embrace Supply chain
teamworkon extension services and service providers”. The effect Supply chain
teamworkaccording to them is “the milk volume will go up and Supply chain
teamworkwill be embraced.
5.2.5Mediating influence of dairy board policies and regulations on the relationship
between supply chain collaboration and Performance of dairy processing
firms Supplier’s results revealed that Dairy Board Act influences growth of industry by
majority respondents in agreement on the statement. On the Dairy Board Organs improve
services of milk suppliers, Majority of the respondent’s disagreed that Dairy Board Organs
improve services of milk suppliers, However, Dairy Board on delivering of its mandate to
increase milk production, Majority of the respondent’s disagreed that Dairy Board delivers
its mandate to increase milk production. Also Dairy Board Guidelines for enhancing

184
Supply chain teamwork Majority of the respondents, disagreed on the statement.
The customer’s results on dairy board has mediating influence on customer satisfaction,
majority respondents were in agreement on the statement, on the Dairy Board organs
improving services of customers by respondents were in agreement on the statement. On
the Dairy Board embraces joint effort to increase milk production, Majority respondents
were in agreement were on the statement. The board also regulates the prices and of
products. There is mutual trust between dairy board and milk customers as also revealed
by the results. However, The Dairy Board policies are in line to chain parties’
performance, majority disagreed on the statement.
On mediating effect of Dairy board the respondents suggest to them “to educate the
farmers on the importance of government policies”. In their opinion the dairy the board
are policies majority said are good and another feel very good but at the same time the
dairy farmers don’t understand the policies and regulations.
Their suggestions were “The Dairy board and milk processors to hold workshop jointly”.
Also “they need to organize for farmers’ “barazas” and meetings to sensitize farmers on
importance of policies and regulations”.
Their general recommendation on what to be done on supply chai partners in order to
enhance performance of dairy processing firms , “ they said information is key,
strengthening the extension activities, formation of kibbutz farms for the dairy animals,
and engaging more service providers and feeds inputs suppliers.”
5.3 Conclusions of the Study
This study sought to analyze the influence of SCC on Performance of Dairy Processing
Firms. Milk processing firms that perform attract sizeable milk suppliers and maintain
customer loyalty on choice of milk products. The ability of the firm to retain customers
lies on market share, profitability and client satisfaction. Findings showed a positive
correlation between the set of five selected regressors and the regressed. The explanatory

185
variables explored by this study were: Supply chain information sharing, Decision
Synchronisation, incentive Alignment, Supply chain teamworkand Dairy board.
The study concludes that Supply chain information sharing affects the performance of
dairy processing firms with respect to customer. The results showed thatcustomers are
informed on new products introduced and delivered, new and effective information
technology as a mode of communication was used to inform customers on new products,
know early enough about price changes, the company aware of customer complaints and
respond on time, customers are informed of varied products, informed on the benefits of
new products, know where to buy the firms products and they understand very well the
product.With respect to customer Supply chain information sharing significantly
contributed to the performance of dairy processing firms . With respect to supplier the
firm has not done fairly well on Supply chain information sharing.
The study also concludes that Supply chain incentive alignment with respect to customer
has a positive effect of on the performance of dairy processing firms . The effect was
deduced by the fact that Supply chain Supply chain incentive alignment used by the
organization improved the market share, enhance customer satisfaction, as financial
implications and improve competitive advantage of the milk processing firm. Further the
study deduced that all measureswith respect to customer have helped to improve customer
satisfaction among other performance measures. However, the study found that Supply
chain Supply chain incentive alignment with respect to supplier did not made significant
effect on the performance of the dairy processing firms .
The study concludes that Supply chain teamworkhas a positive effect on the performance
of dairy processing firms with respect to supplier and customer. In this case the study
deduced that the firm is committed to the growth and needs of customers, committed to
improving the services to milk suppliers and the quality of their products to customers,
there is joint effort to increase milk production and market share, enhances coordination
through Supply chain teamworkand cooperation to deliver required products, all parties
along the chain plan together and promote products, there is supply alliance with all the
186
parties, mutual trust between the firm and suppliers also customers, there is cordial
relationship between the firm and milk suppliers and customers, and there is spirit of
togetherness.
Overall, the study concludes that Supply chain team workand mediating influence hadthe
greatest effect on the performance of dairy processing firms , followed by Supply chain
Supply chain incentive alignment and Supply chain information sharing least effect to the
performance of dairy processing firms Ltd. The mediation generally improved the model.
5.4 Recommendations of the Study
Inview ofthe conclusions made above, the following managerial and policy
recommendations were made:
5.4.1 Management Recommendations
As clearly indicated by previous researchers, performance of milk processing firm is key.
The study established that the influence of supply chain collaboration is significant to
performance of dairy processing firms . Therefore, the study recommends it would be
appropriate for the management of milk processing firm to exploit Supply chain
information sharing, decision synchronization, incentive alignment, Supply chain team
workand dairy board on the day to day operations with aim of ensuring sizeable market
share, profitability, and client satisfaction for performance of the firm.
Based on research findings on Supply chain information sharing and performance of dairy
processing firms , thefarmers the results were contradictory on firmSupply chain
information sharing. This result shows that although supply chain practitioners findings
are positive on the aspects the suppliers and customer’s findings are at times contradicting
which could means that the practitioners are giving positive views to cover for the firm’s
weakness. It clearly shows that the firm’s form of Supply chain information sharing has
not influenced the farmers. The study recommends that relevant information could be
communicated to farmers in a compatible means to influence them. The firm should

187
understand the demographic characteristics of the farmers for their communication to be
effective. With regards to customers the firm could enhance their performance by putting
more tracking orders and formalization of Supply chaininformation sharing.
With regards to Supply chain decision synchronization and performance of dairy
processing firms , the results were contradictory. The study recommends to the firm to
find other ways to influence farmers and customers. The firm should collaborate with key
stakeholders by join decisions and share benefits. They find ways of ensuring that their
decisions, planning and resolution are understood.
Based on the results on Supply chain Supply chain incentive alignment and performance
of dairy processing firms , the firm offers subsidized AI/Veterinary services but not
effective. It is recommended that the firm offer other collaborative Supply chain Supply
chain incentive alignment measures to influence farmers. The study recommends that
supply chain practitioners/managers could exploit other possible options like
collaborating with financial institutions, cooperative societies, donors, educational
institutions for training needs, public-private development partnerships and all committed
group of partners.It would be of competitive advantage if the firm could provide
collaborative programmes with international supply chain partners. This could be better
incentive to farmers.With regard to customers the firm should enhance Supply chain
Supply chain incentive alignment for better performance.
Based on the results on Supply chain teamworkand performance of dairy processing firms
, there is significant influence on performance of the firm. The study recommends that the
firm maintain Supply chain teamworkwith its supply chai partners for cordial relationships
and togetherness. The studyrecommends that the firm should be fully committed to
imparting trust to suppliers and customers of dairy processing firms .
The dairy industry has become increasingly competitive and this research demonstrates
that milk processing firms need to demonstrate sensitivity in performance in terms of
market share, profitability and client satisfaction. Managers/supply chain practitioners

188
should be cautious and should have appropriate knowledge regarding farmers and
customer feedback regarding to performance measures. The study recommends that the
firm should not underestimate the mediating effect of dairy board but instead appreciate
the policies and regulation of the body and find ways to realign the policies and regulations
to the objectives of the firm and also consider the key stakeholders of the firm (suppliers).
The study recommends tradeoffs to be made wisely on client satisfaction and expectation
of suppliers/customers.
5.4.2 Policy Recommendations
Milk processing firm should realign their policies and other collaborative partners. The
firm should realign policies in line with dairy board. The board policies and regulations is
a driving force behind performance of milk processing firm. Also, the firm should broaden
the vision beyond the firms’ internal supply or value chain for their growth
5.5 Areas for Future Research
This study should be interpreted with some concern as it is directed only to the SCC
towards performance of dairy processing firms hence there is also a necessity to recognize
other variables or constructs that may possibly have an influence on Performance of dairy
processing firms . It is anticipated that this will stimulate future research considering the
importance of client satisfaction.Moreover the studies on supply chain collaboration on
performance have shown inconsistent results.
The researcher recommends tha tsimilar studies maybe replicated in milk processing firms
in othe rregions or in wider scopesoasto improve the external validity of the findings.
Also,comparative analysis could be done involving other dairy processing firms milk
processing firms in Kenya. This would ascertain whether there are significant differences
between firms with respect to performance of the firm.Future studies may be conducted
on the influence of SCC on performance of other firms but under different social,
economic and political conditions. The study focused on five supply chain collaboration

189
variable which were; Supply chain information sharing, decision synchronization,
incentive alignment, Supply chain teamworkand dairy board. With respect to supplier, the
variables accounted for 40.2% without mediation and 41.3% variation with mediation.
With respect to customer, the variables accounted for 39.3% without mediation and 40.9%
variation with mediation. From empirical evidence, it actually demonstrates the whole of
supply chain collaboration is beyond the scope of five collaborations identified in the
study. Therefore, similar study can be conducted using different supply chain
collaboration variables that influence performance of dairy processing firms or other milk
processing firms.
Finally, further research can be conducted on the influence of supply chain collaboration
but in different sectors other than milk processing firms such as in education, public
service, private and health sectors.The study should examine objective measures of supply
chain collaboration with other firms and come with conceptual model.

190
REFERENCES
Abebe, G.K., Bijman, J., Pscucci, S. & Omta, O. (2013).Adoption of improved potato
varieties in Ethiopia:The role of agricultural knowledge and innovation system
and smallholder farmers’ quality assessment. New Zealand:Elsevier Ltd
Abdallah, A.B., Obeidat, B.Y., & Aqqad, N.O. (2014). The Impact of Supply Chain
Management Practices on Supply Chain Performance in Jordan: The
Moderating Effect of Competitive Intensity. International Business
Research, 7(3), 13-27.
Afuah, A. (2001). Dynamic boundaries of the firm: Are firms better off being vertically
integrated in the face of a technological change?. The Academy of Management
Journal, 44(6), 1211–1228.
Al-Doori, J.A. (2019). The impact of supply chain collaboration on performance in
automotive industry: Empirical evidence. Journal of Industrial Engineering and
Management,12(2), 241-253.
Allemand, T. R., & Jain, N. (2013). Project Finance and Investments in Risky
Environments: Evidence from the Infrastructure Sector. Journal of Financial
Management of Property and Construction, 18(3), 251-267.
Anbanandam, R., Banwet, D. K., & Shankar, R. (2011). Evaluation of supply chain
collaboration: A case of apparel retail industry in India. International Journal of
Productivity and Performance Management,60(2), 82-98.
Angulo, A., Nachtmann, H., & Waller, M. (2004). “Supply chain Supply chain
information sharingin a vendor managed partnership”. Journal of Business
Logistics, 25(1), 101-20.

191
Arif-Uz-Zaman K,A.M.M. & Ahsan N, (2014). Lean supply chain performance
measurement, International Journal of Productivity and Performance
Management, 63(5), 588-612.
Arshinder, K., Kanda,A.,& DeshmukhS.G., (2011). A review on supply chain
coordination: Coordination mechanisms, managing uncertainty and research
directions; ‘Supply Chain Coordination under Uncertainty’, International Hand-
books on Information Systems, Berlin: Heidelberg Springer, , pp. 39–82.
Ataseven, C., & Nair, A. (2017). Assessment of Supply Chain Integration and
Performance Relationships: A Meta-Analytic Investigation of the Literature.
International Journal of Production Economics.
https://doi.org/10.1016/j.ijpe.2017.01.007
Attaran, M., &Attaran, S. (2007), “Collaborative supply chain management: The most
promising practice for building efficient and sustainable supply chains”, Business
process management journal, Vol.13 No.3, pp.390-404.
Balina, S., Baumgarte, D., & Salna, E. (2017). Cloud Based Cross-system Integration for
small and mediumsized enterprises, Procedia Computer Science, (104) 127-132
Banomyong, R. (2018), “Collaboration in Supply Chain Management: A Resilience
Perspective”, International Transport Forum Discussion Papers: Paris. OECD
Publishing.
Banomyong, R.,&Supatn, N. (2011), Developing a supply chain performance tool for
SMEs in Thailand, Supply Chain Management: An International Journal, Vol. 16,
No. 1, pp. 20-31.
Barney, J. B. (2012). ‘Purchasing, supply chain management and sustained competitive
advantage’: The relevance of resource-based theory’, Journal of Supply Chain
Management 48(2), 3–6.

192
Barney, J. B. (2001). ‘Resource-based theories of competitive advantage’: A ten-year
retrospective on the resource-based view’, Journal of Management,27(6), 643–
650.
Barratt& Mark (2004). ‘Understanding the meaning of collaboration in the supply chain’,
SupplyChain Management: An International Journal,9(1), 30–42.
Barros, G. (2010). ‘Herbert A. Simon and the concept of rationality: Boundaries and
procedures’, Brazilian Journal of Political Economy,30(3(119)), 455–472.
Basu, G., Jeyasingam, J., Habib, M., Letchmana, U., & Ravindran, R. (2017). The Impact
of Supply Chain Management Practices on the Performance of Private Universities
in Malaysia. International Journal of Supply Chain Management, 6(3), 22-35.
Batenburg, R. (2007). ‘an open mind in a research joy forever: A reply; journal of
Purchasing and Supply Management,13 (3), 223-224
Benavides, Luis & Versa de Eskinazis (2012), ‘Six steps to successful supply chain.
Blackhurst, J., Dunn, K., & Craighead, C. (2011).An empirically derived framework of
global supply resiliency.Journal of Business Logistics, 32(4), 374-391.
Borut, P.C. & Dahmane, R. (2014). The role of antioxidants in skin cancer prevention and
treatment. Oxidative medicine and cellular longevity, 2014.
Bouwens, J., Margaret, A., Abernethy, & Lent, L. v. (2013) "The Role of Performance
Measures in the Intertemporal Decisions of Business Unit
Managers."Contemporary Accounting Research: 30 no 3; 925-961.
Bray, R. L. & Mendelson, H. (2012). Information transmission and the bullwhip effect:
An empirical investigation. Management Science, 58(5), 860–875.euer, C.,
Siestrup, G., Haasis, H. & Wildebrand, H. (2013). Collaborative risk management
in sensitive logistics nodes. Team Performance Management, 19(7/8), 331-

193
351.
Cao, M., & Zhang, Q. (2013). Supply Chain Collaboration: Roles of Interorganizational
Systems, Trust, and Collaborative Culture (1-221). London: Springer.
Cao, M. &Qingyu, Z. (2011), ‘Supply chain collaboration: Impact on
collaborativeadvantage and firm performance’, Journal of Operations
Management, 29(3), 163-180.
Carter, Rogers, C. (2008), ‘Knowledge production and knowledge transfer - closing the
research- practice gap’, Journal of Supply Chain Management 44(2), 78–82.
Cecil,B.,& Robert,H., (2008). Introduction to Operations and Supply ChainManagement.
Prentice Hall.
Chaplin, L., & O’Rourke, S. J. (2014). Lean Six Sigma and marketing: a missed
opportunity. International Journal of Productivity & Performance Management,
665-674.
Chartered Institute of Purchasing and Supply, (2018). http://www.cips.com/
Chen, I.J.,& Paulraj, A., (2004a). ‘Towards a theory of supply chain management: the
constructs and measurements’, Journal of Operations Management,22(2), 119 –
150.
Chen, I.J., Paulraj, A. & Lado. A. (2004), "Strategic purchasing, supply management,
and firm performance", Journal of Operations Management,Vol. 22, 505-523.
Chen, L.; Zhao, X.; Tang, O.; Price, L.; Zhang, S.; Zhu, W. (2017). Supply chain
collaboration for sustainability: A literature review and future research agenda.
International Journal of Production Economics, in press.

194
Chopra, S.,& Meindl, P. (2014). Supply Chain Management, Prentice-Hall, Upper Saddle
River, NJ.
Cooke, J. A. (2011), ‘Sharing supply chains for mutual gain’. Retrieved on 02/07/2020
Cooper, D.R & Schindler, P.S. (2008). Business Research Methods; (10th edn).York:
McGraw Hill Irwin ISBN
Council of Supply Chain Management Professionals (2011). Glossary of terms.
Retrieved on 06/07 2020
Cousins, P.D. &Menguc, B. (2006), ‘The implications of socialization and integration in
supply chain management’, Journal of Operations Management,24(5), 604 – 620.
Creswell, J.W. (2013). Research design: Qualitative, Quantitative, and mixed methods
Approaches, (4th ed.), London: Sage Publications
Dairy Industry (Regulatory Permits and Levy) Regulations, 2020
Dairy policy Draft, (2018). Towards a Competitive and Sustainable Dairy Industry for
Economic Growth in the 21s Century and Beyond.Ministry of Livestock
Development and Fisheries. Kenya
Dairy Report (2011). Kenya. Nairobi
Datta, P. &Roy, R. (2011), “Operations strategy for the effective delivery of integrated
industrial product-service offerings: Two exploratory defense industry case
studies”, International Journal of Operations & Production Management, Vol. 31
No. 5, pp. 579-603.
Daugherty, P. J. (2011). “Review of Logistics and Supply chain Relationship Literature
and Suggested Research Agenda.” International Journal of Physical Distribution
& Logistics Management,41(1):16-31.

195
De Carmago, P.F., & Charbel, J.C.J. (2017). Information systems and sustainable supply
chain management towards a more sustainable society: Where we are and where
we are going. International Journal of Information Management, 37(4), 241-24.
Devaraj,S.,Krajewski,L.,and Wei,J.C.(2007),"ImpactofeBusinesstechnologies
onoperational performance: The role of production information integration in
the supply chain", Journal of OperationsManagement,Vol.25,1199-1216.
Dhakal, C.P. (2016). Optimising multiple regression model for rice production
forecasting in Nepal, Doctoral thesis, Central Department of statistics, Nepal:
tribhuvan University.
Disney, Stephen M., Andrew T., Potter & Bernard M. G., (2003), ‘The impact of ven-
dor managed inventory on transport operations’, Transportation Research Part
E: Logistics and Transportation Review,39(5), 363 – 380.
Dr. Kivunja, C. (2018). Distinguishing between Theory, Theoretical Framework, and
ConceptualFramework: A Systematic Review of Lessons from the Field.
International Journal of Higher Education,Vol 7, No 6
Dyer, J.H., & Singh, H. (1998). The relational view: cooperative strategy and sources of
interorganizational competitive advantage, Academy of Management Review,
23(4), 66-79.
Edmans, A., Goldstein I., & Zhu, J. (2013). Contracting with synergies. Working Paper
at Wharton School of Business.
Effendi, F.S.R. (2015).The Determinants of Logistics Efficiency in Malaysia. Social
Science Research Network
Ellinger, A., & Richey, Jr, R. G. (2013). “Some Ideas and Guidance for Prospective

196
IJPDLM Authors.” International Journal of Physical Distribution & Logistics
Management,43(3).
Fawcett, S. E., Fawcett, A. M., Watson, B. J., &Magnan, G. M. 2012. “Peeking Inside the
Black Box: Toward an Understanding of Supply Chain Collaboration Dynamics.”
Journal of Supply Chain Management,48(1):44-72.
Fawcett, S. E., Magnan, G. M., & McCarter, M. W. (2008). “A Three-Stage
Implementation Model for Supply Chain Collaboration.” Journal of Business
Logistics,29(1):93-112.
Fayezi, Sajad, Andrew O’L.& Ambika, Z. (2012), ‘Agency theory and supply chain
management: A structured literature review’, Supply Chain
Management: An International Journal,17(5), 556 – 570.
Field, A. (2013) Discovering Statistics Using IBM SPSS statistics, 4th Edition. London
SAGE Publishers ltd.
Fierro, J. & Redondo, Y. (2008), “Creating satisfaction in the demand-supply chain: the
buyers’ perspective”, Supply Chain Management: An International
Journal,Vol.13, No.2, pp. 160-169.
Flammer, C. & Bansal, P. (2017) “Does a long Term Orientation Create Value?:
Strategic Management Journal,38: 1827-1847
Flynn, B.B., Huo, B., & Zhao, X. (2010). The impact of supply chain integration on
performance: A contingency and configuration approach. Journal of Operations
Management, 28(1), 58-71.
Font, X., Richard T., Karen S.,& Marianna K.,(2008). ‘Sustainable sup- ply chain
management in tourism’, Business Strategy and the Environment, 17(4), 260–271.

197
Frohlich, M. T., Flammer & Bansal (2002). "E-integration in the supply chain: Barriers
and performance", Decision Sciences,Vol. 33, 537-556.
Frohlich, M. T. & Westbrook, R. (2001). “Arcs of Integration: An International Study of
Supply Chain Strategies”, Journal of Operations Management, Vol. 19, No. 2, pp.
185-200.
Gachengo, W., & Kyalo, J.K. (2015). Knowledge Based Inter-Firm Collaborations:
ATheoretical Review. Journal of Educational Policy and Entrepreneurial
Research, 2(1): 70-86.
Ganga,G.M.D.,& CarpinettiL.C.R.(2011).AFuzzy LogicApproachtoSupply Chain
Performance Management:InternationalJournalofProduction Economics 134(1),
Retieved from https://doi.org/10.1016/j.ijpe.2011.06.011
Goffin, K., Lemke, F., &Szwejczewski, M. (2006). “An exploratory study of „close‟
supplier – manufacturer relationships”. Journal of Operations Management,
Vol.24, No. 2, pp. 189-209.
Golicic, S., Davis, D.F. (2012). ‘Implementing mixed methods research in supply chain
management; International Journal of Physical Distribution& Logistics
management, 42 (8), Early pre-publication
Golrizgashti, S. (2014). Supply chain value creation methodology under
BSCapproach, Journal of Industrial Engineering International,10(67), 1–15.
http://dx.doi.org/10.1007/s40092-014-0067-5
Government of Kenya, (2016). Dairy Industry Act,Chapter 336, available at
www.kenyalaw.org on 5th December 2016
Government of Kenya (2013).Kenya Vision 2030 & its Second MTP 2013-2017,Ministry

198
of Planning. Nairobi: Government Printer
Government of Kenya (2013). Towards a Competitive and Sustainable Dairy Industry for
Economic Growth in the 21st Century and Beyond; Sessional Paper No.5 of 2013
in National Dairy Development Policy,Nairobi: Government Printers
Government of Kenya (2013). Economic Survey, Nairobi: Government Printer
Government of Kenya (2003). Economic Recovery Strategy for Wealth and Employment
Creation 2003-2007.Nairobi: Government Printers.
Grover, V., &Manoj, K. M. (2003). ‘Transaction cost framework in operations
and supply chain management research: theory and measurement’. Journal of
Operations Management,21(4), 457 – 473.
Ha, Byoung-Chun, Yang-Kyu P.,& Sungbin C., (2011), ‘Suppliers’ affective trust atrust
in competency in buyers: Its effect on collaboration and logistics efficiency’,
InternationalJournal of Operations & Production Management, 31(1), 56 –
77.
Hadaya, P., Cassivi, L. (2007). The role of joint collaboration planning actions in a
demand-driven supply chain. Industrial Management & Data Systems, 107(7),
954-978.
Hair, Jr., Joseph, F., William, C., Black, Barry J., Babin, &Rolph, E. A. (2010),
Multivariate Data Analysis: International Version, 7 edn, London: Pearson.
Håkansson, H., & David, F. (2002). ‘How companies interact in business networks?’.
Journal of Business Research,55(2), 133–139.
Halldórsson, Á., Herbert, K., Juliana, H., Mikkola, &TageS.-L (2007), ‘Complementary
theories to supply chain management’, Supply Chain Management: An
International Journal,21(4), 284 – 296.

199
Handfield, R.B., & Nichols, E.L. (1999). Introduction to Supply Chain Management.
Jersey: Prentice-Hall.
Hearnshaw, E. J. S., & Wilson, M. M. J. (2013). A complex network approach to supply
chain
Heide, J.B., & John, G. (1990). Alliances in industrial purchasing: the determinants of
joint action in buyer-supplier relationships. Journal of Marketing Research,27(1),
24-36.
Henderson, A., & Fredrickson, J. (2001). “Top management team coordination needs and
the CEO pay gap” : A competitive test of economic and behavioral views.
Holmberg, S. A. (2010). Systems perspective on supply chain measurements.
International Journal of Physical Distribution and Logistics Management,
30(1), 847–868.
Holweg, M. & Pil, F. K. (2016). Theoretical perspectives on the coordination of
supply chains. Journal of Operations Management, 26(3), 389–406
Hsieh, M. H., Tsai, K. H., & Wang, J. R. (2008), "The moderating effects of market
orientation and launch proficiency on the product advantage-performance
relationship", Industrial Marketing Management,Vol. 37, 580-592.
Huang, C.H., Kuo, L.L., Yang, K.D., Lin, P.S., Lu, P.L., Lin, C.C., et al., (2013).
Laboratory diagnostics of dengue fever: an emphasis on the role of commercial
dengue virus nonstructural protein 1 antigen rapid test. Journal of Microbiol
Immunol Infect. 46(5):358–65.
Hunt, S.D., & Donna, F. D. (2012). ‘Grounding supply chain management in resource
advantage theory: In defense of a resource-based view of the firm’. Journal of
Supply Chain Management,48(2), 14–20

200
Huo, B., Zhao, X., & Zhou, H. (2014). The effects of competitive environment on supply
chain Supply chain information sharing and performance: An empirical study in
China. Production and Operations Management,23(4), 552-569.
IMP Group. (2012). International Marketing and Purchasing of Industrial
Goods.www.impgroup.org. Accessed on June, 2, 2016.
Imenda,S. (2014). Is there a conceptual difference between theoretical and conceptual
frameworks, Journal of Social Sciences, 38 (2), 185-195
Jack G., Carlos A. & Jacques H. (2008). Agro-Industrial Supply Chain Management:
Concepts and Applications. Food and Agriculture Organization of the United
Nations.
ubilee Manifesto. (2012). “Transforming Kenya: Securing Kenya’s Prosperity 2013-
2017”Shared Manifesto of the Coalition between”. The National Alliance, TNA,
The United Republican party URP, the National Rainbow Coalition (NARC) and
the Republican Congress Party (RC).
Kaipia, R., Dukovska-Popovska, I., & Loikkanen, L. (2013), "Creating sustainable fresh
food supply chains through waste reduction", International Journal of
Physical Distribution & Logistics Management, Vol. 43 No. 3, pp. 262-276.
Kaiser, H. (1974). An index of factorial simplicity. Psychometrika, 39,31-36
Kale, J., Reis, E., &Venkateswaran. A. (2009). Rank-order tournaments and incentive
alignment: the effect on firm performance. Journal of Finance,64: 1479-1512.
Katothya, G.(2017). Gender assessment of dairy value chains: Evidence from Kenya,
Rome, FAO.
Kauppi, K., Longoni, A., Caniato, F., & Kuula, M. (2016). Managing country disruption
risks and improving operational performance: risk management along integrated

201
supply chains. International Journal of Production Economics, 182(August), 484-
495.
KCC Report (2017). Committee Paper NO: TCP/KCC/14/05a
KCC Food Safety Manual (2016). KCC/ELD/KTL/01
Kenon,V.H., & Palsole,S.V. (2019). Developing an agile global workforce: Challenges
and Critical Success Factors; Winley Online Library
Kenya Dairy Board. (2020). Regulatory and Levy Regulation. The dairy Act, (Cap. 336)
Kenya Dairy Board. (2016). Annual Report and financial statement. Kenya, Nairobi
Kenya Dairy Board. (2014). Annual Report and financial statement. Kenya, Nairobi
Kenya National Bereau of Statistics (KNBS) (2016). Economic Survey. Nairobi:
government Printers
Karanja. (2003). The Dairy Industry in Kenya: The Post-Liberalization Agenda. Paper
presented at a Dairy Industry Stakeholders Workshop Kenya, Nairobi.
Kenya National Bureau of Statistics (2014), Economic Survey.
Kenya Dairy Board website: www. kdb.co.ke accessed August, 2018.
Kerzner, H.R. & Saladis, F.R., (2013). Project Management workbook and PMP/CAPM
Exam study Guide (11Edition), Wiley, New Jersey
Kinyenje, J.M (2013).Factors Influencing Performance of Dairy Industry In Meru Central
District, Kenya: A Case of Katheri Dairy Co-Operative Society. Kenya:University
of Nairobi
Kim, S. Cohen, M. a& Netessine, S. (2007), “Performance contracting in after-sales
202
servicesupply chains”, Management Science, Vol. 53, No. 12, pp. 1843-1858.
Kinra, A.&Kotzab, H. (2008), ‘A macro-institutional perspective on supply chain
environmental complexity’, International Journal of Production
Economics,115(2), 283 – 295.
Kothari, C.R. (2005). Research methodology: Methods and Techniques. Delhi: Age
International Publishers.
Kothari, C.R., & Garg, G. (2014). Research methodology: Methods and Techniques.
Delhi: Age International (P) Ltd.
Kotzab, Herbert, Christopher, Teller, David, B. Grant, & Leigh, S. (2011). ‘Antecedents
for the adoption and execution of supply chain management’: Supply Chain
Management. An International Journal 16(4), 231 – 245.
Krause, D. R., Robert B. H.,& Beverly B. T (2007), ‘The relationships between supplier
development, commitment, social capital accumulation and performance improve-
ment’, Journal of Operations Management 25(2), 528 – 545.
Kulp, S. C., Lee, H. L., & Ofek, E. (2004b), "Manufacturer benefits from information
integration with retail customers", Management Science,Vol. 50, 431-444.
Lau, A., Yam, R., & Tang, E. (2010), "Supply chain integration and product modularity:
An empirical study of product performance for selected Hong Kong manufacturing
industries", International Journal of Operations & Production Management,Vol.
30, 20-56.
Lawson, Benn, Paul, D., Cousins, Robert, B., Handfield & Kenneth J. P., (2009),
‘Strategic purchasing, supply management practices and buyer performance
improvement: an empir- ical study of uk manufacturing organisations’,
International Journal of Production Research,47(10), 2649–2667.

203
Lee, H. L., & Whang, S. (2004), e-Business and Supply Chain Integration (Vol. 62),
York: Springer
Lee, Hau L., Kut, C., So & Christopher S. T., (2000), ‘The value of Supply chain
information sharing in a two-level supply chain’, Management Science,46(5),
626–643.
Lehoux, N., Amours, S.D. & Langevin, A. (2014), Inter- firm collaborations and supply
chain coordination: review of key element and case study. Production Planning &
Control,25(10), pp. 858-872.
Lemma, H.R., Singh, R. & Kaur, N. (2015), Determinants of supply chain coordination
of milk and dairy industries in Ethiopia: a caseof Addis Ababa and its
surroundings. Springer Open Journal. India.Springer.
León-Bravo, V., Caniato, F., Caridi, M., & Johnsen, T. (2017), Collaboration for
Sustainability in the Food Supply Chain: A Multi-Stage Study in Italy.Open
access article,Switzerland.MDPI, Basel
Leończuk & Dorota. (2016). Categories of supply chain performance indicators: an
overview of approaches" Business, Management and Education, 14(1),103–115.
Liang,Q.,Hendrikse,G.,Huang,Z.,&Xu,X.(2015).Governance structureofChinese
FarmerCooperatives:EvidencefromZhejiang Province.Agricbusiness:An
InternationalJournal, 31(2), 198-214.
Makoni, N., Mwai, R., Redda, T., Zijpp, A. van der., Lee, J. van der. 2013. White Gold;
Opportunities for Dairy Sector Development Collaboration in East Africa.Centre
for Development Innovation, Wageningen UR (University & Research centre).
CDI report CDI-14-006. Wageningen.
Malhotra, N.K. (2004). Marketing Research: an Applied Orientation, (4th Edn). New

204
Jersey, Upper Saddle River: Pearson Prentice-Hall
Mangan, John, Chandra, L. & Bernard, G. (2004). Combining quantitiative and qualitative
methodologies in logistics research; International Journal of Physical Distribution
& logistics Management,34 (7), 565-578
Manthou, V., Vlachopoulou, M., & Folinas, D. (2004). Virtual e-Chain (VeC)
model for supply chain collaboration. International Journal of Production
Economics, 87, 241-250.
Manuj, I. & Mentzer, J.T. (2016). "Global supply chain risk management." Journal of
Business Logistics, 38(2), 192‐22
March, R.,& Wilkinson, I., (2009), ‘Conceptual tools for evaluating tourism partnerships’,
Tourism Management,30(3), 455 – 462.
Mathae, R. K., Paul, S. N. & Mbura, L. K. (2018). Effect of bullwhip on performance of
milk processing firms in Kenya. International Academic Journal of Procurement
and Supply Chain Management, 3(1), 58-84
Meme, F.K. (2017) . Board Characteristics and Financial Performance of Manufacturing
firms Listed At The Nairobi Securities Exchange In Kenya. Thesis:
Kenyatta University
Mena, Carlos, Andrew, H.,& Richard, W., (2009), ‘A comparison of inter- and intra-
organizational relationships: Two case studies from uk food and drink industry’,
Inter- national Journal of Physical Distribution & Logistics Management,39(9),
762 – 784.
Mendelson, R. (2008). Teamwork-the key to productivity. Journal of Management in
Engineering;14(1); 22-25

205
Milin,P &Hadzˇic´, O. (2011). Moderating and Mediating Variables in Psychological
Research, Serbia: University of Novi Sad
Moharana, H.S., Murty, J.S., Senapati, S.K. & Khuntia, K. (2014). Importance of
Information vol 1 issue 2
Morgan, N. A., Anna, K., & Richard, A. G. (2007). ‘Focal supplier opportunism
in supermarket retailer category management’, Journal of Operations
Management,25(2), 512 –527.
Morrisey, J. & Pittaway, L. (2006), “Buyer-supplier relationships in small firms; the use
of social factors to manage relationships”, International Small Business Journal,
Vol.24, No.3, pp. 272-298.
Mugenda, A.G. (2008). SocialScience Research Theory and principles, Applied
Research & Training Services,Kenya: Nairobi
Muhammad, Z., Akhter, S. N.,& Ullah, M. K. (2014) Dairy Supply Chain Management
and Critical an Investigations on Dairy Informal Channel Partners in Pakistan;
Journal of Business and Management, Vol 16, Issue 3. Ver. V PP 81-87 Assessed
from: www.iosrjournals.org
Mulwa, L.M. (2015). Determinants of Supply Chain Management Practices in
Organizations. Proceedings from 1st DBA-Africa Management Review
International Conference 20th March , 2015 Pp. 196-211.
Musau,E.G. (2018). Supply Chain Determinants of Organizational Performance among
Textile Manufacturing Firms in Kenya.The Moderating Effect of Background
Characteristics. Thesis. Jomo Kenyatta University of Agriculture and Technology

206
Namusonge, S.O., Mukulu, E., &Kirima, N. (2015). Supply chain information sharing,
Cooperative Behavior and Hotel Performance: International Journal of Business
& Social Research,Vol. 05, issue. 09
Naslund, D. (2002). ‘Logistics needs qualitative research: especially action research;
International Journal of Physical Distribution & logistics Management, 32 (5),
321-338.
National Research Council of Thailand (2012), Thailand Research Framework, National
ResearchCouncil of Thailand.
Ngigi, M. (2004). Building on successes in African agriculture smallholder dairy in
Kenya, International Food Policy. Research Institute. Focus 12, Brief 6
Nyaga, G. N., & Judith, M. W. (2011). ‘Relationship quality and performance outcomes:
Achieving a sustainable competitive advantage’, Journal of Business
Logistics,32(4), 345–360.
Nyaga, G. N., Judith, M., Whipple & Daniel F. L., (2010), ‘Examining supply chain re-
lationships: Do buyer and supplier perspectives on collaborative relationships
di↵er?’, Journal of Operations Management 28(2), 101 – 114.
Oh, J., & Rhee, S.K. (2008), “The influence of supplier capabilities and technology
uncertainty on manufacturer-supplier collaboration”, International Journal of
Operations & Production Management, Vol. 28 No. 6, p. 28.
Olok-Asobasi, F., &Sserunjogi, M. (2001). Survey of dairy markets inKenya and about
and Rwanda and opportunities for Uganda Exports.
Omid, K. Mehdi, M. (2016). The relationship between Team effectiveness and project
aspects: a case study of Iranian construction project team, International Journal of
Humanities and Cultural Studies,2(3), 1738-1767
207
Orodho, A. J. (2005). Essentials of Education and Social Science Research Methods.
Nairobi: Kanezja Publishers
Orodho, A. J. Kombo, D.K. (2002). Research Methods. Nairobi: Kenyatta University
Oteki , E.B. (2018). Influence of Electronic Procurement Practices on Supply Chain
Performance of Sugar Processing Firms In Kenya. Thesis: Jomo Kenyatta
University of Agriculture and Technology
Ou, C. S., Fang C. Liu, Yu, C. H., & David C. Y. (2010), ‘A structural model of supply
chain management on firm performance’, International Journal of Operations &
Production Management, 30(5), 526 – 545.
Pallant, J. (2010). SPSS Survival Manual. A step by step guide to data analysis usingSPSS
(4th ed.). Melbourne: Open University Press.
Parks, L. (2001). “Wal-Mart gets onboard early with collaborative planning”, Drug Store
s, Vol. 23 No. 2, p. 14.
Piboonruroj, P. (2012). Supply Chain Collaboration: Impacts and Mediation on Firm
Performance. Published PhD Thesis, Wales, United Kingdom: Cardiff University
Potocan, V. (2009). Does trust influence supply chain management?: The Journal of
American Academy of Business, 15(1), 118-224.
Prajogo, Daniel,& Olhager., (2012), ‘Supply chain integration and performance: The
effects of long-term relationships, information technology and sharing, and
logistics integration’, International Journal of Production Economics,135(1),
514 – 522.
Rademaker, C.J., Bebe,B.O., Vander Lee, J., Kilelu, C., & Tonui, C. (2016). Sustainable
Growth of the Kenyan Dairy Sector: A quick scan of robustness, reliability and
resilience (No 979). Wageningen University and Research

208
Ramanathan, U.,& Gunasekaran, A. (2012), ‘Supply chain collaboration: Impact of
success in long-term partnerships’, International Journal of Production
Economics,In press.
Ramanathan, U., Gunasekaran, A., Subramanian, N. (2011), “Supply chain collaboration
performance metrics: a conceptual framework”, Benchmarking: An International
Journal, Vol.18, No.6, pp. 856-872.
Ray, G. Jay, B. & Waleed A. M. (2004), ‘Capabilities, business pro- cesses, and
competitive advantage: choosing the dependent variable in empirical tests of the
resource-based view’, Strategic Management Journal, 25(1), 23–37.
Richey, R. G., Anthony S. R., Judith M. W., & Stanley E. F. (2010), ‘Exploring a
governance theory of supply chain management: Barriers and facilitators to
integration’, Journal of Business Logistics31(1), 237–256.
Runkel, P. (2017). Cp and Cpk: Two Process perspectives, One Process reality. Retrieved
from http:/blog.minitab.com/blog/statistics-and-quality-data-analysis Assessed
on 22/06/2020
Samadi, E., & Kassou, I. (2016). The Relationship between IT and Supply Chain
Performance: A Systematic Review and Future Research. American Journal
of Industrial and Business Management,6, 480-495. Retrieved from
http://dx.doi.org/10.4236/ajibm.2016.64044
Sanders, N. R. (2008), "Pattern of information technology use: The impact on buyer-
suppler coordination and performance", Journal of Operations Management,Vol.
26, 349-367.

209
Saunders, M., Lewis, P., &Thornhill, A. (2019). Research Methods for Business
Students:8th Ed. London:Pearson Education Limited
Saunders, M., Lewis, P., & Thornhill, A. (2019). Research Methods for Business
Students:6th Ed. London: Pearson Education Limited
Schepker, D., Oh, Y-W. Martynov, A. & Poppo, L. (2014), “The many futures of
contracts: Moving beyond structure and safeguarding to coordination and
adaptation”, Journal of Management, Vol. 40 No. 1, pp. 193-225.
Seligman, M. E. P., & Peterson, C. (2004). Positive clinical psychology. In L. G. Aspinwall
& U. M. Staudinger (Eds.), A psychology of human strengths: Fundamental
questions and future directions for a positive psychology:(pp. 305–317).
Washington, DC: American Psychological Association.
Selviaridis, K.,& Spring, M. (2018). Supply chain alignment as process: contracting,
learning and pay-for- performance. International Journal of Operations &
Production Management,United Kingdom: Lancaster UniversityManagement
School DOI: 10.1108/IJOPM-01-2017-0059
Shepherd, C., & Gunter, H. (2012). Measuring supply chain performance: current research
and future directions", International Journal of Productivity and Performance
Management, 55(3/4), 242-258.
Simatupang, T. M., &Sridharan, R. (2005). The collaboration index: A measure for supply
chain collaboration. International Journal of Physical Distribution &
Logistics Management, 35(1), 44-62.
Singh, A. (2013). Understanding supply chain disruption risk with the aid of social
networks and information flows analysis. Ph.D. Thesis. Aston University.

210
Sirmon, D.G., M.A. Hitt& R.D. Ireland (2007), ‘Managing firm resources in dynamic
environments to create value: looking inside the black box’, Academy of
Management Review32(1), 273–292.
Smallholder Dairy Project (2005). The uncertainty of cattle numbers in Kenya.SDP Policy
Brief No. 10. Smallholder dairy (R&D) Project.Retrieved from www.
Soosay, C. A., Hyland, P. W., &Ferrer, M. (2008) Supply chain collaboration:
Capabilities for continuous innovation. Supply Chain Management: An
nternational Journal, 13(2), 160-169.
Stein, A. A., (1982), ‘Coordination and collaboration: regimes in an anarchic world’,
International Organization 36(02), 299–324.
Stock, James, Stefanie Boyer and Tracy Harmon (2010), ‘Research opportunities in
supply chain management’, Journal of the Academy of Marketing Science,38(1),
32–41. 10.1007/s11747-009-0136-2.
Sumo, R. van der Valk, W. van Weele, A. & Bode, C. (2016), “Fostering incremental and
radical innovation through performance-based contracting in buyer-supplier
relationships”, International Journal of Operations & Production Management,
Vol. 36 No.11, pp. 1482-1503.
Supply Chain Management Review (SCMR) and Computer Sciences Corporation (CSC)
(2004), “The second annual global survey of supply chain progress”, Retrieved
from: www.csc.com/ features/2004/55.shtml.
Tabachnick, B.G., & Fidell, L. S. (2013). Using Multivariet statistics. (6th Edn) Boston:
Pearson Education Inc.
Tan, K.C., (2001), ‘A framework of supply chain management literature’, European Jour-
nal of Purchasing & Supply Management 7(1), 39 – 48.

211
USAID KENYA. (2010). Usaid Kenya Dairy Sector Competitiveness Program. Nairobi,
Kenya: Land O' Lakes Inc.
Vieira, Valter A., Plinio R.R., Monteiro& Ricardo T. V. (2011), ‘Relationship
marketing in supply chain: an empirical analysis in the 211organization service
sector’, Journal of Business & Industrial Marketing,26(7), 524–531.
Vinodh, S. S., Kumar, S., & Vimal, K. (2014). Implementing lean sigma in an Indian
rotary switches manufacturing organization. Journal of Production Planning
& Control, 25(4), 288-302.
Waema, M. (2013). The effects of competitive strategies on performance of dairy firms in
Kenya. Research Project, Nairobi, Kenyatta University.
Wambugu, S., Kirimi, L. & Opiyo, J. 2011. Production Trends and Performance of
Dairy Farming in Kenya. Tegemeo Institute of Agricultural Policy and
Development, Working Paper, WPS 43/2011.
Waweru,Z.W. (2o18). Influence of Supply chain teamworkApproach on Project
Performance: a case of Kenya, University of Nairobi
Weele, A. V. (2010). Purchasing and Supply Chain Management: Analysis, Strategy,
Planning and Practice.Andover: Cengage Learning.
Wilding, Richard, A., S. &Humphries (2006), ‘Understanding collaborative supply chain
relationships through the application of the williamson organisational failure
framework’, International Journal of Physical Distribution & Logistics
Management 36(4), 309 – 329.
Williamson, O. E. (2010), ‘Transaction cost economics: The natural progression’,
American Economic Review,100(3), 673–690.

212
Williamson, O. E. (2008), ‘Outsourcing: Transactio, cost economics and supply chain
management’, Journal of Supply Chain Management,44(2), 5–16.
Williamson, O. E. (2005b), ‘Transaction cost economics and business administration’,
Scan- dinevian:Journal of Management,21(1), 19–40.
Williamson, O. E. (2002), ‘The theory of the firm as governance structure: From choice
to contract’, The Journal of Economic Perspectives,16(3), 171–195.
Whipple, J. M., Lynch, D. F., & Nyaga, G. N. 2010."A Buyer's Perspective on
Collaborative Versus Transactional Relationships." Industrial Marketing
Management,39(3):507-518.
Wuyts, S.&Geyskens, I. (2005), ‘The formation of buyer-supplier relationships: Detailed
contract drafting and close partner selection’, Journal of Marketing,69(4), 103–
117.
Xiaojun, Z., Ping, Y., Jun, Y., & A. M. Spil, I. T. (2015).Using diffusion of innovation
theory to understand the factors impacting patient acceptanceand use of consumer
e-health innovations: a case study in a primary care clinic. BMC Health Services
Research, 15(1), 1-15.
Zacharia, Z. G., Nix, N. W., &Lusch, R. F.( 2011). “An Analysis of Supply Chain
Collaborations and their Effect on Performance Outcomes.” Journal of Business
Logistics,30(2):101-124.
Zailani, S.H.M., Eltayeb, T.K., Hsu, C.C., & Tan, K.C. (2012). The impact of
external institutional drivers and internal strategy on environmental performance,
International Journal of Operations & Production Management,32(6),
721-745.
Zikmund, W. G., Babin, B. J., Carr, J. C., & Griffin, M. (2013). Business

213
ResearchMethods. Mason : South-Western.
Zuo, Y., Kajikawa, Y., & Mori, J. (2016). Extraction of business relationships in supply
networks using statistical learning theory. Heliyon, 2, e00123.
Zuo, Yi & Kajikawa, Y. (2017). Toward a Theory of Industrial Supply Networks: A Multi-
Level Perspective via Network Analysis. Entropy, 19, 382.

214
APPENDICES
Appendix I: Questionnaire for Milk Suppliers to Dairy Processing Firms
Hello, I am a doctorate student at Jomo Kenyatta University of Agriculture and
Technology. I am carrying a field study on “Influence of Supply Chain Collaboration on
Performance of Dairy Processing Firms in kenya”. Any information you give is purely
for academic purpose and will be handled with utmost confidentiality. Your contribution,
participation and cooperation will be highly appreciated.
QUESTIONNAIRE
Section A: GENERAL INFORMATION
1. Gender: Male ( )
Female ( )
2. Indicate the entity you fall in the farmer category:
a) Large, Medium and small scale groups ( )
b) Large scale, small individual farmers ( )
3. Years you have supplied milk to dairy processing firms :
a) Less than One Year ( )
b) 1-5 Years ( )
c) More than 5 Years ( )

215
Section A: Effect of Supply chain information sharing on performance of dairy
processing firms
To what extent do you agree or disagree with the following statements regarding Supply
chain information sharing when used in enhancing performance of dairy processing
firms?
Please indicate your agreement or otherwise with the following statements using the
following scale of 1 – 5 where: -Strongly Disagree (SD) =1 Disagree (D) =2, Neutral (N)
=3, Agree (A) =4 and Strongly Agree (SA) =5.
No. Statement 1
SD
2
D
3
N
4
A
5
SA
1 The firm communicates to dairy farmers about it’s
demand
2 Effective and Information Technology is used to
communicate to dairy farmers
3 Dairy farmers are informed on any change of delivery
schedules effectively
4 Dairy farmers get to know early enough about price
changes
5 There is exchange visits both in and outside to share
information
6 Information about inventory levels is shared with dairy
farmers.
7 Information about product developments is always
shared with our milk suppliers/farmers
8 Information about of milk supply disruptions is always
communicated to farmers
9 Information about market conditions is always shared to
milk suppliers/farmers

216
Section B: Effect of Supply chain decision synchronization on performanceof dairy
processing firms
To what extent do you agree or disagree with the following statements regarding Supply
chain decision synchronization when used in enhancing firm’s performance?
Please indicate your agreement or otherwise with the following statements using the
following scale of 1 – 5 where: -Strongly Disagree (SD) =1 Disagree (D) =2, Neutral (N)
=3, Agree (A) =4 and Strongly Agree (SA) =5.
No. Statement 1
SD
2
D
3
N
4
A
5
SA
1 Fixing of milk prices are done as required
2 Weight disparities between dairy farmers and Dairy
Processing Firms are well resolved
3 Quality control measures are understood by dairy farmers
4 Extension services are offered to increase production of
milk
5 Extension services are offered to increase quality of milk
6 Demand for early milk deliveries is understood by the
dairy farmers
7 Dairy farmers receive record of their daily deliveries
8 Tenders offered to transporters, coolers are done as
required
9 Product inventory levels are understood by dairy farmers.
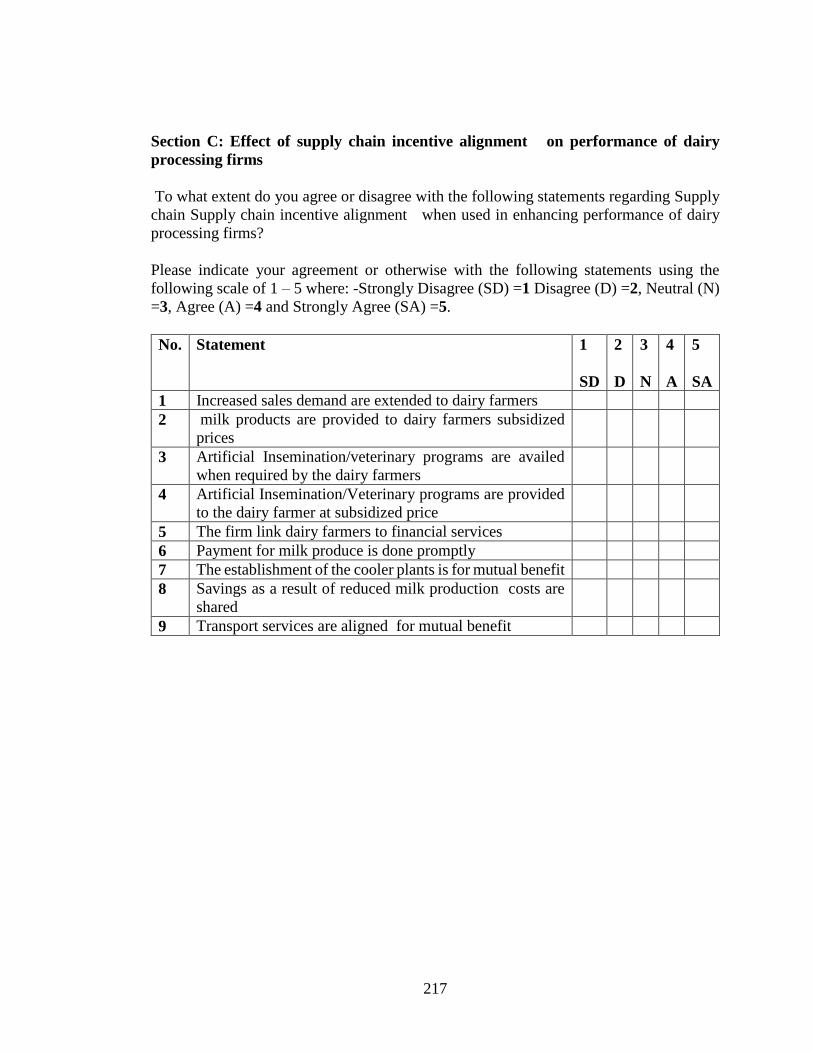
217
Section C: Effect of supply chain incentive alignment on performance of dairy
processing firms
To what extent do you agree or disagree with the following statements regarding Supply
chain Supply chain incentive alignment when used in enhancing performance of dairy
processing firms?
Please indicate your agreement or otherwise with the following statements using the
following scale of 1 – 5 where: -Strongly Disagree (SD) =1 Disagree (D) =2, Neutral (N)
=3, Agree (A) =4 and Strongly Agree (SA) =5.
No. Statement 1
SD
2
D
3
N
4
A
5
SA
1 Increased sales demand are extended to dairy farmers
2 milk products are provided to dairy farmers subsidized
prices
3 Artificial Insemination/veterinary programs are availed
when required by the dairy farmers
4 Artificial Insemination/Veterinary programs are provided
to the dairy farmer at subsidized price
5 The firm link dairy farmers to financial services
6 Payment for milk produce is done promptly
7 The establishment of the cooler plants is for mutual benefit
8 Savings as a result of reduced milk production costs are
shared
9 Transport services are aligned for mutual benefit

218
Section D: Effect of Supply chain teamworkon performance of dairy processing
firms
To what extent do you agree or disagree with the following statements regarding Supply
chain teamworkwhen used to enhance firm’s performance?
Please indicate your agreement or otherwise with the following statements using the
following scale of 1 – 5 where: -Strongly Disagree (SD) =1 Disagree (D) =2, Neutral (N)
=3, Agree (A) =4 and Strongly Agree (SA) =5.
No. Statement 1
SD
2
D
3
N
4
A
5
SA
1 The firm is committed to the growth of industry
2 The firm is committed to improving the services to milk
suppliers
3 There is joint effort to increase milk production
4 The firm enhances coordination through Supply chain
teamwork
5 All the parties along the chain plan together
6 There is cordial relationship between the firm and milk
suppliers
7 There is supply alliances with all the parties within the
chain
8 There is mutual trust between the firm and milk suppliers
9 There is the spirit of togetherness between the firm and
milk suppliers

219
Section E: Mediating Effect of Dairy Board on performance of dairy processing
firms
To what extent do you agree or disagree with the following statements regarding dairy
board when used to mediate the relationship between supply chain collaboration and
performance dairy processing firms?
Please indicate your agreement or otherwise with the following statements using the
following scale of 1 – 5 where: -Strongly Disagree (SD) =1 Disagree (D) =2, Neutral (N)
=3, Agree (A) =4 and Strongly Agree (SA) =5.
No. Statement 1
SD
2
D
3
N
4
A
5
SA
1 The dairy board Act influences the growth of industry
2 The dairy board organs improve the services of milk
suppliers
3 The dairy board delivers its mandate to increase milk
production
4 The dairy board guidelines enhances Supply chain
teamwork
5 The dairy board policies are in line to chain parties
performance
6 The dairy board regulates the prices of dairy produce
7 The dairy board improves the quality of milk produce
8 There is mutual trust between dairy board and milk
suppliers
9 The dairy board work in association with other
participants in milk chain to enhance efficiency in the
dairy industry

220
Section F: Dairy Processing Firm’s Performance
To what extent do you agree or disagree with the following statements regarding
performance of dairy processing firms?
Please indicate your agreement or otherwise with the following statements using the
following scale of 1 – 5 where: -Strongly Disagree (SD) =1 Disagree (D) =2, Neutral (N)
=3, Agree (A) =4 and Strongly Agree (SA) =5.
No. Statement 1
SD
2
D
3
N
4
A
5
SA
1 The firm focuses on existing milk suppliers for business
growth
2 The firm focuses on existing milk suppliers for business
expansion
3 The firm focuses on establishing itself in markets for
business growth and expansion
4 Outreach effort through the establishment of coolers has
led to business growth
5 The firm has served its milk suppliers according to various
market segments
6 The firm considers how products are manufactured by
extending their services to the dairy farmers
7 The firm considers how products are transported from
milk suppliers in respective localities
8 The company is aware about dairy farmers complaints and
responds on time
9 Dairy farmers are satisfied with the price paid to milk
produce
10 The market share of the firm is sizeable compared to other
processing firms
Recommendations: In your opinion, what do you recommend to be done in order to
enhance performance of dairy processing firms ? -----------------------------------------------
---------------------------------------------------------------------------------------------------

221
Appendix II: Questionnaire for Customers of Processed Products of Dairy
processing firms
Hello, I am a doctorate student at Jomo Kenyatta University of Agriculture and
Technology. I am carrying a field study on “Influence of Supply Chain Collaboration on
Performance of Dairy Processing Firms in kenya” Any information you give is purely for
academic purpose and will be handled with utmost confidentiality. Your contribution,
participation will be highly appreciated
QUESTIONNAIRE
Section A: GENERAL INFORMATION
1. Gender: Male( )
Female ( )
2. Indicate the brand of milk product:
a) Fresh UHT Milk ( )
b) Gold Crown Milk Whole ( )
c) Fresh Milk TFA ( )
d) Mala ( )
3. How often do you buy products of dairy processing firm?
a) Always ( )
b) Rarely ( )
c) For the First time ( )

222
Section A: Effect of Supply chain information sharing on performance of dairy
processing firms
To what extent do you agree or disagree with the following statements regarding Supply
chain information sharing when used in enhancing performanceDairy Processing Firms?
Please indicate your agreement or otherwise with the following statements using the
following scale of 1 – 5 where: -Strongly Disagree (SD) =1 Disagree (D) =2, Neutral (N)
=3, Agree (A) =4 and Strongly Agree (SA) =5.
No. Statement 1
SD
2
D
3
N
4
A
5
SA
1 Customers are informed on products introduced
2 Effective and Information Technology as a mode of
communication is used to inform customers on products
3 Milk products are conveniently delivered to customers
4 Customers get to know early enough about price changes
5 The company is aware about customer complaints and
respond on time
6 Customers are informed of the varied milk products
7 Customers are informed on the benefits of products
8 Customers know where to buy the firm’s products
9 Customers understand very well the products of dairy
processing firms

223
Section B: Effect of Supply chain decision synchronization on performance ofdairy
processing firms
To what extent do you agree or disagree with the following statements regarding Supply
chain decision synchronization when used in performance of dairy processing firms?
Please indicate your agreement or otherwise with the following statements using the
following scale of 1 – 5 where: -Strongly Disagree (SD) =1 Disagree (D) =2, Neutral (N)
=3, Agree (A) =4 and Strongly Agree (SA) =5.
No. Statement 1
SD
2
D
3
N
4
A
5
SA
1 Dairy processing firms Product prices are reasonable and
understood
2 Price variation between dairy processing firms products
and others are understood by customers
3 Quality of products are understood by customers
4 Promotion services are offered to increase demand
5 Promotion efforts are done according to customers’
demands
6 Dairy processing firms products offer solution to
customers
7 Firm’s products are introduced timely
8 Promotion of products are done rightfully in the retail
store
Section C: Effect of Supply chain incentive alignment on performance of dairy
processing firms
To what extent do you agree or disagree with the following statements regarding Supply
chain Supply chain incentive alignment when used in enhancingperformance dairy
processing firms?
Please indicate your agreement or otherwise with the following statements using the
following scale of 1 – 5 where: -Strongly Disagree (SD) =1 Disagree (D) =2, Neutral (N)
=3, Agree (A) =4 and Strongly Agree (SA) =5.
No. Statement 1
SD
2
D
3
N
4
A
5
SA
1 Sales demand are aligned to the customers’ requirements

224
2 milk product are accessed to customers
3 The firm pricing is demand driven
4 There is shared costs on high demand of products
5 The products prices are align to demand
6 Prices of the products are align to the quality
7 Promotion of the products are align to the contents of the
products
Section D: Effect of Supply chain teamworkon performance of dairy processing
firms
To what extent do you agree or disagree with the following statements regarding Supply
chain teamworkwhen used in enhancing performance of dairy processing firms ?
Please indicate your agreement or otherwise with the following statements using the
following scale of 1 – 5 where: -Strongly Disagree (SD) =1 Disagree (D) =2, Neutral (N)
=3, Agree (A) =4 and Strongly Agree (SA) =5.
No. Statement 1
SD
2
D
3
N
4
A
5
SA
1 The firm is committed to the needs of customers
2 The firm is committed to improving the quality of their
products
3 There is joint effort to increase market share
4 The firm enhances cooperation to deliver required
products
5 All the parties along the chain promote the products
6 There is cordial relationship between the firm and
customers
7 There is supply alliances with all the parties within the
chain
8 The firm has measures to ensure customers trust their
products
9 Through coordinated promotion the customers are
informed and retained

225
Section E: Mediating Effect of Dairy Board on performance of dairy processing
firms
To what extent do you agree or disagree with the following statements regarding dairy
board in enhancing performance of dairy processing firms?
Please indicate your agreement or otherwise with the following statements using the
following scale of 1 – 5 where: -Strongly Disagree (SD) =1 Disagree (D) =2, Neutral (N)
=3, Agree (A) =4 and Strongly Agree (SA) =5.
No. Statement 1
SD
2
D
3
N
4
A
5
SA
1 Dairy board influences customer satisfaction
2 The dairy board organs improve the services of customers
3 The dairy board embraces joint effort to increase milk
production
4 The dairy board guidelines enhances Supply chain
teamwork
5 The dairy board policies are in line to chain parties
performance
6 The dairy board regulates the prices of dairy products
7 The dairy board improves the quality of milk products
8 There is mutual trust between dairy board and milk
customers
9 The dairy board work in association with other
participants in milk chain to enhances customer
satisfaction
Section E: Milk Processing Firm’s Performance
To what extent do you agree or disagree with the following statements regarding
performance of dairy processing firms?
Please indicate your agreement or otherwise with the following statements using the
following scale of 1 – 5 where: -Strongly disagree=1 Disagree=2, Neither Agree nor
Disagree=3, Agree=4, and Strongly Agree=5.
Thefollowing itemsrelatetotopicalareasrelatedSupply Chain Collaboration on
Performance of Dairy Processing Firms.

226
No. Statement 1
SD
2
D
3
N
4
A
5
SA
1 The firm has improved on existing milk products
2 The firms products meets various market segments
3 The firm offers products that are highly reliable
4 The firm offers products that are of high quality
5 The firm offers a wide range of products to the market
compared to its competitors
6 The firm quickly responds to customer expectations
7 The firm quickly responds to customer complaints
8 Milk products are conveniently delivered to customers
9 The firm effectively promotes its products
10 Firms products are competitive compared to others
Recommendations:In your opinion, what do you recommend to be done in order to
enhance performance of dairy processing firms ?
-----------------------------------------------------------------------------------------------------------
-----------------------------------------------------------------------------------------------------------
-----------------------------------------------------------------------------------------------------------
----------------------------------------------------------------------------------

227
Appendix II: Interview for Supply Chain Practitioners of Dairy Processing Firms
Hello, I am a doctorate student at Jomo Kenyatta University of Agriculture and
Technology. I am carrying a field study on “Influence of Supply Chain Collaboration on
Performance of Dairy Processing Firms in kenya”. Any information you give is purely for
academic purpose and will be handled with utmost confidentiality. Your contribution,
participation and cooperation will be highly appreciated. Thefollowing
itemsrelatetotopicalareasrelatedto supply chain collaboration on performance ofdairy
processing firms. Pleaseprovideyourcandidviewswithrespectto each of the items
Section A: Effect of Supply chain information sharing on performance of dairy
processing firms
1a) How do you as a firm communicate to your supply chain partners
-----------------------------------------------------------------------------------------------------------
-----------------------------------------------------------------------------------------------------------
-----------------------------------------------------------------------------------------------------------
b) What information do you share with your supply chain partners?
-----------------------------------------------------------------------------------------------------------
-----------------------------------------------------------------------------------------------------------
-----------------------------------------------------------------------------------------------------------
c) How do you think will affect the performance of the firm?----------------------------------
-----------------------------------------------------------------------------------------------------------
----------------------------------------------------------------------------------------------------------
Section B: Effect of Supply chain decision synchronization on performance of dairy
processing firms
2 a)In what instances to you arrive at a join decision with your supply chain partners?----
----------------------------------------------------------------------------------------------------------
b) In what instances to you incorporate your supply chain partners in your planning?
-----------------------------------------------------------------------------------------------------------
-----------------------------------------------------------------------------------------------------------
------
c) In what instances to you make join resolution with your supply chain partners?

228
-----------------------------------------------------------------------------------------------------------
-----------------------------------------------------------------------------------------------------------
--
c) How do you think will affect the performance of the firm?----------------------------------
-----------------------------------------------------------------------------------------------------------
----------------------------------------------------------------------------------------------------------
Section C: Effect of Supply chain Supply chain incentive alignment on
performance of dairy processing firms
3a) In relation supply chain partners what incentive programs/ measures do you have?
-----------------------------------------------------------------------------------------------------------
-----------------------------------------------------------------------------------------------------------
--
b) How do you thick will the performance of dairy processing firms -------------------------
-----------------------------------------------------------------------------------------------------------
-----------------------------------------------------------------------------------------------------------
------
Section D: Effect of Supply chain teamworkon performance of dairy processing
firms
3a) In relation supply chain partners, what programs that you have in place that enhances
teamwork?
-----------------------------------------------------------------------------------------------------------
-----------------------------------------------------------------------------------------------------------
--
b) How do you think will affect the performance of dairy processing firms -----------------
-----------------------------------------------------------------------------------------------------------
-----------------
Section E: Mediating Effect of Dairy Board on performance of dairy processing
firms?
a) KDB is body mandated by the Government. What can you suggest to them as they
deliver their mandate?--------------------------------------------------------------------------------
-----------------------------------------------------------------------------------------------------------
-------------------------------------------------------------------------------------------

229
b) In your opinion what can you comment on the dairy board policies?
----------------------------------------------------------------------------------------------------------
-
c) In your opinion what can you comment on the dairy board regulatory?
-----------------------------------------------------------------------------------------------------------
-
In your opinion what can you comment on the dairy board policies?-------------------------
----------------------------------------------------------------------------------------------------------
In your opinion what can you comment on the dairy board mandate and guidelines?
-----------------------------------------------------------------------------------------------------------
---------------------------------------------------------------------------------------------------------
Section F: Performance of Dairy Processing Firms
a) Being one of the key managers of the firm, is the firm is making profits or losses
-------------------------- Justify your choice--------------------------------------------------
If your choice above is “profits” kindly mention approximately how much for the last
three years in Kenya shillings (You are requested to give figures from documentary
evidence).
2013------------------------------2014---------------------------------------------
2015------------------------------2016----------------------------------------------
b) Position your firm in terms of market share, are they the leaders or otherwise kindly
indicate the current position------------------------------------------------------------------------
c) What programmes do you have in place to expand your market share?
-----------------------------------------------------------------------------------------------------------
-----------------------------------------------------------------------------------------------------------
-----------------------------------------------------------------------------------------------------------
d) What programmes do you have in place to maintain and improve your profit
margins?------------------------------------------------------------------------------------------------
-------------------------------------------------------------------------------------------

230
e)Who are the key supply chains partners the firm collaborate with---------------------------
-----------------------------------------------------------------------------------------------------------
-----
Recommendations: In your opinion, what do you recommend to be done on Supply
Chain partners in order to enhance performance of dairy processing firms ?
-----------------------------------------------------------------------------------------------------------
-----------------------------------------------------------------------------------------------------------
-----------------------------------------------------------------------------------------------------------
-----------------------------------------------------------------------------------------------------------
-----------------------------------------------------
Thank you for your participation

231
Appendix III: List of Licensed DairyMilk Processors in Kenya
S/NO. LICENSEE ADDRESS COUNTY PRODUCTS
1 K.C.C Eldoret P. O. Box 609
Eldoret
UasinGishu Fresh Milk & Milk Powder
2 K.C.C- Kitale
Factory
Private Bag
Kitale
Trans-
Nzoia
Pasteurised Milk, Butter,
Ghee, Skim & Full Cream,
Powder Milk
3 K.C.C Sotik P. O. Box 191
Sotik
Bomet Fresh Milk,Mala, Milk
Shakes & UHT
4 K.C.C Nairobi P.O. Box
30131 Nairobi
Nairobi Fresh Milk, Mala, Yoghurt,
UHT, Ghee, Cream &
Butter
Source: The Kenya Dairy Board, 2014

232
Appendix IV: Dairy Supply Chain Collaborative Partners
Department Actors
Production Dairy Farmers
Transport Human/Vehicles
Bulking/Chilling Milk Sheds Coolers
Processing Dairy Processing Firms
Markets Supermarkets, Chain stores
Customers Consumers of processed milk products
Ch
ain

233
Appendix V: Top Ten Dairy Suppliers’ for Second Quarter 2015
Average kgs Suppliers
Mois-bridge
209793 4600
Koitogos
59200 350
Naitiri
39733 3150
Taito
51500 250
Mbuthia
44100 320
Ndalu
38666 268
Dairy farm of Cheranganyi
34177 600
North Highlands Dairy
26603 400
Meevoot Society
30010 300
Chepkoilel
26453 250
TOTAL
86,7835 10,488
Source: KCC Food Safety Manual, (2016)
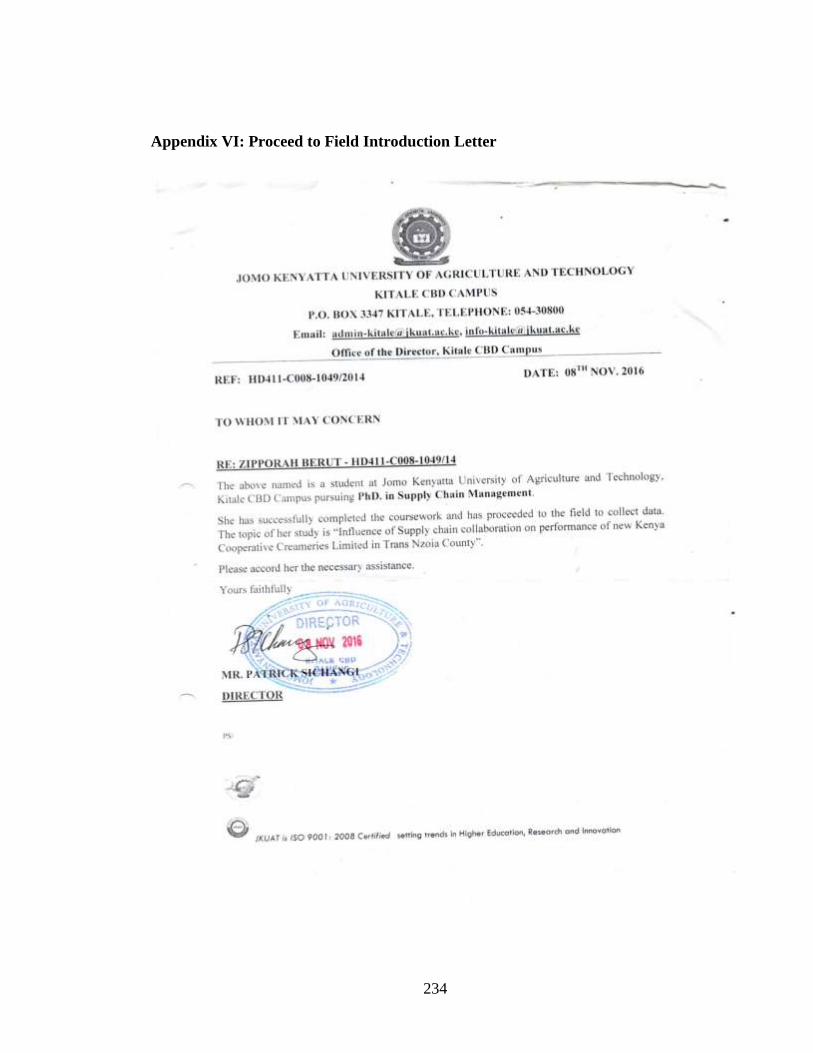
234
Appendix VI: Proceed to Field Introduction Letter

235
Appendix VII: Approval of Research Proposal and Supervisors
Source: JKUAT, BPS (2017)

236
Appendix IX: Approval of Intent to Submit PhD Thesis
Source: JKUAT, BPS (2019)


![03 Supply Chain Technology and Collaboration[1]](https://img.pdfslide.us/doc/110x75/577d20171a28ab4e1e91f71a/03-supply-chain-technology-and-collaboration1.jpg)