Embed Size (px)
Citation preview
Published in Ocean Engineering 197 2020 106838
1
Influence of scour depth and type on p–y curves for monopiles in sand under monotonic lateral 1
loading in a geotechnical centrifuge 2
Chortis, G.a,1, Askarinejad, A.a,2, Prendergast, L.J.b,3*, Li, Q.a,4, Gavin, K.a,5 3
a Faculty of Civil Engineering and Geosciences, 4 Delft University of Technology, 5
Building 23, 6 Stevinweg 1 / PO-box 5048, 7 2628 CN Delft / 2600 GA Delft, 8 The Netherlands 9 10 b Department of Civil Engineering, 11 Faculty of Engineering, 12
University of Nottingham, 13 Nottingham, 14 NG7 2RD, 15 United Kingdom 16
17
*Corresponding author 18
Email: [email protected], [email protected], 19
[email protected], [email protected], [email protected] 20
21
Abstract 22
The influence of scour on the lateral response of monopile foundations for offshore wind turbines is 23
investigated in this paper. Application of lateral load-displacement (p-y) curves to predict the lateral 24
pile behaviour is subject to uncertainty as many of the presently used design approaches have been 25
derived for long, slender piles. These piles, with typical length/diameter ratios (L/D) of greater than 10 26
behave differently compared to rigid monopiles, with L/D typically less than 6. In this paper, centrifuge 27
tests are conducted on a monopile model under various scour scenarios and p-y curves are derived 28
from strain gauges embedded along the model pile wall. Global scour and two different shapes for 29
local scour holes are studied. Using the piecewise polynomial method for extraction of p-y curves from 30
sparsely distributed strain measurements, it is recommended to use a 4th order polynomial for the 31
moment profile to extract soil reaction and a 7th order polynomial for the moment profile to calculate 32
pile deflection. Results indicate that the pile behaviour is significantly influenced by the nature (size, 33

Published in Ocean Engineering 197 2020 106838
2
shape) of the scour holes affecting the pile–soil system and suggest that the p-y curves should be 34
appropriately modified to account for this behaviour. 35
Keywords: Offshore monopiles; p-y curves; Centrifuge modelling; Scour 36
37
1 Introduction 38
Renewable energy is gaining traction worldwide as technologies improve and political pressure to 39
reduce fossil fuel usage mounts. Offshore wind turbines in particular are becoming significantly more 40
commonplace in Northern and Western Europe. Monopiles are the preferred foundation solution for 41
offshore wind due to ease of fabrication and installation offshore (Byrne et al., 2018). The share of 42
turbines founded on monopiles increased from 75% of offshore turbines in 2012 (Doherty and Gavin, 43
2012) to 87% in 2018 (Wind Europe, 2017). Monopiles are particularly adept at resisting lateral loads 44
and moments induced by wind, waves and currents, and are also efficient at transferring super-45
structural dead loads to the foundation soil. 46
It is well-understood that cylindrical structures founded in soil and subjected to hydraulic actions can 47
lead to local scour hole formation (Sørensen and Ibsen, 2013; Prendergast et al., 2015). In fact, many 48
types of foundations including pile groups and caissons located in deep waters can be adversely 49
affected by scour development (Liang et al., 2019). The magnitude of scour depth that can develop 50
under given flow conditions is an area of ongoing research, and the DNV design code suggests a value 51
of 1.3 times the pile diameter (1.3D) be considered in design for both ultimate (ULS) and serviceability 52
limit states (SLS), respectively (Det Norske Veritas, 2007) for monopiles. It should be noted that this 53
design specification is for the case of current-only induced scour erosion. The combined actions of 54
waves, currents and tides in the marine environment leads to a significantly more complex time-55
varying scour interaction process (Negro et al., 2014; Qi and Gao, 2014). Combining this with the 56
natural process of seabed migration, the overall scour regime affecting a particular wind farm can be 57
very difficult to predict. Difficulties in estimating the scour depth is exacerbated by variabilities 58

Published in Ocean Engineering 197 2020 106838
3
between empirical formulae developed for scour depth calculation as investigated by previous 59
researchers (Matutano et al., 2013). 60
The formation of scour essentially increases the free cantilevered length of a monopile and 61
simultaneously reduces the strength and the stiffness of the soil around the pile due to the lower 62
remaining overburden pressures, potentially compromising the stability of the monopile (Hoffmans 63
and Verheij 1997; Sumer and Fredsøe 2012). Several researchers have previously investigated the 64
effect of scour formation on the lateral response characteristics of piles (Li et al., 2018; Prendergast et 65
al., 2013). Reese et al. (1989) presented an overview of the scour formation process in cohesive soils, 66
focusing on the gap created at the soil-pile interface due to water injection induced by the cyclic 67
loading. They concluded that this gap increases with the number of cycles, leading to a considerable 68
decrease in lateral capacity. Bennett et al. (2009) investigated how scour influenced the response of 69
pile groups supporting Kansas Bridge, and showed that the total lateral capacity was significantly 70
reduced by the scour formation. The bending moment and deflection profiles along the piles were 71
significantly altered before and after scouring. Kishore et al. (2009) performed small-scale laboratory 72
tests at 1g on PVC and aluminium piles in marine clay with and without scour, under monotonic and 73
cyclic loading. They concluded that the formation of scour led to considerably larger bending moments 74
and pile deflections under a given load. Furthermore, they report a reduction in the ultimate lateral 75
capacity, especially when cyclic loads were applied. Similar trends were observed by Li et al. (2009), 76
who focused on bridge piers in order to study the sensitive scour range, in which the soil-pile system’s 77
mechanical properties are highly affected. Liang et al. (2018) investigated the influence of vertical 78
loads on lateral responses of piles under scour in marine clay, where the effects of soil stress history 79
and scour hole geometry were taken into consideration. An analytical model based on the principle of 80
minimum potential energy was developed. The study concludes that scour depth plays the most 81
significant role (among various scour hole dimensions – depth, width and side slope angle) influencing 82
the responses of piles under combined vertical and lateral loading. Mostafa (2012) performed 83
Published in Ocean Engineering 197 2020 106838
4
numerical studies of the effects of scour on piles in both sandy and clayey soils for different scour hole 84
geometries. They concluded that the influence of scour is more significant in sands than in clays and 85
that global scour has a larger influence than local scour. Li et al. (2013) investigated the behavior of 86
laterally loaded single piles in clay subjected to scour using numerical methods. They studied the 87
influence of scour hole geometry, and showed that the depth of the scour hole has a larger influence 88
than its width. 89
The lateral response of a monopile can be modelled using 1D finite-element approaches based on a 90
beam on a nonlinear Winkler foundation (Kampitsis et al., 2013; Yankelevsky et al., 1989). A beam 91
model is used to simulate the pile behaviour and discrete, nonlinear lateral springs distributed along 92
the length of the beam can be used to model the nonlinear lateral soil behaviour. The load-displacement 93
behaviour of these springs can be characterised by p-y curves, which correlate the soil pressure p at a 94
given point along the pile to the lateral pile deflection y. Several p-y formulations exist for a range of 95
soil types and these approaches offer designers a means for rapid assessment of lateral pile behaviour 96
with the ease of accounting for soil layering. Several researchers (Matlock 1970; Reese et al. 1974; 97
Reese et al. 1975; Reese and Welch 1975; O’Neill and Murchinson 1983) have developed formulations 98
for p-y curves, however the majority of these were derived from load tests performed on piles with 99
large length to diameter (L/D) ratios that are relatively flexible when compared to the rigid piles used 100
in the offshore wind sector. Because of their deflected shape, rigid monopiles develop additional 101
components of resistance (Byrne et al., 2019) that are not considered by the commonly adopted 102
hyperbolic sand model, as formulated in the API design code (API, 2007) for flexible piles. 103
In addition to the ongoing uncertainty with p-y approaches commonly adopted in design, the effect of 104
scour on the p-y characteristics is not fully understood. Some previous studies such as Lin et al. (2010) 105
have investigated this by performing numerical analyses. Due to the inability of p-y curves to account 106
for the 3D geometry of a scour hole, Lin et al. (2010) developed a simplified p-y method based on a 107
wedge-type failure, which produced results close to the ones of finite element numerical investigations. 108

Published in Ocean Engineering 197 2020 106838
5
The conclusion drawn by their research is that the scour depth is the most crucial factor in diminishing 109
the soil lateral capacity as opposed to the width and the angle of the scour hole. In addition, they 110
compared models where all the soil was removed up to a given scour depth (global scour) with ones 111
where only a wedge of soil was eroded (local scour). The result was an extremely large reduction in 112
the lateral soil capacity for the global case, which was about 50% lower than the equivalent capacity 113
in the local scour case. Qi et al. (2016) performed centrifuge tests on flexible piles subjected to scour. 114
They stated the importance of the scour hole geometry, especially due to the different overburden 115
pressure developed between global (complete removal) and local scour. In the global scour tests, the 116
derived p-y curves at the same distance from the new mudline were practically the same, regardless of 117
the scour depth. However, in the local scour cases the overburden pressure led to stiffer responses in 118
the scour-extracted p-y curves compared to the global cases for the same equivalent depth. They 119
proposed an effective soil depth that would take into account both scour geometry and overburden 120
pressures. It should be noted though that the piles used in the centrifuge tests had a slenderness ratio 121
(L/D) of 11.4 and 35, meaning that they behave as slender piles, very different from the short rigid 122
piles used in wind farms, which typically have a L/D of approximately 5. 123
In this paper, the effect of scour hole type and shape on the derived p-y curves of a rigid monopile is 124
investigated through centrifuge testing. Tests are conducted in dry sand conditions for different scour 125
profiles, and the p-y curves are derived from embedded strain gauges along the model pile under 126
monotonic lateral loading. Two shapes for local scour holes are adopted to investigate the influence of 127
overburden pressure. These are termed narrow and wide in this study, which refer to the base width of 128
the scour hole. The research highlights some important characteristics of scour on measured p-y curves 129
and also provides some insight into the inefficiencies of p-y approaches for modelling rigid monopiles. 130
131
132
Published in Ocean Engineering 197 2020 106838
6
2 Experimental set-up 133
2.1 Physical model 134
In this study, experiments were performed at an enhanced acceleration field of 100 times the Earth’s 135
gravity (100g) using the geotechnical centrifuge at TU Delft (Allersma, 1994). The gravity is limited 136
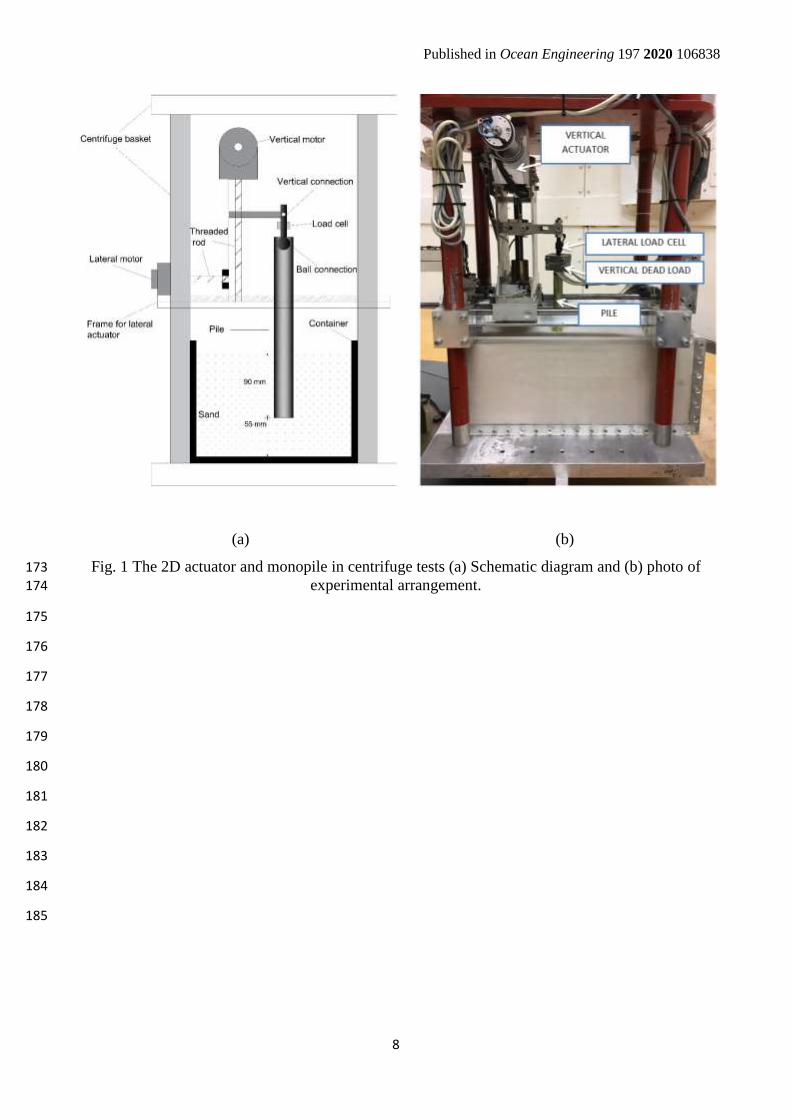
to a maximum of 100g to prevent issues with the data-logging system. Fig. 1 shows a schematic and 137
photo of the experimental arrangement. The dimensions of the model pile are chosen so as to model a 138
monopile used for offshore wind, which typically have L/D < 6 (Doherty and Gavin, 2012; Prendergast 139
et al., 2015; Sørensen and Ibsen, 2013; LeBlanc et al., 2010). The wall thickness of the model pile is 140
selected based on the similitude between the flexural rigidity (EI) of the prototype (p) and the model 141
(m), see Eq. (1). 142
(EI)p = (EI)mN4 (1) 143
where E is the Young’s modulus of the pile material, I is the second moment of area of the cross section 144
of the monopile, and N is the geometrical scaling factor, which is 100 in the analysis in this paper. The 145
minimum pile wall thickness (t min) according to (API, 2007) is shown in Eq. (2) 146
tmin (mm) = 6.35 + D/100 (2) 147
From Eq. (2), the thickness of the prototype pile wall should be larger than 24.35 mm. Assuming a 148
steel (E = 210 GPa) prototype pile with a wall thickness of 30 mm, the flexural stiffness will be (EI)p 149
= 13.7 GN m2. Therefore, the flexural stiffness of the model pile should be N4 times smaller, i.e. (EI)m 150
= 0.137 kN m2. The model pile is fabricated from aluminium with Young’s modulus of 70 GPa, 151
therefore, the thickness of the model pile is required to be ~ 1mm. The adopted model pile dimensions 152
simulate a rigid, open-ended monopile with an outer diameter of 1.8 m, a wall thickness of 0.03 m, 153
embedment length of 9 m and bending stiffness (EI) of 13.7 GN m2 at prototype scale. It should be 154
noted that the prototype dimensions are smaller than typically observed for offshore monopiles (typical 155
diameters 3-6m). However, previous research (Byrne et al., 2015) has shown that it is the L/D, rather 156

Published in Ocean Engineering 197 2020 106838
7
than the pile diameter, that controls the response of piles, so it is more important to maintain a similar 157
L/D for comparison to full-scale monopiles. The reason for adopting the smaller diameter in the present 158
case is to avoid issues with model boundary conditions, as discussed in section 2.2, and due to the 159
limiting gravitational acceleration that can safely be used. 160
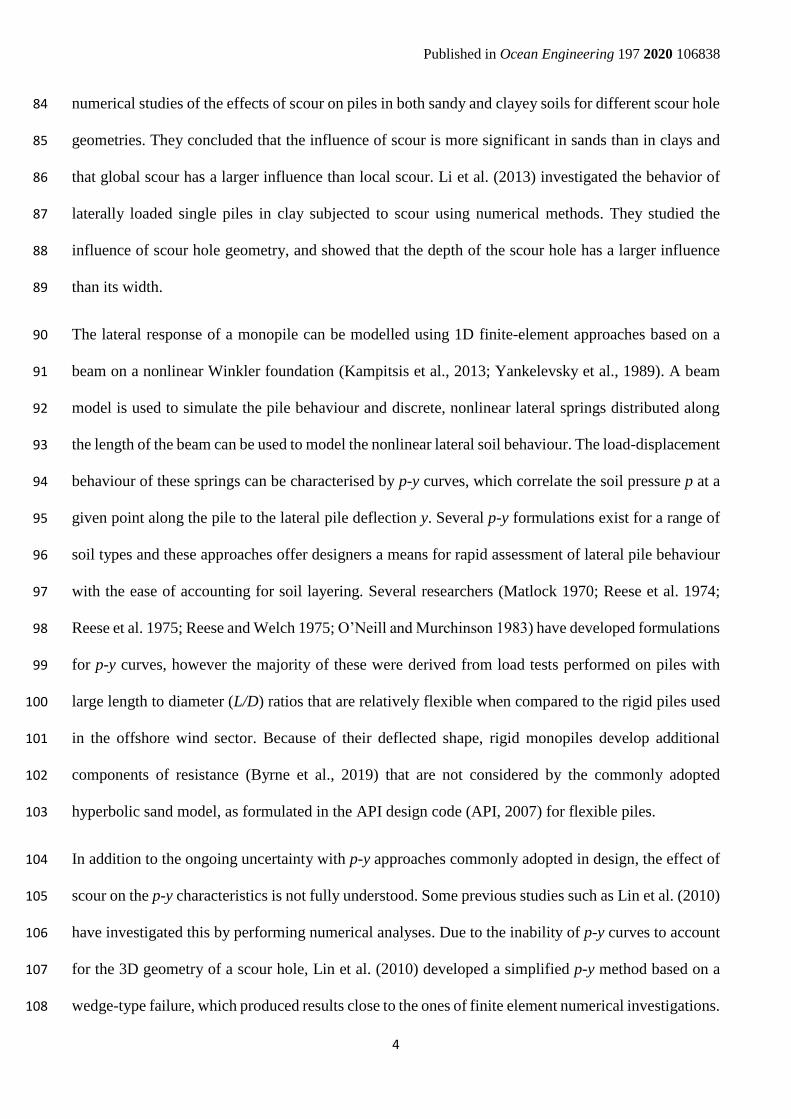
Ten pairs of strain gauges are installed along the pile shaft from which the bending moment profile for 161
a given applied load can be derived. These strain gauges are spaced evenly along the embedded length 162
of the pile, see Fig. 2. The gauges are covered with a sealing layer to protect the sensors during testing. 163
This protective layer creates a rough interface between the pile and the sand. It should be noted that 164
only 7 of the 10 installed gauges may be monitored at a given time in each test, due to limitations in 165
the number of measurement channels on the data acquisition system. As a result, in each scour case 166
tested in this paper, the data from the most appropriate gauges are logged. For example, in the case 167
where there is no scour, the top most 7 gauge pairs are used as these are the most crucial for producing 168
the p-y curves in this case. For the case where a scour hole of 2 pile diameters (2D) is implemented, 169
the gauges closest to the original soil surface (i.e. above the scour hole) are omitted, since these are 170
now located above the new soil surface and as such provide no information on the soil reaction for 171
deriving p-y curves. 172
Published in Ocean Engineering 197 2020 106838
8
(a) (b)
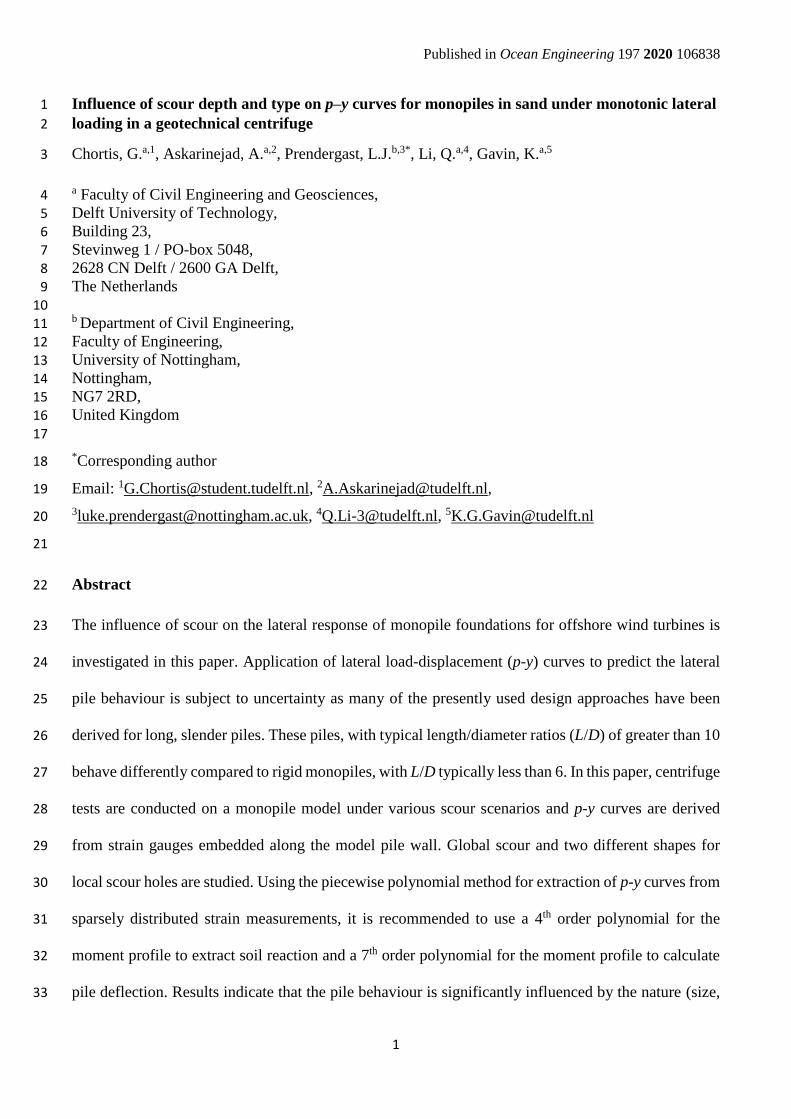
Fig. 1 The 2D actuator and monopile in centrifuge tests (a) Schematic diagram and (b) photo of 173
experimental arrangement. 174
175
176
177
178
179
180
181
182
183
184
185

Published in Ocean Engineering 197 2020 106838
9
186
187
Fig. 2 Schematic of model pile with instrumentation. (left) position of strain gauges and (right) strain 188
gauges used for each scour depth 189
2.2 Soil characteristics and model preparation 190
The sand used in the centrifuge tests is a uniform fine sand with an average grain size (D50) of 0.11 191
mm, which results in a pile diameter to average particle size ratio (D/D50) of approximately 160. This 192
is higher than 60, the value suggested by Remaud (1999) for centrifuge testing of piles subjected to 193
lateral loading. The geotechnical characteristics of the sand are summarised in Table 1. All samples 194
have a relative density (Dr) of 80% and are prepared using an air pluviation technique. This technique 195
is carefully controlled to generate a sample with the required relative density so as to ensure 196
consistency between testing. Prior to each test, the sand is placed in a rectangular strong box with 197
dimensions 430 ×150 × 180 mm3 to a height of 145 mm. The dimensions of the strong box are such so 198
as to minimise potential boundary effects from influencing the results. The ratio of the smallest 199
dimension of the box to the model pile diameter (B/D) is 8.3, which is larger than 4 as suggested by 200
Prakasha et al. (2005). The height of the sand is such so as to provide a clearance of more than 3D 201
between the pile tip and the base of the box, which is sufficiently large to minimise boundary effects 202

Published in Ocean Engineering 197 2020 106838
10
(Prakasha et al., 2005). The model piles are installed in the sand by jacking in place at 1g in the centre 203
of the strong box prior to each test. 204
205
Table 1 Geotechnical properties of the sand used in the experiments (De Jager et al., 2017). 206
Property Value
Soil Classification Based on USCSa SP (Poorly Graded Sand)
Median Particle Size, D50 (mm) 0.11
Curvature Coefficient, CC 1.24
Uniformity Coefficient, CU 1.55
Specific Gravity, GS 2.67
Maximum Void Ratio, emax 1.07
Minimum Void Ratio, emin 0.64
Internal Friction Angle, φ 34° a Unified Soil Classification System (USCS) (ASTM, 2017). 207
208
2.3 Local and global scour holes 209
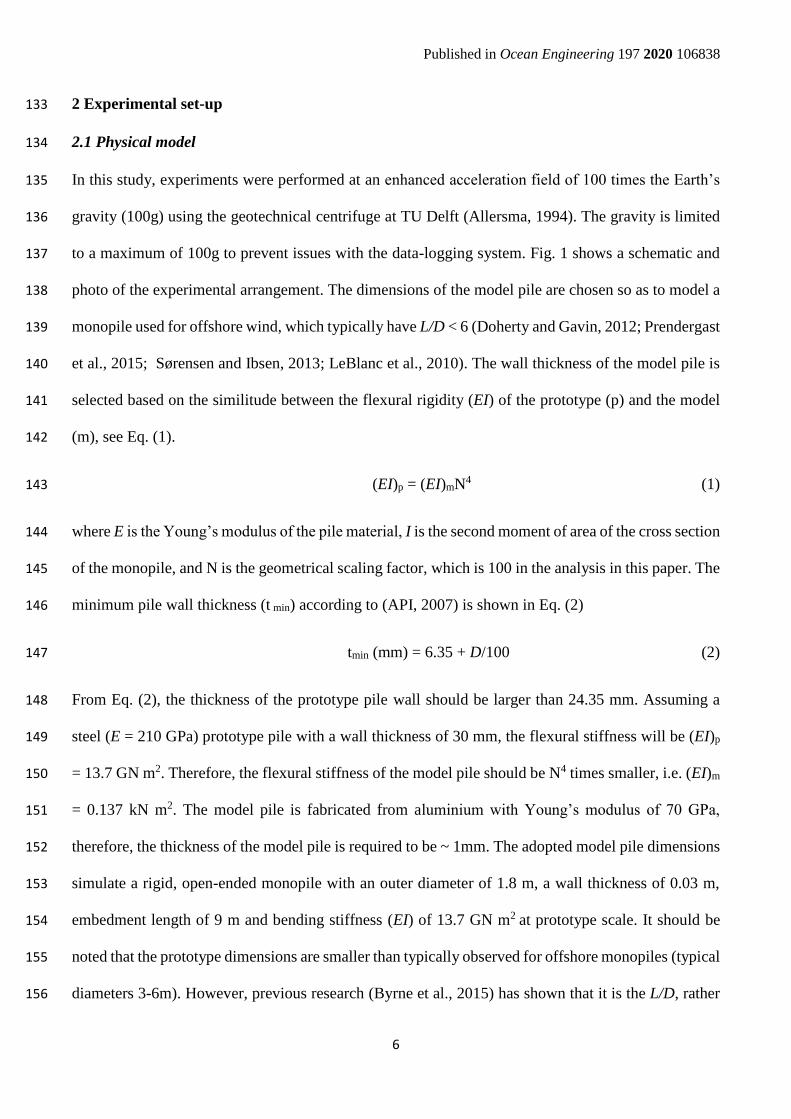
For the piles tested in this paper, the influence of three different scour hole shapes (global scour and 210
two types of local scour) on the lateral pile behaviour are investigated. Global scour is modelled as the 211
complete removal of a soil layer in the sample, as shown schematically in Fig. 3. This phenomenon 212
can occur as a global action around a whole wind farm site or due to natural seabed migration over a 213
wide area. Local scour is modelled by forming an inverted-circular frustum around the pile as would 214
occur due to changing water-flow characteristics in the direct vicinity of a pile. For local scour, the 215
influence of scour hole shape is investigated by varying the distance from the pile wall to the base of 216
the side slope of the scour hole. This distance, termed Wb (see Fig. 3), is varied between 0 and D from 217
the pile. The scour hole with base width Wb = 0 is termed narrow scour while the scour hole with base 218
width Wb = D is termed wide scour in subsequent analyses. The choice of 0 and 1D for local narrow 219
and local wide scour is informed from previous studies, which have shown that the behaviour of piles 220
subjected to scour holes with bottom widths larger than 1D tend towards the behaviour of piles affected 221

Published in Ocean Engineering 197 2020 106838
11
by global scour (Li et al., 2013). In all local scour holes, a side slope angle of α=30° is adopted, in 222
accordance with Refs. (Hoffmans and Verheij 1997; Roulund et al. 2005). 223
To maintain the shape of each modelled scour hole as precisely as possible, rigid plates were fabricated 224
from aluminium with the required geometry for each scour shape. These plates, with varying depths 225
of 1D, 1.5D and 2D (1.8m, 2.7m and 3.6m at prototype scale) had varying base widths of D (narrow 226
scour) and 3D (wide scour). These plates were used to check the dimensions of scour holes after the 227
sand is removed to ensure consistency. To implement global scour, the whole soil layer from the 228
surface to the required depth was removed after sample preparation. Each scour hole was created prior 229
to installation of the model pile at 1g and just before accelerating the centrifuge up to 100g. The 230
programme of testing is presented in section 2.4. 231
232
Fig. 3 Schematic showing scour hole shape in centrifuge test 233
234
2.4 Testing programme 235
The testing programme comprises ten tests; one monotonic load test with no scour formation and nine 236
monotonic load tests with three different scour types and three scour depths. The test programme is 237
summarised in Table 2. For each test, the lateral load is applied 1 m below the pile head. The horizontal 238
Published in Ocean Engineering 197 2020 106838
12
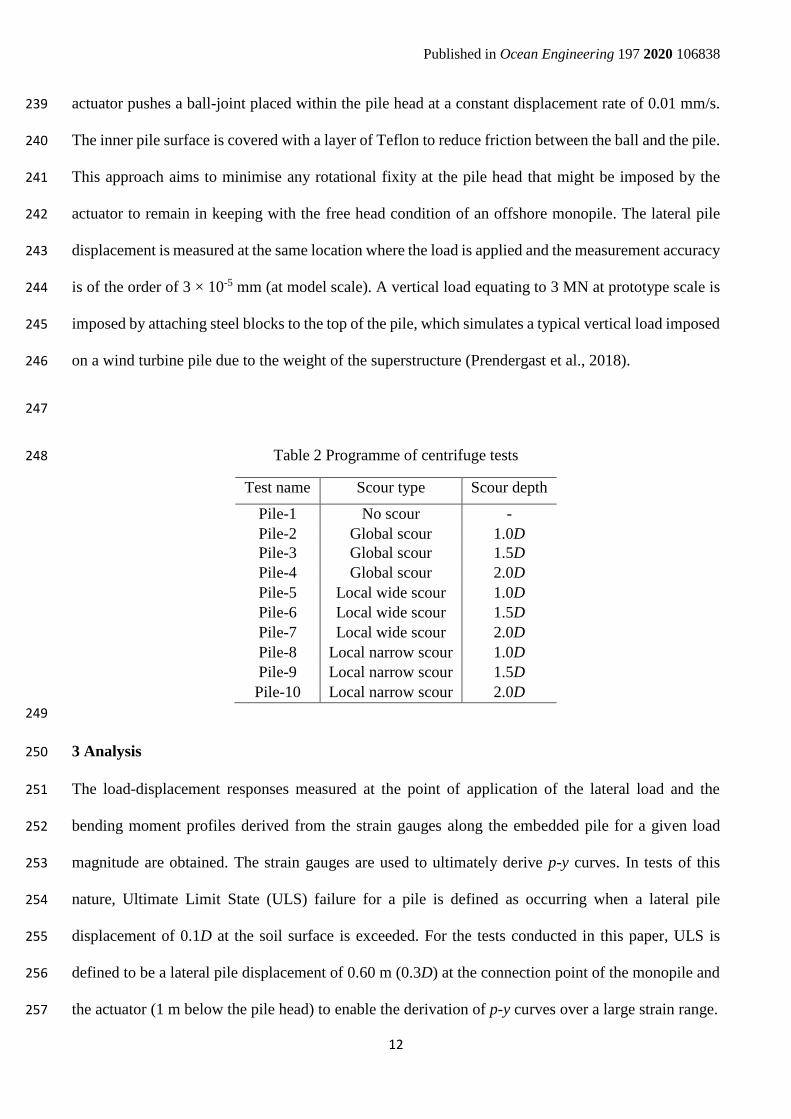
actuator pushes a ball-joint placed within the pile head at a constant displacement rate of 0.01 mm/s. 239
The inner pile surface is covered with a layer of Teflon to reduce friction between the ball and the pile. 240
This approach aims to minimise any rotational fixity at the pile head that might be imposed by the 241
actuator to remain in keeping with the free head condition of an offshore monopile. The lateral pile 242
displacement is measured at the same location where the load is applied and the measurement accuracy 243
is of the order of 3 × 10⁻⁵ mm (at model scale). A vertical load equating to 3 MN at prototype scale is 244
imposed by attaching steel blocks to the top of the pile, which simulates a typical vertical load imposed 245
on a wind turbine pile due to the weight of the superstructure (Prendergast et al., 2018). 246
247
Table 2 Programme of centrifuge tests 248
Test name Scour type Scour depth
Pile-1 No scour -
Pile-2 Global scour 1.0D
Pile-3 Global scour 1.5D
Pile-4 Global scour 2.0D
Pile-5 Local wide scour 1.0D
Pile-6 Local wide scour 1.5D
Pile-7 Local wide scour 2.0D
Pile-8 Local narrow scour 1.0D
Pile-9 Local narrow scour 1.5D
Pile-10 Local narrow scour 2.0D
249
3 Analysis 250
The load-displacement responses measured at the point of application of the lateral load and the 251
bending moment profiles derived from the strain gauges along the embedded pile for a given load 252
magnitude are obtained. The strain gauges are used to ultimately derive p-y curves. In tests of this 253
nature, Ultimate Limit State (ULS) failure for a pile is defined as occurring when a lateral pile 254
displacement of 0.1D at the soil surface is exceeded. For the tests conducted in this paper, ULS is 255
defined to be a lateral pile displacement of 0.60 m (0.3D) at the connection point of the monopile and 256
the actuator (1 m below the pile head) to enable the derivation of p-y curves over a large strain range. 257

Published in Ocean Engineering 197 2020 106838
13
3.1 Load-displacement curves and bending moments along the pile 258
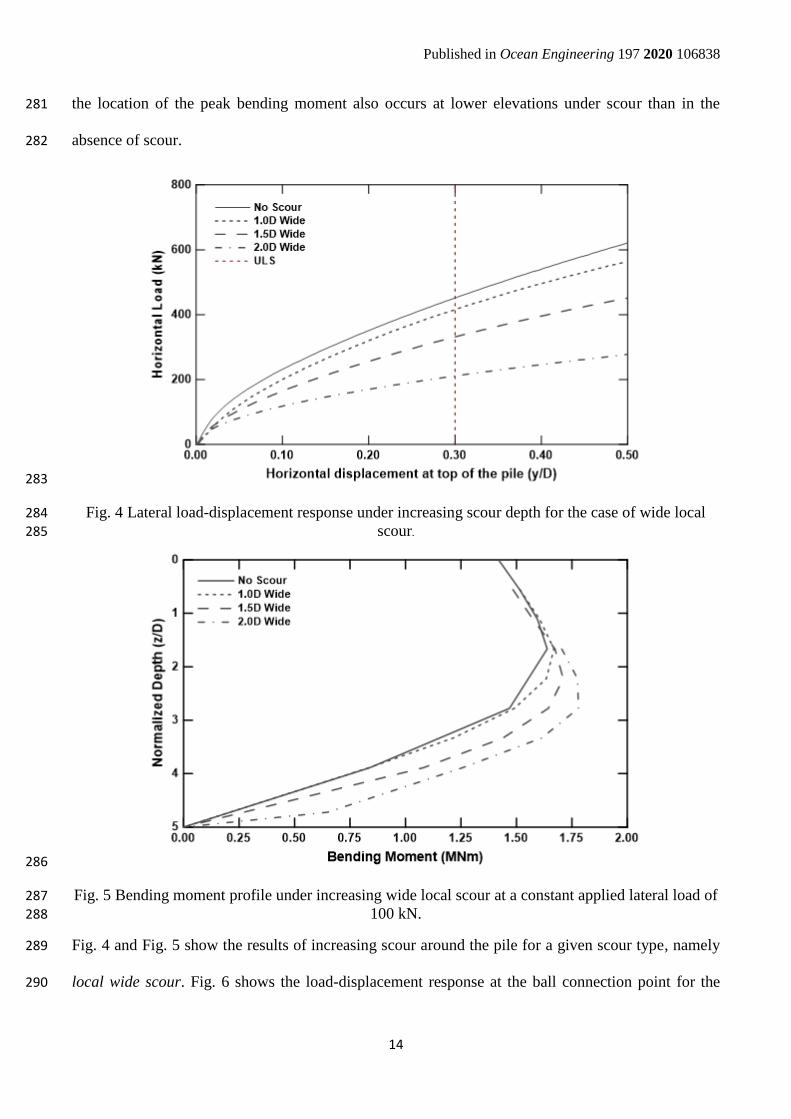
The load-displacement behaviour, at the level of the ball connection point, under different scour depths 259
is shown in Fig. 4. For this analysis, the results of the local wide scour cases are shown (see Table 2 260
and Fig. 3). The increase in the depth of scour around the pile decreases the available soil capacity 261
resulting in lower lateral resistance for a given displacement. At ULS (0.3D at the connection point in 262
this case), the reduction in mobilized soil resistance is evident, whereby the unscoured resistance is 263
approximately 400 kN and the resistance at 2D scour is 50% of this value, at approximately 200 kN. 264
The lateral soil resistance is governed both by the length of the embedded pile and the effective stress 265
level in the soil surrounding the pile. Increasing the scour depth has the dual effect of decreasing the 266
embedded length of the pile as well as reducing the effective stress in the remaining soil, resulting in 267
lower resistance under applied loading. 268
Under a given applied load, the strains measured along the pile shaft can be used to derive the bending 269
moment profile. Bending moments are derived from bending strain measurements using Eq. (3). 270
zEIzM
(3) 271
where E is the Young’s modulus of the pile material (N/m2), I is the cross-sectional moment of inertia 272
of the pile (m4) and ρ(z) is the curvature at a given applied load, obtained as the ratio between the 273
difference in measured compressive and tensile strains to the gauge lever arm (pile radius) at a given 274
depth z. Fig. 5 shows the pile bending moment profiles under an applied load of 100 kN for zero scour 275
and three depths of local wide scour. The bending moments at various points along the pile are lower 276
in the no scour case compared to the cases with scour around the monopile. This observation implies 277
that the pile structure encounters higher stresses in the case of scour. This mechanism can be attributed 278
to the reduced pile embedment under scour, and the resulting reduction in soil-pile contact area, which 279
requires higher stresses to develop in order for equilibrium to be achieved in the system. Moreover, 280
Published in Ocean Engineering 197 2020 106838
14
the location of the peak bending moment also occurs at lower elevations under scour than in the 281
absence of scour. 282
283
Fig. 4 Lateral load-displacement response under increasing scour depth for the case of wide local 284
scour. 285
286
Fig. 5 Bending moment profile under increasing wide local scour at a constant applied lateral load of 287
100 kN. 288
Fig. 4 and Fig. 5 show the results of increasing scour around the pile for a given scour type, namely 289
local wide scour. Fig. 6 shows the load-displacement response at the ball connection point for the 290

Published in Ocean Engineering 197 2020 106838
15
maximum scour condition (2D) for all three scour types, local narrow, local wide and global scour. 291
The data show that the different scour types result in differences in the load-displacement behavior. 292
Relative to the no scour case, the pile response becomes progressively weaker under local narrow, 293
local wide and global scour, at the same scour depth magnitude of 2D. This result suggests a sensitivity 294
to the differences in the overburden pressures around the pile for each scour case. The local scour cases 295
offer higher overburden pressures in the remaining soil than global scour (due to the fact that only a 296
frustum-shaped volume of soil is removed and not the entire soil layer), leading to higher lateral soil 297
resistance. Of note is that local narrow and local wide scour also exhibit this sensitivity to differences 298
in the overburden between these two scour hole shapes, implying that the shape of a scour hole should 299
be considered more closely. 300
Fig. 7 presents the bending moment profiles for an applied lateral load of 100 kN for the three scour 301
types, at a scour depth of 2D. Relative to the no scour condition, the narrow scour type is the most 302
favorable in the terms of soil resistance, while the global and the local wide scour are the most critical 303
cases. The distinction between the latter two cases is not really clear, as the moment profiles have been 304
extracted for a lateral load of 100 kN (a load below ULS). However, at this load magnitude, the 305
displacement of the pile is relatively small, as can be seen by the load-displacement curves in Fig. 6, 306
leading to minor differences in the bending moment profiles. However, for larger displacements, the 307
local wide scour deviates away from the global case and provides intermediate results between the 308
narrow and global case. It is noteworthy that the response under local wide scour will depend highly 309
on the length of Wb, as this parameter defines whether the behavior is closer to local narrow scour or 310
global scour. 311

Published in Ocean Engineering 197 2020 106838
16
312
Fig. 6 Lateral load-displacement response under different scour types at constant depth 313
314
Fig. 7 Bending moment profile under different scour types at a constant horizontal load of 100 kN. 315
316
3.2 Effect of scour on derived p-y curves 317
3.2.1 Deriving p-y curves from experimental measurements 318
Soil reaction-lateral displacement (p-y) curves at various points along a pile can be derived from a 319
bending moment distribution along the pile, which can be obtained from strain gauges. A bending 320
moment profile derived using strain gauges is discrete in the sense that one obtains values for the 321
Published in Ocean Engineering 197 2020 106838
17
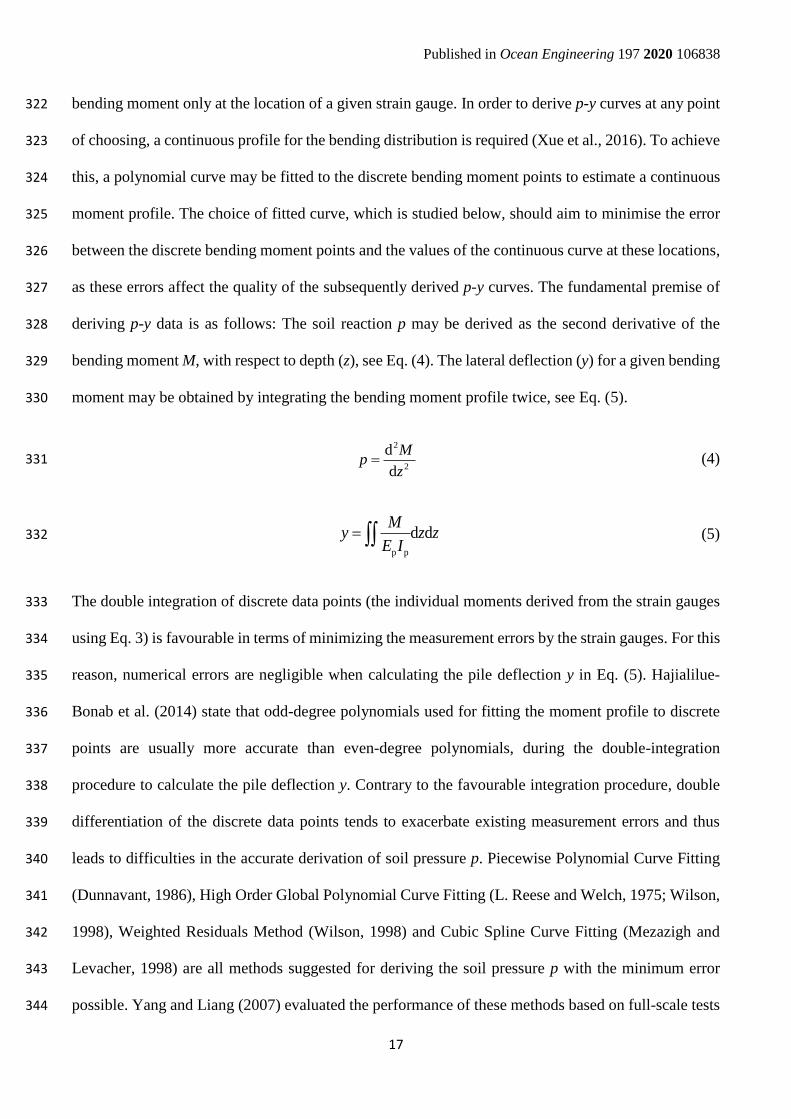
bending moment only at the location of a given strain gauge. In order to derive p-y curves at any point 322
of choosing, a continuous profile for the bending distribution is required (Xue et al., 2016). To achieve 323
this, a polynomial curve may be fitted to the discrete bending moment points to estimate a continuous 324
moment profile. The choice of fitted curve, which is studied below, should aim to minimise the error 325
between the discrete bending moment points and the values of the continuous curve at these locations, 326
as these errors affect the quality of the subsequently derived p-y curves. The fundamental premise of 327
deriving p-y data is as follows: The soil reaction p may be derived as the second derivative of the 328
bending moment M, with respect to depth (z), see Eq. (4). The lateral deflection (y) for a given bending 329
moment may be obtained by integrating the bending moment profile twice, see Eq. (5). 330
2
2
d
d
Mp
z (4) 331
p p
d dM
y z zE I
(5) 332
The double integration of discrete data points (the individual moments derived from the strain gauges 333
using Eq. 3) is favourable in terms of minimizing the measurement errors by the strain gauges. For this 334
reason, numerical errors are negligible when calculating the pile deflection y in Eq. (5). Hajialilue-335
Bonab et al. (2014) state that odd-degree polynomials used for fitting the moment profile to discrete 336
points are usually more accurate than even-degree polynomials, during the double-integration 337
procedure to calculate the pile deflection y. Contrary to the favourable integration procedure, double 338
differentiation of the discrete data points tends to exacerbate existing measurement errors and thus 339
leads to difficulties in the accurate derivation of soil pressure p. Piecewise Polynomial Curve Fitting 340
(Dunnavant, 1986), High Order Global Polynomial Curve Fitting (L. Reese and Welch, 1975; Wilson, 341
1998), Weighted Residuals Method (Wilson, 1998) and Cubic Spline Curve Fitting (Mezazigh and 342
Levacher, 1998) are all methods suggested for deriving the soil pressure p with the minimum error 343
possible. Yang and Liang (2007) evaluated the performance of these methods based on full-scale tests 344
Published in Ocean Engineering 197 2020 106838
18
where they compared the curves derived by measurements to ones generated by 1D software 345
applications such as COM624P (Wang and Reese, 1991) or its commercial version L-Pile (ENSOFT 346
INC, 2018). They concluded that the piecewise polynomial approach was the most accurate method, 347
especially for relatively sparse strain measurements, which is the case in the present study. 348
The piecewise polynomial curve-fitting method (Yang and Liang, 2007) was adopted for the 349
calculation of soil pressure p in this paper. A minor modification was adopted in the present case, 350
namely that a fourth-order polynomial was used instead of a third-order one that was suggested by 351
Dunnavant (1986) & Yang and Liang (2007). This choice was determined by the sparse distribution 352
of the gauges near the bottom of the pile. Specifically, if a third-order polynomial is differentiated 353
twice, it produces a linear expression for the soil pressure distribution. This procedure can be effective 354
only if the gauges are densely spaced, as the consecutive linear expressions and hence the linear soil 355
pressure distribution are applied only to small parts of the pile, and therefore in total the actual curved 356
shape of the soil pressure distribution can be captured. In this series of tests however, the gauges are 357
not spaced with sufficient density, especially near the bottom of the pile, meaning that a linear 358
expression would be applied over too large a portion of the pile length. On the contrary, a fourth-order 359
polynomial differentiated twice produces a second-order equation, which can simulate a non-linear 360
pressure distribution. This detail proved to be important in capturing a more accurate pressure response, 361
at the top and the bottom of the pile, from trials undertaken in this study. Note also that the odd-degree 362
polynomials are considered to be more accurate for the extraction of the pile deflection (Hajialilue-363
Bonab et al., 2014), but the same claim is not made in the literature for the extraction of soil pressure. 364
The approach adopted in the present paper is described as follows: An n-degree polynomial is fitted to 365
five successive moment data points, derived from the strain gauge data, using a least-squares approach. 366
This polynomial expression is then differentiated twice to derive the soil response p, evaluated at the 367
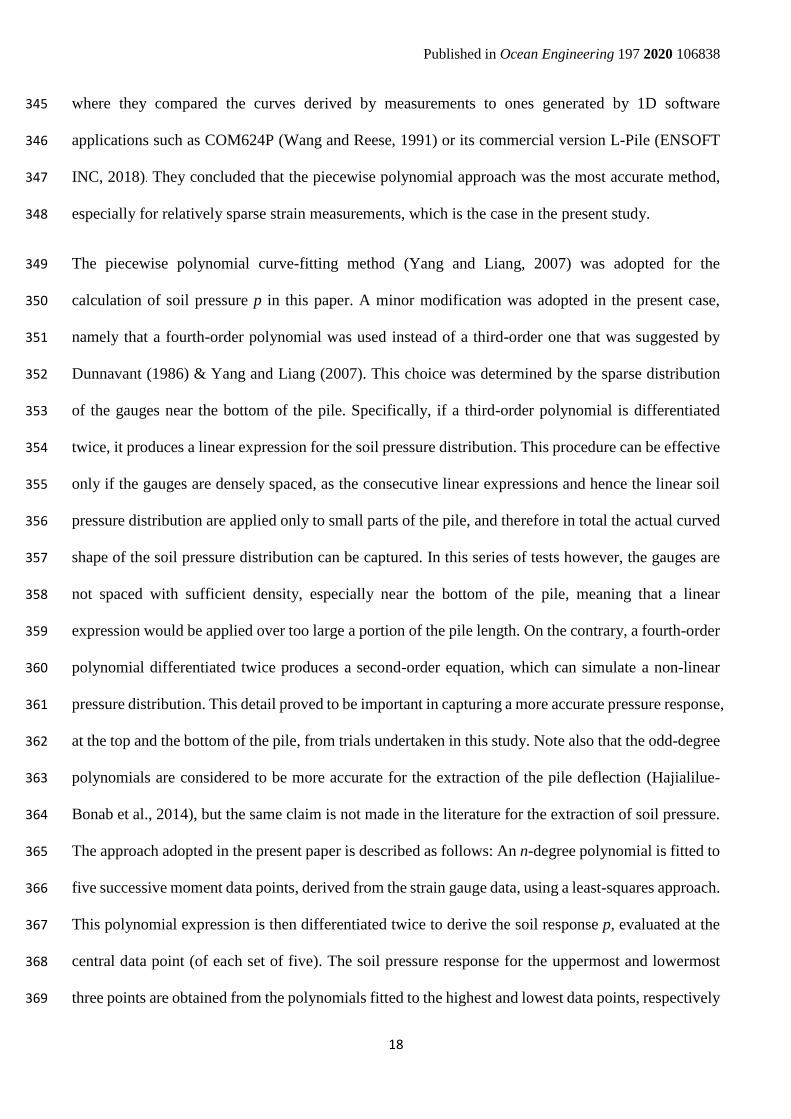
central data point (of each set of five). The soil pressure response for the uppermost and lowermost 368
three points are obtained from the polynomials fitted to the highest and lowest data points, respectively 369
Published in Ocean Engineering 197 2020 106838
19
(Fig. 8, left). For this reason, a third order polynomial when differentiated twice gives a straight line 370
at the top and at the bottom of the pile (unless there are many strain gauges). In this study, a fourth-371
order polynomial proved to be more suitable for the upper and lower part of the pile, as discussed 372
above. 373
374
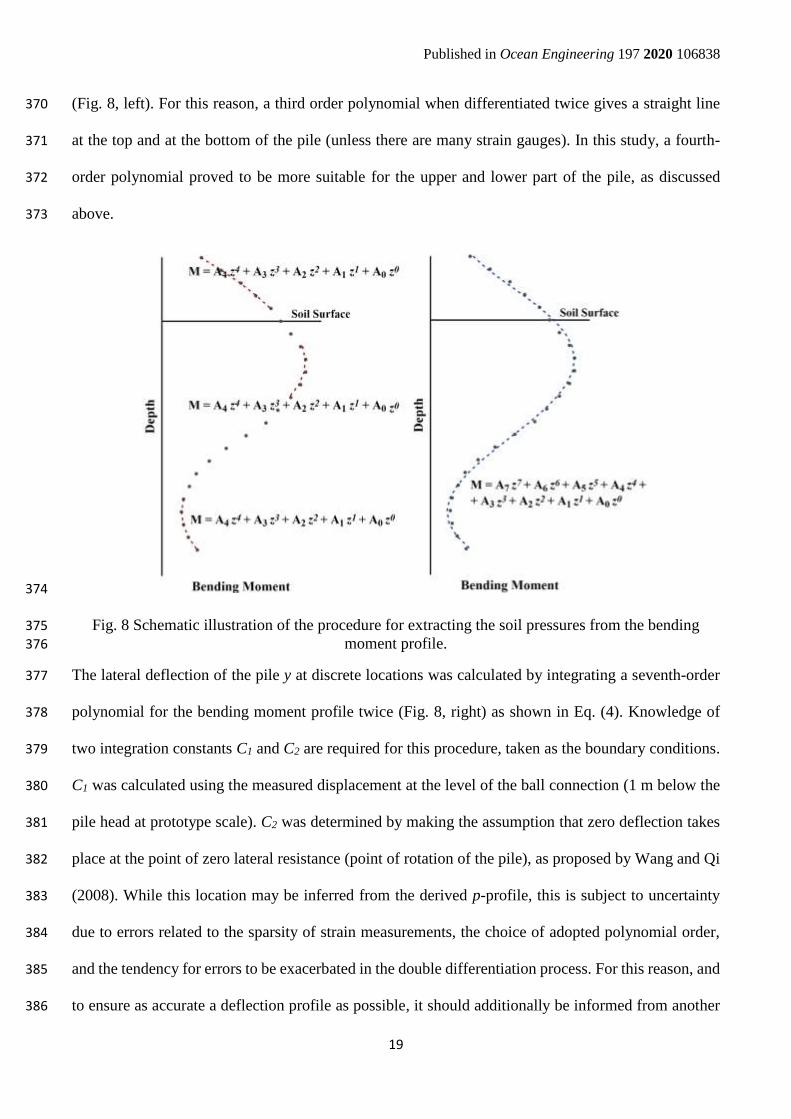
Fig. 8 Schematic illustration of the procedure for extracting the soil pressures from the bending 375
moment profile. 376
The lateral deflection of the pile y at discrete locations was calculated by integrating a seventh-order 377
polynomial for the bending moment profile twice (Fig. 8, right) as shown in Eq. (4). Knowledge of 378
two integration constants C1 and C2 are required for this procedure, taken as the boundary conditions. 379
C1 was calculated using the measured displacement at the level of the ball connection (1 m below the 380
pile head at prototype scale). C2 was determined by making the assumption that zero deflection takes 381
place at the point of zero lateral resistance (point of rotation of the pile), as proposed by Wang and Qi 382
(2008). While this location may be inferred from the derived p-profile, this is subject to uncertainty 383
due to errors related to the sparsity of strain measurements, the choice of adopted polynomial order, 384
and the tendency for errors to be exacerbated in the double differentiation process. For this reason, and 385
to ensure as accurate a deflection profile as possible, it should additionally be informed from another 386
Published in Ocean Engineering 197 2020 106838
20
source. For the analysis in this paper, a numerical model of the test arrangement was created to inform 387
on this second required boundary condition. The Finite Element (FE) software PLAXIS (Brinkgreve 388
et al., 2016) was used to develop a model of the pile for this purpose, and is described herein. 389
A 3D FE model of the test pile at prototype scale was developed, see Fig. 9. The purpose of conducting 390
these analyses was to make a scientifically informed assumption for the depth of the rotation point 391
(zero soil pressure nominally) to be used as the second integration constant in the p-y derivation 392
procedure. The geometry of the model is the same as that of the prototype of the centrifuge tests. Due 393
to the scale of the strong box, boundary effects may be present in the analyses so effort was made to 394
ensure the same boundary effects were implemented in the numerical model. A vertical dead load of 395
3 MN was simulated using a distributed load at the pile top. A Hypoplastic constitutive model for the 396
soil was adopted (Niemunis and Herle, 1997; von Wolffersdorff, 1996) and the soil parameters were 397
calibrated based on element tests. The implemented parameters for the von Wolffersdorf (von 398
Wolffersdorff, 1996) model with the addition of the intergranular strain concept (Niemunis and Herle, 399
1997) are presented in Table 3. A series of FE simulations were undertaken for cases where no scour 400
affects the pile and where scour equating to the three depths and types from the centrifuge testing were 401
considered. In each simulation, the pile was subjected to a prescribed displacement (at the same 402
displacement magnitudes as in the centrifuge tests at prototype scale) at its top, which corresponded 403
to the level of the ball connection in the centrifuge set-up. The deflection of the pile along its length 404
was measured under these varying lateral displacements. From these simulations, the rotation point 405
was shown to occur at a depth of approximately 70% of the current embedded pile length and remained 406
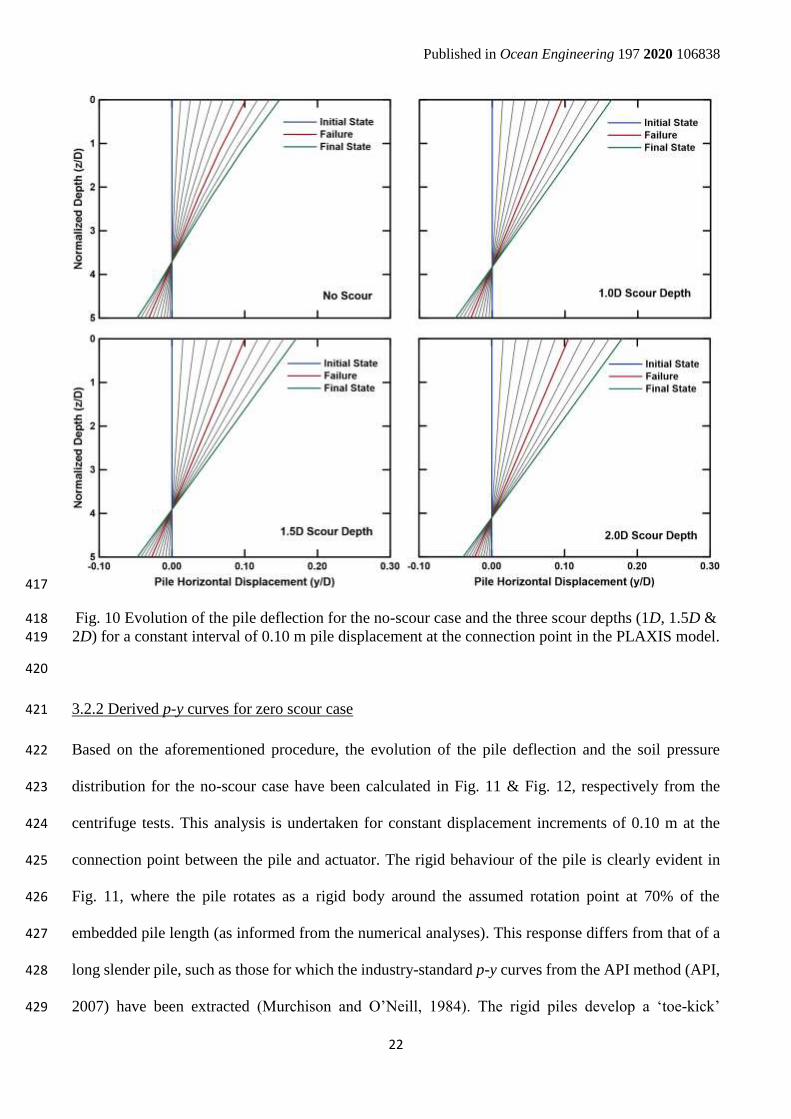
constant for each scour case, independent of the magnitude of the lateral displacement. In Fig. 10 a 407
characteristic set of the aforementioned analyses is shown, for the no-scour case and for three different 408
scour depths (1D, 1.5D & 2D) of the local wide scour case, where the ratio of rotation point depth to 409
the new embedded pile length (after scour) is approximately 0.7. This location is used as the second 410

Published in Ocean Engineering 197 2020 106838
21
‘known’ boundary condition for the lateral displacement derivation. Note also as an aside that the rigid 411
behavior of the pile is clearly illustrated in the graphs of Fig. 10. 412
Table 3 Hypoplastic model parameters after the calibration of the PLAXIS 3D model 413
von Wolffersdorff’s hypoplastic model parameters
φc hs n ed0 ec0 ei0 α β
34 4200MPa 0.15 0.640 1.070 1.280 0.07 0.75
Intergranular Strain Concept
mR mT Rmax βr χ
6.9 5.0 0.0001 0.3 1.0
414
415
Fig. 9 PLAXIS model that simulates the centrifuge test for a typical wide scour case. 416
Published in Ocean Engineering 197 2020 106838
22
417
Fig. 10 Evolution of the pile deflection for the no-scour case and the three scour depths (1D, 1.5D & 418
2D) for a constant interval of 0.10 m pile displacement at the connection point in the PLAXIS model. 419
420
3.2.2 Derived p-y curves for zero scour case 421
Based on the aforementioned procedure, the evolution of the pile deflection and the soil pressure 422
distribution for the no-scour case have been calculated in Fig. 11 & Fig. 12, respectively from the 423
centrifuge tests. This analysis is undertaken for constant displacement increments of 0.10 m at the 424
connection point between the pile and actuator. The rigid behaviour of the pile is clearly evident in 425
Fig. 11, where the pile rotates as a rigid body around the assumed rotation point at 70% of the 426
embedded pile length (as informed from the numerical analyses). This response differs from that of a 427
long slender pile, such as those for which the industry-standard p-y curves from the API method (API, 428
2007) have been extracted (Murchison and O’Neill, 1984). The rigid piles develop a ‘toe-kick’ 429

Published in Ocean Engineering 197 2020 106838
23
(Achmus, 2010) at the pile toe, which mobilises high soil resistance. In Fig. 12, high soil pressures are 430
observed close to the pile toe. Fig. 12 also exhibits some soil pressure in the region of the point of 431
rotation, where these should be zero. This error occurs as there are few strain gauges below the rotation 432
point, which leads to inevitable errors in the fitted data for the moment profile. Moreover, the double-433
differentiation procedure to derive soil pressure from the bending moment profile exacerbates 434
measurement errors, as previously discussed. This could be improved with the use of a higher density 435
of strain gauges, to provide more continuous strain profiles and thus mitigate issues related to curve-436
fitting of the moment profile. For the case in the present study, the limitation is due to the available 437
hardware. In both Figs. 11 and 12, ULS refers to the displacement of 0.3D at 1m below the pile head 438
(ball connection level) as previously defined. 439
440
Fig. 11 Evolution of the pile deflection for the no scour case 441

Published in Ocean Engineering 197 2020 106838
24
442
443
Fig. 12 Evolution of the soil pressures for the no scour case 444
Using the data in Fig. 11 & Fig. 12, the p-y curves for the no-scour case have been extracted as shown 445
in Fig. 13. For comparison, the p-y curves have also been constructed using the API method (API, 446
2007) in Fig. 13. The sign of the soil reaction is defined by the single rotation point (see Fig. 11), i.e. 447
whether the soil on the right-hand or left-hand side of the pile is providing the resistance at a given 448
depth. The initial stiffness of the soil increases with depth, as observed by the increasing angle of the 449
initial portion of the derived p-y curves. The soil resistance increases with depth, since for a given 450
displacement, the equivalent (absolute) soil pressure is largest for the case z/D=3.90, with the z/D=2.78, 451
1.67, 1.10 & 0.55 decreasing accordingly. Note the length of a given p-y curve is limited by the 452
displacement of the pile at that location, which explains the shorter curves at z/D=2.78 and 3.90 (nearer 453
assumed rotation point). The increase of the soil capacity with depth indicates that in order to reach 454
equilibrium, the rotation point must be closer to the tip of the pile, as observed in Fig. 11 & Fig. 12. 455
Above the rotation point, the largest soil resistance occurs at a depth z/D = 1.67, which is also the 456
location of the highest bending moment. Relative to the p-y curves derived in this paper, the API 457
approach overestimates the soil resistance. Moreover, the API initial stiffness is high and the ultimate 458

Published in Ocean Engineering 197 2020 106838
25
resistance is in some cases more than twice that measured from the centrifuge test data. This difference 459
between the API and the derived curves is most likely attributable to the rigidity of the test pile, as the 460
API method is more applicable to long, slender piles. Note also, a slender pile tends to have little to 461
no pile tip deflection whereas a rigid pile can have significant deflection at this location. 462
463
464
Fig. 13 p-y curves for the no scour case for various depths 465
3.2.3 Effect of scour on the characteristics of the p-y curves 466
The effect of scour depth and type on the characteristics of the derived p-y curves is investigated in 467
this section. p-y curves for the piles subjected to different scour types (local narrow, local wide, and 468
global) are derived for three different scour depths; namely 1D, 1.5D, and 2D in Fig. 14, Fig. 15 & 469
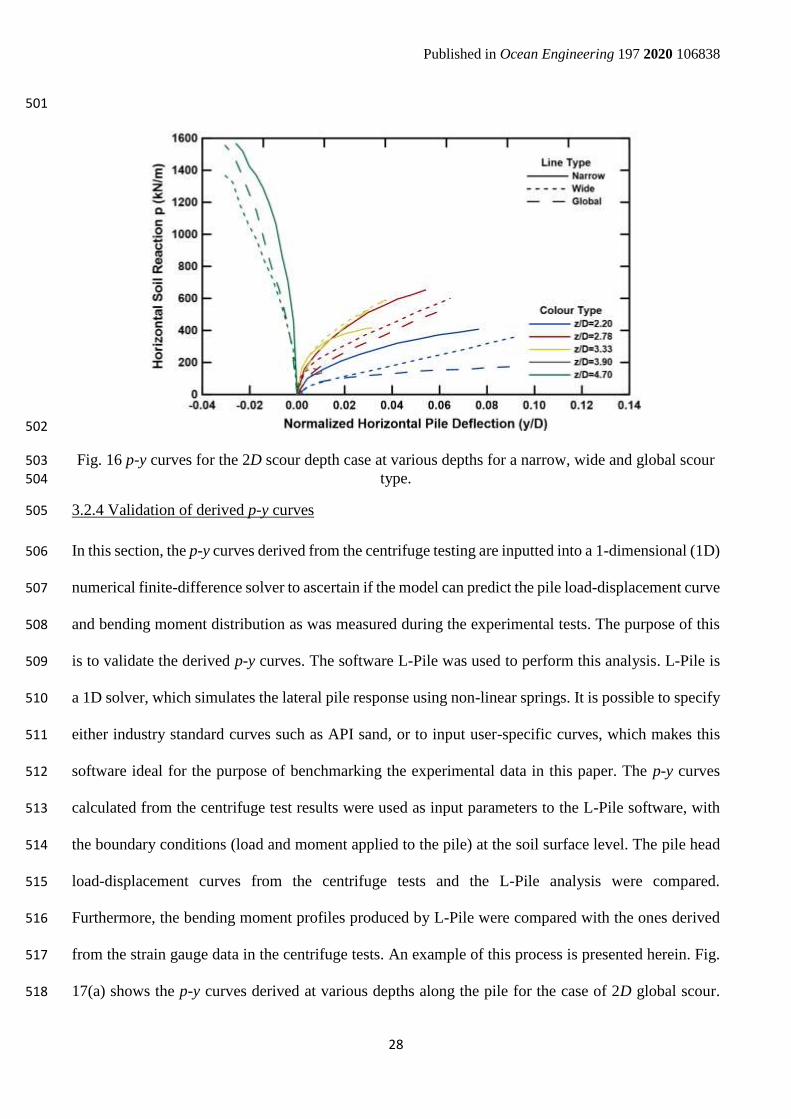
Fig. 16, respectively. In each graph, the p-y curves are illustrated for the same scour depth, for all three 470
scour types. Note, the curves at normalized depths z=1.67D, z=2.2D, z=2.78D, z=3.33D occur above 471
the pile rotation point, while the curve z=4.7D occurs below it. The curve at z=3.9D is close to the 472
rotation point, hence limited data is available due to the small lateral deformations at this point. For 473
each plot, only certain curves are produced due to the limited number of strain gauges available in each 474

Published in Ocean Engineering 197 2020 106838
26
case (only 7 of the 10 gauges may be logged simultaneously on the system). In Fig.14 and 15, the 475
curve at z/D=4.7 is omitted and in Fig. 16, the curve at z/D=1.67 is omitted. 476
The results in each plot show that the p-y curves at shallower depths (z=1.67D, z=2.2D) are 477
considerably affected by the scour type. At z=1.67D in Figs. 14 and 15, the response of the local narrow 478
scour case is stiffer than those of the local wide and global scour cases, as the overburden pressure is 479
almost the same as the no scour case, Fig. 13 (only a small frustum of soil has been removed around 480
the pile for the local narrow scour scenario). At larger depths, while still above the rotation point in all 481
plots (z=2.78D, z=3.33D) the p-y curves for all three scour types begin to converge, implying that the 482
effect of scour type is not so important at larger depths. Some small differences still exist between 483
these curves, as in Fig. 14 for the depth of z=3.33D, which may be attributable to experimental error 484
in the calculation of the p-y curves as different tests were conducted in each case. Observing the curves 485
at z=4.7D (below the rotation point) in Fig. 16 a very stiff response occurs. 486
The conclusion that may be drawn by Fig. 14, Fig. 15 & Fig. 16 is that the scour type highly affects 487
the p-y curves at the shallower depths, while as the depth becomes larger this effect becomes less 488
severe. The geometry of the local scour hole, whether wide or narrow in these experiments, influences 489
the p-y curves, leading to a ≈ 20% reduction in ultimate resistance for the local wide scour case 490
compared to the local narrow case. Moreover, the p-y curves for the global scour cases, in the shallow 491
depths can be smaller in a range of 20% up to even 40% from the ones of the local scour cases. 492

Published in Ocean Engineering 197 2020 106838
27
493
494
Fig. 14 p-y curves for the 1D scour depth case at various depths for a narrow, wide and global scour 495
type. 496
497
498
Fig. 15 p-y curves for the 1.5D scour depth case at various depths for a narrow, wide and global 499
scour type. 500
Published in Ocean Engineering 197 2020 106838
28
501
502
Fig. 16 p-y curves for the 2D scour depth case at various depths for a narrow, wide and global scour 503
type. 504
3.2.4 Validation of derived p-y curves 505
In this section, the p-y curves derived from the centrifuge testing are inputted into a 1-dimensional (1D) 506
numerical finite-difference solver to ascertain if the model can predict the pile load-displacement curve 507
and bending moment distribution as was measured during the experimental tests. The purpose of this 508
is to validate the derived p-y curves. The software L-Pile was used to perform this analysis. L-Pile is 509
a 1D solver, which simulates the lateral pile response using non-linear springs. It is possible to specify 510
either industry standard curves such as API sand, or to input user-specific curves, which makes this 511
software ideal for the purpose of benchmarking the experimental data in this paper. The p-y curves 512
calculated from the centrifuge test results were used as input parameters to the L-Pile software, with 513
the boundary conditions (load and moment applied to the pile) at the soil surface level. The pile head 514
load-displacement curves from the centrifuge tests and the L-Pile analysis were compared. 515
Furthermore, the bending moment profiles produced by L-Pile were compared with the ones derived 516
from the strain gauge data in the centrifuge tests. An example of this process is presented herein. Fig. 517
17(a) shows the p-y curves derived at various depths along the pile for the case of 2D global scour. 518
Published in Ocean Engineering 197 2020 106838
29
These p-y curves are inputted into L-Pile, and the equivalent bending moment distribution was 519
calculated under three lateral loads (50, 100, 150 kN). These bending moment profiles produced by L-520
Pile were then compared with the bending moments derived from the strain gauge measurements for 521
the same lateral loads for the 2D global scour case. A scour case with a depth of 2D has been chosen 522
for this comparison because of the availability of strain gauge measurements below the rotation point. 523
In the upper part of the pile (around 50% of the embedded pile length) there is close agreement between 524
the L-Pile results and the experimental data, indicating that the derived p-y curves are correctly 525
calculated from the data. However, at the bottom of the pile, the centrifuge test results show higher 526
values of bending moment compared to those calculated using L-Pile. This deviation is most likely 527
due to the high horizontal passive soil pressure and shear stresses mobilized at the tip of laterally-528
loaded rigid piles in the experiment, which result in the potential existence of large bending moments 529
above the base. L-Pile does not take into account the possible shear force developed in the annular part 530
of the pile tip and hence this extra resistance is not included. This is potentially the reason why the L-531
Pile produced curves exhibit a smaller magnitude relative to the experimental curves close to the pile 532
toe. Fig. 18 shows the measured pile head load-displacement curve compared against the curve 533
extracted from L-Pile for the same case of 2D global scour. A reasonably good match is obtained, with 534
some under-prediction in the capacity being observed in the L-Pile curves. This under-prediction is 535
sensible as the L-Pile analysis omits the presence of potential base shear forces, which would increase 536
the lateral capacity. 537
Overall, the extracted p-y curves from the centrifuge tests are reasonably well validated by the L-Pile 538
software and moreover this analysis highlights the disparity in predictions that can occur for rigid 539
monopiles. 540

Published in Ocean Engineering 197 2020 106838
30
541
542
Fig. 17 (a) p-y curves for the 2D global scour case for various depths (b) Equivalent bending moment 543
profile from centrifuge and L-Pile for three different horizontal loads. 544
545
Fig. 18 Pile head load-displacement curves from the centrifuge testing and L-Pile for the case of 2D 546
global scour 547
548
549
3.2.5 Recommendations 550
The effect of the scour formation on p-y curves is case sensitive at relatively shallow depths. Global 551
and local scour lead to p-y curves with different ultimate capacity, which may be up to 40% lower for 552
the global case as compared to the no scour case. Similarly, the ‘catch-all’ term “local-scour” seems 553
to be insufficient, since the geometry of the local scour hole highly influences the response 554

Published in Ocean Engineering 197 2020 106838
31
characteristics, producing p-y curves that can differ by up to 20% in ultimate capacity for the conditions 555
tested in this study. Therefore, taking into account the difficulty in accurately predicting the scour 556
formation (depth and type) it is highly recommended that a full-range analysis of scour be performed 557
in each relevant project. Scour depth and type should be investigated in such an analysis, by focusing 558
on the geometry of the scour hole and overburden pressure considerations, for local scour cases. Local 559
narrow scour and global scour are the two extremes, while the local wide case is an intermediate 560
scenario, hence a valid analysis should contain at least these scenarios to make sure a given structure 561
will be adequately designed against scour occurrence. 562
It is recommended that p-y curves used by industry should be updated to have a better application to 563
rigid monopiles. Approaches to incorporate additional resistance components due to shear force 564
mobilized at the base and shear stresses mobilized along the pile during rotation are discussed in Burd 565
et al. (2017). 566
567
4 Conclusions 568
This paper presents a series of centrifuge tests for a monopile subjected to lateral loads for different 569
scour depths and types. A method is presented for deriving p-y curves for rigid piles and its 570
applicability is evaluated. The effect of scour type on the derived p-y curves is investigated. The 571
findings of this paper are summarised as follows: 572
- The Piecewise Polynomial approach is a reasonably valid method for fitting a discrete bending 573
moment profile and used in the subsequent derivation of soil pressure developed along the length of 574
the monopile. For sparsely distributed gauges, a 4th order curve performs well. For extracting the 575
deflection of the monopile based on the bending moment profile, a 7th order polynomial is sufficient. 576

Published in Ocean Engineering 197 2020 106838
32
- At shallow depths the influence of scour type is more evident in the derived p-y curves, but becomes 577
less significant as the depth increases. This indicates significant overburden dependency on the 578
resistance properties of the soil, an effect which becomes lower for deeper depths. 579
- The distinction between local and global scour is not sufficient for determining the influence of scour 580
type on p-y curves. The geometry of the local scour hole should also be considered as it highly affects 581
the characteristics of the p-y curves in shallower soil layers. In the tests in this paper, a ≈ 20% reduction 582
in ultimate p-y resistance was observed between local wide scour cases and local narrow scour cases. 583
This therefore has ramifications for the lateral resistance properties of monopiles affected by local 584
scour. 585
- An analysis that investigates the effect of scour formation on a rigid pile, should contain a series of 586
scenarios with different scour geometries, as this parameter is crucial to the characteristics of the p-y 587
curves. Note that since scour formation cannot yet be predicted accurately, it is still of importance to 588
assess the influence of the various scour types for a given structure. 589
Future work will focus on appraising the performance of effective depths for scoured p-y curves for 590
the geometrical cases considered in the present study. Effective depths can be used to appropriately 591
modify p-y curves to account for scour presence. Furthermore, the additional resistance generated by 592
laterally loaded rigid monopiles should be studied in more detail with a view to deriving simplified 593
modelling parameters to incorporate the additional base stresses/moments and side shear resistances. 594
These parameters could take the form of rotational springs distributed along the pile shaft to 595
complement the lateral p-y curves. The use of p-y curves alone seems to be insufficient for capturing 596
the lateral behavior of rigid monopiles. 597
598
599

Published in Ocean Engineering 197 2020 106838
33
Acknowledgement 600
This work is partly funded by the Section of Geo-Engineering, Delft University of Technology and the 601
EU Horizon 2020 Project SAFE-10-T Project No. 723254. One author has been funded by the China 602
Scholarship Council (CSC). 603
References 604
Achmus, M., 2010. Design of Axially and Laterally Loaded Piles for the Support of Offshore Wind 605
Energy Converters. Indian Geotech. Conf. 322–327. 606
Allersma, H.G.B., 1994. The University of Delft geotechnical centrifuge, in: Centrifuge 94. 607
Rotterdam, pp. 47–52. 608
API, 2007. RP2A: Recommended practice for planning, designing and constructing offshore 609
platforms - Working stress design. Washington, DC. 610
ASTM, 2017. D2487 - 17 - Standard Practice for Classification of Soils for Engineering Purposes 611
(Unified Soil Classification System) 10. https://doi.org/10.1520/D2487-17 612
Bennett, C.R., Lin, C., Parsons, R., Han, J., 2009. Evaluation of behavior of a laterally loaded bridge 613
pile group under scour conditions, in: Structures Congress 2009: Don’t Mess with Structural 614
Engineers: Expanding Our Role. 615
Brinkgreve, R.B.J., Kumarswamy, S., Swolfs, W., 2016. PLAXIS Manual, Delft, Netherlands. 616
Burd, H.J., Byrne, B.W., McAdam, R.A., Houlsby, G.T., Martin, C.M., JAP Beuckelaers, W., 617
Zdravković, L., Taborda, D.M., Potts, D.M., Jardine, R.J., Gavin, K., Doherty, P., Igoe, D., 618
Skov Gretlund, J., Pacheco Andrade, M., Muir Wood, A., 2017. Design aspects for monopile 619
foundations, in: TC 209 Workshop on Foundation Design for Offshore Wind Structures,19th 620
ICSMGE. pp. 35–44. 621
Byrne, B., McAdam, R., Burd, H., Houlsby, G., Martin, C., Gavin, K., Doherty, P., Igoe, D., 622
Zdravković, L., Taborda, D., Potts, D., Jardine, R., Sideri, M., Schroeder, F., Muir Wood, A., 623
Kallehave, D., Skov Gretlund, J., 2015. Field testing of large diameter piles under lateral 624
loading for offshore wind applications, in: Proceedings of the XVI ECSMGE Geotechnical 625
Engineering for Infrastructure and Development. pp. 1255–1260. 626
https://doi.org/10.1680/ecsmge.60678 627

Published in Ocean Engineering 197 2020 106838
34
Byrne, B.W., Burd, H.J., Gavin, K.G., Houlsby, G.T., Jardine, R.J., McAdam, R.A., Martin, C.M., 628
Potts, D.M., Taborda, D.M.G., Zdravkovic, L., 2019. PISA: Recent Developments in Offshore 629
Wind Turbine Monopile Design. pp. 350–355. https://doi.org/10.1007/978-981-13-2306-5_48 630
Byrne, T., Gavin, K., Prendergast, L.J., Cachim, P., Doherty, P., Chenicheri Pulukul, S., 2018. 631
Performance of CPT-based methods to assess monopile driveability in North Sea sands. Ocean 632
Eng. 166, 76–91. https://doi.org/10.1016/j.oceaneng.2018.08.010 633
De Jager, R.R., Maghsoudloo, A., Askarinejad, A., Molenkamp, F., 2017. Preliminary results of 634
instrumented laboratory flow slides, in: 1st International Conference on the Material Point 635
Method. Elsevier Ltd, Delft, Netherlands. 636
Det Norske Veritas, 2007. Environmental conditions and environmental loads, Recommended 637
Practice DNV-RP-C205. https://doi.org/10.1109/INTLEC.1993.388591 638
Doherty, P., Gavin, K., 2012. Laterally loaded monopile design for offshore wind farms. Proc. ICE - 639
Energy 165, 7–17. https://doi.org/10.1680/ener.11.00003 640
Dunnavant, T.W., 1986. Experimental And Analytical Investigation of the Behavior of Single Piles 641
in Overconsolidated Clay Subjected to Cyclic Lateral Loads. 642
ENSOFT INC, 2018. LPILE. 643
Hajialilue-Bonab, M., Levacher, D., Chazelas, J.L., Kaynia, A.M., 2014. Experimental study on the 644
dynamic behavior of laterally loaded single pile. Soil Dyn. Earthq. Eng. 66, 157–166. 645
https://doi.org/10.1016/j.soildyn.2014.06.011 646
Hoffmans, G.J., Verheij, H.J., 1997. Scour manual. CRC Press. 647
Kampitsis, A.E., Sapountzakis, E.J., Giannakos, S.K., Gerolymos, N. a., 2013. Seismic soil–pile–648
structure kinematic and inertial interaction—A new beam approach. Soil Dyn. Earthq. Eng. 55, 649
211–224. https://doi.org/10.1016/j.soildyn.2013.09.023 650
Kishore, Y.N., Rao, S.N., Mani, J., 2009. The behavior of laterally loaded piles subjected to scour in 651
marine environment. KSCE J. Civ. Eng. 13, 403–408. 652
LeBlanc, C., Houlsby, G.T., Byrne, B.W., 2010. Response of stiff piles in sand to long-term cyclic 653
lateral loading. Géotechnique 60, 79–90. https://doi.org/10.1680/geot.7.00196 654
Li, F., Han, J., Lin, C., 2013. Effect of scour on the behavior of laterally loaded single piles in marine 655
clay. Mar. Georesources Geotechnol. 31, 271–289. 656
Published in Ocean Engineering 197 2020 106838
35
Li, Q., Prendergast, L.J., Askarinejad, A., Gavin, K.G., 2018. Effect of scour on the behavior of a 657
combined loaded monopile in sand, in: 9th European Conference on Numerical Methods in 658
Geotechnical Engineering. Porto, Portugal. 659
Li, Y., Chen, X., Fan, S., Briaud, J.-L., Chen, H.-C., 2009. Is scour important for pile foundation 660
design in deepwater, in: Offshore Technology Conference. 661
Liang, F., Wang, C., Yu, X. (Bill), 2019. Widths, types, and configurations: Influences on scour 662
behaviors of bridge foundations in non-cohesive soils. Mar. Georesources Geotechnol. 37, 578–663
588. https://doi.org/10.1080/1064119X.2018.1460644 664
Liang, F., Zhang, H., Chen, S., 2018. Effect of vertical load on the lateral response of offshore piles 665
considering scour-hole geometry and stress history in marine clay. Ocean Eng. 158, 64–77. 666
https://doi.org/10.1016/j.oceaneng.2018.03.070 667
Lin, C., Bennett, C., Han, J., Parsons, R.L., 2010. Scour effects on the response of laterally loaded 668
piles considering stress history of sand. Comput. Geotech. 37, 1008–1014. 669
Matlock, H., 1970. Correlations for design of laterally loaded piles in soft clay, in: Offshore 670
Technology in Civil Engineering. pp. 577–594. 671
Matutano, C., Negro, V., López-Gutiérrez, J.-S., Esteban, M.D., 2013. Scour prediction and scour 672
protections in offshore wind farms. Renew. Energy 57, 358–365. 673
https://doi.org/10.1016/j.renene.2013.01.048 674
Mezazigh, S., Levacher, D., 1998. Laterally loaded piles in sand: slope effect on P-Y reaction curves. 675
Can. Geotech. J. 35, 433–441. https://doi.org/10.1139/t98-016 676
Mostafa, Y.E., 2012. Effect of local and global scour on lateral response of single piles in different 677
soil conditions. Engineering 4, 297–306. 678
Murchison, J.M., O’Neill, M.W., 1984. Evaluation of p-y relationships in cohesionless soils, in: 679
Analysis and Design of Pile Foundations. Proceedings of a Symposium in Conjunction with the 680
ASCE National Convention. pp. 174–191. 681
Negro, V., López-Gutiérrez, J.-S., Esteban, M.D., Matutano, C., 2014. Uncertainties in the design of 682
support structures and foundations for offshore wind turbines. Renew. Energy 63, 125–132. 683
https://doi.org/10.1016/j.renene.2013.08.041 684
Niemunis, A., Herle, I., 1997. Hypoplastic model for cohesionless soils with elastic strain range. 685
Published in Ocean Engineering 197 2020 106838
36
Mech. Cohesive-Frictional Mater. 2, 279–299. https://doi.org/10.1002/(SICI)1099-686
1484(199710)2:4<279::AID-CFM29>3.0.CO;2-8 687
O’Neill, M., Murchinson, J.M., 1983. An evaluation of p-y relationships in sands. 688
Peder Hyldal Sørensen, S., Bo Ibsen, L., 2013. Assessment of foundation design for offshore 689
monopiles unprotected against scour. Ocean Eng. 63, 17–25. 690
https://doi.org/10.1016/j.oceaneng.2013.01.016 691
Prakasha, K., Joer, H., Randolph, M., 2005. Establishing a model testing capability for deep water 692
foundation systems, in: Proceedings of the 15th International Offshore and Polar Engineering 693
Conference and Exhibition. Seoul, Korea, pp. 309–315. 694
Prendergast, L.J., Gavin, K., Doherty, P., 2015. An investigation into the effect of scour on the 695
natural frequency of an offshore wind turbine. Ocean Eng. 101, 1–11. 696
https://doi.org/10.1016/j.oceaneng.2015.04.017 697
Prendergast, L.J., Hester, D., Gavin, K., O’Sullivan, J.J., 2013. An investigation of the changes in the 698
natural frequency of a pile affected by scour. J. Sound Vib. 332, 6685–6702. 699
https://doi.org/http://dx.doi.org/10.1016/j.jsv.2013.08.020i 700
Prendergast, L.J., Reale, C., Gavin, K., 2018. Probabilistic examination of the change in 701
eigenfrequencies of an offshore wind turbine under progressive scour incorporating soil spatial 702
variability. Mar. Struct. 57, 87–104. https://doi.org/10.1016/j.marstruc.2017.09.009 703
Qi, W., Gao, F., 2014. Equilibrium scour depth at offshore monopile foundation in combined waves 704
and current. Sci. China Technol. Sci. 57, 1030–1039. https://doi.org/10.1007/s11431-014-5538-705
9 706
Qi, W.G., Gao, F.P., Randolph, M.F., Lehane, B.M., 2016. Scour effects on p–y curves for shallowly 707
embedded piles in sand. Géotechnique 66, 648–660. https://doi.org/10.1680/jgeot.15.P.157 708
Reese, L., Welch, R.C., 1975. Lateral Loadings of Deep Foundations in Stiff Clay. J. Geotech. Eng. 709
101, 633–649. 710
Reese, L.C., Cox, W.R., Koop, F.D., 1975. Field testing and analysis oflaterally loaded piles in stiff 711
clays., in: 7th Annual Offshore Technology Conf. pp. 672–690. 712
Reese, L.C., Cox, W.R., Koop, F.D., 1974. Analysis of laterally loaded pilesin sand, in: 6th Annual 713
Offshore Technology Conf. pp. 473–484. 714

Published in Ocean Engineering 197 2020 106838
37
Reese, L.C., Wang, S., Long, J., 1989. Scour from cyclic lateral loading of piles, in: Offshore 715
Technology Conference. 716
Reese, L.C., Welch, R.C., 1975. LATERAL LOADING OF DEEP FOUNDATIONS IN STIFF 717
CLAY. ASCE J Geotech Eng Div 101, 633–649. 718
Remaud, D., 1999. Pieux sous charges latérales: étude expérimentale de l’effet de groupe. 719
Confrontation. 720
Roulund, A., Sumer, B.M., Michelsen, J., 2005. Numerical and experimental investigation of flow 721
and scour around a circular pile. J. Fluid Mech. 534, 351–401. 722
https://doi.org/10.1017/S0022112005004507 723
Sumer, B.M., Fredsøe, J., 2012. The mechanics of scour in the marine environment. Adv. Ser. Ocean 724
Eng. 17. 725
von Wolffersdorff, P.-A., 1996. Hypoplastic relation for granular materials with a predefined limit 726
state surface. Mech. Cohesive-Frictional Mater. 1, 251–271. 727
https://doi.org/10.1002/(SICI)1099-1484(199607)1:3<251::AID-CFM13>3.0.CO;2-3 728
Wang, J., Qi, C., 2008. P-y Curves of Piles in Saturated Degradation Sands with Residual Pore 729
Water Pressures. Isope 8, 690–697. 730
Wang, S.T., Reese, L.C., 1991. “Analysis of piles under lateral load-computer program COM624P 731
for the microcomputers.” Report No. FHwA-SA-91-002, U.S. Dept. of Transportation, FHwA, 732
Washington, D.C. 733
Wilson, D.W., 1998. Soil-Pile-Superstructure Interaction in Liquefying Sand and Soft Clay. Transp. 734
Res. Rec. 1569, 190. https://doi.org/10.3141/1569-07 735
Wind Europe, 2017. Offshore wind in Europe - Key trends and statistics. 736
https://doi.org/10.1016/S1471-0846(02)80021-X 737
Xue, J., Gavin, K., Murphy, G., Doherty, P., Igoe, D., 2016. Optimization technique to determine the 738
p-y curves of laterally loaded stiff piles in dense sand. Geotech. Test. J. 39, 842–854. 739
https://doi.org/10.1520/GTJ20140257 740
Yang, K., Liang, R., 2007. Methods for deriving p-y curves from instrumented lateral load tests. 741
Geotech. Test. J. 30, 31–38. 742
Yankelevsky, D.Z., Eisenberger, M., Adin, M.A., 1989. Analysis of beams on nonlinear winkler 743

Published in Ocean Engineering 197 2020 106838
38
foundation. Comput. Struct. 31, 287–292. https://doi.org/https://doi.org/10.1016/0045-744
7949(89)90232-0 745
746