Embed Size (px)
Citation preview

Influence of perfusion depth on laser Doppler flowmeasurements with large source–detector spacing
Yohei Watanabe and Eiji Okada
Laser Doppler flowmetry with a large source–detector spacing has been applied to measure bloodperfusion in the deeper regions of tissue. The influence of the depth of perfusion on the Dopplerspectrum for the large source–detector spacing is likely to be different from that for the conventional laserDoppler instruments with small source–detector spacing. In this study, the light propagation in a tissuemodel with a blood perfusion layer is predicted by the Monte Carlo simulation to discuss the influence ofthe depth of perfusion, blood volume, and source–detector spacing on the spectrum of the Doppler signaldetected with large source–detector spacing. The influence of the depth of perfusion on the Dopplerspectrum for the large source–detector spacing is different from that for the conventional laser Dopplerinstruments with small source–detector spacing, although the influence of source–detector spacing andblood volume on the Doppler spectrum for large source–detector spacing is almost the same as that forthe conventional laser Doppler instruments. The influence of the depth of the perfusion on the Dopplerspectrum depends on the path length that the detected light travels at different depths. © 2003 OpticalSociety of America
OCIS codes: 170.3340, 170.3660, 170.6930, 170.7050.
1. Introduction
Laser Doppler flowmetry �LDF� has been routinelyused for noninvasive measurements of the perfusionin skin1 and the exposed cortex.2 The tissue surfaceis irradiated by red or near-infrared light. The fre-quency of the light that is scattered by moving bloodcells is shifted by the Doppler effect. The Doppler-shifted light and nonshifted light are heterodyned onthe detector to obtain the Doppler signal. Becausethe blood cells in the capillary bed move at variousvelocities in random directions, quite a few theoreti-cal analyses and phantom experiments have beenperformed to investigate the relation between thevelocity of blood cells and the Doppler signal. It hasbeen shown that the first moment of the Dopplerspectrum is proportional to the root-mean-squarespeed, of moving blood cells.3 Because the light isstrongly scattered in the tissue, the probing volume ofLDF has also been investigated.4–8 The depth of theprobing volume as well as the Doppler signal depends
The authors are with the Department of Electronics, Keio Uni-versity, 3-14-1, Hiyoshi, Kohoku-ku, Yokohama, 223, Japan. Y.Watanabe’s e-mail address is [email protected].
Received 1 September 2002; revised manuscript received 18 De-cember 2002.
0003-6935�03�163198-07$15.00�0© 2003 Optical Society of America
3198 APPLIED OPTICS � Vol. 42, No. 16 � 1 June 2003
on the wavelength of the light source,4,5 source–detector spacing,4,6–8 and so forth. Near-infraredlight can probe deeper parts of the tissue than redlight, and the depth of the probing volume increaseswith increasing source–detector spacing.
The source–detector spacing of conventional laserDoppler instruments is normally less than 1 mm, andthe depth of the probing volume of the LDF is limitedto a few millimeters. LDF with small source–detector spacing tends to be used to measure theblood flow in shallow regions of tissue. Near-infrared light can penetrate into deeper regions of thetissue, whereas red light is strongly attenuated byscattering and absorption in the tissue. Recently,the possibility of detection of a Doppler signal causedby cortical blood flow with a source–detector pairattached to the scalp has been discussed to realizenoninvasive cortical blood flow measurement by LDFwith near-infrared light.9 The phantom experi-ments showed that the Doppler signal from deeperparts of the tissue can be obtained from the lightdetected with the large source–detector spacing.The optical path length that the light travels in thetissue for the large source–detector spacing is con-siderably longer than that for the conventional LDF.The influences of the depth of perfusion, source–detector spacing, and blood volume on the Dopplerspectrum of the signal detected with the largesource–detector spacing are likely to be different

from those for the conventional LDF with the smallsource–detector spacing. However, there are veryfew investigations of the influence of these parame-ters on the Doppler spectrum for the large source–detector spacing.
In this study, light propagation in a tissue modelwith a blood perfusion layer is predicted by means ofMonte Carlo simulation, thus allowing discussion ofthe influence of the depth of perfusion, source–detector spacing, and blood volume on the spectrumof Doppler signal detected with the large source–detector spacing. Because it has been revealed thatthe average frequency of the Doppler spectrum ofconventional LDF with the small source–detectorspacing depends on the blood velocity and averagenumber of Doppler scattering events, the number ofscattering events caused by moving blood cells in theperfusion layer was also calculated for evaluation ofthe influence of the parameters.
2. Tissue Model and Method of Simulation
A. Tissue Model with Blood Perfusion
The tissue model for the Monte Carlo simulation wasa slab consisting of two types of tissue as shown inFig. 1. The optical properties of the tissue were cho-sen from the reported data on the optical properties ofthe dermis at a wavelength of 800 nm.10 The scat-tering coefficient was �s � 19.4 mm�1 with anisotro-pic factor g � 0.9. The absorption coefficient was �a� 0.031 mm�1. The absorption by the blood11 ofwhich fractional volume in the tissue model was as-sumed to be 5% was taken into account for the ab-sorption coefficient of the model.
A 0.5-mm-thick layer with blood perfusion was con-sidered in the model. The percentage of the scatter-ing events caused by moving scatterers, which isdefined as the blood volume of the perfusion layer,ranged from 2.5% to 15%. The scattering and ab-sorption coefficients were not changed with the bloodvolume of the perfusion layer. The depth of the topsurface of the perfusion layer from the tissue surfacewas varied from 0 to 10 mm. The velocity of bloodcells moving in a random direction was varied from 1to 10 mm�s.
B. Monte Carlo Simulation
The Doppler power spectrum of the detected lightwas predicted by means of Monte Carlo simulation.6The calculation of Monte Carlo simulation was basedon the variance reduction technique.12 Ten millionphotons that had unit weight and wave vectors wereinjected into the tissue model one by one. The initialdirection of the photons was varied to represent adiverging beam from a fiber of which the numericalaperture is 0.3. The path length between successivescattering events in the model was determined by thescattering coefficient �s and a random number asfollows
li � �ln�P���s , (1)
where P is a random number between 0 and 1. Thedirection of the scattered photon was calculated fromrandom numbers and the scattering phase function.The scattering phase function was assumed to be aHenyey–Greenstein phase function with an anisot-ropy factor, g � 0.9. The wave vector was alsochanged with the scattering angles. In the perfu-sion layer, the scattering event with a moving bloodcell was examined by means of the blood volume anda random number. If the photon was scattered by amoving blood cell, the frequency shift caused by thescattering event �fs was given as
�fs �1
2��ks � ki�v , (2)
where ki and ks are the wave vectors of a photonbefore and after the scattering event, and v is thevelocity of the moving blood cell. The Doppler shiftcaused by every scattering event by moving bloodcells was accumulated.
Reflection and refraction of light caused byrefractive-index mismatching between the air andthe tissue were taken into account. The refractiveindices of the tissue and air were assumed to be 1.4and 1.0, respectively. When the photon reached thesquare detectors with sides of 5 mm at 10, 20, or 30mm from the light source on the model surface, theultimate weight of the photon Wn was calculated fromthe optical path length and the absorption coefficientof the tissue
Wn � W0 exp���a L� , (3)
where W0 is the weight of the photon, reduced only byreflection on the boundary, and L is the optical pathlength that the detected photon travels in the tissuemodel.
The total frequency shift fn was also obtained fromthe accumulated frequency shift caused by the Dopp-ler scattering events. The ultimate weight of thephoton Wn was accumulated onto a discrete fre-quency channel that represents the distribution ofthe total Doppler shift of the light detected at eachdetector. The width and interval of the frequencychannel was �fr. The discrete Doppler power spec-
Fig. 1. Tissue model for the Monte Carlo simulation.
1 June 2003 � Vol. 42, No. 16 � APPLIED OPTICS 3199

trum S�f� of the signal obtained by heterodyne detec-tion can be calculated by the following convolution13
S� f � � S�m � �fr� � c �i�0
N�m
WiWim , (4)
where c is a normalization factor and N is the numberof frequency channels. The width of the frequencychannel �fr was 200 Hz in the simulation. Actually,the size of the detector of the LDF is limited to thesize of the spatial coherence area. A large detectorcan reduce the statistical noise of Monte Carlo sim-ulation, however it increases the degree of incoherentdetection that increases the noise level of the signalin measurements. We assume that all the detectedlight is completely coherent, although the size of thedetector is much larger than the size of the coherencearea.
It has been shown that the first weighted momentof the Doppler power spectrum f�,
f� �
�0
f S� f �df
�0
S� f �df
, (5)
is proportional to the root-mean-square speed of themoving particle v2�1�2.3 In this study, the Dopplerpower spectrum of the frequency range from 200 Hzto 60 kHz was used to obtain the first moment of theDoppler spectrum f�. The lower cutoff frequency of200 Hz was determined by the width of the frequencychannel �fr.
The Doppler shift frequency of the signal detectedwith the small source–detector spacing increaseswith the average number of scattering events causedby the moving blood cells.14 We also calculated theaverage number of the Doppler scattering events bymoving blood cells Nave:
Nave �
�i�0
MAXDop
ci i
�i�0
MAXDop
ci
, (6)
where i is the number of Doppler scattering events,MAXDop is the maximum number of the Doppler scat-tering events, and ci is the ultimate weight of de-tected photons that are scattered i times by themoving blood cells.
The accumulated trajectories of photons detectedat each detector were also calculated to show thepenetration depth of the detected light. The modelwas divided into voxels, and the path length that thedetected photon traveled in each voxel was stored torecord the trajectories of the detected photon. Thepath length in each voxel was weighted by the ulti-mate weight Wn of the detected photon. Theweighted trajectories for all the detected photons
were projected onto an x–z plane to obtain accumu-lated trajectories.15
3. Results
The Doppler power spectra for source–detector spac-ings of 10 and 20 mm are shown in Figs. 2�a� and 2�b�,respectively. The velocity of the blood cell was 10.0mm�s, and the depth of the perfusion layer was var-ied from 0 to 10 mm. The power of the Dopplerspectrum decreases with the increasing depth of theperfusion for a source–detector spacing of 10 mm.Very few photons can be reemitted at the detectorposition once the photons penetrate deeper regions.The detected intensity of light scattered by the mov-ing cells in the perfusion layer decreases with theincreasing depth of the perfusion layer. The Dopp-ler power spectrum obtained from the photons arriv-ing at the detectors of which the numerical aperture
Fig. 2. Doppler power spectra at a blood velocity of 10 mm�s forsource–detector spacings �a� of 10 mm and �b� of 20 mm.
3200 APPLIED OPTICS � Vol. 42, No. 16 � 1 June 2003

was 0.3 was also calculated; however, the differencescaused by the numerical aperture of the detectorwere within the statistical error of the Monte Carlosimulation.
The slope of the Doppler spectrum increases withthe increasing depth of perfusion for a source–detector spacing of 10 mm. The Doppler spectrumfor a source–detector spacing of 20 mm shows almostthe same tendency; however, the slope of the Dopplerspectrum for a perfusion of 0 mm in depth is slightlysteeper than that for a perfusion of 3 mm in depth.Figure 3 shows the average Doppler frequency calcu-lated with Eq. �5� as a function of the depth of perfu-sion. The velocity of the blood cell was 4 and 10mm�s, and the source–detector spacing ranged from10 to 30 mm. Error bars represent the statisticalerror of the Monte Carlo simulation. The averageDoppler frequency increases with the increasingsource–detector spacing. The average Doppler fre-quency decreases with the increasing depth of perfu-sion in the case of a source–detector spacing of 10mm. In the case of source–detector spacings of 20and 30 mm, the average Doppler frequency due to aperfusion of 3 mm in depth is greater than that due toa perfusion of 0 mm in depth, although the averageDoppler frequency decreases with increasing perfu-sion depth over 3 mm.
The relation between the blood volume in the per-fusion layer and the average Doppler frequency isshown in Fig. 4. The blood velocity was 10 mm�s,and the source–detector spacing was 20 mm. Theaverage Doppler frequency increases with increasingblood volume. The ratio of the average Doppler fre-quency for a blood volume of 10% to that for a bloodvolume of 5% is approximately 1.4 for all depths ofperfusion. No significant differences in the effect ofblood volume on the average Doppler frequency canbe observed between the perfusion on the surface andthat in the deeper regions. The same tendency was
observed in the results for source–detector spacingsof 10 and 30 mm.
The average number of Doppler scattering events ofdetected photons as a function of the depth of perfusionis shown in Fig. 5. The path length between succes-sive scattering events and the direction of the scatter-ing photons do not depend on the velocity of the bloodcells in the Monte Carlo simulation; therefore, the re-lation between the average number of Doppler scatter-ing events and the depth of perfusion does not dependon the velocity of the blood cells. In the case of asource–detector spacing of 10 mm, the average num-ber of Doppler scattering events decreases with in-creasing depth of perfusion. The average number ofDoppler scattering events increase with increasingsource–detector spacing, except for the case in whichthe depth of perfusion is 0 mm. In the case of source–
Fig. 3. Calculated average Doppler frequency as a function of thedepth of perfusion.
Fig. 4. Average Doppler frequency as a function of the bloodvolume in the perfusion layer at a velocity of perfusion of 10 mm�sfor a source–detector spacing of 20 mm.
Fig. 5. Average number of Doppler scattering events as a functionof the depth of the perfusion layer.
1 June 2003 � Vol. 42, No. 16 � APPLIED OPTICS 3201
detector spacings of 20 and 30 mm, the average num-ber of Doppler scattering events decreases withincreasing perfusion depth greater than 3 mm.
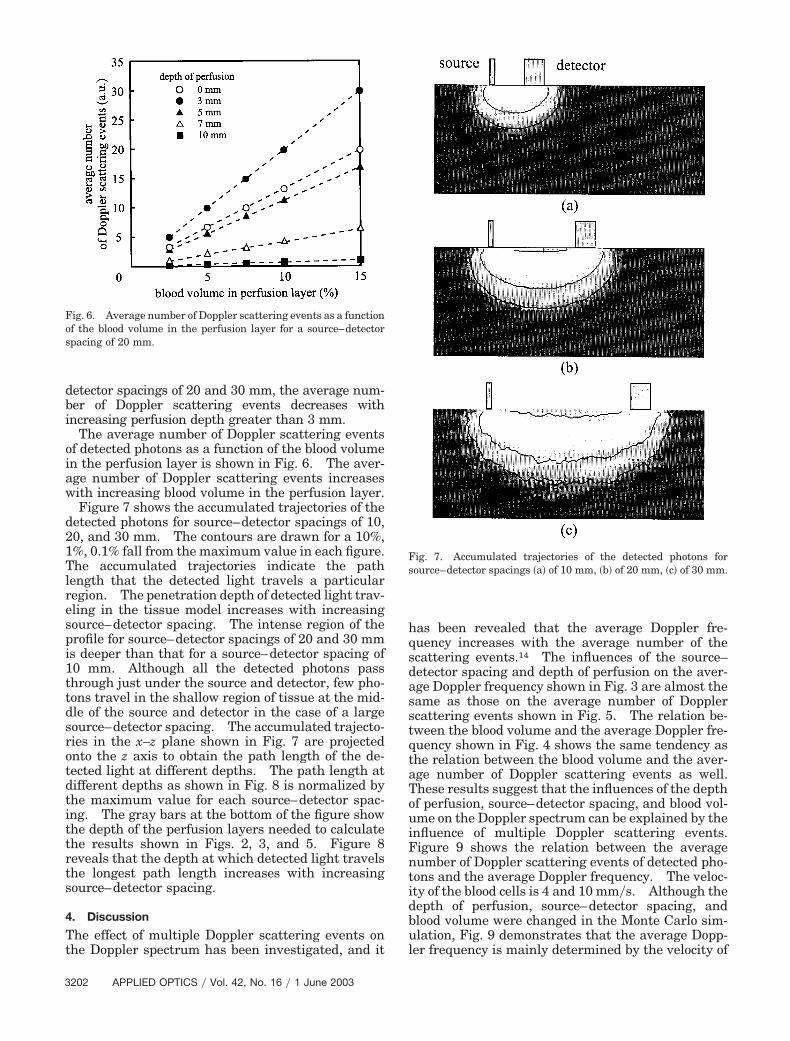
The average number of Doppler scattering eventsof detected photons as a function of the blood volumein the perfusion layer is shown in Fig. 6. The aver-age number of Doppler scattering events increaseswith increasing blood volume in the perfusion layer.
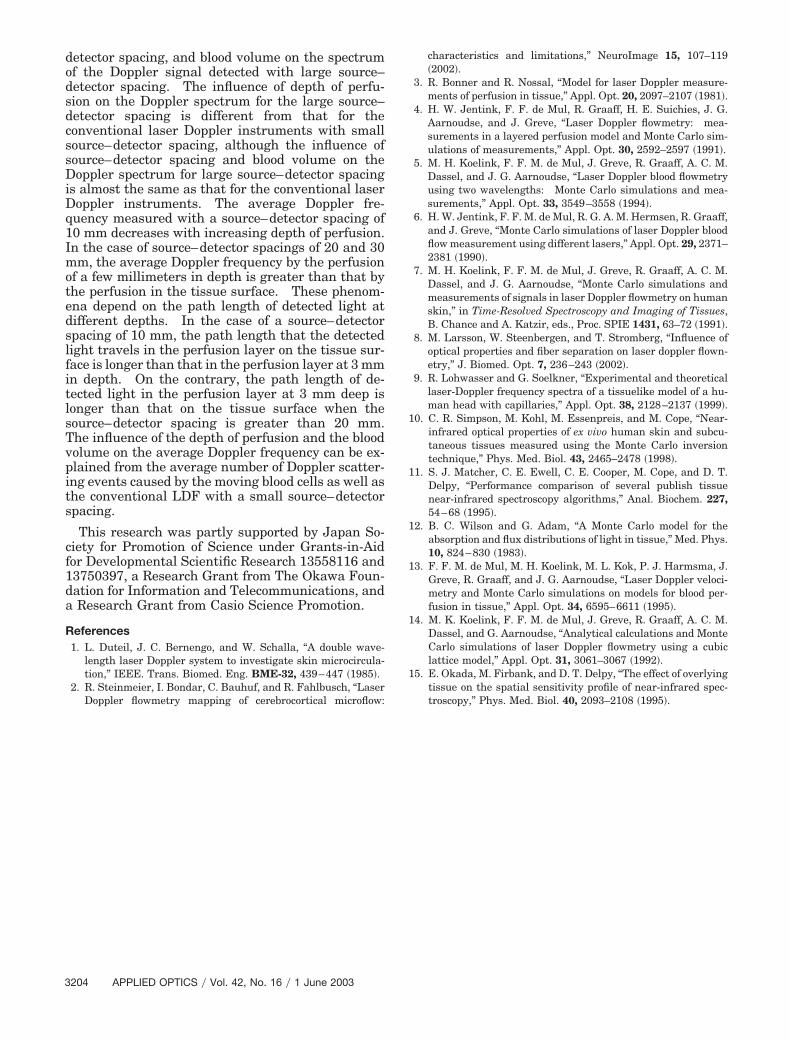
Figure 7 shows the accumulated trajectories of thedetected photons for source–detector spacings of 10,20, and 30 mm. The contours are drawn for a 10%,1%, 0.1% fall from the maximum value in each figure.The accumulated trajectories indicate the pathlength that the detected light travels a particularregion. The penetration depth of detected light trav-eling in the tissue model increases with increasingsource–detector spacing. The intense region of theprofile for source–detector spacings of 20 and 30 mmis deeper than that for a source–detector spacing of10 mm. Although all the detected photons passthrough just under the source and detector, few pho-tons travel in the shallow region of tissue at the mid-dle of the source and detector in the case of a largesource–detector spacing. The accumulated trajecto-ries in the x–z plane shown in Fig. 7 are projectedonto the z axis to obtain the path length of the de-tected light at different depths. The path length atdifferent depths as shown in Fig. 8 is normalized bythe maximum value for each source–detector spac-ing. The gray bars at the bottom of the figure showthe depth of the perfusion layers needed to calculatethe results shown in Figs. 2, 3, and 5. Figure 8reveals that the depth at which detected light travelsthe longest path length increases with increasingsource–detector spacing.
4. Discussion
The effect of multiple Doppler scattering events onthe Doppler spectrum has been investigated, and it
has been revealed that the average Doppler fre-quency increases with the average number of thescattering events.14 The influences of the source–detector spacing and depth of perfusion on the aver-age Doppler frequency shown in Fig. 3 are almost thesame as those on the average number of Dopplerscattering events shown in Fig. 5. The relation be-tween the blood volume and the average Doppler fre-quency shown in Fig. 4 shows the same tendency asthe relation between the blood volume and the aver-age number of Doppler scattering events as well.These results suggest that the influences of the depthof perfusion, source–detector spacing, and blood vol-ume on the Doppler spectrum can be explained by theinfluence of multiple Doppler scattering events.Figure 9 shows the relation between the averagenumber of Doppler scattering events of detected pho-tons and the average Doppler frequency. The veloc-ity of the blood cells is 4 and 10 mm�s. Although thedepth of perfusion, source–detector spacing, andblood volume were changed in the Monte Carlo sim-ulation, Fig. 9 demonstrates that the average Dopp-ler frequency is mainly determined by the velocity of
Fig. 6. Average number of Doppler scattering events as a functionof the blood volume in the perfusion layer for a source–detectorspacing of 20 mm.
Fig. 7. Accumulated trajectories of the detected photons forsource–detector spacings �a� of 10 mm, �b� of 20 mm, �c� of 30 mm.
3202 APPLIED OPTICS � Vol. 42, No. 16 � 1 June 2003

the blood cells and the average number of Dopplerscattering events.
In the previous studies, it was shown that the av-erage frequency of the Doppler spectrum decreaseswith the increasing depth of perfusion.8 As shownin Fig. 3, the same tendency can be observed in theresults of our Monte Carlo simulation in the case of asource–detector spacing of 10 mm. However, theinfluence of the depth of perfusion on the Dopplerspectrum for source–detector spacings of 20 and 30mm is different from that shown in the previous stud-ies. The average Doppler frequency once increases
with the increasing depth of perfusion in shallowregions of the tissue, although the average Dopplerfrequency decreases with the increasing depth of per-fusion in the deeper regions of tissue. This tendencycan be explained from the path length that detectedlight travels at different depths. As can be seen inFig. 8, the depth at which detected light travels thelongest path length is approximately 1 mm in thecase of a source–detector spacing of 10 mm.
The path length that detected light travels in theperfusion layer at 0 mm in depth is longer than thatin the perfusion layer at 3 mm deep. The density ofaccumulated trajectories of the detected light de-creases with increasing depth of the tissue. Thisdecreased density indicates that the light propa-gated, i.e., scattered, in a shallow region of tissuecontributes more greatly to the detected signal thanthe light propagated in a deeper region of tissue.Because the number of scattering events at differentdepths depends on the path length that the detectedlight travels at those depths, the average number ofDoppler scattering events decreases with the increas-ing depth of perfusion. In most of the previous the-oretical studies, the source–detector spacing wasassumed to be less than 1 mm, which was normallyused for conventional LDF. The path length of thedetected light at different depths for those smallsource–detector spacings decreases with the increas-ing depth of the tissue.
The accumulated trajectories of detected light forsource–detector spacings of 20 and 30 mm are differ-ent from that for a source–detector spacing of 10 mm.The accumulated trajectories penetrate deeper re-gions of the tissue as shown in Fig. 7, and the depthat which detected light travels the longest pathlength is observed at approximately 3 mm below thetissue surface as shown in Fig. 8. This distributionof photon trajectories increases the Doppler scatter-ing events in the blood perfusion at approximately 3mm in depth. The path length that detected lighttravels in the perfusion layer of 3 mm in depth islonger than that in the perfusion layer on the tissuesurface.
Increasing the source–detector spacing leads to in-creasing the path length that the detected light trav-els in the tissue, and hence the average number ofDoppler scattering events increases with increasingsource–detector spacing. The average number ofDoppler scattering events increases with increasingblood volume in the perfusion layer because the prob-ability that the photon scattered by a moving bloodcell is raised because of increasing the blood volume.These influences on the spectrum of the Doppler sig-nal detected with large source–detector spacing arealmost the same as those of the conventional LDFwith the small source–detector spacing.
5. Conclusion
In this study, the light propagation in a tissue modelwith a blood perfusion layer is predicted by means ofMonte Carlo simulation, thus allowing discussion ofthe influence of the depth of perfusion, source–
Fig. 8. Normalized path length of detected photons at differentdepths. Gray bars at the bottom represent the depth of perfusionlayers used to calculate the results shown in Figs. 2, 3, and 5.
Fig. 9. Relation between the average Doppler frequency and theaverage number of Doppler scattering events.
1 June 2003 � Vol. 42, No. 16 � APPLIED OPTICS 3203
detector spacing, and blood volume on the spectrumof the Doppler signal detected with large source–detector spacing. The influence of depth of perfu-sion on the Doppler spectrum for the large source–detector spacing is different from that for theconventional laser Doppler instruments with smallsource–detector spacing, although the influence ofsource–detector spacing and blood volume on theDoppler spectrum for large source–detector spacingis almost the same as that for the conventional laserDoppler instruments. The average Doppler fre-quency measured with a source–detector spacing of10 mm decreases with increasing depth of perfusion.In the case of source–detector spacings of 20 and 30mm, the average Doppler frequency by the perfusionof a few millimeters in depth is greater than that bythe perfusion in the tissue surface. These phenom-ena depend on the path length of detected light atdifferent depths. In the case of a source–detectorspacing of 10 mm, the path length that the detectedlight travels in the perfusion layer on the tissue sur-face is longer than that in the perfusion layer at 3 mmin depth. On the contrary, the path length of de-tected light in the perfusion layer at 3 mm deep islonger than that on the tissue surface when thesource–detector spacing is greater than 20 mm.The influence of the depth of perfusion and the bloodvolume on the average Doppler frequency can be ex-plained from the average number of Doppler scatter-ing events caused by the moving blood cells as well asthe conventional LDF with a small source–detectorspacing.
This research was partly supported by Japan So-ciety for Promotion of Science under Grants-in-Aidfor Developmental Scientific Research 13558116 and13750397, a Research Grant from The Okawa Foun-dation for Information and Telecommunications, anda Research Grant from Casio Science Promotion.
References1. L. Duteil, J. C. Bernengo, and W. Schalla, “A double wave-
length laser Doppler system to investigate skin microcircula-tion,” IEEE. Trans. Biomed. Eng. BME-32, 439–447 �1985�.
2. R. Steinmeier, I. Bondar, C. Bauhuf, and R. Fahlbusch, “LaserDoppler flowmetry mapping of cerebrocortical microflow:
characteristics and limitations,” NeuroImage 15, 107–119�2002�.
3. R. Bonner and R. Nossal, “Model for laser Doppler measure-ments of perfusion in tissue,” Appl. Opt. 20, 2097–2107 �1981�.
4. H. W. Jentink, F. F. de Mul, R. Graaff, H. E. Suichies, J. G.Aarnoudse, and J. Greve, “Laser Doppler flowmetry: mea-surements in a layered perfusion model and Monte Carlo sim-ulations of measurements,” Appl. Opt. 30, 2592–2597 �1991�.
5. M. H. Koelink, F. F. M. de Mul, J. Greve, R. Graaff, A. C. M.Dassel, and J. G. Aarnoudse, “Laser Doppler blood flowmetryusing two wavelengths: Monte Carlo simulations and mea-surements,” Appl. Opt. 33, 3549–3558 �1994�.
6. H. W. Jentink, F. F. M. de Mul, R. G. A. M. Hermsen, R. Graaff,and J. Greve, “Monte Carlo simulations of laser Doppler bloodflow measurement using different lasers,” Appl. Opt. 29, 2371–2381 �1990�.
7. M. H. Koelink, F. F. M. de Mul, J. Greve, R. Graaff, A. C. M.Dassel, and J. G. Aarnoudse, “Monte Carlo simulations andmeasurements of signals in laser Doppler flowmetry on humanskin,” in Time-Resolved Spectroscopy and Imaging of Tissues,B. Chance and A. Katzir, eds., Proc. SPIE 1431, 63–72 �1991�.
8. M. Larsson, W. Steenbergen, and T. Stromberg, “Influence ofoptical properties and fiber separation on laser doppler flown-etry,” J. Biomed. Opt. 7, 236–243 �2002�.
9. R. Lohwasser and G. Soelkner, “Experimental and theoreticallaser-Doppler frequency spectra of a tissuelike model of a hu-man head with capillaries,” Appl. Opt. 38, 2128–2137 �1999�.
10. C. R. Simpson, M. Kohl, M. Essenpreis, and M. Cope, “Near-infrared optical properties of ex vivo human skin and subcu-taneous tissues measured using the Monte Carlo inversiontechnique,” Phys. Med. Biol. 43, 2465–2478 �1998�.
11. S. J. Matcher, C. E. Ewell, C. E. Cooper, M. Cope, and D. T.Delpy, “Performance comparison of several publish tissuenear-infrared spectroscopy algorithms,” Anal. Biochem. 227,54–68 �1995�.
12. B. C. Wilson and G. Adam, “A Monte Carlo model for theabsorption and flux distributions of light in tissue,” Med. Phys.10, 824–830 �1983�.
13. F. F. M. de Mul, M. H. Koelink, M. L. Kok, P. J. Harmsma, J.Greve, R. Graaff, and J. G. Aarnoudse, “Laser Doppler veloci-metry and Monte Carlo simulations on models for blood per-fusion in tissue,” Appl. Opt. 34, 6595–6611 �1995�.
14. M. K. Koelink, F. F. M. de Mul, J. Greve, R. Graaff, A. C. M.Dassel, and G. Aarnoudse, “Analytical calculations and MonteCarlo simulations of laser Doppler flowmetry using a cubiclattice model,” Appl. Opt. 31, 3061–3067 �1992�.
15. E. Okada, M. Firbank, and D. T. Delpy, “The effect of overlyingtissue on the spatial sensitivity profile of near-infrared spec-troscopy,” Phys. Med. Biol. 40, 2093–2108 �1995�.
3204 APPLIED OPTICS � Vol. 42, No. 16 � 1 June 2003