Embed Size (px)
Citation preview
7/28/2019 Influence of Friction in Simple Upsetting
http://slidepdf.com/reader/full/influence-of-friction-in-simple-upsetting 1/13
R. Ganesh Narayanan,1 M. Gopal,2 and A. Rajadurai3
Influence of Friction in Simple Upsetting
and Prediction of Hardness Distribution in a ColdForged Product
ABSTRACT: Predicting inhomogeneous deformation in any forging process will definitely be helpful in deciding the tool, billet material, lubri-
cation, annealing sequences, and number of stages to make products. In this work, the influence of varied friction conditions on the hardness and effective strain variation during simple upsettingis studied.Also,hardnessvariation in a typical cold forging process is predicted by relating hardnessand effective strain evolution in a simple upsetting operation empirically. Four different lubricants, viz., castor oil ( m=0.33), soap (m=0.25), grease(m=0.2), teflon (m=0.16), are considered for experimentation. The friction factors of these lubricants were obtained from a Ring Compression Test(RCT) and are used in FE simulations of upsetting and forging operations. It is found from the analyses that: (1) Teflon shows relatively less variation
in hardness and effective strain depicting homogeneous upsetting operation, whereas other lubricants show a larger variation in hardness and effec-tive strain in radial and axial directions; (2)hardnessis observed to vary linearly with effective strain; (3) the empirical relationship between hardnessand effective strain obtained from a simple upsetting operation, which is common for all the lubricants, predicts the hardness distribution during theforging-extrusion process with moderate accuracy. This depends on the interface friction conditions, i.e., solid and semi-solid lubricants with better holdability like Teflon and soap show good correlation between experimental and predicted hardness values than liquid lubricant, i.e., castor oil.
KEYWORDS: forging, forming, hardness, lubricant
Introduction
Need for Hardness Prediction
Metal forming operations involve a complex interaction of the
metal and the dies and equipment used to deform it. The physical
phenomena describing a forming operation are difficult to expresswith quantitative relationships. The metal flow in any metal form-
ing operation is influenced by the process variables, viz., billet ma-
terial, tooling, conditions at tool/material interface, deformation
zone, equipment, used, and number of stages to make the product.
In producing discrete parts, several forming operations are required
to transform the initial “simple” geometry into a “complex” geom-
etry without causing material failure or undesirable material prop-
erties. Inhomogeneous deformation can occur in such forging op-
erations, and leads to failure or reduced fatigue life of the product
in service. A prior knowledge about the deformation characteristics
in a particular forging process is necessary in deciding the appro-
priate lubricants, tool/die design, load, forming and annealing se-
quences. Also, this assists in producing either a homogeneousstructure or a prescribed distribution of properties (like hardness,
strain, etc.) during the course of deformation. Most of the forged
parts are produced in multi-stages that in each stage the product
undergoes severe plastic deformation and hence strength/hardness
increases because of strain hardening. Sometimes the forged mate-
rial becomes so hard that one needs to anneal it before subsequent
forging operations to avoid early failure. It is cumbersome and time
consuming to measure the properties distribution at every stage to
assess the deformation characteristics of the component. Conse-
quently, the most significant objective of any method of analysis
could be to predict the forging behavior at the design stage itself
and assist the forming engineer in designing the forming and pre-forming sequences. For a given operation, such design essentially
consists of relating the undeformed part properties with that of the
deformed one, either by analytical, numerical predictions or
through empirical relations.
Hardness is the direct measure of resistance given by the mate-
rial to plastic deformation and hence is a better candidate to mea-
sure the deformation behavior of any cold forged product. If it is
possible to predict the hardness distribution at the design stage it-
self, without performing experiments or with minimum experi-
ments, one can monitor and control the cold forging process in the
design stage itself. Moreover, the heterogeneity involved in any
forging operation is influenced by the frictional conditions at the
material-die interface. Therefore it is conceivable to say that hard-
ness distribution during the forging operation will also be affected
by the interface friction conditions. So, predicting the hardness dis-
tribution at the design stage itself, for varied friction conditions,
will be of great concern and an interesting point to be explored.
Brief Description of Friction Tests for Cold Forging
This section briefly describes two friction tests, Ring Compression
Test (RCT) and Double Cup Extrusion (DCE) test, generally used
to evaluate the interface friction condition during forging opera-
tion. Also the literature status on predicting the hardness distribu-
tion during any cold forging operation is presented.
Manuscript received September 20, 2007; accepted for publication March 10,
2008; published online May 2008.1Department of Mechanical Engineering, Indian Institute of Technology,–
Guwahati, Guwahati 781 039, India, e-mail: [email protected] of General Engineering, DMI College of Engineering, Palanchur,
Nazrethpet (P.O.), Chennai 602 103, India.3Department of Production Engineering, Madras Institute of Technology,
Chrompet, Anna University, Chennai 600 044, India.
Journal of Testing and Evaluation, Vol. 36, No. 4Paper ID JTE101443
Available online at: w ww.astm.org
Copyright © 2008 by ASTM International, 100 Barr Harbor Drive, PO Box C700, West Conshohocken, PA 19428-2959. 1
7/28/2019 Influence of Friction in Simple Upsetting
http://slidepdf.com/reader/full/influence-of-friction-in-simple-upsetting 2/13
Ring Compression Test (RCT) —For defining the friction
condition occurring in the metal forming process, it is common
practice to follow either the concept of the interface friction factor
m (m = / k ; where =interface shear strength, and k =shear yield
stress of the material) or the Coulomb’s law concept ( µ = / P ; where
µ=friction coefficient, =interface shear strength, and P =stress nor-
mal to interface) [1]. Since m is independent of normal shear stress
and friction tests are available to evaluate the m value easily duringforging operations, it is widely used to predict the forging behavior.
In order to predict the forging behavior of any material, it is nec-
essary to quantify friction factor during the forming process. There
are various laboratory friction tests to perform this activity. The
most commonly used method for evaluating frictional conditions in
cold forging is the Ring Compression Test (RCT). In this test, a thin
ring specimen is forged axially (or compressed) between two rigid
patterns (top and bottom). As a result, the ring specimen deforms
and metal flows in the radial direction such that for low friction
conditions (good lubrication) the inner diameter of the ring in-
creases like that of solid sample, while for high friction conditions
(poor lubrication) the inner diameter is found to decrease [2]. Dur-
ing compression, the percentage change in inner diameter is mea-
sured for every known reduction in sample thickness or height. Thecalibration curves are drawn between percentage height reduction
and percentage change in inner diameter [1]. Thus the curves cor-
respond to varied friction conditions and therefore can be quanti-
fied in terms of “friction factor– m or friction coefficient– µЈ [3] for
standard ring geometry. The popularly used ring geometry is
ID:OD:H=3:6:2. Since this method (RCT) of friction quantifica-
tion depends only on the physical measurement of the ring sample
and the requirement of forming loads, material properties, etc., are
avoided, it is widely accepted to measure friction during bulk form-
ing operation. Some of the factors that influence the friction factor
(or friction coefficient) in RCT are the ring geometry, barreling ef-
fect, changing friction condition, strain rate, temperature, percent-
age reduction, surface conditions, etc., [4–7] and their effects arelisted below.
1. Effect of geometry: With an increase in ring thickness, the
friction factor was found to increase for the same lubricant
and material. This effect is studied in Ref [4] that for the
same temperature 300 K , reduction percentage (app. 40
to 47 %), and material (Al-5Si forged, cast alloy and
Al-4Mg forged, cast alloy), the change in ring geometry
(thickness) from 6:3:1 to 6:3:2 (OD:ID:H), leads to an in-
crease in the m value for the 6:3:2 case.
2. Effect of barreling: Avitzur in his analyses [8] assumed that
there is no barreling (or bulging) effect during ring forging
and the calibration curves are developed based on this. But
this was disproved by Sofouglu et al. [5,6] that the bulgingeffect showed significant effect on the friction factor devel-
oped during deformation by conducting experiments on
plasticine material. This was demonstrated by monitoring
the inner diameter both at the interface and at the middle of
thickness for every percentage reduction and the friction
coefficient changes are found to be significant.
3. Effect of changing friction conditions at interface: The
RCT calibration curves were developed with the assump-
tion that the friction will remain constant along the inter-
face during forging [8]. But this is not the case as friction
conditions change along the interface. This issue of chang-
ing friction conditions has not been critically analyzed, but
the “constant friction factor assumption” can be adopted as
long as the iteration process is carried out using small stepsin height reduction and the final dimensions obtained in
one step are considered as the initial geometry for the next
step [4].
4. Effect of strain rate: The strain rate effect on the friction
coefficient is also found to be significant from RCT on
plasticine material [5,6] by considering rate dependent and
rate independent FE models.
5. Effect of temperature: The temperature effect is quite inter-
esting. Under lubricated conditions, in general, with an in-
crease in temperature, the friction factor is found to in-
crease [4]. This could be because of the change in viscosity
of the lubricant at higher temperatures. With an increase in
temperature, lubricant viscosity will decrease making it
watery and hence holding of lubricant is reduced resulting
in a higher friction coefficient (or friction factor). But
under dry lubrication, temperature effect is not significant
on friction factor [7]. It should also be noted that in Ref [4],
it is mentioned that the effect of temperature on the friction
condition is uncertain.
In RCT, the die geometry and metal flow are simple, the forging
pressure is relatively low, and the new surface generated during de-
formation is small [9,10]. Therefore, in a ring test the frictional
characteristics of the forging lubricant cannot be adequately evalu-
ated. Also, the friction factor evaluated from RCT can be used
mainly for open die forging operations, where degree of deforma-
tion is less. In order to overcome the problem involved in RCT, a
double cup extrusion test was developed [9,10].
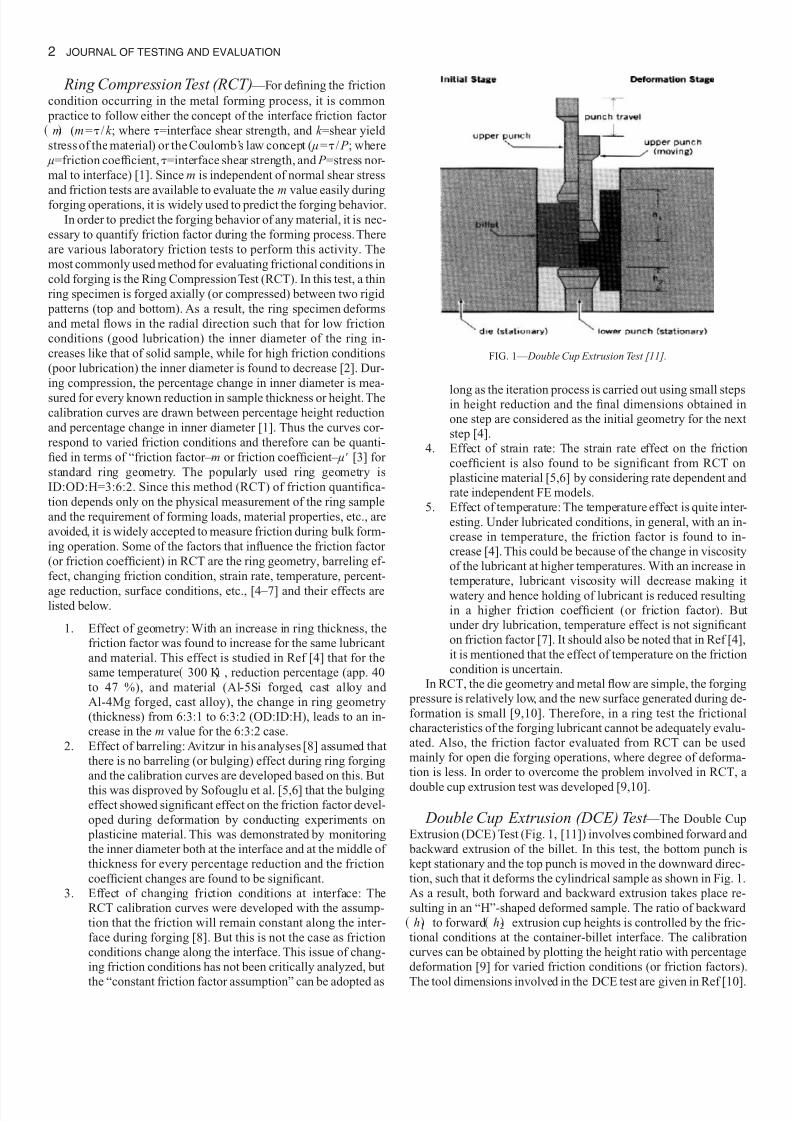
Double Cup Extrusion (DCE) Test —The Double Cup
Extrusion (DCE) Test (Fig. 1, [11]) involves combined forward and
backward extrusion of the billet. In this test, the bottom punch is
kept stationary and the top punch is moved in the downward direc-
tion, such that it deforms the cylindrical sample as shown in Fig. 1.
As a result, both forward and backward extrusion takes place re-
sulting in an “H”-shaped deformed sample. The ratio of backward
h1 to forward h2 extrusion cup heights is controlled by the fric-
tional conditions at the container-billet interface. The calibration
curves can be obtained by plotting the height ratio with percentage
deformation [9] for varied friction conditions (or friction factors).
The tool dimensions involved in the DCE test are given in Ref [10].
FIG. 1— Double Cup Extrusion Test [11].
2 JOURNAL OF TESTING AND EVALUATION
7/28/2019 Influence of Friction in Simple Upsetting
http://slidepdf.com/reader/full/influence-of-friction-in-simple-upsetting 3/13
The DCE test can be simulated using the FE code and the height
ratio h1 / h2 —percentage deformation data can be obtained for
varied friction factors m . By comparing the experimental curves
for different lubricants with that of from FE simulations for differ-
ent friction factors, the m values for lubricants can be evaluated
[10]. Also, by comparing the deformation of grids in the extruded
specimen experimentally and numerically, one can evaluate the
friction factor of the lubricant more accurately [10].
In order to find the suitability of the ring test and double cup
extrusion test, a cold forging process which involves extrusion in
the axial direction and upsetting in the radial direction was ana-
lyzed with grease lubrication whose m values were obtained both
from the ring compression test and double cup extrusion test. The
deformed patterns were compared at different stages of the process
[12]. It was concluded that the m values given by double cup tests
were more appropriate for deformation predictions in cold forging
operations. Ring compression tests are suitable for simple upsetting
operations [12]. Similar to RCT, factors influencing the friction
factor in DCE test, i.e., billet height, reduction ratio, reduction in
area on cup height can be understood from Refs [9,13].
Prediction of Hardness Distribution
Efforts have been taken to predict the hardness change by relating it
to plastic strain during forging. The earlier attempt was made by
Hartley et al. [14], where in the hardness distribution during Rim
Disk forging was predicted by knowing the stress distribution
by FE analyses and relating the stress to hardness by a known
(Hardness-) relation. But the hardness prediction is not accurate
at higher deformation levels. A better approach to predict the hard-
ness distribution was suggested by Kim et al. [15]. In their work,
the hardness-effective strain distribution during a simple upsetting
test was initially established. Hardness was obtained from experi-
ments and effective strain from FE simulations. Then the effective
strain pattern at known regions during cup extrusion was obtained by FE simulations and hardness pattern at the same regions were
established using the empirical relationship developed earlier by
upsetting tests. Their approach showed good agreement between
the experimental and predicted hardness pattern during cup extru-
sion. Also in their work, an attempt has been made to study the
effect of varied friction conditions on the hardness and effective
strain variation during simple upsetting. Petruska et al. [16] per-
formed similar work, but their aim was to compare the hardness
prediction accuracy between hardness-mean strain and hardness-
local strain relations during forward extrusion. Both of them agreed
well with each other. Recently, analytical models were developed
for Brinell hardness and Vickers hardness by Sonmez et al. [17]
such that properties obtained from simple compression tests K , ncan be directly related to hardness, so that hardness distribution can
be evaluated independent of material and deformation. These ana-
lytically predicted hardness distributions were related to effective
strain predictions from FE simulation empirically. From this, a
hardness pattern can be predicted for any cold working operation. It
is found that their predictions were accurate and the models devel-
oped were quite satisfactory.
The authors feel important that the following issues can be ad-
dressed during the prediction of the hardness pattern in any cold
forging process.
• The above presented literature relates hardness and effective
strain quantities without knowing the effect of varied friction
conditions on them during the initial upsetting process. The
basis for projecting this as an issue is because of the depen-
dency of hardness and strain evolution on the varying fric-
tion conditions (or lubricants) during upsetting and hence
supporting the necessity of understanding the effect of dif-
ferent lubricating conditions on the hardness, effective strain
distribution in a simple upsetting process.Though an attempt
has beenmade in Kim et al. [15] to address this issue to some
extent, further critical experimental analyses is necessary to
make unified conclusions.• Relating hardness and plastic strain using a simple upsetting
operation and predicting the hardness distribution in a typi-
cal forging process using this relationship is explored only
for a particular lubricating condition. This methodology is
not examined for varied friction conditions. From the pub-
lished literature, one can say that the same procedure has to
be adopted for each lubricant to predict the hardness distri-
bution, which is quite time consuming and cumbersome.
Hence, exploring and understanding the applicability of the
hardness-plastic strain relationship for varied lubricating
conditions is an important issue.
• The hardness-plastic strain relationship was developed from
a simple upsetting process involving only radial metal flow.The applicability of this relation for a cold forging process,
say cup extrusion, involving axial metal flow is the general
trend. How good the developed empirical relation is for pre-
dicting the hardness distribution in a forging process involv-
ing both radial and axial metal flow can also be addressed.
By considering the above issues as important, the present work
aims at:
1. Investigating the influence of various lubricants (or friction
conditions) on the hardness and effective strain variation
during the simple upsetting operation.
2. Inter-relating hardness and effective strain evolution in a
simple upsetting operation for different lubricants and vali-dating the applicability of this empirical relation for chang-
ing lubricating conditions.
3. Validating the applicability of the developed empirical re-
lation for predicting the hardness distribution in a cold
forging process which involves both axial and radial metal
flow (for different lubricating conditions).
Influence of Varied Friction Conditions on the
Hardness, Effective Strain Distribution During
Simple Upsetting Operation
This part of the analysis deals with the effect of friction on the
variation of hardness and effective strain in a simple upsetting pro-
cess for different lubricating conditions. Different lubricants, viz.,
castor oil m =0.33 , soap m =0.25 , grease m =0.2 , and Teflon
m =0.16 are used for performing the experiments. Here, the fric-
tion factor m values for the lubricants were obtained through ring
compression tests conducted earlier [18].
Selected Material
Commercially available pure aluminum was used as the billet ma-
terial in this study. In order to ensure identical properties all the test
specimens were annealed at 623 K for a period of one hour.
NARAYANAN ET AL. ON INFLUENCE OF FRICTION IN A COLD FORGED PRODUCT 3
7/28/2019 Influence of Friction in Simple Upsetting
http://slidepdf.com/reader/full/influence-of-friction-in-simple-upsetting 4/13
Annealing was conducted after the test specimens were machined.
In order to ensure uniform hardness distribution before deforma-
tion, hardness was measured at three different points in the axial
and radial directions.Average hardness of 60 VHN was found in all
the test specimens with a variation of ±2 VHN. Cylindrical speci-
mens with the dimension of 20 mm diameter and 30 mm height
were prepared for conducting simple upsetting tests.
Flow Curve of the Testing Material
In order to perform the FE simulations, the material properties of
the billet (strength coefficient, K, and strain hardening coefficient,
n) and stress-strain values should be given as input. Basically, it is
assumed here that the metal flow in a cold forging operation follows
the constitutive equation, = K T n where =true stress (MPa), T
=true strain, K = strength coefficient (MPa), n =strain hardening
exponent.
In order to establish this constitutive equation, a true stress-true
strain graph was drawn by conducting compression tests on pure
aluminum billet of size 20 mm diameter and 30 mm height. Load
and height deformation values were obtained from a 30-ton hydrau-lic press. By using volume constancy during plastic deformation,
true stress and true strain values were calculated. A graph was
drawn between true stress and true strain in log-log plot. The slope
of the line gives the n value and the stress at T =1.0 gives the K
value. Teflon was used as the lubricant for compression testing
which in general gives homogeneous deformation with a lesser
bulging effect. The bulging effect is neglected for simplicity.
Finally, the constitutive equation was found to be
= 180T 0.13
This constitutive equation was used as the input for the FE simula-tions.
Simple Upsetting Test
Commercially available pure aluminum billet (annealed) of size
20 mm diameter and 30 mm height was compressed for different
lubricating conditions in a 30-ton hydraulic press. The four lubri-
cants selected for the upsetting process are castor oil, grease, Te-
flon, and soap. The crosshead speed was maintained at 0.1 mm/s.
Upsetting was conducted for 50 % height reduction of the initial
billet. After 50 % height reduction, upset specimens were sectioned
axially into two halves and the flat surface was polished. Hardness
values were measured along the axial and radial directions.
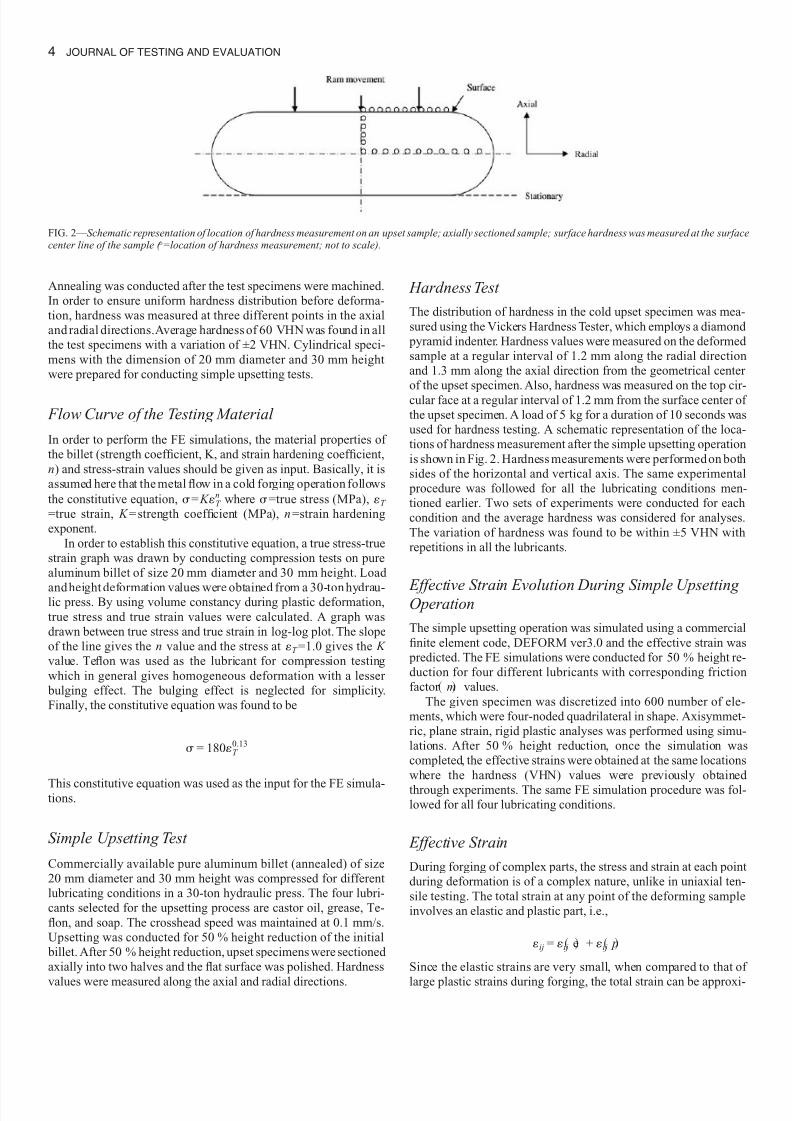
Hardness Test
The distribution of hardness in the cold upset specimen was mea-
sured using the Vickers Hardness Tester, which employs a diamond
pyramid indenter. Hardness values were measured on the deformed
sample at a regular interval of 1.2 mm along the radial direction
and 1.3 mm along the axial direction from the geometrical center
of the upset specimen. Also, hardness was measured on the top cir-
cular face at a regular interval of 1.2 mm from the surface center of
the upset specimen. A load of 5 kg for a duration of 10 seconds was
used for hardness testing. A schematic representation of the loca-
tions of hardness measurement after the simple upsetting operation
is shown in Fig. 2. Hardness measurements were performed on both
sides of the horizontal and vertical axis. The same experimental
procedure was followed for all the lubricating conditions men-
tioned earlier. Two sets of experiments were conducted for each
condition and the average hardness was considered for analyses.
The variation of hardness was found to be within ±5 VHN with
repetitions in all the lubricants.
Effective Strain Evolution During Simple Upsetting Operation
The simple upsetting operation was simulated using a commercial
finite element code, DEFORM ver3.0 and the effective strain was
predicted. The FE simulations were conducted for 50 % height re-
duction for four different lubricants with corresponding friction
factor m values.
The given specimen was discretized into 600 number of ele-
ments, which were four-noded quadrilateral in shape. Axisymmet-
ric, plane strain, rigid plastic analyses was performed using simu-
lations. After 50 % height reduction, once the simulation was
completed, the effective strains were obtained at the same locations
where the hardness (VHN) values were previously obtained
through experiments. The same FE simulation procedure was fol-lowed for all four lubricating conditions.
Effective Strain
During forging of complex parts, the stress and strain at each point
during deformation is of a complex nature, unlike in uniaxial ten-
sile testing. The total strain at any point of the deforming sample
involves an elastic and plastic part, i.e.,
ij = ij e + ij p
Since the elastic strains are very small, when compared to that of
large plastic strains during forging, the total strain can be approxi-
FIG. 2— Schematic representation of location of hardness measurement on an upset sample; axially sectioned sample; surface hardness was measured at the surfacecenter line of the sample ( =location of hardness measurement; not to scale).
4 JOURNAL OF TESTING AND EVALUATION
7/28/2019 Influence of Friction in Simple Upsetting
http://slidepdf.com/reader/full/influence-of-friction-in-simple-upsetting 5/13
mated to plastic strains only and hence, ij Ϸij p .The 3-D nature of plastic strain during forging can be repre-
sented by a single quantity “Effective strain=” which is a func-
tion of plastic strains in normal and shear directions. The effective
strain can be obtained by equating the plastic work done in 1-D to
the plastic work done in the general state, i.e.,
d = 1d 1 + 2d 2 + 3d 3
So, the plastic strain increment can be written as, d = 1 / 1d 1
+2d 2 +3d 3 .
Now, by following von Mises plasticity theory, and normality
condition, one can find the strain increments, viz., d 1, d 2, d 3.
From this, the plastic strain increment can be obtained as, d
= 2 / 3 d 12 + d 22 + d 32 1/2.Representing in general coordinate system,
d = 2/3 d 112 + d 22
2 + d 332 + 2d 12
2 + 2d 132 + 2d 23
2 1/2
Finally in terms of total plastic strains,
Effective strain, = 2 / 3 112 +22
2 +332 + 212
2 + 2132 + 223
2 1/2
Results of Upsetting Experiments
The variation of hardness and effective strain in the radial and axial
directions with respect to the distance from the geometrical center
to the periphery of the billet for different lubricants were analyzed
and the results are given below.
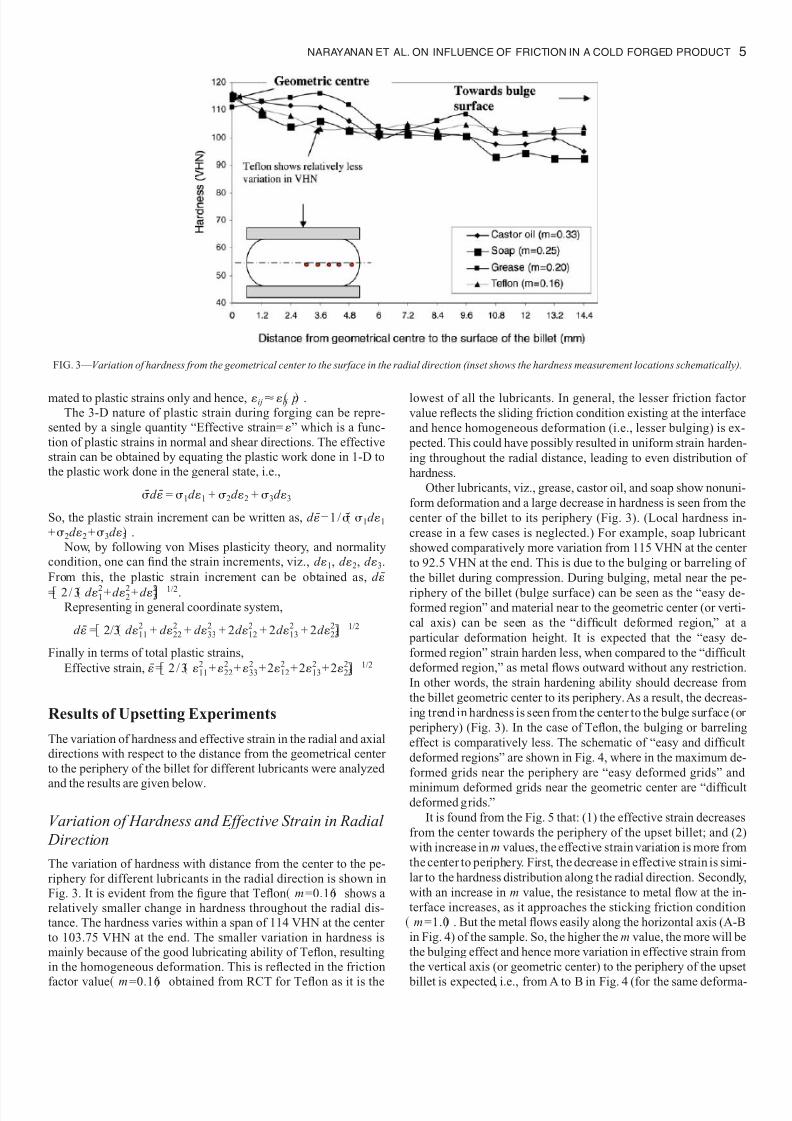
Variation of Hardness and Effective Strain in Radial
Direction
The variation of hardness with distance from the center to the pe-
riphery for different lubricants in the radial direction is shown in
Fig. 3. It is evident from the figure that Teflon m =0.16 shows a
relatively smaller change in hardness throughout the radial dis-
tance. The hardness varies within a span of 114 VHN at the center
to 103.75 VHN at the end. The smaller variation in hardness is
mainly because of the good lubricating ability of Teflon, resulting
in the homogeneous deformation. This is reflected in the friction
factor value m =0.16 obtained from RCT for Teflon as it is the
lowest of all the lubricants. In general, the lesser friction factor
value reflects the sliding friction condition existing at the interface
and hence homogeneous deformation (i.e., lesser bulging) is ex-
pected. This could have possibly resulted in uniform strain harden-
ing throughout the radial distance, leading to even distribution of
hardness.
Other lubricants, viz., grease, castor oil, and soap show nonuni-
form deformation and a large decrease in hardness is seen from the
center of the billet to its periphery (Fig. 3). (Local hardness in-
crease in a few cases is neglected.) For example, soap lubricant
showed comparatively more variation from 115 VHN at the center
to 92.5 VHN at the end. This is due to the bulging or barreling of
the billet during compression. During bulging, metal near the pe-
riphery of the billet (bulge surface) can be seen as the “easy de-formed region” and material near to the geometric center (or verti-
cal axis) can be seen as the “difficult deformed region,” at a
particular deformation height. It is expected that the “easy de-
formed region” strain harden less, when compared to the “difficult
deformed region,” as metal flows outward without any restriction.
In other words, the strain hardening ability should decrease from
the billet geometric center to its periphery. As a result, the decreas-
ing trend in hardness is seen from the center to the bulge surface (or
periphery) (Fig. 3). In the case of Teflon, the bulging or barreling
effect is comparatively less. The schematic of “easy and difficult
deformed regions” are shown in Fig. 4, where in the maximum de-
formed grids near the periphery are “easy deformed grids” and
minimum deformed grids near the geometric center are “difficultdeformed grids.”
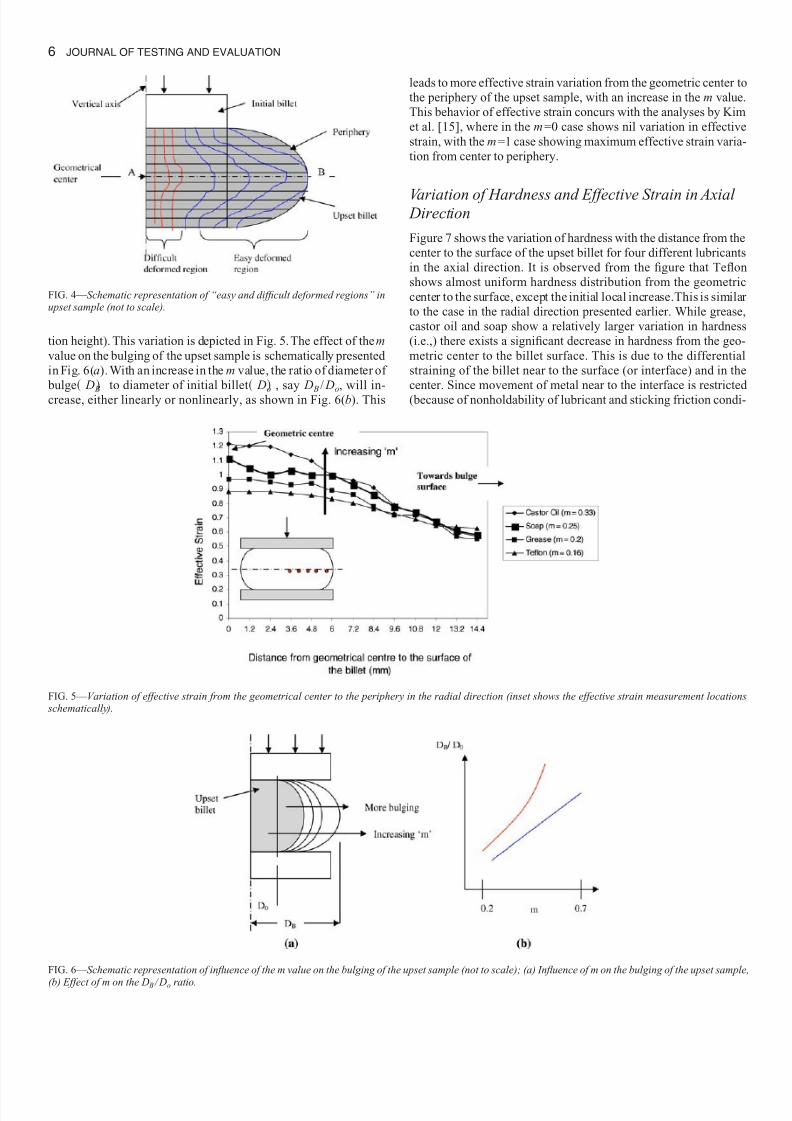
It is found from the Fig. 5 that: (1) the effective strain decreases
from the center towards the periphery of the upset billet; and (2)
with increase in m values, the effective strain variation is more from
the center to periphery. First, the decrease in effective strain is simi-
lar to the hardness distribution along the radial direction. Secondly,
with an increase in m value, the resistance to metal flow at the in-
terface increases, as it approaches the sticking friction condition
m =1.0 . But the metal flows easily along the horizontal axis (A-B
in Fig. 4) of the sample. So, the higher the m value, the more will be
the bulging effect and hence more variation in effective strain from
the vertical axis (or geometric center) to the periphery of the upset
billet is expected, i.e., from A to B in Fig. 4 (for the same deforma-
FIG. 3— Variation of hardness from the geometrical center to the surface in the radial direction (inset shows the hardness measurement locations schematically).
NARAYANAN ET AL. ON INFLUENCE OF FRICTION IN A COLD FORGED PRODUCT 5
7/28/2019 Influence of Friction in Simple Upsetting
http://slidepdf.com/reader/full/influence-of-friction-in-simple-upsetting 6/13
tion height). This variation is depicted in Fig. 5. The effect of the m
value on the bulging of the upset sample is schematically presented
in Fig. 6(a). With an increase in the m value, the ratio of diameter of
bulge
D B
to diameter of initial billet
Do
, say D B
/ Do
, will in-
crease, either linearly or nonlinearly, as shown in Fig. 6(b). This
leads to more effective strain variation from the geometric center to
the periphery of the upset sample, with an increase in the m value.
This behavior of effective strain concurs with the analyses by Kim
et al. [15], where in the m =0 case shows nil variation in effective
strain, with the m =1 case showing maximum effective strain varia-
tion from center to periphery.
Variation of Hardness and Effective Strain in Axial Direction
Figure 7 shows the variation of hardness with the distance from the
center to the surface of the upset billet for four different lubricants
in the axial direction. It is observed from the figure that Teflon
shows almost uniform hardness distribution from the geometric
center to the surface, except the initial local increase.This is similar
to the case in the radial direction presented earlier. While grease,
castor oil and soap show a relatively larger variation in hardness
(i.e.,) there exists a significant decrease in hardness from the geo-
metric center to the billet surface. This is due to the differential
straining of the billet near to the surface (or interface) and in the
center. Since movement of metal near to the interface is restricted
(because of nonholdability of lubricant and sticking friction condi-
FIG. 4— Schematic representation of “easy and difficult deformed regions” inupset sample (not to scale).
FIG. 5— Variation of effective strain from the geometrical center to the periphery in the radial direction (inset shows the effective strain measurement locations schematically).
FIG. 6— Schematic representation of influence of the m value on the bulging of the upset sample (not to scale); (a) Influence of m on the bulging of the upset sample,
(b) Effect of m on the D B / Do ratio.
6 JOURNAL OF TESTING AND EVALUATION

7/28/2019 Influence of Friction in Simple Upsetting
http://slidepdf.com/reader/full/influence-of-friction-in-simple-upsetting 7/13
tion), deformation is less in that region, whereas metal deforms
easily without any restriction away from the interface. As a result,
the material hardening is severe near to the horizontal axis (or geo-
metric center), rather than at the interface. Hence, when hardness ismeasured in the axial direction from the geometric center to the
surface, it is likely to decrease as shown in Fig. 7.
One can imagine this similar to the deformed grids presented in
Fig. 4. The schematic of the deformed grid pattern for this case is
shown in Fig. 8, wherein the elements near to the geometric center
(or horizontal axis) deform more when compared to that of near the
interface. As a result, the hardness decreases from the center to the
interface (or billet surface). One should observe similar hardness
variation behavior, even if the hardness locations are other than the
vertical center axis. For example, if the hardness values are mea-
sured along the line AA as shown in Fig. 8(b), a similar decrease in
hardness is expected from the horizontal axis to the interface. The
hardness variation in the axial direction correlates with what is ob-served in Ref [15], wherein hardness decreases from the center to
the interface.
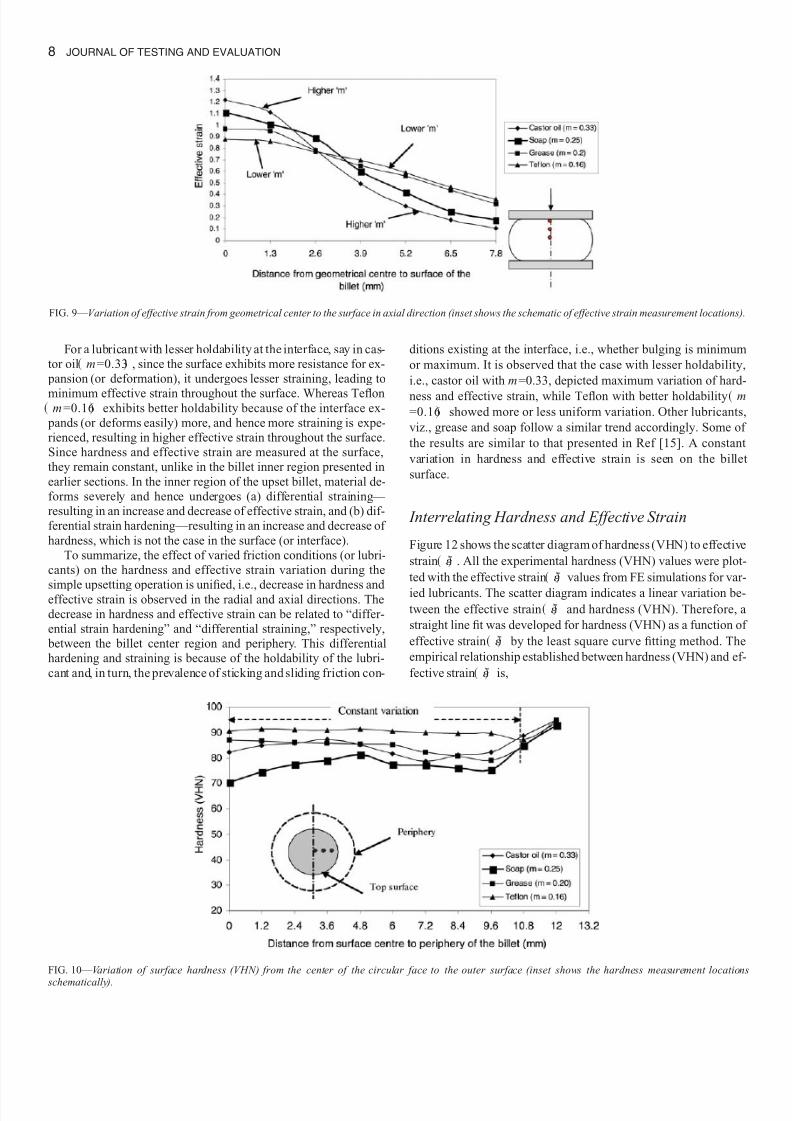
Figure 9 shows the variation of effective strain with respect to
distance from the center to the periphery of the billet in the axial
direction. It is understood from the figure that the effective strain
decreases from the center to the periphery of the upset specimen. It
also demonstrates that higher friction factor lubricant, i.e., castor
oil, m =0.33, generates higher effective strain at the center and
lower effective strain at the interface i.e., the range of effective
strain variation in the axial direction increases with increase in fric-
tion factor value. Teflon with m =0.16 shows lesser variation in ef-
fective strain (Fig. 9). One can visualize this as a result of inhomo-
geneous deformation (i.e., more bulging) occurring due to thehigher friction condition existing at the interface when castor oil is
used as the lubricant, whereas this is minimal in the case of Teflon.
Moreover, since castor oil is a liquid lubricant, its holdability dur-
ing the forging operation is of greater concern, which may not be an
issue in the case of Teflon.
Variation of Hardness and Effective Strain on the
Flat Surface (or Interface)
The variation of hardness (VHN) and effective strain from the cen-
ter to the periphery on the flat surface of the billet is presented in
Figs. 10 and 11, respectively. Teflon and other lubricants as wellshow more or less constant variation in hardness and effective
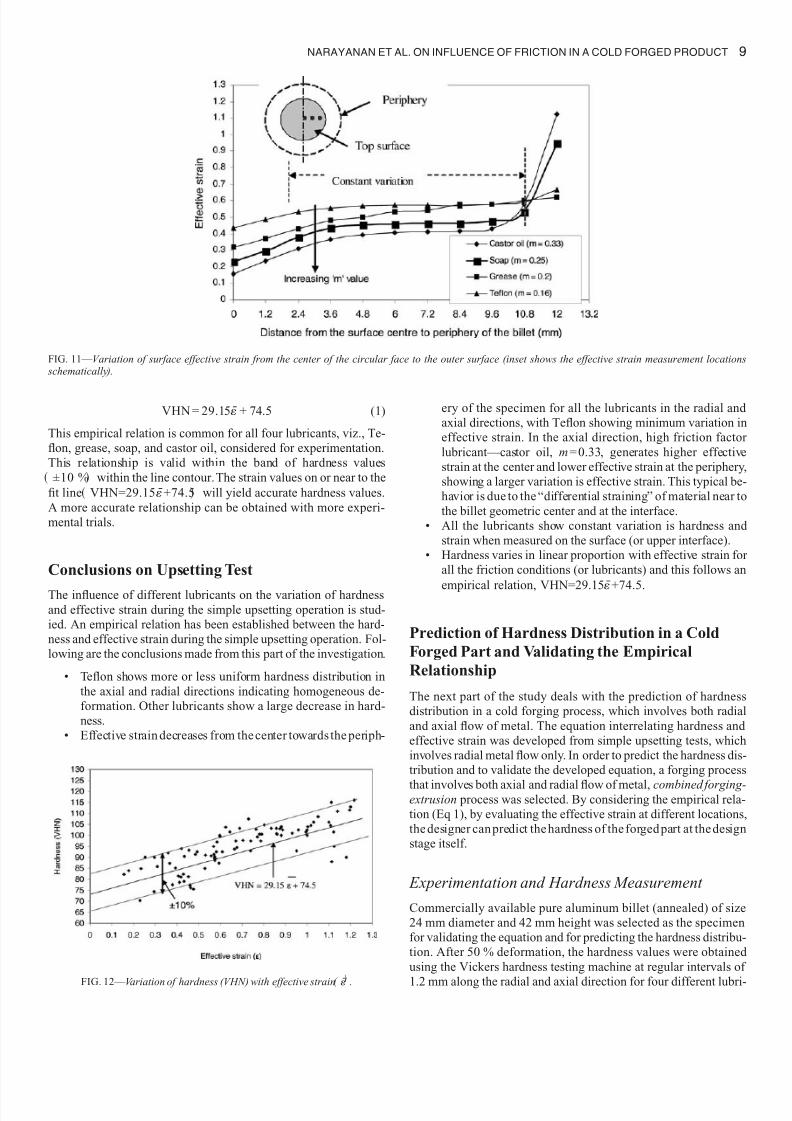
strain throughout the surface, except at the end. An important ob-
servation is that with increase in the m value, the effective strain
variation on the surface is decreasing. For example, in Fig. 11, cas-
tor oil with a higher m value m =0.33 shows lesser effective strain
throughout the surface, in comparison to that of Teflon with a lower
m value m =0.16 . This typical behavior can be related to the hold-
ability of the lubricant and, in turn, existence of sticking or sliding
friction conditions at the interface.
FIG. 7— Variation of hardness from geometrical center to the surface in the axial direction (inset shows the hardness measurement locations schematically).
FIG. 8— Schematic representation of initial billet and deformed grids during upsetting; Initial undeformed billet with grid pattern, (b) Deformed grids in one-quarter
of the upset sample (not to scale).
NARAYANAN ET AL. ON INFLUENCE OF FRICTION IN A COLD FORGED PRODUCT 7
7/28/2019 Influence of Friction in Simple Upsetting
http://slidepdf.com/reader/full/influence-of-friction-in-simple-upsetting 8/13
For a lubricant with lesser holdability at the interface, say in cas-
tor oil m =0.33 , since the surface exhibits more resistance for ex-
pansion (or deformation), it undergoes lesser straining, leading to
minimum effective strain throughout the surface. Whereas Teflon m =0.16 exhibits better holdability because of the interface ex-
pands (or deforms easily) more, and hence more straining is expe-
rienced, resulting in higher effective strain throughout the surface.
Since hardness and effective strain are measured at the surface,
they remain constant, unlike in the billet inner region presented in
earlier sections. In the inner region of the upset billet, material de-
forms severely and hence undergoes (a) differential straining—
resulting in an increase and decrease of effective strain, and (b) dif-
ferential strain hardening—resulting in an increase and decrease of
hardness, which is not the case in the surface (or interface).
To summarize, the effect of varied friction conditions (or lubri-
cants) on the hardness and effective strain variation during the
simple upsetting operation is unified, i.e., decrease in hardness and effective strain is observed in the radial and axial directions. The
decrease in hardness and effective strain can be related to “differ-
ential strain hardening” and “differential straining,” respectively,
between the billet center region and periphery. This differential
hardening and straining is because of the holdability of the lubri-
cant and, in turn, the prevalence of sticking and sliding friction con-
ditions existing at the interface, i.e., whether bulging is minimum
or maximum. It is observed that the case with lesser holdability,
i.e., castor oil with m =0.33, depicted maximum variation of hard-
ness and effective strain, while Teflon with better holdability m=0.16 showed more or less uniform variation. Other lubricants,
viz., grease and soap follow a similar trend accordingly. Some of
the results are similar to that presented in Ref [15]. A constant
variation in hardness and effective strain is seen on the billet
surface.
Interrelating Hardness and Effective Strain
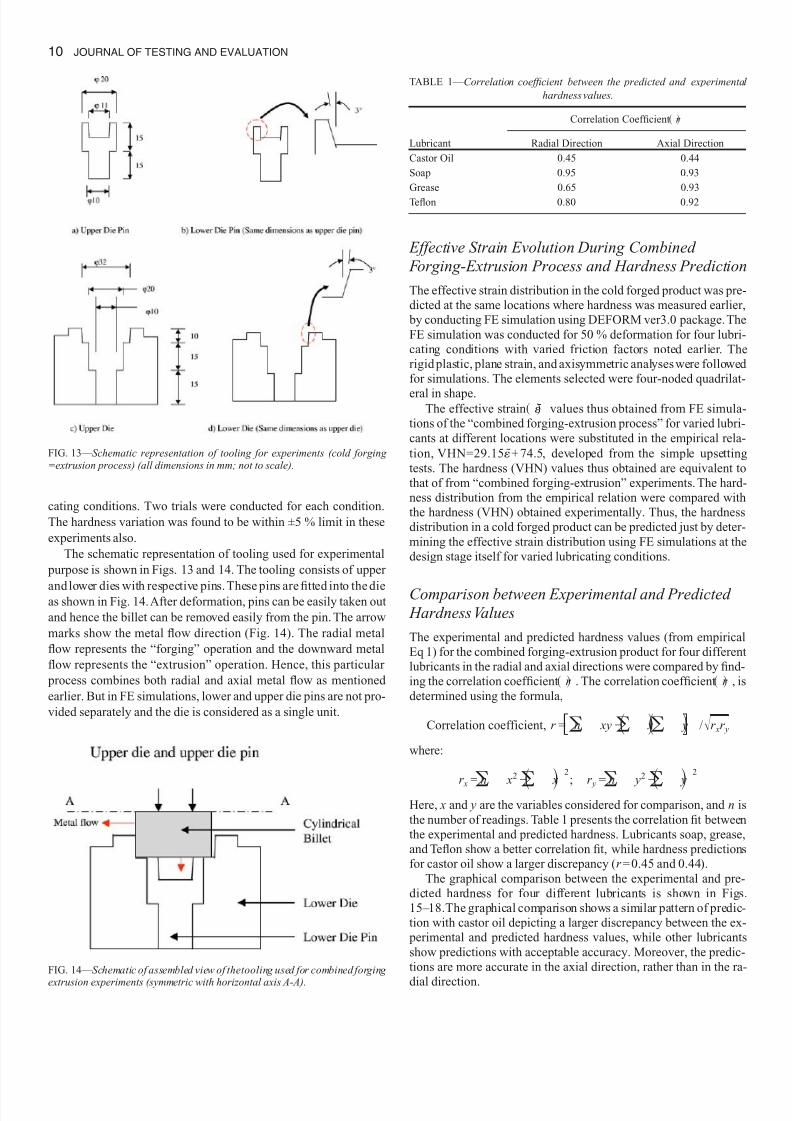
Figure 12 shows the scatter diagram of hardness (VHN) to effective
strain . All the experimental hardness (VHN) values were plot-
ted with the effective strain values from FE simulations for var-
ied lubricants. The scatter diagram indicates a linear variation be-tween the effective strain and hardness (VHN). Therefore, a
straight line fit was developed for hardness (VHN) as a function of
effective strain by the least square curve fitting method. The
empirical relationship established between hardness (VHN) and ef-
fective strain is,
FIG. 9— Variation of effective strain from geometrical center to the surface in axial direction (inset shows the schematic of effective strain measurement locations).
FIG. 10— Variation of surface hardness (VHN) from the center of the circular face to the outer surface (inset shows the hardness measurement locations
schematically).
8 JOURNAL OF TESTING AND EVALUATION
7/28/2019 Influence of Friction in Simple Upsetting
http://slidepdf.com/reader/full/influence-of-friction-in-simple-upsetting 9/13
VHN = 29.15 + 74.5 (1)
This empirical relation is common for all four lubricants, viz., Te-
flon, grease, soap, and castor oil, considered for experimentation.
This relationship is valid within the band of hardness values
±10 % within the line contour.The strain values on or near to the
fit line VHN=29.15 +74.5 will yield accurate hardness values.
A more accurate relationship can be obtained with more experi-
mental trials.
Conclusions on Upsetting Test
The influence of different lubricants on the variation of hardness
and effective strain during the simple upsetting operation is stud-
ied. An empirical relation has been established between the hard-
ness and effective strain during the simple upsetting operation. Fol-
lowing are the conclusions made from this part of the investigation.
• Teflon shows more or less uniform hardness distribution in
the axial and radial directions indicating homogeneous de-
formation. Other lubricants show a large decrease in hard-
ness.
• Effective strain decreases from the center towards the periph-
ery of the specimen for all the lubricants in the radial and
axial directions, with Teflon showing minimum variation in
effective strain. In the axial direction, high friction factor
lubricant—castor oil, m = 0.33, generates higher effective
strain at the center and lower effective strain at the periphery,
showing a larger variation is effective strain. This typical be-
havior is due to the “differential straining” of material near to
the billet geometric center and at the interface.
• All the lubricants show constant variation is hardness and
strain when measured on the surface (or upper interface).
• Hardness varies in linear proportion with effective strain for
all the friction conditions (or lubricants) and this follows an
empirical relation, VHN=29.15
¯ +74.5.
Prediction of Hardness Distribution in a Cold
Forged Part and Validating the Empirical
Relationship
The next part of the study deals with the prediction of hardness
distribution in a cold forging process, which involves both radial
and axial flow of metal. The equation interrelating hardness and
effective strain was developed from simple upsetting tests, which
involves radial metal flow only. In order to predict the hardness dis-
tribution and to validate the developed equation, a forging process
that involves both axial and radial flow of metal, combined forging-extrusion process was selected. By considering the empirical rela-
tion (Eq 1), by evaluating the effective strain at different locations,
the designer can predict the hardness of the forged part at the design
stage itself.
Experimentation and Hardness Measurement
Commercially available pure aluminum billet (annealed) of size
24 mm diameter and 42 mm height was selected as the specimen
for validating the equation and for predicting the hardness distribu-
tion. After 50 % deformation, the hardness values were obtained
using the Vickers hardness testing machine at regular intervals of
1.2 mm along the radial and axial direction for four different lubri-
FIG. 11— Variation of surface effective strain from the center of the circular face to the outer surface (inset shows the effective strain measurement locations schematically).
FIG. 12— Variation of hardness (VHN) with effective strain ¯ .
NARAYANAN ET AL. ON INFLUENCE OF FRICTION IN A COLD FORGED PRODUCT 9
7/28/2019 Influence of Friction in Simple Upsetting
http://slidepdf.com/reader/full/influence-of-friction-in-simple-upsetting 10/13
cating conditions. Two trials were conducted for each condition.
The hardness variation was found to be within ±5 % limit in these
experiments also.
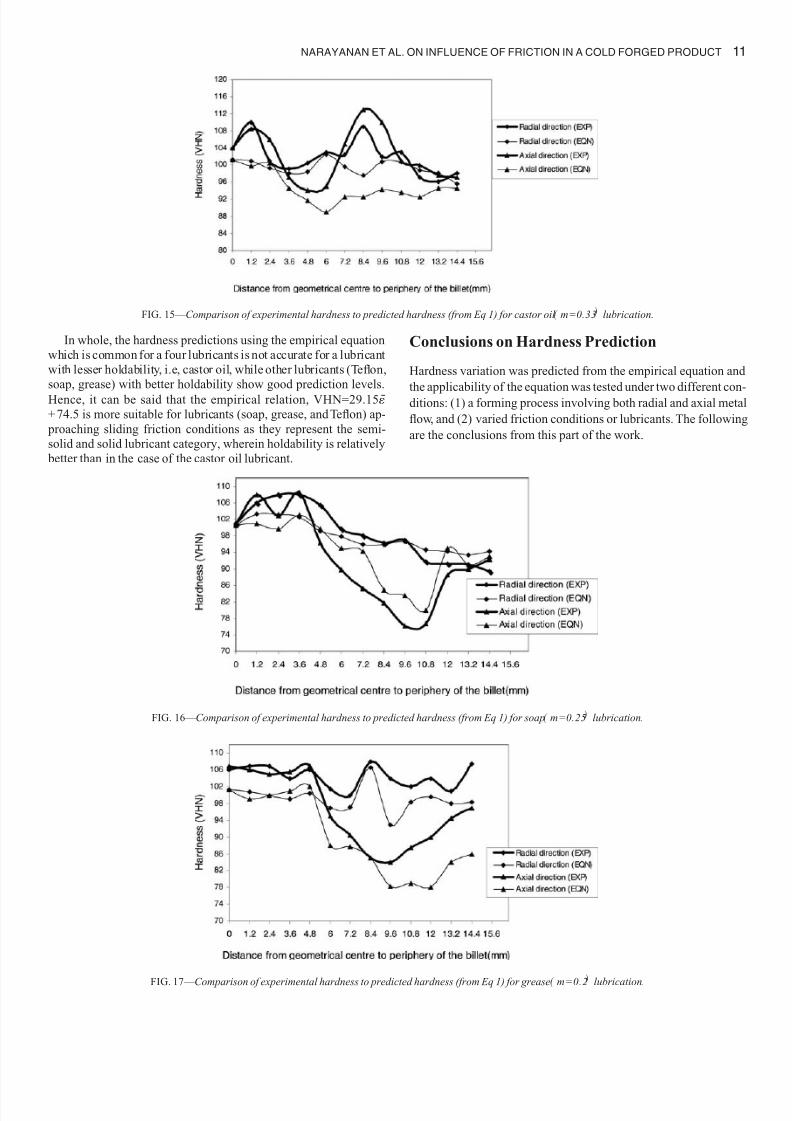
The schematic representation of tooling used for experimental
purpose is shown in Figs. 13 and 14. The tooling consists of upper
and lower dies with respective pins. These pins are fitted into the dieas shown in Fig. 14.After deformation, pins can be easily taken out
and hence the billet can be removed easily from the pin. The arrow
marks show the metal flow direction (Fig. 14). The radial metal
flow represents the “forging” operation and the downward metal
flow represents the “extrusion” operation. Hence, this particular
process combines both radial and axial metal flow as mentioned
earlier. But in FE simulations, lower and upper die pins are not pro-
vided separately and the die is considered as a single unit.
Effective Strain Evolution During Combined
Forging-Extrusion Process and Hardness Prediction
The effective strain distribution in the cold forged product was pre-
dicted at the same locations where hardness was measured earlier,
by conducting FE simulation using DEFORM ver3.0 package. The
FE simulation was conducted for 50 % deformation for four lubri-
cating conditions with varied friction factors noted earlier. The
rigid plastic, plane strain, and axisymmetric analyses were followed
for simulations. The elements selected were four-noded quadrilat-
eral in shape.The effective strain values thus obtained from FE simula-
tions of the “combined forging-extrusion process” for varied lubri-
cants at different locations were substituted in the empirical rela-
tion, VHN=29.15 + 74.5, developed from the simple upsetting
tests. The hardness (VHN) values thus obtained are equivalent to
that of from “combined forging-extrusion” experiments. The hard-
ness distribution from the empirical relation were compared with
the hardness (VHN) obtained experimentally. Thus, the hardness
distribution in a cold forged product can be predicted just by deter-
mining the effective strain distribution using FE simulations at the
design stage itself for varied lubricating conditions.
Comparison between Experimental and Predicted Hardness Values
The experimental and predicted hardness values (from empirical
Eq 1) for the combined forging-extrusion product for four different
lubricants in the radial and axial directions were compared by find-
ing the correlation coefficient r . The correlation coefficient r , is
determined using the formula,
Correlation coefficient, r = n xy − x y /ͱ r xr y
where:
r x
= n
x2 −
x
2
; r y
= n
y2 −
y
2
Here, x and y are the variables considered for comparison, and n is
the number of readings. Table 1 presents the correlation fit between
the experimental and predicted hardness. Lubricants soap, grease,
and Teflon show a better correlation fit, while hardness predictions
for castor oil show a larger discrepancy (r = 0.45 and 0.44).
The graphical comparison between the experimental and pre-
dicted hardness for four different lubricants is shown in Figs.
15–18.The graphical comparison shows a similar pattern of predic-
tion with castor oil depicting a larger discrepancy between the ex-
perimental and predicted hardness values, while other lubricants
show predictions with acceptable accuracy. Moreover, the predic-
tions are more accurate in the axial direction, rather than in the ra-
dial direction.
FIG. 13— Schematic representation of tooling for experiments (cold forging =extrusion process) (all dimensions in mm; not to scale).
FIG. 14— Schematic of assembled view of thetooling used for combined forging
extrusion experiments (symmetric with horizontal axis A-A).
TABLE 1— Correlation coefficient between the predicted and experimental
hardness values.
Correlation Coefficient r
Lubricant Radial Direction Axial Direction
Castor Oil 0.45 0.44
Soap 0.95 0.93
Grease 0.65 0.93
Teflon 0.80 0.92
10 JOURNAL OF TESTING AND EVALUATION
7/28/2019 Influence of Friction in Simple Upsetting
http://slidepdf.com/reader/full/influence-of-friction-in-simple-upsetting 11/13
In whole, the hardness predictions using the empirical equation
which is common for a four lubricants is not accurate for a lubricant
with lesser holdability, i.e, castor oil, while other lubricants (Teflon,
soap, grease) with better holdability show good prediction levels.
Hence, it can be said that the empirical relation, VHN=29.15
+ 74.5 is more suitable for lubricants (soap, grease, and Teflon) ap-
proaching sliding friction conditions as they represent the semi-
solid and solid lubricant category, wherein holdability is relatively
better than in the case of the castor oil lubricant.
Conclusions on Hardness Prediction
Hardness variation was predicted from the empirical equation and
the applicability of the equation was tested under two different con-ditions: (1) a forming process involving both radial and axial metal
flow, and (2) varied friction conditions or lubricants. The following
are the conclusions from this part of the work.
FIG. 15— Comparison of experimental hardness to predicted hardness (from Eq 1) for castor oil m=0.33 lubrication.
FIG. 16— Comparison of experimental hardness to predicted hardness (from Eq 1) for soap m=0.25 lubrication.
FIG. 17— Comparison of experimental hardness to predicted hardness (from Eq 1) for grease m=0.2 lubrication.
NARAYANAN ET AL. ON INFLUENCE OF FRICTION IN A COLD FORGED PRODUCT 11
7/28/2019 Influence of Friction in Simple Upsetting
http://slidepdf.com/reader/full/influence-of-friction-in-simple-upsetting 12/13
• The empirical relation, VHN= 29.15 + 74.5, established
during the simple upsetting operation (having only radial
metal flow) is found to be good for hardness prediction dur-
ing the combined forging-extrusion process, involving both
radial and axial metal flow. The predictions are more depen-dent on the lubricating conditions at the interface, rather than
the typical forging process used for prediction.
• The empirical relationship between hardness and effective
strain obtained from the simple upsetting operation, which is
common for all the lubricants, predicts the hardness distribu-
tion during the forging-extrusion process with moderate ac-
curacy. In general, predictions are good in the case of lubri-
cants with better holdability, viz., Teflon, soap, grease, rather
than a lubricant with lesser holdability, i.e., castor oil. This
can be related to sticking and sliding friction conditions ex-
isting at the interface.
Perspective
• The hardness and effective strain variation for four differ-
ent lubricants are related to sticking and sliding friction
conditions resulting in differential strain hardening and
differential straining during upsetting operation. Some of
the results are similar to that presented in Kim et al. [15].
A similar trend is expected in the case of other lubricants
also and, hence, one can visualize the influence of lubri-
cants on the hardness and effective strain during the up-
setting operation to be similar to that presented in this
study.
• The friction factor of lubricants used for the simulation
purpose in this work were evaluated from the ring com- pression test, which may not accurately represent the in-
terfacial friction conditions during closed die forging, as
is the case in the combined forging-extrusion process. It
is expected that the friction factor obtained from the
double cup extrusion test may predict the forging behav-
ior accurately.
• Even in the case of RCT, the constant friction factor ap-
proach is considered. But the interface friction changes
with deformation and, hence, evaluating the varying fric-
tion factor will improve the accuracy of predictions.
• Also, one can develop separate empirical equations for
varied lubricating conditions to improve the prediction
accuracy.
References
[1] Dieter, G. E., Mechanical Metallurgy, Tata Mc-Graw Hill,
1988, p. 751.
[2] Robinson, T., Ou, H., and Armstrong, C. G., “Study on Ring
Compression Test Using Physical Modeling and FE Simula-
tion,” J. Mater. Process. Technol., Vol. 153-154, 2004, pp. 54–
59.
[3] Male, A. T. and Cockcroft, M. G., “A Method for the Deter-
mination of the Coefficient of Friction of Metals Under Con-
dition of Bulk Plastic Deformation,” Journal of Institute of
Metals, Vol. 64-65, 1993, p. 38.
[4] Rao, K. P. and Sivaram, K., “A Review of Ring Compression
Testing and Applicability of the Calibration Curves,” J. Mater.
Process. Technol., Vol. 37, 1993, pp. 295–318.
[5] Hasan, S., Hasan, G., and Jahan, R., “Determination of Fric-
tion Coefficient by Employing the Ring Compression Test,” J.
Eng. Mater. Technol., Vol. 123, 2001, pp. 338–348.[6] Hasan, S. and Jahan, R., “On the Measurement of Friction Co-
efficient Utilizing the Ring Compression Test,” Tribol. Int.,
Vol. 32, 1999, pp. 327–335.
[7] Venugopal, S., Srinivasan, G., Venkadesan, S., and Seethara-
man, V., “A Note on the Determination of the Friction Factor
by Means of the Reduction-Capacity Test,” J. Mech. Work.
Technol., Vol. 19, 1989, pp. 261–266.
[8] Avitzur, B., Metal Forming: Processes and Analysis, Tata
McGraw-Hill, 1977, p. 500.
[9] Buschhausen, A., Weinmann, K., Lee, J. Y., and Altan, T.,
“Evaluation of Lubrication and Friction in Cold Forging
Using a Double Backward-Extrusion Process,” J. Mater. Pro-
cess. Technol., Vol. 33, 1992, pp. 95–108.[10] Forcellese, A., Gabrielli, F., Barcellona, A., and Micari, F.,
“Evaluation of Friction in Cold Metal Forming,” J. Mater.
Process. Technol., Vol. 45, 1994, pp. 619–624.
[11] Wagoner, R. H. and Chenot, J. L., Fundamentals of Metal
Forming , John Wiley and Sons, Inc., 1997, p. 388.
[12] Barcellona, A., Cannizzaro, L., Forcellese, A., and Gabrielli,
F., “Validation of Frictional Studies by Double-Cup Extrusion
Tests in Cold-Forming,” Annals of the CIRP , Vol. 45/1, 1996,
p. 211, www.cirp.net.
[13] Ghobrial, M. I., Lee, J. Y., Altan, T., Bay, T., and Hansen, B.
G., “Factors Affecting the Double Cup Extrusion Test for
Evaluation of Friction in Cold and Warm Forging,” Annals of
the CIRP , Vol. 42/1, 1993, p. 347, www.cirp.net.
FIG. 18— Comparison of experimental hardness to predicted hardness (from Eq 1) for Teflon m=0.16 lubrication.
12 JOURNAL OF TESTING AND EVALUATION

7/28/2019 Influence of Friction in Simple Upsetting
http://slidepdf.com/reader/full/influence-of-friction-in-simple-upsetting 13/13
[14] Hartley, P., Sturgess, C. E. N., and Rowe, G. W., “Prediction of
Deformation and Homogeneity in Rim-Disc Forging,” J.
Mech. Work. Technol., Vol. 4, 1980, pp. 145–154.
[15] Kim, H., Lee, S-M., and Altan, T. “Prediction of Hardness
Distribution in Cold Backward Extruded Cups,” J. Mater.
Process. Technol., Vol. 59, 1996, pp. 113–121.
[16] Petruska, J. and Janicek, L., “On the Evaluation of Strain
Inhomogeneity by Hardness Measurement of Formed Prod-
ucts,” J. Mater. Process. Technol., Vol. 143-144, 2003,
pp. 300–305.
[17] Sonmez, F. O. and Demir, A., “Analytical Relations Between
Hardness and Strain for Cold Formed Parts,” J. Mater. Pro-
cess. Technol., Vol. 186, 2007, pp. 163–173.
[18] Ganesh Narayanan, R., “Studies on Effect of Friction in Cold
Forging and Prediction of Hardness Distribution in a Cold
Formed Product,” M.S. (by research)Thesis, Anna University,
Chennai, India, 2002.
NARAYANAN ET AL. ON INFLUENCE OF FRICTION IN A COLD FORGED PRODUCT 13


![INFLUENCE OF TRIBOELECTRIFICATION ON FRICTION …Dielectric and friction behaviour of unidirectional glass fibre reinforced epoxy (GFRE) were studied, [14]. It was found that the glass](https://img.pdfslide.us/doc/110x75/5f0cce287e708231d437380a/influence-of-triboelectrification-on-friction-dielectric-and-friction-behaviour.jpg)