Embed Size (px)
Citation preview
Engineering Geology 220 (2017) 1–12
Contents lists available at ScienceDirect
Engineering Geology
j ourna l homepage: www.e lsev ie r .com/ locate /enggeo
Influence of cyclic wetting and drying on physical and dynamiccompressive properties of sandstone
Zilong Zhou a, Xin Cai a,⁎, Lu Chen a, Wenzhuo Cao b, Yuan Zhao a, Cheng Xiong a
a School of Resources and Safety Engineering, Central South University, Changsha, Hunan, PR Chinab Department of Earth Science and Engineering, Royal School of Mines, Imperial College, London SW7 2AZ, UK
⁎ Corresponding author.E-mail address: [email protected] (X. Cai).
http://dx.doi.org/10.1016/j.enggeo.2017.01.0170013-7952/© 2017 Elsevier B.V. All rights reserved.
a b s t r a c t
a r t i c l e i n f oArticle history:Received 24 July 2016Received in revised form 17 December 2016Accepted 14 January 2017Available online 17 January 2017
The cyclic wetting-drying phenomenon, which is a part of weathering processes, plays a vitally important role inaffecting the properties of rock materials. To investigate the effect of wetting and drying cycles on the physicaland dynamic compressive properties of rocks, some essential physical properties of sandstone specimens includ-ing density, water absorption, porosity, P-wave velocity and slake durability index (SDI) were measured afterevery 10 cycles (for a total of 50 cycles). Dynamic compressive tests were conducted using a modified split Hop-kinson pressure bar (SHPB) technique for rock specimens. Laboratory tests results showed that, with the increaseof wetting and drying cycles, the porosity and water absorption of rock increases while the density, P-wave ve-locity, SDI, dynamic compressive strength and elastic modulus decrease. In addition, the surface microscopicmorphological characteristics of specimens were examined by scanning electron microscope (SEM). It was ob-served that the micro-cracks grow and expand in rock after cyclic wetting-drying treatments, which is themain cause of the reduction in dynamic compressive strength. Based on experimental results, an empirical equa-tion was established to describe the effect of strain rate and number of wetting and drying cycles on the dynamiccompressive strength of rock materials.
© 2017 Elsevier B.V. All rights reserved.
Keywords:SandstoneCyclic wetting and dryingPhysical propertiesSHPBRock dynamics
1. Introduction
It is well known that deterioration of rock is usually related withwater in many rock engineering applications, such as tunneling, miningand rock excavation, where rockmasses are in moist conditions period-ically. Diurnal aswell as seasonal changes in groundwater level, humid-ity or other reasons could lead to cyclic actions of wetting and dryingand accelerate the weathering process of rocks, which over the yearwould eventually result in lots of geological disasters, such as landslides,karst collapse, pillar degradation in mining engineering and deforma-tion of dam foundation (Wu et al., 2005). Furthermore, many of thesehazards occur under dynamic loading conditions. Thus, it addresses aneed to investigate the dynamic mechanical properties of rock subject-ed to cyclic wetting and drying.
In recent years, the influence of cyclic wetting and drying on thephysical and static mechanical properties of rock materials has beenstudied by many researchers. The rock deterioration after wetting anddrying cycles was assessed by changes in physical properties includingbulk density, weight loss, water absorption (water content), effectiveporosity, P-wave velocity (Pardini et al., 1996; Sumner and Loubser,2008; Özbek, 2014; Khanlari and Abdilor, 2015). The results of these
researches showed that, with the number of wetting and drying cyclesincreasing, the bulk density and P-wave velocity of rock decreasewhereas the water absorption and effective porosity increase.Gökceoğlu et al. (2000) also investigated the factors affecting the slakedurability index (SDI) of 17 kinds of clay-bearing rocks and emphasizedthe influence of the number of wetting and drying cycles on the SDIvalues.
The investigations of mechanical properties of rock materials affect-ed by cyclic wetting and drying have been mainly concentrated on uni-axial compressive strength (Hale and Shakoor, 2003; Özbek, 2014;Khanlari and Abdilor, 2015), tensile strength (Liu et al., 2016), shearstrength (Zhang et al., 2015) and fracture toughness (Hua et al., 2015),etc. All of these test results indicated that the mechanical properties ofrock materials have a different degree of deterioration after cyclic wet-ting and drying treatments.
However, all of the mechanical properties mentioned above arebased on static tests, and limited studies can be foundon the effect of cy-clic wetting and drying treatments on the dynamic properties of rocks.In fact, the rock and rockmass are usually broken and fractured dynam-ically in rock engineering applications, such as impact, explosion, rockburst and seismic events. The investigation on the dynamic propertiesof rock after cyclic wetting and drying is thus greatly meaningful to as-sess the safety and stability of rock structure and control the hazard ofrock engineering.
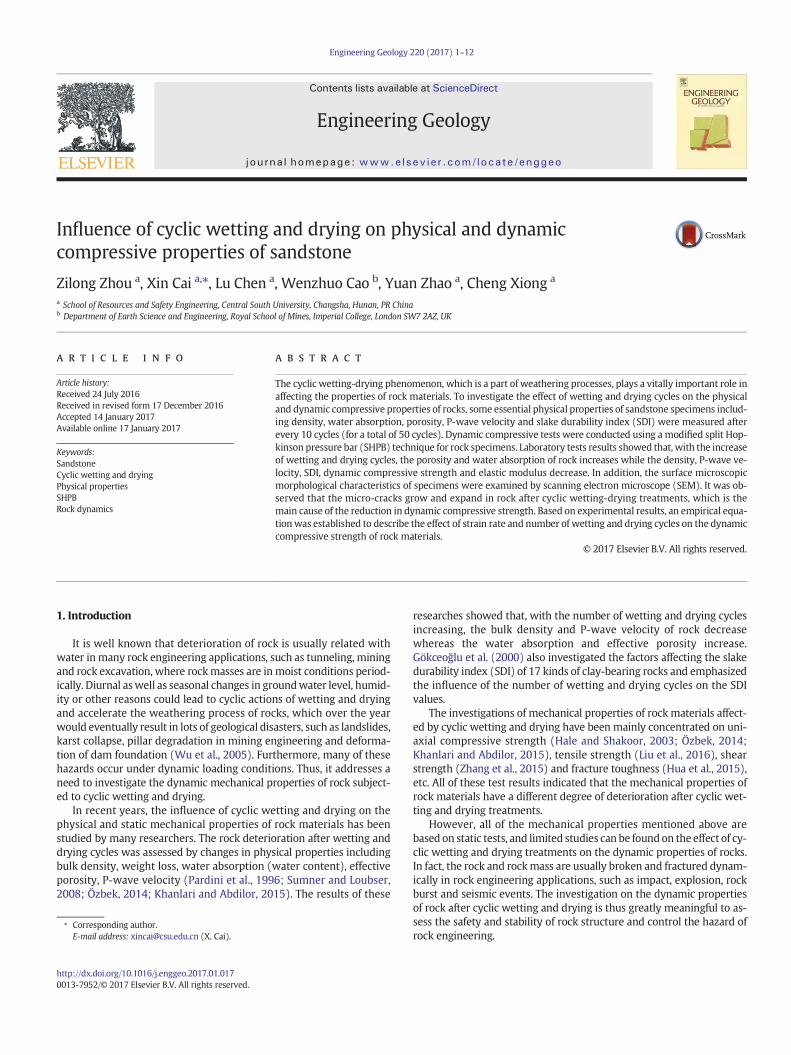
Fig. 1. The results of EDX analysis for sandstone: (a) electron spectroscopy of specimen without cyclic wetting and drying treatments, (b) mineral composition of sandstone specimenwithout cyclic wetting and drying treatments and (c) difference of mineral content between specimen without treatments and that subjected to 50 cycles of wetting and dryingtreatments.
2 Z. Zhou et al. / Engineering Geology 220 (2017) 1–12
In this study, in order to investigate and quantify the effect of cyclicwetting and drying on the physical and dynamic mechanical propertiesof sandstone, a series of tests were conducted on sandstone specimensafter different numbers of cyclic wetting and drying processes. The spe-cific experimental details are listed as follows:
1. The engineering properties indices were determined for sandstonespecimens subjected to different numbers of cyclic wetting and dry-ing treatments, namely density, porosity, water absorption, P-wavevelocity, and slake durability index (SDI);
2. In order to obtain the microscopic morphological characteristics, thesurface of sandstone specimens was observed using the scanningelectron microscope (SEM) technique, and the micro-cracks of spec-imens after every 10 cycles were also examined;
3. Impact tests on sandstone after different numbers of cyclic wettingand drying were conducted with the split Hopkinson pressure bar(SHPB) setup, the dynamic strength of specimens under differentstrain rateswas analyzed, and the elasticmoduluswith different cyclictreatment numbers at the strain rate of 90 s−1 was also compared.
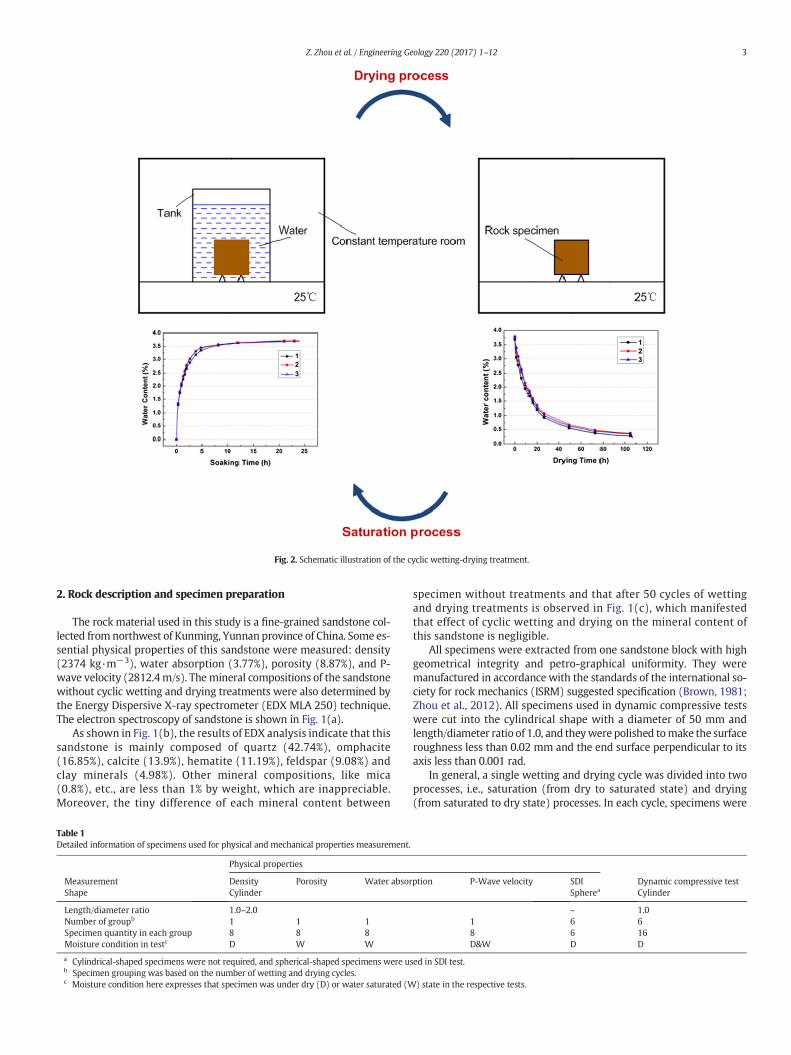
Fig. 2. Schematic illustration of the cyclic wetting-drying treatment.
3Z. Zhou et al. / Engineering Geology 220 (2017) 1–12
2. Rock description and specimen preparation
The rock material used in this study is a fine-grained sandstone col-lected from northwest of Kunming, Yunnan province of China. Some es-sential physical properties of this sandstone were measured: density(2374 kg·m−3), water absorption (3.77%), porosity (8.87%), and P-wave velocity (2812.4m/s). Themineral compositions of the sandstonewithout cyclic wetting and drying treatments were also determined bythe Energy Dispersive X-ray spectrometer (EDX MLA 250) technique.The electron spectroscopy of sandstone is shown in Fig. 1(a).
As shown in Fig. 1(b), the results of EDX analysis indicate that thissandstone is mainly composed of quartz (42.74%), omphacite(16.85%), calcite (13.9%), hematite (11.19%), feldspar (9.08%) andclay minerals (4.98%). Other mineral compositions, like mica(0.8%), etc., are less than 1% by weight, which are inappreciable.Moreover, the tiny difference of each mineral content between
Table 1Detailed information of specimens used for physical and mechanical properties measurement.
Measurement
Physical properties
Density Porosity Water absorShape Cylinder
Length/diameter ratio 1.0–2.0Number of groupb 1 1 1Specimen quantity in each group 8 8 8Moisture condition in testc D W W
a Cylindrical-shaped specimens were not required, and spherical-shaped specimens were ub Specimen grouping was based on the number of wetting and drying cycles.c Moisture condition here expresses that specimen was under dry (D) or water saturated (W
specimen without treatments and that after 50 cycles of wettingand drying treatments is observed in Fig. 1(c), which manifestedthat effect of cyclic wetting and drying on the mineral content ofthis sandstone is negligible.
All specimens were extracted from one sandstone block with highgeometrical integrity and petro-graphical uniformity. They weremanufactured in accordance with the standards of the international so-ciety for rock mechanics (ISRM) suggested specification (Brown, 1981;Zhou et al., 2012). All specimens used in dynamic compressive testswere cut into the cylindrical shape with a diameter of 50 mm andlength/diameter ratio of 1.0, and theywere polished tomake the surfaceroughness less than 0.02 mm and the end surface perpendicular to itsaxis less than 0.001 rad.
In general, a single wetting and drying cycle was divided into twoprocesses, i.e., saturation (from dry to saturated state) and drying(from saturated to dry state) processes. In each cycle, specimens were
Dynamic compressive testption P-Wave velocity SDISpherea Cylinder
– 1.01 6 68 6 16D&W D D
sed in SDI test.
) state in the respective tests.
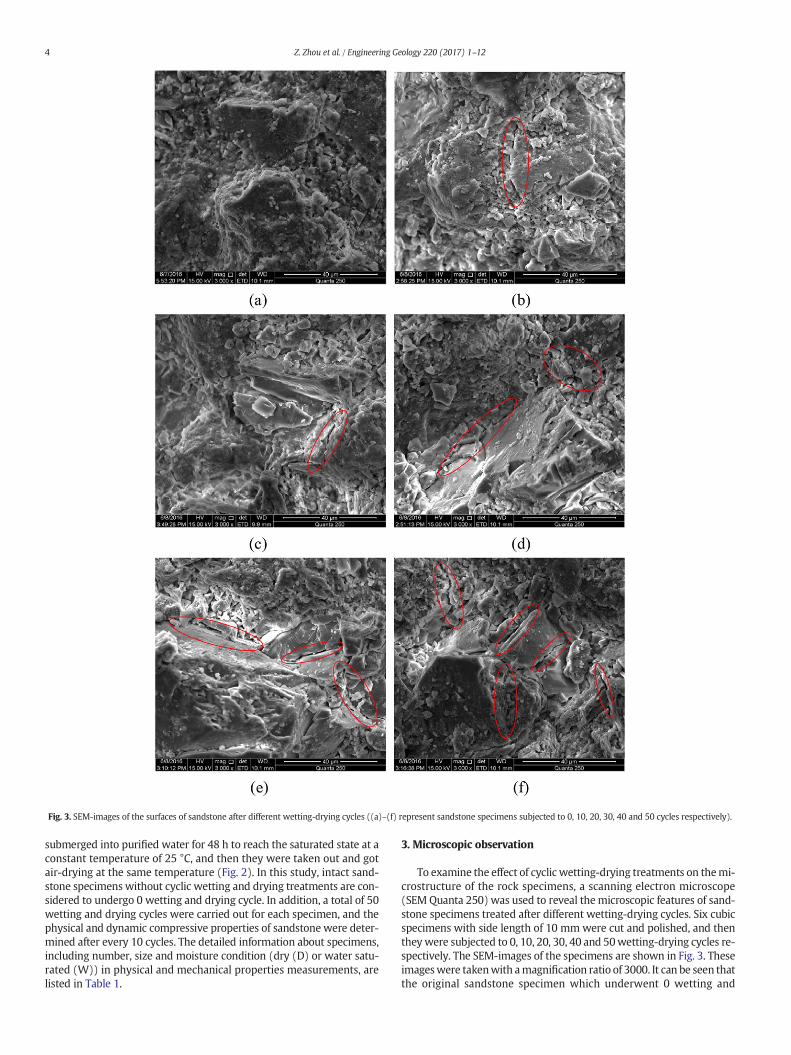
Fig. 3. SEM-images of the surfaces of sandstone after different wetting-drying cycles ((a)–(f) represent sandstone specimens subjected to 0, 10, 20, 30, 40 and 50 cycles respectively).
4 Z. Zhou et al. / Engineering Geology 220 (2017) 1–12
submerged into purified water for 48 h to reach the saturated state at aconstant temperature of 25 °C, and then they were taken out and gotair-drying at the same temperature (Fig. 2). In this study, intact sand-stone specimens without cyclic wetting and drying treatments are con-sidered to undergo 0 wetting and drying cycle. In addition, a total of 50wetting and drying cycles were carried out for each specimen, and thephysical and dynamic compressive properties of sandstone were deter-mined after every 10 cycles. The detailed information about specimens,including number, size and moisture condition (dry (D) or water satu-rated (W)) in physical and mechanical properties measurements, arelisted in Table 1.
3. Microscopic observation
To examine the effect of cyclic wetting-drying treatments on themi-crostructure of the rock specimens, a scanning electron microscope(SEM Quanta 250) was used to reveal themicroscopic features of sand-stone specimens treated after different wetting-drying cycles. Six cubicspecimens with side length of 10 mm were cut and polished, and thentheywere subjected to 0, 10, 20, 30, 40 and 50wetting-drying cycles re-spectively. The SEM-images of the specimens are shown in Fig. 3. Theseimageswere takenwith amagnification ratio of 3000. It can be seen thatthe original sandstone specimen which underwent 0 wetting and
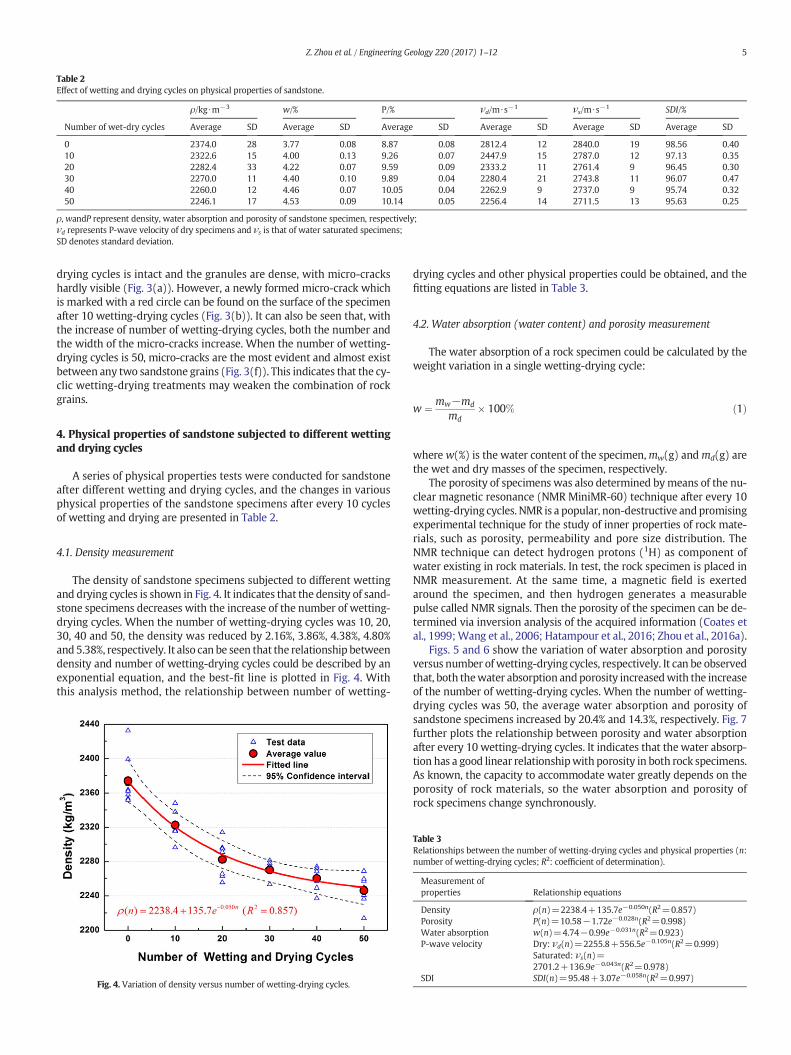
Table 2Effect of wetting and drying cycles on physical properties of sandstone.
Number of wet-dry cycles
ρ/kg ⋅m−3 w/% P/% νd/m ⋅s−1 νs/m ⋅s−1 SDI/%
Average SD Average SD Average SD Average SD Average SD Average SD
0 2374.0 28 3.77 0.08 8.87 0.08 2812.4 12 2840.0 19 98.56 0.4010 2322.6 15 4.00 0.13 9.26 0.07 2447.9 15 2787.0 12 97.13 0.3520 2282.4 33 4.22 0.07 9.59 0.09 2333.2 11 2761.4 9 96.45 0.3030 2270.0 11 4.40 0.10 9.89 0.04 2280.4 21 2743.8 11 96.07 0.4740 2260.0 12 4.46 0.07 10.05 0.04 2262.9 9 2737.0 9 95.74 0.3250 2246.1 17 4.53 0.09 10.14 0.05 2256.4 14 2711.5 13 95.63 0.25
ρ, wandP represent density, water absorption and porosity of sandstone specimen, respectively;νd represents P-wave velocity of dry specimens and νs is that of water saturated specimens;SD denotes standard deviation.
5Z. Zhou et al. / Engineering Geology 220 (2017) 1–12
drying cycles is intact and the granules are dense, with micro-crackshardly visible (Fig. 3(a)). However, a newly formed micro-crack whichis marked with a red circle can be found on the surface of the specimenafter 10 wetting-drying cycles (Fig. 3(b)). It can also be seen that, withthe increase of number of wetting-drying cycles, both the number andthe width of the micro-cracks increase. When the number of wetting-drying cycles is 50, micro-cracks are the most evident and almost existbetween any two sandstone grains (Fig. 3(f)). This indicates that the cy-clic wetting-drying treatments may weaken the combination of rockgrains.
4. Physical properties of sandstone subjected to different wettingand drying cycles
A series of physical properties tests were conducted for sandstoneafter different wetting and drying cycles, and the changes in variousphysical properties of the sandstone specimens after every 10 cyclesof wetting and drying are presented in Table 2.
4.1. Density measurement
The density of sandstone specimens subjected to different wettingand drying cycles is shown in Fig. 4. It indicates that the density of sand-stone specimens decreases with the increase of the number of wetting-drying cycles. When the number of wetting-drying cycles was 10, 20,30, 40 and 50, the density was reduced by 2.16%, 3.86%, 4.38%, 4.80%and 5.38%, respectively. It also can be seen that the relationship betweendensity and number of wetting-drying cycles could be described by anexponential equation, and the best-fit line is plotted in Fig. 4. Withthis analysis method, the relationship between number of wetting-
Fig. 4. Variation of density versus number of wetting-drying cycles.
drying cycles and other physical properties could be obtained, and thefitting equations are listed in Table 3.
4.2. Water absorption (water content) and porosity measurement
The water absorption of a rock specimen could be calculated by theweight variation in a single wetting-drying cycle:
w ¼ mw−md
md� 100% ð1Þ
where w(%) is the water content of the specimen,mw(g) andmd(g) arethe wet and dry masses of the specimen, respectively.
The porosity of specimens was also determined bymeans of the nu-clear magnetic resonance (NMR MiniMR-60) technique after every 10wetting-drying cycles. NMR is a popular, non-destructive andpromisingexperimental technique for the study of inner properties of rock mate-rials, such as porosity, permeability and pore size distribution. TheNMR technique can detect hydrogen protons (1H) as component ofwater existing in rock materials. In test, the rock specimen is placed inNMR measurement. At the same time, a magnetic field is exertedaround the specimen, and then hydrogen generates a measurablepulse called NMR signals. Then the porosity of the specimen can be de-termined via inversion analysis of the acquired information (Coates etal., 1999;Wang et al., 2006; Hatampour et al., 2016; Zhou et al., 2016a).
Figs. 5 and 6 show the variation of water absorption and porosityversus number ofwetting-drying cycles, respectively. It can be observedthat, both thewater absorption andporosity increasedwith the increaseof the number of wetting-drying cycles. When the number of wetting-drying cycles was 50, the average water absorption and porosity ofsandstone specimens increased by 20.4% and 14.3%, respectively. Fig. 7further plots the relationship between porosity and water absorptionafter every 10 wetting-drying cycles. It indicates that the water absorp-tion has a good linear relationshipwith porosity in both rock specimens.As known, the capacity to accommodate water greatly depends on theporosity of rock materials, so the water absorption and porosity ofrock specimens change synchronously.
Table 3Relationships between the number of wetting-drying cycles and physical properties (n:number of wetting-drying cycles; R2: coefficient of determination).
Measurement ofproperties Relationship equations
Density ρ(n)=2238.4+135.7e−0.050n(R2=0.857)Porosity P(n)=10.58−1.72e−0.028n(R2=0.998)Water absorption w(n)=4.74−0.99e−0.031n(R2=0.923)P-wave velocity Dry: νd(n)=2255.8+556.5e−0.105n(R2=0.999)
Saturated: νs(n)=2701.2+136.9e−0.043n(R2=0.978)
SDI SDI(n)=95.48+3.07e−0.058n(R2=0.997)
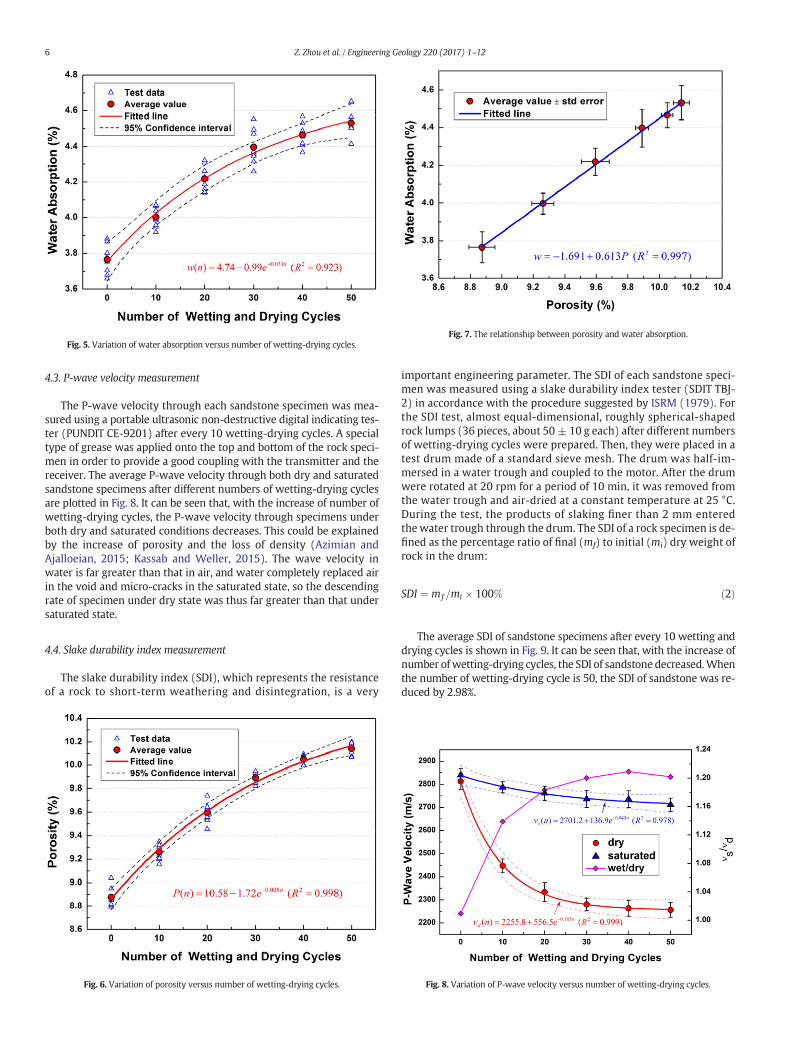
Fig. 5. Variation of water absorption versus number of wetting-drying cycles.Fig. 7. The relationship between porosity and water absorption.
6 Z. Zhou et al. / Engineering Geology 220 (2017) 1–12
4.3. P-wave velocity measurement
The P-wave velocity through each sandstone specimen was mea-sured using a portable ultrasonic non-destructive digital indicating tes-ter (PUNDIT CE-9201) after every 10 wetting-drying cycles. A specialtype of grease was applied onto the top and bottom of the rock speci-men in order to provide a good coupling with the transmitter and thereceiver. The average P-wave velocity through both dry and saturatedsandstone specimens after different numbers of wetting-drying cyclesare plotted in Fig. 8. It can be seen that, with the increase of number ofwetting-drying cycles, the P-wave velocity through specimens underboth dry and saturated conditions decreases. This could be explainedby the increase of porosity and the loss of density (Azimian andAjalloeian, 2015; Kassab and Weller, 2015). The wave velocity inwater is far greater than that in air, and water completely replaced airin the void and micro-cracks in the saturated state, so the descendingrate of specimen under dry state was thus far greater than that undersaturated state.
4.4. Slake durability index measurement
The slake durability index (SDI), which represents the resistanceof a rock to short-term weathering and disintegration, is a very
Fig. 6. Variation of porosity versus number of wetting-drying cycles.
important engineering parameter. The SDI of each sandstone speci-men was measured using a slake durability index tester (SDIT TBJ-2) in accordance with the procedure suggested by ISRM (1979). Forthe SDI test, almost equal-dimensional, roughly spherical-shapedrock lumps (36 pieces, about 50± 10 g each) after different numbersof wetting-drying cycles were prepared. Then, they were placed in atest drum made of a standard sieve mesh. The drum was half-im-mersed in a water trough and coupled to the motor. After the drumwere rotated at 20 rpm for a period of 10 min, it was removed fromthe water trough and air-dried at a constant temperature at 25 °C.During the test, the products of slaking finer than 2 mm enteredthe water trough through the drum. The SDI of a rock specimen is de-fined as the percentage ratio of final (mf) to initial (mi) dry weight ofrock in the drum:
SDI ¼ mf =mi � 100% ð2Þ
The average SDI of sandstone specimens after every 10 wetting anddrying cycles is shown in Fig. 9. It can be seen that, with the increase ofnumber ofwetting-drying cycles, the SDI of sandstone decreased.Whenthe number of wetting-drying cycle is 50, the SDI of sandstone was re-duced by 2.98%.
Fig. 8. Variation of P-wave velocity versus number of wetting-drying cycles.
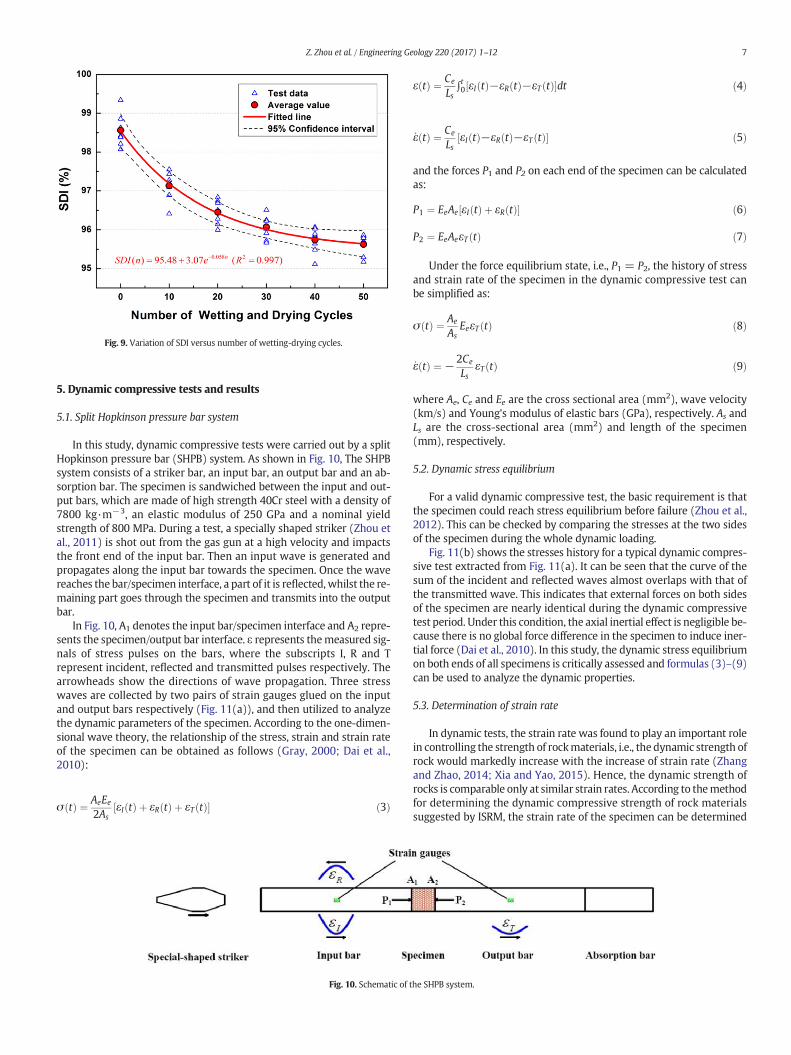
Fig. 9. Variation of SDI versus number of wetting-drying cycles.
7Z. Zhou et al. / Engineering Geology 220 (2017) 1–12
5. Dynamic compressive tests and results
5.1. Split Hopkinson pressure bar system
In this study, dynamic compressive tests were carried out by a splitHopkinson pressure bar (SHPB) system. As shown in Fig. 10, The SHPBsystem consists of a striker bar, an input bar, an output bar and an ab-sorption bar. The specimen is sandwiched between the input and out-put bars, which are made of high strength 40Cr steel with a density of7800 kg·m−3, an elastic modulus of 250 GPa and a nominal yieldstrength of 800 MPa. During a test, a specially shaped striker (Zhou etal., 2011) is shot out from the gas gun at a high velocity and impactsthe front end of the input bar. Then an input wave is generated andpropagates along the input bar towards the specimen. Once the wavereaches the bar/specimen interface, a part of it is reflected, whilst the re-maining part goes through the specimen and transmits into the outputbar.
In Fig. 10, A1 denotes the input bar/specimen interface and A2 repre-sents the specimen/output bar interface. ε represents themeasured sig-nals of stress pulses on the bars, where the subscripts I, R and Trepresent incident, reflected and transmitted pulses respectively. Thearrowheads show the directions of wave propagation. Three stresswaves are collected by two pairs of strain gauges glued on the inputand output bars respectively (Fig. 11(a)), and then utilized to analyzethe dynamic parameters of the specimen. According to the one-dimen-sional wave theory, the relationship of the stress, strain and strain rateof the specimen can be obtained as follows (Gray, 2000; Dai et al.,2010):
σ tð Þ ¼ AeEe2As
εI tð Þ þ εR tð Þ þ εT tð Þ½ � ð3Þ
Fig. 10. Schematic of t
ε tð Þ ¼ Ce
Ls∫t0 εI tð Þ−εR tð Þ−εT tð Þ½ �dt ð4Þ
_ε tð Þ ¼ Ce
LsεI tð Þ−εR tð Þ−εT tð Þ½ � ð5Þ
and the forces P1 and P2 on each end of the specimen can be calculatedas:
P1 ¼ EeAe εI tð Þ þ εR tð Þ½ � ð6Þ
P2 ¼ EeAeεT tð Þ ð7Þ
Under the force equilibrium state, i.e., P1 = P2, the history of stressand strain rate of the specimen in the dynamic compressive test canbe simplified as:
σ tð Þ ¼ Ae
AsEeεT tð Þ ð8Þ
_ε tð Þ ¼ −2Ce
LsεT tð Þ ð9Þ
where Ae, Ce and Ee are the cross sectional area (mm2), wave velocity(km/s) and Young's modulus of elastic bars (GPa), respectively. As andLs are the cross-sectional area (mm2) and length of the specimen(mm), respectively.
5.2. Dynamic stress equilibrium
For a valid dynamic compressive test, the basic requirement is thatthe specimen could reach stress equilibrium before failure (Zhou et al.,2012). This can be checked by comparing the stresses at the two sidesof the specimen during the whole dynamic loading.
Fig. 11(b) shows the stresses history for a typical dynamic compres-sive test extracted from Fig. 11(a). It can be seen that the curve of thesum of the incident and reflected waves almost overlaps with that ofthe transmitted wave. This indicates that external forces on both sidesof the specimen are nearly identical during the dynamic compressivetest period. Under this condition, the axial inertial effect is negligible be-cause there is no global force difference in the specimen to induce iner-tial force (Dai et al., 2010). In this study, the dynamic stress equilibriumon both ends of all specimens is critically assessed and formulas (3)–(9)can be used to analyze the dynamic properties.
5.3. Determination of strain rate
In dynamic tests, the strain rate was found to play an important rolein controlling the strength of rockmaterials, i.e., the dynamic strength ofrock would markedly increase with the increase of strain rate (Zhangand Zhao, 2014; Xia and Yao, 2015). Hence, the dynamic strength ofrocks is comparable only at similar strain rates. According to themethodfor determining the dynamic compressive strength of rock materialssuggested by ISRM, the strain rate of the specimen can be determined
he SHPB system.
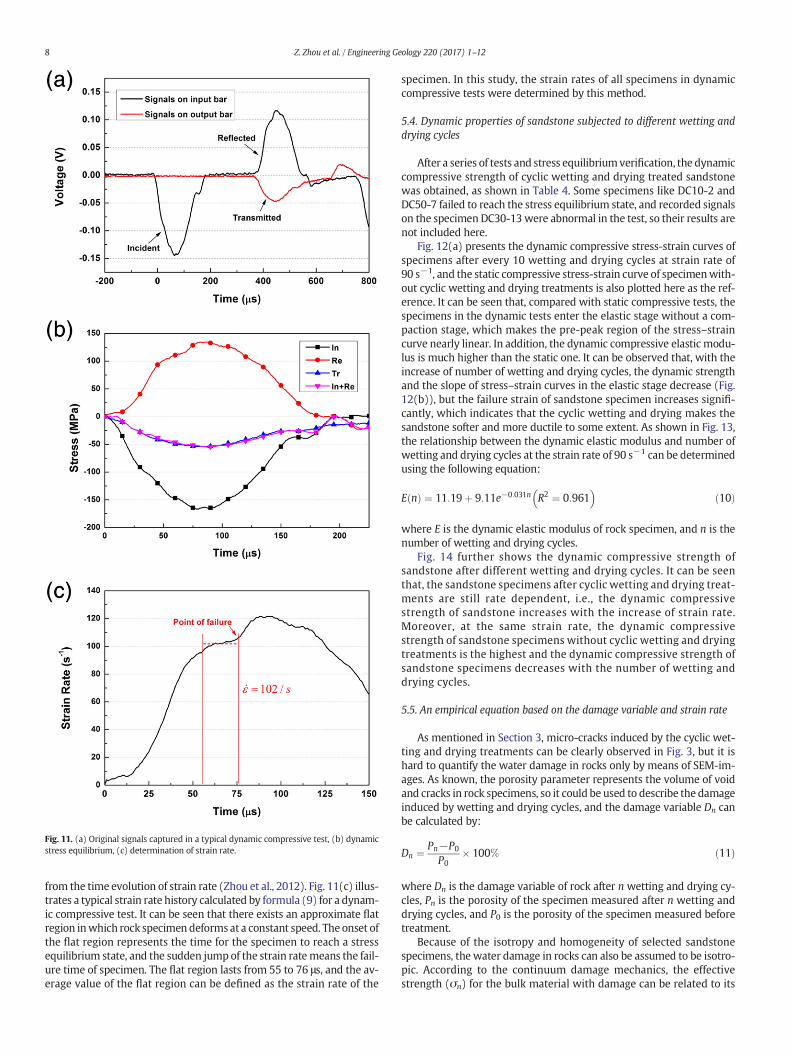
Fig. 11. (a) Original signals captured in a typical dynamic compressive test, (b) dynamicstress equilibrium, (c) determination of strain rate.
8 Z. Zhou et al. / Engineering Geology 220 (2017) 1–12
from the time evolution of strain rate (Zhou et al., 2012). Fig. 11(c) illus-trates a typical strain rate history calculated by formula (9) for a dynam-ic compressive test. It can be seen that there exists an approximate flatregion inwhich rock specimen deforms at a constant speed. The onset ofthe flat region represents the time for the specimen to reach a stressequilibrium state, and the sudden jump of the strain ratemeans the fail-ure time of specimen. The flat region lasts from 55 to 76 μs, and the av-erage value of the flat region can be defined as the strain rate of the
specimen. In this study, the strain rates of all specimens in dynamiccompressive tests were determined by this method.
5.4. Dynamic properties of sandstone subjected to different wetting anddrying cycles
After a series of tests and stress equilibriumverification, the dynamiccompressive strength of cyclic wetting and drying treated sandstonewas obtained, as shown in Table 4. Some specimens like DC10-2 andDC50-7 failed to reach the stress equilibrium state, and recorded signalson the specimen DC30-13were abnormal in the test, so their results arenot included here.
Fig. 12(a) presents the dynamic compressive stress-strain curves ofspecimens after every 10 wetting and drying cycles at strain rate of90 s−1, and the static compressive stress-strain curve of specimenwith-out cyclic wetting and drying treatments is also plotted here as the ref-erence. It can be seen that, compared with static compressive tests, thespecimens in the dynamic tests enter the elastic stage without a com-paction stage, which makes the pre-peak region of the stress–straincurve nearly linear. In addition, the dynamic compressive elastic modu-lus is much higher than the static one. It can be observed that, with theincrease of number of wetting and drying cycles, the dynamic strengthand the slope of stress–strain curves in the elastic stage decrease (Fig.12(b)), but the failure strain of sandstone specimen increases signifi-cantly, which indicates that the cyclic wetting and drying makes thesandstone softer and more ductile to some extent. As shown in Fig. 13,the relationship between the dynamic elastic modulus and number ofwetting and drying cycles at the strain rate of 90 s−1 can be determinedusing the following equation:
E nð Þ ¼ 11:19þ 9:11e−0:031n R2 ¼ 0:961� �
ð10Þ
where E is the dynamic elastic modulus of rock specimen, and n is thenumber of wetting and drying cycles.
Fig. 14 further shows the dynamic compressive strength ofsandstone after different wetting and drying cycles. It can be seenthat, the sandstone specimens after cyclic wetting and drying treat-ments are still rate dependent, i.e., the dynamic compressivestrength of sandstone increases with the increase of strain rate.Moreover, at the same strain rate, the dynamic compressivestrength of sandstone specimens without cyclic wetting and dryingtreatments is the highest and the dynamic compressive strength ofsandstone specimens decreases with the number of wetting anddrying cycles.
5.5. An empirical equation based on the damage variable and strain rate
As mentioned in Section 3, micro-cracks induced by the cyclic wet-ting and drying treatments can be clearly observed in Fig. 3, but it ishard to quantify the water damage in rocks only by means of SEM-im-ages. As known, the porosity parameter represents the volume of voidand cracks in rock specimens, so it could be used to describe the damageinduced by wetting and drying cycles, and the damage variable Dn canbe calculated by:
Dn ¼ Pn−P0
P0� 100% ð11Þ
where Dn is the damage variable of rock after n wetting and drying cy-cles, Pn is the porosity of the specimen measured after n wetting anddrying cycles, and P0 is the porosity of the specimen measured beforetreatment.
Because of the isotropy and homogeneity of selected sandstonespecimens, the water damage in rocks can also be assumed to be isotro-pic. According to the continuum damage mechanics, the effectivestrength (σn) for the bulk material with damage can be related to its
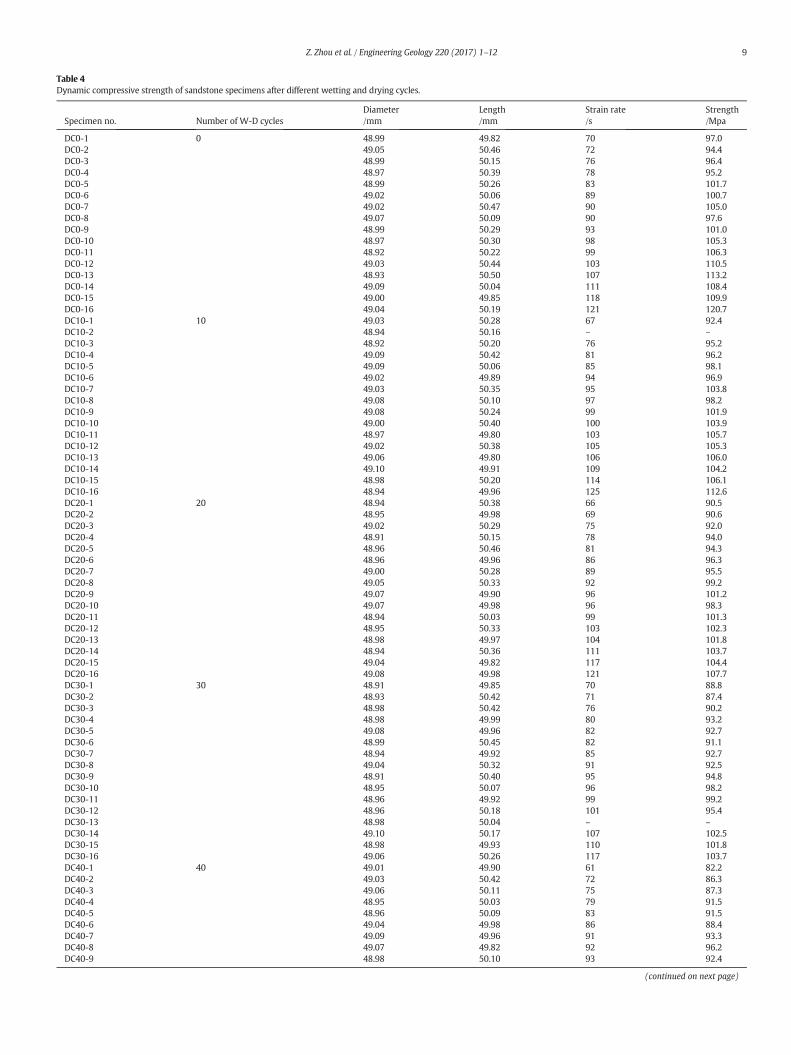
Table 4Dynamic compressive strength of sandstone specimens after different wetting and drying cycles.
Specimen no. Number of W-D cyclesDiameter Length Strain rate Strength/mm /mm /s /Mpa
DC0-1 0 48.99 49.82 70 97.0DC0-2 49.05 50.46 72 94.4DC0-3 48.99 50.15 76 96.4DC0-4 48.97 50.39 78 95.2DC0-5 48.99 50.26 83 101.7DC0-6 49.02 50.06 89 100.7DC0-7 49.02 50.47 90 105.0DC0-8 49.07 50.09 90 97.6DC0-9 48.99 50.29 93 101.0DC0-10 48.97 50.30 98 105.3DC0-11 48.92 50.22 99 106.3DC0-12 49.03 50.44 103 110.5DC0-13 48.93 50.50 107 113.2DC0-14 49.09 50.04 111 108.4DC0-15 49.00 49.85 118 109.9DC0-16 49.04 50.19 121 120.7DC10-1 10 49.03 50.28 67 92.4DC10-2 48.94 50.16 – –DC10-3 48.92 50.20 76 95.2DC10-4 49.09 50.42 81 96.2DC10-5 49.09 50.06 85 98.1DC10-6 49.02 49.89 94 96.9DC10-7 49.03 50.35 95 103.8DC10-8 49.08 50.10 97 98.2DC10-9 49.08 50.24 99 101.9DC10-10 49.00 50.40 100 103.9DC10-11 48.97 49.80 103 105.7DC10-12 49.02 50.38 105 105.3DC10-13 49.06 49.80 106 106.0DC10-14 49.10 49.91 109 104.2DC10-15 48.98 50.20 114 106.1DC10-16 48.94 49.96 125 112.6DC20-1 20 48.94 50.38 66 90.5DC20-2 48.95 49.98 69 90.6DC20-3 49.02 50.29 75 92.0DC20-4 48.91 50.15 78 94.0DC20-5 48.96 50.46 81 94.3DC20-6 48.96 49.96 86 96.3DC20-7 49.00 50.28 89 95.5DC20-8 49.05 50.33 92 99.2DC20-9 49.07 49.90 96 101.2DC20-10 49.07 49.98 96 98.3DC20-11 48.94 50.03 99 101.3DC20-12 48.95 50.33 103 102.3DC20-13 48.98 49.97 104 101.8DC20-14 48.94 50.36 111 103.7DC20-15 49.04 49.82 117 104.4DC20-16 49.08 49.98 121 107.7DC30-1 30 48.91 49.85 70 88.8DC30-2 48.93 50.42 71 87.4DC30-3 48.98 50.42 76 90.2DC30-4 48.98 49.99 80 93.2DC30-5 49.08 49.96 82 92.7DC30-6 48.99 50.45 82 91.1DC30-7 48.94 49.92 85 92.7DC30-8 49.04 50.32 91 92.5DC30-9 48.91 50.40 95 94.8DC30-10 48.95 50.07 96 98.2DC30-11 48.96 49.92 99 99.2DC30-12 48.96 50.18 101 95.4DC30-13 48.98 50.04 – –DC30-14 49.10 50.17 107 102.5DC30-15 48.98 49.93 110 101.8DC30-16 49.06 50.26 117 103.7DC40-1 40 49.01 49.90 61 82.2DC40-2 49.03 50.42 72 86.3DC40-3 49.06 50.11 75 87.3DC40-4 48.95 50.03 79 91.5DC40-5 48.96 50.09 83 91.5DC40-6 49.04 49.98 86 88.4DC40-7 49.09 49.96 91 93.3DC40-8 49.07 49.82 92 96.2DC40-9 48.98 50.10 93 92.4
(continued on next page)
9Z. Zhou et al. / Engineering Geology 220 (2017) 1–12
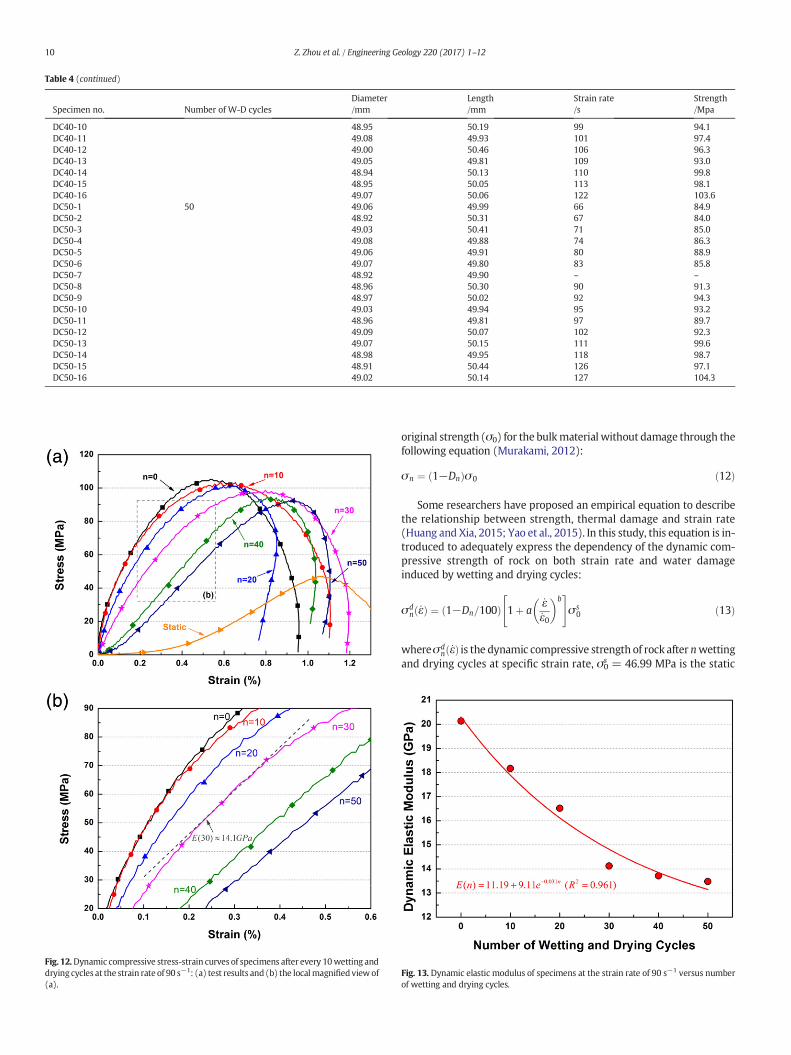
Table 4 (continued)
Specimen no. Number of W-D cyclesDiameter Length Strain rate Strength/mm /mm /s /Mpa
DC40-10 48.95 50.19 99 94.1DC40-11 49.08 49.93 101 97.4DC40-12 49.00 50.46 106 96.3DC40-13 49.05 49.81 109 93.0DC40-14 48.94 50.13 110 99.8DC40-15 48.95 50.05 113 98.1DC40-16 49.07 50.06 122 103.6DC50-1 50 49.06 49.99 66 84.9DC50-2 48.92 50.31 67 84.0DC50-3 49.03 50.41 71 85.0DC50-4 49.08 49.88 74 86.3DC50-5 49.06 49.91 80 88.9DC50-6 49.07 49.80 83 85.8DC50-7 48.92 49.90 – –DC50-8 48.96 50.30 90 91.3DC50-9 48.97 50.02 92 94.3DC50-10 49.03 49.94 95 93.2DC50-11 48.96 49.81 97 89.7DC50-12 49.09 50.07 102 92.3DC50-13 49.07 50.15 111 99.6DC50-14 48.98 49.95 118 98.7DC50-15 48.91 50.44 126 97.1DC50-16 49.02 50.14 127 104.3
Fig. 12.Dynamic compressive stress-strain curves of specimens after every 10wetting anddrying cycles at the strain rate of 90 s−1: (a) test results and (b) the localmagnifiedviewof(a).
10 Z. Zhou et al. / Engineering Geology 220 (2017) 1–12
original strength (σ0) for the bulkmaterial without damage through thefollowing equation (Murakami, 2012):
σn ¼ 1−Dnð Þσ0 ð12Þ
Some researchers have proposed an empirical equation to describethe relationship between strength, thermal damage and strain rate(Huang and Xia, 2015; Yao et al., 2015). In this study, this equation is in-troduced to adequately express the dependency of the dynamic com-pressive strength of rock on both strain rate and water damageinduced by wetting and drying cycles:
σdn _εð Þ ¼ 1−Dn=100ð Þ 1þ a
_ε_ε0
� �b" #
σ s0 ð13Þ
whereσdnð _εÞ is the dynamic compressive strength of rock after nwetting
and drying cycles at specific strain rate, σ0s = 46.99 MPa is the static
Fig. 13. Dynamic elastic modulus of specimens at the strain rate of 90 s−1 versus numberof wetting and drying cycles.
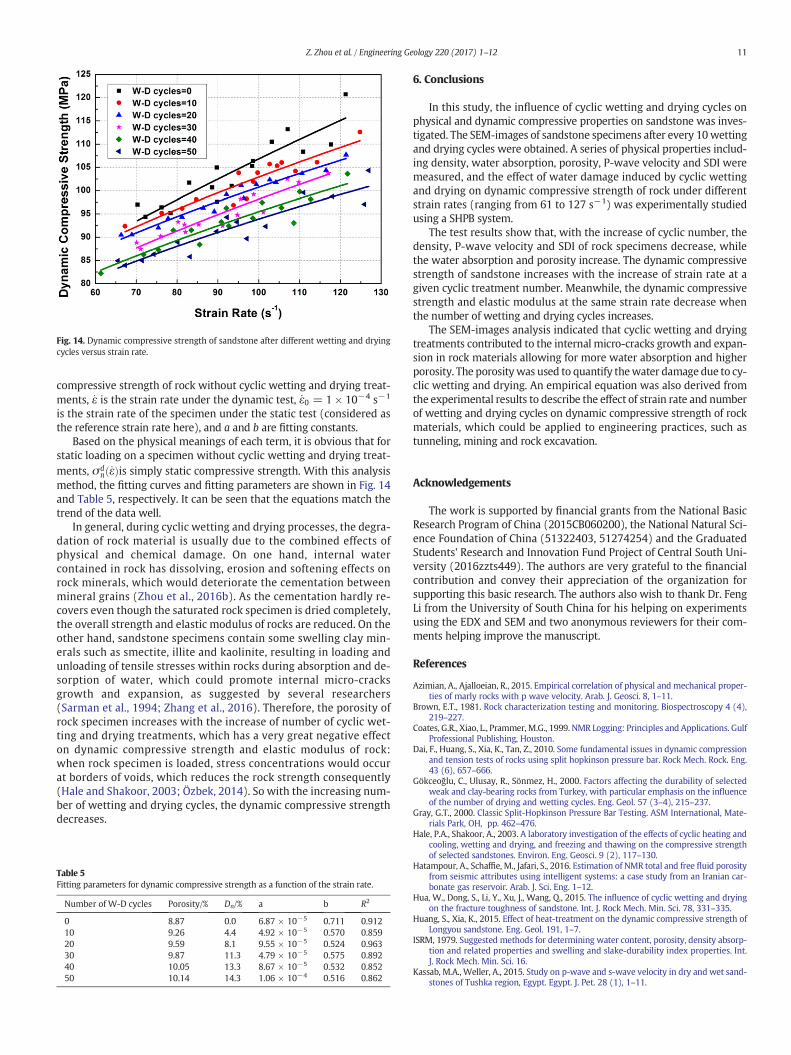
Fig. 14. Dynamic compressive strength of sandstone after different wetting and dryingcycles versus strain rate.
11Z. Zhou et al. / Engineering Geology 220 (2017) 1–12
compressive strength of rock without cyclic wetting and drying treat-ments, _ε is the strain rate under the dynamic test, _ε0 = 1 × 10⁻⁴ s−1
is the strain rate of the specimen under the static test (considered asthe reference strain rate here), and a and b are fitting constants.
Based on the physical meanings of each term, it is obvious that forstatic loading on a specimen without cyclic wetting and drying treat-ments, σd
nð _εÞis simply static compressive strength. With this analysismethod, the fitting curves and fitting parameters are shown in Fig. 14and Table 5, respectively. It can be seen that the equations match thetrend of the data well.
In general, during cyclic wetting and drying processes, the degra-dation of rock material is usually due to the combined effects ofphysical and chemical damage. On one hand, internal watercontained in rock has dissolving, erosion and softening effects onrock minerals, which would deteriorate the cementation betweenmineral grains (Zhou et al., 2016b). As the cementation hardly re-covers even though the saturated rock specimen is dried completely,the overall strength and elastic modulus of rocks are reduced. On theother hand, sandstone specimens contain some swelling clay min-erals such as smectite, illite and kaolinite, resulting in loading andunloading of tensile stresses within rocks during absorption and de-sorption of water, which could promote internal micro-cracksgrowth and expansion, as suggested by several researchers(Sarman et al., 1994; Zhang et al., 2016). Therefore, the porosity ofrock specimen increases with the increase of number of cyclic wet-ting and drying treatments, which has a very great negative effecton dynamic compressive strength and elastic modulus of rock:when rock specimen is loaded, stress concentrations would occurat borders of voids, which reduces the rock strength consequently(Hale and Shakoor, 2003; Özbek, 2014). So with the increasing num-ber of wetting and drying cycles, the dynamic compressive strengthdecreases.
Table 5Fitting parameters for dynamic compressive strength as a function of the strain rate.
Number of W-D cycles Porosity/% Dn/% a b R2
0 8.87 0.0 6.87 × 10⁻⁵ 0.711 0.91210 9.26 4.4 4.92 × 10⁻⁵ 0.570 0.85920 9.59 8.1 9.55 × 10⁻⁵ 0.524 0.96330 9.87 11.3 4.79 × 10⁻⁵ 0.575 0.89240 10.05 13.3 8.67 × 10⁻⁵ 0.532 0.85250 10.14 14.3 1.06 × 10⁻⁴ 0.516 0.862
6. Conclusions
In this study, the influence of cyclic wetting and drying cycles onphysical and dynamic compressive properties on sandstone was inves-tigated. The SEM-images of sandstone specimens after every 10wettingand drying cycles were obtained. A series of physical properties includ-ing density, water absorption, porosity, P-wave velocity and SDI weremeasured, and the effect of water damage induced by cyclic wettingand drying on dynamic compressive strength of rock under differentstrain rates (ranging from 61 to 127 s−1) was experimentally studiedusing a SHPB system.
The test results show that, with the increase of cyclic number, thedensity, P-wave velocity and SDI of rock specimens decrease, whilethe water absorption and porosity increase. The dynamic compressivestrength of sandstone increases with the increase of strain rate at agiven cyclic treatment number. Meanwhile, the dynamic compressivestrength and elastic modulus at the same strain rate decrease whenthe number of wetting and drying cycles increases.
The SEM-images analysis indicated that cyclic wetting and dryingtreatments contributed to the internal micro-cracks growth and expan-sion in rock materials allowing for more water absorption and higherporosity. The porositywas used to quantify thewater damage due to cy-clic wetting and drying. An empirical equation was also derived fromthe experimental results to describe the effect of strain rate and numberof wetting and drying cycles on dynamic compressive strength of rockmaterials, which could be applied to engineering practices, such astunneling, mining and rock excavation.
Acknowledgements
The work is supported by financial grants from the National BasicResearch Program of China (2015CB060200), the National Natural Sci-ence Foundation of China (51322403, 51274254) and the GraduatedStudents' Research and Innovation Fund Project of Central South Uni-versity (2016zzts449). The authors are very grateful to the financialcontribution and convey their appreciation of the organization forsupporting this basic research. The authors also wish to thank Dr. FengLi from the University of South China for his helping on experimentsusing the EDX and SEM and two anonymous reviewers for their com-ments helping improve the manuscript.
References
Azimian, A., Ajalloeian, R., 2015. Empirical correlation of physical and mechanical proper-ties of marly rocks with p wave velocity. Arab. J. Geosci. 8, 1–11.
Brown, E.T., 1981. Rock characterization testing and monitoring. Biospectroscopy 4 (4),219–227.
Coates, G.R., Xiao, L., Prammer, M.G., 1999. NMR Logging: Principles and Applications. GulfProfessional Publishing, Houston.
Dai, F., Huang, S., Xia, K., Tan, Z., 2010. Some fundamental issues in dynamic compressionand tension tests of rocks using split hopkinson pressure bar. Rock Mech. Rock. Eng.43 (6), 657–666.
Gökceoğlu, C., Ulusay, R., Sönmez, H., 2000. Factors affecting the durability of selectedweak and clay-bearing rocks from Turkey, with particular emphasis on the influenceof the number of drying and wetting cycles. Eng. Geol. 57 (3–4), 215–237.
Gray, G.T., 2000. Classic Split-Hopkinson Pressure Bar Testing. ASM International, Mate-rials Park, OH, pp. 462–476.
Hale, P.A., Shakoor, A., 2003. A laboratory investigation of the effects of cyclic heating andcooling, wetting and drying, and freezing and thawing on the compressive strengthof selected sandstones. Environ. Eng. Geosci. 9 (2), 117–130.
Hatampour, A., Schaffie, M., Jafari, S., 2016. Estimation of NMR total and free fluid porosityfrom seismic attributes using intelligent systems: a case study from an Iranian car-bonate gas reservoir. Arab. J. Sci. Eng. 1–12.
Hua, W., Dong, S., Li, Y., Xu, J., Wang, Q., 2015. The influence of cyclic wetting and dryingon the fracture toughness of sandstone. Int. J. Rock Mech. Min. Sci. 78, 331–335.
Huang, S., Xia, K., 2015. Effect of heat-treatment on the dynamic compressive strength ofLongyou sandstone. Eng. Geol. 191, 1–7.
ISRM, 1979. Suggested methods for determining water content, porosity, density absorp-tion and related properties and swelling and slake-durability index properties. Int.J. Rock Mech. Min. Sci. 16.
Kassab, M.A., Weller, A., 2015. Study on p-wave and s-wave velocity in dry and wet sand-stones of Tushka region, Egypt. Egypt. J. Pet. 28 (1), 1–11.
12 Z. Zhou et al. / Engineering Geology 220 (2017) 1–12
Khanlari, G., Abdilor, Y., 2015. Influence of wet–dry, freeze–thaw, and heat–cool cycles onthe physical and mechanical properties of Upper Red sandstones in central Iran. Bull.Eng. Geol. Environ. 74 (4), 1287–1300.
Liu, X., Wang, Z., Fu, Y., Yuan,W.,Miao, L., 2016. Macro/microtesting and damage and deg-radation of sandstones under dry-wet cycles. Adv. Mater. Sci. Eng. 2016 (1), 1–16.
Murakami, S., 2012. Continuum Damage Mechanics: A Continuum Mechanics Approachto the Analysis of Damage and Fracture. Springer Science & Business Media.
Özbek, A., 2014. Investigation of the effects of wetting–drying and freezing–thawing cy-cles on some physical and mechanical properties of selected ignimbrites. Bull. Eng.Geol. Environ. 73 (2), 595–609.
Pardini, G., Guidi, G.V., Pini, R., Regues, D., Gallart, F., 1996. Structure and porosity of smec-titic mudrocks as affected by experimental wetting-drying cycles and freezing-thawing cycles. Catena 27, 149–165.
Sarman, R., Shakoor, A., Palmer, D.F., 1994. A multiple regression approach to predictswelling in mudrocks. Bull. Assoc. Eng. Geol. 31 (1), 107–112.
Sumner, P.D., Loubser, M.J., 2008. Experimental sandstone weathering using differentwetting and drying moisture amplitudes. Earth Surf. Process. Landf. 33 (6), 985–990.
Wang, X., Xiao, L., Xie, R., Zhang, Y., 2006. Study of NMR porosity for terrestrial formationin China. Sci. China 49 (3), 313–320.
Wu, F., Qi, S., Lan, H., 2005. Mechanism of uplift deformation of the dam foundation ofjiangya water power station, Hunan province, P.R. China. Hydrogeol. J. 13 (3),451–466.
Xia, K., Yao, W., 2015. Dynamic rock tests using split Hopkinson (kolsky) bar system - areview. J. Rock Mech. Geotech. Eng. 7 (01), 27–59.
Yao, W., Xu, Y., Wang, W., Kanopolous, P., 2015. Dependence of dynamic tensile strengthof longyou sandstone on heat-treatment temperature and loading rate. Rock Mech.Rock. Eng. 1–17.
Zhang, B.Y., Zhang, J.H., Sun, G.L., 2015. Deformation and shear strength of rockfill mate-rials composed of soft siltstones subjected to stress, cyclical drying/wetting and tem-perature variations. Eng. Geol. 190, 87–97.
Zhang, H., Adoko, A.C., Meng, Z., Wang, H., Jiao, Y., 2016. Mechanism of themudstone tun-nel failures induced by expansive clay minerals. Geotech. Geol. Eng.:1–13 http://dx.doi.org/10.1007/s10706-016-0102-y.
Zhang, Q.B., Zhao, J., 2014. A review of dynamic experimental techniques and mechanicalbehaviour of rock materials. Rock Mech. Rock. Eng. 47 (4), 1411–1478.
Zhou, Y.X., Xia, K., Li, X.B., Li, H.B., Ma, G.W., Zhao, J., et al., 2012. Suggested methods fordetermining the dynamic strength parameters and mode-i fracture toughness ofrock materials. Int. J. Rock Mech. Min. Sci. 49 (1), 105–112.
Zhou, Z.L., Cai, X., Cao, W., Li, X., Xiong, C., 2016a. Influence of water content on mechan-ical properties of rock in both saturation and drying processes. Rock Mech. Rock. Eng.49 (8), 3009–3025.
Zhou, Z.L., Cai, X., Zhao, Y., Chen, L., Xiong, C., Li, X., 2016b. Strength characteristics of dryand saturated rock at different strain rates. Trans. Nonferrous Metals Soc. China 26(7), 1919–1925.
Zhou, Z.L., Li, X., Liu, A., Zou, Y., 2011. Stress uniformity of split Hopkinson pressure barunder half-sine wave loads. Int. J. Rock Mech. Min. Sci. 48 (4), 697–701.
本文献由“学霸图书馆-文献云下载”收集自网络,仅供学习交流使用。
学霸图书馆(www.xuebalib.com)是一个“整合众多图书馆数据库资源,
提供一站式文献检索和下载服务”的24 小时在线不限IP
图书馆。
图书馆致力于便利、促进学习与科研,提供最强文献下载服务。
图书馆导航:
图书馆首页 文献云下载 图书馆入口 外文数据库大全 疑难文献辅助工具


![Passive Air Cavity Convection on the Wetting and Drying ...Passive Air Cavity Convection on the Wetting and Drying Behavior of Building Envelopes ... drying of brickwork [Jung 1985]](https://img.pdfslide.us/doc/110x75/5e7f71bf3e038f433668467d/passive-air-cavity-convection-on-the-wetting-and-drying-passive-air-cavity-convection.jpg)