Embed Size (px)
Citation preview

Federal Reserve Bank of Dallas Globalization and Monetary Policy Institute
Working Paper No. 174 http://www.dallasfed.org/assets/documents/institute/wpapers/2014/0174.pdf
Inflation Targeting and the Anchoring of Inflation Expectations:
Cross-country Evidence from Consensus Forecasts*
J. Scott Davis Federal Reserve Bank of Dallas
April 2014
Abstract Using survey data of inflation expectations across a 36 developed and developing countries, this paper examines whether the adoption of inflation targeting has helped to anchor inflation expectations. We examine the response of inflation expectations following a shock to inflation, inflation expectations, and oil prices. For the 13 countries that adopted inflation targeting midway through the time period used in this study, there is a significant difference in the responses between the earlier and the later subperiods. A shock leads to a positive, significant, and persistent increase inflation expectations in the earlier, pre-targeting subperiod, but the same response is much less significant and persistent in the later, post-targeting subperiod. For the control group of 23 countries that did not adopt inflation targeting during this time period, there is no difference between responses in the earlier and the later sub-periods. JEL codes: D80, E31, E50
* J. Scott Davis, Research Department, Federal Reserve Bank of Dallas, 2200 N. Pearl Street, Dallas, TX 75201. 214-922-5124. [email protected]. I would like to thank Alexander Chudik, Mark Wynne and seminar participants at the Federal Reserve Bank of Dallas for many helpful comments and suggestions. I would also like to thank Adrienne Mack and Peyton Odom for excellent research assistance. The views in this paper are those of the author and do not necessarily reflect the views of the Federal Reserve Bank of Dallas or the Federal Reserve System.

1 Introduction
Milton Friedman said that "Inflation is always and everywhere a monetary phenomenon"
(1968). Friedman was careful to qualify that inflation is a "steady and sustained rise in
prices", for while a number of factors can lead to a transitory movement in prices in the
short run, only monetary policy can cause a sustained rise in the price level over the medium
to long run. Movements in current inflation could be driven by a number of factors unrelated
to monetary policy, but the expectation of inflation over the long run should be entirely driven
by their perception of monetary policy.
The benefit of setting a credible inflation target is that it anchors inflation expectations
(Bernanke et al., 2001). If the central bank announces that it will keep inflation at x% over
the medium to long run, and agents believe them, then the public’s inflation expectations
should be x%.
Given the general lack of direct observations of inflation expectations for many countries,
most empirical papers that test the effect of inflation targeting measure the effect of targeting
on the level and variability of observed inflation. Here the evidence about the effectiveness
of inflation targeting is mixed. Mishkin and Schmidt-Hebbel (2007) find that the adoption
of inflation targeting in developed countries has led to a steeper drop in the level and vari-
ability of observed inflation than in similar countries that did not adopt inflation targeting.
Gonçalves and Salles (2008) extend this analysis to a group of developing countries and find
the opposite. They argue that, compared with other developing countries that did not adopt
inflation targeting, inflation targeting countries have experienced significantly greater falls
in both the level and volatility of inflation. Ball and Sheridan (2005) find the same results,
but they argue that much of this is simply explained by a reversion to the mean. Brito and
Bystedt (2010) argue with a panel data study that these benefits of inflation targeting in
developing countries wash out when one controls for a common time component. Similarly,
Lin and Ye (2007; 2009) argue that after accounting for self-selection using propensity score
2

methods, the adoption of inflation targeting has no effect on either the level or volatility or
observed inflation in both developed and developing countries.
Walsh (2007) and Crowe (2010) argue that the adoption of inflation targeting boosts the
transparency of the central bank, and Crowe and Meade (2008) and Dincer and Eichengreen
(2007; 2009; 2013) find empirical evidence that greater central bank transparency reduces
both the level and the variability of observed inflation.
Since inflation expectations are incorporated into wage and price setting, which then
affect the price level in the future, the unanchoring of inflation expectations is closely related
to the persistence of observed inflation. Benati (2008) estimates inflation persistence in
many different countries across many different monetary regimes. He finds that inflation
persistence was near zero in many of the countries on the gold standard, while he cannot
reject the hypothesis that in many developed countries inflation followed a random walk
throughout much of the post-World War II period. He finds that in the post-Volcker United
States, inflation does not follow a random walk but the persistence parameter is still positive
and significant, while persistence is near zero in many inflation targeting countries.
Using more direct measures of inflation expectations from far forward Treasury yields,
Gürkaynak et al. (2005) find that in the U.S., long-run inflation expectations respond to
macroeconomic news. Long-forward rates, which they argue are mainly composed of inflation
expectations, should not respond to macroeconomic news if inflation expectations are truly
anchored. Gürkaynak et al. (2006) do a similar exercise but compare the response of far-
forward rates in the U.S., the UK, and Sweden to macroeconomic news. They find that
far forward rates respond very little to news in inflation targeting Sweden and respond the
most in the U.S.1 Their sample contains data from the UK from both before and after
the independence of the Bank of England. They find that far forward rates from pre-
independence UK behave more like those from the U.S., but far forward rates from post-
independence UK behave more like Sweden. Gürkaynak et al. (2007) find the same results
1The U.S. Federal Reserve adopted a numerical infaltion target in early 2012.
3
when comparing the behavior of long-run inflation expectations in the United States with
those from inflation targeting Canada and Chile. Similarly Beechey et al. (2011) use far
forward inflation expectations derived from inflation swaps and find that far forward inflation
expectations in the U.S. are more sensitive to current macroeconomic news than far-forward
expectations in a number of inflation targeting European countries.
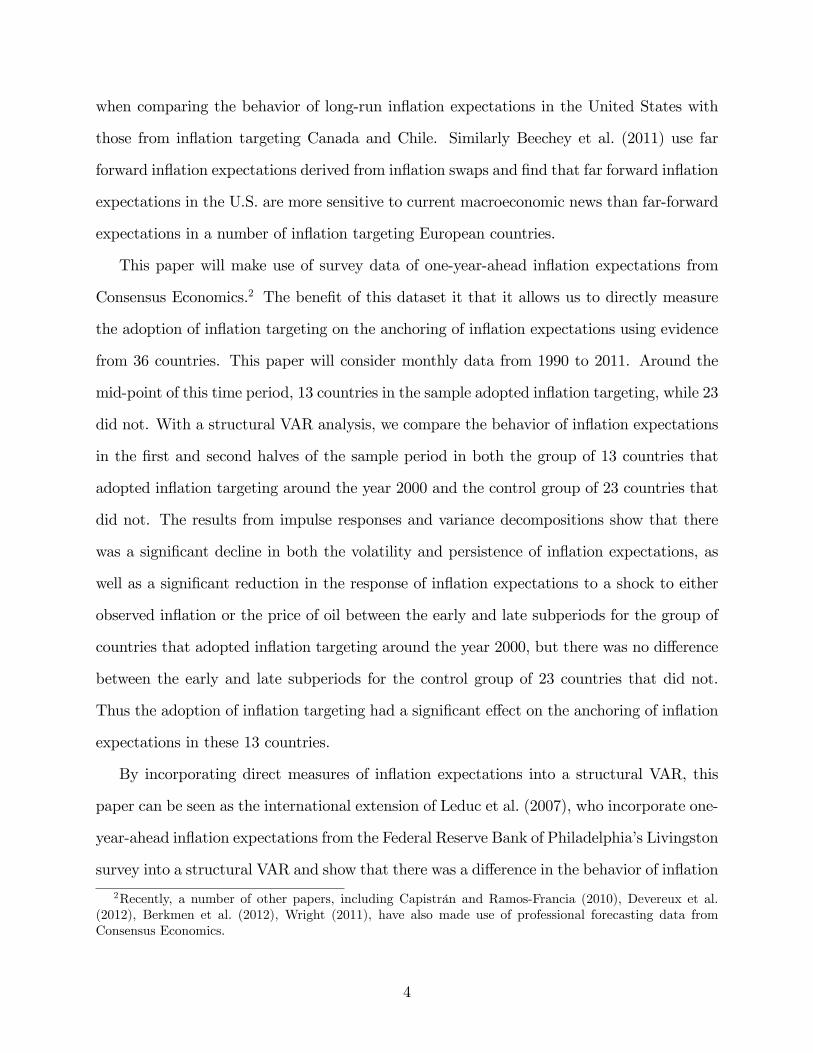
This paper will make use of survey data of one-year-ahead inflation expectations from
Consensus Economics.2 The benefit of this dataset it that it allows us to directly measure
the adoption of inflation targeting on the anchoring of inflation expectations using evidence
from 36 countries. This paper will consider monthly data from 1990 to 2011. Around the
mid-point of this time period, 13 countries in the sample adopted inflation targeting, while 23
did not. With a structural VAR analysis, we compare the behavior of inflation expectations
in the first and second halves of the sample period in both the group of 13 countries that
adopted inflation targeting around the year 2000 and the control group of 23 countries that
did not. The results from impulse responses and variance decompositions show that there
was a significant decline in both the volatility and persistence of inflation expectations, as
well as a significant reduction in the response of inflation expectations to a shock to either
observed inflation or the price of oil between the early and late subperiods for the group of
countries that adopted inflation targeting around the year 2000, but there was no difference
between the early and late subperiods for the control group of 23 countries that did not.
Thus the adoption of inflation targeting had a significant effect on the anchoring of inflation
expectations in these 13 countries.
By incorporating direct measures of inflation expectations into a structural VAR, this
paper can be seen as the international extension of Leduc et al. (2007), who incorporate one-
year-ahead inflation expectations from the Federal Reserve Bank of Philadelphia’s Livingston
survey into a structural VAR and show that there was a difference in the behavior of inflation
2Recently, a number of other papers, including Capistrán and Ramos-Francia (2010), Devereux et al.(2012), Berkmen et al. (2012), Wright (2011), have also made use of professional forecasting data fromConsensus Economics.
4

expectations in the United States between the pre- and post-1979 periods. They conclude
that the change in U.S. monetary regime in 1979 with the Fed Chairmanship of Paul Volcker
served to anchor U.S. inflation expectations.3 In extending this analysis to 36 countries this
paper reaches a similar conclusion; the adoption of inflation targeting by many countries
around the mid-point of our sample period was a similar monetary regime change that
served to anchor inflation expectations between the first and the second halves of our sample
period.
This paper will proceed as follows. Section 2 presents the structural VAR model used
in this paper and discusses the variables and sources of data. The results of this structural
VAR analysis are presented in section 3. First with impulse response diagrams and then
with the results from variance decompositions, this paper will show that there was a major
change in the behavior of inflation expectations between the first and second halves of the
sample period for the 13 countries that adopted inflation targeting around the year 2000,
but there was no change in the behavior of inflation expectations in the control group of
23 countries that did not. Section 4 discusses the robustness of these results to alternative
identification schemes in the structural VAR, and to the exclusion of certain countries from
the control group. Finally section 5 concludes with some directions for further research.
2 Data and Econometric Model
The benchmark model is a structural VAR of one-year-ahead expected inflation (EPi), ob-
served inflation (Pi), the output gap (OG), the change in the nominal price of oil (PO), and
the nominal interest rate (R):
Yt = A (L)Yt−1 + ut (1)
3See Clarida et al. (2002), Lubik and Schorfheide (2004), Boivin and Giannoni (2006), Stock and Watson(2007), Blanchard and Gali (2007), Blanchard and Riggi (2009), Mehra and Herrington (2008), Goodfriendand King (2005), Ireland (2007), Schorfheide (2005) and Del Negro and Eusepi (2012), Bianchi (2013), amongothers, for further evidence of a shift in U.S. monetary policy in about 1979.
5

where Yt is a 5 × 1 vector. Impulse responses and variance decompositions are generated
with a recursive identification scheme with the ordering [EPi,Pi,OG,PO,R]. Expected infla-
tion is ordered first since, as will be discussed later in this section, it is pre-determined by
construction. In a later section we will test the robustness of the main results to alternative
ordering schemes.
This VAR model is estimated to produce impulse responses for each country in the study
in both the pre-2000 and post-2000 periods. The optimal lag length is chosen for each
separate estimation based on SIC tests.
2.1 Data
The countries in the analysis are separated into four groups. Developed countries that
adopted inflation targeting around the year 2000 (Group 1), emerging market countries that
adopted inflation targeting around the year 2000 (Group 2), developed countries that did not
adopt inflation targeting around the year 2000 (Group 3), and emerging market countries
that did not adopt inflation targeting around the year 2000 (Group 4). The members of each
group, and the year that each member of groups 1 or 2 adopted inflation targeting are listed
in table 1.
Table 1: Countries included in this study.Group 1: Group 2: Group 3: Group 4:
Norway (2001) Columbia (1999) Canada ArgentinaS. Korea (1998) Slovakia (2005) France BangladeshSwitzerland (2000) Romania (2005) Germany India
Brazil (1999) Ireland MalaysiaHungary (2001) Italy PakistanIndonesia (2005) Japan SingaporeMexico (1999) Spain ChilePeru (2002) Sweden Slovenia
S. Africa (2000) U.K. TaiwanPhilippines (1998) U.S. Venezuela
Finland Hong KongUruguay
6

Notice that while groups 1 and 2 are made up of countries that adopted inflation targeting
sometime around the year 2000, groups 3 and 4 are a control group and are made up of some
countries that adopted inflation targeting much earlier (like Canada, 1991 or Chile, 1990)
and other countries that never adopted inflation targeting. What distinguishes the countries
in groups 3 and 4 and what sets them apart as a control group is simply the fact that they
did not adopt inflation targeting around the mid-point of time period studied in this paper.
We will consider monthly data from 1990 to 2011. The first variable in the benchmark
ordering is the expected inflation rate, EPi. This data is taken from the professional forecast-
ing firm, Consensus Economics. The Consensus survey data is collected around the middle
of the month. So for instance, the observation of EPi for a given country in July of a given
year is collected around July 15th. Information about the observed inflation rate over the
month (Pi), and the output gap (OG) wouldn’t be known until the data for July is released
sometime in August. Likewise, the change in the price of oil (PO) and the average interest
rate over the month (R) aren’t known until the end of July. Thus the observation for ex-
pected inflation (EPi) is recorded long before the values of any contemporaneous variables
are observed.4
The Consensus survey asks survey respondents for their forecast of observed inflation
during this calendar year and the next calendar year. Thus the one-year-ahead expected
inflation rate is not recorded. We use a simple weighted extrapolation to combine the
inflation expectations over two calendar years into one measure of one-year-ahead inflation
expectations, where the weight placed on the response for expected inflation in this calendar
year is simply the number of months that are left in the year. So for instance, the one-
year-ahead expected inflation rate in March is a weighted average of the forecasts for this
year and next year, where the weight on the forecast for this calendar year is 9/12. The
weight on the forecast for this calendar year for the one-year-ahead expected inflation rate
in September is 4/12.
4More information about this data from Consensus Economics Inc. can be found atwww.consensuseconomics.com/what_are_consensus_forecasts.htm.
7

The other variables in the VAR are standard. The observed inflation rate is simply the
year-over-year change in the headline consumer price index. The output gap is simply the
percent deviation of industrial production from its HP filtered trend. The change in the
nominal price of oil is simply the month-over-month change in the price of oil converted
into local currency terms at the spot exchange rate. The interest rate is simply the rate on
3-month government bills.
The time series of one-year-ahead inflation expectations and observed inflation are pre-
sented in figures 1 and 2. Figure 1 plots the GDP weighted average of inflation expectations
and observed inflation for the countries that adopted inflation targeting around the year 2000
(groups 1 and 2) and those that did not (groups 3 and 4). The data for most countries begins
in 1990, but the data for some countries in the study do not begin until the mid-1990s.
The figure shows that both inflation expectations and observed inflation were relatively
steady across this entire time period for counties in the control group. There is no noticeable
difference in either the level or the dynamics of inflation expectations or observed inflation
between the pre- and post-2000 periods in the solid blue line. This is in contrast to the
countries that adopted inflation targeting around the mid-point of this sample, where infla-
tion expectations and observed inflation were high and volatile in the first half of the sample
period, but were steady and are similar to those in the control group during the second half
of the sample period.
Figure 2 reports these same statistics, but here the time series from the developed coun-
tries in the study are presented separately from those for the emerging market countries.
The top half of the figure plots the time series for inflation expectations and observed infla-
tion for both the developed countries that adopted inflation targeting around the mid-point
of the sample (group 1) and the developed countries that did not adopt inflation targeting
around 2000 (group 3). The bottom half of the figure does the same for the emerging market
countries in the study (groups 2 and 4).
Figure 2 shows that the same results seen earlier continue to hold when developed coun-
8

tries are considered separately from emerging market countries. In both cases, there is a
noticeable difference between the first and second half of the sample periods for the coun-
tries that adopted inflation targeting around the year 2000, and very little change between
the two halves of the sample period in the countries that did not.
3 Results
To show how the adoption of inflation targeting has anchored inflation expectations and
changed the behavior of both inflation expectations and observed inflation, we will present
the results in two parts. In the first we will examine the responses of observed inflation and
inflation expectations to a shock to either inflation expectations, observed inflation, or the
price of oil. These impulse responses will be computed separately for both the pre-2000 and
post-2000 periods, and we compare the difference between the pre- and post-2000 responses
in the 13 countries that adopted inflation targeting around the year 2000 with the difference
in the control group of 23 countries that did not. In the second part of this section we
examine variance decompositions to identify what factors drove the fluctuations in inflation
expectations in the pre- and post-2000 subperiods.
3.1 Impulse responses
Impulse responses are calculated in both the pre- and post-2000 subperiods in each of the
36 countries in this study. As discussed earlier, in the benchmark specification, shocks
are identified with a recursive identification scheme with the ordering: expected inflation,
observed inflation, the output gap, the change in the price of oil, and the short-term interest
rate. In the next section we will instead consider the specification where expected inflation
is ordered third, after observed inflation and the output gap.
Impulse responses are calculated for each of the 36 countries. However, to save space,
this paper will only present the GDP weighted average of these responses across the different
9

country groupings listed in table 1. In addition, this paper will only report the responses
of inflation expectations and observed inflation to either a shock to inflation expectations, a
shock to observed inflation, or a shock to the price of oil.5
These responses, for the 13 countries that adopted inflation targeting around the year
2000 (groups 1 and 2 in table 1) are presented in figure 3. The same impulse responses for
the control group of 23 countries are presented in figure 4.
Each figure presents the responses of inflation expectations and observed inflation fol-
lowing three shocks. The top row of diagrams presents the responses to a shock to expected
inflation, the second row presents the responses to a shock to observed inflation, and the
third row presents the responses to a shock to the month-over-month growth rate in the
price of oil. Each diagram plots the response and one standard error confidence bands using
the pre-2000 data in the dashed red line and using the post-2000 data with the solid blue
line.6
Figure 3 shows that for the group of 13 countries that adopted inflation targeting around
the year 2000, the responses to a shock are much greater and much more persistent in the
pre-2000 data than in the post-2000 data. The diagrams in the top row of the figure show
that the volatility of shocks to expected inflation were much smaller in the later subperiod,
and they would quickly dissipate. The diagrams in the second and third rows of the figure
show that in the early subperiod, a shock to either observed inflation or the price of oil would
lead to a large and persistent increase in inflation expectations, but the shocks have little
effect on inflation expectations in the post-2000 period.
5The results for any individual country, or the responses of the other variables in the model are availablefrom the author on request.
6Of course the standard error for a weighted average impulse response is simply equal to the weightedaverage of standard errors of the individual impulse responses only when the error terms in the impulseresponses are perfectly correlated across countries. If they are not, the standard error of the weighted averageimpulse response will be lower. Since the impulse responses for each country are estimated separately there isno way to calculate a standard error of the weighted average impulse response without estimating the cross-dependence of individual impulse response estimates across countries. However, the goal of this exercise isto show that the weighted average impulse response in the earlier period lies well outside of the confidencerange of the weighted average impulse response in the later period. By assuming that the standard error forthe weighted average impulse response is simply equal to the weighted average of standard errors, we areassuming the highest value possible for this standard error.
10

By contrast, figure 4 shows that in the control group there is very little difference between
the pre- and post-2000 impulse responses. The top row of the figure shows that shocks to
expected inflation are actually more volatile in the post-2000 data, and the persistence of
inflation expectations is about the same in both subperiods. The diagrams in the second
and third row of the figure show that the response of inflation expectations following a shock
to either observed inflation or the price of oil was actually slightly greater in the post-2000
period, and the confidence bands show that the difference between the responses in the early
and late subperiods in the control group of countries is not statistically significant.
Figures 5 and 6 repeat the same exercise, but only for the developed countries in the
study (groups 1 and 3 in table 1). The top row of figure 5 shows that a shock to expected
inflation is more persistent in the pre-2000 period than in the post-2000 period in the group
of developed countries that adopted inflation targeting around the year 2000. The top row
of figure 6 shows that there is not a statistically significant difference in the responses to a
shock to expected inflation in the control group of countries. Furthermore, the second and
third rows of figure 5 show that the response of expected inflation following a shock to either
observed inflation or a shock to the price of oil is greater and much more persistent in the
group of countries that adopted inflation targeting around 2000, but these same diagrams in
figure 6 shows that there is not a statistically significant difference between the responses in
the two subperiods in the control group developed countries.
Figures 7 and 8 repeat the same exercise, but for the emerging market countries in the
study (groups 2 and 4 in table 1). The same results hold. Figure 7 shows that there is a
significant difference in the volatility and persistence of expected inflation between the pre-
and post-2000 periods in the group of countries that adopted inflation targeting, but there
isn’t a significant difference in the responses between the two subperiods in the control group
of emerging market countries.
11

3.2 Variance decompositions
To identify which shocks are responsible for the fluctuations in both expected inflation and
observed inflation, variance decompositions are calculated in both the pre- and post-2000
subperiods in each of the 36 countries in this study. In the benchmark specification, shocks
are identified with a recursive identification scheme with the ordering expected inflation,
observed inflation, the output gap, the change in the price of oil, and the short-term interest
rate. In the next section we will instead consider the specification where expected inflation
is ordered third, after observed inflation and the output gap. These variance decompositions
are calculated for each of the 36 countries. However, to save space, this paper will only
present the GDP weighted average of these variance decompositions across the different
country groupings listed in table 1.7
The decomposition of the variances of expected and observed inflation in both the group
of 13 countries that adopted inflation targeting around the year 2000 and the control group
of 23 countries that did not is presented in table 2.
The results in the table present the forecast error variance of expected inflation and the
share of that variance at the 12, 24, or 36 month horizon that can be explained by the five
shocks in the model. The first column in the table shows that for the set of 13 countries that
adopted infaltion targeting around the year 2000, there was a major drop in the forecast
error variance of inflation expectations at all horizons. The variability of the forecast error
fell from between 3-4% to around 1% between the pre- and post-2000 samples. Meanwhile
in the control group of countries, there was almost no change between the two time periods.
The third column in the table reports the share of the forecast error variance that is due to
shock to observed inflation. This describes the anchoring of inflation expectations. If a large
part of the forecast error variance of expected inflation is attributable to shocks to observed
inflation then inflation expectations are not well anchored. If this share falls between the
early and the late subperiods, then inflation expectations are becoming better anchored.
7The results for any individual country are available from the author on request.
12

The table shows that in the post-2000 subperiod, shocks to observed inflation explain about
11% of the variance of expected inflation in both groups of countries. However, in the pre-
2000 subperiod, shocks to observed inflation explain about 18% of the variance of expected
inflation in the control group of countries, but they explain as much as 26% of the variance
in expected inflation in the group of countries that did adopt inflation targeting around
2000. Thus the share of fluctuations in inflation expectations that are explained by shocks
to observed inflation has fallen between the early and late subperiods for both groups of
countries, but this share has fallen more in the group of countries that adopted inflation
targeting around the year 2000. The anchoring of inflation expectations has improved in
both groups of countries, but it has improved by more in the group of countries that adopted
inflation targeting between the two subperiods.
These results continue to hold when we consider developed countries separately from
emerging market countries. Table 3 presents this same decomposition of the forecast error
variance of expected inflation in the pre- and post-2000 subperiods when developed countries
and considered separately from emerging market countries. For the set of developed countries
that adopted inflation targeting around the year 2000, the forecast error variance of expected
inflation was nearly 0.8% in the pre-2000 period but around 0.6% in the post-2000 period.
There was almost no change, indeed a slight increase in the forecast error variance of expected
infaltion between the early and late subperiods in the control group of developed countries.
Similarly, in the developed countries that adopted infaltion targeting around the year 2000,
nearly 36% of the variance of expected inflation at a 12 month horizon was explained by
shocks to observed inflation in the pre-targeting period, but only 13% or the variance of
expected inflation is explained by the same shock in the post-targeting period. For the control
group of developed countries, the fall in this share was only from 18% to 11%. Thus within the
subset of developed countries, there is strong evidence that the adoption of inflation targeting
had a large effect on the anchoring of inflation expectations and significantly reduced the
share of fluctuations in expected inflation that are explained by shocks in observed inflation.
13

The results for the subset of emerging market counties are also presented in table 3. Again
we see a significant fall in the forecast error variance of expected infaltion between the early
and late subperiods for the set of emerging market countries that adopted inflation targeting
around the year 2000, from 5% to around 1%, but there was no change in the forecast error
variance of expected inflation in the control group of emerging market countries.
4 Sensitivity Analysis
To investigate the robustness of these results, we will first test the sensitivity of these results
to an alternative recursive identification scheme where expected inflation in ordered after
both observed inflation and the output gap. Then we will test the sensitivity of these results
to different country groupings, namely if the results are robust to the exclusion of the Euro
Area countries (which also saw a major monetary regime change around the year 2000).
4.1 Re-ordering expected inflation
In the previous section, shocks used to calculate impulse responses or variance decompositions
are identified with a recursive identification scheme with the ordering: expected inflation,
observed inflation, the output gap, the change in the price of oil, and the short-term interest
rate. By construction, since the Consensus survey responses are collected before the data
used to calculate the other variables in the model are known, expected inflation should not
respond to contemporaneous shock to the other variables in the model. However, since ob-
served inflation is calculated as year-over-year and the output gap is very persistent, one
could argue that forecasters have a reasonable approximation for contemporaneous observed
inflation and the output gap when completing the survey. In this case, a recursive identifi-
cation scheme with the ordering: observed inflation, the output gap, expected inflation, the
change in the price of oil, and the short-term interest rate might be more appropriate. The
responses of expected inflation and observed inflation to a shock to either expected inflation,
14

observed inflation, or the price of oil under this alternative identification scheme are pre-
sented in figure 9 and 10. Figure 9 presents the pre- and post-2000 responses for the group
of countries that adopted inflation targeting around the year 2000, and figure 10 presents
the responses for the control group of countries. The figures show that the responses are
very similar under both the benchmark identification schedule and the alternative scheme.8
Similarly, the decomposition of the variance of expected inflation under the alternative
ordering scheme is presented in table 4. The same results that were presented before under
the benchmark identification scheme are even more dramatic here. The share of the variance
of expected inflation at a 12 month horizon in the set of countries that adopted inflation
targeting around the year 2000 is 44% in the pre-2000 period and 24% in the post-2000
period. The same shares in the early and late subperiods for the control group of countries
is 22% and 20%, respectively.
4.2 Exclusion of the Euro Area countries
The analysis so far has considered two groups of countries, those that adopted inflation
targeting around the year 2000 and those that did not. The Euro Area countries in the
sample: France, Germany, Ireland, Italy, Spain, Finland, and Slovenia, which are all included
in the group of countries that did not adopt inflation targeting, also experienced a major
monetary regime change around this time. Therefore to ensure that the adoption of the euro
by so many countries in the control group is not clouding the results, we will reaggregate the
impulse responses and variance decompositions and remove these seven euro area countries
from the control group of countries that did not adopt inflation targeting.
The impulse responses for this new, ex-euro, control group are presented in figure 11.
These impulse responses for the control group should be compared to those in figure 4. The8In fact, the impulse responses under the two ordering schemes look so similar that the easiest way to
tell them apart is to notice that in the benchmark scheme, expected inflation is ordered before observedinflation, so in the second row of diagrams in figures 3 and 4, inflation expectations will not react to acontemporaneous shock to observed inflation. In the alternative scheme, observed inflation is ordered beforeexpected inflation, so in figures 9 and 10 observed inflation will not react to a contemporaneous shock toexpected inflation.
15

impulse responses in the two figures are nearly identical, and thus the inclusion or exclusion
of the euro area countries in the control group does not affect the results. The same holds true
for the variance decomposition in table 5. The the decomposition of the variance of expected
inflation in the ex-euro control group should be compared to the variance decomposition for
the entire control group in table 2. Again, there is hardly any difference in the results, and
thus the inclusion or the exclusion of the euro area countries in the control group doesn’t
affect the results.
5 Summary and Conclusion
By showing that there was a major change in the behavior of inflation expectations between
the pre- and post-targeting subperiods for a number of countries that adopted inflation
targeting around the year 2000, but there wasn’t a similar change in the behavior of inflation
expectations in the control group of countries, this paper shows that the adoption of inflation
targeting has served to anchor inflation expectations in a number of developed and developing
countries.
The natural next question to ask is why. What is it about inflation targeting that
serves to anchor inflation expectations? Is that it changes the behavior and the reaction
function of the central bank, or is it simply that the adoption of inflation targeting leads to
greater transparency? When the public has better information about the true intentions and
inflation fighting goals of the central bank they are less likely to change their expectations
about future inflation following a transitory shock to observed inflation.
In the U.S. case, using 1979 as a break-point, Clarida et al. (2002), Boivin and Giannoni
(2006), Ireland (2007), Lubik and Schorfheide (2004), Schorfheide (2005) all argue that the
reason for the difference in the behavior of expected and observed inflation between pre-
and post-1979 periods is that there was a significant change in the conduct of monetary
policy or the central bank’s reaction function occurring in 1979. However, this finding is
16
called into doubt by Sims and Zha (2006). Andolfatto and Gomme (2003) Erceg and Levin
(2003), Orphanides and Williams (2005; 2007) and Gaspar et al. (2006; 2011), Lansing
(2009), Blanchard and Riggi (2009) present models where agents are uncertain about the
credibility of the central bank. In this case, transitory shocks to observed inflation may be
misinterpreted as a change in the central bank’s long-term policy stance and thus shocks
to observed inflation would have an outsized effect on fluctuations in the public’s inflation
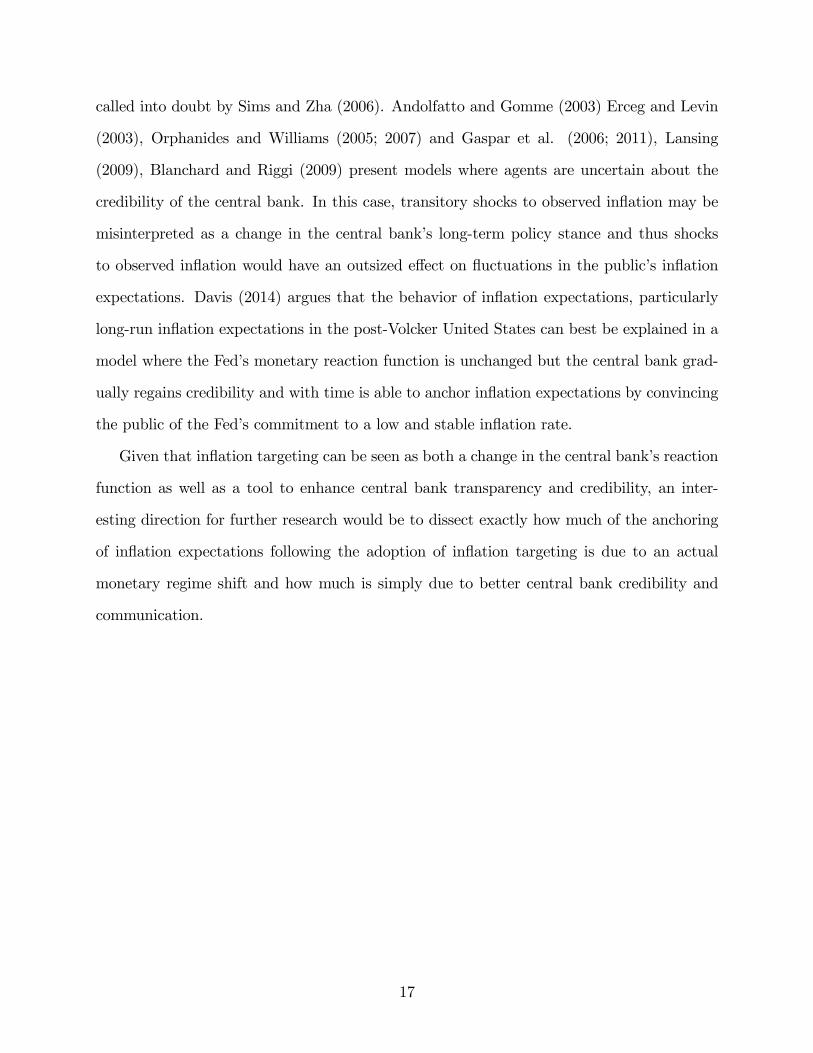
expectations. Davis (2014) argues that the behavior of inflation expectations, particularly
long-run inflation expectations in the post-Volcker United States can best be explained in a
model where the Fed’s monetary reaction function is unchanged but the central bank grad-
ually regains credibility and with time is able to anchor inflation expectations by convincing
the public of the Fed’s commitment to a low and stable inflation rate.
Given that inflation targeting can be seen as both a change in the central bank’s reaction
function as well as a tool to enhance central bank transparency and credibility, an inter-
esting direction for further research would be to dissect exactly how much of the anchoring
of inflation expectations following the adoption of inflation targeting is due to an actual
monetary regime shift and how much is simply due to better central bank credibility and
communication.
17

References
Andolfatto, D., Gomme, P., 2003. Monetary policy regimes and beliefs. International Eco-nomic Review 44, 1—30.
Ball, L. M., Sheridan, N., 2005. Does inflation targeting make a difference? In: Bernanke,B. S., Woodford, M. (Eds.), The Inflation-Targeting Debate. University of Chicago Press,pp. 249—282.
Beechey, M. J., Johannsen, B. K., Levin, A. T., 2011. Are long-run inflation expectationsmore firmly anchored in the euro-area than in the United States? American EconomicJournal: Macroeconomics 3, 104—129.
Benati, L., 2008. Investigating inflation persistence across monetary regimes. Quarterly Jour-nal of Economics 123 (3), 1005—1060.
Berkmen, S. P., Gelos, G., Rennhack, R., Walsh, J. P., 2012. The global financial crisis:Explaining cross-country differences in the output impact. Journal of International Moneyand Finance 31 (1), 32—59.
Bernanke, B. S., Laubach, T., Mishkin, F. S., 2001. Inflation targeting: lessons from theinternational experience. Princeton University Press, Princeton, NJ.
Bianchi, F., 2013. Regime switches, agentsŠ beliefs, and post-world war II U.S. macroeco-nomic dynamics. Review of Economic Studies 80, 463—490.
Blanchard, O. J., Gali, J., September 2007. The macroeconomic effects of oil shocks: Whyare the 2000s so different from the 1970s? NBER Working Paper no. 13368.
Blanchard, O. J., Riggi, M., October 2009. Why are the 2000s so different from the 1970s?a structural interpretation of changes in the macroeconomic effects of oil prices. NBERWorking Paper no. 15467.
Boivin, J., Giannoni, M. P., 2006. Has monetary policy become more effective? Review ofEconomics and Statistics 88 (3), 445—462.
Brito, R. D., Bystedt, B., 2010. Inflation targeting in emerging economies, panel evidence.Journal of Development Economics 91, 198—210.
Capistrán, C., Ramos-Francia, M., 2010. Does inflation targeting affect the dispersion ofinflation expectations? Journal of Money, Credit, and Banking 42 (1), 113—134.
Clarida, R., Gali, J., Gertler, M., 2002. A simple framework for monetary policy analysis.Journal of Monetary Economics 49, 879—904.
Crowe, C., 2010. Testing the transparency benefits of inflation targeting: Evidence fromprivate sector forecasts. Journal of Monetary Economics 57, 226—232.
Crowe, C., Meade, E. M., 2008. Central bank independence and transparency: Evolutionand effectiveness. IMF Working Paper no. 08/119.
18

Davis, S., February 2014. Re-establishing credibility: The behavior of inflation expectationsin the post-volcker united states. Federal Reserve Bank of Dallas, Globalization and Mon-etary Policy Institute Working Paper no. 171.
Del Negro, M., Eusepi, S., 2012. Fitting observed inflation expectations. Journal of EconomicDynamics and Control, forthcoming.
Devereux, M. B., Yetman, J., Smith, G. W., 2012. Consumption and real exchange rates inprofessional forecasts. Journal of International Economics 86, 33—42.
Dincer, N. N., Eichengreen, B., 2007. Central bank transparency: Where, why, and withwhat effects? NBER Working Paper No. 13003.
Dincer, N. N., Eichengreen, B., 2009. Central bank transparency: Causes, consequences andupdates. mimeo.
Dincer, N. N., Eichengreen, B., 2013. Central bank transparency and independence: Updatesand new measures. Bank of Korea Working Paper no. 2013-21.
Erceg, C. J., Levin, A. T., 2003. Imperfect credibility and inflation persistence. Journal ofMonetary Economics 50, 915—944.
Friedman, M., 1968. Inflation: Causes and consequences. In: Dollars and Deficits: Livingwith America’s Economic Problems. Prentice-Hall, Englewood Cliffs, NJ, pp. 21—71.
Gaspar, V., Smets, F., Vestin, D., 2006. Adaptive learning, persistence, and optimal mone-tary policy. Journal of the European Economic Association 4, 376—385.
Gaspar, V., Smets, F., Vestin, D., 2011. Inflation expectations, adaptive learning, and opti-mal monetary policy. In: Friedman, B. M., Woodford, M. (Eds.), Handbook of MonetaryEconomics. Vol. 3B. North Holland, pp. 1055—1096.
Gonçalves, C. E. S., Salles, J. M., 2008. Inflation targeting in emerging economies: What dothe data say? Journal of Development Economics 85, 312—318.
Goodfriend, M., King, R. G., 2005. The incredible Volcker disinflation. Journal of MonetaryEconomics 52 (5), 981—1015.
Gürkaynak, R. S., Levin, A. T., Swanson, E. T., March 2006. Does inflation targeting anchorlong-run inflation expectations? evidence from long-term bond yields in the u.s., u.k., andsweden. Tech. Rep. Federal Reserve Bank of San Francisco Working Paper no. 2006-09.
Gürkaynak, R. S., Marder, A. N., Levin, A. T., Swanson, E. T., 2007. Inflation targetingand the anchoring of inflation expectations in the western hemisphere. FRBSF EconomicReview, 25—47.
Gürkaynak, R. S., Sack, B., Swanson, E. T., 2005. The sensitivity of long-term interestrates to economic news: Evidence and implications for macroeconomic models. AmericanEconomic Review 95 (1), 425—436.
19

Ireland, P. N., 2007. Changes in the Federal Reserves’s inflation target: Causes and conse-quences. Journal of Money, Credit, and Banking 39, 1851—1882.
Lansing, K. J., 2009. Time varying U.S. inflation dynamics and the New Keynesian Phillipscurve. Review of Economic Dynamics 12 (2), 304—326.
Leduc, S., Sill, K., Stark, T., 2007. Self-fulfilling expectations and the inflation of the 1970s:Evidence from the Livingston Survey. Journal of Monetary Economics 54, 433—459.
Lin, S., Ye, H., 2007. Does inflation targeting really make a difference? evaluating thetreatment effect of inflation targeting in seven industrial economies. Journal of MonetaryEconomics 54, 2521—2533.
Lin, S., Ye, H., 2009. Does inflation targeting make a difference in developing countries?Journal of Development Economics 89, 118—123.
Lubik, T., Schorfheide, F., 2004. Testing for indeterminacy: An application to u.s. monetarypolicy. American Economic Review 94 (1), 190—217.
Mehra, Y. P., Herrington, C., 2008. On the sources of movements in inflation expectations:A few insights from a VAR model. Federal Reserve Bank of Richmond Economic Quarterly94 (2), 121—146.
Mishkin, F. S., Schmidt-Hebbel, K., 2007. Does inflation targeting make a difference? In:Mishkin, F. S., Schmidt-Hebbel, K., Loayza, N. (Eds.), Monetary Policy under InflationTargeting. Central Bank of chile, pp. 291—372.
Orphanides, A., Williams, J. C., 2005. Imperfect knowledge, inflation expectations, and mon-etary policy. In: Bernanke, B. S., Woodford, M. (Eds.), The Inflation-Targeting Debate.University of Chicago Press, pp. 201—246.
Orphanides, A., Williams, J. C., 2007. Robust monetary policy with imperfect knowledge.Journal of Monetary Economics 54, 1406—1435.
Schorfheide, F., 2005. Learning and monetary policy shifts. Review of Economic Dynamics8, 392—419.
Sims, C. A., Zha, T., 2006. Where there regime switches in u.s. monetary policy? AmericanEconomic Review 96 (1), 54—80.
Stock, J. H., Watson, M. W., 2007. Why has U.S. inflation become harder to forecast?Journal of Money, Credit, and Banking 39 (1), 3—33.
Walsh, C. E., 2007. Transparency, flexibility, and inflation targeting. In: Mishkin, F. S.,Schmidt-Hebbel, K., Loayza, N. (Eds.), Monetary Policy under Inflation Targeting. Cen-tral Bank of chile, pp. 227—263.
Wright, J. H., 2011. Term premia and inflation uncertainty: Empirical evidence from aninternational panel dataset. American Economic Review 101 (4), 1514—1534.
20

1990 1994 1998 2002 2006 20100
2
4
6
8
10
12
14
16Inflation Expectations
1990 1994 1998 2002 2006 20102
0
2
4
6
8
10
12
14
16Inflation
Figure 1: Inflation expectations and observed inflation for the two groups of countries. Coun-tries that adopted inflation targeting around the year 2000 are presented in red. The countriesdid not are presented in blue. Inflation expectations data is from Consensus Economics Inc.
21

1990 1994 1998 2002 2006 20101
0
1
2
3
4
5
6
7
8Inflation Expectations
1990 1994 1998 2002 2006 20102
0
2
4
6
8
10Inflation
1990 1994 1998 2002 2006 20100
2
4
6
8
10
12
14
16
18
20Inflation Expectations
1990 1994 1998 2002 2006 20100
5
10
15
20
25Inflation
Figure 2: Inflation expectations and observed inflation for the two groups of countries. Coun-tries that adopted inflation targeting around the year 2000 are presented in red. The countriesdid not are presented in blue. Inflation expectations data is from Consensus Economics Inc.Plots for developed countries are presented in the top row and developing countries are inthe bottom row.
22

10 20 300.2
0
0.2
0.4
0.6
0.8
1
1.2Inf lation Expectations
10 20 300.5
0
0.5
1
1.5
2Inf lation
10 20 300.2
0
0.2
0.4
0.6
0.8Inf lation Expectations
10 20 300.5
0
0.5
1
1.5Inf lation
10 20 300.1
0
0.1
0.2
0.3
0.4
0.5
0.6Inf lation Expectations
10 20 300.2
0
0.2
0.4
0.6
0.8Inf lation
Figure 3: Impulse responses in countries that adopted inflation targeting around the year2000. Responses in the pre-2000 data are in red, responses from the post-2000 data arein blue. Diagrams on the top row are responses following a one S.D. shock to inflationexpectations, the second row are responses following a one S.D. shock to observed inflation,and the third row presents responses to a one S.D. shock to the price of oil. Dotted linesdenote one S.E. bands.
23

10 20 300.05
0
0.05
0.1
0.15
0.2
0.25
0.3Inf lation Expectations
10 20 300.1
0.05
0
0.05
0.1
0.15
0.2
0.25Inf lation
10 20 300.05
0
0.05
0.1
0.15Inf lation Expectations
10 20 300.1
0
0.1
0.2
0.3
0.4
0.5
0.6Inf lation
10 20 300.02
0
0.02
0.04
0.06
0.08
0.1
0.12Inf lation Expectations
10 20 300.05
0
0.05
0.1
0.15
0.2Inf lation
Figure 4: Impulse responses in countries that did not inflation targeting around the year2000. Responses in the pre-2000 data are in red, responses from the post-2000 data arein blue. Diagrams on the top row are responses following a one S.D. shock to inflationexpectations, the second row are responses following a one S.D. shock to observed inflation,and the third row presents responses to a one S.D. shock to the price of oil. Dotted linesdenote one S.E. bands.
24

10 20 300.05
0
0.05
0.1
0.15
0.2Inf lation Expectations
10 20 300.05
0
0.05
0.1
0.15
0.2Inf lation
10 20 300.1
0.05
0
0.05
0.1
0.15
0.2
0.25Inf lation Expectations
10 20 300.1
0
0.1
0.2
0.3
0.4
0.5
0.6Inf lation
10 20 300.02
0
0.02
0.04
0.06
0.08
0.1Inf lation Expectations
10 20 300.05
0
0.05
0.1
0.15
0.2
0.25
0.3Inf lation
Figure 5: Impulse responses in developed countries that adopted inflation targeting aroundthe year 2000. Responses in the pre-2000 data are in red, responses from the post-2000 dataare in blue. Diagrams on the top row are responses following a one S.D. shock to inflationexpectations, the second row are responses following a one S.D. shock to observed inflation,and the third row presents responses to a one S.D. shock to the price of oil. Dotted linesdenote one S.E. bands.
25

10 20 300.05
0
0.05
0.1
0.15
0.2Inf lation Expectations
10 20 300.1
0.05
0
0.05
0.1
0.15
0.2
0.25Inf lation
10 20 300.05
0
0.05
0.1
0.15Inf lation Expectations
10 20 300.1
0
0.1
0.2
0.3
0.4
0.5
0.6Inf lation
10 20 300.02
0
0.02
0.04
0.06
0.08
0.1
0.12Inf lation Expectations
10 20 300.05
0
0.05
0.1
0.15
0.2Inf lation
Figure 6: Impulse responses in developed countries that did not adopt inflation targetingaround the year 2000. Responses in the pre-2000 data are in red, responses from the post-2000 data are in blue. Diagrams on the top row are responses following a one S.D. shock toinflation expectations, the second row are responses following a one S.D. shock to observedinflation, and the third row presents responses to a one S.D. shock to the price of oil. Dottedlines denote one S.E. bands.
26

10 20 300.5
0
0.5
1
1.5Inf lation Expectations
10 20 300.5
0
0.5
1
1.5
2
2.5Inf lation
10 20 300.2
0
0.2
0.4
0.6
0.8
1
1.2Inf lation Expectations
10 20 300.5
0
0.5
1
1.5Inf lation
10 20 300.2
0
0.2
0.4
0.6
0.8Inf lation Expectations
10 20 300.5
0
0.5
1
1.5Inf lation
Figure 7: Impulse responses in developing countries that adopted inflation targeting aroundthe year 2000. Responses in the pre-2000 data are in red, responses from the post-2000 dataare in blue. Diagrams on the top row are responses following a one S.D. shock to inflationexpectations, the second row are responses following a one S.D. shock to observed inflation,and the third row presents responses to a one S.D. shock to the price of oil. Dotted linesdenote one S.E. bands.
27

10 20 300.4
0.2
0
0.2
0.4
0.6
0.8
1Inf lation Expectations
10 20 300.4
0.2
0
0.2
0.4
0.6Inf lation
10 20 300.2
0.1
0
0.1
0.2
0.3
0.4
0.5Inf lation Expectations
10 20 300.5
0
0.5
1
1.5Inf lation
10 20 300.2
0.1
0
0.1
0.2
0.3Inf lation Expectations
10 20 300.2
0.1
0
0.1
0.2
0.3Inf lation
Figure 8: Impulse responses in developing countries that did not adopt inflation targetingaround the year 2000. Responses in the pre-2000 data are in red, responses from the post-2000 data are in blue. Diagrams on the top row are responses following a one S.D. shock toinflation expectations, the second row are responses following a one S.D. shock to observedinflation, and the third row presents responses to a one S.D. shock to the price of oil. Dottedlines denote one S.E. bands.
28
10 20 300.2
0
0.2
0.4
0.6
0.8
1
1.2Inf lation Expectations
10 20 300.5
0
0.5
1
1.5Inf lation
10 20 300.2
0
0.2
0.4
0.6
0.8
1
1.2Inf lation Expectations
10 20 300.5
0
0.5
1
1.5Inf lation
10 20 300.1
0
0.1
0.2
0.3
0.4
0.5
0.6Inf lation Expectations
10 20 300.2
0
0.2
0.4
0.6
0.8Inf lation
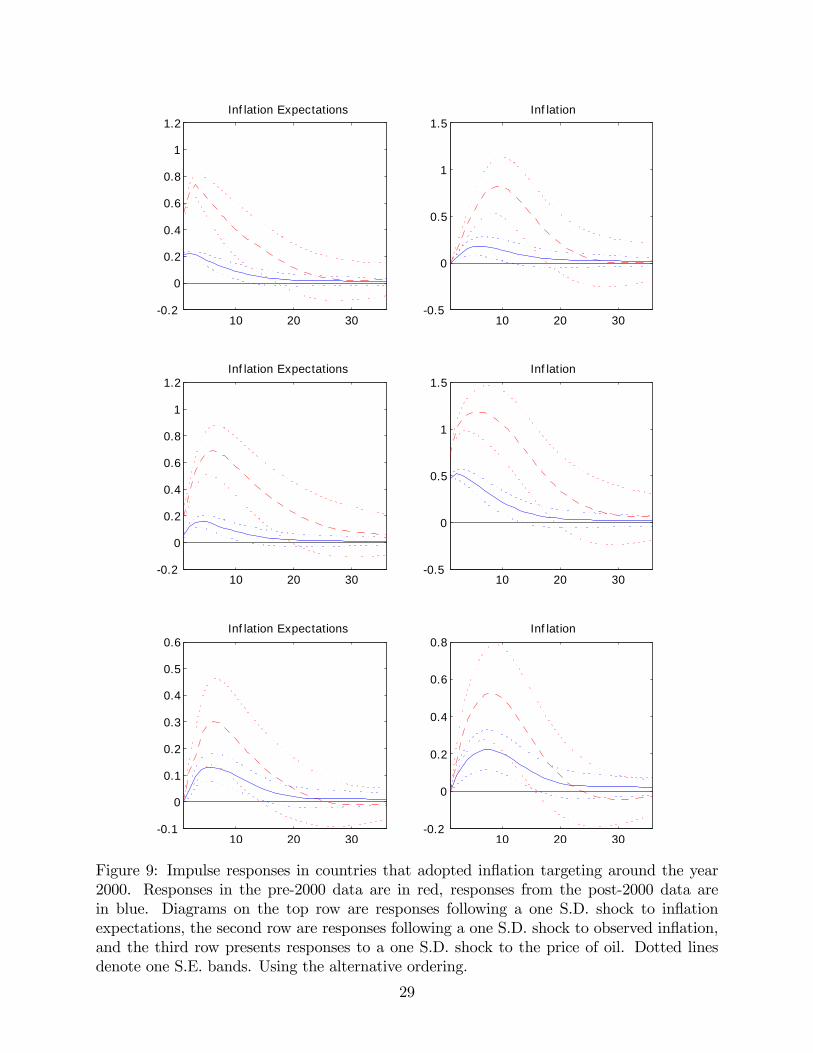
Figure 9: Impulse responses in countries that adopted inflation targeting around the year2000. Responses in the pre-2000 data are in red, responses from the post-2000 data arein blue. Diagrams on the top row are responses following a one S.D. shock to inflationexpectations, the second row are responses following a one S.D. shock to observed inflation,and the third row presents responses to a one S.D. shock to the price of oil. Dotted linesdenote one S.E. bands. Using the alternative ordering.
29

10 20 300.05
0
0.05
0.1
0.15
0.2
0.25
0.3Inf lation Expectations
10 20 300.1
0.05
0
0.05
0.1
0.15
0.2
0.25Inf lation
10 20 300.05
0
0.05
0.1
0.15Inf lation Expectations
10 20 300.1
0
0.1
0.2
0.3
0.4
0.5
0.6Inf lation
10 20 300.02
0
0.02
0.04
0.06
0.08
0.1
0.12Inf lation Expectations
10 20 300.05
0
0.05
0.1
0.15
0.2Inf lation
Figure 10: Impulse responses in countries that did not adopt inflation targeting around theyear 2000. Responses in the pre-2000 data are in red, responses from the post-2000 dataare in blue. Diagrams on the top row are responses following a one S.D. shock to inflationexpectations, the second row are responses following a one S.D. shock to observed inflation,and the third row presents responses to a one S.D. shock to the price of oil. Dotted linesdenote one S.E. bands. Using the alternative ordering.
30

10 20 300.05
0
0.05
0.1
0.15
0.2
0.25
0.3Inf lation Expectations
10 20 300.1
0
0.1
0.2
0.3Inf lation
10 20 300.05
0
0.05
0.1
0.15Inf lation Expectations
10 20 300.1
0
0.1
0.2
0.3
0.4
0.5
0.6Inf lation
10 20 300.05
0
0.05
0.1
0.15Inf lation Expectations
10 20 300.05
0
0.05
0.1
0.15
0.2
0.25
0.3Inf lation
Figure 11: Impulse responses in countries that did not adopt inflation targeting around theyear 2000. Responses in the pre-2000 data are in red, responses from the post-2000 dataare in blue. Diagrams on the top row are responses following a one S.D. shock to inflationexpectations, the second row are responses following a one S.D. shock to observed inflation,and the third row presents responses to a one S.D. shock to the price of oil. Dotted linesdenote one S.E. bands. Excluding all Euro Area countries.
31

Table 2: Variance decomposition of inflation expectations. Average across all countries.Countries that adopted inflation targeting around 2000
FEV Inf Ex Inf OG Oil RPre-20001 year 3.21 58.63 25.64 3.44 6.50 5.792 year 3.64 49.95 29.85 7.00 6.90 6.303 year 3.77 47.38 30.37 9.06 6.92 6.27
Post-20001 year 0.91 57.01 11.31 10.36 12.50 8.812 year 0.99 52.11 13.22 10.83 12.49 11.353 year 1.01 50.60 14.17 10.67 12.47 12.10
Countries that did not adopt inflation targeting around 2000
FEV Inf Ex Inf OG Oil RPre-20001 year 0.54 47.44 18.43 14.04 15.73 4.362 year 0.70 37.63 20.61 19.06 16.20 6.503 year 0.78 34.39 21.04 20.52 16.00 8.04
Post-20001 year 0.67 58.09 10.96 13.13 14.36 3.462 year 0.76 51.10 11.48 19.80 13.28 4.343 year 0.80 48.11 11.95 22.18 12.69 5.08
Notes: FEV stands for Forecast Error variance
32

Table3:Variancedecompositionofinflationexpectations.Averageacrossdevelopedandemergingmarketcountries.
Countriesthatadoptedinflationtargetingaround2000
DevelopedCountries
EmergingMarketCountries
FEV
InfEx
Inf
OG
Oil
RFEV
InfEx
Inf
OG
Oil
RPre-2000
1year
0.56
46.6635.95
2.65
5.77
8.97
4.44
64.15
20.88
3.81
6.83
4.33
2year
0.72
31.9143.37
7.84
7.62
9.27
4.98
58.27
23.62
6.61
6.57
4.93
3year
0.77
26.6443.9413.41
7.72
8.29
5.15
56.95
24.11
7.05
6.56
5.34
Post-2000
1year
0.56
42.5512.8623.5111.20
9.88
1.07
63.68
10.60
4.30
13.10
8.32
2year
0.60
37.8915.1524.1810.4112.37
1.18
58.67
12.32
4.67
13.4510.88
3year
0.60
37.0916.8423.3810.3212.36
1.20
56.82
12.94
4.81
13.4611.97
Countriesthatdidnotadoptinflationtargetingaround2000
DevelopedCountries
EmergingMarketCountries
FEV
InfEx
Inf
OG
Oil
RFEV
InfEx
Inf
OG
Oil
RPre-2000
1year
0.42
47.2317.7514.6016.68
3.74
2.22
50.23
27.63
6.51
2.90
12.74
2year
0.56
37.3919.7719.9817.17
5.69
2.60
40.89
31.86
6.58
3.17
17.50
3year
0.64
34.0120.2321.5416.95
7.27
2.78
39.49
32.09
6.77
3.18
18.47
Post-2000
1year
0.57
58.6110.7112.4714.83
3.38
2.06
51.06
14.3222.12
8.03
4.48
2year
0.63
51.6610.8819.6813.72
4.06
2.56
43.52
19.6221.36
7.37
8.13
3year
0.66
48.6411.2422.2513.11
4.76
2.72
40.90
21.5121.17
7.02
9.41
Notes:FEVstandsforForecastErrorVariance
33

Table 4: Variance decomposition of inflation expectations. Average across all countries,Using the alternative ordering.
Countries that adopted inflation targeting around 2000
FEV Inf Ex Inf OG Oil RPre-20001 year 3.21 38.35 44.30 5.05 6.50 5.792 year 3.64 31.12 47.42 8.26 6.90 6.303 year 3.77 28.96 47.59 10.26 6.92 6.27
Post-20001 year 0.91 42.87 24.11 11.70 12.50 8.812 year 0.99 38.51 25.60 12.05 12.49 11.353 year 1.01 37.22 26.37 11.85 12.47 12.10
Countries that did not adopt inflation targeting around 2000
FEV Inf Ex Inf OG Oil RPre-20001 year 0.54 37.74 22.63 19.53 15.73 4.362 year 0.70 28.71 24.40 24.18 16.20 6.503 year 0.78 25.97 24.66 25.33 16.00 8.04
Post-20001 year 0.67 40.16 20.94 21.08 14.36 3.462 year 0.76 34.86 19.88 27.65 13.28 4.343 year 0.80 32.78 19.64 29.82 12.69 5.08
Notes: FEV stands for Forecast Error variance
34

Table 5: Variance decomposition of inflation expectations.
Excluding Euro Area Countries
FEV Inf Ex Inf OG Oil RPre-20001 year 0.61 46.18 16.66 13.66 19.86 3.632 year 0.75 37.30 16.64 17.99 20.77 7.313 year 0.80 34.19 16.15 19.29 20.54 9.82
Post-20001 year 0.75 64.53 6.67 12.16 15.16 1.492 year 0.86 56.44 7.37 19.74 13.86 2.593 year 0.90 52.77 8.14 22.96 13.13 3.00
Notes: FEV stands for Forecast Error variance
35