Embed Size (px)
DESCRIPTION
Inflation Report August 2005. Demand. Chart 2.1 Nominal GDP. Chart 2.2 Contributions to quarterly growth in consumer spending (a). (a) Chained volume measure. Excluding non-profit institutions serving households. (b) Other spending is on net tourism and non-durable goods. Chart 2.3 - PowerPoint PPT Presentation
Citation preview

Inflation Report Inflation Report August 2005 August 2005

Demand Demand
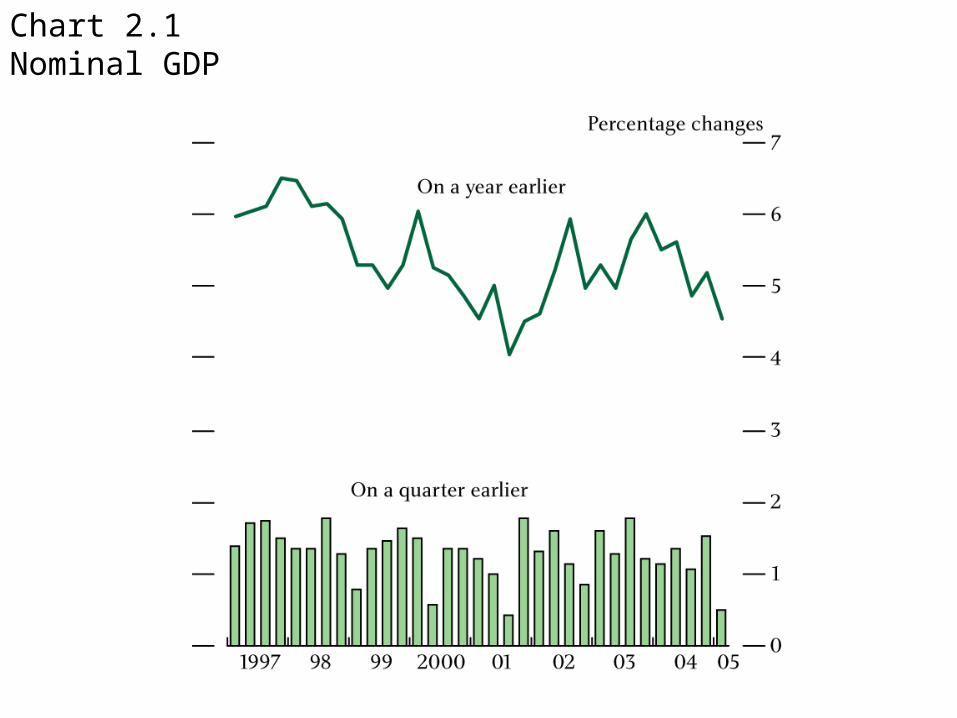
Chart 2.1Nominal GDP

Chart 2.2Contributions to quarterly growth in consumer spending(a)
(a) Chained volume measure. Excluding non-profit institutions serving households.(b) Other spending is on net tourism and non-durable goods.

Chart 2.3Households’ quarterly interest payments and receipts and the repo rate
(a) Includes non-profit institutions serving households.
(b) Quarterly average. Last data point is 2005 Q2.

Chart 2.4Households’ real post-tax labour income

Chart 2.5GfK consumer confidence: households’ financial situation over the next twelve months
Source: Martin Hamblin GfK.

Chart 2.6Real house prices(a) and consumption(b)
Sources: Bank of England, Nationwide and ONS.
(a) Real house price measure, calculated as the nominal Nationwide series deflated by the consumption expenditure deflator.(b) Chained volume measure of consumption. Excluding non-profit institutions serving households. (c) 2005 Q1 data were unavailable at the time of the May Report.

Chart 2.7Sectoral contributions to quarterly whole-economy investment growth(a)
(a) Chained volume measures.

Chart 2.8Official estimates of business investment and a survey-based indicator
Sources: Bank of England, ONS and Ellis, C and Barnes, S (2005), ‘Indicators of short-term movements in business investment’, Bank of England Quarterly Bulletin, Spring, pages 30–38.
(a) Shaded area shows the survey-based indicator plus and minus its average absolute difference from official estimates between 1996 and 2002.
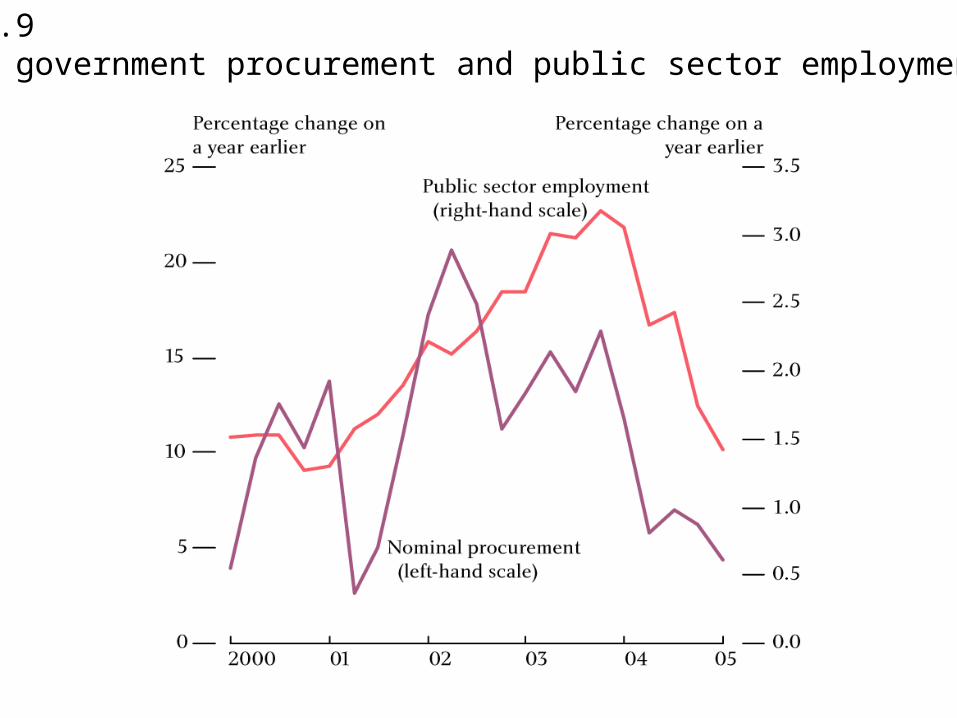
Chart 2.9Nominal government procurement and public sector employment

Chart 2.10Euro-area competitiveness — real effective exchange rates based on relative unit labour costs
Source: Thomson Financial Datastream.
(a) Inverted scale. An increase in the index implies a fall in competitiveness.

Chart 2.11Contributions to quarterly US GDP growth(a)
Source: US Bureau of Economic Analysis.
(a) Chained volume measures.

Chart 2.12Revisions to quarterly UK export growth since 1997

TablesTables
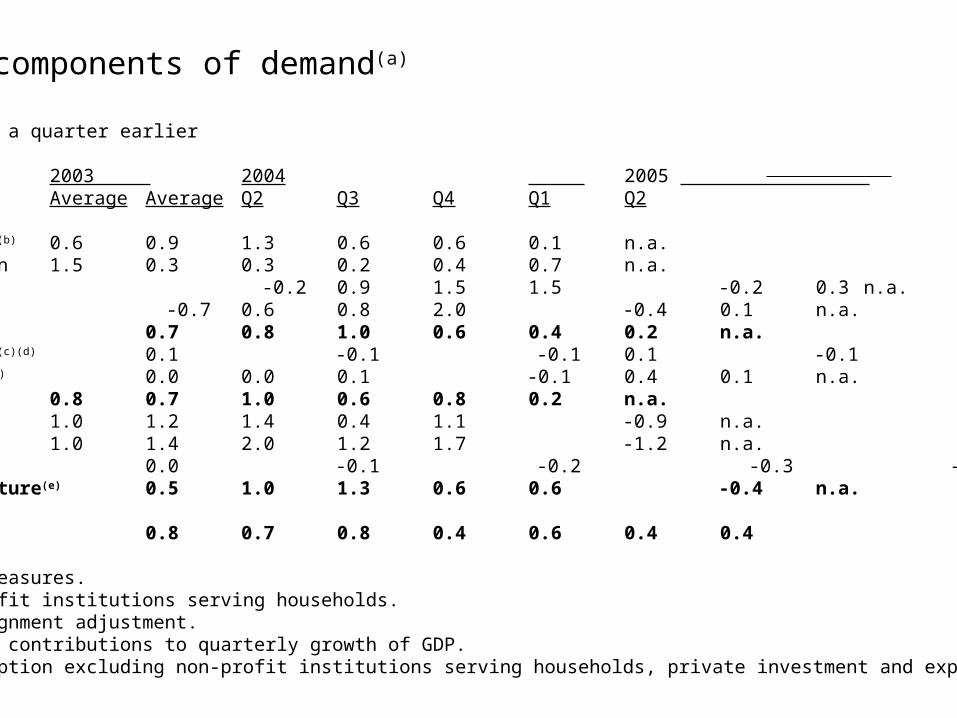
Table 2.AExpenditure components of demand(a)
Percentage changes on a quarter earlier
2003 2004 2005 Average Average Q2 Q3 Q4 Q1 Q2
Household consumption(b) 0.6 0.9 1.3 0.6 0.6 0.1 n.a.Government consumption 1.5 0.3 0.3 0.2 0.4 0.7 n.a.Investment -0.2 0.9 1.5 1.5 -0.2 0.3 n.a. of which, business -0.7 0.6 0.8 2.0 -0.4 0.1 n.a.Final domestic demand 0.7 0.8 1.0 0.6 0.4 0.2 n.a.Change in inventories(c)(d) 0.1 -0.1 -0.1 0.1 -0.1 -0.1 n.a.Alignment adjustment(d) 0.0 0.0 0.1 -0.1 0.4 0.1 n.a.Domestic demand 0.8 0.7 1.0 0.6 0.8 0.2 n.a.Exports 1.0 1.2 1.4 0.4 1.1 -0.9 n.a.Imports 1.0 1.4 2.0 1.2 1.7 -1.2 n.a.Net trade(d) 0.0 -0.1 -0.2 -0.3 -0.2 0.1 n.a.Private final expenditure(e) 0.5 1.0 1.3 0.6 0.6 -0.4 n.a.
GDP at market prices 0.8 0.7 0.8 0.4 0.6 0.4 0.4
(a) Chained volume measures.(b) Excludes non-profit institutions serving households.(c) Excludes the alignment adjustment.(d) Percentage point contributions to quarterly growth of GDP.(e) Household consumption excluding non-profit institutions serving households, private investment and exports.
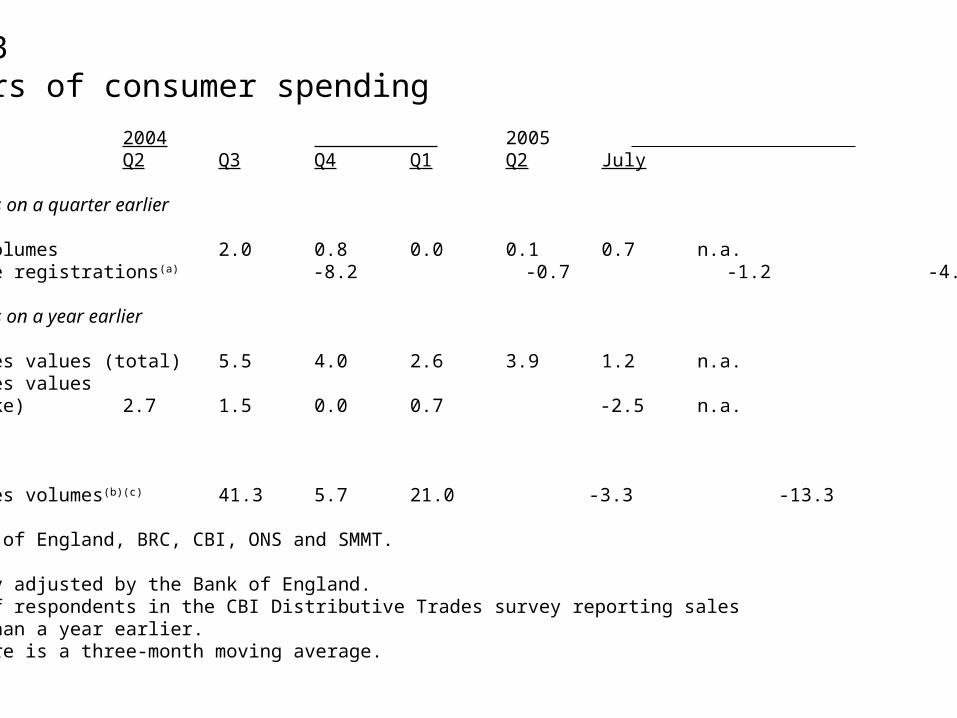
Table 2.BIndicators of consumer spending
2004 2005Q2 Q3 Q4 Q1 Q2 July
Percentage changes on a quarter earlier
Retail sales volumes 2.0 0.8 0.0 0.1 0.7 n.a.Private vehicle registrations(a) -8.2 -0.7 -1.2 -4.9 0.5 n.a.
Percentage changes on a year earlier
BRC retail sales values (total) 5.5 4.0 2.6 3.9 1.2 n.a.BRC retail sales values (like-for-like) 2.7 1.5 0.0 0.7 -2.5 n.a.
Balance
CBI retail sales volumes(b)(c) 41.3 5.7 21.0 -3.3 -13.3 -14.7
Sources: Bank of England, BRC, CBI, ONS and SMMT.
(a) Seasonally adjusted by the Bank of England.(b) Balance of respondents in the CBI Distributive Trades survey reporting sales higher than a year earlier.(c) July figure is a three-month moving average.

Table 2.CIndicators of future investment(a)
Average Average 2004 2005 since in 1989 1997 Q3 Q4 Q1 Q2
Surveys of investment intentionsBCC service sector 15 28 17 15 11 8BCC manufacturing(b) 10 23 18 16 10 9CBI manufacturing -7 12 -17 -19 -16 -15CBI distributive trades -1 9 24 6 -18 -29
Confidence in profitability(c)
BCC service sector 34 46 35 41 38 29BCC manufacturing(b) 29 37 24 35 34 34
Sources: BCC and CBI.
(a) Percentage balances of respondents. (b) Includes agriculture, energy and construction. (c) The question asks ‘Do you believe that over the next twelve months profitability will improve/remain the same/worsen?’

Revisions to the Revisions to the National AccountsNational Accounts
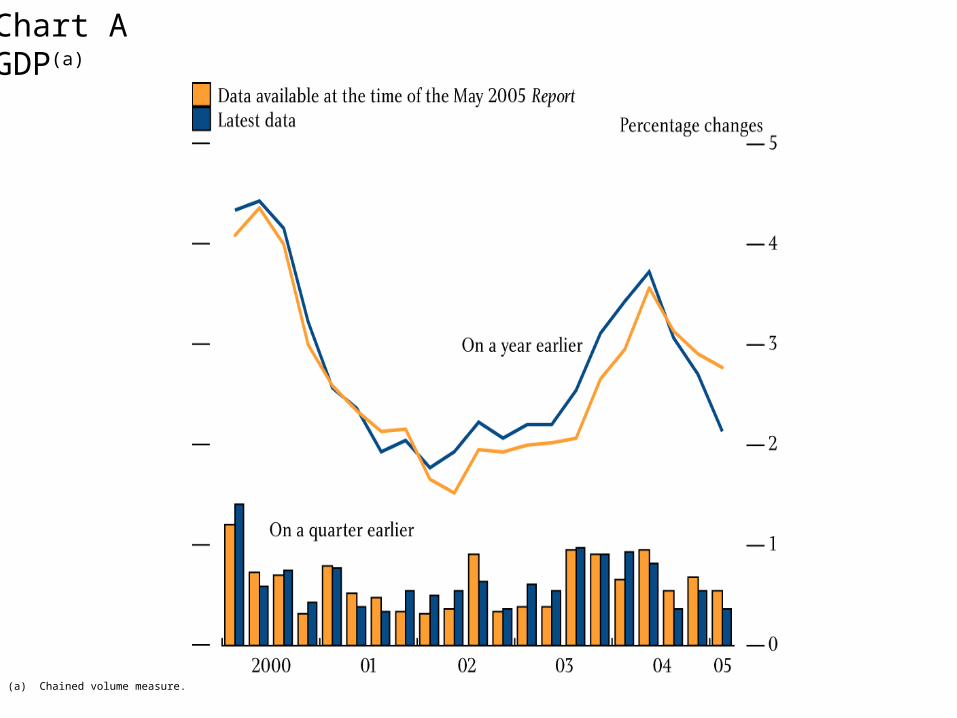
Chart AGDP(a)
(a) Chained volume measure.

Chart BRevisions to the level of GDP
(a) Calculated using the difference in cumulated growth from 1991 Q4 before and after the revisions, as volumes levels before and after the revision are not directly comparable. (b) Excluding non-profit institutions serving households.

Chart CHousehold consumption(a)
(a) Excluding non-profit institutions serving households.(b) 2005 Q1 data were unavailable at the time of the May Report.

Chart DHouseholds’ saving ratio
(a) 2005 Q1 data were unavailable at the time of the May Report.
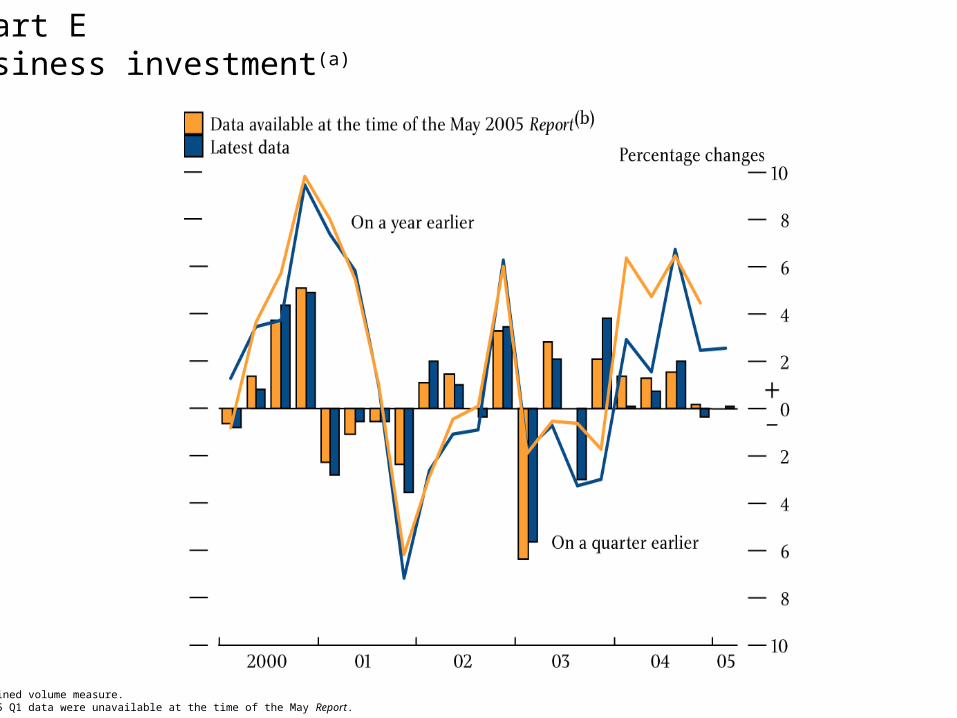
Chart EBusiness investment(a)
(a) Chained volume measure.(b) 2005 Q1 data were unavailable at the time of the May Report.

Chart FWhole-economy stock-output(a) ratio
(a) Inventories (excluding the alignment adjustment) as a proportion of chain-weighted GDP.(b) 2005 Q1 data were unavailable at the time of the May Report.