Embed Size (px)
Citation preview
ISSN 1655-5104
INFLATIONREPORT
Q12018
i
The primary objective of monetary policy is to promote a low and stable rate of inflation conducive to a balanced and sustainable economic growth. The adoption in January 2002 of the inflation targeting
framework for monetary policy was aimed at helping to fulfill this objective. One of the key features of inflation targeting is greater transparency, which means greater disclosure and communication by the BSP of its policy actions and decisions. This Inflation Report is published by the BSP as part of its transparency mechanisms under inflation targeting. The objectives of this Inflation Report are: (i) to identify the risks to price stability and discuss their implications for monetary policy; and (ii) to document the economic analysis behind the formulation of monetary policy and convey to the public the overall thinking behind the BSP’s decisions on monetary policy. The broad aim is to make monetary policy easier for the public to understand and enable them to better monitor the BSP’s commitment to the inflation target, thereby helping both in anchoring inflation expectations and encouraging informed debate on monetary policy issues.
The government’s target for annual headline inflation under the inflation targeting framework has been set at 3.0 percent ± 1.0 percentage point (ppt) for 2018-2020 by the Development Budget Coordination Committee (DBCC). This is consistent with the desired disinflation path over the medium term, favorable trends in inflation dynamics, and expected higher capacity of the economy for growth under a low inflation environment.
The report is published on a quarterly basis, presenting an analysis of the various factors affecting inflation. These include recent price and cost developments, inflation expectations, prospects for aggregate demand and output, labor market conditions, monetary and financial market conditions, fiscal developments, and the international environment. An entire section is devoted to a discussion of monetary policy developments in the most recent quarter, while a separate section provides a comprehensive analysis of the BSP’s view of the inflation outlook for the policy horizon.
The Monetary Board approved this Inflation Report at its meeting on 12 April 2018.
Foreword
NESTOR A. ESPENILLA, JR. Governor

ii
The BSP Mandate
The BSP’s main responsibility is to formulate and implement policy in the areas of money, banking and credit, with the primary objective of maintaining stable prices conducive to a balanced and sustainable economic growth in the Philippines. The BSP also aims to promote and preserve monetary stability and the convertibility of the national currency.
Monetary Policy Instruments The BSP’s primary monetary policy instrument is its overnight reverse repurchase (RRP) or borrowing rate. Other instruments to implement the desired monetary policy stance to achieve the inflation target include (a) increasing/decreasing the reserve requirement; (b) conducting auctions for the term deposit facility (TDF);
1 (c) adjusting the rediscount rate on loans extended to banking institutions on a short-term
basis against eligible collateral of banks’ borrowers; and (d) outright sales/purchases of the BSP’s holdings of government securities.
Policy Target The BSP’s target for monetary policy uses the Consumer Price Index (CPI) or headline inflation rate, which is compiled and released to the public by the National Statistics Office (NSO). The policy target is set by the Development Budget Coordination Committee (DBCC)
2 in consultation with the BSP. The inflation
target for 2018-2020 is 3.0 percent ± 1.0 ppt.3
BSP’s Explanation Clauses
These are the predefined set of acceptable circumstances under which an inflation-targeting central bank may fail to achieve its inflation target. These clauses reflect the fact that there are limits to the effectiveness of monetary policy and that deviations from the inflation target may sometimes occur because of factors beyond the control of the central bank. Under the inflation targeting framework of `the BSP, these exemptions include inflation pressures arising from: (a) volatility in the prices of agricultural products; (b) natural calamities or events that affect a major part of the economy; (c) volatility in the prices of oil products; and (d) significant government policy changes that directly affect prices such as changes in the tax structure, incentives, and subsidies.
1 The TDF was introduced under the interest rate corridor system which was implemented on 3 June 2016. 2 The DBCC, created under Executive Order (E.O.) No. 232 dated 14 May 1970, is an inter-agency committee tasked primarily to formulate the National Government's fiscal program. It is composed of the Office of the President (OP), Department of Budget and Management (DBM), National Economic and Development Authority (NEDA), and the Department of Finance (DOF). The BSP attends the Committee meetings as a resource agency. 3 During its meeting on 22 December 2017, the DBCC decided to keep the current inflation target at 3.0 percent ± 1.0 percentage point for 2018 – 2020.
The Monetary Policy of the Bangko Sentral ng Pilipinas

iii
The Monetary Board
The powers and functions of the BSP, such as the conduct of monetary policy and the supervision over the banking system, are exercised by its Monetary Board, which has seven members appointed by the President of the Philippines. The Monetary Board holds eight (8) monetary policy meetings in a year to review and decide on the stance of monetary policy.
Chairman & Governor
Nestor A. Espenilla, Jr.
Members
Carlos G. Dominguez III Felipe M. Medalla
Juan D. De Zuñiga, Jr. Valentin A. Araneta
Peter B. Favila Antonio S. Abacan, Jr.
The Advisory Committee
The Advisory Committee was established as an integral part of the institutional setting for inflation targeting. It is tasked to deliberate, discuss, and make recommendations on monetary policy to the Monetary Board. Like the Monetary Board, the Committee meets eight times a year but may also meet between regular meetings, whenever deemed necessary.
Chairman
Nestor A. Espenilla, Jr. Governor
Members Diwa C. Guinigundo
Deputy Governor Monetary Stability Sector
Ma. Cyd Tuaño-Amador Deputy Governor
Resource Management Sector
Chuchi G. Fonacier Deputy Governor
Supervision and Examination Sector
Ma. Ramona GDT Santiago Assistant Governor
Treasury Department
Johnny Noe E. Ravalo Assistant Governor
Office of Systemic Risk Management
Francisco G. Dakila, Jr. Assistant Governor
Monetary Policy Sub-sector
iv
30 June 2017; Former Monetary Board members Alfredo C. Antonio and Armando L. Suratos were MB members until 30 June 2017 and were replaced by MB members Antonio S. Abacan, Jr. and Peter B. Favila. ** Supervision and Examination Sector Deputy Governor Nestor A. Espenilla, Jr. was a member of the Advisory Committee until 30 June 2017 and has become the Chairman of the Advisory Committee starting 1 July 2017.
Technical Staff
Chairman Zeno Ronald R. Abenoja
Senior Director, Department of Economic Research
Members Mary Jane T. Chiong
Managing Director, Office of the Governor
Lyn I. Javier Managing Director, Financial Supervision Research and Consumer Protection Sub-sector
Veronica B. Bayangos Director, Office of the Supervisory Policy Development
Lorelei S. Fernandez Senior Director, Treasury Department
Rosabel B. Guerrero Senior Director, Department of Economic Statistics
Dennis D. Lapid Deputy Director, Department of Economic Research
Dennis M. Bautista Deputy Director, Department of Economic Research
Ma. Mediatriz M. Boelsch Assistant Chief Dealer, Treasury Department
Thea Josefina Natalia W. Santos Deputy Director, Supervision and Examination Sub-Sector I
Lara Romina E. Ganapin Bank Officer V, Department of Economic Research
Cherrie F. Ramos Bank Officer V, Department of Economic Research
Jasmin E. Dacio Bank Officer V, Department of Economic Research
Gabrielle Roanne L. Moral Bank Officer V, Department of Economic Research
Eduard Joseph D. Robleza Bank Officer V, Department of Economic Research
Jan Christopher G. Ocampo Bank Officer V, Department of Economic Research
Marites B. Oliva Bank Officer V, Center for Monetary and Financial Policy
Alvin Joshua P. Fama Acting Bank Officer V, Office of Systemic Risk Management
Sol Elizah T. Roxas Bank Officer VI, Provident Fund Office
v
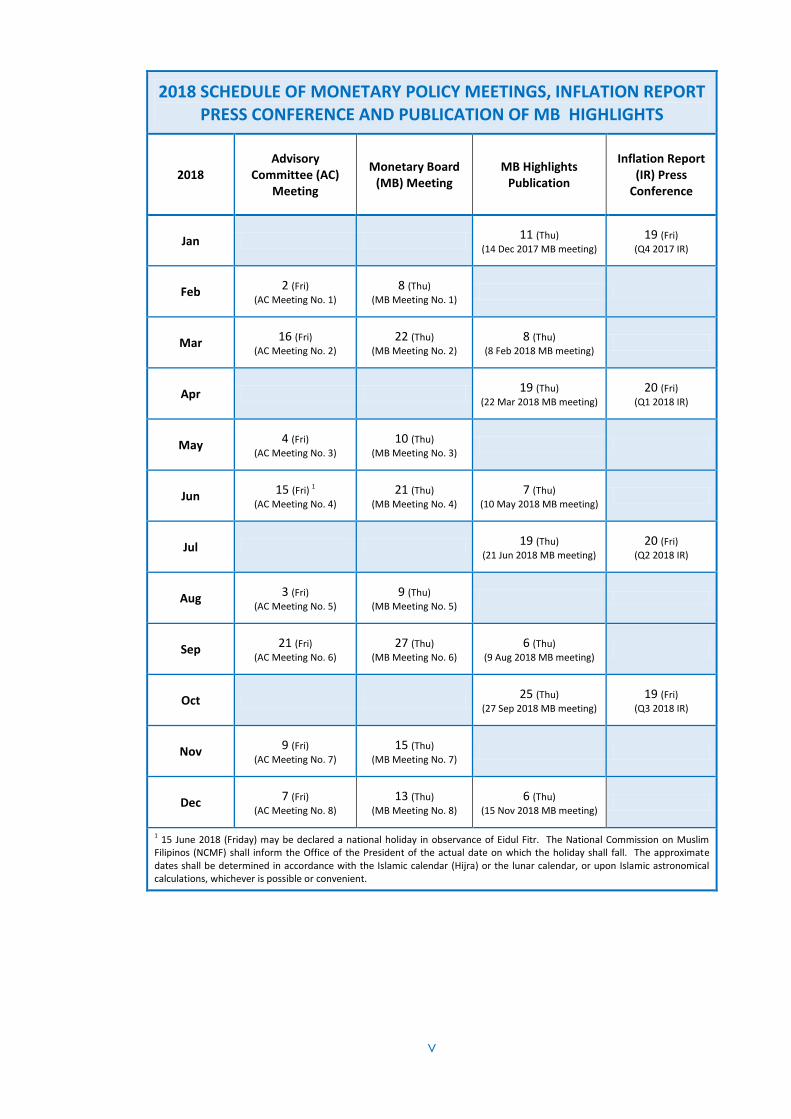
2018 SCHEDULE OF MONETARY POLICY MEETINGS, INFLATION REPORT PRESS CONFERENCE AND PUBLICATION OF MB HIGHLIGHTS
2018 Advisory
Committee (AC) Meeting
Monetary Board (MB) Meeting
MB Highlights Publication
Inflation Report (IR) Press
Conference
Jan 11 (Thu)
(14 Dec 2017 MB meeting) 19 (Fri)
(Q4 2017 IR)
Feb 2 (Fri)
(AC Meeting No. 1) 8 (Thu)
(MB Meeting No. 1)
Mar 16 (Fri)
(AC Meeting No. 2) 22 (Thu)
(MB Meeting No. 2) 8 (Thu)
(8 Feb 2018 MB meeting)
Apr 19 (Thu)
(22 Mar 2018 MB meeting)
20 (Fri)
(Q1 2018 IR)
May 4 (Fri)
(AC Meeting No. 3) 10 (Thu)
(MB Meeting No. 3)
Jun 15 (Fri) 1
(AC Meeting No. 4) 21 (Thu)
(MB Meeting No. 4) 7 (Thu)
(10 May 2018 MB meeting)
Jul 19 (Thu)
(21 Jun 2018 MB meeting) 20 (Fri)
(Q2 2018 IR)
Aug 3 (Fri)
(AC Meeting No. 5) 9 (Thu)
(MB Meeting No. 5)
Sep 21 (Fri)
(AC Meeting No. 6) 27 (Thu)
(MB Meeting No. 6) 6 (Thu)
(9 Aug 2018 MB meeting)
Oct 25 (Thu)
(27 Sep 2018 MB meeting) 19 (Fri)
(Q3 2018 IR)
Nov 9 (Fri)
(AC Meeting No. 7) 15 (Thu)
(MB Meeting No. 7)
Dec 7 (Fri) (AC Meeting No. 8)
13 (Thu)
(MB Meeting No. 8) 6 (Thu)
(15 Nov 2018 MB meeting)
1 15 June 2018 (Friday) may be declared a national holiday in observance of Eidul Fitr. The National Commission on Muslim Filipinos (NCMF) shall inform the Office of the President of the actual date on which the holiday shall fall. The approximate dates shall be determined in accordance with the Islamic calendar (Hijra) or the lunar calendar, or upon Islamic astronomical calculations, whichever is possible or convenient.

vi
List of Acronyms, Abbreviations, and Symbols
AL BES
Auto Loans Business Expectations Survey
NBQBs Non-Bank Financial Institutions with Quasi-Banking Functions
BTr CAMPI
Bureau of the Treasury Chamber of Automotive Manufacturers of the Philippines, Inc.
NEDA NEER NNPL
National Economic and Development Authority Nominal Effective Exchange Rate Net Non-Performing Loan
CAR Capital Adequacy Ratio NFA Net Foreign Assets; National Food Authority
CBD Central Business District NG National Government
CES Consumer Expectations Survey NGCP National Grid Corporation of the Philippines
CDS Credit Default Swaps NPC National Power Corporation
CI Confidence Index NPI Net Primary Income
COV Coefficient of Variation NPL Non-Performing Loan
CPI DBCC
Consumer Price Index Development Budget Coordination Committee
OECD Organization for Economic Cooperation and Development
DOE DI
Department of Energy Diffusion Index
OPEC Organization of the Petroleum Exporting Countries
DOF Department of Finance OF Overseas Filipinos
EIA US Energy Information Administration PMI Purchasing Managers’ Index
EM EMBIG
Emerging Market JP Morgan Emerging Market Bond Index Global
PSA Philippine Statistical Authority; Power Supply Agreement
ERC FCDA
Energy Regulatory Commission Foreign Currency Differential Adjustment
PSALM Power Sector Assets and Liabilities Management Corporation
GDP Gross Domestic Product PSEi Philippine Stock Exchange Composite Index
GNI Gross NationaI Income RBs Rural Banks
GNPL Gross Non-Performing Loan REER Real Effective Exchange Rate
GS Government Securities ROP Republic of the Philippines
IEA International Energy Agency RP Repurchase
IMF International Monetary Fund RR Reserve Requirement
IPP Independent Power Producer RRP Reverse Repurchase
IRI International Research Institute for Climate and Society
RWA SDA
Risk-Weighted Asset Special Deposit Account
LFS LPG
Labor Force Survey Liquefied Petroleum Gas
SEM SME
Single-Equation Model Small and Medium Enterprise
LTFRB Land Transportation Franchising and SOSFM Society of Fellows in Supply Management, Inc.
Regulatory Board TB Thrift Banks
MB MEM
Monetary Board Multi-Equation Model
TLP U/KBs
Total Loan Portfolio Universal and Commercial Banks
MERALCO Manila Electric Company VAPI Value of Production Index
MISSI Monthly Integrated Survey of Selected VOPI Volume of Production Index
MTP
Industries Major Trading Partner
WESM Wholesale Electricity Spot Market
vii
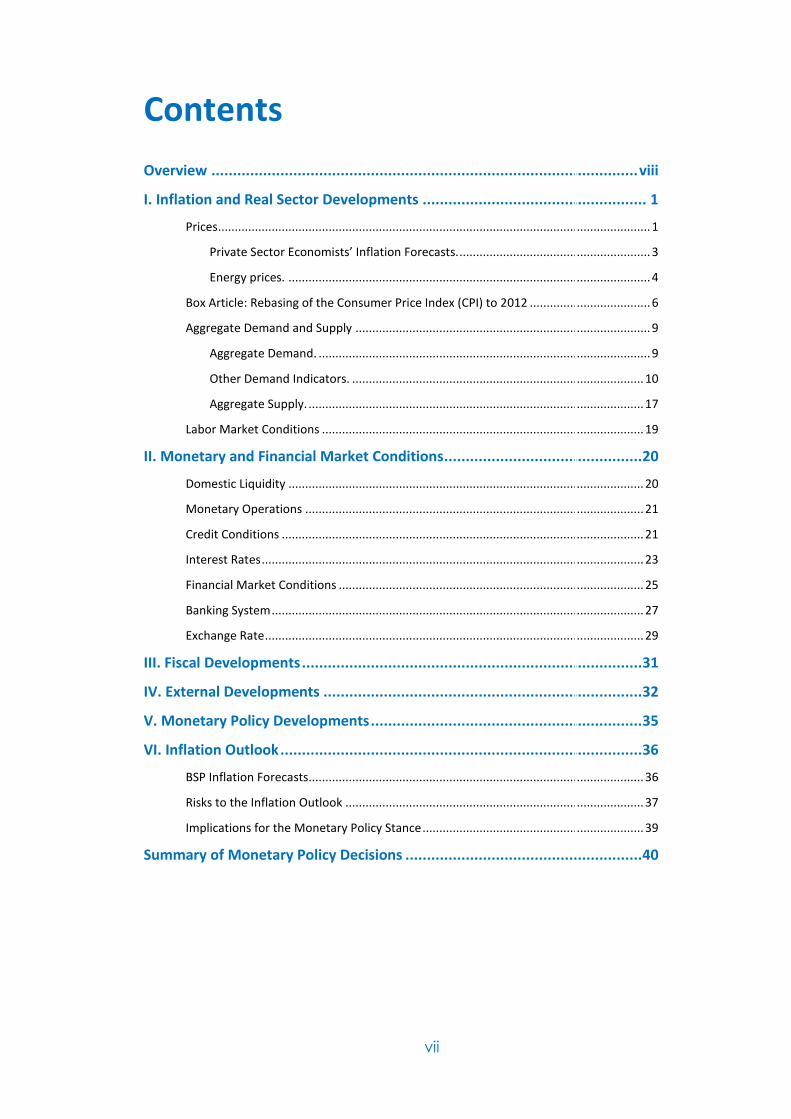
Contents
Overview ................................................................................................... viii
I. Inflation and Real Sector Developments .................................................... 1
Prices ................................................................................................................................. 1
Private Sector Economists’ Inflation Forecasts. ......................................................... 3
Energy prices. ............................................................................................................ 4
Box Article: Rebasing of the Consumer Price Index (CPI) to 2012 .................................... 6
Aggregate Demand and Supply ........................................................................................ 9
Aggregate Demand. ................................................................................................... 9
Other Demand Indicators. ....................................................................................... 10
Aggregate Supply. .................................................................................................... 17
Labor Market Conditions ................................................................................................ 19
II. Monetary and Financial Market Conditions .............................................. 20
Domestic Liquidity .......................................................................................................... 20
Monetary Operations ..................................................................................................... 21
Credit Conditions ............................................................................................................ 21
Interest Rates .................................................................................................................. 23
Financial Market Conditions ........................................................................................... 25
Banking System ............................................................................................................... 27
Exchange Rate ................................................................................................................. 29
III. Fiscal Developments ............................................................................... 31
IV. External Developments .......................................................................... 32
V. Monetary Policy Developments ............................................................... 35
VI. Inflation Outlook .................................................................................... 36
BSP Inflation Forecasts.................................................................................................... 36
Risks to the Inflation Outlook ......................................................................................... 37
Implications for the Monetary Policy Stance .................................................................. 39
Summary of Monetary Policy Decisions ....................................................... 40
viii
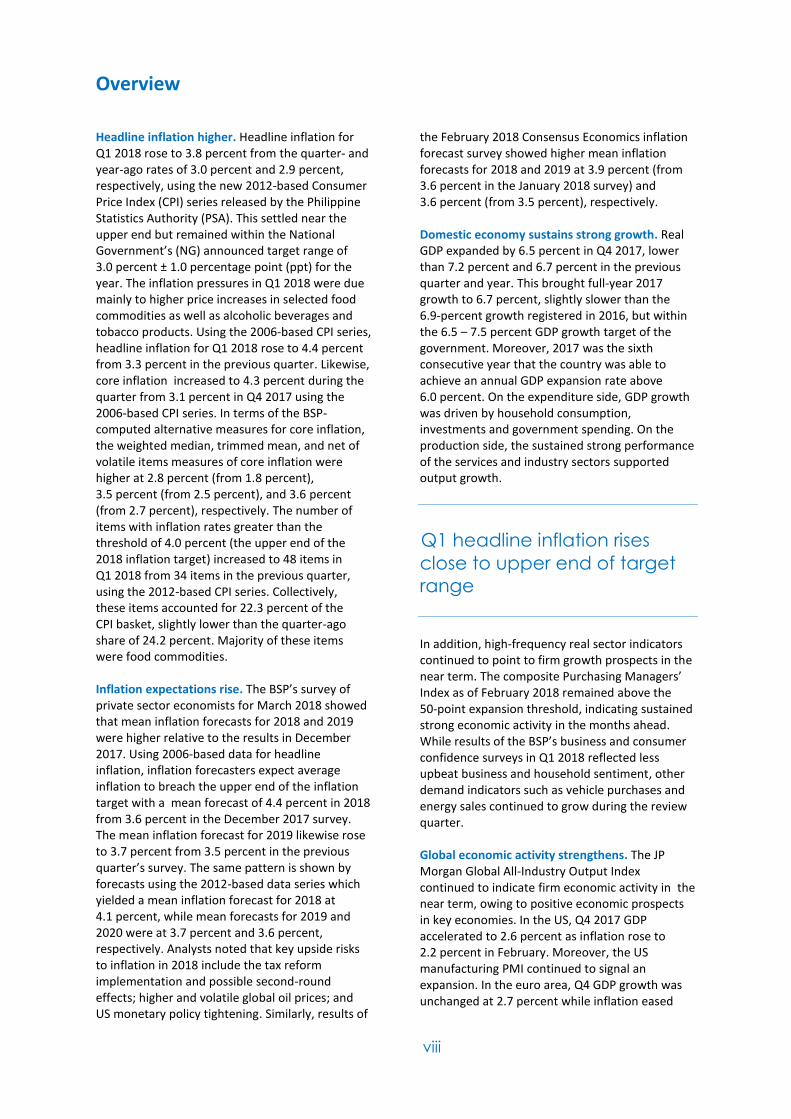
Overview
Headline inflation higher. Headline inflation for Q1 2018 rose to 3.8 percent from the quarter- and year-ago rates of 3.0 percent and 2.9 percent, respectively, using the new 2012-based Consumer Price Index (CPI) series released by the Philippine Statistics Authority (PSA). This settled near the upper end but remained within the National Government’s (NG) announced target range of 3.0 percent ± 1.0 percentage point (ppt) for the year. The inflation pressures in Q1 2018 were due mainly to higher price increases in selected food commodities as well as alcoholic beverages and tobacco products. Using the 2006-based CPI series, headline inflation for Q1 2018 rose to 4.4 percent from 3.3 percent in the previous quarter. Likewise, core inflation increased to 4.3 percent during the quarter from 3.1 percent in Q4 2017 using the 2006-based CPI series. In terms of the BSP-computed alternative measures for core inflation, the weighted median, trimmed mean, and net of volatile items measures of core inflation were higher at 2.8 percent (from 1.8 percent), 3.5 percent (from 2.5 percent), and 3.6 percent (from 2.7 percent), respectively. The number of items with inflation rates greater than the threshold of 4.0 percent (the upper end of the 2018 inflation target) increased to 48 items in Q1 2018 from 34 items in the previous quarter, using the 2012-based CPI series. Collectively, these items accounted for 22.3 percent of the CPI basket, slightly lower than the quarter-ago share of 24.2 percent. Majority of these items were food commodities. Inflation expectations rise. The BSP’s survey of private sector economists for March 2018 showed that mean inflation forecasts for 2018 and 2019 were higher relative to the results in December 2017. Using 2006-based data for headline inflation, inflation forecasters expect average inflation to breach the upper end of the inflation target with a mean forecast of 4.4 percent in 2018 from 3.6 percent in the December 2017 survey. The mean inflation forecast for 2019 likewise rose to 3.7 percent from 3.5 percent in the previous quarter’s survey. The same pattern is shown by forecasts using the 2012-based data series which yielded a mean inflation forecast for 2018 at 4.1 percent, while mean forecasts for 2019 and 2020 were at 3.7 percent and 3.6 percent, respectively. Analysts noted that key upside risks to inflation in 2018 include the tax reform implementation and possible second-round effects; higher and volatile global oil prices; and US monetary policy tightening. Similarly, results of
the February 2018 Consensus Economics inflation forecast survey showed higher mean inflation forecasts for 2018 and 2019 at 3.9 percent (from 3.6 percent in the January 2018 survey) and 3.6 percent (from 3.5 percent), respectively. Domestic economy sustains strong growth. Real GDP expanded by 6.5 percent in Q4 2017, lower than 7.2 percent and 6.7 percent in the previous quarter and year. This brought full-year 2017 growth to 6.7 percent, slightly slower than the 6.9-percent growth registered in 2016, but within the 6.5 – 7.5 percent GDP growth target of the government. Moreover, 2017 was the sixth consecutive year that the country was able to achieve an annual GDP expansion rate above 6.0 percent. On the expenditure side, GDP growth was driven by household consumption, investments and government spending. On the production side, the sustained strong performance of the services and industry sectors supported output growth.
Q1 headline inflation rises
close to upper end of target
range
In addition, high-frequency real sector indicators continued to point to firm growth prospects in the near term. The composite Purchasing Managers’ Index as of February 2018 remained above the 50-point expansion threshold, indicating sustained strong economic activity in the months ahead. While results of the BSP’s business and consumer confidence surveys in Q1 2018 reflected less upbeat business and household sentiment, other demand indicators such as vehicle purchases and energy sales continued to grow during the review quarter. Global economic activity strengthens. The JP Morgan Global All-Industry Output Index continued to indicate firm economic activity in the near term, owing to positive economic prospects in key economies. In the US, Q4 2017 GDP accelerated to 2.6 percent as inflation rose to 2.2 percent in February. Moreover, the US manufacturing PMI continued to signal an expansion. In the euro area, Q4 GDP growth was unchanged at 2.7 percent while inflation eased

ix
slightly to 1.1 percent in February. The euro composite PMI also remained in expansion territory. In Japan, the economy grew at a brisker pace of 2.0 percent as inflation rose to 1.5 percent in February. In addition, manufacturing PMI remained firmly above the expansionary threshold. In China, growth remained robust at 6.8 percent as inflation rose to 2.9 percent in February. Meanwhile, manufacturing PMI eased slightly but remained above the 50-percent mark. In India, growth accelerated to 7.2 percent while inflation relatively eased to 4.4 percent in February. Moreover, composite PMI improved. Domestic financial system remains resilient amid uncertainty. Optimism regarding the country’s economic prospects, given strong Q4 GDP growth, implementation of the tax reform, and strong government initiative for infrastructure development, counterbalanced fears of faster-than-expected US monetary tightening, adverse impact of a possible trade war between the US and China as well as geopolitical concerns. The Philippine stock exchange index rose by 2.6 percent, quarter-on-quarter, to average 8,571.05 index points in Q1 2018. Meanwhile, Philippine sovereign debt spreads generally reflected the uncertainty on outlook on the external front. The peso continued to depreciate, averaging P51.43/US$1 during the review quarter. Nevertheless, investor demand for government securities remained healthy as evidenced by oversubscriptions to the Bureau of the Treasury’s regular auctions of T-bills and T-bonds. In addition, the banking system saw continued increases in total assets, lending, and deposits, while capital adequacy ratios remained comfortably above the BSP’s prescribed levels and international norms. At the same time, based on the latest round of the BSP survey on senior bank loan officers, bank lending standards for loans to both enterprises and households were broadly unchanged in Q1 2018, indicating a stable supply of credit. . Monetary policy settings were unchanged in Q1 2018. The BSP decided to maintain its policy interest rate at 3.0 percent at the 8 February and 22 March monetary policy meetings. In addition, on 15 February, the BSP announced the reduction in the reserve requirement (RR) ratio by one percentage point effective 2 March as an operational adjustment in the implementation of monetary policy. The BSP’s monetary policy decisions were based on its assessment that while recent inflation
outturns showed an elevated path in 2018, baseline forecasts (using the 2012-based CPI data) showed inflation remaining within the inflation target in 2018 and moderating further in 2019. The BSP noted that inflation expectations have also started to rise and will therefore need to be monitored closely in the coming months. Monetary authorities also observed that economic growth remains solid enough to absorb some policy tightening if warranted.
Prevailing monetary policy
settings remain appropriate
Present monetary policy settings are seen to be appropriate to the latest outlook for the time being. The latest baseline inflation forecasts support the maintenance of current present monetary policy settings for the time being as inflation is expected to be within target by 2019. Inflation has increased in Q1 2018 but remained in line with the BSP’s baseline forecast scenario. Inflation expectations are higher in 2018 but revert to the target over the policy horizon. Looking at output conditions, domestic activity continue to be firm on the back of robust domestic demand, strong growth in credit and liquidity, and a sustained recovery in global economic growth. Nevertheless, authorities see the balance of risks to the inflation outlook as remaining tilted toward the upside, which argues for maintaining vigilance in setting the stance of monetary policy going forward. While the supply-side factors affecting inflation are likely to be transitory, managing the risks to inflation expectations continue to be a key policy priority. Given these considerations, the BSP remains watchful against any signs of second-round effects and inflation becoming broader based. The BSP stands firm in its intent to take immediate and appropriate measures to ensure that the monetary policy stance continues to support the BSP's price stability objective.
Q1 2018 Inflation Report | 1
I. Inflation and Real Sector Developments
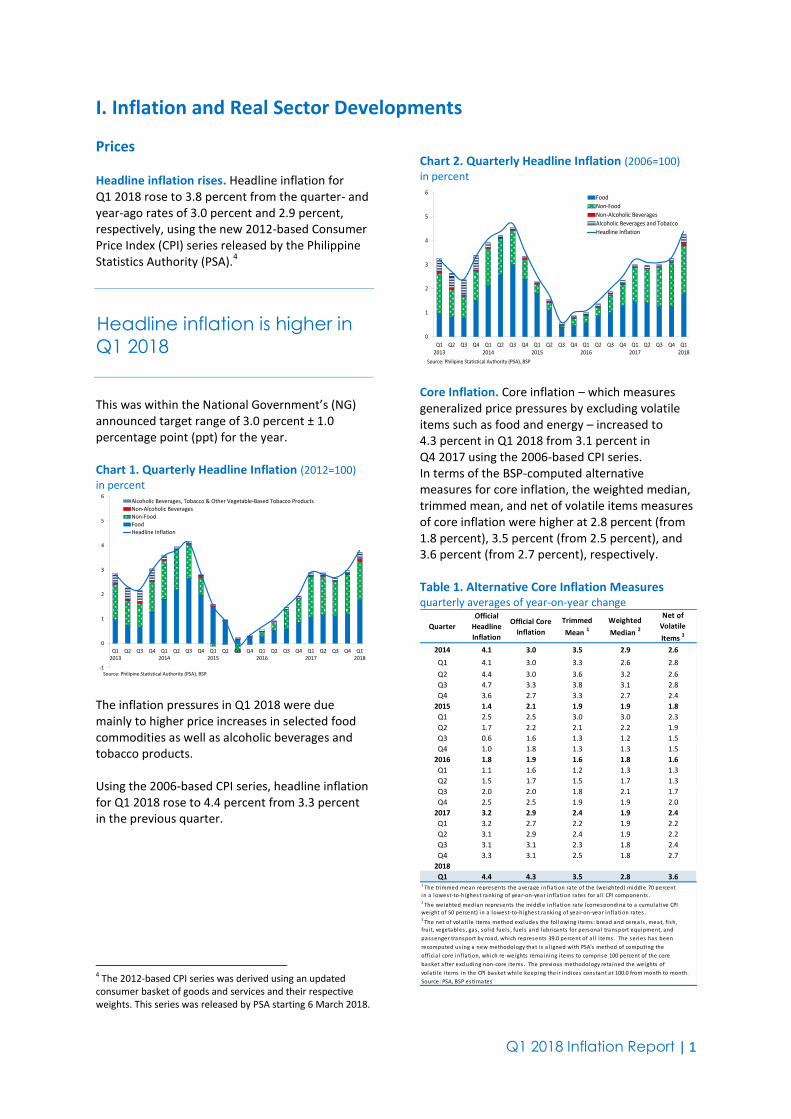
Prices Headline inflation rises. Headline inflation for Q1 2018 rose to 3.8 percent from the quarter- and year-ago rates of 3.0 percent and 2.9 percent, respectively, using the new 2012-based Consumer Price Index (CPI) series released by the Philippine Statistics Authority (PSA).
4
Headline inflation is higher in
Q1 2018
This was within the National Government’s (NG) announced target range of 3.0 percent ± 1.0 percentage point (ppt) for the year. Chart 1. Quarterly Headline Inflation (2012=100)
in percent
-1
0
1
2
3
4
5
6
Q12013
Q2 Q3 Q4 Q12014
Q2 Q3 Q4 Q12015
Q2 Q3 Q4 Q12016
Q2 Q3 Q4 Q12017
Q2 Q3 Q4 Q12018
Alcoholic Beverages, Tobacco & Other Vegetable-Based Tobacco ProductsNon-Alcoholic BeveragesNon-FoodFoodHeadline Inflation
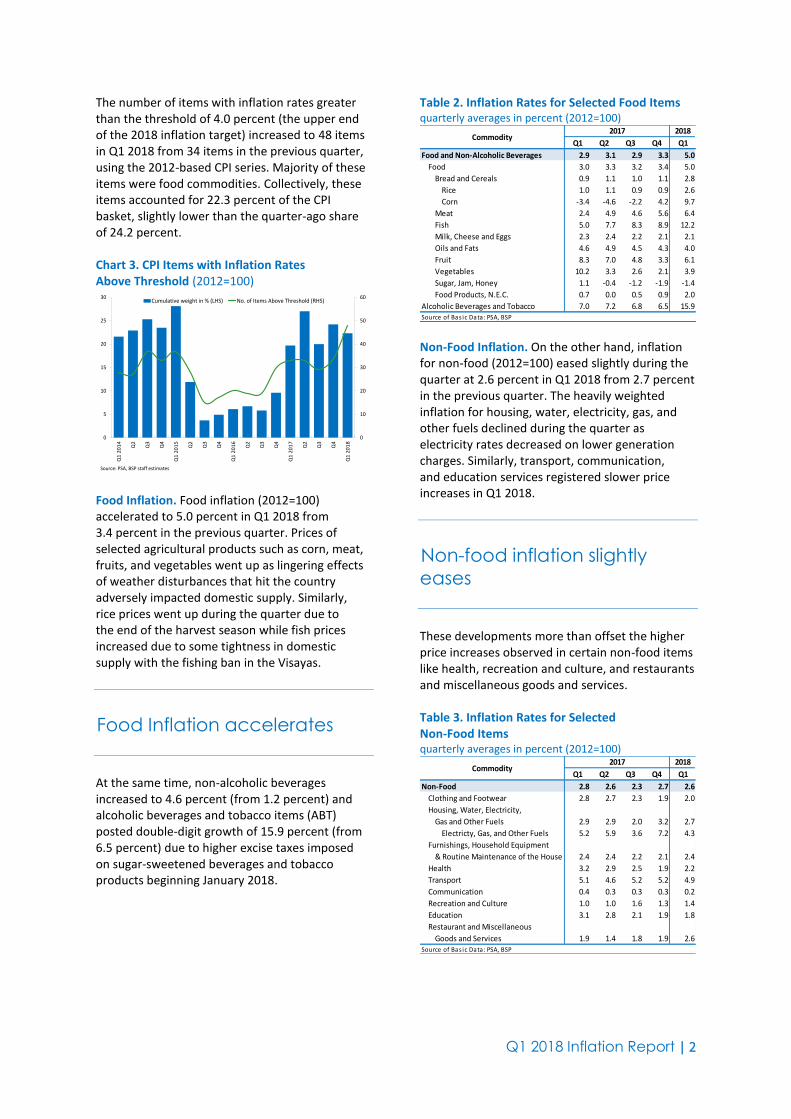
Source: Philipine Statistical Authority (PSA), BSP The inflation pressures in Q1 2018 were due mainly to higher price increases in selected food commodities as well as alcoholic beverages and tobacco products. Using the 2006-based CPI series, headline inflation for Q1 2018 rose to 4.4 percent from 3.3 percent in the previous quarter. 4 The 2012-based CPI series was derived using an updated consumer basket of goods and services and their respective weights. This series was released by PSA starting 6 March 2018.
Chart 2. Quarterly Headline Inflation (2006=100)
in percent
0
1
2
3
4
5
6
Q12013
Q2 Q3 Q4 Q12014
Q2 Q3 Q4 Q12015
Q2 Q3 Q4 Q12016
Q2 Q3 Q4 Q12017
Q2 Q3 Q4 Q12018
Food
Non-Food
Non-Alcoholic Beverages
Alcoholic Beverages and Tobacco
Headline Inflation
Source: Philipine Statistical Authority (PSA), BSP Core Inflation. Core inflation – which measures generalized price pressures by excluding volatile items such as food and energy – increased to 4.3 percent in Q1 2018 from 3.1 percent in Q4 2017 using the 2006-based CPI series. In terms of the BSP-computed alternative measures for core inflation, the weighted median, trimmed mean, and net of volatile items measures of core inflation were higher at 2.8 percent (from 1.8 percent), 3.5 percent (from 2.5 percent), and 3.6 percent (from 2.7 percent), respectively. Table 1. Alternative Core Inflation Measures quarterly averages of year-on-year change
Quarter
Official
Headline
Inflation
Official Core
Inflation
Trimmed
Mean 1
Weighted
Median 2
Net of
Volatile
Items 3
2014 4.1 3.0 3.5 2.9 2.6
Q1 4.1 3.0 3.3 2.6 2.8
Q2 4.4 3.0 3.6 3.2 2.6
Q3 4.7 3.3 3.8 3.1 2.8
Q4 3.6 2.7 3.3 2.7 2.4
2015 1.4 2.1 1.9 1.9 1.8
Q1 2.5 2.5 3.0 3.0 2.3
Q2 1.7 2.2 2.1 2.2 1.9
Q3 0.6 1.6 1.3 1.2 1.5
Q4 1.0 1.8 1.3 1.3 1.5
2016 1.8 1.9 1.6 1.8 1.6
Q1 1.1 1.6 1.2 1.3 1.3
Q2 1.5 1.7 1.5 1.7 1.3
Q3 2.0 2.0 1.8 2.1 1.7
Q4 2.5 2.5 1.9 1.9 2.0
2017 3.2 2.9 2.4 1.9 2.4
Q1 3.2 2.7 2.2 1.9 2.2
Q2 3.1 2.9 2.4 1.9 2.2
Q3 3.1 3.1 2.3 1.8 2.4
Q4 3.3 3.1 2.5 1.8 2.7
2018 3.4 3.3 3.5 2.8 3.6
Q1 4.4 4.3 3.5 2.8 3.61 The trimmed mean represents the average inflation rate of the (weighted) middle 70 percent
in a lowest-to-highest ranking of year-on-year inflation rates for a l l CPI components .2 The weighted median represents the middle inflation rate (corresponding to a cumulative CPI
weight of 50 percent) in a lowest-to-highest ranking of year-on-year inflation rates .3
The net of volati le i tems method excludes the fol lowing i tems: bread and cereals , meat, fi sh,
frui t, vegetables , gas , sol id fuels , fuels and lubricants for personal transport equipment, and
passenger transport by road, which represents 39.0 percent of a l l i tems. The series has been
recomputed us ing a new methodology that i s a l igned with PSA's method of computing the
officia l core inflation, which re-weights remaining i tems to comprise 100 percent of the core
basket after excluding non-core i tems. The previous methodology reta ined the weights of
volati le i tems in the CPI basket whi le keeping their indices constant at 100.0 from month to month.
Source: PSA, BSP estimates
Q1 2018 Inflation Report | 2
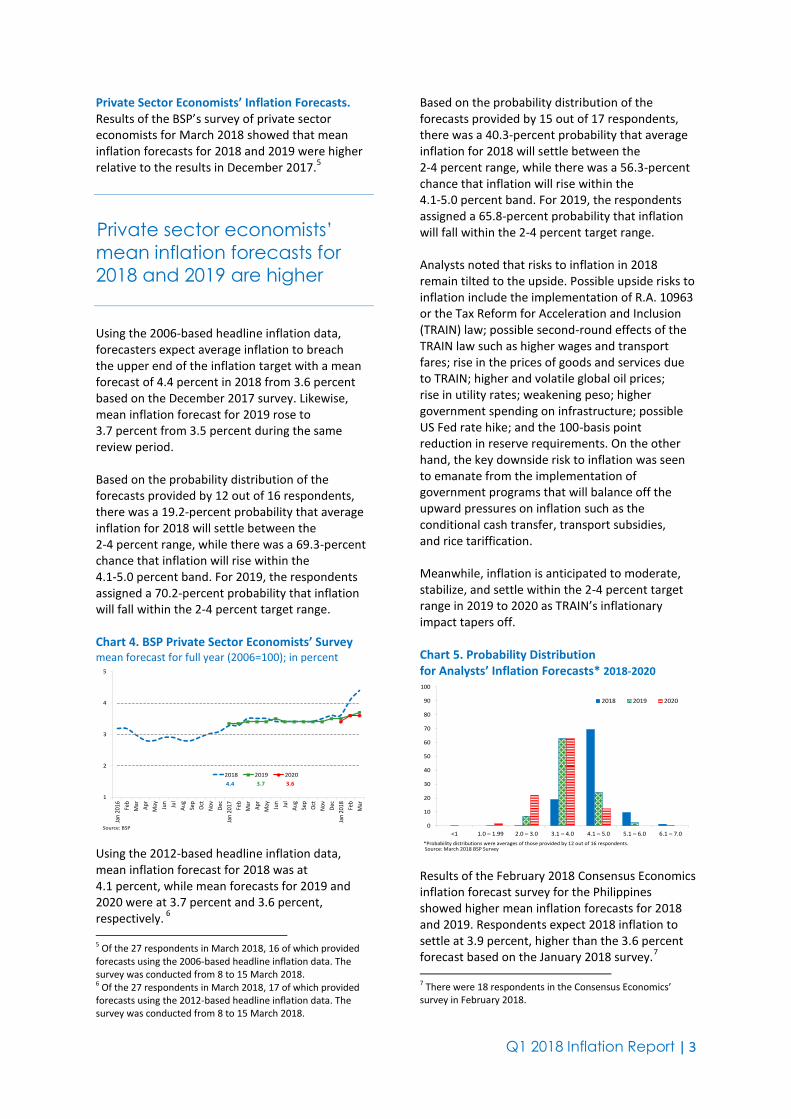
The number of items with inflation rates greater than the threshold of 4.0 percent (the upper end of the 2018 inflation target) increased to 48 items in Q1 2018 from 34 items in the previous quarter, using the 2012-based CPI series. Majority of these items were food commodities. Collectively, these items accounted for 22.3 percent of the CPI basket, slightly lower than the quarter-ago share of 24.2 percent.
Chart 3. CPI Items with Inflation Rates Above Threshold (2012=100)
0
10
20
30
40
50
60
0
5
10
15
20
25
30
Q1
20
14
Q2
Q3
Q4
Q1
20
15
Q2
Q3
Q4
Q1
20
16
Q2
Q3
Q4
Q1
20
17
Q2
Q3
Q4
Q1
20
18
Cumulative weight in % (LHS) No. of Items Above Threshold (RHS)
Source: PSA, BSP staff estimates Food Inflation. Food inflation (2012=100) accelerated to 5.0 percent in Q1 2018 from 3.4 percent in the previous quarter. Prices of selected agricultural products such as corn, meat, fruits, and vegetables went up as lingering effects of weather disturbances that hit the country adversely impacted domestic supply. Similarly, rice prices went up during the quarter due to the end of the harvest season while fish prices increased due to some tightness in domestic supply with the fishing ban in the Visayas.
Food Inflation accelerates
At the same time, non-alcoholic beverages increased to 4.6 percent (from 1.2 percent) and alcoholic beverages and tobacco items (ABT) posted double-digit growth of 15.9 percent (from 6.5 percent) due to higher excise taxes imposed on sugar-sweetened beverages and tobacco products beginning January 2018.
Table 2. Inflation Rates for Selected Food Items quarterly averages in percent (2012=100)
Q1 Q2 Q3 Q4 Q1
Food and Non-Alcoholic Beverages 2.9 3.1 2.9 3.3 5.0
Food 3.0 3.3 3.2 3.4 5.0
Bread and Cereals 0.9 1.1 1.0 1.1 2.8
Rice 1.0 1.1 0.9 0.9 2.6
Corn -3.4 -4.6 -2.2 4.2 9.7
Meat 2.4 4.9 4.6 5.6 6.4
Fish 5.0 7.7 8.3 8.9 12.2
Milk, Cheese and Eggs 2.3 2.4 2.2 2.1 2.1
Oils and Fats 4.6 4.9 4.5 4.3 4.0
Fruit 8.3 7.0 4.8 3.3 6.1
Vegetables 10.2 3.3 2.6 2.1 3.9
Sugar, Jam, Honey 1.1 -0.4 -1.2 -1.9 -1.4
Food Products, N.E.C. 0.7 0.0 0.5 0.9 2.0
Alcoholic Beverages and Tobacco 7.0 7.2 6.8 6.5 15.9
2017 2018
Source of Bas ic Data: PSA, BSP
Commodity
Non-Food Inflation. On the other hand, inflation for non-food (2012=100) eased slightly during the quarter at 2.6 percent in Q1 2018 from 2.7 percent in the previous quarter. The heavily weighted inflation for housing, water, electricity, gas, and other fuels declined during the quarter as electricity rates decreased on lower generation charges. Similarly, transport, communication, and education services registered slower price increases in Q1 2018.
Non-food inflation slightly
eases
These developments more than offset the higher price increases observed in certain non-food items like health, recreation and culture, and restaurants and miscellaneous goods and services. Table 3. Inflation Rates for Selected Non-Food Items quarterly averages in percent (2012=100)
Q1 Q2 Q3 Q4 Q1
Non-Food 2.8 2.6 2.3 2.7 2.6
Clothing and Footwear 2.8 2.7 2.3 1.9 2.0
Housing, Water, Electricity,
Gas and Other Fuels 2.9 2.9 2.0 3.2 2.7
Electricty, Gas, and Other Fuels 5.2 5.9 3.6 7.2 4.3
Furnishings, Household Equipment
& Routine Maintenance of the House 2.4 2.4 2.2 2.1 2.4
Health 3.2 2.9 2.5 1.9 2.2
Transport 5.1 4.6 5.2 5.2 4.9
Communication 0.4 0.3 0.3 0.3 0.2
Recreation and Culture 1.0 1.0 1.6 1.3 1.4
Education 3.1 2.8 2.1 1.9 1.8
Restaurant and Miscellaneous
Goods and Services 1.9 1.4 1.8 1.9 2.6
2017 2018
Source of Bas ic Data: PSA, BSP
Commodity
Q1 2018 Inflation Report | 3
Private Sector Economists’ Inflation Forecasts. Results of the BSP’s survey of private sector economists for March 2018 showed that mean inflation forecasts for 2018 and 2019 were higher relative to the results in December 2017.
5
Private sector economists’
mean inflation forecasts for
2018 and 2019 are higher
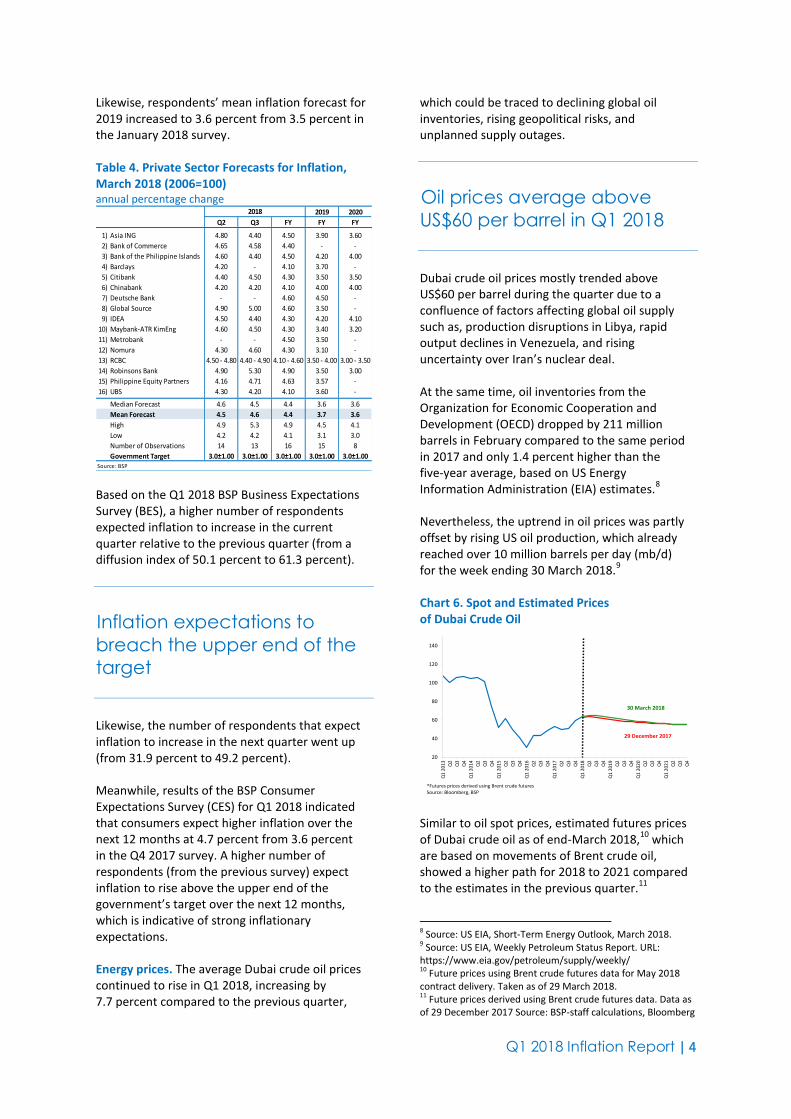
Using the 2006-based headline inflation data, forecasters expect average inflation to breach the upper end of the inflation target with a mean forecast of 4.4 percent in 2018 from 3.6 percent based on the December 2017 survey. Likewise, mean inflation forecast for 2019 rose to 3.7 percent from 3.5 percent during the same review period. Based on the probability distribution of the forecasts provided by 12 out of 16 respondents, there was a 19.2-percent probability that average inflation for 2018 will settle between the 2-4 percent range, while there was a 69.3-percent chance that inflation will rise within the 4.1-5.0 percent band. For 2019, the respondents assigned a 70.2-percent probability that inflation will fall within the 2-4 percent target range. Chart 4. BSP Private Sector Economists’ Survey mean forecast for full year (2006=100); in percent
1
2
3
4
5
Jan
2016 Fe
b
Mar
Apr
May Jun
Jul
Aug Se
p
Oct
Nov
Dec
Jan
2017 Fe
b
Mar
Apr
May Jun
Jul
Aug Se
p
Oct
Nov
Dec
Jan
2018 Fe
b
Mar
2018 2019 2020
Source: BSP
4.4 3.7 3.6
Using the 2012-based headline inflation data, mean inflation forecast for 2018 was at 4.1 percent, while mean forecasts for 2019 and 2020 were at 3.7 percent and 3.6 percent, respectively.
6
5 Of the 27 respondents in March 2018, 16 of which provided forecasts using the 2006-based headline inflation data. The survey was conducted from 8 to 15 March 2018. 6 Of the 27 respondents in March 2018, 17 of which provided forecasts using the 2012-based headline inflation data. The survey was conducted from 8 to 15 March 2018.
Based on the probability distribution of the forecasts provided by 15 out of 17 respondents, there was a 40.3-percent probability that average inflation for 2018 will settle between the 2-4 percent range, while there was a 56.3-percent chance that inflation will rise within the 4.1-5.0 percent band. For 2019, the respondents assigned a 65.8-percent probability that inflation will fall within the 2-4 percent target range. Analysts noted that risks to inflation in 2018 remain tilted to the upside. Possible upside risks to inflation include the implementation of R.A. 10963 or the Tax Reform for Acceleration and Inclusion (TRAIN) law; possible second-round effects of the TRAIN law such as higher wages and transport fares; rise in the prices of goods and services due to TRAIN; higher and volatile global oil prices; rise in utility rates; weakening peso; higher government spending on infrastructure; possible US Fed rate hike; and the 100-basis point reduction in reserve requirements. On the other hand, the key downside risk to inflation was seen to emanate from the implementation of government programs that will balance off the upward pressures on inflation such as the conditional cash transfer, transport subsidies, and rice tariffication. Meanwhile, inflation is anticipated to moderate, stabilize, and settle within the 2-4 percent target range in 2019 to 2020 as TRAIN’s inflationary impact tapers off. Chart 5. Probability Distribution for Analysts’ Inflation Forecasts* 2018-2020
0
10
20
30
40
50
60
70
80
90
100
<1 1.0 – 1.99 2.0 – 3.0 3.1 – 4.0 4.1 – 5.0 5.1 – 6.0 6.1 – 7.0
2018 2019 2020
*Probability distributions were averages of those provided by 12 out of 16 respondents. Source: March 2018 BSP Survey
Results of the February 2018 Consensus Economics inflation forecast survey for the Philippines showed higher mean inflation forecasts for 2018 and 2019. Respondents expect 2018 inflation to settle at 3.9 percent, higher than the 3.6 percent forecast based on the January 2018 survey.
7
7 There were 18 respondents in the Consensus Economics’ survey in February 2018.
Q1 2018 Inflation Report | 4
Likewise, respondents’ mean inflation forecast for 2019 increased to 3.6 percent from 3.5 percent in the January 2018 survey. Table 4. Private Sector Forecasts for Inflation, March 2018 (2006=100) annual percentage change
2019 2020
Q2 Q3 FY FY FY
1) Asia ING 4.80 4.40 4.50 3.90 3.60
2) Bank of Commerce 4.65 4.58 4.40 - -
3) Bank of the Philippine Islands 4.60 4.40 4.50 4.20 4.00
4) Barclays 4.20 - 4.10 3.70 -
5) Citibank 4.40 4.50 4.30 3.50 3.50
6) Chinabank 4.20 4.20 4.10 4.00 4.00
7) Deutsche Bank - - 4.60 4.50 -
8) Global Source 4.90 5.00 4.60 3.50 -
9) IDEA 4.50 4.40 4.30 4.20 4.10
10) Maybank-ATR KimEng 4.60 4.50 4.30 3.40 3.20
11) Metrobank - - 4.50 3.50 -
12) Nomura 4.30 4.60 4.30 3.10 -
13) RCBC 4.50 - 4.80 4.40 - 4.90 4.10 - 4.60 3.50 - 4.00 3.00 - 3.50
14) Robinsons Bank 4.90 5.30 4.90 3.50 3.00
15) Philippine Equity Partners 4.16 4.71 4.63 3.57 -
16) UBS 4.30 4.20 4.10 3.60 -
Median Forecast 4.6 4.5 4.4 3.6 3.6
Mean Forecast 4.5 4.6 4.4 3.7 3.6
High 4.9 5.3 4.9 4.5 4.1
Low 4.2 4.2 4.1 3.1 3.0
Number of Observations 14 13 16 15 8
Government Target 3.0±1.00 3.0±1.00 3.0±1.00 3.0±1.00 3.0±1.00Source: BSP
2018
Based on the Q1 2018 BSP Business Expectations Survey (BES), a higher number of respondents expected inflation to increase in the current quarter relative to the previous quarter (from a diffusion index of 50.1 percent to 61.3 percent).
Inflation expectations to
breach the upper end of the
target
Likewise, the number of respondents that expect inflation to increase in the next quarter went up (from 31.9 percent to 49.2 percent). Meanwhile, results of the BSP Consumer Expectations Survey (CES) for Q1 2018 indicated that consumers expect higher inflation over the next 12 months at 4.7 percent from 3.6 percent in the Q4 2017 survey. A higher number of respondents (from the previous survey) expect inflation to rise above the upper end of the government’s target over the next 12 months, which is indicative of strong inflationary expectations. Energy prices. The average Dubai crude oil prices continued to rise in Q1 2018, increasing by 7.7 percent compared to the previous quarter,
which could be traced to declining global oil inventories, rising geopolitical risks, and unplanned supply outages.
Oil prices average above
US$60 per barrel in Q1 2018
Dubai crude oil prices mostly trended above US$60 per barrel during the quarter due to a confluence of factors affecting global oil supply such as, production disruptions in Libya, rapid output declines in Venezuela, and rising uncertainty over Iran’s nuclear deal. At the same time, oil inventories from the Organization for Economic Cooperation and Development (OECD) dropped by 211 million barrels in February compared to the same period in 2017 and only 1.4 percent higher than the five-year average, based on US Energy Information Administration (EIA) estimates.
8
Nevertheless, the uptrend in oil prices was partly offset by rising US oil production, which already reached over 10 million barrels per day (mb/d) for the week ending 30 March 2018.
9
Chart 6. Spot and Estimated Prices of Dubai Crude Oil
20
40
60
80
100
120
140
Q1
2013 Q
2
Q3
Q4
Q1
2014 Q
2
Q3
Q4
Q1
2015 Q
2
Q3
Q4
Q1
2016 Q
2
Q3
Q4
Q1
2017 Q
2
Q3
Q4
Q1
2018 Q
2
Q3
Q4
Q1
2019 Q
2
Q3
Q4
Q1
2020 Q
2
Q3
Q4
Q1
2021 Q
2
Q3
Q4
*Futures prices derived using Brent crude futuresSource: Bloomberg, BSP
30 March 2018
29 December 2017
Similar to oil spot prices, estimated futures prices of Dubai crude oil as of end-March 2018,
10 which
are based on movements of Brent crude oil, showed a higher path for 2018 to 2021 compared to the estimates in the previous quarter.
11
8 Source: US EIA, Short-Term Energy Outlook, March 2018. 9 Source: US EIA, Weekly Petroleum Status Report. URL: https://www.eia.gov/petroleum/supply/weekly/ 10 Future prices using Brent crude futures data for May 2018 contract delivery. Taken as of 29 March 2018. 11 Future prices derived using Brent crude futures data. Data as of 29 December 2017 Source: BSP-staff calculations, Bloomberg
Q1 2018 Inflation Report | 5
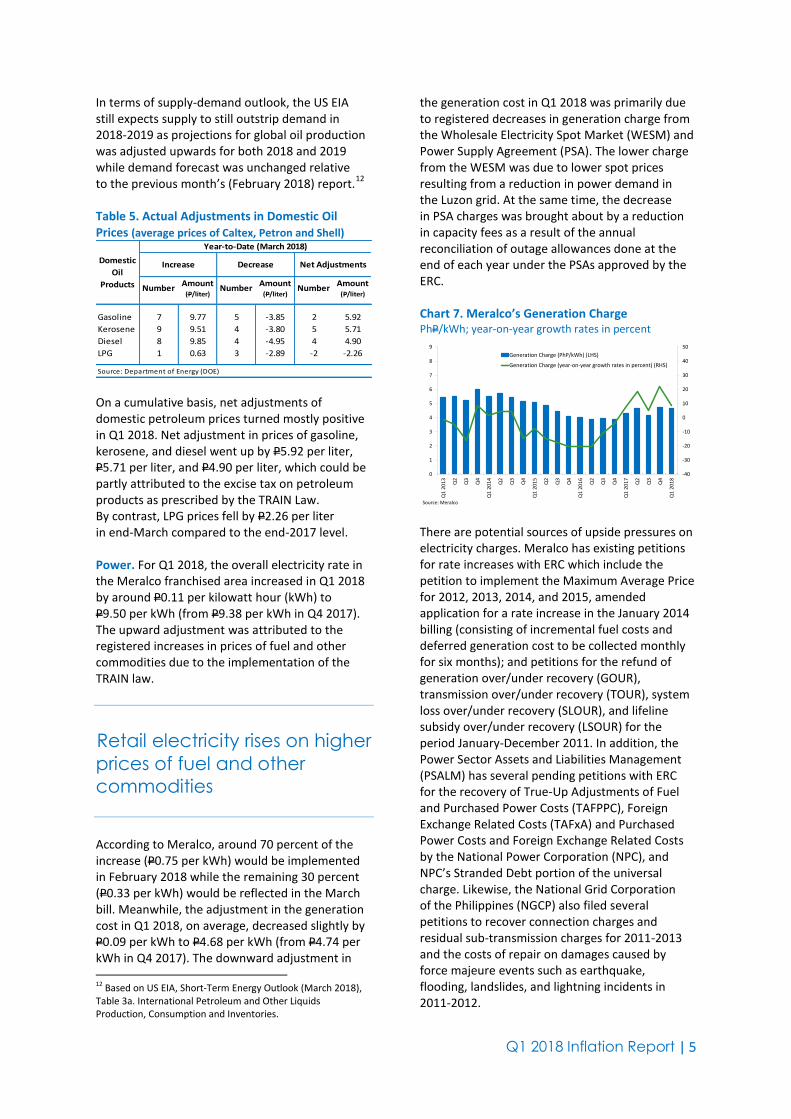
In terms of supply-demand outlook, the US EIA still expects supply to still outstrip demand in 2018-2019 as projections for global oil production was adjusted upwards for both 2018 and 2019 while demand forecast was unchanged relative to the previous month’s (February 2018) report.
12
Table 5. Actual Adjustments in Domestic Oil Prices (average prices of Caltex, Petron and Shell)
NumberAmount
(P/liter)Number
Amount (P/liter)
NumberAmount
(P/liter)
Gasoline 7 9.77 5 -3.85 2 5.92
Kerosene 9 9.51 4 -3.80 5 5.71
Diesel 8 9.85 4 -4.95 4 4.90
LPG 1 0.63 3 -2.89 -2 -2.26
Source: Department of Energy (DOE)
Domestic
Oil
Products
Year-to-Date (March 2018)
Increase Decrease Net Adjustments
On a cumulative basis, net adjustments of domestic petroleum prices turned mostly positive in Q1 2018. Net adjustment in prices of gasoline, kerosene, and diesel went up by P5.92 per liter, P5.71 per liter, and P4.90 per liter, which could be partly attributed to the excise tax on petroleum products as prescribed by the TRAIN Law. By contrast, LPG prices fell by P2.26 per liter in end-March compared to the end-2017 level. Power. For Q1 2018, the overall electricity rate in the Meralco franchised area increased in Q1 2018 by around P0.11 per kilowatt hour (kWh) to P9.50 per kWh (from P9.38 per kWh in Q4 2017). The upward adjustment was attributed to the registered increases in prices of fuel and other commodities due to the implementation of the TRAIN law.
Retail electricity rises on higher
prices of fuel and other
commodities
According to Meralco, around 70 percent of the increase (P0.75 per kWh) would be implemented in February 2018 while the remaining 30 percent (P0.33 per kWh) would be reflected in the March bill. Meanwhile, the adjustment in the generation cost in Q1 2018, on average, decreased slightly by P0.09 per kWh to P4.68 per kWh (from P4.74 per kWh in Q4 2017). The downward adjustment in 12 Based on US EIA, Short-Term Energy Outlook (March 2018), Table 3a. International Petroleum and Other Liquids Production, Consumption and Inventories.
the generation cost in Q1 2018 was primarily due to registered decreases in generation charge from the Wholesale Electricity Spot Market (WESM) and Power Supply Agreement (PSA). The lower charge from the WESM was due to lower spot prices resulting from a reduction in power demand in the Luzon grid. At the same time, the decrease in PSA charges was brought about by a reduction in capacity fees as a result of the annual reconciliation of outage allowances done at the end of each year under the PSAs approved by the ERC. Chart 7. Meralco’s Generation Charge PhP/kWh; year-on-year growth rates in percent
-40
-30
-20
-10
0
10
20
30
40
50
0
1
2
3
4
5
6
7
8
9
Q1
20
13
Q2
Q3
Q4
Q1
20
14
Q2
Q3
Q4
Q1
20
15
Q2
Q3
Q4
Q1
20
16
Q2
Q3
Q4
Q1
20
17
Q2
Q3
Q4
Q1
20
18
Generation Charge (PhP/kWh) (LHS)
Generation Charge (year-on-year growth rates in percent) (RHS)
Source: Meralco There are potential sources of upside pressures on electricity charges. Meralco has existing petitions for rate increases with ERC which include the petition to implement the Maximum Average Price for 2012, 2013, 2014, and 2015, amended application for a rate increase in the January 2014 billing (consisting of incremental fuel costs and deferred generation cost to be collected monthly for six months); and petitions for the refund of generation over/under recovery (GOUR), transmission over/under recovery (TOUR), system loss over/under recovery (SLOUR), and lifeline subsidy over/under recovery (LSOUR) for the period January-December 2011. In addition, the Power Sector Assets and Liabilities Management (PSALM) has several pending petitions with ERC for the recovery of True-Up Adjustments of Fuel and Purchased Power Costs (TAFPPC), Foreign Exchange Related Costs (TAFxA) and Purchased Power Costs and Foreign Exchange Related Costs by the National Power Corporation (NPC), and NPC’s Stranded Debt portion of the universal charge. Likewise, the National Grid Corporation of the Philippines (NGCP) also filed several petitions to recover connection charges and residual sub-transmission charges for 2011-2013 and the costs of repair on damages caused by force majeure events such as earthquake, flooding, landslides, and lightning incidents in 2011-2012.
Q1 2018 Inflation Report | 6
Box Article: Rebasing of the Consumer Price Index (CPI) to 2012 The Philippine Statistics Authority (PSA) released on 6 March 2018 the rebased CPI with 2012 as base year pursuant to PSA Board Resolution No. 01 Series of 2017-146 which approved the synchronized rebasing of price indices to base year 2006 and every six (6) years thereafter. 1. Key Comparison between 2006-based and 2012-based Inflation Rates
Based on information from the PSA, the difference between the 2006- and 2012-based CPI series can be attributed to the changes in the following:
- Composition of the market basket (the sample of goods and services that represent the totality of all the goods and services purchased by households relative to the base year);
- Weights attached to the commodity groups; and - Use of the chain method for the computation of price relatives (defined below) per commodity.
The 2012-based inflation is lower, on average, compared to the 2006-based series.
The change in the formula for the computation of CPI did not have a significant impact on the 2012-based inflation rate.
2. Features of the 2012-based CPI
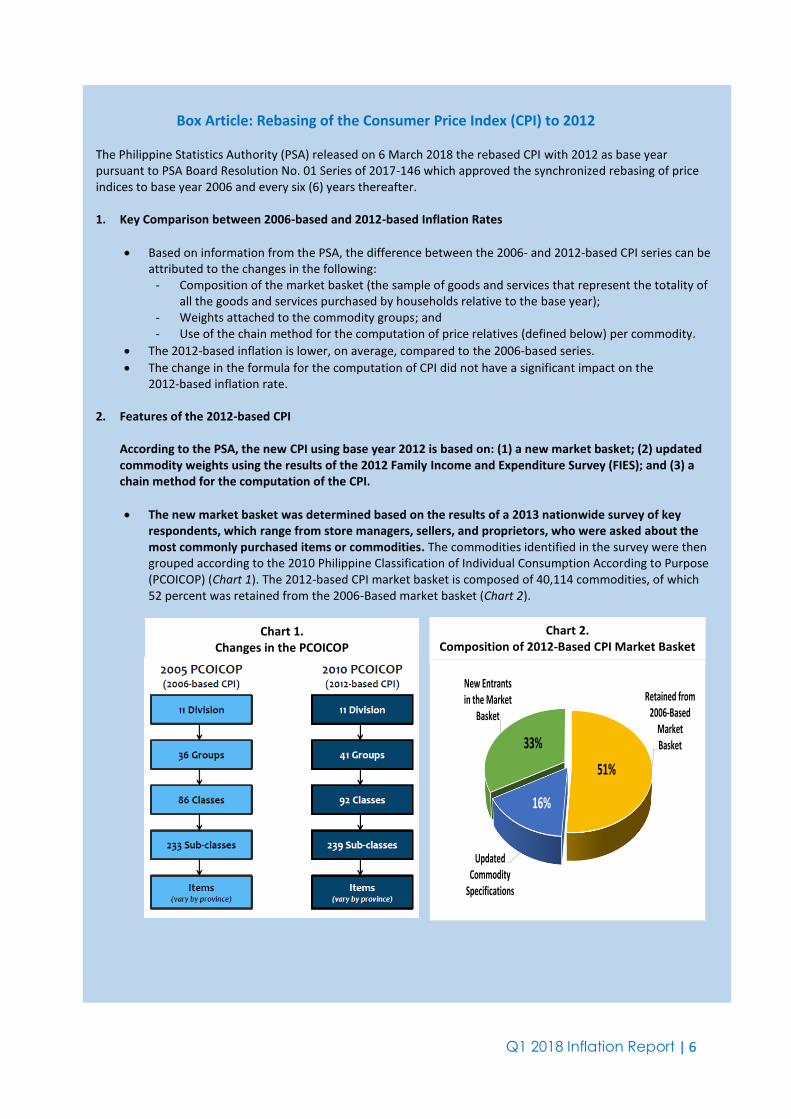
According to the PSA, the new CPI using base year 2012 is based on: (1) a new market basket; (2) updated commodity weights using the results of the 2012 Family Income and Expenditure Survey (FIES); and (3) a chain method for the computation of the CPI.
The new market basket was determined based on the results of a 2013 nationwide survey of key respondents, which range from store managers, sellers, and proprietors, who were asked about the most commonly purchased items or commodities. The commodities identified in the survey were then grouped according to the 2010 Philippine Classification of Individual Consumption According to Purpose (PCOICOP) (Chart 1). The 2012-based CPI market basket is composed of 40,114 commodities, of which 52 percent was retained from the 2006-Based market basket (Chart 2).
Chart 1. Changes in the PCOICOP
Chart 2. Composition of 2012-Based CPI Market Basket
Retained from 2006-Based
Market Basket
Updated Commodity
Specifications
New Entrants in the Market
Basket
33%
16%
51%

Q1 2018 Inflation Report | 7
The national and regional weights, which refer to the value attached to a commodity or group of commodities to indicate the relative importance of that commodity or group of commodities in the market basket for the 2012-based CPI were derived by the PSA from the expenditure data of the latest available Family Income and Expenditure Survey (FIES) for 2012. The weight for each item of expenditure denotes a proportion of that expenditure item to total national household expenditure. Comparing the weights of the 2006-based and 2012-based CPI for the Philippines, the difference ranges from negative 64 to 90 basis points (Table 1). Weights decreased across commodity groups except for, Health, Transport, Communication, and Restaurants and Miscellaneous Goods and Services.
According to the PSA, changes were introduced in the methodology for computing the 2012-based CPI in terms of: (1) monthly average prices of commodities; (2) price relatives (see formula below) per commodity; and (3) sub-class indices or the price indices for 5-digit level items. There were no changes in the computation of higher-level indices (i.e., CPI for 4-digit up to All Items CPI).
Computing the 2012-based CPI series entails using a straightforward arithmetic mean computation for the monthly average prices of commodities and chain method for calculating elementary item indices – geometric mean method at the lowest level (i.e., for 5-digit level items) of aggregation of price indices and weighted arithmetic mean at the higher levels (class-, group-, and division-level, i.e. 4-, 3-, and 2-digit) of aggregation of price indices.
The chain method for the computation of price relatives per commodity was employed by getting the ratio of average commodity price for the current month to average commodity price for the previous month. In the 2006-based method, the average commodity price in the base year is used as denominator instead of the average commodity price for the previous month in coming up with price relatives.
Old Method (2006-based CPI) New Method (2012-based CPI)
Note: PR = Price Relative
TABLE 1. COMPARISON OF CPI WEIGHTS (PHILIPPINES)
2006=100 2012=100 Difference
ALL ITEMS 100.00 100.00
01 Food and Non-Alcoholic Beverages 38.98 38.34 -0.64
02 Alcoholic Beverages and Tobacco 2.00 1.58 -0.41
03 Clothing and Footwear 2.95 2.93 -0.02
04 Housing, Water, Electricity, Gas and Other Fuels 22.47 22.04 -0.43
Furnishings, Household Equipment and Routine
Maintenance of the House
06 Health 2.99 3.89 0.90
07 Transport 7.81 8.06 0.25
08 Communication 2.26 2.93 0.67
09 Recreation and Culture 1.93 1.41 -0.53
10 Education 3.36 3.28 -0.08
11 Restaurants and Miscellaneous Goods and Services 12.03 12.59 0.56
COMMODITY GROUP
05 3.22 2.95 -0.27

Q1 2018 Inflation Report | 8
Meanwhile, the 5-digit level item index is computed by first getting the geometric mean of price
relatives and multiplying the geometric mean with previous month’s index. In the current method, the 5-digit level item index is simply the arithmetic mean of the price relatives of commodities included in the 5-digit level item.
Old Method (2006-based CPI) New Method (2012-based CPI)
I5-digit = 5-digit level item index (sub-class index) PRi = Price relative of commodity i under the sub-class n = number of commodities under the sub-class
Step 1:
Geo Mean = geometric mean
Step 2: Current Month Index = (Geo Mean of PR) * (Previous Month’s Index) = I5-digit
Other Activities Related to Rebasing of CPI
2012-based CPI series: Historical 2012-based CPI series (January 1957 - December 2011) will be released
in September 2018.
Rebasing of Core Inflation to 2012
– The rebasing of the CPI to 2012 necessitates a review of the list of excluded items from the
official measure of core inflation rate in accordance with PSA Board Resolution No. 01, Series of
2017-096. The said Resolution which approved the official definition and methodology for
computing core inflation in the Philippines based on the exclusion method also requires a
review of the list of excluded items whenever the CPI data is rebased.
– The list of excluded items from the official core inflation measure is currently being reviewed by
an inter-agency technical working group composed of staff from the PSA, NEDA, and BSP.
Sources: PSA technical notes and presentations
Q1 2018 Inflation Report | 9
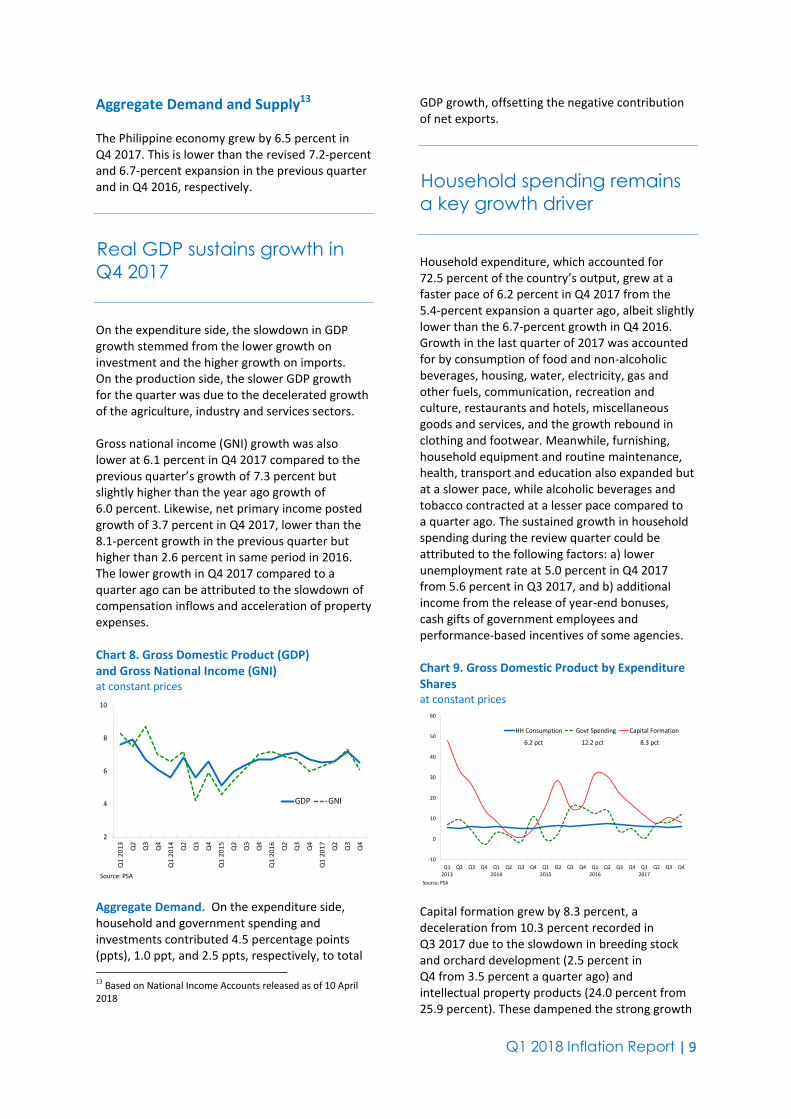
Aggregate Demand and Supply13 The Philippine economy grew by 6.5 percent in Q4 2017. This is lower than the revised 7.2-percent and 6.7-percent expansion in the previous quarter and in Q4 2016, respectively.
Real GDP sustains growth in
Q4 2017
On the expenditure side, the slowdown in GDP growth stemmed from the lower growth on investment and the higher growth on imports. On the production side, the slower GDP growth for the quarter was due to the decelerated growth of the agriculture, industry and services sectors. Gross national income (GNI) growth was also lower at 6.1 percent in Q4 2017 compared to the previous quarter’s growth of 7.3 percent but slightly higher than the year ago growth of 6.0 percent. Likewise, net primary income posted growth of 3.7 percent in Q4 2017, lower than the 8.1-percent growth in the previous quarter but higher than 2.6 percent in same period in 2016. The lower growth in Q4 2017 compared to a quarter ago can be attributed to the slowdown of compensation inflows and acceleration of property expenses. Chart 8. Gross Domestic Product (GDP) and Gross National Income (GNI) at constant prices
2
4
6
8
10
Q1
20
13
Q2
Q3
Q4
Q1
20
14
Q2
Q3
Q4
Q1
20
15
Q2
Q3
Q4
Q1
20
16
Q2
Q3
Q4
Q1
20
17
Q2
Q3
Q4
GDP GNI
Source: PSA Aggregate Demand. On the expenditure side, household and government spending and investments contributed 4.5 percentage points (ppts), 1.0 ppt, and 2.5 ppts, respectively, to total 13 Based on National Income Accounts released as of 10 April 2018
GDP growth, offsetting the negative contribution of net exports.
Household spending remains
a key growth driver
Household expenditure, which accounted for 72.5 percent of the country’s output, grew at a faster pace of 6.2 percent in Q4 2017 from the 5.4-percent expansion a quarter ago, albeit slightly lower than the 6.7-percent growth in Q4 2016. Growth in the last quarter of 2017 was accounted for by consumption of food and non-alcoholic beverages, housing, water, electricity, gas and other fuels, communication, recreation and culture, restaurants and hotels, miscellaneous goods and services, and the growth rebound in clothing and footwear. Meanwhile, furnishing, household equipment and routine maintenance, health, transport and education also expanded but at a slower pace, while alcoholic beverages and tobacco contracted at a lesser pace compared to a quarter ago. The sustained growth in household spending during the review quarter could be attributed to the following factors: a) lower unemployment rate at 5.0 percent in Q4 2017 from 5.6 percent in Q3 2017, and b) additional income from the release of year-end bonuses, cash gifts of government employees and performance-based incentives of some agencies. Chart 9. Gross Domestic Product by Expenditure Shares at constant prices
-10
0
10
20
30
40
50
60
Q12013
Q2 Q3 Q4 Q12014
Q2 Q3 Q4 Q12015
Q2 Q3 Q4 Q12016
Q2 Q3 Q4 Q12017
Q2 Q3 Q4
HH Consumption Govt Spending Capital Formation
Source: PSA
6.2 pct 12.2 pct 8.3 pct
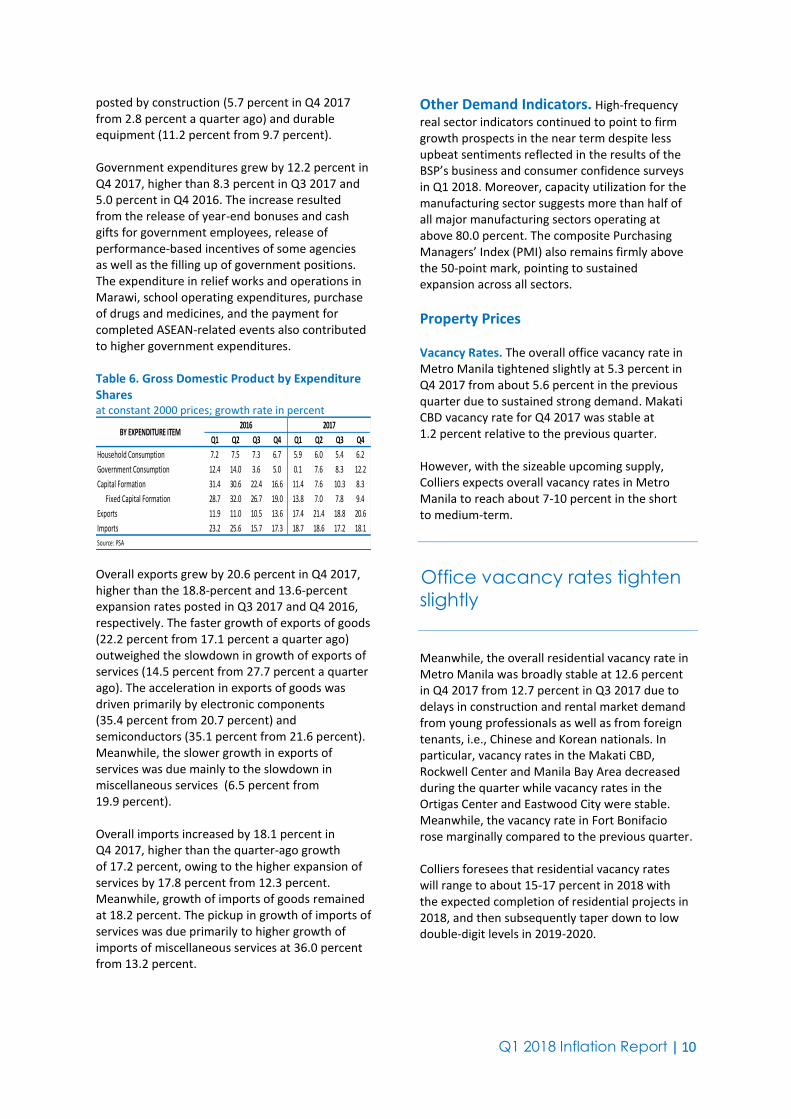
Capital formation grew by 8.3 percent, a deceleration from 10.3 percent recorded in Q3 2017 due to the slowdown in breeding stock and orchard development (2.5 percent in Q4 from 3.5 percent a quarter ago) and intellectual property products (24.0 percent from 25.9 percent). These dampened the strong growth
Q1 2018 Inflation Report | 10
posted by construction (5.7 percent in Q4 2017 from 2.8 percent a quarter ago) and durable equipment (11.2 percent from 9.7 percent). Government expenditures grew by 12.2 percent in Q4 2017, higher than 8.3 percent in Q3 2017 and 5.0 percent in Q4 2016. The increase resulted from the release of year-end bonuses and cash gifts for government employees, release of performance-based incentives of some agencies as well as the filling up of government positions. The expenditure in relief works and operations in Marawi, school operating expenditures, purchase of drugs and medicines, and the payment for completed ASEAN-related events also contributed to higher government expenditures. Table 6. Gross Domestic Product by Expenditure Shares at constant 2000 prices; growth rate in percent
Q1 Q2 Q3 Q4 Q1 Q2 Q3 Q4
Household Consumption 7.2 7.5 7.3 6.7 5.9 6.0 5.4 6.2
Government Consumption 12.4 14.0 3.6 5.0 0.1 7.6 8.3 12.2
Capital Formation 31.4 30.6 22.4 16.6 11.4 7.6 10.3 8.3
Fixed Capital Formation 28.7 32.0 26.7 19.0 13.8 7.0 7.8 9.4
Exports 11.9 11.0 10.5 13.6 17.4 21.4 18.8 20.6
Imports 23.2 25.6 15.7 17.3 18.7 18.6 17.2 18.1
Source: PSA
BY EXPENDITURE ITEM2016 2017
Overall exports grew by 20.6 percent in Q4 2017, higher than the 18.8-percent and 13.6-percent expansion rates posted in Q3 2017 and Q4 2016, respectively. The faster growth of exports of goods (22.2 percent from 17.1 percent a quarter ago) outweighed the slowdown in growth of exports of services (14.5 percent from 27.7 percent a quarter ago). The acceleration in exports of goods was driven primarily by electronic components (35.4 percent from 20.7 percent) and semiconductors (35.1 percent from 21.6 percent). Meanwhile, the slower growth in exports of services was due mainly to the slowdown in miscellaneous services (6.5 percent from 19.9 percent). Overall imports increased by 18.1 percent in Q4 2017, higher than the quarter-ago growth of 17.2 percent, owing to the higher expansion of services by 17.8 percent from 12.3 percent. Meanwhile, growth of imports of goods remained at 18.2 percent. The pickup in growth of imports of services was due primarily to higher growth of imports of miscellaneous services at 36.0 percent from 13.2 percent.
Other Demand Indicators. High-frequency
real sector indicators continued to point to firm growth prospects in the near term despite less upbeat sentiments reflected in the results of the BSP’s business and consumer confidence surveys in Q1 2018. Moreover, capacity utilization for the manufacturing sector suggests more than half of all major manufacturing sectors operating at above 80.0 percent. The composite Purchasing Managers’ Index (PMI) also remains firmly above the 50-point mark, pointing to sustained expansion across all sectors.
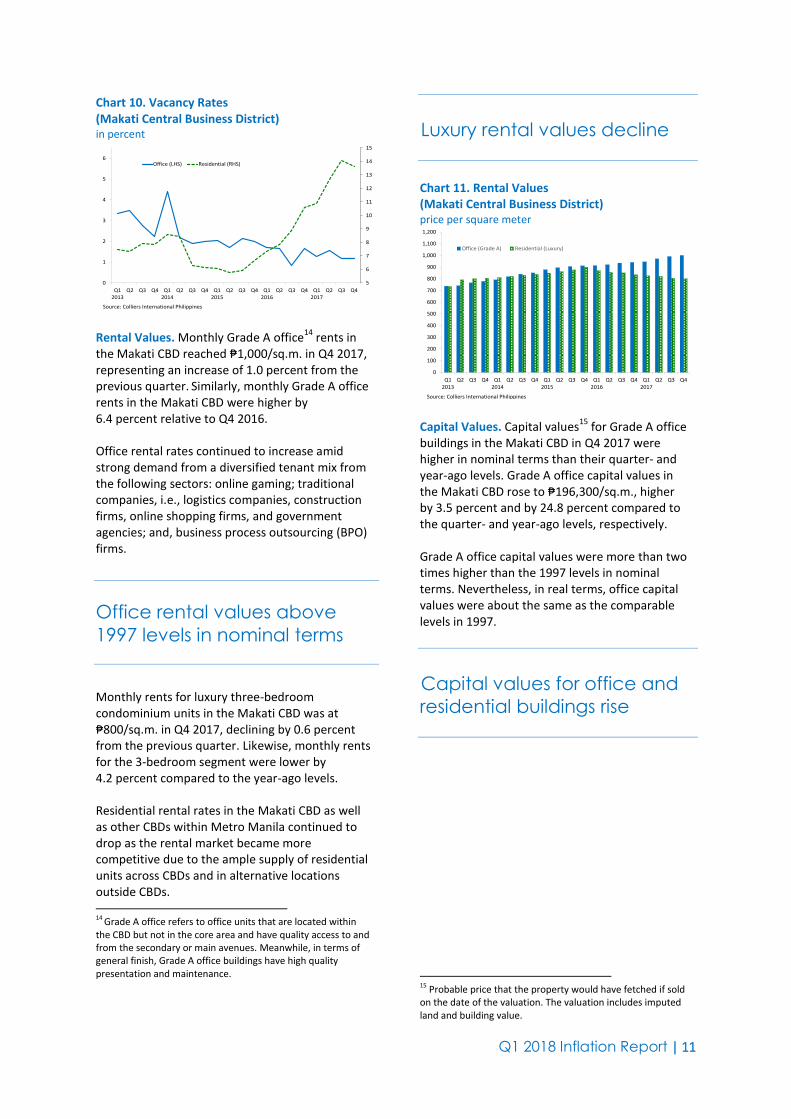
Property Prices Vacancy Rates. The overall office vacancy rate in Metro Manila tightened slightly at 5.3 percent in Q4 2017 from about 5.6 percent in the previous quarter due to sustained strong demand. Makati CBD vacancy rate for Q4 2017 was stable at 1.2 percent relative to the previous quarter. However, with the sizeable upcoming supply, Colliers expects overall vacancy rates in Metro Manila to reach about 7-10 percent in the short to medium-term.
Office vacancy rates tighten
slightly
Meanwhile, the overall residential vacancy rate in Metro Manila was broadly stable at 12.6 percent in Q4 2017 from 12.7 percent in Q3 2017 due to delays in construction and rental market demand from young professionals as well as from foreign tenants, i.e., Chinese and Korean nationals. In particular, vacancy rates in the Makati CBD, Rockwell Center and Manila Bay Area decreased during the quarter while vacancy rates in the Ortigas Center and Eastwood City were stable. Meanwhile, the vacancy rate in Fort Bonifacio rose marginally compared to the previous quarter. Colliers foresees that residential vacancy rates will range to about 15-17 percent in 2018 with the expected completion of residential projects in 2018, and then subsequently taper down to low double-digit levels in 2019-2020.
Q1 2018 Inflation Report | 11
Chart 10. Vacancy Rates (Makati Central Business District) in percent
5
6
7
8
9
10
11
12
13
14
15
0
1
2
3
4
5
6
Q12013
Q2 Q3 Q4 Q12014
Q2 Q3 Q4 Q12015
Q2 Q3 Q4 Q12016
Q2 Q3 Q4 Q12017
Q2 Q3 Q4
Office (LHS) Residential (RHS)
Source: Colliers International Philippines Rental Values. Monthly Grade A office
14 rents in
the Makati CBD reached ₱1,000/sq.m. in Q4 2017, representing an increase of 1.0 percent from the previous quarter.
Similarly, monthly Grade A office
rents in the Makati CBD were higher by 6.4 percent relative to Q4 2016. Office rental rates continued to increase amid strong demand from a diversified tenant mix from the following sectors: online gaming; traditional companies, i.e., logistics companies, construction firms, online shopping firms, and government agencies; and, business process outsourcing (BPO) firms.
Office rental values above
1997 levels in nominal terms
Monthly rents for luxury three-bedroom condominium units in the Makati CBD was at ₱800/sq.m. in Q4 2017, declining by 0.6 percent from the previous quarter. Likewise, monthly rents for the 3-bedroom segment were lower by 4.2 percent compared to the year-ago levels. Residential rental rates in the Makati CBD as well as other CBDs within Metro Manila continued to drop as the rental market became more competitive due to the ample supply of residential units across CBDs and in alternative locations outside CBDs. 14 Grade A office refers to office units that are located within the CBD but not in the core area and have quality access to and from the secondary or main avenues. Meanwhile, in terms of general finish, Grade A office buildings have high quality presentation and maintenance.
Luxury rental values decline
Chart 11. Rental Values (Makati Central Business District) price per square meter
0
100
200
300
400
500
600
700
800
900
1,000
1,100
1,200
Q12013
Q2 Q3 Q4 Q12014
Q2 Q3 Q4 Q12015
Q2 Q3 Q4 Q12016
Q2 Q3 Q4 Q12017
Q2 Q3 Q4
Office (Grade A) Residential (Luxury)
Source: Colliers International Philippines Capital Values. Capital values
15 for Grade A office
buildings in the Makati CBD in Q4 2017 were higher in nominal terms than their quarter- and year-ago levels. Grade A office capital values in the Makati CBD rose to ₱196,300/sq.m., higher by 3.5 percent and by 24.8 percent compared to the quarter- and year-ago levels, respectively. Grade A office capital values were more than two times higher than the 1997 levels in nominal terms. Nevertheless, in real terms, office capital values were about the same as the comparable levels in 1997.
Capital values for office and
residential buildings rise
15 Probable price that the property would have fetched if sold on the date of the valuation. The valuation includes imputed land and building value.
Q1 2018 Inflation Report | 12
Chart 12. Capital Values (Makati Central Business District) price per square meter
0
20,000
40,000
60,000
80,000
100,000
120,000
140,000
160,000
180,000
200,000
220,000
Q1
20
13
Q2
Q3
Q4
Q1
20
14
Q2
Q3
Q4
Q1
20
15
Q2
Q3
Q4
Q1
20
16
Q2
Q3
Q4
Q1
20
17
Q2
Q3
Q4
Office (Grade A) Residential (luxury)
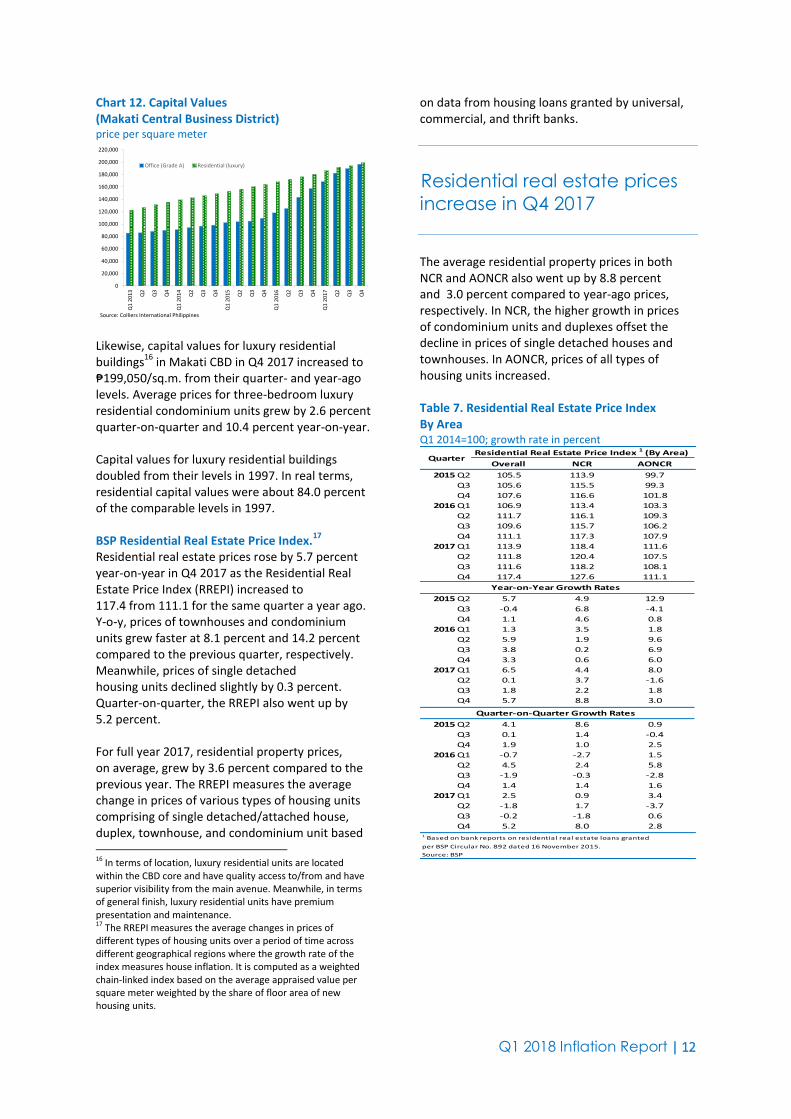
Source: Colliers International Philippines Likewise, capital values for luxury residential buildings
16 in Makati CBD in Q4 2017 increased to
₱199,050/sq.m. from their quarter- and year-ago levels. Average prices for three-bedroom luxury residential condominium units grew by 2.6 percent quarter-on-quarter and 10.4 percent year-on-year. Capital values for luxury residential buildings doubled from their levels in 1997. In real terms, residential capital values were about 84.0 percent of the comparable levels in 1997. BSP Residential Real Estate Price Index.
17
Residential real estate prices rose by 5.7 percent year-on-year in Q4 2017 as the Residential Real Estate Price Index (RREPI) increased to 117.4 from 111.1 for the same quarter a year ago. Y-o-y, prices of townhouses and condominium units grew faster at 8.1 percent and 14.2 percent compared to the previous quarter, respectively. Meanwhile, prices of single detached housing units declined slightly by 0.3 percent. Quarter-on-quarter, the RREPI also went up by 5.2 percent. For full year 2017, residential property prices, on average, grew by 3.6 percent compared to the previous year. The RREPI measures the average change in prices of various types of housing units comprising of single detached/attached house, duplex, townhouse, and condominium unit based 16 In terms of location, luxury residential units are located within the CBD core and have quality access to/from and have superior visibility from the main avenue. Meanwhile, in terms of general finish, luxury residential units have premium presentation and maintenance. 17 The RREPI measures the average changes in prices of different types of housing units over a period of time across different geographical regions where the growth rate of the index measures house inflation. It is computed as a weighted chain-linked index based on the average appraised value per square meter weighted by the share of floor area of new housing units.
on data from housing loans granted by universal, commercial, and thrift banks.
Residential real estate prices
increase in Q4 2017
The average residential property prices in both NCR and AONCR also went up by 8.8 percent and 3.0 percent compared to year-ago prices, respectively. In NCR, the higher growth in prices of condominium units and duplexes offset the decline in prices of single detached houses and townhouses. In AONCR, prices of all types of housing units increased. Table 7. Residential Real Estate Price Index By Area Q1 2014=100; growth rate in percent
Overall NCR AONCR
2015 Q2 105.5 113.9 99.7
Q3 105.6 115.5 99.3
Q4 107.6 116.6 101.8
2016 Q1 106.9 113.4 103.3
Q2 111.7 116.1 109.3
Q3 109.6 115.7 106.2
Q4 111.1 117.3 107.9
2017 Q1 113.9 118.4 111.6
Q2 111.8 120.4 107.5
Q3 111.6 118.2 108.1
Q4 117.4 127.6 111.1
2015 Q2 5.7 4.9 12.9
Q3 -0.4 6.8 -4.1
Q4 1.1 4.6 0.8
2016 Q1 1.3 3.5 1.8
Q2 5.9 1.9 9.6
Q3 3.8 0.2 6.9
Q4 3.3 0.6 6.0
2017 Q1 6.5 4.4 8.0
Q2 0.1 3.7 -1.6
Q3 1.8 2.2 1.8
Q4 5.7 8.8 3.0
2015 Q2 4.1 8.6 0.9
Q3 0.1 1.4 -0.4
Q4 1.9 1.0 2.5
2016 Q1 -0.7 -2.7 1.5
Q2 4.5 2.4 5.8
Q3 -1.9 -0.3 -2.8
Q4 1.4 1.4 1.6
2017 Q1 2.5 0.9 3.4
Q2 -1.8 1.7 -3.7
Q3 -0.2 -1.8 0.6
Q4 5.2 8.0 2.81 Based on bank reports on residential real estate loans granted
per BSP Circular No. 892 dated 16 November 2015.
Source: BSP
Year-on-Year Growth Rates
Quarter-on-Quarter Growth Rates
Residential Real Estate Price Index 1 (By Area)Quarter

Q1 2018 Inflation Report | 13
Table 8. Residential Real Estate Price Index By Housing Type Q1 2014=100; growth rate in percent
Overall 2Single
Detached/
AttachedDuplex 3 Townhouse
Condominium
Unit
2015 Q2 105.5 97.9 97.9 96.8 120.0
Q3 105.6 97.3 101.9 97.7 122.1
Q4 107.6 100.6 99.8 101.2 121.1
2016 Q1 106.9 98.9 114.7 107.3 123.2
Q2 111.7 105.8 98.5 109.3 123.9
Q3 109.6 102.6 96.7 100.5 126.4
Q4 111.1 104.9 87.5 107.7 125.5
2017 Q1 113.9 108.0 91.2 107.6 128.3
Q2 111.8 103.6 103.6 112.7 129.3
Q3 111.6 103.4 88.4 107.8 131.0
Q4 117.4 104.6 102.6 116.4 143.3
2015 Q2 5.7 12.8 1.0 -6.7 7.4
Q3 -0.4 -2.2 14.5 -1.1 5.8
Q4 1.1 2.3 -5.8 5.0 2.3
2016 Q1 1.3 -0.9 10.4 4.0 8.7
Q2 5.9 8.1 0.6 12.9 3.3
Q3 3.8 5.4 -5.1 2.9 3.5
Q4 3.3 4.3 -12.3 6.4 3.6
2017 Q1 6.5 9.2 -20.5 0.3 4.1
Q2 0.1 -2.1 5.2 3.1 4.4
Q3 1.8 0.8 -8.6 7.3 3.6
Q4 5.7 -0.3 17.3 8.1 14.2
2015 Q2 0.0 -1.9 -5.8 -6.2 5.9
Q3 0.1 -0.6 4.1 0.9 1.7
Q4 1.9 3.4 -2.1 3.6 -0.8
2016 Q1 -0.7 -1.7 14.9 6.0 1.7
Q2 4.5 7.0 -14.1 1.9 0.6
Q3 -1.9 -3.0 -1.8 -8.1 2.0
Q4 1.4 2.2 -9.5 7.2 -0.7
2017 Q1 2.5 3.0 4.2 -0.1 2.2
Q2 -1.8 -4.1 13.6 4.7 0.8
Q3 -0.2 -0.2 -14.7 -4.3 1.3
Q4 5.2 1.2 16.1 8.0 9.41 Based on bank reports on residential real estate loans granted per BSP Circular No. 892
dated 16 November 2015.2 No index generated for apartments due to very few observations.3 Indices for duplex exhibit more volatility due to relatively small number of reported real estate loans.
Source: BSP
Quarter-on-Quarter Growth Rates
Quarter
Residential Real Estate Price Index 1 (By Housing Type)
Year-on-Year Growth Rates
Vehicle Sales. The growth in sales of new vehicles from CAMPI
18 members slowed down to
0.6 percent y-o-y in the first two months of Q1 2018 from the 17.4-percent growth recorded in the same period a year ago, reflecting the contraction in the sales of passenger cars and slowdown in the growth of commercial vehicles. 18 Vehicle sales data is gathered on a monthly basis by the Chamber of Automotive Manufacturers of the Philippines (CAMPI). CAMPI represents the local assemblers and manufacturers of vehicle units in the Philippine automotive industry. The following are the active members of CAMPI: (1) Asian Carmakers Corp., (2) CATS Motors, Inc., (3) Columbian Autocar Corp., (4) Honda Cars Philippines, Inc., (5) Isuzu Philippines Corp., (6) Mitsubishi Motors Philippines Corp., (7) Nissan Motor Philippines Corp., (8) Suzuki Philippines Inc., (9) Toyota Motor Philippines Corp. and (10) Universal Motors Corp.
Growth in sales of new
vehicles slows down
Sales of passenger cars declined by 10.5 percent y-o-y in January-February 2018 from the 8.9-percent growth in the same period in 2017. New passenger car sales accrued to a total of 17,982 in the first two months of Q1 2018 units from 20,098 units in the same period a year ago. Chart 13. Vehicle Sales number of units
0
5
10
15
20
25
30
35
40
45
Q1
20
13
*
Q1
Q2
Q3
Q4
Q1
20
14
*
Q1
Q2
Q3
Q4
Q1
20
15
*
Q1
Q2
Q3
Q4
Q1
20
16
*
Q1
Q2
Q3
Q4
Q1
20
17
*
Q1
Q2
Q3
Q4
Q1
20
18
*
* January - February Source: Chamber of Automotive Manufacturers of the Philippines, Inc. (CAMPI)
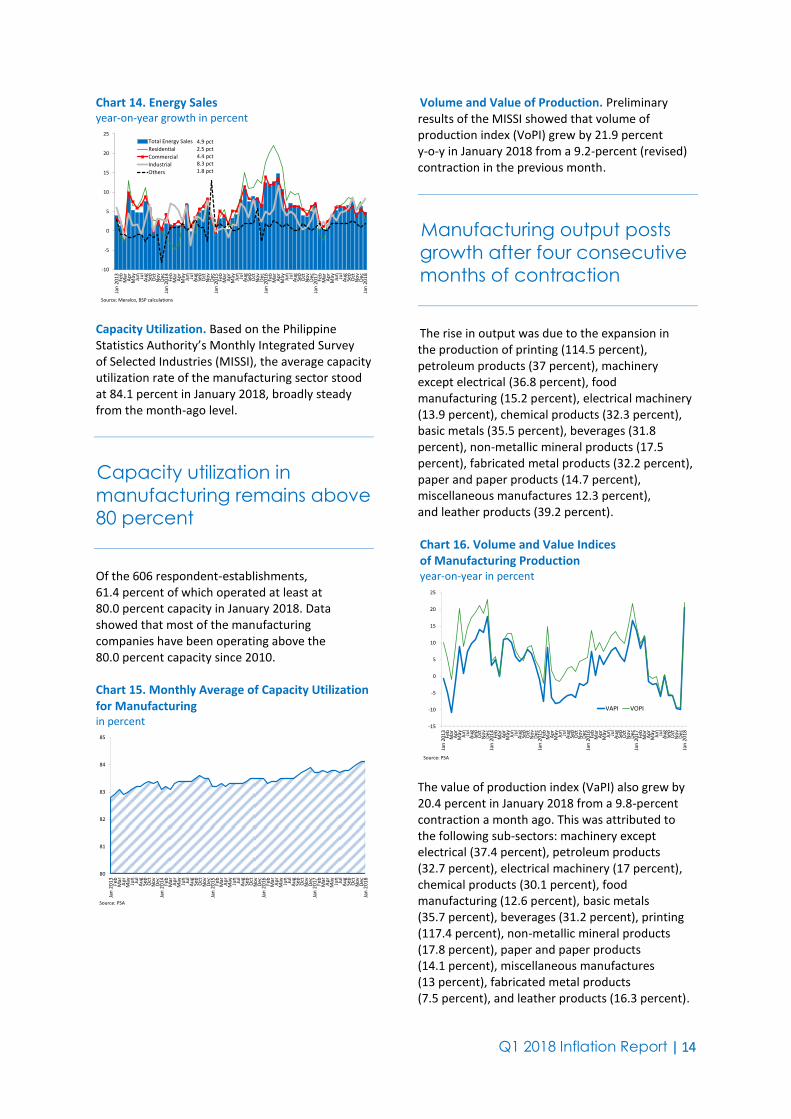
Commercial vehicle sales, which account for about 68.9 percent of total vehicle sales, increased by 6.6 percent y-o-y in the first two months of Q1 2018 relative to 22.5-percent growth in the same period of 2017. Commercial vehicles sold during the quarter reached 57,821 units from 57,465 units in January-February 2017. Energy Sales. Meralco’s energy sales in January 2018 grew by 4.9 percent, slower than the 6.8-percent growth reported in the same period a year ago. Energy sales from the residential sector, commercial sector, and industrial sector increased by 2.5 percent, 4.4 percent, and 8.3 percent, respectively.
Energy sales increase
Q1 2018 Inflation Report | 14
Chart 14. Energy Sales year-on-year growth in percent
-10
-5
0
5
10
15
20
25
Jan
20
13
Feb
Mar
Ap
rM
ay Jun
Jul
Au
gSe
pO
ctN
ov
Dec
Jan
20
14
Feb
Mar
Ap
rM
ay Jun
Jul
Au
gSe
pO
ctN
ov
Dec
Jan
20
15
Feb
Mar
Ap
rM
ay Jun
Jul
Au
gSe
pO
ctN
ov
Dec
Jan
20
16
Feb
Mar
Ap
rM
ay Jun
Jul
Au
gSe
pO
ctN
ov
Dec
Jan
20
17
Feb
Mar
Ap
rM
ay Jun
Jul
Au
gSe
pO
ctN
ov
Dec
Jan
20
18
Total Energy Sales
Residential
Commercial
Industrial
Others
Source: Meralco, BSP calculations
4.9 pct 2.5 pct 4.4 pct 8.3 pct1.8 pct
Capacity Utilization. Based on the Philippine Statistics Authority’s Monthly Integrated Survey of Selected Industries (MISSI), the average capacity utilization rate of the manufacturing sector stood at 84.1 percent in January 2018, broadly steady from the month-ago level.
Capacity utilization in
manufacturing remains above
80 percent
Of the 606 respondent-establishments, 61.4 percent of which operated at least at 80.0 percent capacity in January 2018. Data showed that most of the manufacturing companies have been operating above the 80.0 percent capacity since 2010. Chart 15. Monthly Average of Capacity Utilization for Manufacturing in percent
80
81
82
83
84
85
Jan
20
13
Feb
Mar
Ap
rM
ay Jun
Jul
Au
gSe
pO
ctN
ov
Dec
Jan
20
14
Feb
Mar
Ap
rM
ay Jun
Jul
Au
gSe
pO
ctN
ov
Dec
Jan
20
15
Feb
Mar
Ap
rM
ay Jun
Jul
Au
gSe
pO
ctN
ov
Dec
Jan
20
16
Feb
Mar
Ap
rM
ay Jun
Jul
Au
gSe
pO
ctN
ov
Dec
Jan
20
17
Feb
Mar
Ap
rM
ay Jun
Jul
Au
gSe
pO
ctN
ov
Dec
Jan
20
18
Source: PSA
Volume and Value of Production. Preliminary results of the MISSI showed that volume of production index (VoPI) grew by 21.9 percent y-o-y in January 2018 from a 9.2-percent (revised) contraction in the previous month.
Manufacturing output posts
growth after four consecutive
months of contraction
The rise in output was due to the expansion in the production of printing (114.5 percent), petroleum products (37 percent), machinery except electrical (36.8 percent), food manufacturing (15.2 percent), electrical machinery (13.9 percent), chemical products (32.3 percent), basic metals (35.5 percent), beverages (31.8 percent), non-metallic mineral products (17.5 percent), fabricated metal products (32.2 percent), paper and paper products (14.7 percent), miscellaneous manufactures 12.3 percent), and leather products (39.2 percent). Chart 16. Volume and Value Indices of Manufacturing Production year-on-year in percent
-15
-10
-5
0
5
10
15
20
25
Jan
20
13
Feb
Mar
Ap
rM
ay Jun
Jul
Au
gSe
pO
ctN
ov
Dec
Jan
20
14
Feb
Mar
Ap
rM
ay Jun
Jul
Au
gSe
pO
ctN
ov
Dec
Jan
20
15
Feb
Mar
Ap
rM
ay Jun
Jul
Au
gSe
pO
ctN
ov
Dec
Jan
20
16
Feb
Mar
Ap
rM
ay Jun
Jul
Au
gSe
pO
ctN
ov
Dec
Jan
20
17
Feb
Mar
Ap
rM
ay Jun
Jul
Au
gSe
pO
ctN
ov
Dec
Jan
20
18
VAPI VOPI
Source: PSA The value of production index (VaPI) also grew by 20.4 percent in January 2018 from a 9.8-percent contraction a month ago. This was attributed to the following sub-sectors: machinery except electrical (37.4 percent), petroleum products (32.7 percent), electrical machinery (17 percent), chemical products (30.1 percent), food manufacturing (12.6 percent), basic metals (35.7 percent), beverages (31.2 percent), printing (117.4 percent), non-metallic mineral products (17.8 percent), paper and paper products (14.1 percent), miscellaneous manufactures (13 percent), fabricated metal products (7.5 percent), and leather products (16.3 percent).
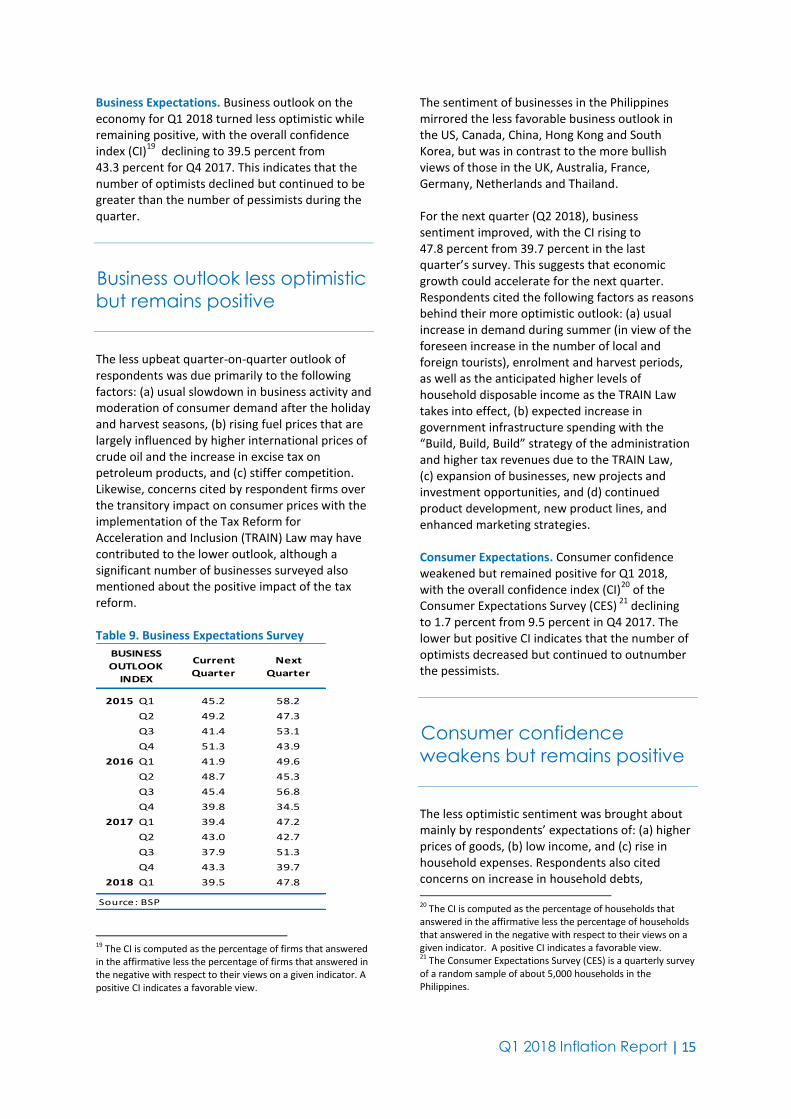
Q1 2018 Inflation Report | 15
Business Expectations. Business outlook on the economy for Q1 2018 turned less optimistic while remaining positive, with the overall confidence index (CI)
19 declining to 39.5 percent from
43.3 percent for Q4 2017. This indicates that the number of optimists declined but continued to be greater than the number of pessimists during the quarter.
Business outlook less optimistic
but remains positive
The less upbeat quarter-on-quarter outlook of respondents was due primarily to the following factors: (a) usual slowdown in business activity and moderation of consumer demand after the holiday and harvest seasons, (b) rising fuel prices that are largely influenced by higher international prices of crude oil and the increase in excise tax on petroleum products, and (c) stiffer competition. Likewise, concerns cited by respondent firms over the transitory impact on consumer prices with the implementation of the Tax Reform for Acceleration and Inclusion (TRAIN) Law may have contributed to the lower outlook, although a significant number of businesses surveyed also mentioned about the positive impact of the tax reform. Table 9. Business Expectations Survey
Current
Quarter
Next
Quarter
2015 Q1 45.2 58.2
Q2 49.2 47.3
Q3 41.4 53.1
Q4 51.3 43.9
2016 Q1 41.9 49.6
Q2 48.7 45.3
Q3 45.4 56.8
Q4 39.8 34.5
2017 Q1 39.4 47.2
Q2 43.0 42.7
Q3 37.9 51.3
Q4 43.3 39.7
2018 Q1 39.5 47.8
Source: BSP
BUSINESS
OUTLOOK
INDEX
19 The CI is computed as the percentage of firms that answered in the affirmative less the percentage of firms that answered in the negative with respect to their views on a given indicator. A positive CI indicates a favorable view.
The sentiment of businesses in the Philippines mirrored the less favorable business outlook in the US, Canada, China, Hong Kong and South Korea, but was in contrast to the more bullish views of those in the UK, Australia, France, Germany, Netherlands and Thailand. For the next quarter (Q2 2018), business sentiment improved, with the CI rising to 47.8 percent from 39.7 percent in the last quarter’s survey. This suggests that economic growth could accelerate for the next quarter. Respondents cited the following factors as reasons behind their more optimistic outlook: (a) usual increase in demand during summer (in view of the foreseen increase in the number of local and foreign tourists), enrolment and harvest periods, as well as the anticipated higher levels of household disposable income as the TRAIN Law takes into effect, (b) expected increase in government infrastructure spending with the “Build, Build, Build” strategy of the administration and higher tax revenues due to the TRAIN Law, (c) expansion of businesses, new projects and investment opportunities, and (d) continued product development, new product lines, and enhanced marketing strategies. Consumer Expectations. Consumer confidence weakened but remained positive for Q1 2018, with the overall confidence index (CI)
20 of the
Consumer Expectations Survey (CES) 21
declining to 1.7 percent from 9.5 percent in Q4 2017. The lower but positive CI indicates that the number of optimists decreased but continued to outnumber the pessimists.
Consumer confidence
weakens but remains positive
The less optimistic sentiment was brought about mainly by respondents’ expectations of: (a) higher prices of goods, (b) low income, and (c) rise in household expenses. Respondents also cited concerns on increase in household debts, 20 The CI is computed as the percentage of households that answered in the affirmative less the percentage of households that answered in the negative with respect to their views on a given indicator. A positive CI indicates a favorable view. 21 The Consumer Expectations Survey (CES) is a quarterly survey of a random sample of about 5,000 households in the Philippines.
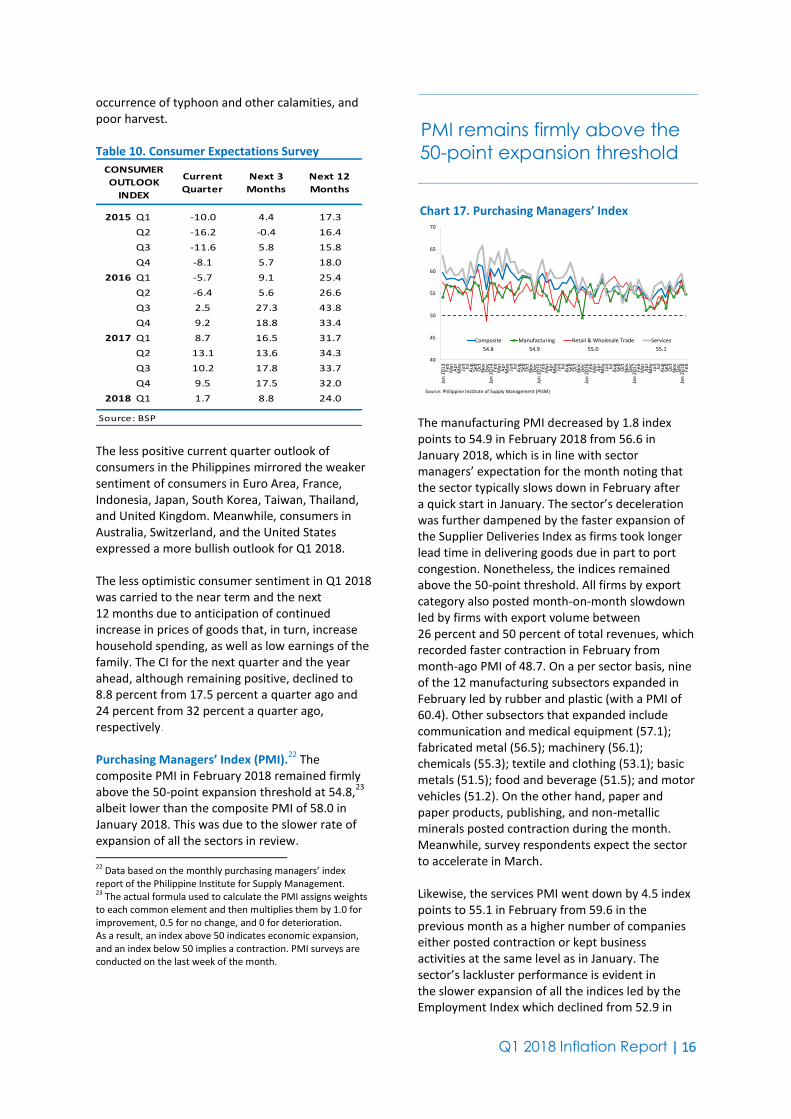
Q1 2018 Inflation Report | 16
occurrence of typhoon and other calamities, and poor harvest. Table 10. Consumer Expectations Survey
Current
Quarter
Next 3
Months
Next 12
Months
2015 Q1 -10.0 4.4 17.3
Q2 -16.2 -0.4 16.4
Q3 -11.6 5.8 15.8
Q4 -8.1 5.7 18.0
2016 Q1 -5.7 9.1 25.4
Q2 -6.4 5.6 26.6
Q3 2.5 27.3 43.8
Q4 9.2 18.8 33.4
2017 Q1 8.7 16.5 31.7
Q2 13.1 13.6 34.3
Q3 10.2 17.8 33.7
Q4 9.5 17.5 32.0
2018 Q1 1.7 8.8 24.0
CONSUMER
OUTLOOK
INDEX
Source: BSP The less positive current quarter outlook of consumers in the Philippines mirrored the weaker sentiment of consumers in Euro Area, France, Indonesia, Japan, South Korea, Taiwan, Thailand, and United Kingdom. Meanwhile, consumers in Australia, Switzerland, and the United States expressed a more bullish outlook for Q1 2018. The less optimistic consumer sentiment in Q1 2018 was carried to the near term and the next 12 months due to anticipation of continued increase in prices of goods that, in turn, increase household spending, as well as low earnings of the family. The CI for the next quarter and the year ahead, although remaining positive, declined to 8.8 percent from 17.5 percent a quarter ago and 24 percent from 32 percent a quarter ago, respectively. Purchasing Managers’ Index (PMI).
22 The
composite PMI in February 2018 remained firmly above the 50-point expansion threshold at 54.8,
23
albeit lower than the composite PMI of 58.0 in January 2018. This was due to the slower rate of expansion of all the sectors in review. 22 Data based on the monthly purchasing managers’ index report of the Philippine Institute for Supply Management. 23 The actual formula used to calculate the PMI assigns weights to each common element and then multiplies them by 1.0 for improvement, 0.5 for no change, and 0 for deterioration. As a result, an index above 50 indicates economic expansion, and an index below 50 implies a contraction. PMI surveys are conducted on the last week of the month.
PMI remains firmly above the
50-point expansion threshold
Chart 17. Purchasing Managers’ Index
40
45
50
55
60
65
70
Jan
20
13
Feb
Mar
Ap
rM
ay Jun
Jul
Au
gSe
pO
ctN
ov
Dec
Jan
20
14
Feb
Mar
Ap
rM
ay Jun
Jul
Au
gSe
pO
ctN
ov
Dec
Jan
20
15
Feb
Mar
Ap
rM
ay Jun
Jul
Au
gSe
pO
ctN
ov
Dec
Jan
20
16
Feb
Mar
Ap
rM
ay Jun
Jul
Au
gSe
pO
ctN
ov
Dec
Jan
20
17
Feb
Mar
Ap
rM
ay Jun
Jul
Au
gSe
pO
ctN
ov
Dec
Jan
20
18
Feb
Composite Manufacturing Retail & Wholesale Trade Services
54.8 54.9 55.0 55.1
Source: Philippine Institute of Supply Management (PISM) The manufacturing PMI decreased by 1.8 index points to 54.9 in February 2018 from 56.6 in January 2018, which is in line with sector managers’ expectation for the month noting that the sector typically slows down in February after a quick start in January. The sector’s deceleration was further dampened by the faster expansion of the Supplier Deliveries Index as firms took longer lead time in delivering goods due in part to port congestion. Nonetheless, the indices remained above the 50-point threshold. All firms by export category also posted month-on-month slowdown led by firms with export volume between 26 percent and 50 percent of total revenues, which recorded faster contraction in February from month-ago PMI of 48.7. On a per sector basis, nine of the 12 manufacturing subsectors expanded in February led by rubber and plastic (with a PMI of 60.4). Other subsectors that expanded include communication and medical equipment (57.1); fabricated metal (56.5); machinery (56.1); chemicals (55.3); textile and clothing (53.1); basic metals (51.5); food and beverage (51.5); and motor vehicles (51.2). On the other hand, paper and paper products, publishing, and non-metallic minerals posted contraction during the month. Meanwhile, survey respondents expect the sector to accelerate in March. Likewise, the services PMI went down by 4.5 index points to 55.1 in February from 59.6 in the previous month as a higher number of companies either posted contraction or kept business activities at the same level as in January. The sector’s lackluster performance is evident in the slower expansion of all the indices led by the Employment Index which declined from 52.9 in
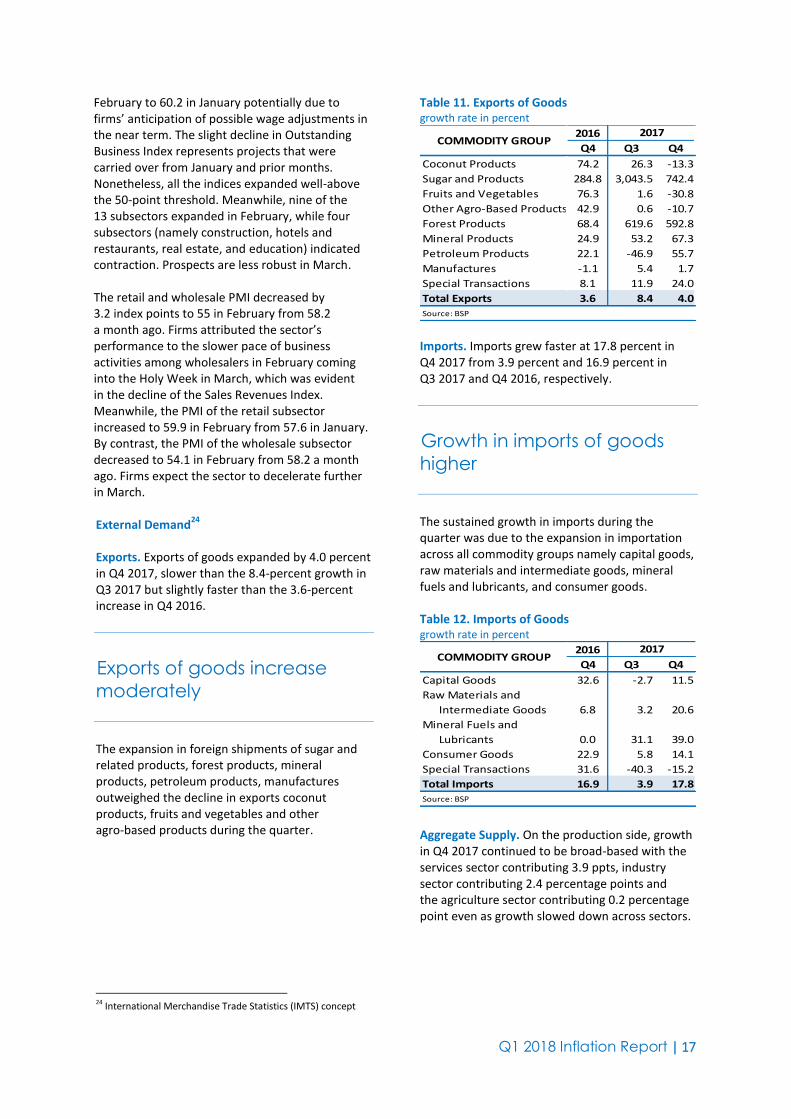
Q1 2018 Inflation Report | 17
February to 60.2 in January potentially due to firms’ anticipation of possible wage adjustments in the near term. The slight decline in Outstanding Business Index represents projects that were carried over from January and prior months. Nonetheless, all the indices expanded well-above the 50-point threshold. Meanwhile, nine of the 13 subsectors expanded in February, while four subsectors (namely construction, hotels and restaurants, real estate, and education) indicated contraction. Prospects are less robust in March. The retail and wholesale PMI decreased by 3.2 index points to 55 in February from 58.2 a month ago. Firms attributed the sector’s performance to the slower pace of business activities among wholesalers in February coming into the Holy Week in March, which was evident in the decline of the Sales Revenues Index. Meanwhile, the PMI of the retail subsector increased to 59.9 in February from 57.6 in January. By contrast, the PMI of the wholesale subsector decreased to 54.1 in February from 58.2 a month ago. Firms expect the sector to decelerate further in March. External Demand
24
Exports. Exports of goods expanded by 4.0 percent in Q4 2017, slower than the 8.4-percent growth in Q3 2017 but slightly faster than the 3.6-percent increase in Q4 2016.
Exports of goods increase
moderately
The expansion in foreign shipments of sugar and related products, forest products, mineral products, petroleum products, manufactures outweighed the decline in exports coconut products, fruits and vegetables and other agro-based products during the quarter. 24 International Merchandise Trade Statistics (IMTS) concept
Table 11. Exports of Goods growth rate in percent
2016
Q4 Q3 Q4
Coconut Products 74.2 26.3 -13.3
Sugar and Products 284.8 3,043.5 742.4
Fruits and Vegetables 76.3 1.6 -30.8
Other Agro-Based Products 42.9 0.6 -10.7
Forest Products 68.4 619.6 592.8
Mineral Products 24.9 53.2 67.3
Petroleum Products 22.1 -46.9 55.7
Manufactures -1.1 5.4 1.7
Special Transactions 8.1 11.9 24.0
Total Exports 3.6 8.4 4.0
2017COMMODITY GROUP
Source: BSP Imports. Imports grew faster at 17.8 percent in Q4 2017 from 3.9 percent and 16.9 percent in Q3 2017 and Q4 2016, respectively.
Growth in imports of goods
higher
The sustained growth in imports during the quarter was due to the expansion in importation across all commodity groups namely capital goods, raw materials and intermediate goods, mineral fuels and lubricants, and consumer goods. Table 12. Imports of Goods growth rate in percent
2016
Q4 Q3 Q4
Capital Goods 32.6 -2.7 11.5
Raw Materials and
Intermediate Goods 6.8 3.2 20.6
Lubricants 0.0 31.1 39.0
Consumer Goods 22.9 5.8 14.1
Special Transactions 31.6 -40.3 -15.2
Total Imports 16.9 3.9 17.8
Mineral Fuels and
Source: BSP
2017COMMODITY GROUP
Aggregate Supply. On the production side, growth in Q4 2017 continued to be broad-based with the services sector contributing 3.9 ppts, industry sector contributing 2.4 percentage points and the agriculture sector contributing 0.2 percentage point even as growth slowed down across sectors.
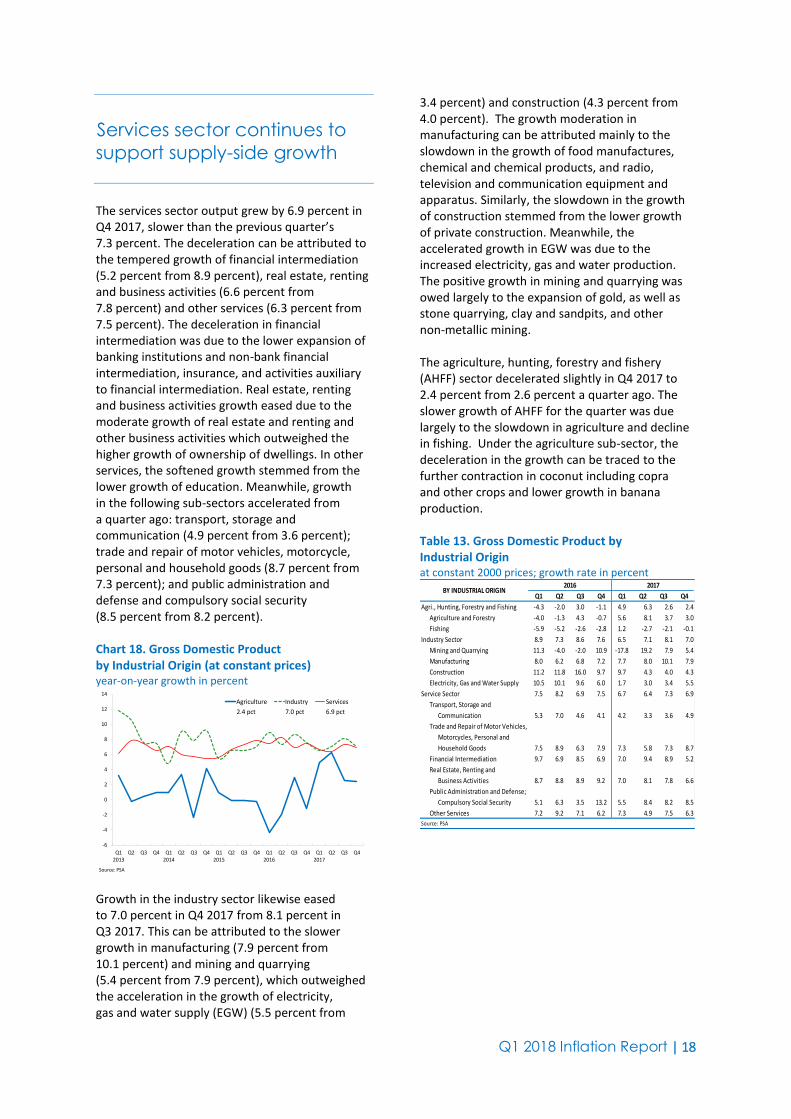
Q1 2018 Inflation Report | 18
Services sector continues to
support supply-side growth
The services sector output grew by 6.9 percent in Q4 2017, slower than the previous quarter’s 7.3 percent. The deceleration can be attributed to the tempered growth of financial intermediation (5.2 percent from 8.9 percent), real estate, renting and business activities (6.6 percent from 7.8 percent) and other services (6.3 percent from 7.5 percent). The deceleration in financial intermediation was due to the lower expansion of banking institutions and non-bank financial intermediation, insurance, and activities auxiliary to financial intermediation. Real estate, renting and business activities growth eased due to the moderate growth of real estate and renting and other business activities which outweighed the higher growth of ownership of dwellings. In other services, the softened growth stemmed from the lower growth of education. Meanwhile, growth in the following sub-sectors accelerated from a quarter ago: transport, storage and communication (4.9 percent from 3.6 percent); trade and repair of motor vehicles, motorcycle, personal and household goods (8.7 percent from 7.3 percent); and public administration and defense and compulsory social security (8.5 percent from 8.2 percent). Chart 18. Gross Domestic Product by Industrial Origin (at constant prices) year-on-year growth in percent
-6
-4
-2
0
2
4
6
8
10
12
14
Q12013
Q2 Q3 Q4 Q12014
Q2 Q3 Q4 Q12015
Q2 Q3 Q4 Q12016
Q2 Q3 Q4 Q12017
Q2 Q3 Q4
Agriculture Industry Services
Source: PSA
2.4 pct 7.0 pct 6.9 pct
Growth in the industry sector likewise eased to 7.0 percent in Q4 2017 from 8.1 percent in Q3 2017. This can be attributed to the slower growth in manufacturing (7.9 percent from 10.1 percent) and mining and quarrying (5.4 percent from 7.9 percent), which outweighed the acceleration in the growth of electricity, gas and water supply (EGW) (5.5 percent from
3.4 percent) and construction (4.3 percent from 4.0 percent). The growth moderation in manufacturing can be attributed mainly to the slowdown in the growth of food manufactures, chemical and chemical products, and radio, television and communication equipment and apparatus. Similarly, the slowdown in the growth of construction stemmed from the lower growth of private construction. Meanwhile, the accelerated growth in EGW was due to the increased electricity, gas and water production. The positive growth in mining and quarrying was owed largely to the expansion of gold, as well as stone quarrying, clay and sandpits, and other non-metallic mining. The agriculture, hunting, forestry and fishery (AHFF) sector decelerated slightly in Q4 2017 to 2.4 percent from 2.6 percent a quarter ago. The slower growth of AHFF for the quarter was due largely to the slowdown in agriculture and decline in fishing. Under the agriculture sub-sector, the deceleration in the growth can be traced to the further contraction in coconut including copra and other crops and lower growth in banana production. Table 13. Gross Domestic Product by Industrial Origin at constant 2000 prices; growth rate in percent
Q1 Q2 Q3 Q4 Q1 Q2 Q3 Q4
Agri., Hunting, Forestry and Fishing -4.3 -2.0 3.0 -1.1 4.9 6.3 2.6 2.4
Agriculture and Forestry -4.0 -1.3 4.3 -0.7 5.6 8.1 3.7 3.0
Fishing -5.9 -5.2 -2.6 -2.8 1.2 -2.7 -2.1 -0.1
Industry Sector 8.9 7.3 8.6 7.6 6.5 7.1 8.1 7.0
Mining and Quarrying 11.3 -4.0 -2.0 10.9 -17.8 19.2 7.9 5.4
Manufacturing 8.0 6.2 6.8 7.2 7.7 8.0 10.1 7.9
Construction 11.2 11.8 16.0 9.7 9.7 4.3 4.0 4.3
Electricity, Gas and Water Supply 10.5 10.1 9.6 6.0 1.7 3.0 3.4 5.5
Service Sector 7.5 8.2 6.9 7.5 6.7 6.4 7.3 6.9
Transport, Storage and
Communication 5.3 7.0 4.6 4.1 4.2 3.3 3.6 4.9
Trade and Repair of Motor Vehicles,
Motorcycles, Personal and
Household Goods 7.5 8.9 6.3 7.9 7.3 5.8 7.3 8.7
Financial Intermediation 9.7 6.9 8.5 6.9 7.0 9.4 8.9 5.2
Real Estate, Renting and
Business Activities 8.7 8.8 8.9 9.2 7.0 8.1 7.8 6.6
Public Administration and Defense;
Compulsory Social Security 5.1 6.3 3.5 13.2 5.5 8.4 8.2 8.5
Other Services 7.2 9.2 7.1 6.2 7.3 4.9 7.5 6.3
Source: PSA
BY INDUSTRIAL ORIGIN2016 2017
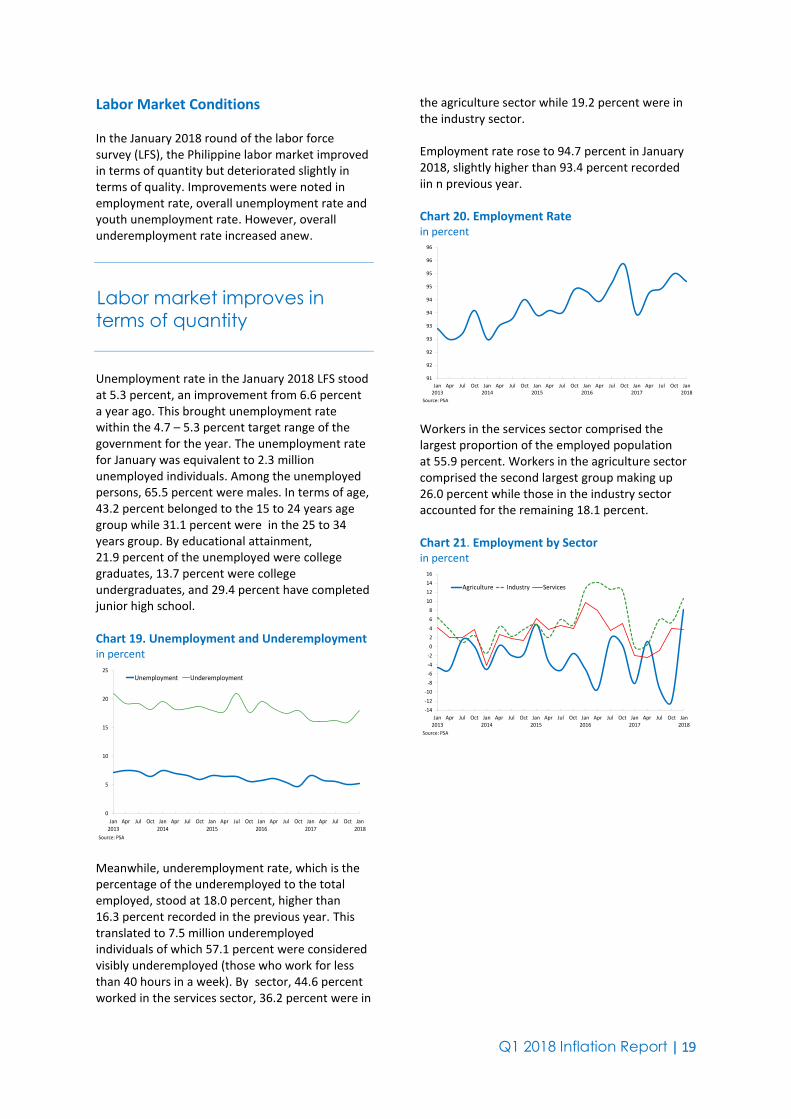
Q1 2018 Inflation Report | 19
Labor Market Conditions In the January 2018 round of the labor force survey (LFS), the Philippine labor market improved in terms of quantity but deteriorated slightly in terms of quality. Improvements were noted in employment rate, overall unemployment rate and youth unemployment rate. However, overall underemployment rate increased anew.
Labor market improves in
terms of quantity
Unemployment rate in the January 2018 LFS stood at 5.3 percent, an improvement from 6.6 percent a year ago. This brought unemployment rate within the 4.7 – 5.3 percent target range of the government for the year. The unemployment rate for January was equivalent to 2.3 million unemployed individuals. Among the unemployed persons, 65.5 percent were males. In terms of age, 43.2 percent belonged to the 15 to 24 years age group while 31.1 percent were in the 25 to 34 years group. By educational attainment, 21.9 percent of the unemployed were college graduates, 13.7 percent were college undergraduates, and 29.4 percent have completed junior high school. Chart 19. Unemployment and Underemployment in percent
0
5
10
15
20
25
Jan2013
Apr Jul Oct Jan2014
Apr Jul Oct Jan2015
Apr Jul Oct Jan2016
Apr Jul Oct Jan2017
Apr Jul Oct Jan2018
Unemployment Underemployment
Source: PSA Meanwhile, underemployment rate, which is the percentage of the underemployed to the total employed, stood at 18.0 percent, higher than 16.3 percent recorded in the previous year. This translated to 7.5 million underemployed individuals of which 57.1 percent were considered visibly underemployed (those who work for less than 40 hours in a week). By sector, 44.6 percent worked in the services sector, 36.2 percent were in
the agriculture sector while 19.2 percent were in the industry sector. Employment rate rose to 94.7 percent in January 2018, slightly higher than 93.4 percent recorded iin n previous year. Chart 20. Employment Rate in percent
91
92
92
93
93
94
94
95
95
96
96
Jan2013
Apr Jul Oct Jan2014
Apr Jul Oct Jan2015
Apr Jul Oct Jan2016
Apr Jul Oct Jan2017
Apr Jul Oct Jan2018
Source: PSA
Workers in the services sector comprised the largest proportion of the employed population at 55.9 percent. Workers in the agriculture sector comprised the second largest group making up 26.0 percent while those in the industry sector accounted for the remaining 18.1 percent. Chart 21. Employment by Sector in percent
-14
-12
-10
-8
-6
-4
-2
0
2
4
6
8
10
12
14
16
Jan2013
Apr Jul Oct Jan2014
Apr Jul Oct Jan2015
Apr Jul Oct Jan2016
Apr Jul Oct Jan2017
Apr Jul Oct Jan2018
Agriculture Industry Services
Source: PSA
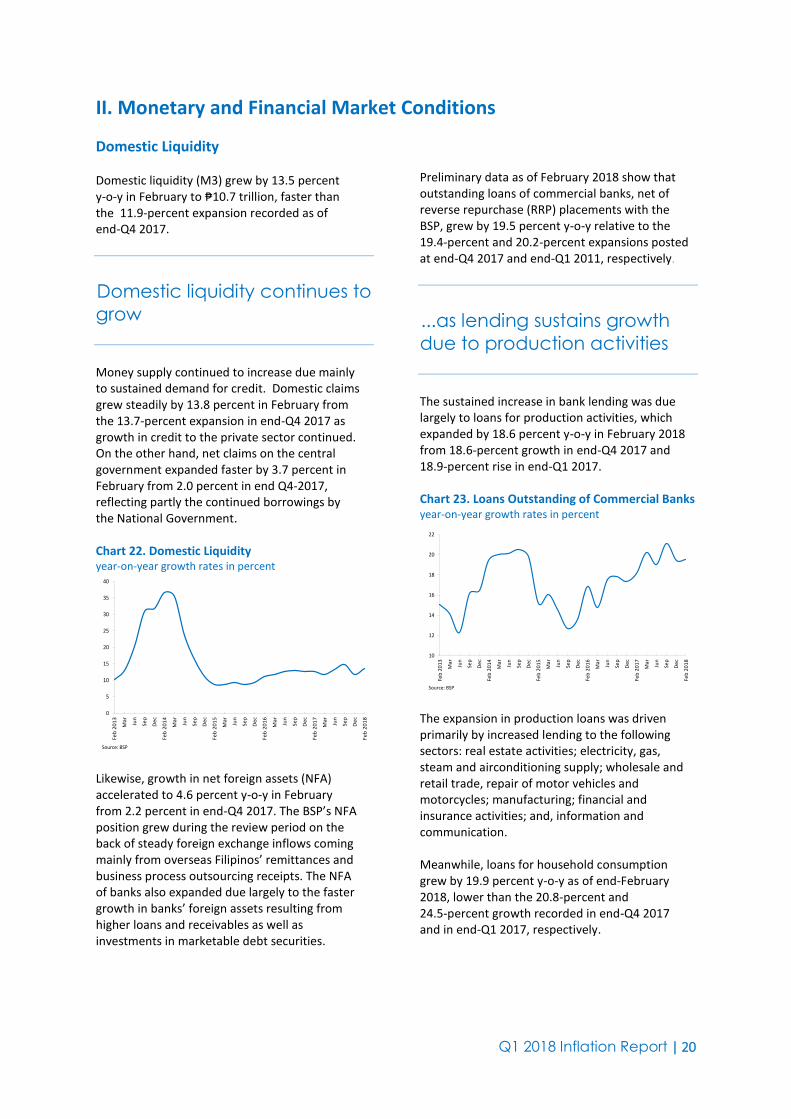
Q1 2018 Inflation Report | 20
II. Monetary and Financial Market Conditions
Domestic Liquidity Domestic liquidity (M3) grew by 13.5 percent y-o-y in February to ₱10.7 trillion, faster than the 11.9-percent expansion recorded as of end-Q4 2017.
Domestic liquidity continues to
grow
Money supply continued to increase due mainly to sustained demand for credit. Domestic claims grew steadily by 13.8 percent in February from the 13.7-percent expansion in end-Q4 2017 as growth in credit to the private sector continued. On the other hand, net claims on the central government expanded faster by 3.7 percent in February from 2.0 percent in end Q4-2017, reflecting partly the continued borrowings by the National Government. Chart 22. Domestic Liquidity year-on-year growth rates in percent
0
5
10
15
20
25
30
35
40
Feb
20
13
Ma
r
Jun
Sep
De
c
Feb
20
14
Ma
r
Jun
Sep
De
c
Feb
20
15
Ma
r
Jun
Sep
De
c
Feb
20
16
Ma
r
Jun
Sep
De
c
Feb
20
17
Ma
r
Jun
Sep
De
c
Feb
20
18
Source: BSP Likewise, growth in net foreign assets (NFA) accelerated to 4.6 percent y-o-y in February from 2.2 percent in end-Q4 2017. The BSP’s NFA position grew during the review period on the back of steady foreign exchange inflows coming mainly from overseas Filipinos’ remittances and business process outsourcing receipts. The NFA of banks also expanded due largely to the faster growth in banks’ foreign assets resulting from higher loans and receivables as well as investments in marketable debt securities.
Preliminary data as of February 2018 show that outstanding loans of commercial banks, net of reverse repurchase (RRP) placements with the BSP, grew by 19.5 percent y-o-y relative to the 19.4-percent and 20.2-percent expansions posted at end-Q4 2017 and end-Q1 2011, respectively.
...as lending sustains growth
due to production activities
The sustained increase in bank lending was due largely to loans for production activities, which expanded by 18.6 percent y-o-y in February 2018 from 18.6-percent growth in end-Q4 2017 and 18.9-percent rise in end-Q1 2017. Chart 23. Loans Outstanding of Commercial Banks year-on-year growth rates in percent
10
12
14
16
18
20
22
Feb
20
13
Mar
Jun
Sep
De
c
Feb
20
14
Mar
Jun
Sep
De
c
Feb
20
15
Mar
Jun
Sep
De
c
Feb
20
16
Mar
Jun
Sep
De
c
Feb
20
17
Mar
Jun
Sep
De
c
Feb
20
18
Source: BSP The expansion in production loans was driven primarily by increased lending to the following sectors: real estate activities; electricity, gas, steam and airconditioning supply; wholesale and retail trade, repair of motor vehicles and motorcycles; manufacturing; financial and insurance activities; and, information and communication. Meanwhile, loans for household consumption grew by 19.9 percent y-o-y as of end-February 2018, lower than the 20.8-percent and 24.5-percent growth recorded in end-Q4 2017 and in end-Q1 2017, respectively.
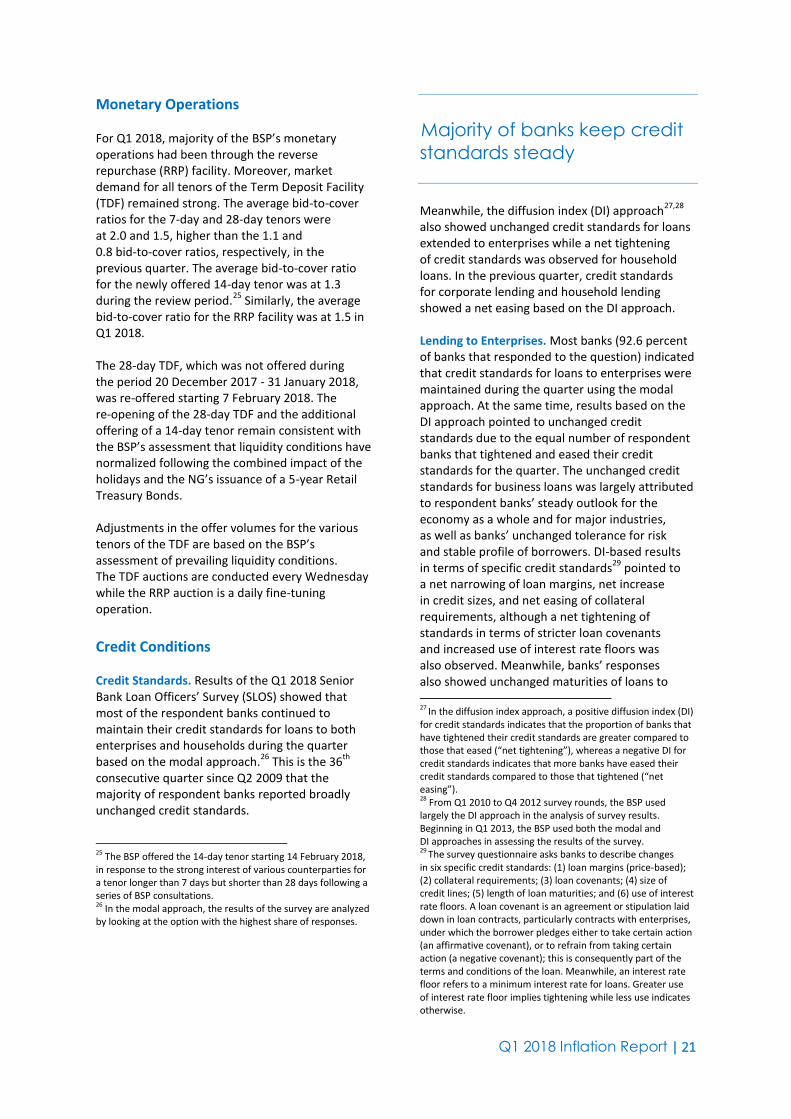
Q1 2018 Inflation Report | 21
Monetary Operations For Q1 2018, majority of the BSP’s monetary operations had been through the reverse repurchase (RRP) facility. Moreover, market demand for all tenors of the Term Deposit Facility (TDF) remained strong. The average bid-to-cover ratios for the 7-day and 28-day tenors were at 2.0 and 1.5, higher than the 1.1 and 0.8 bid-to-cover ratios, respectively, in the previous quarter. The average bid-to-cover ratio for the newly offered 14-day tenor was at 1.3 during the review period.
25 Similarly, the average
bid-to-cover ratio for the RRP facility was at 1.5 in Q1 2018.
The 28-day TDF, which was not offered during the period 20 December 2017 - 31 January 2018, was re-offered starting 7 February 2018. The re-opening of the 28-day TDF and the additional offering of a 14-day tenor remain consistent with the BSP’s assessment that liquidity conditions have normalized following the combined impact of the holidays and the NG’s issuance of a 5-year Retail Treasury Bonds. Adjustments in the offer volumes for the various tenors of the TDF are based on the BSP’s assessment of prevailing liquidity conditions. The TDF auctions are conducted every Wednesday while the RRP auction is a daily fine-tuning operation.
Credit Conditions Credit Standards. Results of the Q1 2018 Senior Bank Loan Officers’ Survey (SLOS) showed that most of the respondent banks continued to maintain their credit standards for loans to both enterprises and households during the quarter based on the modal approach.
26 This is the 36
th
consecutive quarter since Q2 2009 that the majority of respondent banks reported broadly unchanged credit standards.
25 The BSP offered the 14-day tenor starting 14 February 2018, in response to the strong interest of various counterparties for a tenor longer than 7 days but shorter than 28 days following a series of BSP consultations. 26 In the modal approach, the results of the survey are analyzed by looking at the option with the highest share of responses.
Majority of banks keep credit
standards steady
Meanwhile, the diffusion index (DI) approach27,28
also showed unchanged credit standards for loans extended to enterprises while a net tightening of credit standards was observed for household loans. In the previous quarter, credit standards for corporate lending and household lending showed a net easing based on the DI approach. Lending to Enterprises. Most banks (92.6 percent of banks that responded to the question) indicated that credit standards for loans to enterprises were maintained during the quarter using the modal approach. At the same time, results based on the DI approach pointed to unchanged credit standards due to the equal number of respondent banks that tightened and eased their credit standards for the quarter. The unchanged credit standards for business loans was largely attributed to respondent banks’ steady outlook for the economy as a whole and for major industries, as well as banks’ unchanged tolerance for risk and stable profile of borrowers. DI-based results in terms of specific credit standards
29 pointed to
a net narrowing of loan margins, net increase in credit sizes, and net easing of collateral requirements, although a net tightening of standards in terms of stricter loan covenants and increased use of interest rate floors was also observed. Meanwhile, banks’ responses also showed unchanged maturities of loans to 27 In the diffusion index approach, a positive diffusion index (DI) for credit standards indicates that the proportion of banks that have tightened their credit standards are greater compared to those that eased (“net tightening”), whereas a negative DI for credit standards indicates that more banks have eased their credit standards compared to those that tightened (“net easing”). 28 From Q1 2010 to Q4 2012 survey rounds, the BSP used largely the DI approach in the analysis of survey results. Beginning in Q1 2013, the BSP used both the modal and DI approaches in assessing the results of the survey. 29 The survey questionnaire asks banks to describe changes in six specific credit standards: (1) loan margins (price-based); (2) collateral requirements; (3) loan covenants; (4) size of credit lines; (5) length of loan maturities; and (6) use of interest rate floors. A loan covenant is an agreement or stipulation laid down in loan contracts, particularly contracts with enterprises, under which the borrower pledges either to take certain action (an affirmative covenant), or to refrain from taking certain action (a negative covenant); this is consequently part of the terms and conditions of the loan. Meanwhile, an interest rate floor refers to a minimum interest rate for loans. Greater use of interest rate floor implies tightening while less use indicates otherwise.
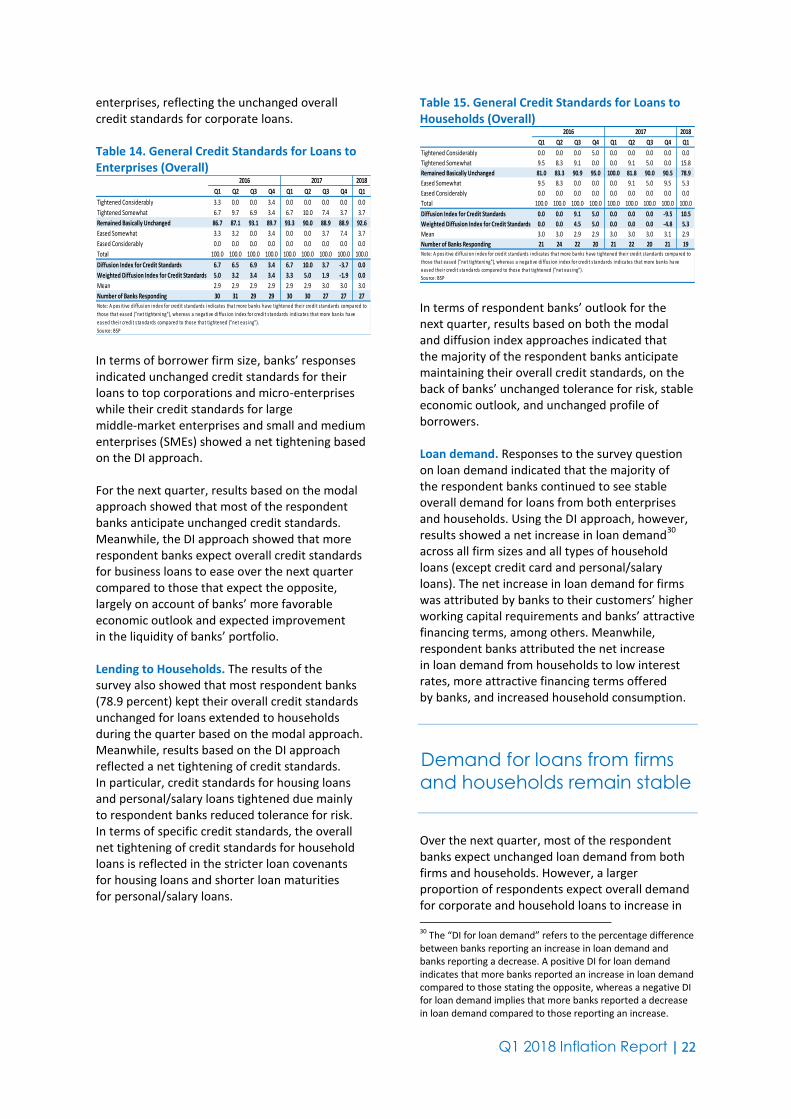
Q1 2018 Inflation Report | 22
enterprises, reflecting the unchanged overall credit standards for corporate loans. Table 14. General Credit Standards for Loans to Enterprises (Overall)
Q1 Q2 Q3 Q4 Q1 Q2 Q3 Q4 Q1
Tightened Considerably 3.3 0.0 0.0 3.4 0.0 0.0 0.0 0.0 0.0
Tightened Somewhat 6.7 9.7 6.9 3.4 6.7 10.0 7.4 3.7 3.7
Remained Basically Unchanged 86.7 87.1 93.1 89.7 93.3 90.0 88.9 88.9 92.6
Eased Somewhat 3.3 3.2 0.0 3.4 0.0 0.0 3.7 7.4 3.7
Eased Considerably 0.0 0.0 0.0 0.0 0.0 0.0 0.0 0.0 0.0
Total 100.0 100.0 100.0 100.0 100.0 100.0 100.0 100.0 100.0
Diffusion Index for Credit Standards 6.7 6.5 6.9 3.4 6.7 10.0 3.7 -3.7 0.0
Weighted Diffusion Index for Credit Standards 5.0 3.2 3.4 3.4 3.3 5.0 1.9 -1.9 0.0
Mean 2.9 2.9 2.9 2.9 2.9 2.9 3.0 3.0 3.0
Number of Banks Responding 30 31 29 29 30 30 27 27 27Note: A pos i tive di ffus ion index for credit s tandards indicates that more banks have tightened their credit s tandards compared to
those that eased ("net tightening"), whereas a negative di ffus ion index for credit s tandards indicates that more banks have
eased their credit s tandards compared to those that tightened ("net eas ing").
Source: BSP
2016 2017 2018
In terms of borrower firm size, banks’ responses indicated unchanged credit standards for their loans to top corporations and micro-enterprises while their credit standards for large middle-market enterprises and small and medium enterprises (SMEs) showed a net tightening based on the DI approach. For the next quarter, results based on the modal approach showed that most of the respondent banks anticipate unchanged credit standards. Meanwhile, the DI approach showed that more respondent banks expect overall credit standards for business loans to ease over the next quarter compared to those that expect the opposite, largely on account of banks’ more favorable economic outlook and expected improvement in the liquidity of banks’ portfolio. Lending to Households. The results of the survey also showed that most respondent banks (78.9 percent) kept their overall credit standards unchanged for loans extended to households during the quarter based on the modal approach. Meanwhile, results based on the DI approach reflected a net tightening of credit standards. In particular, credit standards for housing loans and personal/salary loans tightened due mainly to respondent banks reduced tolerance for risk. In terms of specific credit standards, the overall net tightening of credit standards for household loans is reflected in the stricter loan covenants for housing loans and shorter loan maturities for personal/salary loans.
Table 15. General Credit Standards for Loans to Households (Overall)
Q1 Q2 Q3 Q4 Q1 Q2 Q3 Q4 Q1
Tightened Considerably 0.0 0.0 0.0 5.0 0.0 0.0 0.0 0.0 0.0
Tightened Somewhat 9.5 8.3 9.1 0.0 0.0 9.1 5.0 0.0 15.8
Remained Basically Unchanged 81.0 83.3 90.9 95.0 100.0 81.8 90.0 90.5 78.9
Eased Somewhat 9.5 8.3 0.0 0.0 0.0 9.1 5.0 9.5 5.3
Eased Considerably 0.0 0.0 0.0 0.0 0.0 0.0 0.0 0.0 0.0
Total 100.0 100.0 100.0 100.0 100.0 100.0 100.0 100.0 100.0
Diffusion Index for Credit Standards 0.0 0.0 9.1 5.0 0.0 0.0 0.0 -9.5 10.5
Weighted Diffusion Index for Credit Standards 0.0 0.0 4.5 5.0 0.0 0.0 0.0 -4.8 5.3
Mean 3.0 3.0 2.9 2.9 3.0 3.0 3.0 3.1 2.9
Number of Banks Responding 21 24 22 20 21 22 20 21 19Note: A pos i tive di ffus ion index for credit s tandards indicates that more banks have tightened their credit s tandards compared to
those that eased ("net tightening"), whereas a negative di ffus ion index for credit s tandards indicates that more banks have
eased their credit s tandards compared to those that tightened ("net eas ing").
Source: BSP
2016 2017 2018
In terms of respondent banks’ outlook for the next quarter, results based on both the modal and diffusion index approaches indicated that the majority of the respondent banks anticipate maintaining their overall credit standards, on the back of banks’ unchanged tolerance for risk, stable economic outlook, and unchanged profile of borrowers. Loan demand. Responses to the survey question on loan demand indicated that the majority of the respondent banks continued to see stable overall demand for loans from both enterprises and households. Using the DI approach, however, results showed a net increase in loan demand
30
across all firm sizes and all types of household loans (except credit card and personal/salary loans). The net increase in loan demand for firms was attributed by banks to their customers’ higher working capital requirements and banks’ attractive financing terms, among others. Meanwhile, respondent banks attributed the net increase in loan demand from households to low interest rates, more attractive financing terms offered by banks, and increased household consumption.
Demand for loans from firms
and households remain stable
Over the next quarter, most of the respondent banks expect unchanged loan demand from both firms and households. However, a larger proportion of respondents expect overall demand for corporate and household loans to increase in 30 The “DI for loan demand” refers to the percentage difference between banks reporting an increase in loan demand and banks reporting a decrease. A positive DI for loan demand indicates that more banks reported an increase in loan demand compared to those stating the opposite, whereas a negative DI for loan demand implies that more banks reported a decrease in loan demand compared to those reporting an increase.

Q1 2018 Inflation Report | 23
the next quarter relative to those who indicated the opposite. Respondent banks cited expectations of higher investment in plant or equipment, increased working capital needs, and low interest rates as the key factors behind the expected increase in demand for business loans. Meanwhile, the anticipated net increase in household loan demand was attributed by respondent banks to more attractive financing terms offered to clients and low interest rates along with higher household consumption. Real Estate Loans. Most of the respondent banks (78.9 percent) indicated unchanged credit standards for commercial real estate loans in Q1 2018. The DI approach, however, continued to indicate a net tightening of overall credit standards for commercial real estate loans for the ninth consecutive quarter. The tighter overall credit standards for commercial real estate loans reflected respondent banks’ wider loan margins, reduced credit line sizes, stricter collateral requirements and loan covenants, shorter loan maturities, and increased use of interest rate floors. Over the next quarter, while majority of the respondent banks foresee maintaining their credit standards for commercial real estate loans, DI-based results point to expectations of continued net tightening of credit standards for the said type of loan.
Majority of banks maintain
credit standards for real
estate loans
Demand for commercial real estate loans was also unchanged in Q1 2018 based on the modal approach. A number of banks, however, indicated increased demand for the said type of loan on the back of increased investment in plant and equipment, banks’ more attractive financing terms and low interest rates. Over the next quarter, although most of the respondent banks anticipate generally steady loan demand, a number of banks expect demand for commercial real estate loans to continue to increase.
In the case of housing loans extended to households, most respondent banks (92.9 percent) reported unchanged credit standards based on the modal approach. Meanwhile, DI-based results pointed to a net tightening of credit standards
reflecting respondent banks’ reduced tolerance for risk. Over the next quarter, results based on both the modal and diffusion index approaches showed that banks foresee unchanged overall credit standards for housing loans on the back of their unchanged tolerance for risk, steady profile of housing loan borrowers and banks’ stable economic outlook. Most banks reported unchanged housing loan demand in Q1 2018 based on the modal approach while DI-based results pointed to a net increase in demand for housing loans during the quarter. Meanwhile, banks’ responses indicated expectations of sustained demand for housing loans over the next quarter.
Interest Rates Primary Interest Rates In Q1 2018, the average rates for the 91-day, 182-day, and 364-day T-bills in the primary market increased to 2.637 percent, 2.813 percent, and 3.088 percent from 2.034 percent, 2.497 percent, and 2.878 percent, respectively, in the previous quarter.
T-bill rates in the primary
market increase
The results of the auction reflected market players’ cautious sentiment amid uncertainty policy rate hikes by the US Fed and the BSP. Chart 24. Treasury Bill Rates in percent
0
1
2
3
4
Q1
20
13 Q1
Q2
Q3
Q1
20
14 Q4
Q1
Q2
Q1
20
15 Q3
Q4
Q1
Q1
20
16 Q2
Q3
Q4
Q1
20
17 Q2
Q3
Q4
Q1
20
18
91-day T-bill Rate
182-day T-bill Rate
364-day T-bill Rate
Source: BTr Yield Curve. As of end-March 2018, the secondary market yield for government securities (GS) for all tenors rose except for the 6-month GS tenor relative to the end-December 2017 levels,

Q1 2018 Inflation Report | 24
following the US Federal Reserve’s interest rate hike on 21 March 2018.
Yield curve rose in end- March
2018
Debt paper yields were higher by a range of 4.3 bps (1-year GS) to 145.9 bps (20-year GS) compared to end-December 2017 levels. Chart 25. Yields of Government Securities in the Secondary Market in percent
0
1
2
3
4
5
6
7
8
3Mo 6Mo 1Yr 2Yr 3yr 4Yr 5Yr 7Yr 10Yr 20Yr
Mar 2017
Dec 2017
Mar 2018
Source: Bloomberg
Relative to year-ago levels, the secondary market yields of GS for all maturities likewise increased by a range of 10.3 bps for the 3-month GS to 213.2 bps for the 20-year GS.
Interest Rate Differentials. The average differentials between domestic and US interest rates, gross and net of tax, widened in Q1 2018 relative to the previous quarter.
Interest rate differentials
widen
The average 91-day RP T-bill rate rose q-o-q by 56.7 bps to 2.652 percent in Q1 2018 from 2.085 percent in Q4 2017. Likewise, the average US 90-day LIBOR and the US 90-day T-bill rate increased by 44.3 bps and 34.0 bps, respectively, to 1.927 percent and 1.671 percent in Q1 2018. These developments led to wider positive gross and net of tax differentials between the 91-day RP T-bill rate and US interest rates. Domestic and foreign interest rates rose during the quarter following the US Fed’s quarter point policy rate hike.
Chart 26. Interest Rate Differentials quarterly averages; in basis points
-50
0
50
100
150
200
250
Q1
20
13 Q4
Q1
Q2
Q1
20
14 Q3
Q4
Q1
Q1
20
15 Q2
Q3
Q4
Q1
20
16 Q2
Q3
Q4
Q1
20
17 Q2
Q3
Q4
Q1
20
18
RP 91-day T-bill vs. US 90-day LIBOR (before tax) RP 91-day T-bill vs. US 90-day T-bill (before tax)
RP 91-day T-bill vs. US 90-day LIBOR (after tax) RP 91-day T-bill vs. US 90-day T-bill (after tax)
Source: Bloomberg, BTr and BSP The positive differential between the BSP's overnight borrowing or RRP rate and the US Fed funds target rate narrowed to a range of 125-150 bps in Q1 2018 from 150-175 bps in Q4 2017, reflecting the impact of the 25-bp increase in the US Fed funds target rate to 1.50-1.75 percent on 21 March 2018. Chart 27. BSP RRP Rate and US Federal Funds Target Rate
in percent
-1
0
1
2
3
4
5
Q1
20
13 Q4
Q1
Q2
Q1
20
14 Q3
Q4
Q1
Q1
20
15 Q2
Q3
Q4
Q1
20
16 Q2
Q3
Q4
Q1
20
17 Q2
Q3
Q4
Q1
20
18
BSP RRP Rate US Federal Funds Target Rate
Source: Bloomberg and BSP Meanwhile, the interest rate differential between the BSP’s overnight RRP rate and the US Fed funds target rate adjusted for risk
31 narrowed further
to 48 bps as of end-March 2018 from 88 bps in end-December 2017. This development could be traced to the 25-bp decline in the positive interest rate differential between the BSP’s RRP rate and the US Fed funds target rate combined with a higher risk premium following the 57-bp and 42-bp increases in the 10-year ROP note and 10-year US note to 3.55 percent and 2.78 percent, respectively. 31 The difference between the 10-year ROP note and the 10-year US Treasury note is used as proxy for the risk premium.
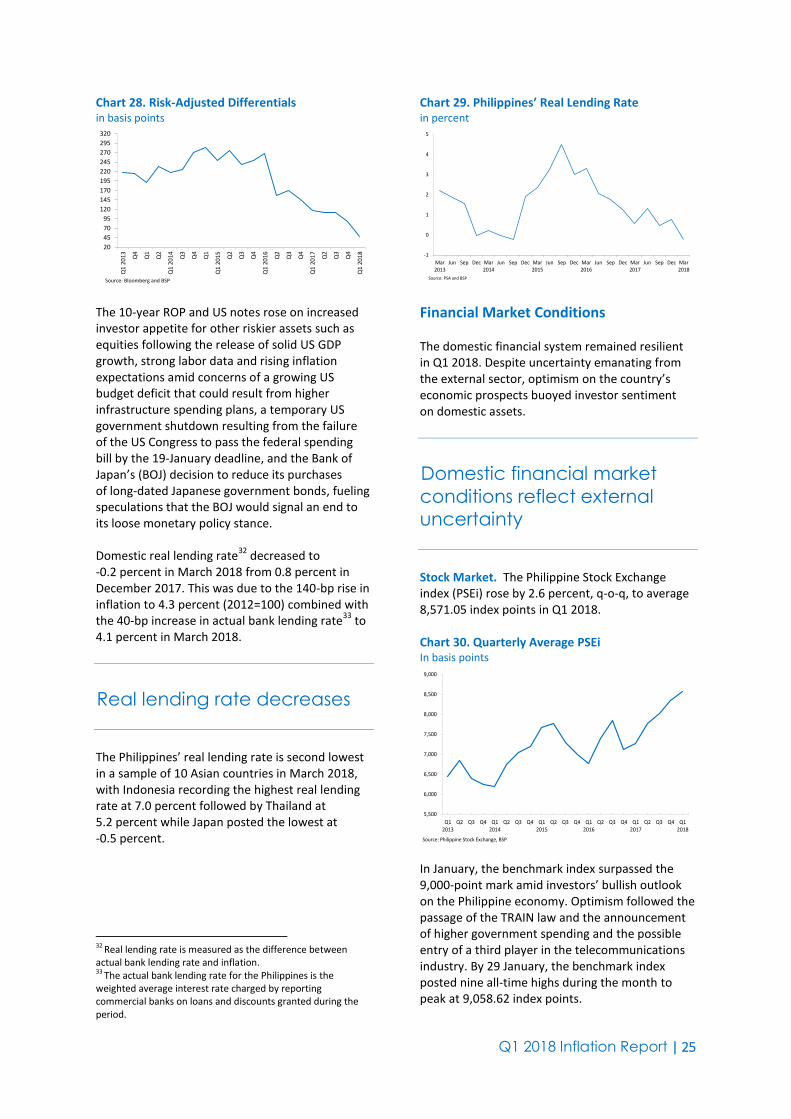
Q1 2018 Inflation Report | 25
Chart 28. Risk-Adjusted Differentials in basis points
20
45
70
95
120
145
170
195
220
245
270
295
320
Q1
20
13 Q4
Q1
Q2
Q1
20
14 Q3
Q4
Q1
Q1
20
15 Q2
Q3
Q4
Q1
20
16 Q2
Q3
Q4
Q1
20
17 Q2
Q3
Q4
Q1
20
18
Source: Bloomberg and BSP The 10-year ROP and US notes rose on increased investor appetite for other riskier assets such as equities following the release of solid US GDP growth, strong labor data and rising inflation expectations amid concerns of a growing US budget deficit that could result from higher infrastructure spending plans, a temporary US government shutdown resulting from the failure of the US Congress to pass the federal spending bill by the 19-January deadline, and the Bank of Japan’s (BOJ) decision to reduce its purchases of long-dated Japanese government bonds, fueling speculations that the BOJ would signal an end to its loose monetary policy stance. Domestic real lending rate
32 decreased to
-0.2 percent in March 2018 from 0.8 percent in December 2017. This was due to the 140-bp rise in inflation to 4.3 percent (2012=100) combined with the 40-bp increase in actual bank lending rate
33 to
4.1 percent in March 2018.
Real lending rate decreases
The Philippines’ real lending rate is second lowest in a sample of 10 Asian countries in March 2018, with Indonesia recording the highest real lending rate at 7.0 percent followed by Thailand at 5.2 percent while Japan posted the lowest at -0.5 percent. 32 Real lending rate is measured as the difference between actual bank lending rate and inflation. 33 The actual bank lending rate for the Philippines is the weighted average interest rate charged by reporting commercial banks on loans and discounts granted during the period.
Chart 29. Philippines’ Real Lending Rate in percent
-1
0
1
2
3
4
5
Mar2013
Jun Sep Dec Mar2014
Jun Sep Dec Mar2015
Jun Sep Dec Mar2016
Jun Sep Dec Mar2017
Jun Sep Dec Mar2018
Source: PSA and BSP
Financial Market Conditions The domestic financial system remained resilient in Q1 2018. Despite uncertainty emanating from the external sector, optimism on the country’s economic prospects buoyed investor sentiment on domestic assets.
Domestic financial market
conditions reflect external
uncertainty
Stock Market. The Philippine Stock Exchange index (PSEi) rose by 2.6 percent, q-o-q, to average 8,571.05 index points in Q1 2018. Chart 30. Quarterly Average PSEi In basis points
5,500
6,000
6,500
7,000
7,500
8,000
8,500
9,000
Q12013
Q2 Q3 Q4 Q12014
Q2 Q3 Q4 Q12015
Q2 Q3 Q4 Q12016
Q2 Q3 Q4 Q12017
Q2 Q3 Q4 Q12018
Source: Philippine Stock Exchange, BSP In January, the benchmark index surpassed the 9,000-point mark amid investors’ bullish outlook on the Philippine economy. Optimism followed the passage of the TRAIN law and the announcement of higher government spending and the possible entry of a third player in the telecommunications industry. By 29 January, the benchmark index posted nine all-time highs during the month to peak at 9,058.62 index points.
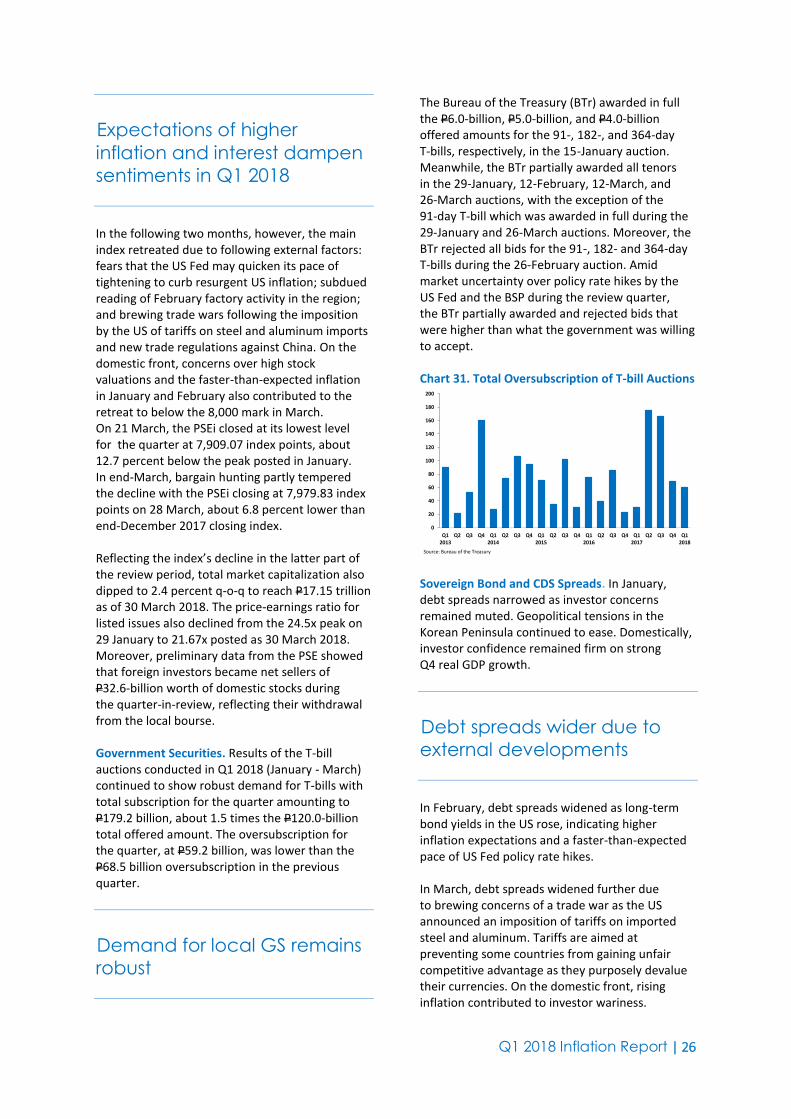
Q1 2018 Inflation Report | 26
Expectations of higher
inflation and interest dampen
sentiments in Q1 2018
In the following two months, however, the main index retreated due to following external factors: fears that the US Fed may quicken its pace of tightening to curb resurgent US inflation; subdued reading of February factory activity in the region; and brewing trade wars following the imposition by the US of tariffs on steel and aluminum imports and new trade regulations against China. On the domestic front, concerns over high stock valuations and the faster-than-expected inflation in January and February also contributed to the retreat to below the 8,000 mark in March. On 21 March, the PSEi closed at its lowest level for the quarter at 7,909.07 index points, about 12.7 percent below the peak posted in January. In end-March, bargain hunting partly tempered the decline with the PSEi closing at 7,979.83 index points on 28 March, about 6.8 percent lower than end-December 2017 closing index. Reflecting the index’s decline in the latter part of the review period, total market capitalization also dipped to 2.4 percent q-o-q to reach P17.15 trillion as of 30 March 2018. The price-earnings ratio for listed issues also declined from the 24.5x peak on 29 January to 21.67x posted as 30 March 2018. Moreover, preliminary data from the PSE showed that foreign investors became net sellers of P32.6-billion worth of domestic stocks during the quarter-in-review, reflecting their withdrawal from the local bourse. Government Securities. Results of the T-bill auctions conducted in Q1 2018 (January - March) continued to show robust demand for T-bills with total subscription for the quarter amounting to P179.2 billion, about 1.5 times the P120.0-billion total offered amount. The oversubscription for the quarter, at P59.2 billion, was lower than the P68.5 billion oversubscription in the previous quarter.
Demand for local GS remains
robust
The Bureau of the Treasury (BTr) awarded in full the P6.0-billion, P5.0-billion, and P4.0-billion offered amounts for the 91-, 182-, and 364-day T-bills, respectively, in the 15-January auction. Meanwhile, the BTr partially awarded all tenors in the 29-January, 12-February, 12-March, and 26-March auctions, with the exception of the 91-day T-bill which was awarded in full during the 29-January and 26-March auctions. Moreover, the BTr rejected all bids for the 91-, 182- and 364-day T-bills during the 26-February auction. Amid market uncertainty over policy rate hikes by the US Fed and the BSP during the review quarter, the BTr partially awarded and rejected bids that were higher than what the government was willing to accept. Chart 31. Total Oversubscription of T-bill Auctions
0
20
40
60
80
100
120
140
160
180
200
Q12013
Q2 Q3 Q4 Q12014
Q2 Q3 Q4 Q12015
Q2 Q3 Q4 Q12016
Q2 Q3 Q4 Q12017
Q2 Q3 Q4 Q12018
Source: Bureau of the Treasury Sovereign Bond and CDS Spreads. In January, debt spreads narrowed as investor concerns remained muted. Geopolitical tensions in the Korean Peninsula continued to ease. Domestically, investor confidence remained firm on strong Q4 real GDP growth.
Debt spreads wider due to
external developments
In February, debt spreads widened as long-term bond yields in the US rose, indicating higher inflation expectations and a faster-than-expected pace of US Fed policy rate hikes. In March, debt spreads widened further due to brewing concerns of a trade war as the US announced an imposition of tariffs on imported steel and aluminum. Tariffs are aimed at preventing some countries from gaining unfair competitive advantage as they purposely devalue their currencies. On the domestic front, rising inflation contributed to investor wariness.
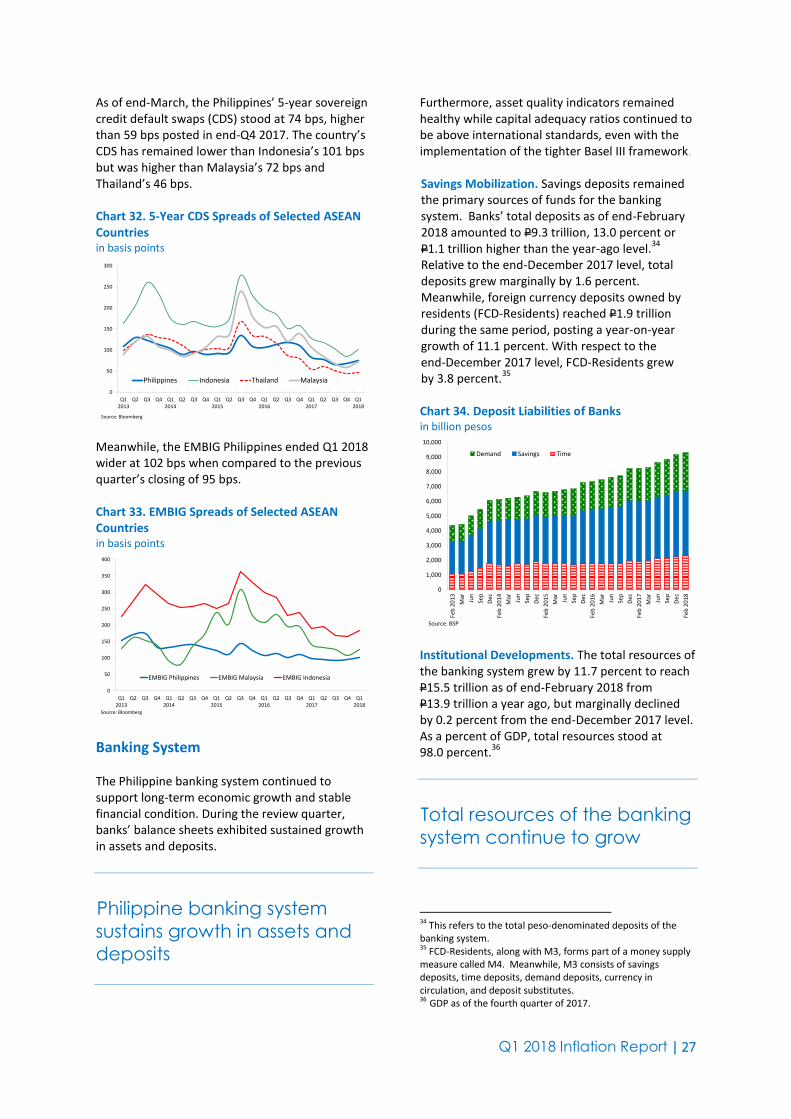
Q1 2018 Inflation Report | 27
As of end-March, the Philippines’ 5-year sovereign credit default swaps (CDS) stood at 74 bps, higher than 59 bps posted in end-Q4 2017. The country’s CDS has remained lower than Indonesia’s 101 bps but was higher than Malaysia’s 72 bps and Thailand’s 46 bps. Chart 32. 5-Year CDS Spreads of Selected ASEAN Countries in basis points
0
50
100
150
200
250
300
Q12013
Q2 Q3 Q4 Q12014
Q2 Q3 Q4 Q12015
Q2 Q3 Q4 Q12016
Q2 Q3 Q4 Q12017
Q2 Q3 Q4 Q12018
Philippines Indonesia Thailand Malaysia
Source: Bloomberg Meanwhile, the EMBIG Philippines ended Q1 2018 wider at 102 bps when compared to the previous quarter’s closing of 95 bps. Chart 33. EMBIG Spreads of Selected ASEAN Countries in basis points
0
50
100
150
200
250
300
350
400
Q12013
Q2 Q3 Q4 Q12014
Q2 Q3 Q4 Q12015
Q2 Q3 Q4 Q12016
Q2 Q3 Q4 Q12017
Q2 Q3 Q4 Q12018
EMBIG Philippines EMBIG Malaysia EMBIG Indonesia
Source: Bloomberg
Banking System The Philippine banking system continued to support long-term economic growth and stable financial condition. During the review quarter, banks’ balance sheets exhibited sustained growth in assets and deposits.
Philippine banking system
sustains growth in assets and
deposits
Furthermore, asset quality indicators remained healthy while capital adequacy ratios continued to be above international standards, even with the implementation of the tighter Basel III framework. Savings Mobilization. Savings deposits remained the primary sources of funds for the banking system. Banks’ total deposits as of end-February 2018 amounted to P9.3 trillion, 13.0 percent or P1.1 trillion higher than the year-ago level.
34
Relative to the end-December 2017 level, total deposits grew marginally by 1.6 percent. Meanwhile, foreign currency deposits owned by residents (FCD-Residents) reached P1.9 trillion during the same period, posting a year-on-year growth of 11.1 percent. With respect to the end-December 2017 level, FCD-Residents grew by 3.8 percent.
35
Chart 34. Deposit Liabilities of Banks in billion pesos
0
1,000
2,000
3,000
4,000
5,000
6,000
7,000
8,000
9,000
10,000
Feb
20
13
Mar
Jun
Sep
Dec
Feb
20
14
Mar
Jun
Sep
Dec
Feb
20
15
Mar
Jun
Sep
Dec
Feb
20
16
Mar
Jun
Sep
Dec
Feb
20
17
Mar
Jun
Sep
Dec
Feb
20
18
Demand Savings Time
Source: BSP Institutional Developments. The total resources of the banking system grew by 11.7 percent to reach P15.5 trillion as of end-February 2018 from P13.9 trillion a year ago, but marginally declined by 0.2 percent from the end-December 2017 level. As a percent of GDP, total resources stood at 98.0 percent.
36
Total resources of the banking
system continue to grow
34 This refers to the total peso-denominated deposits of the banking system. 35 FCD-Residents, along with M3, forms part of a money supply measure called M4. Meanwhile, M3 consists of savings deposits, time deposits, demand deposits, currency in circulation, and deposit substitutes. 36
GDP as of the fourth quarter of 2017.

Q1 2018 Inflation Report | 28
Chart 35. Total Resources of the Banking System levels in billion pesos; share in percent
60
70
80
90
100
110
120
5,000
6,000
7,000
8,000
9,000
10,000
11,000
12,000
13,000
14,000
15,000
16,000
17,000Fe
b 2
01
3
Mar
Jun
Sep
Dec
Feb
20
14
Mar
Jun
Sep
Dec
Feb
20
15
Mar
Jun
Sep
Dec
Feb
20
16
Mar
Jun
Sep
Dec
Feb
20
17
Mar
Jun
Sep
Dec
Feb
20
18
Total Resources (LHS) as % of GDP (RHS)
Source: BSP The number of banking institutions (head offices) decreased to 587 offices as of end-December 2017 from 602 offices a year ago and 592 offices a quarter ago. The banks’ head offices are comprised of 43 universal and commercial banks (U/KBs), 55 thrift banks (TBs), and 489 rural banks (RBs). This indicated continued consolidation of banks as well as the exit of weaker players in the banking system. Chart 36. Number of Banking Institutions
1,000
2,500
4,000
5,500
7,000
8,500
10,000
11,500
13,000
Mar
20
13
Jun
Sep
Dec
Mar
20
14
Jun
Sep
Dec
Mar
20
15
Jun
Sep
Dec
Mar
20
16
Jun
Sep
Dec
Mar
20
17
Jun
Sep
Dec
Universal and Commercial Banks Thrift Banks Rural Banks
Source: BSP Meanwhile, the operating network (head offices and branches/agencies) of the banking system expanded to 11,793 offices as of end-December 2017 from 11,178 offices a year ago and 11,571 offices a quarter ago, due mainly to the increase in the branches/agencies of U/KBs, TBs, and RBs. The Philippine banking system’s gross non-performing loan (GNPL) ratio improved to 1.9 percent as of end-February 2018 relative to the 2.0 percent registered a year ago but slightly higher with respect to the end-December 2017 ratio of 1.7 percent.
Asset quality of Philippine
banks remain strong
Banks’ initiatives to improve their asset quality along with prudent lending regulations helped maintain the GNPL ratio below its pre-Asian crisis level of 3.5 percent.
37
Chart 37. Ratios of Gross Non-Performing Loans and Net Non-Performing Loans to Total Loans in percent
0.2
0.3
0.4
0.5
0.6
0.7
0.8
0.9
1.0
1.5
1.7
1.9
2.1
2.3
2.5
2.7
2.9
3.1
3.3
3.5
3.7
3.9
4.1
Feb
20
13
Mar
Jun
Sep
De
c
Feb
20
14
Mar
Jun
Sep
De
c
Feb
20
15
Mar
Jun
Sep
De
c
Feb
20
16
Mar
Jun
Sep
De
c
Feb
20
17
Mar
Jun
Sep
De
c
Feb
20
18
Gross NPLs/Total Loans (LHS)
Net NPLs/Total Loans (RHS)
Source: BSP Meanwhile, the net non-performing loan (NNPL) ratio increased to 0.9 percent as of end-February 2018 relative to the previous year’s ratio of 0.6 percent and the end-December 2017 ratio of 0.8 percent. In computing for the NNPLs, specific allowances for credit losses on Total Loan Portfolio (TLP) are deducted from the GNPLs. Said allowances increased slightly to P87.3 billion in end-February 2018 from P85.1 billion posted as of end-December 2017.
38
The Philippine banking system’s GNPL ratio of 1.9 percent was higher with respect to that of Malaysia (1.1 percent) and South Korea (1.2 percent) but lower than that of Indonesia (2.8 percent) and Thailand (2.9 percent).
39
The loan exposures of banks remained adequately covered as the banking system registered an NPL 37 The 3.5 percent NPL ratio was based on the pre-2013 definition. 38 This type of provisioning applies to loan accounts classified under loans especially mentioned (LEM), substandard-secured loans, substandard-unsecured loans, doubtful accounts and loans considered as loss accounts. 39 Sources: Malaysia (Banking System’s Ratio of net impaired loans to net total loans, December 2017); South Korea (Domestic Banks’ Substandard or Below Loans *SBLs+ ratio, Q3 2017); Indonesia, IMF and financial stability reports (Banks’ Nonperforming Loans to Gross Loans Ratio, Q3 2017); and Thailand (Total Financial Institutions’ Gross NPLs ratio, Q4 2017).

Q1 2018 Inflation Report | 29
coverage ratio of 116.4 percent as of end-February 2018. This was higher than the previous year’s ratio of 116.0 but lower than the end-December 2017 ratio of 120.4 percent.
U/KBs’ CAR remains above
international and regulatory
standards
The capital adequacy ratio (CAR) of U/KBs at end-September 2017 decreased slightly to 15.0 percent on solo basis, relative to the previous quarter’s ratio of 15.3 percent. Likewise, the CAR, on a consolidated basis, declined marginally to 15.7 percent from the quarter-ago ratio of 16.0 percent. Nonetheless, these figures remained well above the BSP regulatory threshold of 10.0 percent and international minimum of 8.0 percent. Chart 38. Capital Adequacy Ratio of Universal and Commercial Banks in percent
12
13
14
15
16
17
18
19
20
Mar
20
13
Jun
Sep
Dec
Mar
20
14
Jun
Sep
Dec
Mar
20
15
Jun
Sep
Dec
Mar
20
16
Jun
Sep
Dec
Mar
20
17
Jun
Sep
Solo Basis Consolidated Basis
Source: BSP The CAR of Philippine U/KBs, on a consolidated basis, was slightly higher than that of South Korea (15.4 percent) but lower than that of Malaysia (17.5 percent), Thailand (18.2 percent) and Indonesia (23.0 percent).
40
Exchange Rate The peso averaged P51.43/US$1 in Q1 2018, depreciating against the US dollar by 0.97 percent 40 Sources: South Korea (Domestic Banks’ Capital Ratio, Q2 2017); Malaysia (Banking System’s Total Capital Ratio, February 2018); Thailand (Commercial Banks’ Capital Funds Percentage of Risk Assets, January 2018); and Indonesia, IMF and financial stability reports (Commercial Banks, Regulatory Capital to Risk-Weighted Assets Ratio Q4 2017).
from the previous quarter’s average of P50.93/US$1.
Peso depreciates against the
US dollar in Q1 2018
The peso’s depreciation during the review period was due mainly to market concerns over the country’s widening trade gap and growing expectations of further US Federal Reserve rate hikes during the year. On a year-on-year basis, the peso likewise depreciated by 2.78 percent relative to the P50.00/US$1 average in Q1 2017.
41
Chart 39. Quarterly Peso-Dollar Rate PHp/US$; average per quarter
39
40
41
42
43
44
45
46
47
48
49
50
51
52
53
Q12013
Q2 Q3 Q4 Q12014
Q2 Q3 Q4 Q12015
Q2 Q3 Q4 Q12016
Q2 Q3 Q4 Q12017
Q2 Q3 Q4 Q12018
Source: Reference Exchange Rate Bulletin, Treasury Department, BSP In January, the peso depreciated against the US dollar by 0.23 percent to average P50.51/US$1 from the P50.39/US$1 in December 2017. The peso’s depreciation was due mainly to: (i) slower-than-expected fourth quarter Philippine economic growth; (ii) strong US personal consumption expenditure (PCE) inflation data for Q4 2017, indicating firmer prospects of continued US Federal Reserve interest rate hikes; (iii) US President Donald Trump’s statement on a stronger dollar;
42 and (iv) market players’
cautiousness ahead of outgoing US Federal Reserve Chair Janet Yellen’s last monetary policy meeting. The peso depreciated further in February by 2.47 percent to average P51.79/US$1. The peso depreciated amid market concerns over: (i) the country’s widening trade gap;
43 and (ii) renewed
expectations of further US Fed rate hikes following 41 Dollar rates (per peso) or the reciprocal of the peso-dollar rates were used to compute for the percentage change. 42 Source: CNBC article dated 25 January 2018, “Trump says dollar will get 'stronger and stronger,’ Mnuchin was misinterpreted”. 43 Source: ABS-CBN News article dated 9 February 2018, “Peso slides as trade deficit widens to record”.
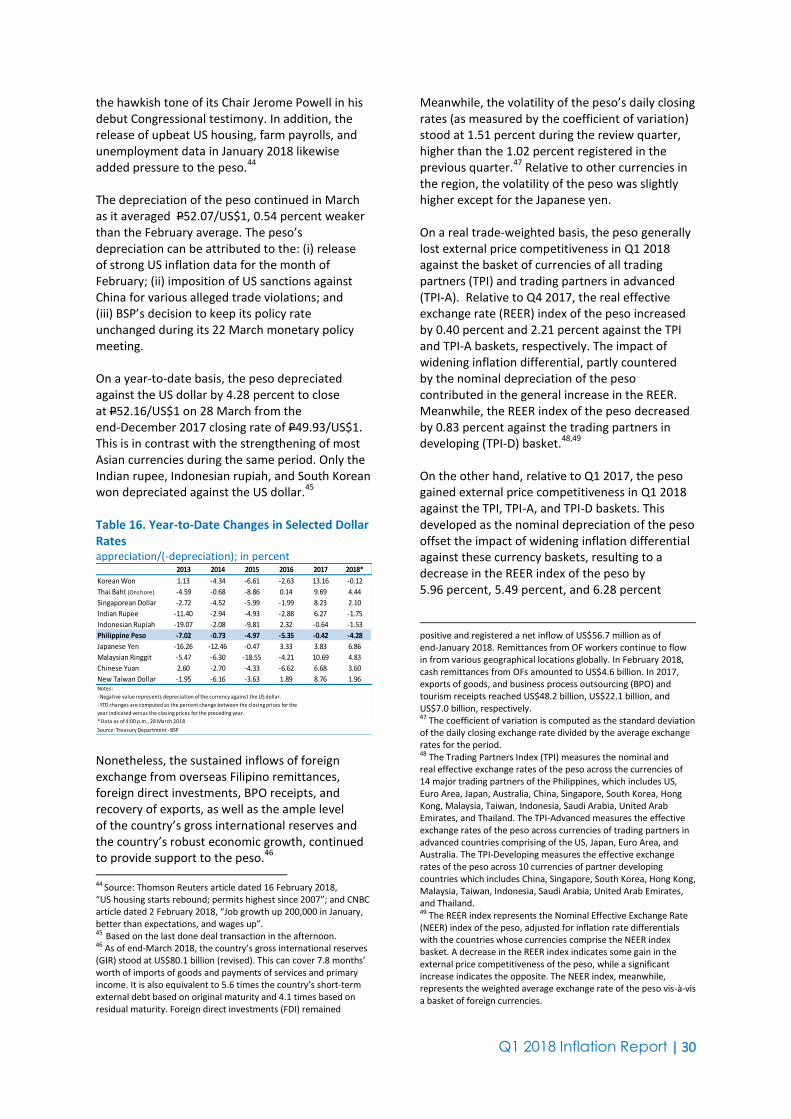
Q1 2018 Inflation Report | 30
the hawkish tone of its Chair Jerome Powell in his debut Congressional testimony. In addition, the release of upbeat US housing, farm payrolls, and unemployment data in January 2018 likewise added pressure to the peso.
44
The depreciation of the peso continued in March as it averaged P52.07/US$1, 0.54 percent weaker than the February average. The peso’s depreciation can be attributed to the: (i) release of strong US inflation data for the month of February; (ii) imposition of US sanctions against China for various alleged trade violations; and (iii) BSP’s decision to keep its policy rate unchanged during its 22 March monetary policy meeting. On a year-to-date basis, the peso depreciated against the US dollar by 4.28 percent to close at P52.16/US$1 on 28 March from the end-December 2017 closing rate of P49.93/US$1. This is in contrast with the strengthening of most Asian currencies during the same period. Only the Indian rupee, Indonesian rupiah, and South Korean won depreciated against the US dollar.
45
Table 16. Year-to-Date Changes in Selected Dollar Rates appreciation/(-depreciation); in percent
2013 2014 2015 2016 2017 2018*
Korean Won 1.13 -4.34 -6.61 -2.63 13.16 -0.12
Thai Baht (Onshore) -4.59 -0.68 -8.86 0.14 9.69 4.44
Singaporean Dollar -2.72 -4.52 -5.99 -1.99 8.23 2.10
Indian Rupee -11.40 -2.94 -4.93 -2.88 6.27 -1.75
Indonesian Rupiah -19.07 -2.08 -9.81 2.32 -0.64 -1.53
Philippine Peso -7.02 -0.73 -4.97 -5.35 -0.42 -4.28
Japanese Yen -16.26 -12.46 -0.47 3.33 3.83 6.86
Malaysian Ringgit -5.47 -6.30 -18.55 -4.21 10.69 4.83
Chinese Yuan 2.60 -2.70 -4.33 -6.62 6.68 3.60
New Taiwan Dollar -1.95 -6.16 -3.63 1.89 8.76 1.96Notes:
- Negative value represents depreciation of the currency against the US dollar.
- YTD changes are computed as the percent change between the closing prices for the
year indicated versus the closing prices for the preceding year.
* Data as of 4:00 p.m., 28 March 2018
Source: Treasury Department - BSP Nonetheless, the sustained inflows of foreign exchange from overseas Filipino remittances, foreign direct investments, BPO receipts, and recovery of exports, as well as the ample level of the country’s gross international reserves and the country’s robust economic growth, continued to provide support to the peso.
46
44 Source: Thomson Reuters article dated 16 February 2018, “US housing starts rebound; permits highest since 2007”; and CNBC article dated 2 February 2018, “Job growth up 200,000 in January, better than expectations, and wages up”. 45 Based on the last done deal transaction in the afternoon. 46 As of end-March 2018, the country’s gross international reserves (GIR) stood at US$80.1 billion (revised). This can cover 7.8 months’ worth of imports of goods and payments of services and primary income. It is also equivalent to 5.6 times the country’s short-term external debt based on original maturity and 4.1 times based on residual maturity. Foreign direct investments (FDI) remained
Meanwhile, the volatility of the peso’s daily closing rates (as measured by the coefficient of variation) stood at 1.51 percent during the review quarter, higher than the 1.02 percent registered in the previous quarter.
47 Relative to other currencies in
the region, the volatility of the peso was slightly higher except for the Japanese yen. On a real trade-weighted basis, the peso generally lost external price competitiveness in Q1 2018 against the basket of currencies of all trading partners (TPI) and trading partners in advanced (TPI-A). Relative to Q4 2017, the real effective exchange rate (REER) index of the peso increased by 0.40 percent and 2.21 percent against the TPI and TPI-A baskets, respectively. The impact of widening inflation differential, partly countered by the nominal depreciation of the peso contributed in the general increase in the REER. Meanwhile, the REER index of the peso decreased by 0.83 percent against the trading partners in developing (TPI-D) basket.
48,49
On the other hand, relative to Q1 2017, the peso gained external price competitiveness in Q1 2018 against the TPI, TPI-A, and TPI-D baskets. This developed as the nominal depreciation of the peso offset the impact of widening inflation differential against these currency baskets, resulting to a decrease in the REER index of the peso by 5.96 percent, 5.49 percent, and 6.28 percent positive and registered a net inflow of US$56.7 million as of end-January 2018. Remittances from OF workers continue to flow in from various geographical locations globally. In February 2018, cash remittances from OFs amounted to US$4.6 billion. In 2017, exports of goods, and business process outsourcing (BPO) and tourism receipts reached US$48.2 billion, US$22.1 billion, and US$7.0 billion, respectively. 47 The coefficient of variation is computed as the standard deviation of the daily closing exchange rate divided by the average exchange rates for the period. 48 The Trading Partners Index (TPI) measures the nominal and real effective exchange rates of the peso across the currencies of 14 major trading partners of the Philippines, which includes US, Euro Area, Japan, Australia, China, Singapore, South Korea, Hong Kong, Malaysia, Taiwan, Indonesia, Saudi Arabia, United Arab Emirates, and Thailand. The TPI-Advanced measures the effective exchange rates of the peso across currencies of trading partners in advanced countries comprising of the US, Japan, Euro Area, and Australia. The TPI-Developing measures the effective exchange rates of the peso across 10 currencies of partner developing countries which includes China, Singapore, South Korea, Hong Kong, Malaysia, Taiwan, Indonesia, Saudi Arabia, United Arab Emirates, and Thailand. 49 The REER index represents the Nominal Effective Exchange Rate (NEER) index of the peso, adjusted for inflation rate differentials with the countries whose currencies comprise the NEER index basket. A decrease in the REER index indicates some gain in the external price competitiveness of the peso, while a significant increase indicates the opposite. The NEER index, meanwhile, represents the weighted average exchange rate of the peso vis-à-vis a basket of foreign currencies.
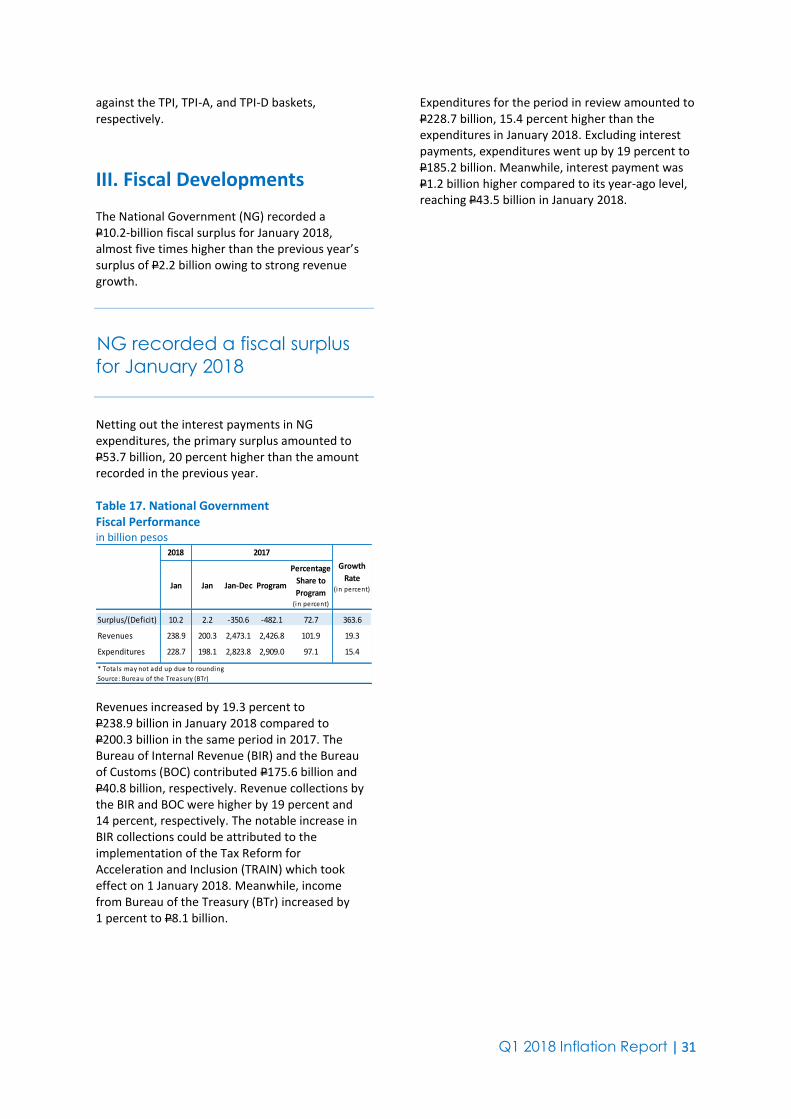
Q1 2018 Inflation Report | 31
against the TPI, TPI-A, and TPI-D baskets, respectively.
III. Fiscal Developments The National Government (NG) recorded a P10.2-billion fiscal surplus for January 2018, almost five times higher than the previous year’s surplus of P2.2 billion owing to strong revenue growth.
NG recorded a fiscal surplus
for January 2018
Netting out the interest payments in NG expenditures, the primary surplus amounted to P53.7 billion, 20 percent higher than the amount recorded in the previous year. Table 17. National Government Fiscal Performance in billion pesos
Jan Jan Jan-Dec Program
Percentage
Share to
Program (in percent)
Surplus/(Deficit) 10.2 2.2 -350.6 -482.1 72.7 363.6
Revenues 238.9 200.3 2,473.1 2,426.8 101.9 19.3
Expenditures 228.7 198.1 2,823.8 2,909.0 97.1 15.4
* Totals may not add up due to rounding
Source: Bureau of the Treasury (BTr)
2018 2017
Growth
Rate (in percent)
Revenues increased by 19.3 percent to P238.9 billion in January 2018 compared to P200.3 billion in the same period in 2017. The Bureau of Internal Revenue (BIR) and the Bureau of Customs (BOC) contributed P175.6 billion and P40.8 billion, respectively. Revenue collections by the BIR and BOC were higher by 19 percent and 14 percent, respectively. The notable increase in BIR collections could be attributed to the implementation of the Tax Reform for Acceleration and Inclusion (TRAIN) which took effect on 1 January 2018. Meanwhile, income from Bureau of the Treasury (BTr) increased by 1 percent to P8.1 billion.
Expenditures for the period in review amounted to P228.7 billion, 15.4 percent higher than the expenditures in January 2018. Excluding interest payments, expenditures went up by 19 percent to P185.2 billion. Meanwhile, interest payment was P1.2 billion higher compared to its year-ago level, reaching P43.5 billion in January 2018.

Q1 2018 Inflation Report | 32
IV. External Developments The JP Morgan Global All-Industry Output Index decreased slightly to 53.3 in March from 54.8 in February as growth of manufacturing production eased to an eight-month low and service sector business activity rose to the weakest extent in almost a year-and-a-half.
Global economic growth
stays firm in March
Positive economic activity was recorded in the US, euro area, China, and Japan. On the other hand, growth in the UK was the weakest for the past 20 months of expansion, while the pace of economic activity also moderated in Brazil and Russia.
50
Chart 40. JP Morgan Global All-Industry Output Index index points
50
51
52
53
54
55
56
Jan
20
13
Feb
Mar
Ap
rM
ay Jun
Jul
Au
gSe
pO
ctN
ov
De
cJa
n 2
01
4Fe
bM
arA
pr
May Jun
Jul
Au
gSe
pO
ctN
ov
De
cJa
n 2
01
5Fe
bM
arA
pr
May Jun
Jul
Au
gSe
pO
ctN
ov
De
cJa
n 2
01
6Fe
bM
arA
pr
May Jun
Jul
Au
gSe
pO
ctN
ov
De
cJa
n 2
01
7Fe
bM
arA
pr
May Jun
Jul
Au
gSe
pO
ctN
ov
De
cJa
n 2
01
8Fe
b
Source: Markit Economics US. Real GDP expanded by 2.6 percent on a seasonally adjusted y-o-y basis in Q4 2017, higher than the 2.3-percent growth rate in Q3 2017. However, on a q-o-q basis, real output grew by 2.9 percent, slower than the 3.2-percent expansion in the previous quarter. The q-o-q growth in real GDP reflected primarily the positive contributions from personal consumption expenditures, nonresidential fixed investment, exports, residential fixed investment, state and local government spending, and federal government spending that were partly offset by a negative contribution from private inventory investment.
51
50 JP Morgan Global Manufacturing & Services PMI, http://www.markiteconomics.com/ 51 US Bureau of Economic Analysis, “Gross Domestic Product: Fourth Quarter 2017 (Third Estimate),” news release, 28 March 2018.
Growth in the US economy
holds firm
Meanwhile, the manufacturing PMI decreased to 59.3 percent in March from 60.8 percent in February due to lower new orders and production indices.
52
The unemployment rate was 4.1 percent in March, unchanged from the rate posted in February. Total nonfarm payroll employment increased by 103,000 during the same month, with employment gains in manufacturing, health care, and mining. Meanwhile, on a y-o-y basis, inflation rose slightly to 2.2 percent in February from 2.1 percent in January due primarily to the increase in the energy price index. The Thomson-Reuters/University of Michigan Index of Consumer Sentiment increased to 101.4 in March from 99.7 in February.
53
Meanwhile, the Conference Board Consumer Confidence Index fell to 127.7 in March from 130.0 in February.
54 Consumers’ assessment of
current conditions eased in March. Consumers were moderately less optimistic about the short-term outlook while expectations for the labor market were marginally more favorable during the month. Euro Area. On a q-o-q basis, real GDP growth in the euro area decreased slightly to 0.6 percent in Q4 2017 from 0.7 percent in Q3 2017. On a y-o-y basis, real GDP expanded by 2.7 percent in Q4 2017, the same rate recorded in Q3 2017.
55
Output growth in the euro
area softens
Meanwhile, the composite PMI for the euro area fell to 55.2 in March from 57.1 in February as the https://www.bea.gov/newsreleases/national/gdp/2018/pdf/gdp4q17_3rd.pdf 52 Institute for Supply Management, https://www.instituteforsupplymanagement.org 53 University of Michigan Survey of Consumers, http://www.sca.isr.umich.edu/ 54 The Conference Board, http://www.conference–board.org/ 55 Eurostat news release 37/2018 dated 7 March 2018

Q1 2018 Inflation Report | 33
level of incoming new business expanded at a weaker pace.
56
Inflation in the euro area was slightly lower at 1.1 percent in February from 1.3 percent in January due to decreases in the price indices for food, alcohol, and tobacco as well as energy.
57
The seasonally adjusted unemployment rate was 8.6 percent in January, unchanged from the record in December.
58
The European Commission’s Economic Sentiment Indicator in the euro area decreased to 112.6 in March from 114.2 in February due to weaker confidence in the industry and services sectors as well as retail trade. Meanwhile, confidence among consumers was unchanged while confidence in the construction sector improved during the month. Japan. On a q-o-q basis, real GDP grew by 0.4 percent in Q4 2017, slower than the 0.6 percent expansion in the previous quarter. Meanwhile, on a y-o-y basis, real GDP expanded at a faster pace by 2.0 percent in Q4 2017 from 1.9 percent in the previous quarter.
59 The slower
q-o-q GDP growth recorded in Japan was attributed mainly to subdued public demand.
Manufacturing activity in
Japan slows down
Meanwhile, the seasonally adjusted manufacturing PMI fell to 53.1 in March from 54.1 in February as the rate of production growth eased despite favorable order receipts, while new business expanded at a softer rate.
60
Inflation rose slightly to 1.5 percent in February from 1.4 percent in January due to the increase in the prices indices of culture and recreation; fuel, light, and water charges; clothes and footwear; and transportation and communication. The seasonally adjusted unemployment rate increased to 2.5 percent in February from 2.4 percent in January. 56 Final Markit Eurozone PMI, http://www.markiteconomics.com/ 57 Eurostat news release 42/2018 dated 16 March 2018 58 Eurostat news release 34/2018 dated 1 March 2018 59Second Estimate. Department of National Accounts, Economic and Social Research Institute, Cabinet Office. http://www/esri.cao.go.jp/ 60 Nikkei Japan Manufacturing PMI, http://www.markiteconomics .com/
China. Real GDP in China expanded by 6.8 percent y-o-y in Q4 2017, the same rate recorded in the previous quarter. The GDP expansion was driven mainly by the services industry, manufacturing, and the agricultural sector. For the full-year 2017, China’s GDP grew by 6.9 percent, higher than the 6.7 percent rate of expansion in 2016 and the government’s GDP growth target of 6.5 percent.
Indicators point to a sustained
improvement in Chinese
economic activity
Meanwhile, the seasonally adjusted manufacturing PMI decreased slightly to 51.0 in March from 51.6 in February due to sustained, albeit weaker growth in new orders.
61
Inflation went up by 2.9 percent in February from 1.5 percent in January as both food and non-food price indices increased during the month. India. Real GDP in India accelerated to 7.2 percent y-o-y in Q4 2017 from 6.5 percent (revised) in the previous quarter. The faster GDP growth was due mainly to the stronger expansion in trade, hotels, transport, communication and services related to broadcasting; manufacturing; public administration, defense, and other services; construction; financial, real estate, and professional services; electricity, gas, water supply and other utility services; and agriculture, forestry, and fishing.
62
Economic activity in India
improves
Meanwhile, the composite PMI rose to 50.8 in March from 49.7 in February due mainly to a renewed increase in new business placed at Indian service companies. Confidence in the service sector strengthened since the implementation of the goods and services tax last July 2017. 61 Caixin China General Manufacturing PMI, http://www.markiteconomics.com/ 62 Ministry of Statistics and Programme Implementation. http://mospi.nic.in/

Q1 2018 Inflation Report | 34
Inflation fell to 4.4 percent in February from 5.1 percent in January due to the decrease in the food and beverages price index. ASEAN Region. The Nikkei ASEAN Manufacturing PMI fell slightly to 50.1 in March from 50.7 in February due to slower increases in both output and new order volumes, alongside inventory depletion and largely stagnant employment.
Manufacturing conditions in
ASEAN region expand slower
In March, output expanded faster in Myanmar and the Philippines, while slower rates of expansion were recorded in Vietnam and Indonesia. Meanwhile, Malaysia, Thailand, and Singapore slid into contraction territory.
63
Policy Actions by Central Banks. On 17 January 2018, Bank of Canada (BOC) decided to raise its target for the overnight rate from 1 percent to 1.25 percent as recent data have been strong, inflation is close to target, and the economy is operating roughly at capacity. Consumption and residential investment have been stronger than anticipated, reflecting strong employment growth. Meanwhile, inflation is close to 2 percent and core measures of inflation have edged up. On 25 January 2018, Bank Negara Malaysia (BNM) also decided to increase its overnight policy rate by 25 basis points (bps) to 3.25 percent as the strong economic growth momentum is expected to continue, sustained by the stronger global growth and positive spillovers from the external sector to the Malaysian economy. At the same time, BNM recognized the need to pre-emptively ensure that the stance of monetary policy is appropriate to prevent the build-up of risks that could arise from interest rates being too low for a prolonged period. 63 Nikkei ASEAN Manufacturing PMI, http://www.markiteconomics.com/
A number of central banks
tighten their monetary policy
settings
Similarly, on 21 March 2018, the Federal Open Market Committee (FOMC) of the Fed decided to raise the fed funds rate target by 25 bps to 1.5-1.75 percent, in view of the further strengthening of the labor market and moderate expansion in economic activity. The FOMC expects that with further gradual adjustments in the monetary policy stance, economic activity will expand at a moderate pace in the medium term and labor market conditions will remain strong. Meanwhile, inflation on a 12-month basis is expected to stabilize around the 2-percent inflation objective over the medium term. On 22 March, People’s Bank of China (PBOC) increased by 5 bps the rate on its 7-day reverse repo, one of its most commonly used tools to manage liquidity in the financial system. The new rate on the 7-day reverse repo was raised to 2.55 percent, while the PBOC injected 10 billion yuan (or US$1.58 billion) into the financial system. The move of the PBOC has been widely expected and was the central bank’s first major policy decision under the newly appointed PBOC Governor Yi Gang. The PBOC had similarly raised some rates after the Fed increased its policy rate last March and December 2017. Meanwhile, the PBOC has not changed the benchmark one-year lending rate since October 2015.
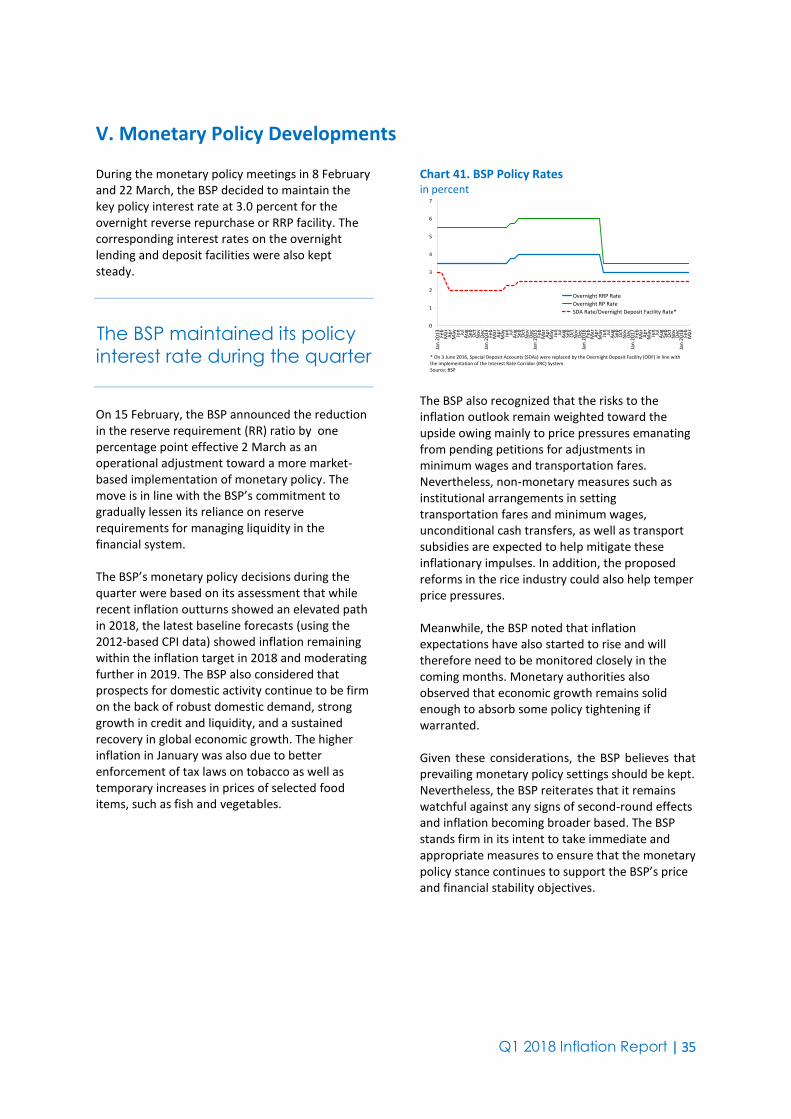
Q1 2018 Inflation Report | 35
V. Monetary Policy Developments
During the monetary policy meetings in 8 February and 22 March, the BSP decided to maintain the key policy interest rate at 3.0 percent for the overnight reverse repurchase or RRP facility. The corresponding interest rates on the overnight lending and deposit facilities were also kept steady.
The BSP maintained its policy
interest rate during the quarter
On 15 February, the BSP announced the reduction in the reserve requirement (RR) ratio by one percentage point effective 2 March as an operational adjustment toward a more market-based implementation of monetary policy. The move is in line with the BSP’s commitment to gradually lessen its reliance on reserve requirements for managing liquidity in the financial system. The BSP’s monetary policy decisions during the quarter were based on its assessment that while recent inflation outturns showed an elevated path in 2018, the latest baseline forecasts (using the 2012-based CPI data) showed inflation remaining within the inflation target in 2018 and moderating further in 2019. The BSP also considered that prospects for domestic activity continue to be firm on the back of robust domestic demand, strong growth in credit and liquidity, and a sustained recovery in global economic growth. The higher inflation in January was also due to better enforcement of tax laws on tobacco as well as temporary increases in prices of selected food items, such as fish and vegetables.
Chart 41. BSP Policy Rates in percent
0
1
2
3
4
5
6
7
Jan
20
13
Feb
Mar
Ap
rM
ay Jun
Jul
Au
gSe
pO
ctN
ov
Dec
Jan
20
14
Feb
Mar
Ap
rM
ay Jun
Jul
Au
gSe
pO
ctN
ov
Dec
Jan
20
15
Feb
Mar
Ap
rM
ay Jun
Jul
Au
gSe
pO
ctN
ov
Dec
Jan
20
16
Feb
Mar
Ap
rM
ay Jun
Jul
Au
gSe
pO
ctN
ov
Dec
Jan
20
17
Feb
Mar
Ap
rM
ay Jun
Jul
Au
gSe
pO
ctN
ov
Dec
Jan
20
18
Feb
Mar
Overnight RRP Rate
Overnight RP Rate
SDA Rate/Overnight Deposit Facility Rate*
* On 3 June 2016, Special Deposit Accounts (SDAs) were replaced by the Overnight Deposit Facility (ODF) in line with the implementation of the Interest Rate Corridor (IRC) System.Source: BSP
The BSP also recognized that the risks to the inflation outlook remain weighted toward the upside owing mainly to price pressures emanating from pending petitions for adjustments in minimum wages and transportation fares. Nevertheless, non-monetary measures such as institutional arrangements in setting transportation fares and minimum wages, unconditional cash transfers, as well as transport subsidies are expected to help mitigate these inflationary impulses. In addition, the proposed reforms in the rice industry could also help temper price pressures. Meanwhile, the BSP noted that inflation expectations have also started to rise and will therefore need to be monitored closely in the coming months. Monetary authorities also observed that economic growth remains solid enough to absorb some policy tightening if warranted. Given these considerations, the BSP believes that prevailing monetary policy settings should be kept. Nevertheless, the BSP reiterates that it remains watchful against any signs of second-round effects and inflation becoming broader based. The BSP stands firm in its intent to take immediate and appropriate measures to ensure that the monetary policy stance continues to support the BSP’s price and financial stability objectives.

Q1 2018 Inflation Report | 36
VI. Inflation Outlook
BSP Inflation Forecasts
The BSP’s latest baseline forecasts using the 2012-based CPI series show that inflation could remain at the high-end of the government’s target range of 3.0 percent ± 1.0 percentage point in 2018 before settling at the midpoint of the target range in 2019.
64
The risks to the inflation outlook remain on the upside. Additional wage adjustments and transport fare hikes due to higher excise taxes on petroleum products and other key commodities, pending petitions for adjustments in transport fares and electricity rates, and faster-than-expected monetary policy normalization in the US are the main upside risks to future inflation. Meanwhile, the slower global economic growth due to protectionist policies in advanced economies and geopolitical tensions along with the proposed reform in the rice industry involving the replacement of quantitative restrictions with tariffs and the deregulation of rice importation continue to be the main downside risks to inflation.
Inflation is expected to settle
close to the high-end of the
target range in 2018 before
settling at the midpoint of the
target range in 2019
Demand Conditions. Outturns for key demand indicators attest to the view of robust domestic real sector activity. Economic activity in the first quarter of 2018 is expected to remain firm driven by the continued strength in public construction with the implementation of the government’s 64 On 22 February 2018, the Philippine Statistics Authority (PSA) announced the release of the 2012-based CPI series starting on 6 March 2018. The 2006-based and 2012-based CPI series will be released simultaneously until June 2018. The official CPI data beginning July 2018 will use the 2012-based series. The initial release of the 2012-based CPI series coverns data beginning 2012 onwards. The PSA plans to release to the public the historical 2012-based CPI series on September 2018.
infrastructure spending and tax reform programs. Looking ahead, prospects for the domestic economy remain favorable. GDP expansion will be supported by the robust growth in the services sector and improved external trade conditions. Private demand is expected to remain firm, aided mainly by sustained remittance inflows and low inflation. Private capital formation should likewise contribute to economic growth with construction and investments in durable equipment expected to remain solid as the government’s infrastructure spending program gets underway, amid ample liquidity conditions. Supply Conditions. Commodity prices are expected to remain manageable, reflecting ample supply conditions. Food inflation could remain benign over the near term given prospects of favorable domestic supply. Meanwhile, oil prices are projected to remain flat or slightly higher in the medium term as suggested by futures prices.
Commodity prices point to
manageable inflation
environment
Global agricultural prices are projected to settle at moderate levels over the medium term. Forecasts by the International Monetary Fund (IMF) and the World Bank suggest benchmark prices of key grains, particularly wheat and rice will rise slightly in 2018 before easing in the medium term.
65,66
In the domestic front, palay and corn production could increase by 5.7 percent and 5.1 percent, respectively, in Q1 2018 based on standing crop estimates. Farmers expect yields to increase with the availability of sufficient water supply.
67
International crude oil prices rose significantly compared to the previous quarter’s level owing mainly to the production cut by the Organization of the Petroleum Exporting Countries (OPEC) and several non-OPEC producers as well as robust 65 IMF, World Economic Outlook Update, January 2018, available online at http://www.imf.org 66 World Bank, Global Economic Prospects, January 2018, available online at http://www.worldbank.org 67 PSA, Rice and Corn Situation Outlook Update, 22 January 2018, available online at http://www.psa.gov.ph
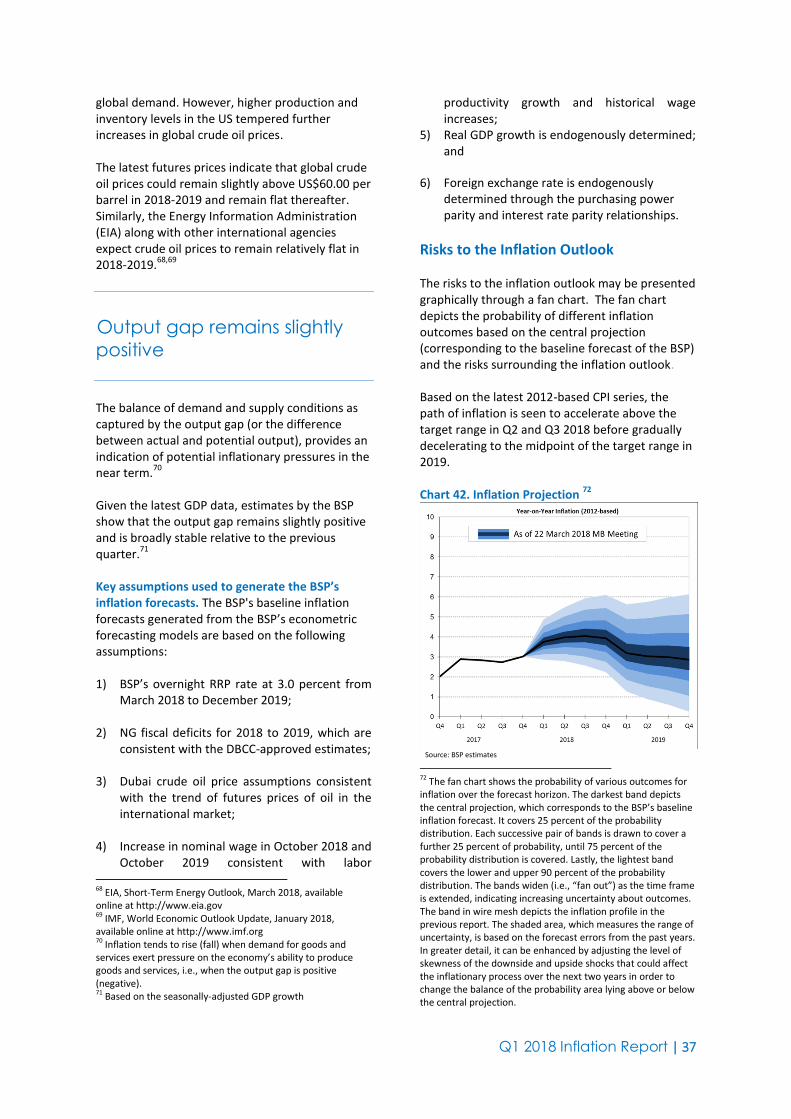
Q1 2018 Inflation Report | 37
global demand. However, higher production and inventory levels in the US tempered further increases in global crude oil prices. The latest futures prices indicate that global crude oil prices could remain slightly above US$60.00 per barrel in 2018-2019 and remain flat thereafter. Similarly, the Energy Information Administration (EIA) along with other international agencies expect crude oil prices to remain relatively flat in 2018-2019.
68,69
Output gap remains slightly
positive
The balance of demand and supply conditions as captured by the output gap (or the difference between actual and potential output), provides an indication of potential inflationary pressures in the near term.
70
Given the latest GDP data, estimates by the BSP show that the output gap remains slightly positive and is broadly stable relative to the previous quarter.
71
Key assumptions used to generate the BSP’s inflation forecasts. The BSP's baseline inflation forecasts generated from the BSP’s econometric forecasting models are based on the following assumptions: 1) BSP’s overnight RRP rate at 3.0 percent from
March 2018 to December 2019; 2) NG fiscal deficits for 2018 to 2019, which are
consistent with the DBCC-approved estimates; 3) Dubai crude oil price assumptions consistent
with the trend of futures prices of oil in the international market;
4) Increase in nominal wage in October 2018 and
October 2019 consistent with labor 68 EIA, Short-Term Energy Outlook, March 2018, available online at http://www.eia.gov 69 IMF, World Economic Outlook Update, January 2018, available online at http://www.imf.org 70 Inflation tends to rise (fall) when demand for goods and services exert pressure on the economy’s ability to produce goods and services, i.e., when the output gap is positive (negative). 71 Based on the seasonally-adjusted GDP growth
productivity growth and historical wage increases;
5) Real GDP growth is endogenously determined; and
6) Foreign exchange rate is endogenously determined through the purchasing power parity and interest rate parity relationships.
Risks to the Inflation Outlook The risks to the inflation outlook may be presented graphically through a fan chart. The fan chart depicts the probability of different inflation outcomes based on the central projection (corresponding to the baseline forecast of the BSP) and the risks surrounding the inflation outlook. Based on the latest 2012-based CPI series, the path of inflation is seen to accelerate above the target range in Q2 and Q3 2018 before gradually decelerating to the midpoint of the target range in 2019. Chart 42. Inflation Projection
72
Source: BSP estimates
72 The fan chart shows the probability of various outcomes for inflation over the forecast horizon. The darkest band depicts the central projection, which corresponds to the BSP’s baseline inflation forecast. It covers 25 percent of the probability distribution. Each successive pair of bands is drawn to cover a further 25 percent of probability, until 75 percent of the probability distribution is covered. Lastly, the lightest band covers the lower and upper 90 percent of the probability distribution. The bands widen (i.e., “fan out”) as the time frame is extended, indicating increasing uncertainty about outcomes. The band in wire mesh depicts the inflation profile in the previous report. The shaded area, which measures the range of uncertainty, is based on the forecast errors from the past years. In greater detail, it can be enhanced by adjusting the level of skewness of the downside and upside shocks that could affect the inflationary process over the next two years in order to change the balance of the probability area lying above or below the central projection.
Q1 2018 Inflation Report | 38
The BSP’s review of current inflation dynamics suggests that the risks surrounding the inflation outlook remains tilted to the upside. This assessment is depicted in the latest fan chart, wherein the projection bands above the central projection are greater than the bands below it. Additional wage adjustments and potential increase in transport fares represent an upside risk to inflation. The higher excise taxes on key commodities could lead to higher-than-assumed minimum wage hikes. However, the proposed unconditional cash transfers and other social welfare programs in the pipeline could temper demands for higher wage increases. Several transport groups have submitted a petition to the Land Transportation Franchising and Regulatory Board (LTFRB) to raise the minimum jeepney, bus, and taxi fares. The transport groups have cited the expected significant rise in diesel prices due to the implementation of the Tax Reform for Acceleration and Inclusion (TRAIN) Act and the higher cost of spare parts due to the weaker peso for the proposed fare hike. Nevertheless, non-monetary measures such as institutional arrangements in setting transportation fares and minimum wages, unconditional cash transfers, as well as transport subsidies are expected to help mitigate these inflationary impulses. Faster-than-expected policy normalization in the US and other advanced economies could contribute to foreign exchange depreciation pressures and raise inflation. The sustained recovery in economic conditions in the US could warrant further rate hikes by the Federal Reserve. The baseline inflation outlook already incorporates three rate hikes by the US Fed in 2018 and two rate hikes in 2019, consistent with latest market sentiment. However, faster-than-expected monetary policy normalization in the US and other advanced economies could lead to tighter global liquidity conditions and repricing of risks, resulting in potential reversals in capital flows in emerging markets, depreciation pressures, and an appreciation of the US dollar. Consequently, the higher federal funds rate could result in portfolio outflows and higher risk premia leading to a weaker peso and higher inflation over the policy horizon. Various petitions for rate adjustments by Meralco and PSALM are also considered as upside risks to inflation and have not yet been added to the baseline forecasts. Meralco’s petitions include
generation and transmission charges, system loss, lifeline subsidy, the December 2013 rate adjustment, which is the subject of Supreme Court temporary restraining order, and the ₱0.65/ kWh adjustment for the January 2014 billing period that is subject to the Energy Regulatory Commission’s (ERC) approval. PSALM’s petitions cover adjustments for fuel and foreign exchange costs.
The balance of risks to the
inflation remain tilted on the
upside
The proposed reforms in rice importation is the main downside risk to inflation. The House of Representatives and the Senate have accelerated discussions to liberalize the country’s rice import policy by replacing quantitative restrictions (QR) on rice by reasonable tariff rates. As the Philippines remains the sole World Trade Organization (WTO) member that still has special treatment exemption, RA No. 8178 or the Agricultural Tariffication Act of 1996 (which maintains the rice QR) would continue to be in effect unless amended or repealed by Congress. Given the significant share of rice in the CPI basket and lower production costs from major import sources such as Thailand and Vietnam, the liberalization of rice importation policy could drive down domestic rice prices. The global economic outlook is also another source of downside risk to the inflation outlook. The continued policy uncertainty, spillovers from tighter global financial conditions, the imposition of inward-looking policies, and geopolitical tensions could lead to slower global trade and economic activity on the whole, thereby leading to potential downward price pressures.

Q1 2018 Inflation Report | 39
Implications for the Monetary Policy Stance The latest baseline inflation forecasts support the maintenance of present monetary policy settings for the time being as inflation is expected to be within target by 2019. Inflation has increased in Q1 2018 but remained in line with the BSP’s baseline forecast scenario. Inflation expectations are higher in 2018 but revert to the target over the policy horizon. Looking at output conditions, domestic activity continue to be firm on the back of robust domestic demand, strong growth in credit and liquidity, and a sustained recovery in global economic growth. Nevertheless, authorities see the balance of risks to the inflation outlook remaining tilted toward the upside, which argues for maintaining vigilance in setting the stance of monetary policy going forward. While the supply-side factors affecting inflation are likely to be transitory, managing the risks to inflation expectations continue to be a key policy priority. Inflation expectations have started to rise and will therefore need to be monitored closely in the coming months. Given these considerations, the BSP remains watchful against any signs of second-round effects and inflation becoming broader based. The BSP stands firm in its intent to take immediate and appropriate measures to ensure that the monetary policy stance continues to support the BSP's price stability objective.

Q1 2018 Inflation Report | 40
Summary of Monetary Policy Decisions
Effectivity Date
Levels (in percent)
Monetary Policy Decisions RRP Overnight
RP Overnight
2 0 0 8
31 Jan 2008 5.00 7.00
The Monetary Board (MB) decided to reduce by 25 basis points (bps) the BSP’s key policy interest rates to 5 percent for the overnight borrowing or reverse repurchase (RRP) facility and 7 percent for the overnight lending or repurchase (RP) facility. The interest rates on term RRPs, RPs, and special deposit accounts (SDAs) were also reduced accordingly. In its assessment of macroeconomic conditions, the MB noted that the latest inflation forecasts indicated that inflation would fall within the 4.0 percent ± 1 percentage point target range in 2008 and the 3.5 ± 1 percentage point target range in 2009.
13 Mar 2008 5.00 7.00
The MB decided to keep the BSP’s key policy interest rates at 5 percent for the overnight borrowing or RRP facility and 7 percent for the overnight lending or RP facility. The MB also decided to implement immediately the following refinements in the SDA facility: (1) the closure of existing windows for the two-, three-, and six-month tenors; and (2) the reduction of the interest rates on the remaining tenors. The interest rates on term RRPs and RPs were also left unchanged.
24 Apr 2008 5.00 7.00
The MB kept the BSP’s key policy interest rates at 5.0 percent for the overnight borrowing or RRP facility and 7.0 percent for the overnight lending or RP facility. The interest rates on term RRPs and RPs were also left unchanged.
5 Jun 2008 5.25 7.25
The MB decided to increase by 25 bps the BSP’s key policy interest rates to 5.25 percent for the RRP facility and 7.25 percent for RP facility as emerging baseline forecasts indicate a likely breach of the inflation target for 2008 along with indications that supply-driven pressures are beginning to feed into demand. Given the early evidence of second-round effects, the MB recognized the need to act promptly to rein in inflationary expectations. The interest rates on term RRPs, RPs, and SDAs were also increased accordingly.
17 Jul 2008 5.75 7.75
The MB increased by 50 bps the BSP’s key policy interest rates to 5.75 percent for the overnight borrowing or RRP facility and 7.75 percent for the overnight lending or RP facility. The interest rates on term RRPs, RPs, and SDAs were also increased accordingly.
28 Aug 2008 6.00 8.00
The MB increased by 25 bps the BSP’s key policy interest rates to 6.0 percent for the overnight borrowing or reverse repurchase (RRP) facility and 8.0 percent for the overnight lending or repurchase (RP) facility. The interest rates on term RRPs, RPs, and SDAs were also increased accordingly.
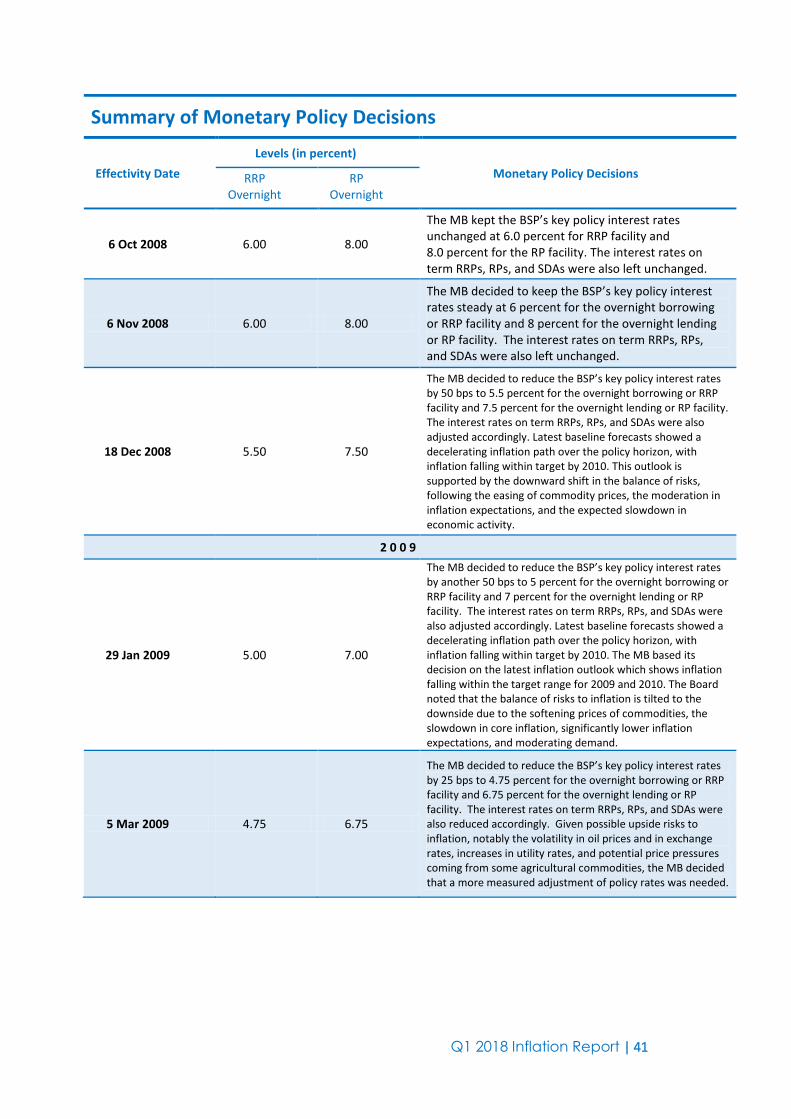
Q1 2018 Inflation Report | 41
Summary of Monetary Policy Decisions
Effectivity Date
Levels (in percent)
Monetary Policy Decisions RRP Overnight
RP Overnight
6 Oct 2008 6.00 8.00
The MB kept the BSP’s key policy interest rates unchanged at 6.0 percent for RRP facility and 8.0 percent for the RP facility. The interest rates on term RRPs, RPs, and SDAs were also left unchanged.
6 Nov 2008 6.00 8.00
The MB decided to keep the BSP’s key policy interest rates steady at 6 percent for the overnight borrowing or RRP facility and 8 percent for the overnight lending or RP facility. The interest rates on term RRPs, RPs, and SDAs were also left unchanged.
18 Dec 2008 5.50 7.50
The MB decided to reduce the BSP’s key policy interest rates by 50 bps to 5.5 percent for the overnight borrowing or RRP facility and 7.5 percent for the overnight lending or RP facility. The interest rates on term RRPs, RPs, and SDAs were also adjusted accordingly. Latest baseline forecasts showed a decelerating inflation path over the policy horizon, with inflation falling within target by 2010. This outlook is supported by the downward shift in the balance of risks, following the easing of commodity prices, the moderation in inflation expectations, and the expected slowdown in economic activity.
2 0 0 9
29 Jan 2009 5.00 7.00
The MB decided to reduce the BSP’s key policy interest rates by another 50 bps to 5 percent for the overnight borrowing or RRP facility and 7 percent for the overnight lending or RP facility. The interest rates on term RRPs, RPs, and SDAs were also adjusted accordingly. Latest baseline forecasts showed a decelerating inflation path over the policy horizon, with inflation falling within target by 2010. The MB based its decision on the latest inflation outlook which shows inflation falling within the target range for 2009 and 2010. The Board noted that the balance of risks to inflation is tilted to the downside due to the softening prices of commodities, the slowdown in core inflation, significantly lower inflation expectations, and moderating demand.
5 Mar 2009 4.75 6.75
The MB decided to reduce the BSP’s key policy interest rates by 25 bps to 4.75 percent for the overnight borrowing or RRP facility and 6.75 percent for the overnight lending or RP facility. The interest rates on term RRPs, RPs, and SDAs were also reduced accordingly. Given possible upside risks to inflation, notably the volatility in oil prices and in exchange rates, increases in utility rates, and potential price pressures coming from some agricultural commodities, the MB decided that a more measured adjustment of policy rates was needed.
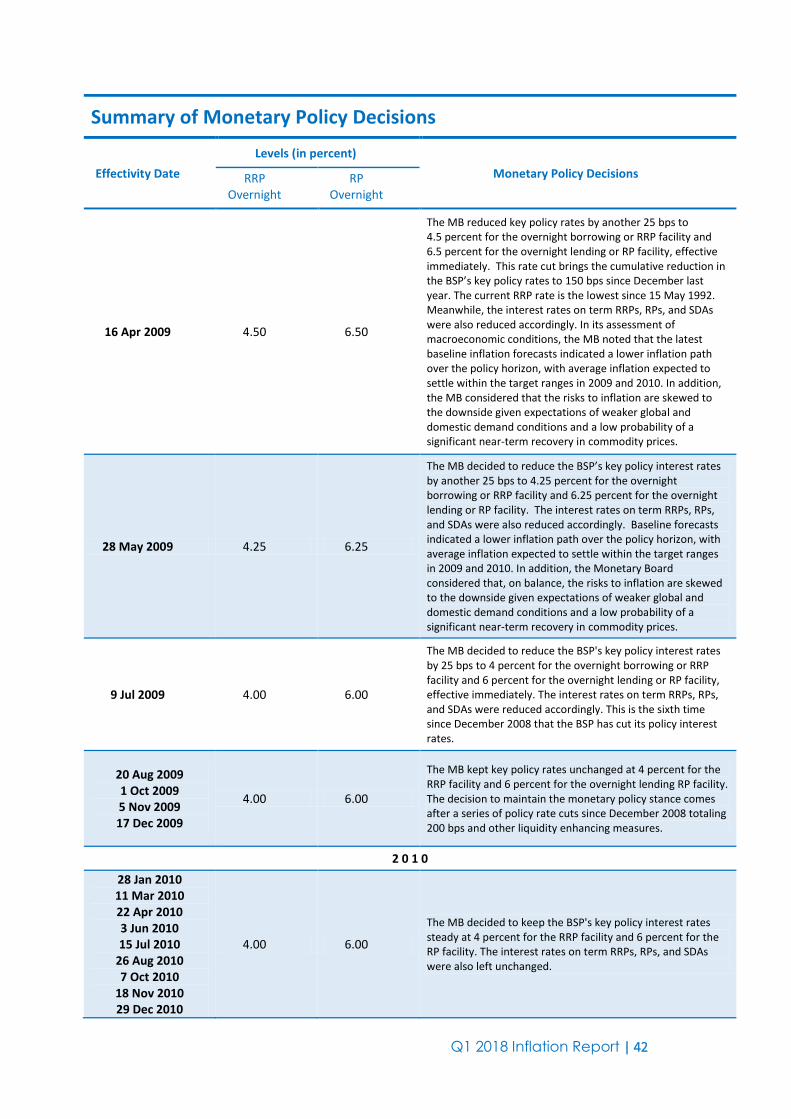
Q1 2018 Inflation Report | 42
Summary of Monetary Policy Decisions
Effectivity Date
Levels (in percent)
Monetary Policy Decisions RRP Overnight
RP Overnight
16 Apr 2009 4.50 6.50
The MB reduced key policy rates by another 25 bps to 4.5 percent for the overnight borrowing or RRP facility and 6.5 percent for the overnight lending or RP facility, effective immediately. This rate cut brings the cumulative reduction in the BSP’s key policy rates to 150 bps since December last year. The current RRP rate is the lowest since 15 May 1992. Meanwhile, the interest rates on term RRPs, RPs, and SDAs were also reduced accordingly. In its assessment of macroeconomic conditions, the MB noted that the latest baseline inflation forecasts indicated a lower inflation path over the policy horizon, with average inflation expected to settle within the target ranges in 2009 and 2010. In addition, the MB considered that the risks to inflation are skewed to the downside given expectations of weaker global and domestic demand conditions and a low probability of a significant near-term recovery in commodity prices.
28 May 2009 4.25 6.25
The MB decided to reduce the BSP’s key policy interest rates by another 25 bps to 4.25 percent for the overnight borrowing or RRP facility and 6.25 percent for the overnight lending or RP facility. The interest rates on term RRPs, RPs, and SDAs were also reduced accordingly. Baseline forecasts indicated a lower inflation path over the policy horizon, with average inflation expected to settle within the target ranges in 2009 and 2010. In addition, the Monetary Board considered that, on balance, the risks to inflation are skewed to the downside given expectations of weaker global and domestic demand conditions and a low probability of a significant near-term recovery in commodity prices.
9 Jul 2009 4.00 6.00
The MB decided to reduce the BSP's key policy interest rates by 25 bps to 4 percent for the overnight borrowing or RRP facility and 6 percent for the overnight lending or RP facility, effective immediately. The interest rates on term RRPs, RPs, and SDAs were reduced accordingly. This is the sixth time since December 2008 that the BSP has cut its policy interest rates.
20 Aug 2009 1 Oct 2009 5 Nov 2009 17 Dec 2009
4.00 6.00
The MB kept key policy rates unchanged at 4 percent for the RRP facility and 6 percent for the overnight lending RP facility. The decision to maintain the monetary policy stance comes after a series of policy rate cuts since December 2008 totaling 200 bps and other liquidity enhancing measures.
2 0 1 0
28 Jan 2010 11 Mar 2010 22 Apr 2010 3 Jun 2010 15 Jul 2010
26 Aug 2010 7 Oct 2010
18 Nov 2010 29 Dec 2010
4.00 6.00
The MB decided to keep the BSP's key policy interest rates steady at 4 percent for the RRP facility and 6 percent for the RP facility. The interest rates on term RRPs, RPs, and SDAs were also left unchanged.
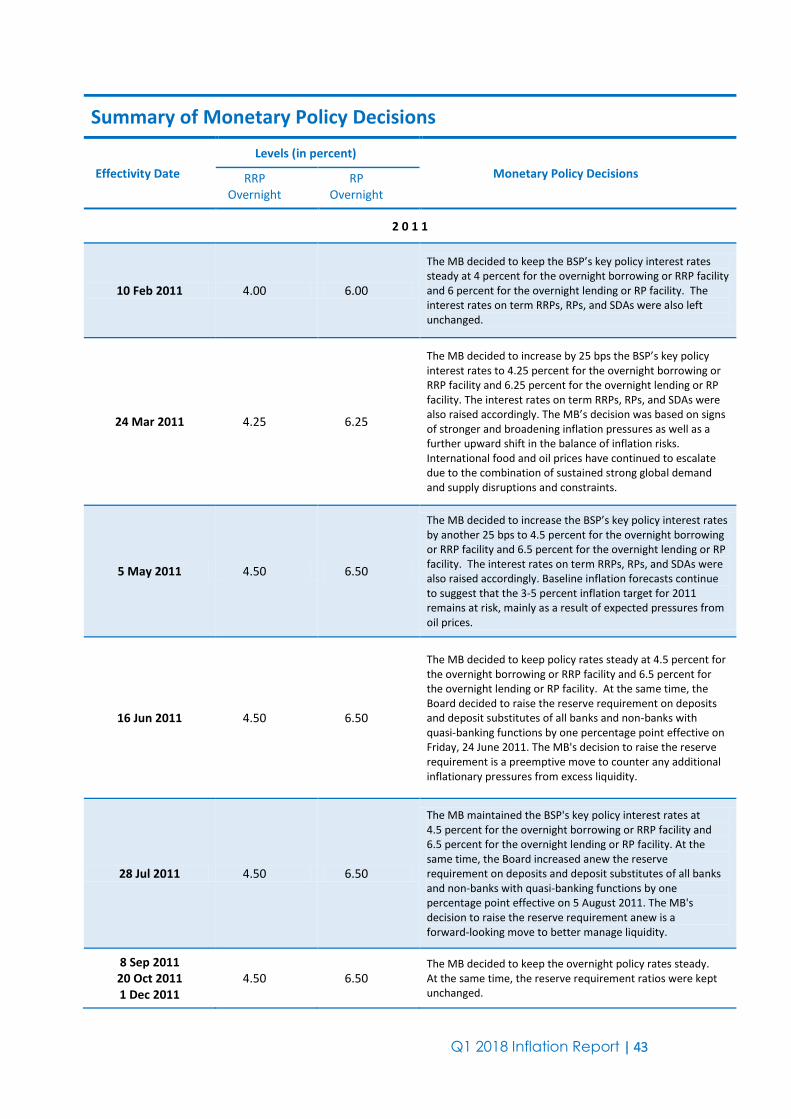
Q1 2018 Inflation Report | 43
Summary of Monetary Policy Decisions
Effectivity Date
Levels (in percent)
Monetary Policy Decisions RRP Overnight
RP Overnight
2 0 1 1
10 Feb 2011 4.00 6.00
The MB decided to keep the BSP’s key policy interest rates steady at 4 percent for the overnight borrowing or RRP facility and 6 percent for the overnight lending or RP facility. The interest rates on term RRPs, RPs, and SDAs were also left unchanged.
24 Mar 2011 4.25 6.25
The MB decided to increase by 25 bps the BSP’s key policy interest rates to 4.25 percent for the overnight borrowing or RRP facility and 6.25 percent for the overnight lending or RP facility. The interest rates on term RRPs, RPs, and SDAs were also raised accordingly. The MB’s decision was based on signs of stronger and broadening inflation pressures as well as a further upward shift in the balance of inflation risks. International food and oil prices have continued to escalate due to the combination of sustained strong global demand and supply disruptions and constraints.
5 May 2011 4.50 6.50
The MB decided to increase the BSP’s key policy interest rates by another 25 bps to 4.5 percent for the overnight borrowing or RRP facility and 6.5 percent for the overnight lending or RP facility. The interest rates on term RRPs, RPs, and SDAs were also raised accordingly. Baseline inflation forecasts continue to suggest that the 3-5 percent inflation target for 2011 remains at risk, mainly as a result of expected pressures from oil prices.
16 Jun 2011 4.50 6.50
The MB decided to keep policy rates steady at 4.5 percent for the overnight borrowing or RRP facility and 6.5 percent for the overnight lending or RP facility. At the same time, the Board decided to raise the reserve requirement on deposits and deposit substitutes of all banks and non-banks with quasi-banking functions by one percentage point effective on Friday, 24 June 2011. The MB's decision to raise the reserve requirement is a preemptive move to counter any additional inflationary pressures from excess liquidity.
28 Jul 2011 4.50 6.50
The MB maintained the BSP's key policy interest rates at 4.5 percent for the overnight borrowing or RRP facility and 6.5 percent for the overnight lending or RP facility. At the same time, the Board increased anew the reserve requirement on deposits and deposit substitutes of all banks and non-banks with quasi-banking functions by one percentage point effective on 5 August 2011. The MB's decision to raise the reserve requirement anew is a forward-looking move to better manage liquidity.
8 Sep 2011 20 Oct 2011 1 Dec 2011
4.50 6.50 The MB decided to keep the overnight policy rates steady. At the same time, the reserve requirement ratios were kept unchanged.
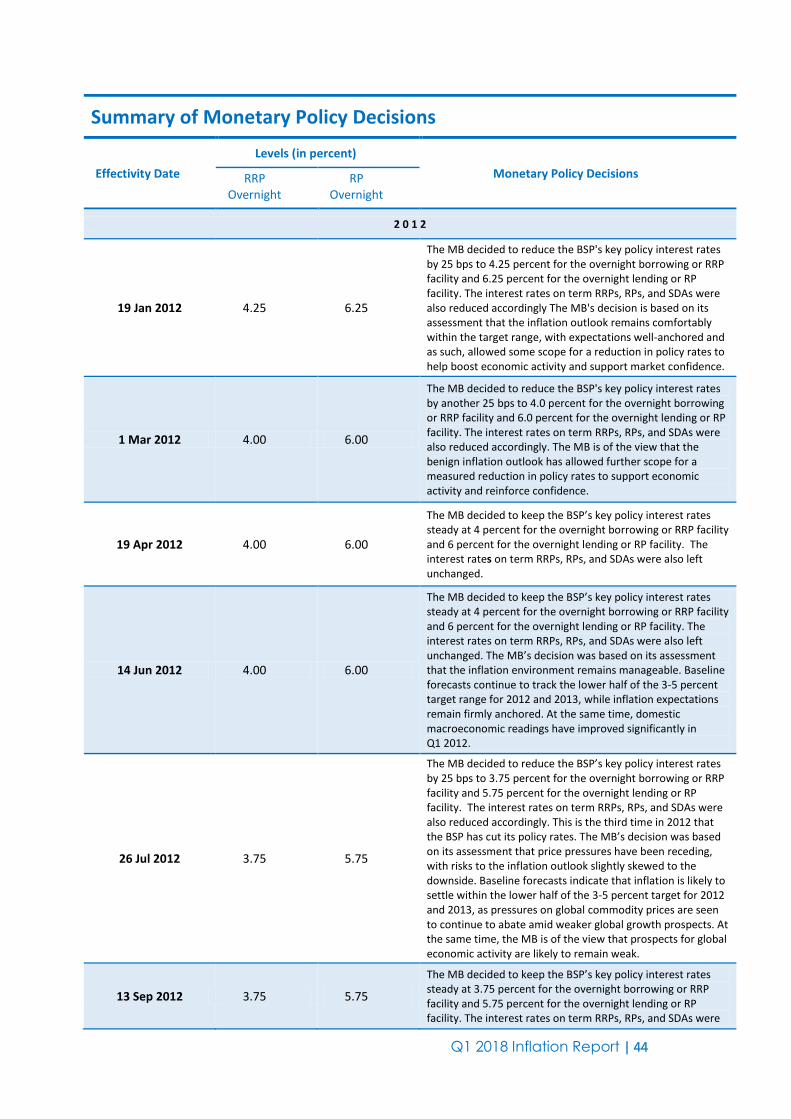
Q1 2018 Inflation Report | 44
Summary of Monetary Policy Decisions
Effectivity Date
Levels (in percent)
Monetary Policy Decisions RRP Overnight
RP Overnight
2 0 1 2
19 Jan 2012 4.25 6.25
The MB decided to reduce the BSP's key policy interest rates by 25 bps to 4.25 percent for the overnight borrowing or RRP facility and 6.25 percent for the overnight lending or RP facility. The interest rates on term RRPs, RPs, and SDAs were also reduced accordingly The MB's decision is based on its assessment that the inflation outlook remains comfortably within the target range, with expectations well-anchored and as such, allowed some scope for a reduction in policy rates to help boost economic activity and support market confidence.
1 Mar 2012 4.00 6.00
The MB decided to reduce the BSP's key policy interest rates by another 25 bps to 4.0 percent for the overnight borrowing or RRP facility and 6.0 percent for the overnight lending or RP facility. The interest rates on term RRPs, RPs, and SDAs were also reduced accordingly. The MB is of the view that the benign inflation outlook has allowed further scope for a measured reduction in policy rates to support economic activity and reinforce confidence.
19 Apr 2012 4.00 6.00
The MB decided to keep the BSP’s key policy interest rates steady at 4 percent for the overnight borrowing or RRP facility and 6 percent for the overnight lending or RP facility. The interest rates on term RRPs, RPs, and SDAs were also left unchanged.
14 Jun 2012 4.00 6.00
The MB decided to keep the BSP’s key policy interest rates steady at 4 percent for the overnight borrowing or RRP facility and 6 percent for the overnight lending or RP facility. The interest rates on term RRPs, RPs, and SDAs were also left unchanged. The MB’s decision was based on its assessment that the inflation environment remains manageable. Baseline forecasts continue to track the lower half of the 3-5 percent target range for 2012 and 2013, while inflation expectations remain firmly anchored. At the same time, domestic macroeconomic readings have improved significantly in Q1 2012.
26 Jul 2012 3.75 5.75
The MB decided to reduce the BSP’s key policy interest rates by 25 bps to 3.75 percent for the overnight borrowing or RRP facility and 5.75 percent for the overnight lending or RP facility. The interest rates on term RRPs, RPs, and SDAs were also reduced accordingly. This is the third time in 2012 that the BSP has cut its policy rates. The MB’s decision was based on its assessment that price pressures have been receding, with risks to the inflation outlook slightly skewed to the downside. Baseline forecasts indicate that inflation is likely to settle within the lower half of the 3-5 percent target for 2012 and 2013, as pressures on global commodity prices are seen to continue to abate amid weaker global growth prospects. At the same time, the MB is of the view that prospects for global economic activity are likely to remain weak.
13 Sep 2012 3.75 5.75
The MB decided to keep the BSP’s key policy interest rates steady at 3.75 percent for the overnight borrowing or RRP facility and 5.75 percent for the overnight lending or RP facility. The interest rates on term RRPs, RPs, and SDAs were
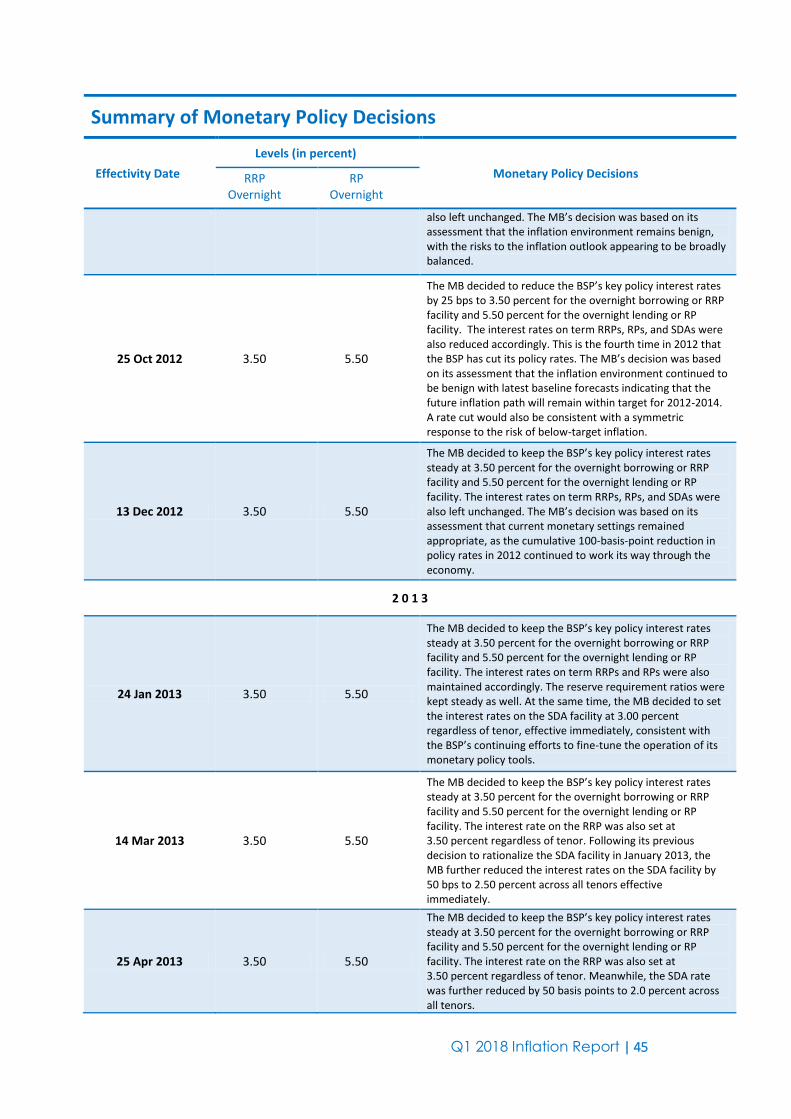
Q1 2018 Inflation Report | 45
Summary of Monetary Policy Decisions
Effectivity Date
Levels (in percent)
Monetary Policy Decisions RRP Overnight
RP Overnight
also left unchanged. The MB’s decision was based on its assessment that the inflation environment remains benign, with the risks to the inflation outlook appearing to be broadly balanced.
25 Oct 2012 3.50 5.50
The MB decided to reduce the BSP’s key policy interest rates by 25 bps to 3.50 percent for the overnight borrowing or RRP facility and 5.50 percent for the overnight lending or RP facility. The interest rates on term RRPs, RPs, and SDAs were also reduced accordingly. This is the fourth time in 2012 that the BSP has cut its policy rates. The MB’s decision was based on its assessment that the inflation environment continued to be benign with latest baseline forecasts indicating that the future inflation path will remain within target for 2012-2014. A rate cut would also be consistent with a symmetric response to the risk of below-target inflation.
13 Dec 2012 3.50 5.50
The MB decided to keep the BSP’s key policy interest rates steady at 3.50 percent for the overnight borrowing or RRP facility and 5.50 percent for the overnight lending or RP facility. The interest rates on term RRPs, RPs, and SDAs were also left unchanged. The MB’s decision was based on its assessment that current monetary settings remained appropriate, as the cumulative 100-basis-point reduction in policy rates in 2012 continued to work its way through the economy.
2 0 1 3
24 Jan 2013 3.50 5.50
The MB decided to keep the BSP’s key policy interest rates steady at 3.50 percent for the overnight borrowing or RRP facility and 5.50 percent for the overnight lending or RP facility. The interest rates on term RRPs and RPs were also maintained accordingly. The reserve requirement ratios were kept steady as well. At the same time, the MB decided to set the interest rates on the SDA facility at 3.00 percent regardless of tenor, effective immediately, consistent with the BSP’s continuing efforts to fine-tune the operation of its monetary policy tools.
14 Mar 2013 3.50 5.50
The MB decided to keep the BSP’s key policy interest rates steady at 3.50 percent for the overnight borrowing or RRP facility and 5.50 percent for the overnight lending or RP facility. The interest rate on the RRP was also set at 3.50 percent regardless of tenor. Following its previous decision to rationalize the SDA facility in January 2013, the MB further reduced the interest rates on the SDA facility by 50 bps to 2.50 percent across all tenors effective immediately.
25 Apr 2013 3.50 5.50
The MB decided to keep the BSP’s key policy interest rates steady at 3.50 percent for the overnight borrowing or RRP facility and 5.50 percent for the overnight lending or RP facility. The interest rate on the RRP was also set at 3.50 percent regardless of tenor. Meanwhile, the SDA rate was further reduced by 50 basis points to 2.0 percent across all tenors.

Q1 2018 Inflation Report | 46
Summary of Monetary Policy Decisions
Effectivity Date
Levels (in percent)
Monetary Policy Decisions RRP Overnight
RP Overnight
13 Jun 2013 25 Jul 2013 12 Sep 2013 24 Oct 2013 12 Dec 2013
3.50 5.50
The MB decided to keep the BSP’s key policy interest rates steady at 3.50 percent for the overnight borrowing or RRP facility and 5.50 percent for the overnight lending or RP facility. The interest rates on term RRPs, RPs, and SDA were also maintained.
2 0 1 4
6 Feb 2014 3.50 5.50
The MB decided to keep the BSP’s key policy interest rates steady at 3.50 percent for the overnight borrowing or RRP facility and 5.50 percent for the overnight lending or RP facility. The interest rates on term RRPs, RPs, and SDA were also maintained.
27 Mar 2014 3.50 5.50
The MB decided to keep the BSP’s key policy interest rates steady at 3.50 percent for the overnight borrowing or RRP facility and 5.50 percent for the overnight lending or RP facility. The interest rates on term RRPs, RPs, and SDA were also maintained. Meanwhile, the MB decided to increase the reserve requirement by one percentage point effective on 11 April 2014.
8 May 2014 3.50 5.50
The MB decided to keep the BSP's key policy interest rates steady at 3.50 percent for the overnight borrowing or RRP facility and 5.50 percent for the overnight lending or RP facility. The interest rates on term RRPs, RPs, and SDA were also maintained. Meanwhile, the MB decided to increase the reserve requirements for U/KBs and TBs by a further one percentage point effective on 30 May 2014.
19 Jun 2014 3.50 5.50
The MB decided to keep the BSP's key policy interest rates steady at 3.50 percent for the overnight borrowing or RRP facility and 5.50 percent for the overnight lending or RP facility. The interest rates on term RRPs and RPs were also maintained. The reserve requirement ratios were left unchanged as well. Meanwhile, the MB decided to raise the interest rate on the SDA facility by 25 basis points from 2.0 percent to 2.25 percent across all tenors effective immediately.
31 Jul 2014 3.75 5.75
The MB decided to increase the BSP's key policy rates by 25 bps to 3.75 percent for the overnight borrowing or RRP facility and 5.75 percent for the overnight lending or RP facility. The interest rates on term RRPs and RPs were also raised accordingly. The rate on special deposit accounts (SDA) was left unchanged. Meanwhile, the reserve requirement ratios were also kept steady.
11 Sep 2014 4.00 6.00
The MB decided to increase the BSP's key policy rates by 25 bps to 4.0 percent for the overnight borrowing or RRP facility and 6.0 percent for the overnight lending or RP facility. The interest rates on term RRPs, RPs, and SDA were also raised accordingly. Meanwhile, the reserve requirement ratios were left unchanged.
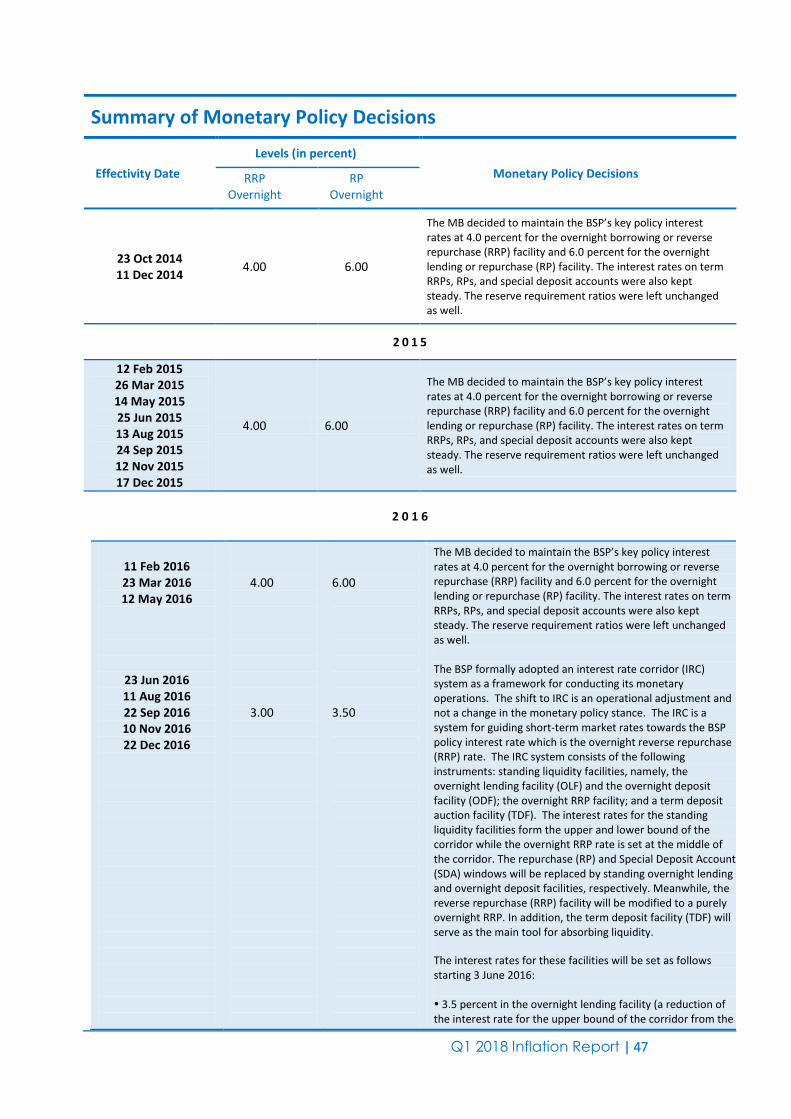
Q1 2018 Inflation Report | 47
Summary of Monetary Policy Decisions
Effectivity Date
Levels (in percent)
Monetary Policy Decisions RRP Overnight
RP Overnight
23 Oct 2014 11 Dec 2014
4.00 6.00
The MB decided to maintain the BSP’s key policy interest rates at 4.0 percent for the overnight borrowing or reverse repurchase (RRP) facility and 6.0 percent for the overnight lending or repurchase (RP) facility. The interest rates on term RRPs, RPs, and special deposit accounts were also kept steady. The reserve requirement ratios were left unchanged as well.
2 0 1 5
12 Feb 2015 26 Mar 2015 14 May 2015 25 Jun 2015 13 Aug 2015 24 Sep 2015 12 Nov 2015 17 Dec 2015
4.00 6.00
The MB decided to maintain the BSP’s key policy interest rates at 4.0 percent for the overnight borrowing or reverse repurchase (RRP) facility and 6.0 percent for the overnight lending or repurchase (RP) facility. The interest rates on term RRPs, RPs, and special deposit accounts were also kept steady. The reserve requirement ratios were left unchanged as well.
2 0 1 6
11 Feb 2016 23 Mar 2016 12 May 2016
23 Jun 2016 11 Aug 2016 22 Sep 2016 10 Nov 2016 22 Dec 2016
4.00
3.00
6.00 3.50
The MB decided to maintain the BSP’s key policy interest rates at 4.0 percent for the overnight borrowing or reverse repurchase (RRP) facility and 6.0 percent for the overnight lending or repurchase (RP) facility. The interest rates on term RRPs, RPs, and special deposit accounts were also kept steady. The reserve requirement ratios were left unchanged as well. The BSP formally adopted an interest rate corridor (IRC) system as a framework for conducting its monetary operations. The shift to IRC is an operational adjustment and not a change in the monetary policy stance. The IRC is a system for guiding short-term market rates towards the BSP policy interest rate which is the overnight reverse repurchase (RRP) rate. The IRC system consists of the following instruments: standing liquidity facilities, namely, the overnight lending facility (OLF) and the overnight deposit facility (ODF); the overnight RRP facility; and a term deposit auction facility (TDF). The interest rates for the standing liquidity facilities form the upper and lower bound of the corridor while the overnight RRP rate is set at the middle of the corridor. The repurchase (RP) and Special Deposit Account (SDA) windows will be replaced by standing overnight lending and overnight deposit facilities, respectively. Meanwhile, the reverse repurchase (RRP) facility will be modified to a purely overnight RRP. In addition, the term deposit facility (TDF) will serve as the main tool for absorbing liquidity. The interest rates for these facilities will be set as follows starting 3 June 2016: 3.5 percent in the overnight lending facility (a reduction of the interest rate for the upper bound of the corridor from the
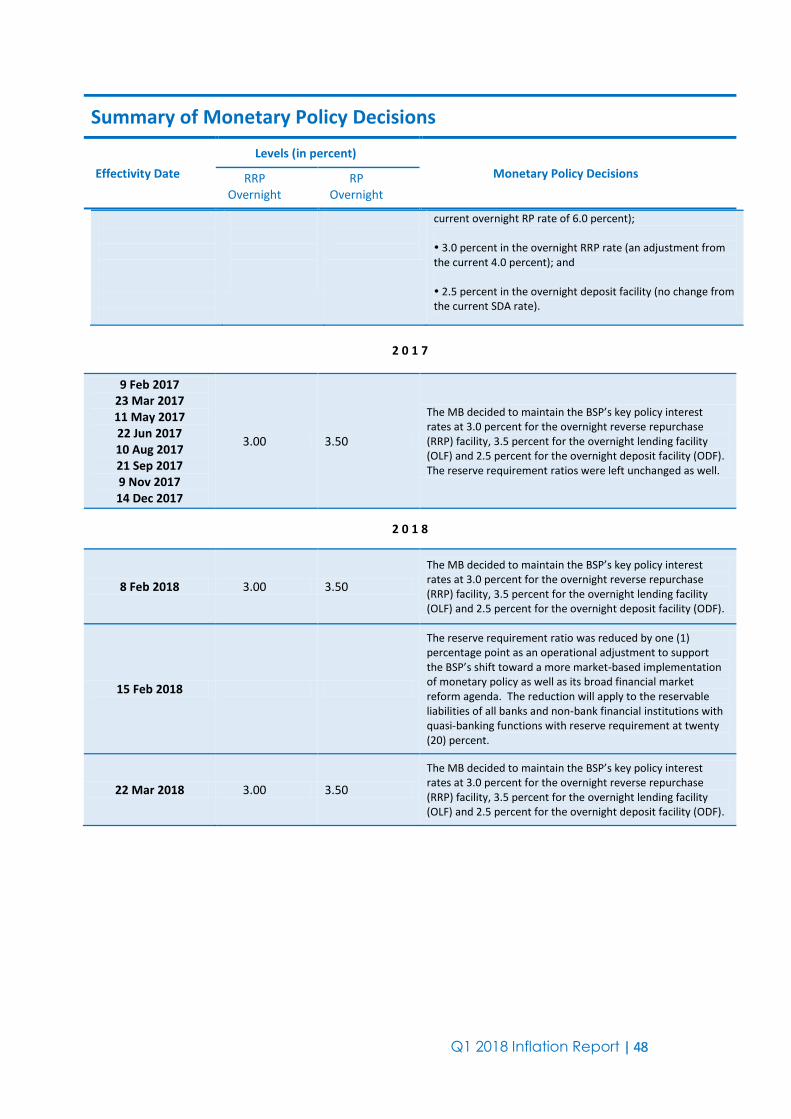
Q1 2018 Inflation Report | 48
Summary of Monetary Policy Decisions
Effectivity Date
Levels (in percent)
Monetary Policy Decisions RRP Overnight
RP Overnight
current overnight RP rate of 6.0 percent); 3.0 percent in the overnight RRP rate (an adjustment from the current 4.0 percent); and 2.5 percent in the overnight deposit facility (no change from the current SDA rate).
2 0 1 7
9 Feb 2017 23 Mar 2017 11 May 2017 22 Jun 2017 10 Aug 2017 21 Sep 2017 9 Nov 2017 14 Dec 2017
3.00 3.50
The MB decided to maintain the BSP’s key policy interest rates at 3.0 percent for the overnight reverse repurchase (RRP) facility, 3.5 percent for the overnight lending facility (OLF) and 2.5 percent for the overnight deposit facility (ODF). The reserve requirement ratios were left unchanged as well.
2 0 1 8
8 Feb 2018 3.00 3.50
The MB decided to maintain the BSP’s key policy interest rates at 3.0 percent for the overnight reverse repurchase (RRP) facility, 3.5 percent for the overnight lending facility (OLF) and 2.5 percent for the overnight deposit facility (ODF).
15 Feb 2018
The reserve requirement ratio was reduced by one (1) percentage point as an operational adjustment to support the BSP’s shift toward a more market-based implementation of monetary policy as well as its broad financial market reform agenda. The reduction will apply to the reservable liabilities of all banks and non-bank financial institutions with quasi-banking functions with reserve requirement at twenty (20) percent.
22 Mar 2018 3.00 3.50
The MB decided to maintain the BSP’s key policy interest rates at 3.0 percent for the overnight reverse repurchase (RRP) facility, 3.5 percent for the overnight lending facility (OLF) and 2.5 percent for the overnight deposit facility (ODF).
Q1 2018 Inflation Report | 49
The BSP Inflation Report is published every quarter by the Bangko Sentral ng Pilipinas. The report is available as a complete document in pdf format, together with other general information about inflation targeting and the monetary policy of the BSP, on the BSP’s website:
www.bsp.gov.ph/monetary/inflation.asp If you wish to receive an electronic copy of the latest BSP Inflation Report, please send an e-mail to [email protected]. The BSP also welcomes feedback from readers on the contents of the Inflation Report as well as suggestions on how to improve the presentation. Please send comments and suggestions to the following addresses:
By post: BSP Inflation Report
c/o Department of Economic Research Bangko Sentral ng Pilipinas
A. Mabini Street, Malate, Manila Philippines 1004
By e-mail: [email protected]