Embed Size (px)
Citation preview

ISSN 1655-5104
INFLATIONREPORT
Q22018
i
The primary objective of monetary policy is to promote a low and stable rate of inflation conducive to
a balanced and sustainable economic growth. The adoption in January 2002 of the inflation targeting
framework for monetary policy was aimed at helping to fulfill this objective.
One of the key features of inflation targeting is greater transparency, which means greater disclosure and
communication by the BSP of its policy actions and decisions. This Inflation Report is published by the BSP
as part of its transparency mechanisms under inflation targeting. The objectives of this Inflation Report
are: (i) to identify the risks to price stability and discuss their implications for monetary policy; and (ii) to
document the economic analysis behind the formulation of monetary policy and convey to the public the
overall thinking behind the BSP’s decisions on monetary policy. The broad aim is to make monetary policy
easier for the public to understand and enable them to better monitor the BSP’s commitment to the
inflation target, thereby helping both in anchoring inflation expectations and encouraging informed
debate on monetary policy issues.
The government’s target for annual headline inflation under the inflation targeting framework has been
set at 3.0 percent ± 1.0 percentage point (ppt) for 2018-2020 by the Development Budget Coordination
Committee (DBCC). This is consistent with the desired disinflation path over the medium term, favorable
trends in inflation dynamics, and expected higher capacity of the economy for growth under a low
inflation environment.
The report is published on a quarterly basis, presenting an analysis of the various factors affecting
inflation. These include recent price and cost developments, inflation expectations, prospects for
aggregate demand and output, labor market conditions, monetary and financial market conditions,
fiscal developments, and the international environment. An entire section is devoted to a discussion
of monetary policy developments in the most recent quarter, while a separate section provides a
comprehensive analysis of the BSP’s view of the inflation outlook for the policy horizon.
The Monetary Board approved this Inflation Report at its meeting on 12 July 2018.
Foreword
NESTOR A. ESPENILLA, JR.
Governor
ii
The BSP Mandate
The BSP’s main responsibility is to formulate and implement policy in the areas of money, banking and
credit, with the primary objective of maintaining stable prices conducive to a balanced and sustainable
economic growth in the Philippines. The BSP also aims to promote and preserve monetary stability and
the convertibility of the national currency.
Monetary Policy Instruments
The BSP’s primary monetary policy instrument is its overnight reverse repurchase (RRP) or borrowing rate.
Other instruments to implement the desired monetary policy stance to achieve the inflation target
include (a) increasing/decreasing the reserve requirement; (b) conducting auctions for the term deposit
facility (TDF);1 (c) adjusting the rediscount rate on loans extended to banking institutions on a short-term
basis against eligible collateral of banks’ borrowers; and (d) outright sales/purchases of the BSP’s holdings
of government securities.
Policy Target
The BSP’s target for monetary policy uses the Consumer Price Index (CPI) or headline inflation rate, which
is compiled and released to the public by the National Statistics Office (NSO). The policy target is set by
the Development Budget Coordination Committee (DBCC)2 in consultation with the BSP. The inflation
target for 2018-2020 is 3.0 percent ± 1.0 ppt.3
BSP’s Explanation Clauses
These are the predefined set of acceptable circumstances under which an inflation-targeting central bank
may fail to achieve its inflation target. These clauses reflect the fact that there are limits to the
effectiveness of monetary policy and that deviations from the inflation target may sometimes occur
because of factors beyond the control of the central bank. Under the inflation targeting framework of
the BSP, these exemptions include inflation pressures arising from: (a) volatility in the prices of
agricultural products; (b) natural calamities or events that affect a major part of the economy; (c) volatility
in the prices of oil products; and (d) significant government policy changes that directly affect prices such
as changes in the tax structure, incentives, and subsidies.
1
The TDF was introduced under the interest rate corridor system which was implemented on 3 June 2016. 2 The DBCC, created under Executive Order (E.O.) No. 232 dated 14 May 1970, is an inter-agency committee tasked primarily to
formulate the National Government's fiscal program. It is composed of the Office of the President (OP), Department of Budget
and Management (DBM), National Economic and Development Authority (NEDA), and the Department of Finance (DOF).
The BSP attends the Committee meetings as a resource agency. 3 During its meeting on 22 December 2017, the DBCC decided to keep the current inflation target at 3.0 percent ± 1.0 percentage
point for 2018 - 2020.
The Monetary Policy of the Bangko Sentral ng Pilipinas

iii
The Monetary Board
The powers and functions of the BSP, such as the conduct of monetary policy and the supervision over
the banking system, are exercised by its Monetary Board, which has seven members appointed by the
President of the Philippines. The Monetary Board holds eight (8) monetary policy meetings in a year to
review and decide on the stance of monetary policy.
Chairman & Governor
Nestor A. Espenilla, Jr.
Members
Carlos G. Dominguez III
Felipe M. Medalla
Juan D. De Zuñiga, Jr.
Peter B. Favila
Antonio S. Abacan, Jr.
V. Bruce J. Tolentino
The Advisory Committee
The Advisory Committee was established as an integral part of the institutional setting for inflation targeting.
It is tasked to deliberate, discuss, and make recommendations on monetary policy to the Monetary Board.
Like the Monetary Board, the Committee meets eight times a year but may also meet between regular
meetings, whenever deemed necessary.
Chairman
Nestor A. Espenilla, Jr.
Governor
Members
Diwa C. Guinigundo
Deputy Governor
Monetary and Economics Sector
Ma. Cyd Tuaño-Amador
Deputy Governor
Corporate Services Sector
Chuchi G. Fonacier
Deputy Governor
Financial Supervision Sector
Ma. Ramona GDT Santiago
Senior Assistant Governor
Financial Market Operations Sub-Sector
Johnny Noe E. Ravalo
Assistant Governor
Office of Systemic Risk Management
Francisco G. Dakila, Jr.
Assistant Governor
Monetary Policy Sub-sector

iv
Technical Staff
Chairman
Zeno Ronald R. Abenoja
Senior Director, Department of Economic Research
Members
Mary Jane T. Chiong
Managing Director, Office of the Governor
Lyn I. Javier
Managing Director, Financial Supervision Research and Consumer Protection Sub-sector
Veronica B. Bayangos
Director, Office of the Supervisory Policy Development
Lorelei S. Fernandez
Senior Director, Financial Market Operations Sub-Sector
Redentor Paolo M. Alegre, Jr.
Head, Department of Economic Statistics
Dennis D. Lapid
Deputy Director, Department of Economic Research
Dennis M. Bautista
Deputy Director, Department of Economic Research
Ma. Mediatriz M. Boelsch
Assistant Chief Dealer, Financial Market Operations Sub-Sector
Thea Josefina Natalia W. Santos
Deputy Director, Financial Supervision Sub-Sector 1
Lara Romina E. Ganapin
Bank Officer V, Department of Economic Research
Cherrie F. Ramos
Bank Officer V, Department of Economic Research
Jasmin E. Dacio
Bank Officer V, Department of Economic Research
Gabrielle Roanne L. Moral
Bank Officer V, Department of Economic Research
Eduard Joseph D. Robleza
Bank Officer V, Department of Economic Research
Jan Christopher G. Ocampo
Bank Officer V, Department of Economic Research
Marites B. Oliva
Bank Officer V, Center for Monetary and Financial Policy
Alvin Joshua P. Fama
Acting Bank Officer V, Office of Systemic Risk Management
Sol Elizah T. Roxas
Bank Officer VI, Provident Fund Office

v
2018 SCHEDULE OF MONETARY POLICY MEETINGS, INFLATION REPORT
PRESS CONFERENCE AND PUBLICATION OF MB HIGHLIGHTS
2018
Advisory
Committee (AC)
Meeting
Monetary Board
(MB) Meeting
MB Highlights
Publication
Inflation Report
(IR) Press
Conference
Jan 11 (Thu)
(14 Dec 2017 MB meeting) 19 (Fri)
(Q4 2017 IR)
Feb 2 (Fri)
(AC Meeting No. 1) 8 (Thu)
(MB Meeting No. 1)
Mar 16 (Fri)
(AC Meeting No. 2) 22 (Thu)
(MB Meeting No. 2) 8 (Thu)
(8 Feb 2018 MB meeting)
Apr 19 (Thu)
(22 Mar 2018 MB meeting)
20 (Fri)
(Q1 2018 IR)
May 4 (Fri)
(AC Meeting No. 3) 10 (Thu)
(MB Meeting No. 3)
Jun 15 (Fri)
1
(AC Meeting No. 4) 21 (Thu)
(MB Meeting No. 4) 7 (Thu)
(10 May 2018 MB meeting)
Jul 19 (Thu)
(21 Jun 2018 MB meeting) 20 (Fri)
(Q2 2018 IR)
Aug 3 (Fri)
(AC Meeting No. 5) 9 (Thu)
(MB Meeting No. 5)
Sep 21 (Fri)
(AC Meeting No. 6) 27 (Thu)
(MB Meeting No. 6) 6 (Thu)
(9 Aug 2018 MB meeting)
Oct 25 (Thu)
(27 Sep 2018 MB meeting) 19 (Fri)
(Q3 2018 IR)
Nov 9 (Fri)
(AC Meeting No. 7) 15 (Thu)
(MB Meeting No. 7)
Dec 7 (Fri)
(AC Meeting No. 8) 13 (Thu)
(MB Meeting No. 8) 6 (Thu)
(15 Nov 2018 MB meeting)
1 15 June 2018 (Friday) may be declared a national holiday in observance of Eidul Fitr. The National Commission on Muslim
Filipinos (NCMF) shall inform the Office of the President of the actual date on which the holiday shall fall. The approximate
dates shall be determined in accordance with the Islamic calendar (Hijra) or the lunar calendar, or upon Islamic astronomical
calculations, whichever is possible or convenient.

vi
List of Acronyms, Abbreviations, and Symbols
AL
BES
Auto Loans
Business Expectations Survey
NBQBs Non-Bank Financial Institutions with
Quasi-Banking Functions
BTr
CAMPI
Bureau of the Treasury
Chamber of Automotive Manufacturers of the
Philippines, Inc.
NEDA
NEER
NNPL
National Economic and Development Authority
Nominal Effective Exchange Rate
Net Non-Performing Loan
CAR Capital Adequacy Ratio NFA Net Foreign Assets; National Food Authority
CBD Central Business District NG National Government
CES Consumer Expectations Survey NGCP National Grid Corporation of the Philippines
CDS Credit Default Swaps NPC National Power Corporation
CI Confidence Index NPI Net Primary Income
COV Coefficient of Variation NPL Non-Performing Loan
CPI
DBCC
Consumer Price Index
Development Budget Coordination Committee
OECD Organization for Economic Cooperation and
Development
DOE
DI
Department of Energy
Diffusion Index
OPEC Organization of the Petroleum Exporting
Countries
DOF Department of Finance OF Overseas Filipinos
EIA US Energy Information Administration PMI Purchasing Managers’ Index
EM
EMBIG
Emerging Market
JP Morgan Emerging Market Bond Index Global
PSA Philippine Statistical Authority;
Power Supply Agreement
ERC
FCDA
Energy Regulatory Commission
Foreign Currency Differential Adjustment
PSALM Power Sector Assets and Liabilities
Management Corporation
GDP Gross Domestic Product PSEi Philippine Stock Exchange Composite Index
GNI Gross NationaI Income RBs Rural Banks
GNPL Gross Non-Performing Loan REER Real Effective Exchange Rate
GS Government Securities ROP Republic of the Philippines
IEA International Energy Agency RP Repurchase
IMF International Monetary Fund RR Reserve Requirement
IPP Independent Power Producer RRP Reverse Repurchase
IRI International Research Institute for Climate and
Society
RWA
SDA
Risk-Weighted Asset
Special Deposit Account
LFS
LPG
Labor Force Survey
Liquefied Petroleum Gas
SEM
SME
Single-Equation Model
Small and Medium Enterprise
LTFRB Land Transportation Franchising and SOSFM Society of Fellows in Supply Management, Inc.
Regulatory Board TB Thrift Banks
MB
MEM
Monetary Board
Multi-Equation Model
TLP
U/KBs
Total Loan Portfolio
Universal and Commercial Banks
MERALCO Manila Electric Company VAPI Value of Production Index
MISSI Monthly Integrated Survey of Selected VOPI Volume of Production Index
MTP
Industries
Major Trading Partner
WESM Wholesale Electricity Spot Market

vii
Contents
Overview ................................................................................................... viii
I. Inflation and Real Sector Developments .................................................... 1
Prices ................................................................................................................................. 1
Private Sector Economists’ Inflation Forecasts. ......................................................... 2
Energy prices. ............................................................................................................ 4
Box Article 1: Updated Core Inflation Measure for the Philippines Based on the 2012-Based
CPI ..................................................................................................................................... 6
Aggregate Demand and Supply ...................................................................................... 11
Aggregate Demand. ................................................................................................. 11
Other Demand Indicators. ....................................................................................... 13
Aggregate Supply. .................................................................................................... 21
Labor Market Conditions ................................................................................................ 23
II. Monetary and Financial Market Conditions .............................................. 25
Domestic Liquidity .......................................................................................................... 25
Box Article 2: Operational Refinements to the IRC System: Further Enhancing Monetary
Policy ............................................................................................................................... 26
Monetary Operations ..................................................................................................... 28
Credit Conditions ............................................................................................................ 28
Interest Rates .................................................................................................................. 30
Financial Market Conditions ........................................................................................... 32
Banking System ............................................................................................................... 34
Exchange Rate ................................................................................................................. 36
III. Fiscal Developments ............................................................................... 38
IV. External Developments .......................................................................... 39
V. Monetary Policy Developments ............................................................... 42
VI. Inflation Outlook .................................................................................... 43
BSP Inflation Forecasts.................................................................................................... 43
Risks to the Inflation Outlook ......................................................................................... 45
Implications for the Monetary Policy Stance .................................................................. 46
Summary of Monetary Policy Decisions ....................................................... 47
Summary of Monetary Policy Decisions ....................................................... 56
viii
Overview
Headline inflation increases further. Headline
inflation in Q2 2018 rose to 4.8 percent from the
quarter- and year-ago rates of 3.8 percent and
2.8 percent, respectively, using the 2012-based
Consumer Price Index (CPI) series. This brought
the year-to-date average inflation to 4.3 percent,
higher than the upper end of the National
Government’s (NG) announced target range of
3.0 percent ± 1.0 percentage point for the year.
Inflation pressures in Q2 came from both food and
non-food items. Food inflation registered an uptick
of 5.5 percent as food commodities such as corn,
vegetables, sugar, jam, honey, chocolate, and
confectionery posted higher prices. Likewise,
inflation for non-food items was at 3.4 percent as
prices for domestic petroleum products remained
elevated. Similarly, core inflation increased to
3.8 percent in Q2, higher than the quarter- and
year-ago rates of 3.0 percent and 2.5 percent,
respectively. The BSP’s alternative measures for
the weighted median, trimmed mean, and net of
volatile items measures were also higher at
3.0 percent (from 2.4 percent), 3.4 percent (from
2.5 percent), and 3.7 percent (from 2.8 percent),
respectively. The number of CPI items with
inflation rates greater than the threshold of
4.0 percent (the upper end of the 2018 inflation
target) rose further to 61 items in Q2 from
48 items in the previous quarter. Collectively,
these items accounted for 46.8 percent of the CPI
basket, higher than 22.3 percent in the previous
quarter.
Inflation expectations rise. The BSP’s survey of
private sector economists for June 2018 showed
that mean inflation forecasts for 2018-2020 were
higher relative to the results in March 2018.
Private sector economists’ average inflation
forecast for 2018 was at 4.5 percent, a rise from
4.1 percent in the previous survey. Mean inflation
forecasts for 2019 and 2020 likewise increased as
both were estimated at 3.8 percent from
3.7 percent and 3.6 percent, respectively, in the
previous survey round. Analysts noted that key
upside risks to inflation in 2018 include higher and
volatile global oil prices, weakening peso, effects
of the implementation of the TRAIN law on prices
of domestic goods; and rising global inflation,
among others. Similarly, results of the June 2018
Consensus Economics inflation forecast survey
showed that respondents expect 2018 average
inflation to increase to 4.4 percent from
4.0 percent in the March 2018 survey. Mean
inflation forecast for 2019 was also higher at
3.7 percent from 3.5 percent in the previous
month’s survey.
Domestic economy grows firmly. Real GDP
expanded by 6.8 percent in Q1 2018, higher than
6.5 percent registered a quarter- and year-ago.
The Q1 growth rate tracked closely the lower end
of the NG’s growth target of 7.0 - 8.0 percent for
2018. On the expenditure side, domestic activity
was stronger on account of the expansion in
capital formation and household consumption.
On the production side, output was supported
by the strong performance in the services and
industry sectors.
Q2 headline inflation rises
above the high end of target
range
In addition, high-frequency real sector indicators
suggested continued firm growth prospects in the
near term. The composite Purchasing Managers’
Index as of April 2018 remained above the
50-point expansion threshold, indicating upbeat
prospects in the months ahead. Similarly,
consumer sentiment improved while business
confidence remained positive for the current and
next quarter. In contrast, vehicle sales contracted
as the imposition of higher excise taxes on
automobiles induced buyers toward earlier
acquisition of units.
Global economy continues to improve. The
JP Morgan Global All-Industry Output Index
continued to suggest strong economic
improvement in the months ahead, owing to
faster rates of expansion in key economies.
In the US, Q1 2018 real GDP grew at a higher rate
of 2.8 percent. Consequently, inflation increased
slightly due mainly to higher inflation for energy
and shelter. Similarly, manufacturing PMI
indicated faster expansion amid robust demand.
In the euro area, Q1 2018 growth remained
broadly steady as inflation rose on price increases
in services, energy and food. The euro composite
PMI also remained steady in the expansion
territory. In China, growth remained robust in
Q1 2018, driven mainly by the services industry
and manufacturing, as inflation remained

ix
unchanged. At the same time, the seasonally
adjusted manufacturing PMI was broadly
unchanged. In contrast, Japan’s real GDP grew at
a slower rate in Q1 2018, attributed to the lower
growth in both private and public demand.
Inflation increased marginally. Nevertheless, the
seasonally adjusted manufacturing PMI remained
firmly in the expansion territory.
Domestic financial system remains resilient amid
uncertainty. Uncertainty in the external
environment coming from the continuing policy
normalization in the US, trade tensions between
key economies, as well as in the domestic front
such as the current account deficit, higher inflation
and a depreciating peso contributed to pressure
on the resilience of the Philippine financial system
despite the strong Q1 GDP outturn. The Philippine
Stock Exchange index retreated by 11.1 percent,
quarter-on-quarter, to average 7,623.21 index
points during the review quarter. Similarly,
sovereign debt spreads widened mainly on
external developments as the peso continued to
depreciate, averaging P52.45/US$1 during the
review quarter. Nevertheless, investor demand
for government securities remained healthy as
evidenced by oversubscriptions to the Bureau
of the Treasury’s regular auctions of T-bills and
T-bonds, and issuance of the Retail Treasury
Bonds. In addition, the banking system saw
continued increases in total assets, lending, and
deposits, while capital adequacy ratios remained
comfortably above the BSP’s prescribed levels and
international norms. Meanwhile, based on the
latest round of the BSP survey on senior bank loan
officers, bank lending standards for loans to both
enterprises and households were broadly
unchanged in Q2 2018, indicating a stable supply
of credit.
The BSP raises key policy rates in Q2 2018. At its
monetary policy meeting on 10 May, the BSP
raised its policy rate by 25 basis points to
3.25 percent for the overnight reverse repurchase
or RRP facility. In the 20 June meeting, the BSP
decided to hike the policy rate by another 25 basis
points to 3.50 percent as a follow-through action.
In deciding to raise the key policy interest rate
twice during the review quarter, the BSP noted
that inflation expectations remained elevated for
2018 and that the risk of possible second-round
effects from ongoing price pressures argued for
follow-through monetary policy action.
Although inflation expectations remain within the
target range for 2019, elevated expectations for
2018 highlight the risk posed by sustained price
pressures on future wage and price outcomes.
Increased inflation
expectations, risk of
second-hand effects call
for monetary policy response
The sum of new information during the quarter
suggests appropriateness of monetary policy
response. Latest baseline forecasts using the
2012-based CPI series show that inflation could
average above the target range for 2018 and
revert back to the target range by 2019. Risks to
the inflation outlook remain on the upside.
Additional wage adjustments and transport fare
hikes due to higher excise taxes on petroleum
products and other key commodities, and
faster-than-expected monetary policy
normalization in the US are among the main
upside risks to future inflation. Meanwhile, slower
global economic growth and the proposed reform
in the rice industry are the main downside risks to
inflation.
With higher baseline inflation projections and the
balance of risks skewing to the upside, an increase
in policy rates was seen to be appropriate. Policy
rate actions also serve to stem the build-up in
inflation expectations and possible second-round
effects from ongoing cost-push price pressures.
Nevertheless, there is also increased optimism on
the passage of the proposed rice tariffication bill
which should result in downward pressure on food
prices and help curb inflation expectations in the
near-term. Meanwhile, prospects for aggregate
demand are expected to remain solid, suggesting
that the economy as a whole will be able to
sustain its momentum. Social mitigating measures
by the National Government could also likely
provide a stabilizing influence on inflation
expectations in the near term while allowing
sufficient time for the economy to adjust to the
recent monetary actions. The BSP continues to
emphasize its vigilance and readiness for
follow-through action as necessary to safeguard
the BSP’s inflation objective.
Q2 2018 Inflation Report | | | | 1111
I. Inflation and Real Sector Developments
Prices
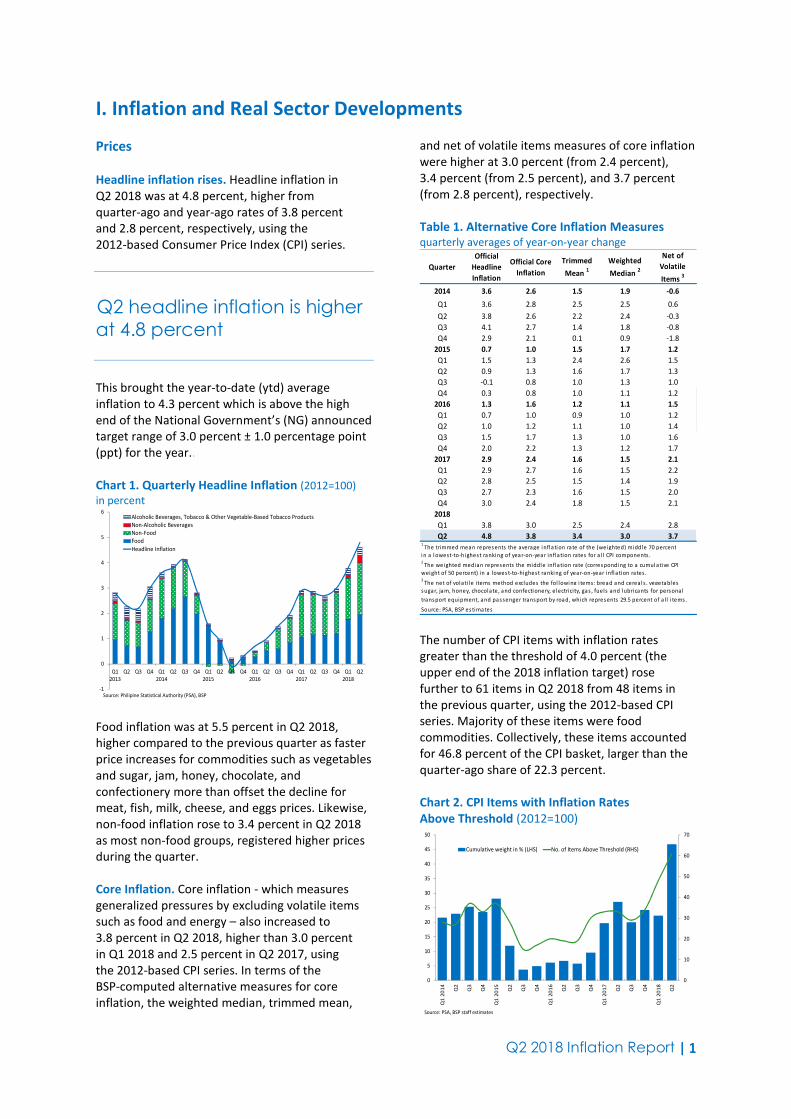
Headline inflation rises. Headline inflation in
Q2 2018 was at 4.8 percent, higher from
quarter-ago and year-ago rates of 3.8 percent
and 2.8 percent, respectively, using the
2012-based Consumer Price Index (CPI) series.
Q2 headline inflation is higher
at 4.8 percent
This brought the year-to-date (ytd) average
inflation to 4.3 percent which is above the high
end of the National Government’s (NG) announced
target range of 3.0 percent ± 1.0 percentage point
(ppt) for the year..
Chart 1. Quarterly Headline Inflation (2012=100)
in percent
-1
0
1
2
3
4
5
6
Q1
2013
Q2 Q3 Q4 Q1
2014
Q2 Q3 Q4 Q1
2015
Q2 Q3 Q4 Q1
2016
Q2 Q3 Q4 Q1
2017
Q2 Q3 Q4 Q1
2018
Q2
Alcoholic Beverages, Tobacco & Other Vegetable-Based Tobacco Products
Non-Alcoholic Beverages
Non-Food
Food
Headline Inflation
Source: Philipine Statistical Authority (PSA), BSP
Food inflation was at 5.5 percent in Q2 2018,
higher compared to the previous quarter as faster
price increases for commodities such as vegetables
and sugar, jam, honey, chocolate, and
confectionery more than offset the decline for
meat, fish, milk, cheese, and eggs prices. Likewise,
non-food inflation rose to 3.4 percent in Q2 2018
as most non-food groups, registered higher prices
during the quarter.
Core Inflation. Core inflation - which measures
generalized pressures by excluding volatile items
such as food and energy – also increased to
3.8 percent in Q2 2018, higher than 3.0 percent
in Q1 2018 and 2.5 percent in Q2 2017, using
the 2012-based CPI series. In terms of the
BSP-computed alternative measures for core
inflation, the weighted median, trimmed mean,
and net of volatile items measures of core inflation
were higher at 3.0 percent (from 2.4 percent),
3.4 percent (from 2.5 percent), and 3.7 percent
(from 2.8 percent), respectively.
Table 1. Alternative Core Inflation Measures
quarterly averages of year-on-year change
Quarter
Official
Headline
Inflation
Official Core
Inflation
Trimmed
Mean 1
Weighted
Median 2
Net of
Volatile
Items 3
2014 3.6 2.6 1.5 1.9 -0.6
Q1 3.6 2.8 2.5 2.5 0.6
Q2 3.8 2.6 2.2 2.4 -0.3
Q3 4.1 2.7 1.4 1.8 -0.8
Q4 2.9 2.1 0.1 0.9 -1.8
2015 0.7 1.0 1.5 1.7 1.2
Q1 1.5 1.3 2.4 2.6 1.5
Q2 0.9 1.3 1.6 1.7 1.3
Q3 -0.1 0.8 1.0 1.3 1.0
Q4 0.3 0.8 1.0 1.1 1.2
2016 1.3 1.6 1.2 1.1 1.5
Q1 0.7 1.0 0.9 1.0 1.2
Q2 1.0 1.2 1.1 1.0 1.4
Q3 1.5 1.7 1.3 1.0 1.6
Q4 2.0 2.2 1.3 1.2 1.7
2017 2.9 2.4 1.6 1.5 2.1
Q1 2.9 2.7 1.6 1.5 2.2
Q2 2.8 2.5 1.5 1.4 1.9
Q3 2.7 2.3 1.6 1.5 2.0
Q4 3.0 2.4 1.8 1.5 2.1
2018 3.7 3.0 3.0 2.7 3.3
Q1 3.8 3.0 2.5 2.4 2.8
Q2 4.8 3.8 3.4 3.0 3.71
The trimmed mean repres ents the average i nfl ati on rate of the (weighted) mi ddl e 70 percent
i n a l owest-to-hi ghes t ranking of year-on-year inflation rates for a l l CPI components .2
The weighted median repres ents the middl e inflation rate (corres pondi ng to a cumul ati ve CPI
wei ght of 50 percent) in a lowes t-to-highest ranki ng of year-on-year i nfl ati on rates .3
The net of volati l e i tems method excludes the fol lowi ng i tems: bread and cerea l s, vegetabl es
s ugar, jam, honey, chocolate, and confecti onery, electricity, gas , fuels and l ubri cants for pers ona l
trans port equipment, and pas senger trans port by road, which repres ents 29.5 percent of a l l i tems .
Source: PSA, BSP es timates
The number of CPI items with inflation rates
greater than the threshold of 4.0 percent (the
upper end of the 2018 inflation target) rose
further to 61 items in Q2 2018 from 48 items in
the previous quarter, using the 2012-based CPI
series. Majority of these items were food
commodities. Collectively, these items accounted
for 46.8 percent of the CPI basket, larger than the
quarter-ago share of 22.3 percent.
Chart 2. CPI Items with Inflation Rates
Above Threshold (2012=100)
0
10
20
30
40
50
60
70
0
5
10
15
20
25
30
35
40
45
50
Q1
20
14
Q2
Q3
Q4
Q1
20
15
Q2
Q3
Q4
Q1
20
16
Q2
Q3
Q4
Q1
20
17
Q2
Q3
Q4
Q1
20
18
Q2
Cumulative weight in % (LHS) No. of Items Above Threshold (RHS)
Source: PSA, BSP staff estimates
Q2 2018 Inflation Report | | | | 2222
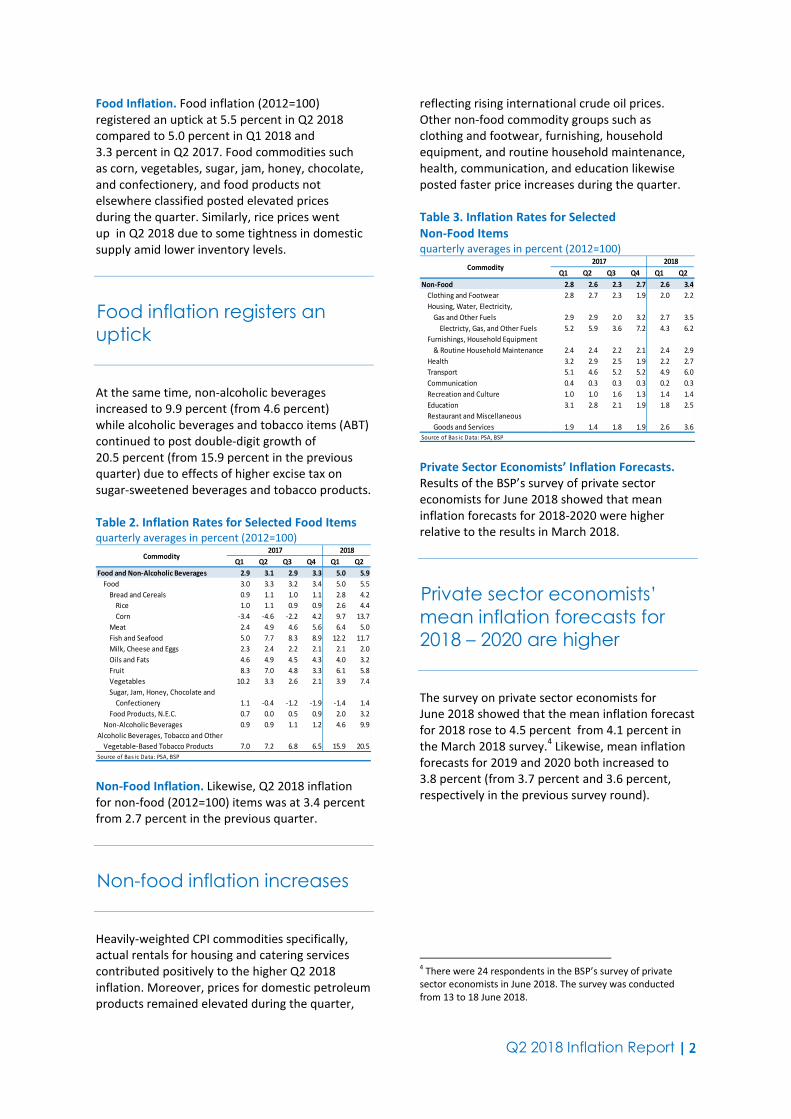
Food Inflation. Food inflation (2012=100)
registered an uptick at 5.5 percent in Q2 2018
compared to 5.0 percent in Q1 2018 and
3.3 percent in Q2 2017. Food commodities such
as corn, vegetables, sugar, jam, honey, chocolate,
and confectionery, and food products not
elsewhere classified posted elevated prices
during the quarter. Similarly, rice prices went
up in Q2 2018 due to some tightness in domestic
supply amid lower inventory levels.
Food inflation registers an
uptick
At the same time, non-alcoholic beverages
increased to 9.9 percent (from 4.6 percent)
while alcoholic beverages and tobacco items (ABT)
continued to post double-digit growth of
20.5 percent (from 15.9 percent in the previous
quarter) due to effects of higher excise tax on
sugar-sweetened beverages and tobacco products.
Table 2. Inflation Rates for Selected Food Items
quarterly averages in percent (2012=100)
Q1 Q2 Q3 Q4 Q1 Q2
Food and Non-Alcoholic Beverages 2.9 3.1 2.9 3.3 5.0 5.9
Food 3.0 3.3 3.2 3.4 5.0 5.5
Bread and Cereals 0.9 1.1 1.0 1.1 2.8 4.2
Rice 1.0 1.1 0.9 0.9 2.6 4.4
Corn -3.4 -4.6 -2.2 4.2 9.7 13.7
Meat 2.4 4.9 4.6 5.6 6.4 5.0
Fish and Seafood 5.0 7.7 8.3 8.9 12.2 11.7
Milk, Cheese and Eggs 2.3 2.4 2.2 2.1 2.1 2.0
Oils and Fats 4.6 4.9 4.5 4.3 4.0 3.2
Fruit 8.3 7.0 4.8 3.3 6.1 5.8
Vegetables 10.2 3.3 2.6 2.1 3.9 7.4
Sugar, Jam, Honey, Chocolate and
Confectionery 1.1 -0.4 -1.2 -1.9 -1.4 1.4
Food Products, N.E.C. 0.7 0.0 0.5 0.9 2.0 3.2
Non-Alcoholic Beverages 0.9 0.9 1.1 1.2 4.6 9.9
Alcoholic Beverages, Tobacco and Other
Vegetable-Based Tobacco Products 7.0 7.2 6.8 6.5 15.9 20.5
2017 2018
Source of Bas ic Data: PSA, BSP
Commodity
Non-Food Inflation. Likewise, Q2 2018 inflation
for non-food (2012=100) items was at 3.4 percent
from 2.7 percent in the previous quarter.
Non-food inflation increases
Heavily-weighted CPI commodities specifically,
actual rentals for housing and catering services
contributed positively to the higher Q2 2018
inflation. Moreover, prices for domestic petroleum
products remained elevated during the quarter,
reflecting rising international crude oil prices.
Other non-food commodity groups such as
clothing and footwear, furnishing, household
equipment, and routine household maintenance,
health, communication, and education likewise
posted faster price increases during the quarter.
Table 3. Inflation Rates for Selected
Non-Food Items
quarterly averages in percent (2012=100)
Q1 Q2 Q3 Q4 Q1 Q2
Non-Food 2.8 2.6 2.3 2.7 2.6 3.4
Clothing and Footwear 2.8 2.7 2.3 1.9 2.0 2.2
Housing, Water, Electricity,
Gas and Other Fuels 2.9 2.9 2.0 3.2 2.7 3.5
Electricty, Gas, and Other Fuels 5.2 5.9 3.6 7.2 4.3 6.2
Furnishings, Household Equipment
& Routine Household Maintenance 2.4 2.4 2.2 2.1 2.4 2.9
Health 3.2 2.9 2.5 1.9 2.2 2.7
Transport 5.1 4.6 5.2 5.2 4.9 6.0
Communication 0.4 0.3 0.3 0.3 0.2 0.3
Recreation and Culture 1.0 1.0 1.6 1.3 1.4 1.4
Education 3.1 2.8 2.1 1.9 1.8 2.5
Restaurant and Miscellaneous
Goods and Services 1.9 1.4 1.8 1.9 2.6 3.6
Source of Bas ic Data: PSA, BSP
Commodity2017 2018
Private Sector Economists’ Inflation Forecasts.
Results of the BSP’s survey of private sector
economists for June 2018 showed that mean
inflation forecasts for 2018-2020 were higher
relative to the results in March 2018.
Private sector economists’
mean inflation forecasts for
2018 – 2020 are higher
The survey on private sector economists for
June 2018 showed that the mean inflation forecast
for 2018 rose to 4.5 percent from 4.1 percent in
the March 2018 survey.4 Likewise, mean inflation
forecasts for 2019 and 2020 both increased to
3.8 percent (from 3.7 percent and 3.6 percent,
respectively in the previous survey round).
4 There were 24 respondents in the BSP’s survey of private
sector economists in June 2018. The survey was conducted
from 13 to 18 June 2018.

Q2 2018 Inflation Report | | | | 3333
Chart 3. BSP Private Sector Economists’ Survey*
mean forecast for full year; in percent
January 2016 to February 2018 (2006=100)
March 2018 to June 2018 (2012=100)
1
2
3
4
5
Jan
20
16
Fe
b
Ma
r
Ap
r
Ma
y
Jun
Jul
Au
g
Se
p
Oct
No
v
De
c
Jan
20
17
Fe
b
Ma
r
Ap
r
Ma
y
Jun
Jul
Au
g
Se
p
Oct
No
v
De
c
Jan
20
18
Fe
b
Ma
r
Ap
r
Ma
y
Jun
2018 2019 2020
*Based on forecasts provided by 24 out of 30 respondents.
Source: BSP
4.5 3.8 3.8
Analysts noted that risks to inflation in 2018
remain tilted to the upside. Possible upside risks
to inflation are the higher and volatile global
oil prices; weakening peso; effects of the
implementation of R.A. 10963 or the Tax Reform
for Acceleration and Inclusion (TRAIN) law on the
prices of domestic goods; higher government
spending on infrastructure; potential rise in wages;
adverse weather conditions; higher utility rates;
and the rising global inflation. The key downside
risk to inflation was seen to emanate from the
removal of quantitative restrictions on rice
importation which could reduce domestic rice
prices.
Table 4. Private Sector Forecasts for Inflation
annual percentage change; June 2018 (2012=100) 2019 2020
Q3 Q4 FY FY FY
1) Al-Amanah Islamic Bank 4.50 4.30 4.20 4.00 3.50
2) Asia ING 4.20 4.10 4.30 3.80 3.60
3) Banco de Oro 4.80 4.10 4.50 3.80 -
4) Bangkok Bank 4.70 4.80 4.60 4.80 5.00
5) Bank of Commerce 4.86 4.50 4.46 - -
6) Bank of China Ltd. 4.70 4.80 4.60 4.50 4.40
7) Barclays 4.50 4.30 4.30 3.80 -
8) Citibank 5.30 4.80 4.70 3.10 3.10
9) Chinabank 4.60 4.20 4.20 3.80 3.80
10) CTBC Bank 4.50 4.30 4.30 4.00 3.80
11) Credit Suisse 4.80 4.60 4.50 3.70 3.60
12) Deutsche Bank - - 4.70 4.20 -
13) Korea Exchange Bank 4.13 4.13 4.03 3.83 3.83
14) Maybank 4.63 4.50 4.40 4.05 4.20
15) Maybank-ATR KimEng 4.50 4.10 4.20 3.80 3.10
16) Metrobank - - 4.50 3.40 -
17) Mizuho 4.30 4.00 4.30 - -
18) Nomura 5.10 4.70 4.60 3.50 -
19) Robinsons Bank 4.70 4.40 4.40 3.50 2.80
20) Philippine Equity Partners 5.10 4.90 4.60 3.40 -
21) Security Bank 5.30 5.10 4.70 3.30 3.40
22) Standard Chartered 5.10 6.00 5.20 4.90 4.20
23) Union Bank of the Phils. 4.90 4.70 4.80 3.60 4.00
24) UBS 4.90 4.70 4.60 3.80 -
Median Forecast 4.7 4.5 4.5 3.8 3.8
Mean Forecast 4.7 4.5 4.5 3.8 3.8
High 5.3 6.0 5.2 4.9 5.0
Low 4.1 4.0 4.0 3.1 2.8
Number of Observations 22 22 24 22 15
Government Target 3.0±1.00 3.0±1.00 3.0±1.00 3.0±1.00 3.0±1.00
2018
Source: BSP
Meanwhile, inflation is anticipated to moderate,
stabilize, and settle within the 2-4 percent target
range in 2019 to 2020 as TRAIN’s inflationary
impact tapers off.
Based on the probability distribution of the
forecasts provided by 20 out of 24 respondents,
there is a 16.6-percent probability that average
inflation for 2018 will settle between the
2-4 percent range, while there was an
82.8-percent chance that inflation will rise
beyond 4 percent. For 2019, the respondents
assigned a 60.8-percent probability that inflation
will fall within the 2-4 percent target range.
Chart 4. Probability Distribution for Analysts’
Inflation Forecasts* (2018-2020)
0
10
20
30
40
50
60
70
80
90
100
<1 1.0 – 1.99 2.0 – 3.0 3.1 – 4.0 4.1 – 5.0 5.1 – 6.0 6.1 – 7.0
2018 2019 2020
*Probability distributions were averages of those provided by 20 out of 24 respondents. Source: BSP June 2018 Survey
Results of the June 2018 Consensus Economics
inflation forecast survey for the Philippines
showed that respondents expect 2018 inflation
to increase to 4.4 percent from 4 percent in
the March 2018 survey.5 Similarly, mean inflation
forecast for 2019 was higher at 3.7 percent from
3.5 percent in the previous month’s survey.
Based on the Q2 2018 BSP Business Expectations
Survey (BES), a higher number of respondents
expected inflation to increase in the current
quarter relative to the previous quarter (from a
diffusion index of 61.3 percent to 63.5 percent).
Businesses expect within-
target inflation; consumers
expect a breach in the upper
end of target range
5 There were 16 respondents in the Consensus Economics’
survey in June 2018.

Q2 2018 Inflation Report | | | | 4444
By contrast, the number of respondents that
expect inflation to increase in the next quarter
went down (from 49.2 percent to 47.1 percent).
Businesses expect the rate of increase in consumer
prices to stay within the 2 to 4 percent BSP
inflation target range in Q2 and Q3 2018
both at 3.8 percent.
Meanwhile, results of the Consumer Expectations
Survey (CES) for Q2 2018 indicated that consumers
expect inflation to breach the upper end of the
governments’s target range of 2-4 percent in the
next 12 months at 4.2 percent. This is lower than
the 4.7 percent expected inflation rate in the Q1
2018 survey.
Energy prices. The average spot price of Dubai
crude oil rose by 12.9 percent in Q2 2018
compared to the previous quarter over
geopolitical risks concerning Iran and Venezuela.
Oil prices remain elevated on
geopolitical tensions
Dubai crude oil prices increased significantly in
Q2 2018 due to geopolitical tensions between
the United States and selected key oil producers
namely, Iran and Venezuela. In May 2018, the
US announced its withdrawal from the Joint
Comprehensive Plan of Action (JCPOA) and
sanctioned companies doing business with Iran.
At the same time, declining oil production from
Venezuela also contributed to the price increase.
Nevertheless, there are other factors exerting
downward pressure on oil prices namely,
announcements from major producers like
Saudi Arabia and Russia that it would evaluate
possibly increasing production given output
declines from Venezuela and uncertatinty
surrounding Iran production. In late June 2018,
the Organization of the Petroleum Exporting
Countries (OPEC) and non-OPEC Ministerial
Meeting reaffirmed their commitment to the
required level of conformity and agreed to
voluntarily adjust its compliance to 100 percent
for the second half of 2018. This is in light of the
147-percent compliance rate in May 2018
based on OPEC data.6
6 Source: “The 4
th OPEC and non-OPEC Ministerial Meeting
concludes” Press Release No 14/2018, 23 June 2018, URL:
http://www.opec.org/opec_web/en/press_room/5081.htm
Rising US crude oil production is also a downside
risk to oil prices as US Energy Information
Administration (EIA) expects US output to exceed
10 million barrels per day (mb/d) in 2018-2019.7
Likewise, demand concerns stemming from
possible trade war between the US and China has
also led to price declines during the quarter.
Chart 5. Spot and Estimated Prices
of Dubai Crude Oil
20
40
60
80
100
120
140
Q1
20
13
Q2
Q3
Q4
Q1
20
14
Q2
Q3
Q4
Q1
20
15
Q2
Q3
Q4
Q1
20
16
Q2
Q3
Q4
Q1
20
17
Q2
Q3
Q4
Q1
20
18
Q2
Q3
Q4
Q1
20
19
Q2
Q3
Q4
Q1
20
20
Q2
Q3
Q4
Q1
20
21
Q2
Q3
Q4
*Futures prices derived using Brent crude futures
Source: Bloomberg, BSP
28 June 2018
29 March 2018
Estimated futures prices of Dubai crude oil as of
end-June 2018,8 which are based on movements
of Brent crude oil, showed a higher path for 2018
to 2021 compared to the estimates in the previous
quarter.9
In terms of supply-demand outlook10
, the US EIA
expects demand to outstrip supply in 2018 before
reverting to surplus in 2019. Projections for global
oil production was adjusted downwards for both
2018 and 2019 due largely to OPEC while demand
forecast was unchanged relative to the previous
month’s (May 2018) report.11
7 US EIA Short-Term Energy Outlook (June 2018), URL:
https://www.eia.gov/outlooks/steo/pdf/steo_text.pdf 8 Future prices using Brent crude futures data. Taken as of
28 June 2018. 9 Future prices derived using Brent crude futures data. Taken as
of 29 March 2018. Source: BSP-staff calculations, Bloomberg. 10
Using US EIA forecast of International Petroleum and Other
Liquids Balance, Short-Term Energy Outlook (June 2018) 11
Source: US EIA Short-Term Energy Outlook (June 2018).
Forecast Comparisons: International Crude Oil and Liquid Fuels.
https://www.eia.gov/outlooks/steo/pdf/ compare.pdf

Q2 2018 Inflation Report | | | | 5555
Table 5. Actual Adjustments in Domestic Oil
Prices (average prices of Caltex, Petron and Shell)
NumberAmount
(P/liter)Number
Amount
(P/liter)Number
Amount
(P/liter)
Gasoline 13 17.27 12 -11.37 1 5.90
Kerosene 17 15.55 8 -6.89 9 8.66
Diesel 15 21.30 10 -13.85 5 7.45
LPG 4 3.74 3 -2.90 1 0.84
Source: Department of Energy (DOE)
Domestic
Oil
Products
Year-to-Date (June 2018)
Increase Decrease Net Adjustments
On a cumulative basis, net adjustments of
domestic petroleum prices remained positive in
the first half of 2018. Net adjustment of gasoline,
kerosene, and diesel went up by P5.90 per liter,
P8.66 per liter, and P7.45 per liter, respectively.
Likewise, LPG prices increased slightly by P0.84 per
liter in end-June compared to the end-2017 level.
Power. For Q2 2018, the overall electricity rate in
the Meralco franchised area increased by around
P0.64 per kilowatt hour (kWh) to P10.14 per kWh
(from P9.50 per kWh in Q1 2017). The upward
adjustment was due mainly to increases in
generation charge.
Electricity prices increase on
upward adjustment in
generation charge
The adjustment in the generation cost in Q2 2018,
on average, increased by P0.49 per kWh to
P5.17 per kWh (from P4.68 per kWh in Q1 2018).
The upward adjustment in the generation cost in
Q2 2018 was primarily due to higher generation
charge from the Wholesale Electricity Spot Market
(WESM). The higher charge from the WESM was
due to tighter supply conditions in the Luzon grid.
With warmer temperature, demand for power in
the Luzon grid increased by about 357 megawatts
(MW) and 239 MW in April and June, respectively.
Chart 6. Meralco’s Generation Charge
PhP/kWh; year-on-year growth rates in percent
-40
-30
-20
-10
0
10
20
30
40
50
0
1
2
3
4
5
6
7
8
9
Q1
20
13
Q2
Q3
Q4
Q1
20
14
Q2
Q3
Q4
Q1
20
15
Q2
Q3
Q4
Q1
20
16
Q2
Q3
Q4
Q1
20
17
Q2
Q3
Q4
Q1
20
18
Q2
Generation Charge (PhP/kWh) (LHS)
Generation Charge (year-on-year growth rates in percent) (RHS)
Source: Meralco
There are potential sources of upside pressures
on electricity charges. Meralco has existing
petitions for rate increases with ERC which include
the petition to implement the Maximum Average
Price for 2012, 2013, 2014, and 2015, amended
application for a rate increase in the January 2014
billing (consisting of incremental fuel costs and
deferred generation cost to be collected monthly
for six months); and petitions for the refund of
generation over/under recovery (GOUR),
transmission over/under recovery (TOUR),
system loss over/under recovery (SLOUR), and
lifeline subsidy over/under recovery (LSOUR) for
the period January-December 2011.
In addition, the Power Sector Assets and Liabilities
Management (PSALM) has several pending
petitions with ERC for the recovery of True-Up
Adjustments of Fuel and Purchased Power Costs
(TAFPPC), Foreign Exchange Related Costs (TAFxA)
and Purchased Power Costs and Foreign Exchange
Related Costs by the National Power Corporation
(NPC), and NPC’s Stranded Debt portion of the
universal charge. Likewise, the National Grid
Corporation of the Philippines (NGCP) also filed
several petitions to recover connection charges
and residual sub-transmission charges for
2011-2013 and the costs of repair on damages
caused by force majeure events such as
earthquake, flooding, landslides, and lightning
incidents in 2011-2012.
Q2 2018 Inflation Report | | | | 6666
Box Article 1: Updated Core Inflation Measure for the Philippines Based on the 2012-Based CPI
I. Background
Core inflation, a widely used measure of the underlying trend in the average consumer prices, is a measure
of inflation that aims to capture the permanent component of the inflationary process that can be
influenced by monetary policy. It is often used as a complementary indicator to what is known as “headline”
or consumer price index (CPI) inflation. While the headline inflation measures the rate of change in the CPI,
a measure of the average price of a standard “basket” of goods and services consumed by a typical family,
core inflation measures the change in average consumer prices after excluding from the CPI certain items
with volatile price movements. By stripping out the volatile components of the CPI, core inflation allows us
to see the broad underlying trend in consumer prices. Core inflation is often used as an indicator of the
long-term inflation trend and as an indicator of future inflation.
The Philippine Statistics Authority (PSA) started releasing the consumer price index (CPI) series with 2012
as the new base year starting on 6 March 2018. The release of the rebased CPI series prompted a review of
the official core inflation measure for the Philippines, pursuant to PSA Board Resolution No. 01, Series of
2017-096.12
The said PSA Board Resolution (previously referred to as National Statistical Coordination Board
Resolution No. 6 Series of 2003) approved the use of exclusion method for the computation of the official
definition of core inflation in the Philippines.
The exclusion method simply excludes a fixed, pre-specified list of volatile CPI components (typically food
and energy items) whose short-term behavior tends to diverge from that of the underlying price trend.
Based on the description of the exclusion method, core inflation for the Philippines is officially defined as the
year-on-year rate of change of the monthly headline CPI after excluding food and energy items. The list of
excluded items from the official core inflation measure is a result of discussions among members of the
Interagency Committee on Price Statistics (IACPS).13
Following the approval by the PSA Board of the list of excluded items from the core inflation using
2012-based CPI series during its meeting on 9 May 2018, the PSA has started publishing the official core
inflation series with 2012 as base year on 5 June 2018, alongside the release of the monthly headline CPI.
II. Updated Core Inflation using 2012-based CPI Series
Consistent with previous practice in the review of official core inflation measure (whenever the CPI is
rebased), the list of excluded items from the 2012-based official core inflation measure was a result of
interagency technical discussions among the members of the IACPS during its meeting on 30 April 2018.14
Subsequently, the said list of excluded items was presented to and approved by the PSA Board on 9 May
2018.
The determination of items to exclude from the 2012-based CPI data followed the same methodology used
in coming up with a list of excluded items for the 2006-based official core inflation series. The process
involved selecting food and energy-related items that are significantly volatile (based on historical monthly
CPI data) using CPI data from the 3-digit to 5-digit level of disaggregation.
12
The official definition and methodology for the computation of core inflation were approved in 2003 by the National Statistical
Coordination Board (NSCB) as contained in the NSCB Resolution No. 6 Series of 2003. The said resolution likewise stated that the list of
excluded items shall be reviewed by the then NSCB Board and the Technical Committee on Price Statistics whenever the CPI data is
rebased (Annex BR-6-2003-1). The said NSCB Board Resolution was ratified by the PSA in 2017 under PSA Board Resolution No. 01, Series
of 2017-096. 13
In the previous updating, the IACPS used to be the Technical Committee on Price Statistics (TCPS). 14
The list of excluded items from the 2006-based official core inflation measure was the result of inter-agency technical discussions in 2012
among the National Statistics Office (NSO), the National Statistical Coordination Board (NSCB), the National Economic and Development
Authority (NEDA), the Statistical Research and Training Center (SRTC), the National Wage and Productivity Commission (NWPC), the
Department of Trade and Industry (DTI), and the Bangko Sentral ng Pilipinas (BSP).

Q2 2018 Inflation Report | | | | 7777
The list of excluded items for the 2012-based official core inflation series is composed of mostly the same set
of food- and energy-related items excluded from the CPI series with 2006 as base year, with the exception of
fruits and natural gas and the addition of fish, as shown in Table 1. The total weight of excluded items will
reach 22.8 percent of the CPI basket, which is 2.8-ppt higher than the total weight of excluded items from
the 2006-based CPI basket at 20.0 percent. Meanwhile, the historical plots of inflation rates for each of the
items excluded from the 2012-based official core inflation series are shown in Figure 1.
Table 1. Excluded Items from the 2006- and 2012-Based Official Core Inflation Measure
2006=100 2012=100
CPI Item Weight CPI Item Weight
Rice 8.9 Rice 9.6
Corn 0.7 Corn 0.6
Meat, Fresh, Chilled or Frozen 4.9 Meat, Fresh, Chilled or Frozen 4.8
Fruit, Fresh 1.5 Fish, Fresh, Chilled or Frozen 4.3
Vegetables Cultivated for their Fruit, Fresh or Dried 1.2 Vegetables Cultivated for their Fruit 0.9
Vegetables Cultivated for their Roots, Fresh or Dried 0.6 Vegetables Cultivated for their Roots 0.6
Natural Gas, Liquefied or in the Gaseous State 1.5 Petroleum and Fuels for Personal 2.0
Gas Oils for Motor Vehicles 0.7
Total Excluded Weight 20.0 Total Excluded Weight 22.8
Source of Basic Data: Philippine Statistics Authority (PSA)

Q2 2018 Inflation Report | | | | 8888
Source of Basic Data: PSA
Figure 1. Historical Inflation of Excluded Items, January 2013 - June 2018
Source of Basic Data: PSA

Q2 2018 Inflation Report | | | | 9999
2012-based Core Inflation vs. 2006-based Core Inflation
On average, the 2012-based official core inflation is lower compared with the 2006-based core inflation,
consistent with the trend observed for the headline inflation series for the two base years (Table 2).
Meanwhile, the coefficient of variation (CV) points to a slightly more volatile 2012-based core inflation
compared with the 2006-based series although formal statistical test indicated that the difference in
variability of the two series is not statistically significant. A comparison of the historical plots of the 2006-
based and proposed 2012-based official core inflation series are shown in Figure 2.
Table 2. Summary Statistics for Headline and Core Inflation Measures*
January 2013 - June 2018
Inflation
Measure
Base
Year Min Max Mean
Standard
Deviation
Coefficient
of
Variation
Core 2012 0.5 4.3 2.2 0.9 0.4
2006 1.4 5.4 2.8 0.9 0.3
Headline 2012 -0.4 5.2 2.4 1.3 0.5
2006 0.4 5.7 2.9 1.3 0.4
*Based on BSP staff computations
Source of Basic Data: PSA
Figure 2. Core Inflation: 2006-based vs 2012-based
January 2013 - June 2018
Source of Basic Data: PSA
Q2 2018 Inflation Report | | | | 10101010
2012-based Core Inflation vs. Headline Inflation
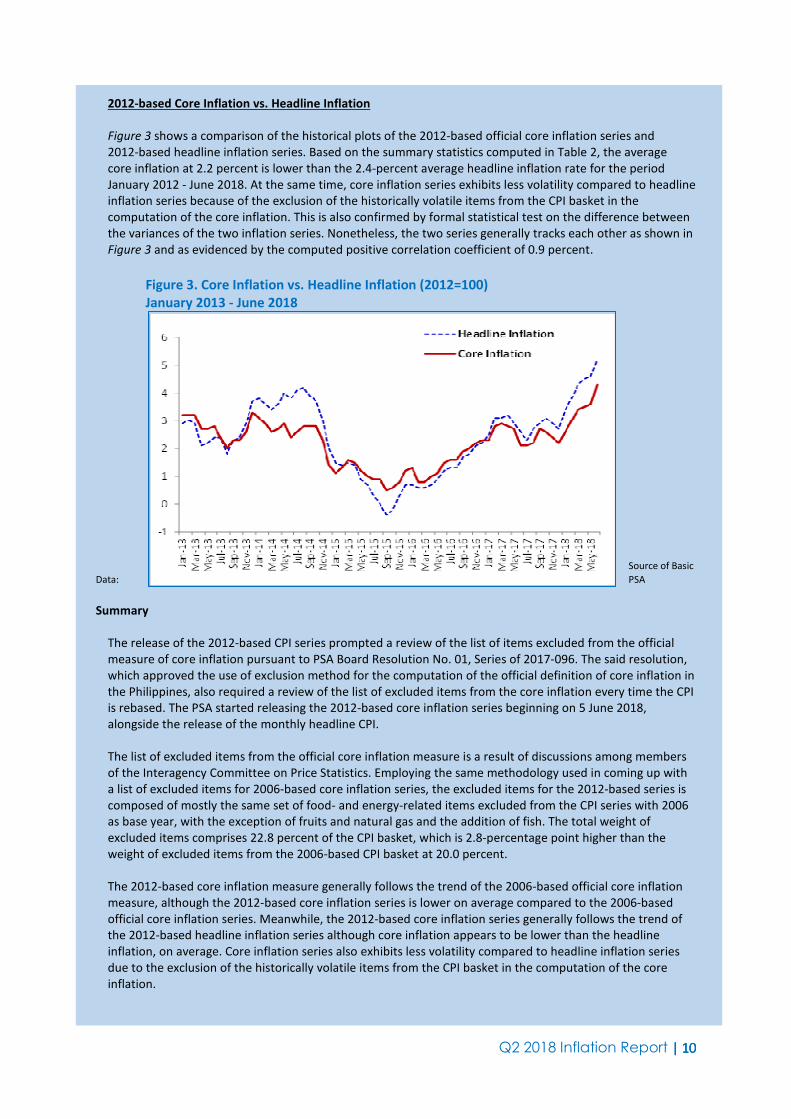
Figure 3 shows a comparison of the historical plots of the 2012-based official core inflation series and
2012-based headline inflation series. Based on the summary statistics computed in Table 2, the average
core inflation at 2.2 percent is lower than the 2.4-percent average headline inflation rate for the period
January 2012 - June 2018. At the same time, core inflation series exhibits less volatility compared to headline
inflation series because of the exclusion of the historically volatile items from the CPI basket in the
computation of the core inflation. This is also confirmed by formal statistical test on the difference between
the variances of the two inflation series. Nonetheless, the two series generally tracks each other as shown in
Figure 3 and as evidenced by the computed positive correlation coefficient of 0.9 percent.
Figure 3. Core Inflation vs. Headline Inflation (2012=100)
January 2013 - June 2018
Source of Basic
Data: PSA
Summary
The release of the 2012-based CPI series prompted a review of the list of items excluded from the official
measure of core inflation pursuant to PSA Board Resolution No. 01, Series of 2017-096. The said resolution,
which approved the use of exclusion method for the computation of the official definition of core inflation in
the Philippines, also required a review of the list of excluded items from the core inflation every time the CPI
is rebased. The PSA started releasing the 2012-based core inflation series beginning on 5 June 2018,
alongside the release of the monthly headline CPI.
The list of excluded items from the official core inflation measure is a result of discussions among members
of the Interagency Committee on Price Statistics. Employing the same methodology used in coming up with
a list of excluded items for 2006-based core inflation series, the excluded items for the 2012-based series is
composed of mostly the same set of food- and energy-related items excluded from the CPI series with 2006
as base year, with the exception of fruits and natural gas and the addition of fish. The total weight of
excluded items comprises 22.8 percent of the CPI basket, which is 2.8-percentage point higher than the
weight of excluded items from the 2006-based CPI basket at 20.0 percent.
The 2012-based core inflation measure generally follows the trend of the 2006-based official core inflation
measure, although the 2012-based core inflation series is lower on average compared to the 2006-based
official core inflation series. Meanwhile, the 2012-based core inflation series generally follows the trend of
the 2012-based headline inflation series although core inflation appears to be lower than the headline
inflation, on average. Core inflation series also exhibits less volatility compared to headline inflation series
due to the exclusion of the historically volatile items from the CPI basket in the computation of the core
inflation.
Q2 2018 Inflation Report | | | | 11111111
Aggregate Demand and Supply15
The Philippine economy grew by 6.8 percent in
Q1 2018. This is higher than the 6.5-percent
expansion a quarter- and year-ago.
Real GDP sustains growth in
Q1 2018
On the expenditure side, the higher Q1 2018
growth was on account of the expansion in capital
formation and household consumption. On the
production side, the higher GDP growth for the
quarter was due to the services and industry
sector, while the agriculture, hunting, forestry and
fishing sector contributed marginally to growth.
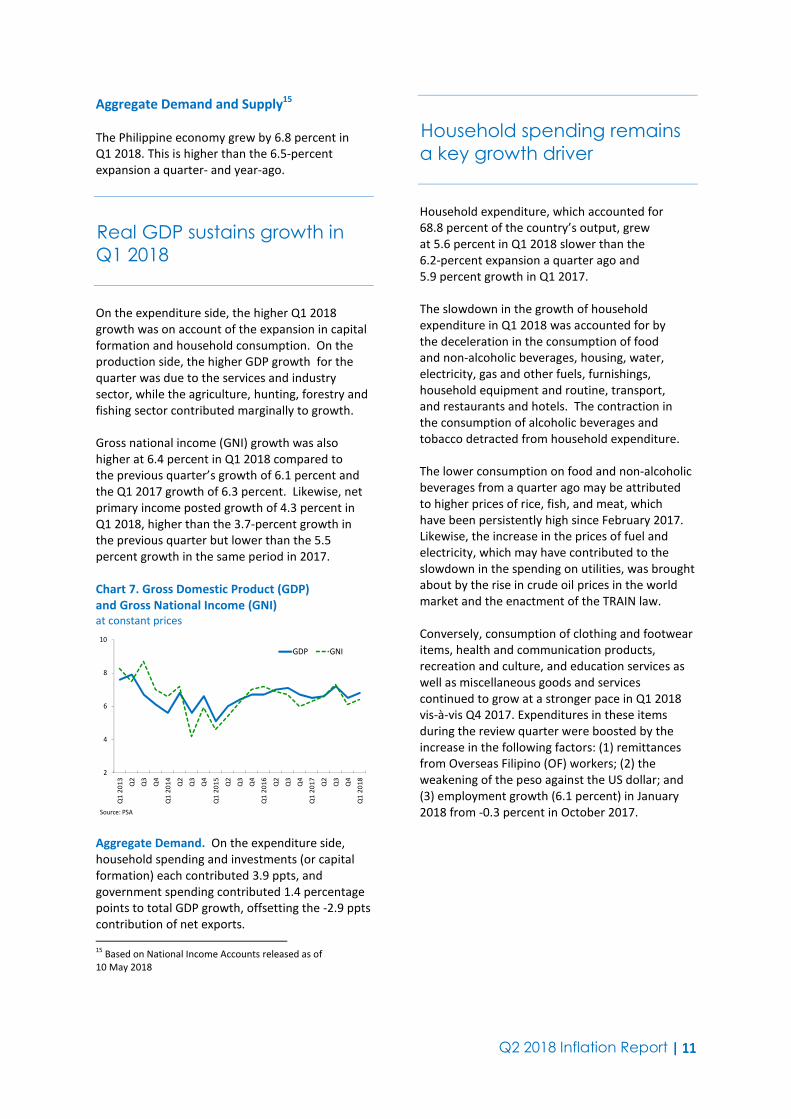
Gross national income (GNI) growth was also
higher at 6.4 percent in Q1 2018 compared to
the previous quarter’s growth of 6.1 percent and
the Q1 2017 growth of 6.3 percent. Likewise, net
primary income posted growth of 4.3 percent in
Q1 2018, higher than the 3.7-percent growth in
the previous quarter but lower than the 5.5
percent growth in the same period in 2017.
Chart 7. Gross Domestic Product (GDP)
and Gross National Income (GNI)
at constant prices
2
4
6
8
10
Q1
20
13
Q2
Q3
Q4
Q1
20
14
Q2
Q3
Q4
Q1
20
15
Q2
Q3
Q4
Q1
20
16
Q2
Q3
Q4
Q1
20
17
Q2
Q3
Q4
Q1
20
18
GDP GNI
Source: PSA
Aggregate Demand. On the expenditure side,
household spending and investments (or capital
formation) each contributed 3.9 ppts, and
government spending contributed 1.4 percentage
points to total GDP growth, offsetting the -2.9 ppts
contribution of net exports.
15
Based on National Income Accounts released as of
10 May 2018
Household spending remains
a key growth driver
Household expenditure, which accounted for
68.8 percent of the country’s output, grew
at 5.6 percent in Q1 2018 slower than the
6.2-percent expansion a quarter ago and
5.9 percent growth in Q1 2017.
The slowdown in the growth of household
expenditure in Q1 2018 was accounted for by
the deceleration in the consumption of food
and non-alcoholic beverages, housing, water,
electricity, gas and other fuels, furnishings,
household equipment and routine, transport,
and restaurants and hotels. The contraction in
the consumption of alcoholic beverages and
tobacco detracted from household expenditure.
The lower consumption on food and non-alcoholic
beverages from a quarter ago may be attributed
to higher prices of rice, fish, and meat, which
have been persistently high since February 2017.
Likewise, the increase in the prices of fuel and
electricity, which may have contributed to the
slowdown in the spending on utilities, was brought
about by the rise in crude oil prices in the world
market and the enactment of the TRAIN law.
Conversely, consumption of clothing and footwear
items, health and communication products,
recreation and culture, and education services as
well as miscellaneous goods and services
continued to grow at a stronger pace in Q1 2018
vis-à-vis Q4 2017. Expenditures in these items
during the review quarter were boosted by the
increase in the following factors: (1) remittances
from Overseas Filipino (OF) workers; (2) the
weakening of the peso against the US dollar; and
(3) employment growth (6.1 percent) in January
2018 from -0.3 percent in October 2017.
Q2 2018 Inflation Report | | | | 12121212
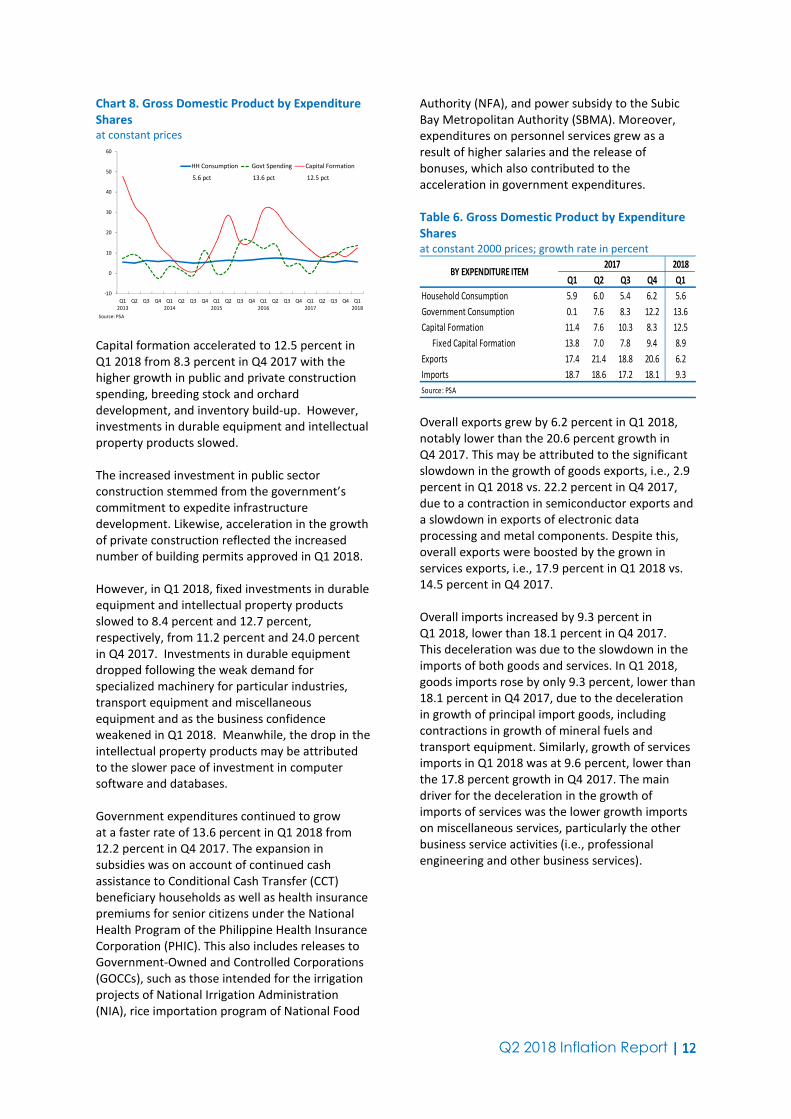
Chart 8. Gross Domestic Product by Expenditure
Shares at constant prices
-10
0
10
20
30
40
50
60
Q1
2013
Q2 Q3 Q4 Q1
2014
Q2 Q3 Q4 Q1
2015
Q2 Q3 Q4 Q1
2016
Q2 Q3 Q4 Q1
2017
Q2 Q3 Q4 Q1
2018
HH Consumption Govt Spending Capital Formation
Source: PSA
5.6 pct 13.6 pct 12.5 pct
Capital formation accelerated to 12.5 percent in
Q1 2018 from 8.3 percent in Q4 2017 with the
higher growth in public and private construction
spending, breeding stock and orchard
development, and inventory build-up. However,
investments in durable equipment and intellectual
property products slowed.
The increased investment in public sector
construction stemmed from the government’s
commitment to expedite infrastructure
development. Likewise, acceleration in the growth
of private construction reflected the increased
number of building permits approved in Q1 2018.
However, in Q1 2018, fixed investments in durable
equipment and intellectual property products
slowed to 8.4 percent and 12.7 percent,
respectively, from 11.2 percent and 24.0 percent
in Q4 2017. Investments in durable equipment
dropped following the weak demand for
specialized machinery for particular industries,
transport equipment and miscellaneous
equipment and as the business confidence
weakened in Q1 2018. Meanwhile, the drop in the
intellectual property products may be attributed
to the slower pace of investment in computer
software and databases.
Government expenditures continued to grow
at a faster rate of 13.6 percent in Q1 2018 from
12.2 percent in Q4 2017. The expansion in
subsidies was on account of continued cash
assistance to Conditional Cash Transfer (CCT)
beneficiary households as well as health insurance
premiums for senior citizens under the National
Health Program of the Philippine Health Insurance
Corporation (PHIC). This also includes releases to
Government-Owned and Controlled Corporations
(GOCCs), such as those intended for the irrigation
projects of National Irrigation Administration
(NIA), rice importation program of National Food
Authority (NFA), and power subsidy to the Subic
Bay Metropolitan Authority (SBMA). Moreover,
expenditures on personnel services grew as a
result of higher salaries and the release of
bonuses, which also contributed to the
acceleration in government expenditures.
Table 6. Gross Domestic Product by Expenditure
Shares
at constant 2000 prices; growth rate in percent
Q1 Q2 Q3 Q4 Q1
Household Consumption 5.9 6.0 5.4 6.2 5.6
Government Consumption 0.1 7.6 8.3 12.2 13.6
Capital Formation 11.4 7.6 10.3 8.3 12.5
Fixed Capital Formation 13.8 7.0 7.8 9.4 8.9
Exports 17.4 21.4 18.8 20.6 6.2
Imports 18.7 18.6 17.2 18.1 9.3
Source: PSA
BY EXPENDITURE ITEM2017 2018
Overall exports grew by 6.2 percent in Q1 2018,
notably lower than the 20.6 percent growth in
Q4 2017. This may be attributed to the significant
slowdown in the growth of goods exports, i.e., 2.9
percent in Q1 2018 vs. 22.2 percent in Q4 2017,
due to a contraction in semiconductor exports and
a slowdown in exports of electronic data
processing and metal components. Despite this,
overall exports were boosted by the grown in
services exports, i.e., 17.9 percent in Q1 2018 vs.
14.5 percent in Q4 2017.
Overall imports increased by 9.3 percent in
Q1 2018, lower than 18.1 percent in Q4 2017.
This deceleration was due to the slowdown in the
imports of both goods and services. In Q1 2018,
goods imports rose by only 9.3 percent, lower than
18.1 percent in Q4 2017, due to the deceleration
in growth of principal import goods, including
contractions in growth of mineral fuels and
transport equipment. Similarly, growth of services
imports in Q1 2018 was at 9.6 percent, lower than
the 17.8 percent growth in Q4 2017. The main
driver for the deceleration in the growth of
imports of services was the lower growth imports
on miscellaneous services, particularly the other
business service activities (i.e., professional
engineering and other business services).

Q2 2018 Inflation Report | | | | 13131313
Other Demand Indicators. High-frequency
indicators of domestic activity continued to point
to firm growth prospects in the near term. The
composite Purchasing Managers’ Index (PMI)
remains firmly above the 50-point mark, pointing
to sustained expansion across all sectors. Capacity
utilization for the manufacturing sector also
suggests that more than half of major
manufacturing sectors operate at above
80.0 percent. Moreover, despite a contraction in
vehicle sales, business and consumer sentiments
remain optimistic for the current and next quarter.
Property Prices
Vacancy Rates. The overall office vacancy rate in
Metro Manila increased slightly at 5.8 percent in
Q1 2018 from about 5.3 percent in the previous
quarter due to the completion of additional office
supply.
Office vacancy rates increase
slightly
Office vacancy rates in Makati CBD and Ortigas
Center for Q1 2018 increased relative to their
quarter-ago levels of 2.3 percent (from 1.2 percent
in Q4 2017) and 6.0 percent (from 3.6 percent in
Q4 2017), respectively. Meanwhile, office
vacancy rates in Fort Bonifacio and Manila Bay
Area decreased in Q1 2018 to 4.4 percent (from
6.1 percent in Q4 2017) and 2.4 percent (from
4.3 percent in Q4 2017), respectively. With the
sizeable upcoming supply, Colliers expects overall
vacancy rates in Metro Manila to reach about
6-9 percent in the next two to three years.
Meanwhile, the overall residential vacancy rate in
Metro Manila decreased slightly to 12.4 percent
in Q1 2018 from 12.6 percent in Q1 2018 due to
the strong demand from a growing Chinese
community in the Manila Bay Area and Makati
CBD as well as sustained demand from employees
of KPO and multinational firms in Fort Bonifacio.
In particular, Q1 2018 vacancy rates eased in the
Makati CBD (12.3 percent from 13.6 percent),
Manila Bay Area (14.7 percent from 19.0 percent),
Eastwood City (5.9 percent from 6.1 percent) and
Ortigas Center (6.2 percent from 6.4 percent)
compared to their quarter-ago levels. On the other
hand, vacancy rates in Fort Bonifacio and Rockwell
Center rose compared to the previous quarter.
Colliers foresees that residential vacancy rates will
range to about 12-16 percent in the next two to
three years.
Chart 9. Vacancy Rates
(Makati Central Business District) in percent
5
6
7
8
9
10
11
12
13
14
15
0
1
2
3
4
5
6
Q1
20
13
Q2
Q3
Q4
Q1
20
14
Q2
Q3
Q4
Q1
20
15
Q2
Q3
Q4
Q1
20
16
Q2
Q3
Q4
Q1
20
17
Q2
Q3
Q4
Q1
20
18
Office (LHS) Residential (RHS)
Source: Colliers International Philippines
Rental Values. Monthly Grade A office16
rents in
the Makati CBD reached P1,030/sq.m. in Q1 2018,
representing an increase of 3.2 percent from the
previous quarter. Similarly, monthly Grade A office
rents in the Makati CBD were higher by 8.6
percent relative to Q1 2017.
Office rental values above
1997 levels in nominal terms
Office rental rates continued to increase amid
strong demand from a diversified tenant mix from
the following sectors: online gaming; traditional
companies, i.e., logistics companies, construction
firms, online shopping firms, and government
agencies; and, business process outsourcing (BPO)
firms. Colliers noted the increased leasing demand
of knowledge process outsourcing (KPO) firms in
Q1 2018 in spite of concerns on the reduction in
fiscal incentives for BPO companies under the
proposed Tax Reform for Acceleration and
inclusion package 2 (TRAIN 2).
Office rental values for Grade A offices were above
their 1997 levels in nominal terms. In real terms,
office rental values were about 53.5 percent of
the comparable levels in 1997.
16
Grade A office refers to office units that are located within
the CBD but not in the core area and have quality access to and
from the secondary or main avenues. Meanwhile, in terms of
general finish, Grade A office buildings have high quality
presentation and maintenance.

Q2 2018 Inflation Report | | | | 14141414
Monthly rent for luxury three-bedroom
condominium units in the Makati CBD was at
P800/sq.m. as of Q1 2018, declining by 0.4 percent
from the previous quarter.
Luxury rental values decline
Likewise, the monthly rent for the 3-bedroom
units was lower by 2.9 percent compared to
year-ago levels. Residential rental rates in the
Makati CBD as well as in Rockwell Center and
Fort Bonifacio continued to drop as the rental
market became more competitive due to the
ample supply of residential units across CBDs.
However, Colliers expect rents to increase by
1-3 percent in 2019 to 2020.
Residential rental values for luxury three-bedroom
high-rise units were above their 1997 levels in
nominal terms but were only about 67.9 percent
of their 1997 levels in real terms.
Chart 10. Rental Values
(Makati Central Business District)
price per square meter
0
100
200
300
400
500
600
700
800
900
1,000
1,100
1,200
Q1
20
13
Q2
Q3
Q4
Q1
20
14
Q2
Q3
Q4
Q1
20
15
Q2
Q3
Q4
Q1
20
16
Q2
Q3
Q4
Q1
20
17
Q2
Q3
Q4
Q1
20
18
Office (Grade A) Residential (Luxury)
Source: Colliers International Philippines
Capital Values. Capital values17
for Grade A office
buildings in the Makati CBD in Q1 2018 were
higher in nominal terms than their quarter- and
year-ago levels. Grade A office capital values in the
Makati CBD rose to P204,100/sq.m., higher by
4.0 percent and by 21.2 percent compared to the
quarter- and year-ago levels, respectively.
Grade A office capital values were more than two
times higher than the 1997 levels in nominal
terms. In real terms, office capital values were
17
Probable price that the property would have fetched if sold
on the date of the valuation. The valuation includes imputed
land and building value.
about slightly higher than the comparable levels in
1997.
Capital values for office and
residential buildings rise
Likewise, capital values for luxury residential
buildings18
in Makati CBD in Q1 2018 increased to
P205,100/sq.m. from their quarter- and year-ago
levels. Average prices for three-bedroom luxury
residential condominium units grew by 3.0 percent
quarter-on-quarter and 10.2 percent y-o-y.
Capital values for luxury residential buildings
doubled from their levels in 1997. In real terms,
residential capital values were about 84.8 percent
of the comparable levels in 1997.
Chart 11. Capital Values
(Makati Central Business District)
price per square meter
0
20,000
40,000
60,000
80,000
100,000
120,000
140,000
160,000
180,000
200,000
220,000
Q1
20
13
Q2
Q3
Q4
Q1
20
14
Q2
Q3
Q4
Q1
20
15
Q2
Q3
Q4
Q1
20
16
Q2
Q3
Q4
Q1
20
17
Q2
Q3
Q4
Q1
20
18
Office (Grade A) Residential (luxury)
Source: Colliers International Philippines
18
In terms of location, luxury residential units are located
within the CBD core and have quality access to/from and have
superior visibility from the main avenue. Meanwhile, in terms
of general finish, luxury residential units have premium
presentation and maintenance.

Q2 2018 Inflation Report | | | | 15151515
BSP Residential Real Estate Price Index.19
Residential real estate prices increased by
2.1 percent y-o-y in Q1 2018 as the Residential
Real Estate Price Index (RREPI) rose to 116.3
from 113.9 for the same quarter a year ago.
Residential real estate prices
higher in Q1 2018
Year-on-year, prices of townhouses and
condominium units grew by 13.8 percent and
2 percent, respectively. Meanwhile, prices of
single detached housing units declined slightly
by 0.6 percent. Quarter-on-quarter, the RREPI
declined marginally by 0.9 percent. The RREPI
measures the average change in prices of various
types of housing units comprising of single
detached/attached house, duplex, townhouse,
and condominium unit based on data from
housing loans granted by universal, commercial,
and thrift banks.
The average residential property prices in
both NCR and AONCR rose by 2.7 percent and
0.9 percent compared to year-ago prices,
respectively.
Residential property prices
increase in NCR and AONCR
In NCR, the higher growth in prices of
condominium units, townhouses, and duplexes
offset the decline in prices of single detached
houses. Meanwhile, the higher increase in prices
of townhouses and duplexes in AONCR,
outweighed the decrease in prices of single
detached houses and condominium units.
19
The RREPI measures the average changes in prices of
different types of housing units over a period of time across
different geographical regions where the growth rate of the
index measures house inflation. It is computed as a weighted
chain-linked index based on the average appraised value per
square meter weighted by the share of floor area of new
housing units.
Table 7. Residential Real Estate Price Index
By Area Q1 2014=100; growth rate in percent
Overall 2
NCR AONCR
2016 Q1 106.9 113.4 103.3
Q2 111.7 116.1 109.3
Q3 109.6 115.7 106.2
Q4 111.1 117.3 107.9
2017 Q1 113.9 118.4 111.6
Q2 111.8 120.4 107.5
Q3 111.6 118.2 108.1
Q4 117.4 127.6 111.1
2018 Q1 116.3 121.6 112.6
2016 Q1 1.3 3.5 1.8
Q2 5.9 1.9 9.6
Q3 3.8 0.2 6.9
Q4 3.3 0.6 6.0
2017 Q1 6.5 4.4 8.0
Q2 0.1 3.7 -1.6
Q3 1.8 2.2 1.8
Q4 5.7 8.8 3.0
2018 Q1 2.1 2.7 0.9
2016 Q1 -0.7 -2.7 1.5
Q2 4.5 2.4 5.8
Q3 -1.9 -0.3 -2.8
Q4 1.4 1.4 1.6
2017 Q1 2.5 0.9 3.4
Q2 -1.8 1.7 -3.7
Q3 -0.2 -1.8 0.6
Q4 5.2 8.0 2.8
2018 Q1 -0.9 -4.7 1.41 Based on bank reports on residential real estate loans granted per
BSP Circular No. 892 dated 16 November 2015.2 No index generated for apartments due to very few observations;
Indices for duplex exhibit more volatility due to relatively small number of
reported real estate loans.
Source: BSP
Year-on-Year Growth Rates
Quarter-on-Quarter Growth Rates
Residential Real Estate Price Index 1 (By Area)
Quarter
For Q1 2018, about seven in ten (73.5 percent)
residential real estate loans were for the purchase
of new housing units. By type of housing unit,
48.9 percent of residential property loans were for
the acquisition of condominium units, followed by
single detached units (43.2 percent) and
townhouses (7.6 percent). By area, condominium
units were the most common house purchases in
NCR, while single detached houses were prevalent
in AONCR. By region, NCR accounted for
48.3 percent of the total number of residential
real estate loans granted during the quarter,
followed by AONCR - CALABARZON (25.5 percent),
Central Luzon (7.1 percent), Central Visayas
(5.5 percent), Western Visayas (4.3 percent),
Davao Region (3.2 percent) and Northern
Mindanao (1.8 percent). Together, these seven
regions accounted for 95.7 percent of total
housing loans granted by banks.
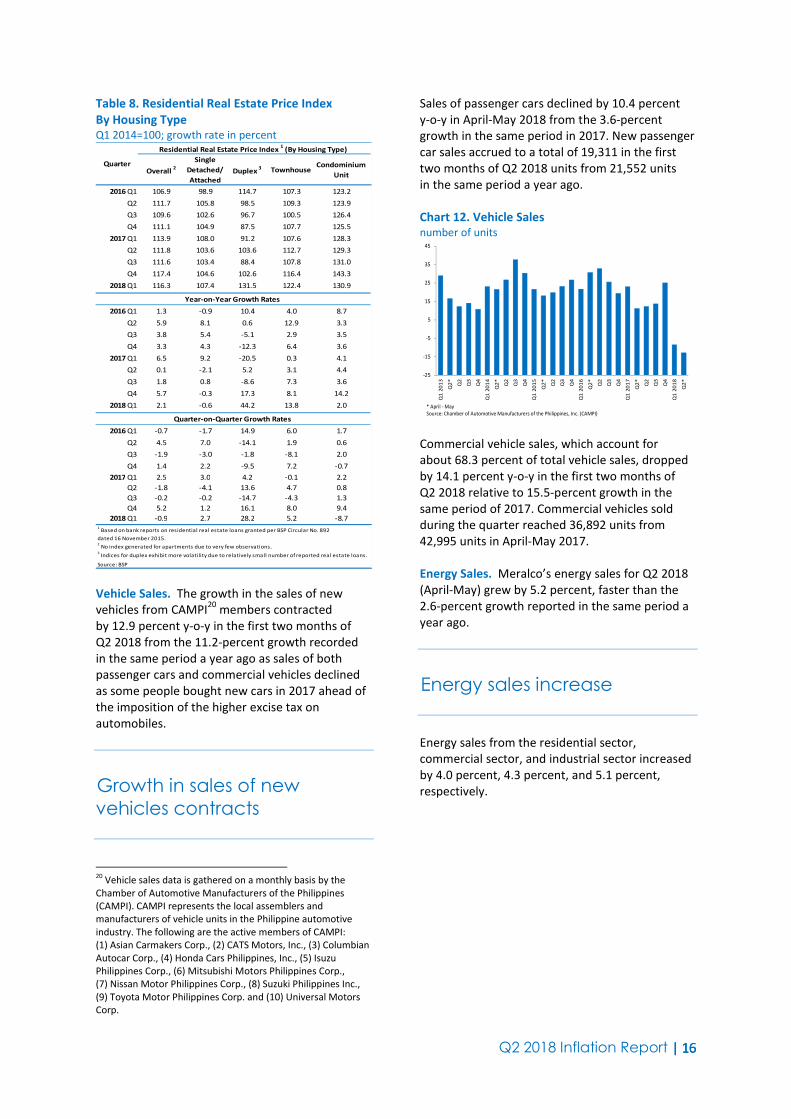
Q2 2018 Inflation Report | | | | 16161616
Table 8. Residential Real Estate Price Index
By Housing Type Q1 2014=100; growth rate in percent
Overall 2
Single
Detached/
Attached
Duplex 3 Townhouse
Condominium
Unit
2016 Q1 106.9 98.9 114.7 107.3 123.2
Q2 111.7 105.8 98.5 109.3 123.9
Q3 109.6 102.6 96.7 100.5 126.4
Q4 111.1 104.9 87.5 107.7 125.5
2017 Q1 113.9 108.0 91.2 107.6 128.3
Q2 111.8 103.6 103.6 112.7 129.3
Q3 111.6 103.4 88.4 107.8 131.0
Q4 117.4 104.6 102.6 116.4 143.3
2018 Q1 116.3 107.4 131.5 122.4 130.9
2016 Q1 1.3 -0.9 10.4 4.0 8.7
Q2 5.9 8.1 0.6 12.9 3.3
Q3 3.8 5.4 -5.1 2.9 3.5
Q4 3.3 4.3 -12.3 6.4 3.6
2017 Q1 6.5 9.2 -20.5 0.3 4.1
Q2 0.1 -2.1 5.2 3.1 4.4
Q3 1.8 0.8 -8.6 7.3 3.6
Q4 5.7 -0.3 17.3 8.1 14.2
2018 Q1 2.1 -0.6 44.2 13.8 2.0
2016 Q1 -0.7 -1.7 14.9 6.0 1.7
Q2 4.5 7.0 -14.1 1.9 0.6
Q3 -1.9 -3.0 -1.8 -8.1 2.0
Q4 1.4 2.2 -9.5 7.2 -0.7
2017 Q1 2.5 3.0 4.2 -0.1 2.2
Q2 -1.8 -4.1 13.6 4.7 0.8
Q3 -0.2 -0.2 -14.7 -4.3 1.3
Q4 5.2 1.2 16.1 8.0 9.4
2018 Q1 -0.9 2.7 28.2 5.2 -8.71 Based on bank reports on residential real estate loans granted per BSP Circular No. 892
dated 16 November 2015.2 No index generated for apartments due to very few observations.
3 Indices for duplex exhibit more volatility due to relatively small number of reported real estate loans.
Source: BSP
Quarter-on-Quarter Growth Rates
Quarter
Residential Real Estate Price Index 1 (By Housing Type)
Year-on-Year Growth Rates
Vehicle Sales. The growth in the sales of new
vehicles from CAMPI20
members contracted
by 12.9 percent y-o-y in the first two months of
Q2 2018 from the 11.2-percent growth recorded
in the same period a year ago as sales of both
passenger cars and commercial vehicles declined
as some people bought new cars in 2017 ahead of
the imposition of the higher excise tax on
automobiles.
Growth in sales of new
vehicles contracts
20
Vehicle sales data is gathered on a monthly basis by the
Chamber of Automotive Manufacturers of the Philippines
(CAMPI). CAMPI represents the local assemblers and
manufacturers of vehicle units in the Philippine automotive
industry. The following are the active members of CAMPI:
(1) Asian Carmakers Corp., (2) CATS Motors, Inc., (3) Columbian
Autocar Corp., (4) Honda Cars Philippines, Inc., (5) Isuzu
Philippines Corp., (6) Mitsubishi Motors Philippines Corp.,
(7) Nissan Motor Philippines Corp., (8) Suzuki Philippines Inc.,
(9) Toyota Motor Philippines Corp. and (10) Universal Motors
Corp.
Sales of passenger cars declined by 10.4 percent
y-o-y in April-May 2018 from the 3.6-percent
growth in the same period in 2017. New passenger
car sales accrued to a total of 19,311 in the first
two months of Q2 2018 units from 21,552 units
in the same period a year ago.
Chart 12. Vehicle Sales
number of units
-25
-15
-5
5
15
25
35
45
Q1
20
13
Q2
*
Q2
Q3
Q4
Q1
20
14
Q2
*
Q2
Q3
Q4
Q1
20
15
Q2
*
Q2
Q3
Q4
Q1
20
16
Q2
*
Q2
Q3
Q4
Q1
20
17
Q2
*
Q2
Q3
Q4
Q1
20
18
Q2
*
* April - May
Source: Chamber of Automotive Manufacturers of the Philippines, Inc. (CAMPI)
Commercial vehicle sales, which account for
about 68.3 percent of total vehicle sales, dropped
by 14.1 percent y-o-y in the first two months of
Q2 2018 relative to 15.5-percent growth in the
same period of 2017. Commercial vehicles sold
during the quarter reached 36,892 units from
42,995 units in April-May 2017.
Energy Sales. Meralco’s energy sales for Q2 2018
(April-May) grew by 5.2 percent, faster than the
2.6-percent growth reported in the same period a
year ago.
Energy sales increase
Energy sales from the residential sector,
commercial sector, and industrial sector increased
by 4.0 percent, 4.3 percent, and 5.1 percent,
respectively.
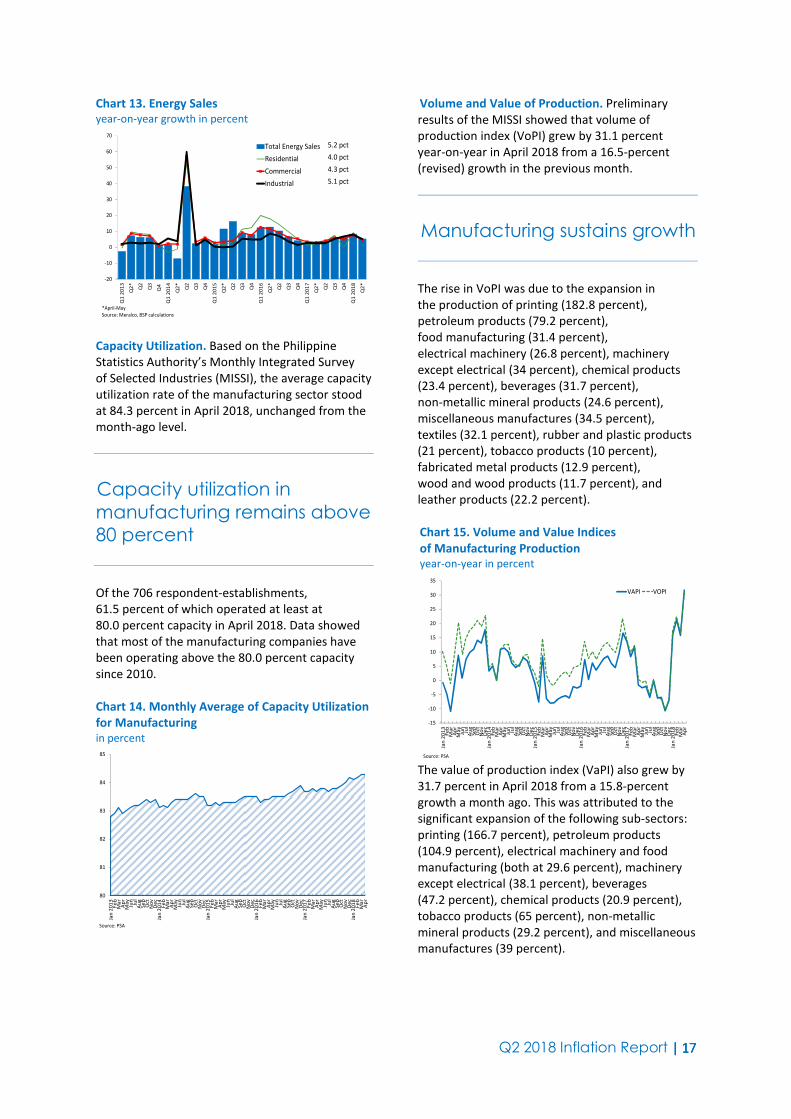
Q2 2018 Inflation Report | | | | 17171717
Chart 13. Energy Sales
year-on-year growth in percent
-20
-10
0
10
20
30
40
50
60
70
Q1
20
13
Q2
*
Q2
Q3
Q4
Q1
20
14
Q2
*
Q2
Q3
Q4
Q1
20
15
Q2
*
Q2
Q3
Q4
Q1
20
16
Q2
*
Q2
Q3
Q4
Q1
20
17
Q2
*
Q2
Q3
Q4
Q1
20
18
Q2
*
Total Energy Sales
Residential
Commercial
Industrial
*April-May
Source: Meralco, BSP calculations
5.2 pct
4.0 pct
4.3 pct
5.1 pct
Capacity Utilization. Based on the Philippine
Statistics Authority’s Monthly Integrated Survey
of Selected Industries (MISSI), the average capacity
utilization rate of the manufacturing sector stood
at 84.3 percent in April 2018, unchanged from the
month-ago level.
Capacity utilization in
manufacturing remains above
80 percent
Of the 706 respondent-establishments,
61.5 percent of which operated at least at
80.0 percent capacity in April 2018. Data showed
that most of the manufacturing companies have
been operating above the 80.0 percent capacity
since 2010.
Chart 14. Monthly Average of Capacity Utilization
for Manufacturing
in percent
80
81
82
83
84
85
Jan
20
13
Fe
bM
ar
Ap
rM
ay
Jun
Jul
Au
gS
ep
Oct
No
vD
ec
Jan
20
14
Fe
bM
ar
Ap
rM
ay
Jun
Jul
Au
gS
ep
Oct
No
vD
ec
Jan
20
15
Fe
bM
ar
Ap
rM
ay
Jun
Jul
Au
gS
ep
Oct
No
vD
ec
Jan
20
16
Fe
bM
ar
Ap
rM
ay
Jun
Jul
Au
gS
ep
Oct
No
vD
ec
Jan
20
17
Fe
bM
ar
Ap
rM
ay
Jun
Jul
Au
gS
ep
Oct
No
vD
ec
Jan
20
18
Fe
bM
ar
Ap
r
Source: PSA
Volume and Value of Production. Preliminary
results of the MISSI showed that volume of
production index (VoPI) grew by 31.1 percent
year-on-year in April 2018 from a 16.5-percent
(revised) growth in the previous month.
Manufacturing sustains growth
The rise in VoPI was due to the expansion in
the production of printing (182.8 percent),
petroleum products (79.2 percent),
food manufacturing (31.4 percent),
electrical machinery (26.8 percent), machinery
except electrical (34 percent), chemical products
(23.4 percent), beverages (31.7 percent),
non-metallic mineral products (24.6 percent),
miscellaneous manufactures (34.5 percent),
textiles (32.1 percent), rubber and plastic products
(21 percent), tobacco products (10 percent),
fabricated metal products (12.9 percent),
wood and wood products (11.7 percent), and
leather products (22.2 percent).
Chart 15. Volume and Value Indices
of Manufacturing Production year-on-year in percent
-15
-10
-5
0
5
10
15
20
25
30
35
Jan
20
13
Fe
bM
ar
Ap
rM
ay
Jun
Jul
Au
gSe
pO
ctN
ov
De
cJa
n 2
01
4Fe
bM
ar
Ap
rM
ay
Jun
Jul
Au
gSe
pO
ctN
ov
De
cJa
n 2
01
5Fe
bM
ar
Ap
rM
ay
Jun
Jul
Au
gSe
pO
ctN
ov
De
cJa
n 2
01
6Fe
bM
ar
Ap
rM
ay
Jun
Jul
Au
gSe
pO
ctN
ov
De
cJa
n 2
01
7Fe
bM
ar
Ap
rM
ay
Jun
Jul
Au
gSe
pO
ctN
ov
De
cJa
n 2
01
8Fe
bM
ar
Ap
r
VAPI VOPI
Source: PSA The value of production index (VaPI) also grew by
31.7 percent in April 2018 from a 15.8-percent
growth a month ago. This was attributed to the
significant expansion of the following sub-sectors:
printing (166.7 percent), petroleum products
(104.9 percent), electrical machinery and food
manufacturing (both at 29.6 percent), machinery
except electrical (38.1 percent), beverages
(47.2 percent), chemical products (20.9 percent),
tobacco products (65 percent), non-metallic
mineral products (29.2 percent), and miscellaneous
manufactures (39 percent).
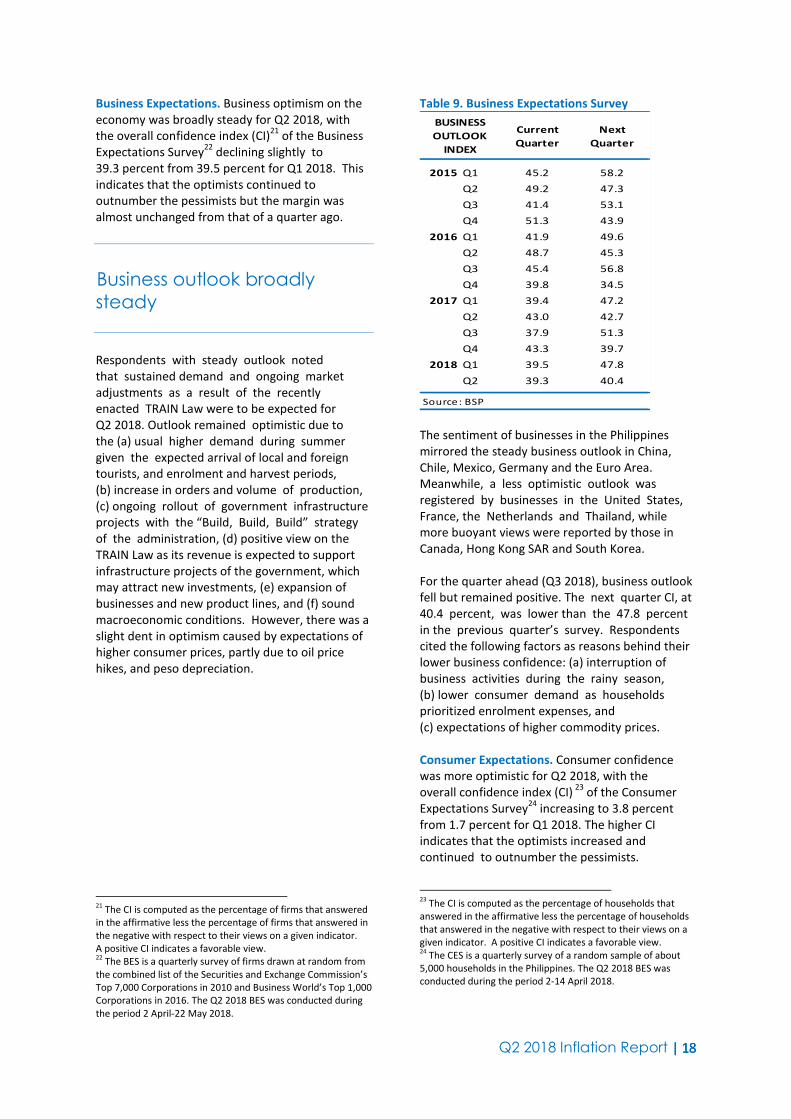
Q2 2018 Inflation Report | | | | 18181818
Business Expectations. Business optimism on the
economy was broadly steady for Q2 2018, with
the overall confidence index (CI)21
of the Business
Expectations Survey22
declining slightly to
39.3 percent from 39.5 percent for Q1 2018. This
indicates that the optimists continued to
outnumber the pessimists but the margin was
almost unchanged from that of a quarter ago.
Business outlook broadly
steady
Respondents with steady outlook noted
that sustained demand and ongoing market
adjustments as a result of the recently
enacted TRAIN Law were to be expected for
Q2 2018. Outlook remained optimistic due to
the (a) usual higher demand during summer
given the expected arrival of local and foreign
tourists, and enrolment and harvest periods,
(b) increase in orders and volume of production,
(c) ongoing rollout of government infrastructure
projects with the “Build, Build, Build” strategy
of the administration, (d) positive view on the
TRAIN Law as its revenue is expected to support
infrastructure projects of the government, which
may attract new investments, (e) expansion of
businesses and new product lines, and (f) sound
macroeconomic conditions. However, there was a
slight dent in optimism caused by expectations of
higher consumer prices, partly due to oil price
hikes, and peso depreciation.
21
The CI is computed as the percentage of firms that answered
in the affirmative less the percentage of firms that answered in
the negative with respect to their views on a given indicator.
A positive CI indicates a favorable view. 22
The BES is a quarterly survey of firms drawn at random from
the combined list of the Securities and Exchange Commission’s
Top 7,000 Corporations in 2010 and Business World’s Top 1,000
Corporations in 2016. The Q2 2018 BES was conducted during
the period 2 April-22 May 2018.
Table 9. Business Expectations Survey
Current
Quarter
Next
Quarter
2015 Q1 45.2 58.2
Q2 49.2 47.3
Q3 41.4 53.1
Q4 51.3 43.9
2016 Q1 41.9 49.6
Q2 48.7 45.3
Q3 45.4 56.8
Q4 39.8 34.5
2017 Q1 39.4 47.2
Q2 43.0 42.7
Q3 37.9 51.3
Q4 43.3 39.7
2018 Q1 39.5 47.8
Q2 39.3 40.4
Source: BSP
BUSINESS
OUTLOOK
INDEX
The sentiment of businesses in the Philippines
mirrored the steady business outlook in China,
Chile, Mexico, Germany and the Euro Area.
Meanwhile, a less optimistic outlook was
registered by businesses in the United States,
France, the Netherlands and Thailand, while
more buoyant views were reported by those in
Canada, Hong Kong SAR and South Korea.
For the quarter ahead (Q3 2018), business outlook
fell but remained positive. The next quarter CI, at
40.4 percent, was lower than the 47.8 percent
in the previous quarter’s survey. Respondents
cited the following factors as reasons behind their
lower business confidence: (a) interruption of
business activities during the rainy season,
(b) lower consumer demand as households
prioritized enrolment expenses, and
(c) expectations of higher commodity prices.
Consumer Expectations. Consumer confidence
was more optimistic for Q2 2018, with the
overall confidence index (CI) 23
of the Consumer
Expectations Survey24
increasing to 3.8 percent
from 1.7 percent for Q1 2018. The higher CI
indicates that the optimists increased and
continued to outnumber the pessimists.
23
The CI is computed as the percentage of households that
answered in the affirmative less the percentage of households
that answered in the negative with respect to their views on a
given indicator. A positive CI indicates a favorable view. 24
The CES is a quarterly survey of a random sample of about
5,000 households in the Philippines. The Q2 2018 BES was
conducted during the period 2-14 April 2018.

Q2 2018 Inflation Report | | | | 19191919
Consumer confidence
weakens but remains positive
According to respondents, their positive outlook
for Q2 2018 was mainly brought about by their
expectations of: (a) improvement in peace
and order situation, (b) additional income,
(c) availability of more jobs, (d) effective
government policies, and (e) increase in
family savings.
Table 10. Consumer Expectations Survey
Current
Quarter
Next 3
Months
Next 12
Months
2015 Q1 -10.0 4.4 17.3
Q2 -16.2 -0.4 16.4
Q3 -11.6 5.8 15.8
Q4 -8.1 5.7 18.0
2016 Q1 -5.7 9.1 25.4
Q2 -6.4 5.6 26.6
Q3 2.5 27.3 43.8
Q4 9.2 18.8 33.4
2017 Q1 8.7 16.5 31.7
Q2 13.1 13.6 34.3
Q3 10.2 17.8 33.7
Q4 9.5 17.5 32.0
2018 Q1 1.7 8.8 24.0
Q2 3.8 8.7 23.1
CONSUMER
OUTLOOK
INDEX
Source: BSP
The positive current quarter outlook of consumers
in the Philippines mirrored the improved
confidence of consumers in Australia, Euro Area,
France, Indonesia, Thailand, and the United States
but was in contrast to the weakened views of
those in Japan, South Korea, Switzerland, Taiwan,
and United Kingdom for Q2 2018.
Consumers’ optimism remained generally steady
for the next quarter (Q3 2018) and the year ahead,
as the CIs showed a fractional decline from
previous quarter’s survey at 8.7 percent from
8.8 percent and at 23.1 percent from 24 percent,
respectively. The relatively steady outlook in the
near-term stemmed from the counterbalancing
of the number of respondents that reported more
positive views on the economy, in anticipation of
more jobs and additional income, versus those
with negative views due to expectations of higher
prices of goods.
Purchasing Managers’ Index (PMI).25
The
composite PMI in May 2018 remained firmly
above the 50-point expansion threshold at 53.8,26
albeit lower than the composite PMI of 55.9 in
April 2018. This was due to the slower rate of
expansion of all sectors.
PMI remains firmly above the
50-point expansion threshold
Chart 16. Purchasing Managers’ Index
40
45
50
55
60
65
70
Jan
20
13
Fe
bM
ar
Ap
rM
ay
Jun
Jul
Au
gS
ep
Oct
No
vD
ec
Jan
20
14
Fe
bM
ar
Ap
rM
ay
Jun
Jul
Au
gS
ep
Oct
No
vD
ec
Jan
20
15
Fe
bM
ar
Ap
rM
ay
Jun
Jul
Au
gS
ep
Oct
No
vD
ec
Jan
20
16
Fe
bM
ar
Ap
rM
ay
Jun
Jul
Au
gS
ep
Oct
No
vD
ec
Jan
20
17
Fe
bM
ar
Ap
rM
ay
Jun
Jul
Au
gS
ep
Oct
No
vD
ec
Jan
20
18
Fe
bM
ar
Ap
rM
ay
Composite Manufacturing Retail & Wholesale Trade Services
53.8 52.3 50.7 55.3
Source: Philippine Institute of Supply Management (PISM)
The manufacturing PMI decreased by 1.6 index
points to 52.3 in May from 53.9 in April 2018.
This is a contrary to managers’ expectation for
the month as demand was weaker-than-expected
with lower number of new orders. In turn,
production volume decreased which resulted in
the contraction of the Inventories Index.
Meanwhile, the slack in demand kept the Supplier
Deliveries Index stable at a PMI of 53.8. In terms
of the sector’s performance by export category,
firms generally posted month-on-month
deceleration, especially firms with export volume
of up to 25 percent of total revenues, which
recorded a contraction in May. By contrast,
non-exporting companies expanded from
month-ago level. On a per sector basis, lower PMIs
were noted in five of 12 manufacturing subsectors,
which more than offset the increases observed in
seven other subsectors. In particular, three
subsectors decelerated namely communication
and medical equipment (with a PMI of 56.2),
25
Data based on the monthly purchasing managers’ index
report of the Philippine Institute for Supply Management. 26
The actual formula used to calculate the PMI assigns weights
to each common element and then multiplies them by 1.0 for
improvement, 0.5 for no change, and 0 for deterioration.
As a result, an index above 50 indicates economic expansion,
and an index below 50 implies a contraction. PMI surveys are
conducted on the last week of the month.

Q2 2018 Inflation Report | | | | 20202020
non-metallic minerals (55), and textiles and
clothing (50.8), while two others posted
contraction which were motor vehicles (49.8)
and publishing (47.2). Meanwhile, survey
respondents expect the sector to further
slowdown in June. Similarly, the services PMI
went down marginally by 1.2 index points to
55.3 in May from 56.5 in the previous month.
Five of six indices declined, with the Employment
Index posting the biggest drop (50.7). Despite
firms’ limited business activities during the month
to contain their operating cost, the Price Charge
Index (which measures the average price charged
to all services) increased. This was attributed
mainly to the implementation of the TRAIN Law
which was believed to have inevitably pushed
prices up.
Meanwhile, five of the 13 subsectors showed
faster expansion in May (transportation including
travel agency; real estate; renting of goods and
equipment; miscellaneous business activities; and
education), five subsectors expanded at slower
rate (electricity, gas, and water; construction;
hotels and restaurants; postal and
telecommunications; provident and insurance),
while the other three subsectors posted
contraction (banking and financial intermediation;
health and social work; and business and
knowledge). Prospects are favorable for the sector
in the month ahead.
The retail and wholesale PMI also decreased by
4.5 index points to 50.7 in May from 55.2 a month
ago. Firms also attributed the sector’s performance
to weak demand as evident in the slower
expansion of all the indices, with the Inventories
Index posting a contraction (45.8). Meanwhile,
the PMI of the retail subsector decreased to 52.5
in May from 55.8 in April. The PMI of the wholesale
subsector contracted to 48.4 in May from 56.0 a
month ago. Managers are expecting the sector to
accelerate in June.
External Demand27
Exports. Exports of goods decreased by 5.5
percent in Q1 2018, a reversal from the growth
rates of 13.4-percent and 25.5 percent in Q4 2017
and Q1 2017, respectively.
Exports of goods decrease
27
International Merchandise Trade Statistics (IMTS) concept
The contraction in foreign shipments of coconut
products, fruits and vegetables, other agro-based
products, petroleum products and manufactures
outweighed the increase in exports of sugar and
related products, forest products and mineral
products during the quarter.
Table 11. Exports of Goods
growth rate in percent
Q1 Q4 Q1
Coconut Products 150.5 -8.9 -36.2
Sugar and Products -67.2 961.8 4.5
Fruits and Vegetables 11.5 -16.5 -22.3
Other Agro-Based Products 25.3 2.2 -11.0
Forest Products 184.9 595.2 135.3
Mineral Products 67.8 70.4 29.0
Petroleum Products 17.4 69.8 -16.6
Manufactures 20.4 9.4 -4.8
Special Transactions 113.1 112.9 -34.2
Total Exports 25.5 13.4 -5.5
Source: BSP
2017 2018COMMODITY GROUP
Imports. Imports grew by 6.9 percent in Q1 2018
from 21.1 percent and 19.3 percent in Q4 2017
and Q1 2017, respectively, due to the sustained
albeit slower expansion in the importation of
capital goods, raw materials and intermediate
goods, mineral fuels and lubricants, and consumer
goods.
Imports of goods decline
Table 12. Imports of Goods
growth rate in percent
Q1 Q4 Q1
Capital Goods 10.0 14.2 11.5
Raw Materials and
Intermediate Goods 20.3 23.2 5.5
Lubricants 58.4 47.6 6.1
Consumer Goods 15.4 16.9 1.8
Special Transactions 22.7 1.5 0.9
Total Imports 19.3 21.1 6.9
Mineral Fuels and
Source: BSP
2017 2018COMMODITY GROUP

Q2 2018 Inflation Report | | | | 21212121
Aggregate Supply. On the production side, growth
was largely due to the services sector (7.0 percent
in Q1 2018 from 6.9 percent in Q4 2017), which
accounted for 4.0 ppts of the 6.8 percent growth
in GDP. The industry sector was the fastest
growing sector at 7.9 percent from 7.0 percent
in Q4 2017, contributing 2.7 ppts to the growth
of the economy. Lastly, the agriculture, hunting,
forestry and fishing sector growth slowed down
to 1.5 percent in Q1 2018 from 2.4 percent in
Q4 2017, contributing marginally at 0.1 ppt to
overall GDP growth.
Services sector continues to
support supply-side growth
Except for trade and repair of motor vehicles,
motorcycles, personal and household goods
and real estate, renting and business activities
sub-sector, all other services sub-sectors recorded
gains that were higher than that of Q4 2017,
namely: (1) financial intermediation (7.6 percent
from 5.2 percent); (2) transport, storage and
communication (6.4 percent from 4.9 percent);
(3) public administration and defense; compulsory
social security (13.2 percent from 8.5 percent);
and (4) other services (8.8 percent from
6.3 percent). However, the sub-sectors on trade
and repair of motor vehicles, motorcycles,
personal and household goods (6.1 percent from
8.7 percent) and real estate, renting and business
activities (4.7 percent from 6.6 percent) posted
growths lower than Q4 2017.
The acceleration in the transport, storage and
communication was due to the higher increase
in land transport and communication services.
Meanwhile, the increase in the number of
transactions in banking institutions and non-bank
financial intermediation drove the faster growth
in the financial intermediation.
The double-digit growth in the public
administration and defense was due to the
upward adjustments in the compensation for
civilian and military and uniformed government
personnel, along with the release of 2016
performance-based bonus to qualified employees
of the Department of Education (DepEd) and the
transfer of funds to the Development Bank of the
Philippines (DBP) for salaries and allowances of
poll watchers for the 2018 SK and barangay
elections. Moreover, payments made by the
social services sub-sector and other operating
requirements of the government also contributed
to the acceleration of the public administration
and defense.
The higher growth in the other services sub-sector
was driven by the activities in the social-related
sub-sectors, such as education, health and social
work. Education in Q1 2018 can be partially
attributed to the enrollment season in relatively
larger schools, such as University of the Philippines
and Ateneo de Manila University. Meanwhile,
recreation, cultural and sporting activities
continued to grow given the increase in the
number of tourist arrivals during the first
quarter of 2018.
The slower growth in the trade and repair of
motor vehicles, motorcycles, personal and
household goods sub-sector may be due to the
less optimistic consumer sentiment in Q1 2018.
As such, lower household spending may have
constrained retail and wholesale trade activities.
Real estate, renting and business activities grew at
slower rates vs. Q4 2017. The slower growth in the
real estate and renting (5.7 percent in Q1 2018 vs.
8.1 percent in Q4 2017) and other business
activities (5.3 percent in Q1 2018 vs. 8.0 percent in
Q4 2017) may be attributed to the faster y-o-y
increase on real estate prices.28
While the slide in
the value added growth of renting and other
business activities may be an effect of the policy
uncertainties in the United States with regard to
the business process outsourcing (BPO) industry.
This was reflected in the drop in foreign direct
investments in the month of January 2018,
specifically in the information and communication
and administrative and support service activities
classification, where BPO services are categorized.
28
http://www.bsp.gov.ph/statistics/keystat/rrepi.htm: Real
estate prices grew by 5.7 percent (Y-o-Y) in Q4 2017.

Q2 2018 Inflation Report | | | | 22222222
Chart 17. Gross Domestic Product
by Industrial Origin (at constant prices) year-on-year growth in percent
-6
-4
-2
0
2
4
6
8
10
12
14
Q1
2013
Q2 Q3 Q4 Q1
2014
Q2 Q3 Q4 Q1
2015
Q2 Q3 Q4 Q1
2016
Q2 Q3 Q4 Q1
2017
Q2 Q3 Q4 Q1
2018
Agriculture Industry Services
Source: PSA
1.5 pct 7.9 pct 7.0 pct
The acceleration of the industry sector may be
attributed to the faster growth in construction
(9.3 percent in Q1 2018 from 4.3 percent in
Q4 2017), manufacturing (8.0 percent in Q1 2018
from 7.9 percent in Q4 2017), and electricity, gas
and water supply (6.0 percent in Q1 2018 from
5.5 percent in Q4 2017). Meanwhile, the mining
and quarrying growth slowed down to 4.5 percent
in Q1 2018 from 5.4 percent in Q4 2017.
The acceleration in construction was caused
mainly by the substantial increase in the
government’s disbursement performance resulting
to double digit growth rates in infrastructure and
other capital outlays and capital transfers to Local
Government Units (LGUs), which is in line with the
government’s thrust of accelerating infrastructure
development under the Build, Build, Build
program.
Manufacturing sub-sector’s expansion may be
attributed to the acceleration in the food
manufacturing, publishing and printing, petroleum
and other fuel products, non-metallic mineral
products, machinery and equipment except
electrical, office, accounting and computing
machinery, electrical machinery and apparatus,
radio, television and communication equipment
and apparatus.
The utilities sub-sector grew by 6.0 percent in
Q1 2018 from the 5.5 percent in Q4 2017. This
was due to higher electricity output growth,
based on the MERALCO sales for the first quarter
of 2018. However, this was tempered by the lower
growth of water production and negative growth
of steam production.
Table 13. Gross Domestic Product by
Industrial Origin at constant 2000 prices; growth rate in percent
Q1 Q2 Q3 Q4 Q1
Agri., Hunting, Forestry and Fishing 4.9 6.3 2.6 2.4 1.5
Agriculture and Forestry 5.6 8.1 3.7 3.0 2.4
Fishing 1.2 -2.7 -2.1 -0.1 -3.7
Industry Sector 6.5 7.1 8.1 7.0 7.9
Mining and Quarrying -17.8 19.2 7.9 5.4 4.5
Manufacturing 7.7 8.0 10.1 7.9 8.0
Construction 9.7 4.3 4.0 4.3 9.3
Electricity, Gas and Water Supply 1.7 3.0 3.4 5.5 6.0
Service Sector 6.7 6.4 7.3 6.9 7.0
Transport, Storage and
Communication 4.2 3.3 3.6 4.9 6.4
Trade and Repair of Motor Vehicles,
Motorcycles, Personal and
Household Goods 7.3 5.8 7.3 8.7 6.1
Financial Intermediation 7.0 9.4 8.9 5.2 7.6
Real Estate, Renting and
Business Activities 7.0 8.1 7.8 6.6 4.7
Public Administration and Defense;
Compulsory Social Security 5.5 8.4 8.2 8.5 13.2
Other Services 7.3 4.9 7.5 6.3 8.8
Source: PSA
BY INDUSTRIAL ORIGIN2017 2018
The growth of the agriculture, hunting, forestry
and fishery (AHFF) sector decelerated in Q1 2018
to 1.5 percent from 2.4 percent in Q4 2017. The
slower growth of AHFF for the quarter was due to
the slowdown in agriculture and a further
contraction in fishing.
In the agriculture sub-sector, the deceleration
can be traced to the decline in production of
sugarcane, mango, and cassava. However,
the higher growth of palay production (from
4.4 percent in Q4 2017 to 4.6 percent in Q1 2018),
coconut including copra (from 3.7 percent in
Q4 2017 to 8.5 percent in Q1 2018), livestock
(from 1.8 percent in Q4 2017 to 2.1 percent in
Q1 2018) and poultry (from 4.7 percent in Q4 2017
to 5.2 percent in Q1 2018) as well as the recovery
in the production of corn (from -5.6 percent in
Q4 2017 to 4.7 percent in Q1 2018), moderated
the slowdown in the agriculture sub-sector.
Meanwhile, fishing continued to contract in
Q1 2018 at -3.7 percent from -0.1 percent in
Q4 2017. There was a reduction of output for
milkfish, tilapia, tiger prawn, roundscad, yellowfin
tuna and other fish varieties due to delayed
stocking caused by the typhoons (i.e., Vinta,
Agaton, Basyang, and Caloy).

Q2 2018 Inflation Report | | | | 23232323
Labor Market Conditions
Similar to the results of the January 2018 round
of the labor force survey (LFS), the Philippine labor
market improved in terms of quantity but slightly
deteriorated in terms of quality in the April 2018
round of the LFS. The country’s employment rate,
overall unemployment rate and youth
unemployment rate all improved compared to
the same period a year ago while the overall
underemployment rate increased anew.
Labor market shows
improvement
During the period, the employment rate rose to
94.5 percent, the unemployment rate declined
to 5.5 percent and the youth unemployment rate
dropped to 13.8 percent, not only better
compared to respective rates in April 2017 but
also the highest in terms of employment rate
and the lowest in terms of overall and youth
unemployment rates in all of the previous April
rounds of the LFS since 2005.29
These brought
the country closer to the targets of the
government of reducing the overall
unemployment rate to 3 to 5 percent and the
youth unemployment rate to 8 percent by 2022.
However, the government also needs to take more
actions to improve the quality of employment as
underemployment rate in the country went up
again to 17.0 percent level, after settling at
16.1 percent in the second quarter of 2017.
Chart 18. Employment Rate
in percent
91
92
93
94
95
96
Jan
20
13
Ap
r
Jul
Oct
Jan
20
14
Ap
r
Jul
Oct
Jan
20
15
Ap
r
Jul
Oct
Jan
20
16
Ap
r
Jul
Oct
Jan
20
17
Ap
r
Jul
Oct
Jan
20
18
Ap
r
Source: PSA
29
Starting April 2005, the Philippine Statistics Authority has
adopted the new unemployment definition based on
international standard per NSCB Resolution No. 15 series of
2004.
The improvement in employment rate in
April 2018 is equivalent to 625 thousand more
employed people compared to the level a year
ago, which brings the total of employed individuals
to 40.9 million. The main employment contributor
continued to be the services sector, with net
employment gain of 743 thousand or 3.3 percent
growth, coming mainly from public administration
and defense with 11.5 percent growth. This was
followed by the industry sector, with net
employment gain of 605 thousand or 8.1 percent
growth partly due to strong employment in
construction and manufacturing subsectors that
expanded by 13.1 percent and 3.1 percent,
respectively. Employment in agriculture sector,
however, declined again with net employment loss
of 723 thousand or 6.9 percent contraction. This
appears to be consistent with the rice and corn
situation outlook of the government that there
may be a decline in production of both rice and
corn in the second quarter of 2018 due to the
contraction in harvest area caused by early
planting in the previous quarter, conversion of
some areas to commercial and industrial
establishments, and inadequate water supply.30
Meanwhile, it is worth noting that among the
country’s major sub-sectors, construction posted
the highest contribution to employment growth in
April 2018 and this is mainly attributed to the
increased infrastructure spending of the National
Government (NG) under the Build, Build, Build
program.31
Chart 19. Employment by Sector in percent
-16
-14
-12
-10
-8
-6
-4
-2
0
2
4
6
8
10
12
14
16
Jan
20
13
Ap
r
Jul
Oct
Jan
20
14
Ap
r
Jul
Oct
Jan
20
15
Ap
r
Jul
Oct
Jan
20
16
Ap
r
Jul
Oct
Jan
20
17
Ap
r
Jul
Oct
Jan
20
18
Ap
r
Agriculture Industry Services
Source: PSA
The 5.5 percent unemployment rate in April 2018
is equivalent to 2.4 million unemployed
individuals. These are the lowest unemployment
rate and level that were recorded by the country
for the second quarter since 2005. However,
30
Philippine Statistics Authority (2018), “Rice and Corn
Situation and Outlook, April 2018 Round,” Special Release
2017-129, 15 May. 31
NEDA (2018), “Infra Boosts Employment for 2018,” 5 June.

Q2 2018 Inflation Report | | | | 24242424
this latest unemployment rate also implies a
year-to-date (y-t-d) unemployment rate of
5.4 percent, which is higher than the 4.7 to
5.3 percent target of the NG for 2018. Among
the youth (15-24 age group), the unemployment
rate dropped from 14.9 percent in April 2017
to 13.8 percent in April 2018, but as before, this
youth unemployment rate remains more than
twice of the country’s national rate. Also, majority
of the unemployed are still the junior high school
graduates (28.9 percent share) and college
graduates (19.6 percent) of the country’s labor
force.
Chart 20. Unemployment and Underemployment
in percent
0
5
10
15
20
25
Jan
20
13
Ap
r
Jul
Oct
Jan
20
14
Ap
r
Jul
Oct
Jan
20
15
Ap
r
Jul
Oct
Jan
20
16
Ap
r
Jul
Oct
Jan
20
17
Ap
r
Jul
Oct
Jan
20
18
Ap
r
Unemployment Underemployment
Source: PSA
Meanwhile, the 17.0 percent underemployment
rate in April 2018 is equivalent to 6.9 million
underemployed individuals, majority of which
are visible (52.5 percent) and are employed in
the services (47.1 percent share) and agriculture
(32.4 percent share) sectors. On a positive note,
however, other aspects of quality of employment
improved during the period as evidenced by
higher share of remunerative work or wage
and salary workers (63.8 percent in April 2018
from 61.3 percent a year ago) and the increase
in overall mean hours of work (hours per week)
(42.0 in April 2018 from 40.3 in April 2017), which
could imply that economic activity increased in the
second quarter of 2018.

Q2 2018 Inflation Report | | | | 25252525
II. Monetary and Financial Market Conditions
Domestic Liquidity
Domestic liquidity (M3) grew by 14.3 percent y-o-y
in May to P11.0 trillion, slightly slower than the
14.4-percent expansion as of end-Q1 2018.
Domestic liquidity continues to
grow
Money supply continued to increase due mainly
to sustained demand for credit. Domestic
claims grew by 16.8 percent in May from the
14.5-percent expansion in end-Q1 2018 as growth
in credit to the private sector continued. On the
other hand, net claims on the central government
expanded by 17.3 percent in May from 7.0 percent
in end-Q1 2018, reflecting the continued
borrowings by the National Government.
Chart 21. Domestic Liquidity
year-on-year growth rates in percent
0
5
10
15
20
25
30
35
40
Ma
r 2
01
3
Ma
y
Jun
Se
p
De
c
Ma
r 2
01
4
Ma
y
Jun
Se
p
De
c
Ma
r 2
01
5
Ma
y
Jun
Se
p
De
c
Ma
r 2
01
6
Ma
y
Jun
Se
p
De
c
Ma
r 2
01
7
Ma
y
Jun
Se
p
De
c
Ma
r 2
01
8
Ma
y
Source: BSP
Meanwhile, growth in net foreign assets (NFA)
slowed slightly to 5.4 percent y-o-y in May
from 5.6 percent in end-Q1 2018. The BSP’s NFA
position grew slightly during the review period
on the back of steady foreign exchange inflows
coming mainly from overseas Filipinos’
remittances and business process outsourcing
receipts. The NFA of banks also expanded due
largely to the faster growth in banks’ foreign
assets resulting from higher loans and
investments in marketable debt securities.
Preliminary data as of May 2018 show that
outstanding loans of commercial banks, net of
reverse repurchase (RRP) placements with the
BSP, increased at a faster rate of 19.4 percent
y-o-y relative to the 18.5-percent and 19.0-percent
growths posted at end-Q1 2018 and end-Q2 2017,
respectively.
...as lending sustains growth
due to production activities
The sustained increase in bank lending was due
largely to loans for production activities, which
expanded by 19.3 percent y-o-y in May 2018
from 18.2-percent growth in end-Q1 2018 and
17.9-percent rise in end-Q2 2017.
Chart 22. Loans Outstanding of Commercial Banks
year-on-year growth rates in percent
10
12
14
16
18
20
22
Ma
r 2
01
3
Ma
y
Jun
Se
p
De
c
Ma
r 2
01
4
Ma
y
Jun
Se
p
De
c
Ma
r 2
01
5
Ma
y
Jun
Se
p
De
c
Ma
r 2
01
6
Ma
y
Jun
Se
p
De
c
Ma
r 2
01
7
Ma
y
Jun
Se
p
De
c
Ma
r 2
01
8
Ma
ySource: BSP
The expansion in production loans was driven
primarily by increased lending to the following
sectors: wholesale and retail trade, repair of
motor vehicles and motorcycles; real estate
activities; financial and insurance activities;
manufacturing; and, electricity, gas, steam
and airconditioning supply.
Meanwhile, loans for household consumption
grew by 18.4 percent as of end-May 2018, lower
than the 19.8-percent and 22.5-percent growth
recorded in end-Q1 2018 and end-Q2 2017,
respectively.
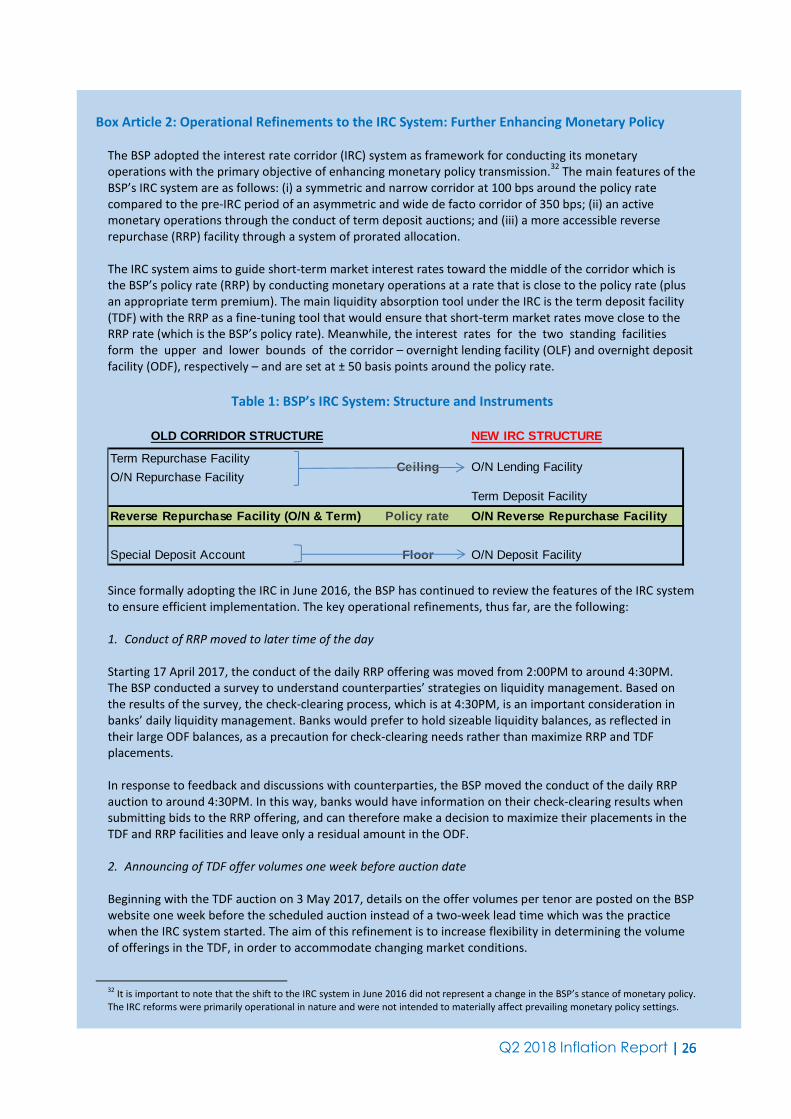
Q2 2018 Inflation Report | | | | 26262626
Box Article 2: Operational Refinements to the IRC System: Further Enhancing Monetary Policy
The BSP adopted the interest rate corridor (IRC) system as framework for conducting its monetary
operations with the primary objective of enhancing monetary policy transmission.32
The main features of the
BSP’s IRC system are as follows: (i) a symmetric and narrow corridor at 100 bps around the policy rate
compared to the pre-IRC period of an asymmetric and wide de facto corridor of 350 bps; (ii) an active
monetary operations through the conduct of term deposit auctions; and (iii) a more accessible reverse
repurchase (RRP) facility through a system of prorated allocation.
The IRC system aims to guide short-term market interest rates toward the middle of the corridor which is
the BSP’s policy rate (RRP) by conducting monetary operations at a rate that is close to the policy rate (plus
an appropriate term premium). The main liquidity absorption tool under the IRC is the term deposit facility
(TDF) with the RRP as a fine-tuning tool that would ensure that short-term market rates move close to the
RRP rate (which is the BSP’s policy rate). Meanwhile, the interest rates for the two standing facilities
form the upper and lower bounds of the corridor – overnight lending facility (OLF) and overnight deposit
facility (ODF), respectively – and are set at ± 50 basis points around the policy rate.
Table 1: BSP’s IRC System: Structure and Instruments
OLD CORRIDOR STRUCTURE NEW IRC STRUCTURE
Term Repurchase Facility
O/N Repurchase Facility
Term Deposit Facility
Reverse Repurchase Facility (O/N & Term) Policy rate O/N Reverse Repurchase Facility
Special Deposit Account Floor O/N Deposit Facility
O/N Lending FacilityCeiling
Since formally adopting the IRC in June 2016, the BSP has continued to review the features of the IRC system
to ensure efficient implementation. The key operational refinements, thus far, are the following:
1. Conduct of RRP moved to later time of the day
Starting 17 April 2017, the conduct of the daily RRP offering was moved from 2:00PM to around 4:30PM.
The BSP conducted a survey to understand counterparties’ strategies on liquidity management. Based on
the results of the survey, the check-clearing process, which is at 4:30PM, is an important consideration in
banks’ daily liquidity management. Banks would prefer to hold sizeable liquidity balances, as reflected in
their large ODF balances, as a precaution for check-clearing needs rather than maximize RRP and TDF
placements.
In response to feedback and discussions with counterparties, the BSP moved the conduct of the daily RRP
auction to around 4:30PM. In this way, banks would have information on their check-clearing results when
submitting bids to the RRP offering, and can therefore make a decision to maximize their placements in the
TDF and RRP facilities and leave only a residual amount in the ODF.
2. Announcing of TDF offer volumes one week before auction date
Beginning with the TDF auction on 3 May 2017, details on the offer volumes per tenor are posted on the BSP
website one week before the scheduled auction instead of a two-week lead time which was the practice
when the IRC system started. The aim of this refinement is to increase flexibility in determining the volume
of offerings in the TDF, in order to accommodate changing market conditions.
32
It is important to note that the shift to the IRC system in June 2016 did not represent a change in the BSP’s stance of monetary policy.
The IRC reforms were primarily operational in nature and were not intended to materially affect prevailing monetary policy settings.
Q2 2018 Inflation Report | | | | 27272727
3. Introduction of a 14-day TDF tenor
On 14 February 2018, the BSP started offering a 14-day tenor in its TDF in response to the strong interest of
various counterparties for a tenor longer than 7 days but shorter than 28 days following a series of BSP
consultations.
Focusing on shorter-tenored term deposits is in line with international central banking practice of using term
deposits as an ideal short-term sterilization tool. Central banks with corridor systems usually lever the very
short-end of the yield curve, from overnight to two weeks of maturity with an intention to steer the market
interest rates until the end of the reserve maintenance period, usually coinciding with a central bank’s
monetary policy meetings.33
4. Varying auction offer volumes in the TDF
Following the migration of funds from the special deposit account (SDA) in the pre-IRC period to the TDF and
ODF in the second half of 2017, the BSP started to actively adjust weekly offer volumes in the TDF,
consistent with the liquidity forecasts instead of the earlier practice of announcing fixed offer amounts.
Varying the weekly TDF offer volumes affords the BSP with sufficient operational flexibility in taking into
account recent developments in the money market when conducting monetary operations. Moreover, it
would encourage active and dynamic liquidity management as banks will have to consider a broader range
of volume and make more calibrated decisions on their bids.
Moving forward, the BSP is considering the following additional operational refinements:
1. Introduce scope to re-allocate total volume offer across the different tenors of the TDF;
2. Increase the TDF auction frequency from the current one auction per week;
3. Further shorten the lead time in announcing of TDF offer volumes;
4. Lengthen the reserve maintenance period from the current one week cycle; and
5. Transform the RRP facility from a fixed-rate, fixed-volume auction to a variable-rate,
variable-volume auction.
The continuous efforts of the BSP to refine its monetary operations are meant to enhance its capacity to
guide short-term market interest rates to move closely with the BSP policy rate, and in the process,
strengthen the transmission of changes in the monetary policy stance to the rest of the economy.
33
Gray and Talbot, “Handbooks in Central Banking No. 24 Monetary Operations.” Centre for Central Banking Studies, Bank of England.
2006.

Q2 2018 Inflation Report | | | | 28282828
Monetary Operations
For Q2 2018, majority of the BSP’s monetary
operations had been through the reverse
repurchase (RRP) facility, comprising about
61.5 percent of total. Meanwhile, the BSP’s
deposit facilities – namely, the term deposit facility
(TDF) and the overnight deposit facility (ODF),
made up the remaining 38.5 percent.
Market demand for the TDF remained generally
strong during the review quarter. The average
bid-to-cover ratios for the 7-day, 14-day and
28-day tenors were at 1.3, 1.1, and 1.0,
respectively, from 2.0, 1.3, and 1.5 in the
previous quarter.34
On the other hand, the
average bid-to-cover ratio for the daily RRP facility
was at about 1.0 from 1.5 in the previous quarter.
Liquidity conditions during the quarter were
affected by holidays (such as Holy Week in April),
barangay elections in May, as well as the
P121.8-billion Retail Treasury Bonds issuance
by the NG in early June. In view of these, offer
volumes for the various tenors of the TDF were
reviewed and adjusted accordingly, based on the
BSP’s assessment of prevailing liquidity conditions.
The TDF auctions are conducted every Wednesday
while the RRP auction is a daily fine-tuning
operation.
Credit Conditions
Credit Standards. Results of the Q2 2018 Senior
Bank Loan Officers’ Survey (SLOS) showed that
most of the respondent banks continued to
maintain their credit standards for loans to both
enterprises and households during the quarter
based on the modal approach.35
Majority of banks keep credit
standards steady
This is the 37th
consecutive quarter since Q2 2009
that the majority of respondent banks reported
broadly unchanged credit standards.
34
The BSP started offering the 14-day tenor on 14 February
2018 while the 28-day tenor was reoffered starting 7 February
2018. 35
In the modal approach, the results of the survey are analyzed
by looking at the option with the highest share of responses.
Meanwhile, the diffusion index (DI) approach36,37
showed a net tightening of credit standards for
both loans to enterprises and households. In the
previous quarter, credit standards for loans to
enterprises were unchanged while those for loans
to households showed a net tightening based on
the DI approach.
Lending to Enterprises. Most banks (82.1 percent
of banks that responded to the question) indicated
that credit standards for loans to enterprises were
maintained during the quarter using the modal
approach.
Table 14. General Credit Standards for Loans to
Enterprises (Overall)
Q1 Q2 Q3 Q4 Q1 Q2
Tightened Considerably 0.0 0.0 0.0 0.0 0.0 3.6
Tightened Somewhat 6.7 10.0 7.4 3.7 3.7 10.7
Remained Basically Unchanged 93.3 90.0 88.9 88.9 92.6 82.1
Eased Somewhat 0.0 0.0 3.7 7.4 3.7 3.6
Eased Considerably 0.0 0.0 0.0 0.0 0.0 0.0
Total 100.0 100.0 100.0 100.0 100.0 100.0
Diffusion Index for Credit Standards 6.7 10.0 3.7 -3.7 0.0 10.7
Weighted Diffusion Index for Credit Standards 3.3 5.0 1.9 -1.9 0.0 7.1
Mean 2.9 2.9 3.0 3.0 3.0 2.9
Number of Banks Responding 30 30 27 27 27 28
Note: A pos i ti ve diffus ion index for credi t s tanda rds indicates tha t more banks have tightened thei r credi t
sta ndards compa red to thos e that ea sed ("net tightening"), whereas a negative di ffus ion index for credit
sta ndards indica tes that more banks ha ve ea s ed thei r credi t s tanda rds compared to those tha t tightened
("net ea s ing").
Source: BSP
2017 2018
Meanwhile, results based on the DI approach
pointed to a net tightening of credit standards for
the quarter, which was largely attributed by
respondent banks to their perception of stricter
financial system regulations, and deterioration of
the profile of corporate borrowers. DI-based
results in terms of specific credit standards38
36
In the diffusion index approach, a positive diffusion index (DI)
for credit standards indicates that the proportion of banks that
have tightened their credit standards are greater compared to
those that eased (“net tightening”), whereas a negative DI for
credit standards indicates that more banks have eased their
credit standards compared to those that tightened (“net
easing”). 37
From Q1 2010 to Q4 2012 survey rounds, the BSP used
largely the DI approach in the analysis of survey results.
Beginning in Q1 2013, the BSP used both the modal and DI
approaches in assessing the results of the survey. 38
The survey questionnaire asks banks to describe changes in
six specific credit standards: (1) loan margins (price-based);
(2) collateral requirements; (3) loan covenants; (4) size of credit
lines; (5) length of loan maturities; and (6) use of interest rate
floors. A loan covenant is an agreement or stipulation laid
down in loan contracts, particularly contracts with enterprises,
under which the borrower pledges either to take certain action
(an affirmative covenant), or to refrain from taking certain
action (a negative covenant); this is consequently part of the
terms and conditions of the loan. Meanwhile, an interest rate
floor refers to a minimum interest rate for loans. Greater use of
interest rate floor implies tightening while less use indicates
otherwise.

Q2 2018 Inflation Report | | | | 29292929
pointed to stricter collateral requirements, shorter
loan maturity periods, and increased use of
interest rate floors, reflecting the net tightening of
overall credit standards for corporate loans.
In terms of borrower firm size, banks’ responses
indicated a net tightening of credit standards for
loans to large middle-market enterprises, small
and medium enterprises (SMEs) and micro-
enterprises. Meanwhile, credit standards for loans
to top corporations were unchanged based on the
DI approach.
For the next quarter, results based on the modal
approach showed that most of the respondent
banks anticipate unchanged credit standards.
Meanwhile, the DI approach showed that more
respondent banks expect overall credit standards
for business loans to tighten over the next quarter
compared to those that expect the opposite,
largely on account of banks’ perception of stricter
financial system regulations and expectations of a
decline in deposit base of banks and deterioration
of the profile of their corporate borrowers.
Lending to Households. The results of the
survey also showed that most respondent banks
(94.1 percent) kept their overall credit standards
unchanged for loans extended to households
during the quarter based on the modal approach.
Meanwhile, results based on the DI approach
reflected a net tightening of credit standards for
household loans. In particular, credit standards for
credit card and personal/salary loans tightened
due mainly to respondent banks’ reduced
tolerance for risk.
Table 15. General Credit Standards for Loans to
Households (Overall)
Q1 Q2 Q3 Q4 Q1 Q2
Tightened Considerably 0.0 0.0 0.0 0.0 0.0 0.0
Tightened Somewhat 0.0 9.1 5.0 0.0 15.8 5.9
Remained Basically Unchanged 100.0 81.8 90.0 90.5 78.9 94.1
Eased Somewhat 0.0 9.1 5.0 9.5 5.3 0.0
Eased Considerably 0.0 0.0 0.0 0.0 0.0 0.0
Total 100.0 100.0 100.0 100.0 100.0 100.0
Diffusion Index for Credit Standards 0.0 0.0 0.0 -9.5 10.5 5.9
Weighted Diffusion Index for Credit Standards 0.0 0.0 0.0 -4.8 5.3 2.9
Mean 3.0 3.0 3.0 3.1 2.9 2.9
Number of Banks Responding 21 22 20 21 19 17
Note: A pos i ti ve diffus ion index for credi t s tanda rds indicates tha t more banks have tightened thei r credi t
sta ndards compa red to thos e that ea sed ("net tightening"), whereas a negative di ffus ion index for credit
sta ndards indica tes that more banks ha ve ea s ed thei r credi t s tanda rds compared to those tha t tightened
("net ea s ing").
Source: BSP
2017 2018
In terms of respondent banks’ outlook for the next
quarter, results based on the modal approach
indicated that the majority of the respondent
banks anticipate maintaining their overall credit
standards. Meanwhile, DI-based results pointed
expectations of a slight net easing of credit
standards for household loans as respondent
banks anticipate an improvement in the
profitability and liquidity of their portfolio, among
others.
Loan demand. Responses to the survey question
on loan demand indicated that the majority of the
respondent banks continued to see stable overall
demand for loans from both enterprises and
households.
Demand for loans from firms
and households remain stable
Using the DI approach, however, results showed a
net increase in loan demand39
across all firm sizes
and all types of household loans (except
personal/salary loans). The net increase in loan
demand for firms was attributed by banks to their
customers’ higher working capital requirements
and improvement in corporate customers’ outlook
during the quarter. Meanwhile, respondent banks
attributed the net increase in loan demand from
households to low interest rates and more
attractive financing terms offered by banks, as well
as increased household consumption.
Over the next quarter, most of the respondent
banks expect unchanged loan demand from both
firms and households. However, a larger
proportion of respondents expect overall demand
for corporate and household loans to increase in
the next quarter relative to those who indicated
the opposite. Respondent banks cited
expectations of higher investment in plant or
equipment and increased working capital needs as
the key factors behind the expected increase in
demand for business loans. Meanwhile, the
anticipated net increase in household loan
demand was attributed by respondent banks to
low interest rates along with higher household
consumption.
39
The “DI for loan demand” refers to the percentage difference
between banks reporting an increase in loan demand and
banks reporting a decrease. A positive DI for loan demand
indicates that more banks reported an increase in loan demand
compared to those stating the opposite, whereas a negative DI
for loan demand implies that more banks reported a decrease
in loan demand compared to those reporting an increase.

Q2 2018 Inflation Report | | | | 30303030
Real Estate Loans. Most of the respondent banks
(90.5 percent) indicated unchanged credit
standards for commercial real estate loans in
Q2 2018.
Majority of banks maintain
credit standards for real
estate loans
The DI approach, however, continued to indicate a
net tightening of overall credit standards for
commercial real estate loans for the tenth
consecutive quarter. The tighter overall credit
standards for commercial real estate loans
reflected respondent banks’ wider loan margins,
reduced credit line sizes, stricter collateral
requirements and loan covenants, and increased
use of interest rate floors. Over the next quarter,
while majority of the respondent banks foresee
maintaining their credit standards for commercial
real estate loans, DI-based results point to
expectations of continued net tightening of credit
standards for the said type of loan.
Demand for commercial real estate loans was also
unchanged in Q2 2018 based on the modal
approach. A number of banks, however, indicated
increased demand for the said type of loan on the
back of increased investment in plant and
equipment, higher working capital needs, banks’
more attractive financing terms and low interest
rates. Over the next quarter, although most of the
respondent banks anticipate generally steady loan
demand, a number of banks expect demand for
commercial real estate loans to continue to
increase.
Meanwhile, credit standards for housing loans
extended to households were unchanged based on
both modal and DI approaches reflecting
respondent banks’ unchanged tolerance for risk
and steady profile of borrowers. Over the next
quarter, results based on both the modal and
diffusion index approaches likewise showed that
respondent banks foresee unchanged overall
credit standards for housing loans on the back of
their unchanged tolerance for risk, steady profile
of housing loan borrowers and respondent banks’
stable economic outlook. Most banks reported
unchanged housing loan demand in Q2 2018
based on the modal approach while DI-based
results pointed to a net increase in demand for
housing loans during the quarter. Banks’ responses
likewise indicated expectations of sustained net
increase in demand for housing loans over the
next quarter.
Interest Rates
Primary Interest Rates
In Q2 2018, the average rates for the 91-day,
182-day, and 364-day T-bills in the primary market
increased to 3.408 percent, 3.829 percent, and
4.262 percent from 2.637 percent, 2.813 percent,
and 3.088 percent, respectively, in the previous
quarter.
T-bill rates in the primary
market increase
The results of the auction reflected strong market
preference for the shorter-tenored notes following
the May and June interest rate hikes by the BSP
and the US Federal Reserve.
Chart 23. Treasury Bill Rates in percent
0
1
2
3
4
5
Q1
20
13
Q1
Q2
Q3
Q1
20
14
Q4
Q1
Q2
Q1
20
15
Q3
Q4
Q1
Q1
20
16
Q2
Q3
Q4
Q1
20
17
Q2
Q3
Q4
Q1
20
18
Q2
91-day T-bill Rate
182-day T-bill Rate
364-day T-bill Rate
Source: BTr
Yield Curve. As of end-June 2018, the secondary
market yield for government securities (GS) for
all tenors rose generally except for the 7-year GS
relative to the end-March 2018 levels as general
sentiment continued to be cautious ahead of the
release of the June 2018 inflation data.
Yield curve rose in end-June
2018

Q2 2018 Inflation Report | | | | 31313131
Debt paper yields were higher by a range of
48.9 bps (7-year GS) to 139.9 bps (1-year GS)
compared to end-March 2018 levels.
Chart 24. Yields of Government Securities in the
Secondary Market in percent
0
1
2
3
4
5
6
7
8
3Mo 6Mo 1Yr 2Yr 3yr 4Yr 5Yr 7Yr 10Yr 20Yr 25Yr
Jun 2017 Mar 2018 Jun 2018
Source: Bloomberg
Relative to year-ago levels, the secondary market
yields of GS for all maturities likewise increased by
a range of 91.2 bps for the 2-year GS to 227.6 bps
for the 20-year GS.
Interest Rate Differentials. The average
differentials between domestic and US interest
rates, gross and net of tax, widened further in
Q2 2018 relative to the previous quarter.
Interest rate differentials
widen further
The average 91-day RP T-bill rate rose q-o-q
by 74.9 bps to 3.401 percent in Q2 2018 from
2.652 percent in Q1 2018. Likewise, the average
US 90-day LIBOR and the US 90-day T-bill rate
increased by 41.1 bps and 17.2 bps, respectively,
to 2.338 percent and 1.935 percent in Q2 2018.
These developments led to wider positive gross
and net of tax differentials between the 91-day
RP T-bill rate and US interest rates. Domestic
and foreign interest rates rose during the quarter
following the BSP’s 50-bp and the US Fed’s quarter
point policy rate hikes.
Chart 25. Interest Rate Differentials
quarterly averages; in basis points
-50
0
50
100
150
200
250
Q1
20
13
Q4
Q1
Q2
Q1
20
14
Q3
Q4
Q1
Q1
20
15
Q2
Q3
Q4
Q1
20
16
Q2
Q3
Q4
Q1
20
17
Q2
Q3
Q4
Q1
20
18
Q2
RP 91-day T-bill vs. US 90-day LIBOR (before tax) RP 91-day T-bill vs. US 90-day T-bill (before tax)
RP 91-day T-bill vs. US 90-day LIBOR (after tax) RP 91-day T-bill vs. US 90-day T-bill (after tax)
Source: Bloomberg, BTr and BSP
The positive differential between the BSP's
overnight borrowing or RRP rate and the
US Fed funds target rate widened to a range
of 150-175 bps in Q2 2018 from 125-150 bps
in Q1 2018, reflecting the impact of the 50-bp
increases in the BSP’s RRP rate to 3.25 percent on
10 May and 3.50 percent on 20 June as well as the
25-bp increase in the US Fed funds target rate to
1.75-2.00 percent on 14 June 2018.
Chart 26. BSP RRP Rate and US Federal Funds
Target Rate
in percent
-1
0
1
2
3
4
5
Q1
20
13
Q4
Q1
Q2
Q1
20
14
Q3
Q4
Q1
Q1
20
15
Q2
Q3
Q4
Q1
20
16
Q2
Q3
Q4
Q1
20
17
Q2
Q3
Q4
Q1
20
18
Q2
BSP RRP Rate
US Federal Funds Target Rate
Source: Bloomberg and BSP
Meanwhile, the interest rate differential between
the BSP’s overnight RRP rate and the US Fed funds
target rate adjusted for risk40
narrowed further
to 41 bps as of end-June 2018 from 48 bps in
end-March 2018. This development could be
traced to the 25-bp rise in the positive interest
rate differential between the BSP’s RRP rate and
the US Fed funds target rate combined with a
higher risk premium following the 39-bp and 8-bp
increases in the 10-year ROP note and 10-year US
note to 3.94 percent and 2.86 percent,
respectively.
40
The difference between the 10-year ROP note and the
10-year US Treasury note is used as proxy for the risk premium.

Q2 2018 Inflation Report | | | | 32323232
Chart 27. Risk-Adjusted Differentials
in basis points
20
45
70
95
120
145
170
195
220
245
270
295
320
Q1
20
13
Q4
Q1
Q2
Q1
20
14
Q3
Q4
Q1
Q1
20
15
Q2
Q3
Q4
Q1
20
16
Q2
Q3
Q4
Q1
20
17
Q2
Q3
Q4
Q1
20
18
Q2
Source: Bloomberg and BSP
The 10-year ROP and US notes rose on renewed
investor demand for risky assets as trade tensions
between the US and China eased; geopolitical
concerns between the US and Syria moderated;
and an aggressive monetary policy tightening by
the US Fed amid rising inflation expectations due
to higher oil and steel prices; and the release of
stronger-than-expected US data on retail sales,
home sales, manufacturing and non-farm payrolls,
lower unemployment and higher wages.
Domestic real lending rate41
decreased further to
-0.7 percent in June 2018 from -0.2 percent in
March 2018. This was due to the 90-bp rise in
inflation to 5.2 percent (2012=100) combined with
the 40-bp increase in actual bank lending rate42
to
4.5 percent in June 2018.
Real lending rate decreases
further
Chart 28. Philippines’ Real Lending Rate
in percent
-1
0
1
2
3
4
5
Mar
2013
Jun Sep Dec Mar
2014
Jun Sep Dec Mar
2015
Jun Sep Dec Mar
2016
Jun Sep Dec Mar
2017
Jun Sep Dec Mar
2018
Jun
Source: PSA and BSP
41
Real lending rate is measured as the difference between
actual bank lending rate and inflation. 42
The actual bank lending rate for the Philippines is the
weighted average interest rate charged by reporting
commercial banks on loans and discounts granted during the
period.
The Philippines’ real lending rate at -0.7 percent in
June 2018 remained the lowest for the fourth
consecutive month in a sample of 10 Asian
countries, with Indonesia recording the highest
real lending rate at 7.2 percent followed by
Singapore at 4.9 percent while Japan posted
second to the lowest at 0.3 percent.
Financial Market Conditions
The domestic financial system in Q2 reflected the
volatility stemming primarily from the external
environment. Nevertheless, sound banking system
and firm economic growth prospects supported
investor appetite for domestic assets.
Domestic financial market
conditions reflect external
uncertainty
Stock Market. In Q2 2018, the Philippine Stock
Exchange index (PSEi) retreated by 11.1 percent,
q-o-q, to average 7,618.99 index points during
the review period.
Chart 29. Quarterly Average PSEi
In basis points
5,500
6,000
6,500
7,000
7,500
8,000
8,500
9,000
Q1
20
13
Q2
Q3
Q4
Q1
20
14
Q2
Q3
Q4
Q1
20
15
Q2
Q3
Q4
Q1
20
16
Q2
Q3
Q4
Q1
20
17
Q2
Q3
Q4
Q1
20
18
Q2
Source: Philippine Stock Exchange, BSP
During the quarter, a combination of factors
pushed the benchmark index lower
month-on-month (m-o-m). Concerns over
developments overseas, such as the looming
trade war between the US and China, geopolitical
concerns involving the US, Syria, North Korea,
Iran and Italy and rising US Treasury yields,
weighed down the main index. On the local front,
the country’s higher-than-expected domestic
inflation, widening merchandise trade deficit
and the peso weakening to a 12-year low also
helped push the PSEi lower. Partly tempering the
decline were reports of the robust Q1 GDP growth,

Q2 2018 Inflation Report | | | | 33333333
the BSP’s decision to cut reserve requirements for
the second time this year effective June 1 and its
policy rate hikes in May and June to curb rising
inflation. In June, local equities entered bear
market territory43
amid worsening trade tensions
between the US and some of its major trading
partners44
and the continued depreciation of the
peso.
External headwinds and
inflation concerns weakened
the local bourse in Q2 2018
Mirroring the index’s decline, total market
capitalization declined 7.9 percent q-o-q to close
at P15.79 trillion in June 2018. Foreign investors
also continued to post net sales amounting to
P31.78 billlion during the period, albeit slightly less
than the P34.0 billion net sales posted in the
preceding quarter. Meanwhile, the price-earnings
ratio for listed issues also dropped from 20.65x on
30 March to 18.37x as of end-June 2018.
Government Securities. Results of the T-bill
auctions conducted in Q2 2018 (April - June)
continued to show robust demand for T-bills with
total subscription for the quarter amounting to
P321.4 billion, about 1.7 times the P195.0-billion
total offered amount. The oversubscription for
Q2 2018, at P126.4 billion, was higher than the
P59.2 billion oversubscription in the previous
quarter.
43
On 21 June, the PSEi closed at 7,098.15 index points, more
than 21 percent lower than the peak posted on 29 January of
9,058.62 index points. 44
Trade tensions widened between the United States on the
one hand and China, the European Union and lately India on
the other. In retaliation against the Trump administration’s
tariff hikes on steel and aluminum, Beijing has vowed to impose
its own tariffs on US soybeans and other farm products, while
the European Union is set to slap tariffs on $3.4 billion in
Moreover, India and Turkey have already raised import duties
on US products, ranging from rice to autos to sunscreen.
Demand for local GS remains
robust
The Bureau of Treasury (BTr) awarded in full all the
₱5.0-billion offered amount for the 91-day T-bills
during the quarter, except for the auction on 2
April and 25 June wherein the BTr only made a
partial award. Meanwhile, for the 18-June auction,
the BTr rejected all bids tendered. For the 182-day
T-bills, the BTr partially awarded bids for the 16-
Aprill, 23-April, 30-April and 25-June auctions vis-
à-vis the ₱4.0-billion offered amount, while it
rejected in full all bids for the 2-April and 10-April
auctions. Moreover, for the 364-day T-bills, the
BTr awarded in full the ₱6.0-billion offered amount
during the 25-May auction. Meanwhile, the BTr
rejected all bids for the 2-April, 10-April, 30-April
and 7-May auctions, and made partial awards for
the other auction schedules during the quarter.
Chart 30. Total Oversubscription of T-bill Auctions
0
20
40
60
80
100
120
140
160
180
200
Q1
20
13
Q2
Q3
Q4
Q1
20
14
Q2
Q3
Q4
Q1
20
15
Q2
Q3
Q4
Q1
20
16
Q2
Q3
Q4
Q1
20
17
Q2
Q3
Q4
Q1
20
18
Q2
Source: Bureau of the Treasury
Sovereign Bond and CDS Spreads. In April, debt
spreads widened as China retaliated against
US trade tariffs by imposing tariffs on US food
exports. This negative development spooked
investors as the possibility of a full blown trade
war between the two countries increased.
Debt spreads wider due to
external developments

Q2 2018 Inflation Report | | | | 34343434
In May, debt spreads widened further as investors
seemed to have rebalanced their portfolio away
from emerging economies due to the
strengthening US dollar and higher long-term
treasury yields indicating a stronger US economy.
Moreover, other advanced economies such as the
European Union (EU) have indicated that their
stimulus programs will not be extended when
these expire, indicating a stronger outlook in
advanced economies.
In June, debt spreads continued to widen due to
the worsening trade tensions between the US and
some of its trading partners such as the EU, Turkey
and India. These countries have raised import
duties on certain US products. On the domestic
front, the country’s higher-than-expected
domestic inflation, widening merchandise trade
deficit and depreciating peso to a 12-year low
may have caused market jitters. However, the
negative sentiment was partly tempered by the
robust Q1 GDP growth figures and the BSP’s policy
actions to curb inflation.
As of end-June, the Philippines’ 5-year sovereign
credit default swaps (CDS) stood at 91 bps, higher
than the 74 bps in end-1Q 2018. It has remained
lower than Indonesia’s 136 bps and Malaysia’s
107 bps but higher than and Korea’s 49 bps and
Thailand’s 48 bps in the current quarter.
Chart 31. 5-Year CDS Spreads of Selected ASEAN
Countries
in basis points
0
50
100
150
200
250
300
Q1
20
13
Q2
Q3
Q4
Q1
20
14
Q2
Q3
Q4
Q1
20
15
Q2
Q3
Q4
Q1
20
16
Q2
Q3
Q4
Q1
20
17
Q2
Q3
Q4
Q1
20
18
Q2
Philippines
Indonesia
Thailand
Malaysia
Source: Bloomberg
Meanwhile, the EMBIG Philippines ended the
quarter wider at 132 bps when compared to the
previous quarter’s closing of 102 bps.
Chart 32. EMBIG Spreads of Selected ASEAN
Countries in basis points
0
50
100
150
200
250
300
350
400
Q1
2013
Q2 Q3 Q4 Q1
2014
Q2 Q3 Q4 Q1
2015
Q2 Q3 Q4 Q1
2016
Q2 Q3 Q4 Q1
2017
Q2 Q3 Q4 Q1
2018
EMBIG Philippines EMBIG Malaysia EMBIG Indonesia
Source: Bloomberg
Banking System
The Philippine banking system continued to
support long-term economic growth and stable
financial condition. During the review quarter,
banks’ balance sheets exhibited sustained growth
in assets and deposits.
Philippine banking system
exhibits steady growth in
assets and deposits
Furthermore, asset quality indicators remained
healthy while capital adequacy ratios continued to
be above international standards, even with the
implementation of the tighter Basel III framework.
Savings Mobilization. Savings deposits remained
the primary sources of funds for the banking
system. Banks’ total deposits as of end-May 2018
amounted to P9.5 trillion, 13.3 percent or
P1.1 trillion higher than the year-ago level.45
Relative to the end-March 2018 level, total
deposits grew marginally by 1.0 percent.
Meanwhile, foreign currency deposits owned by
residents (FCD-Residents) reached P1.9 trillion
during the same period, posting a year-on-year
growth of 7.8 percent. With respect to the end-
March 2018 level, FCD-Residents grew by
1.1 percent.46
45
This refers to the total peso-denominated deposits of the
banking system. 46
FCD-Residents, along with M3, forms part of a money supply
measure called M4. Meanwhile, M3 consists of savings
deposits, time deposits, demand deposits, currency in
circulation, and deposit substitutes.
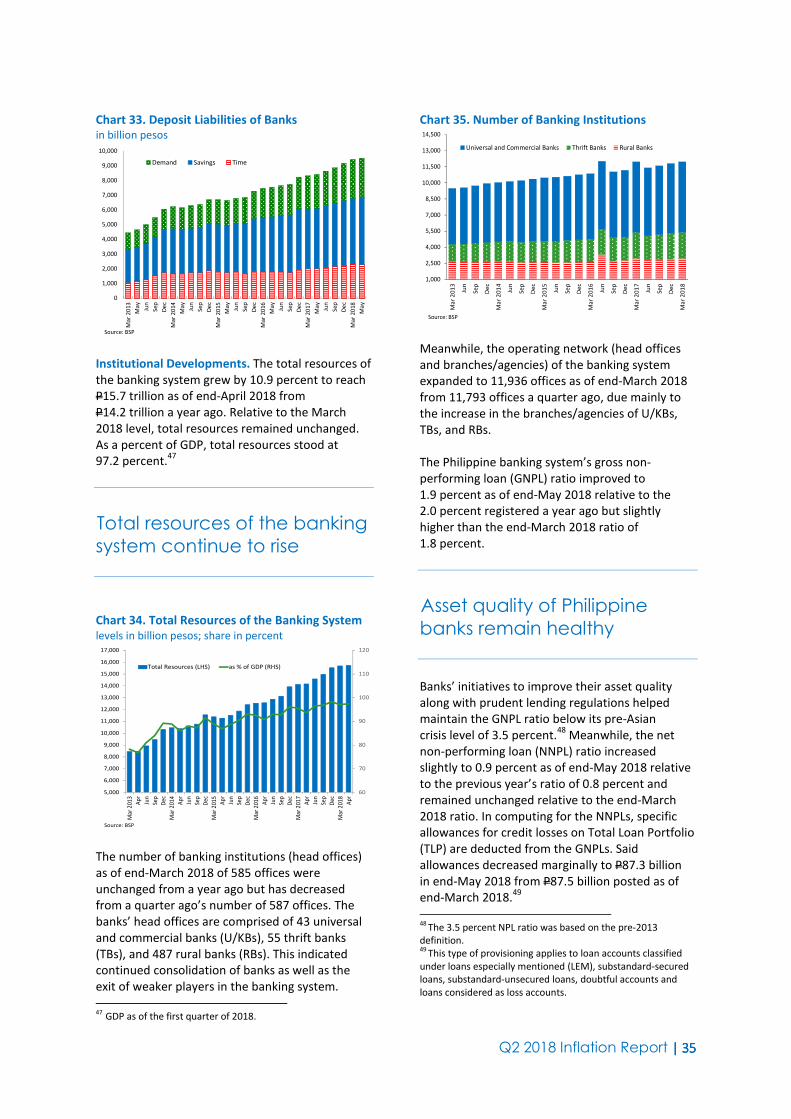
Q2 2018 Inflation Report | | | | 35353535
Chart 33. Deposit Liabilities of Banks in billion pesos
0
1,000
2,000
3,000
4,000
5,000
6,000
7,000
8,000
9,000
10,000
Ma
r 2
01
3
Ma
y
Jun
Se
p
De
c
Ma
r 2
01
4
Ma
y
Jun
Se
p
De
c
Ma
r 2
01
5
Ma
y
Jun
Se
p
De
c
Ma
r 2
01
6
Ma
y
Jun
Se
p
De
c
Ma
r 2
01
7
Ma
y
Jun
Se
p
De
c
Ma
r 2
01
8
Ma
y
Demand Savings Time
Source: BSP
Institutional Developments. The total resources of
the banking system grew by 10.9 percent to reach
P15.7 trillion as of end-April 2018 from
P14.2 trillion a year ago. Relative to the March
2018 level, total resources remained unchanged.
As a percent of GDP, total resources stood at
97.2 percent.47
Total resources of the banking
system continue to rise
Chart 34. Total Resources of the Banking System
levels in billion pesos; share in percent
60
70
80
90
100
110
120
5,000
6,000
7,000
8,000
9,000
10,000
11,000
12,000
13,000
14,000
15,000
16,000
17,000
Mar
201
3
Ap
r
Jun
Sep
Dec
Mar
201
4
Ap
r
Jun
Sep
Dec
Mar
201
5
Ap
r
Jun
Sep
Dec
Mar
201
6
Ap
r
Jun
Sep
Dec
Mar
201
7
Ap
r
Jun
Sep
Dec
Mar
201
8
Ap
r
Total Resources (LHS) as % of GDP (RHS)
Source: BSP
The number of banking institutions (head offices)
as of end-March 2018 of 585 offices were
unchanged from a year ago but has decreased
from a quarter ago’s number of 587 offices. The
banks’ head offices are comprised of 43 universal
and commercial banks (U/KBs), 55 thrift banks
(TBs), and 487 rural banks (RBs). This indicated
continued consolidation of banks as well as the
exit of weaker players in the banking system.
47 GDP as of the first quarter of 2018.
Chart 35. Number of Banking Institutions
1,000
2,500
4,000
5,500
7,000
8,500
10,000
11,500
13,000
14,500
Ma
r 2
01
3
Jun
Se
p
De
c
Ma
r 2
01
4
Jun
Se
p
De
c
Ma
r 2
01
5
Jun
Se
p
De
c
Ma
r 2
01
6
Jun
Se
p
De
c
Ma
r 2
01
7
Jun
Se
p
De
c
Ma
r 2
01
8
Universal and Commercial Banks Thrift Banks Rural Banks
Source: BSP
Meanwhile, the operating network (head offices
and branches/agencies) of the banking system
expanded to 11,936 offices as of end-March 2018
from 11,793 offices a quarter ago, due mainly to
the increase in the branches/agencies of U/KBs,
TBs, and RBs.
The Philippine banking system’s gross non-
performing loan (GNPL) ratio improved to
1.9 percent as of end-May 2018 relative to the
2.0 percent registered a year ago but slightly
higher than the end-March 2018 ratio of
1.8 percent.
Asset quality of Philippine
banks remain healthy
Banks’ initiatives to improve their asset quality
along with prudent lending regulations helped
maintain the GNPL ratio below its pre-Asian
crisis level of 3.5 percent.48
Meanwhile, the net
non-performing loan (NNPL) ratio increased
slightly to 0.9 percent as of end-May 2018 relative
to the previous year’s ratio of 0.8 percent and
remained unchanged relative to the end-March
2018 ratio. In computing for the NNPLs, specific
allowances for credit losses on Total Loan Portfolio
(TLP) are deducted from the GNPLs. Said
allowances decreased marginally to P87.3 billion
in end-May 2018 from P87.5 billion posted as of
end-March 2018.49
48
The 3.5 percent NPL ratio was based on the pre-2013
definition. 49
This type of provisioning applies to loan accounts classified
under loans especially mentioned (LEM), substandard-secured
loans, substandard-unsecured loans, doubtful accounts and
loans considered as loss accounts.
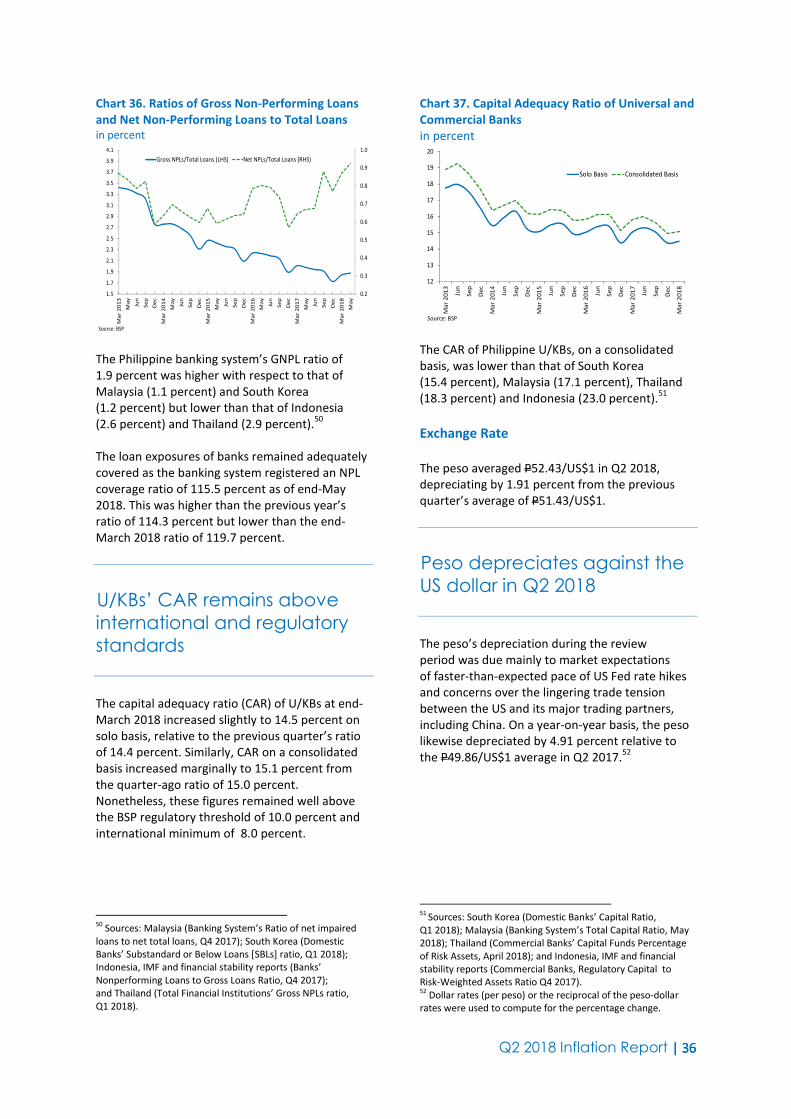
Q2 2018 Inflation Report | | | | 36363636
Chart 36. Ratios of Gross Non-Performing Loans
and Net Non-Performing Loans to Total Loans in percent
0.2
0.3
0.4
0.5
0.6
0.7
0.8
0.9
1.0
1.5
1.7
1.9
2.1
2.3
2.5
2.7
2.9
3.1
3.3
3.5
3.7
3.9
4.1
Ma
r 2
01
3
Ma
y
Jun
Se
p
De
c
Ma
r 2
01
4
Ma
y
Jun
Se
p
De
c
Ma
r 2
01
5
Ma
y
Jun
Se
p
De
c
Ma
r 2
01
6
Ma
y
Jun
Se
p
De
c
Ma
r 2
01
7
Ma
y
Jun
Se
p
De
c
Ma
r 2
01
8
Ma
y
Gross NPLs/Total Loans (LHS) Net NPLs/Total Loans (RHS)
Source: BSP
The Philippine banking system’s GNPL ratio of
1.9 percent was higher with respect to that of
Malaysia (1.1 percent) and South Korea
(1.2 percent) but lower than that of Indonesia
(2.6 percent) and Thailand (2.9 percent).50
The loan exposures of banks remained adequately
covered as the banking system registered an NPL
coverage ratio of 115.5 percent as of end-May
2018. This was higher than the previous year’s
ratio of 114.3 percent but lower than the end-
March 2018 ratio of 119.7 percent.
U/KBs’ CAR remains above
international and regulatory
standards
The capital adequacy ratio (CAR) of U/KBs at end-
March 2018 increased slightly to 14.5 percent on
solo basis, relative to the previous quarter’s ratio
of 14.4 percent. Similarly, CAR on a consolidated
basis increased marginally to 15.1 percent from
the quarter-ago ratio of 15.0 percent.
Nonetheless, these figures remained well above
the BSP regulatory threshold of 10.0 percent and
international minimum of 8.0 percent.
50
Sources: Malaysia (Banking System’s Ratio of net impaired
loans to net total loans, Q4 2017); South Korea (Domestic
Banks’ Substandard or Below Loans [SBLs] ratio, Q1 2018);
Indonesia, IMF and financial stability reports (Banks’
Nonperforming Loans to Gross Loans Ratio, Q4 2017);
and Thailand (Total Financial Institutions’ Gross NPLs ratio,
Q1 2018).
Chart 37. Capital Adequacy Ratio of Universal and
Commercial Banks
in percent
12
13
14
15
16
17
18
19
20
Ma
r 2
01
3
Jun
Se
p
De
c
Ma
r 2
01
4
Jun
Se
p
De
c
Ma
r 2
01
5
Jun
Se
p
De
c
Ma
r 2
01
6
Jun
Se
p
De
c
Ma
r 2
01
7
Jun
Se
p
De
c
Ma
r 2
01
8
Solo Basis Consolidated Basis
Source: BSP
The CAR of Philippine U/KBs, on a consolidated
basis, was lower than that of South Korea
(15.4 percent), Malaysia (17.1 percent), Thailand
(18.3 percent) and Indonesia (23.0 percent).51
Exchange Rate
The peso averaged P52.43/US$1 in Q2 2018,
depreciating by 1.91 percent from the previous
quarter’s average of P51.43/US$1.
Peso depreciates against the
US dollar in Q2 2018
The peso’s depreciation during the review
period was due mainly to market expectations
of faster-than-expected pace of US Fed rate hikes
and concerns over the lingering trade tension
between the US and its major trading partners,
including China. On a year-on-year basis, the peso
likewise depreciated by 4.91 percent relative to
the P49.86/US$1 average in Q2 2017.52
51
Sources: South Korea (Domestic Banks’ Capital Ratio,
Q1 2018); Malaysia (Banking System’s Total Capital Ratio, May
2018); Thailand (Commercial Banks’ Capital Funds Percentage
of Risk Assets, April 2018); and Indonesia, IMF and financial
stability reports (Commercial Banks, Regulatory Capital to
Risk-Weighted Assets Ratio Q4 2017). 52
Dollar rates (per peso) or the reciprocal of the peso-dollar
rates were used to compute for the percentage change.

Q2 2018 Inflation Report | | | | 37373737
Chart 38. Quarterly Peso-Dollar Rate PHp/US$; average per quarter
39
40
41
42
43
44
45
46
47
48
49
50
51
52
53
Q1
20
13
Q2
Q3
Q4
Q1
20
14
Q2
Q3
Q4
Q1
20
15
Q2
Q3
Q4
Q1
20
16
Q2
Q3
Q4
Q1
20
17
Q2
Q3
Q4
Q1
20
18
Q2
Source: Reference Exchange Rate Bulletin, Treasury Department, BSP
In April, the peso depreciated marginally by
0.06 percent to an average of P52.10/US$1 from
the P52.07/US$1 average in March. The peso’s
depreciation was due mainly to: (1) rising tensions
over a brewing trade war between the US and
China53
; (2) the general strengthening of the dollar
on the back of rising US Treasury yields in March;
and (3) optimistic US inflation outlook ahead of
the US Fed policy meeting.54
The depreciation of the peso continued in May as
it averaged P52.19/US$1, 0.18 percent more than
its average in April. The peso’s performance was
amid safe haven buying following (i) release of
minutes of the US Federal Reserve’s May policy
meeting which the market perceived as hawkish;
(ii) the comments of US President Trump that he
was not satisfied with the latest round of trade
talks with China; (iii) geopolitical concerns
involving the US, China, North Korea and Italy;
and (iv) rising US Treasury yields, which boosted
the US dollar.
In June, the peso averaged P53.05/US$1
depreciating further by 1.61 percent from the
average in May. The peso’s depreciation can be
attributed to the second interest rate hike of the
US Fed for the year and market expectations of
two more rate hikes until end-2018. Concerns
over the lingering trade tension between the
US and China likewise continued to add pressure
to the peso.
On a year-to-date basis, the peso depreciated
against the US dollar by 6.39 percent to close
53
US President Trump instructed its officials to consider
slapping $100 billion worth of duties against China, following
the latter’s imposition of new tariffs on 128 US goods including
frozen pork, wine and apples. 54
The US consumer prices, as measured by the personal
consumption expenditure (PCE) price index, jumped 2 percent
in March compared with the same period last year. This
followed the 1.7 percent rise in February and was the biggest
gain since February 2017. Source: Reuters news, “U.S. core PCE
price index hits 2 percent; spending slows”, April 30, 2018.
at P53.34/US$1 on 29 June 2018 from the
end-December 2017 closing rate of P49.93/US$1.
The peso’s performance is in line with the
strengthening, during the period, of most Asian
currencies except the Japanese yen and Malaysian
ringgit.55
Nonetheless, the sustained inflows of foreign
exchange from overseas Filipino remittances,
foreign direct investments, BPO receipts, and
recovery of exports; as well as the ample level
of the country’s gross international reserves
and the country’s robust economic growth, are
expected to provide support to the peso.56
Table 16. Year-to-Date Changes in Selected Dollar
Rates appreciation/(-depreciation); in percent
2013 2014 2015 2016 2017 2018*
Korean Won 1.13 -4.34 -6.61 -2.63 13.16 -4.21
Thai Baht (Onshore) -4.59 -0.68 -8.86 0.14 9.69 -1.71
Singaporean Dollar -2.72 -4.52 -5.99 -1.99 8.23 -2.02
Indian Rupee -11.40 -2.94 -4.93 -2.88 6.27 -6.75
Indonesian Rupiah -19.07 -2.08 -9.81 2.32 -0.64 -5.28
Philippine Peso -7.02 -0.73 -4.97 -5.35 -0.42 -6.39
Japanese Yen -16.26 -12.46 -0.47 3.33 3.83 1.87
Malaysian Ringgit -5.47 -6.30 -18.55 -4.21 10.69 0.26
Chinese Yuan 2.60 -2.70 -4.33 -6.62 6.68 -1.74
New Taiwan Dollar -1.95 -6.16 -3.63 1.89 8.76 -2.44Notes:
- Negative value represents depreciation of the currency against the US dollar.
- YTD changes are computed as the percent change between the closing prices for the
year indicated versus the closing prices for the preceding year.
* Data as of 4:00 p.m., 29 June 2018
Source: Treasury Department - BSP
Meanwhile, the volatility of the peso’s daily closing
rates (as measured by the coefficient of variation)
stood at 1.05 percent during the review quarter,
lower than the 1.51 percent registered in the
previous quarter.57
The volatility of the peso was
lower than most of the other currencies in the
region.
On a real trade-weighted basis, the peso gained
external price competitiveness in Q2 2018 against
the basket of currencies of all trading partners
(TPI) and trading partners in advanced (TPI-A) and
55
Based on the last done deal transaction in the afternoon. 56
As of end-June 2018, the country’s gross international
reserves (GIR) stood at US$77.7 billion (preliminary). This can
cover 7.5 months’ worth of imports of goods and payments of
services and primary income. It is also equivalent to 6.0 times
the country’s short-term external debt based on original
maturity and 4.1 times based on residual maturity. Foreign
direct investments (FDI) remained positive and registered a net
inflow of US$2.2 billion as of end-March 2018. Remittances
from OF workers continue to flow in from various geographical
locations globally. As of end-April 2018, cash remittances from
OFs amounted to US$9.4 billion. In 2017, exports of goods, and
business process outsourcing (BPO) and tourism receipts
reached US$48.2 billion, US$22.1 billion, and US$7.0 billion,
respectively. 57
The coefficient of variation is computed as the standard
deviation of the daily closing exchange rate divided by the
average exchange rates for the period.

Q2 2018 Inflation Report | | | | 38383838
developing (TPI-D) countries. Relative to Q1 2018,
the real effective exchange rate (REER) index of
the peso decreased by 0.70 percent, 1.74 percent
and 0.06 percent against the TPI, TPI-A, and TPI-D
baskets, respectively. The impact of widening
inflation differential was offset by the nominal
depreciation which resulted to the general
decrease in the REER index.58,59
Relative to Q2 2017, the peso likewise gained
external price competitiveness in Q1 2018
against the TPI, TPI-A, and TPI-D baskets. This
developed as the nominal depreciation of the
peso outweighed the impact of widening
inflation differential against these currency
baskets, resulting to a decrease in the REER
index of the peso by 5.01 percent, 4.18 percent,
and 5.53 percent against the TPI, TPI-A, and
TPI-D baskets, respectively.
III. Fiscal Developments
The National Government (NG) recorded a
P138.7-billion fiscal deficit for January-May 2018,
two times higher than the deficit posted in the
previous year.
NG recorded a fiscal deficit
for January-May 2018
Netting out the interest payments in NG
expenditures, the primary surplus amounted to
P2.7 billion, twenty-three times lower than the
amount recorded in the January-May 2017.
58
The TPI measures the nominal and real effective exchange
rates of the peso across the currencies of 14 major trading
partners of the Philippines, which includes US, Euro Area,
Japan, Australia, China, Singapore, South Korea, Hong Kong,
Malaysia, Taiwan, Indonesia, Saudi Arabia, United Arab
Emirates, and Thailand. The TPI-Advanced measures the
effective exchange rates of the peso across currencies of
trading partners in advanced countries comprising of the US,
Japan, Euro Area, and Australia. The TPI-Developing measures
the effective exchange rates of the peso across 10 currencies
of partner developing countries which includes China,
Singapore, South Korea, Hong Kong, Malaysia, Taiwan,
Indonesia, Saudi Arabia, United Arab Emirates, and Thailand. 59
The REER index represents the Nominal Effective Exchange
Rate (NEER) index of the peso, adjusted for inflation rate
differentials with the countries whose currencies comprise the
NEER index basket. A decrease in the REER index indicates
some gain in the external price competitiveness of the peso,
while a significant increase indicates the opposite. The NEER
index, meanwhile, represents the weighted average exchange
rate of the peso vis-à-vis a basket of foreign currencies.
Table 17. National Government
Fiscal Performance in billion pesos
May Jan-May May Jan-May May Jan-May
Surplus/(Deficit) -33.4 -63.6 -32.9 -138.7 -2.0 118.0
Revenues 228.3 996.5 259.0 1,186.3 13.0 19.0
Expenditures 261.7 1,060.1 291.9 1,325.1 12.0 25.0
* Totals ma y not a dd up due to rounding
Source: Bureau of the Treasury (BTr)
Growth Rate
(in percent)2017 2018
Revenues increased by 19 percent to
P1,186.3 billion in January-May 2018 compared
to P996.5 billion in the same period last year.
The Bureau of Internal Revenue (BIR) and the
Bureau of Customs (BOC) contributed
P827.7 billion and P229.3 billion, respectively.
Revenue collections by the BIR and BOC were
higher by 15 percent and 31 percent, respectively.
The notable increase in BOC collections could be
attributed to the combined effects of peso
depreciation, higher oil prices, and higher import
volumes. Meanwhile, income from Bureau of
the Treasury (BTr) increased by 22 percent to
P58.4 billion owing to higher dividends on shares
of stocks held by the government and remittance
of shares in PAGCOR and MIAA profits.
Expenditures for the period in review amounted
to P1,325.1 billion, 25 percent higher than the
expenditures in January-May 2018. Excluding
interest payments, expenditures went up by
28 percent to P1,183.6 billion. Meanwhile,
interest payment was P9.1 billion higher
compared to its year-ago level, reaching
P141.4 billion in end-May 2018.

Q2 2018 Inflation Report | | | | 39393939
IV. External Developments
The JP Morgan Global All-Industry Output Index
increased slightly to 54.2 in June from 54.0 in May
as service sector business activity continued to
expand faster.
Global economic activity
improves in June
The rate of expansion in the US remained close to
the record-high in May while economic activity
accelerated in the euro area, China, and India.
Meanwhile, slower growth was recorded in Russia,
while economic activity in Brazil contracted
further.60
Chart 39. JP Morgan Global All-Industry Output
Index index points
50
51
52
53
54
55
56
Jan
20
13
Fe
bM
ar
Ap
rM
ay
Jun
Jul
Au
gS
ep
Oct
No
vD
ec
Jan
20
14
Fe
bM
ar
Ap
rM
ay
Jun
Jul
Au
gS
ep
Oct
No
vD
ec
Jan
20
15
Fe
bM
ar
Ap
rM
ay
Jun
Jul
Au
gS
ep
Oct
No
vD
ec
Jan
20
16
Fe
bM
ar
Ap
rM
ay
Jun
Jul
Au
gS
ep
Oct
No
vD
ec
Jan
20
17
Fe
bM
ar
Ap
rM
ay
Jun
Jul
Au
gS
ep
Oct
No
vD
ec
Jan
20
18
Fe
bM
ar
Ap
rM
ay
Jun
Source: Markit Economics
US. Real GDP expanded by 2.0 percent on a
seasonally adjusted q-o-q basis in Q1 2018,
slower than the 2.9-percent growth rate in
Q4 2017. On a y-o-y basis, real output grew by
2.8 percent, faster than the 2.6-percent expansion
in the previous year. The slower q-o-q growth in
real GDP reflected primarily the decelerations in
personal consumption expenditures, exports,
state and local government spending, and federal
government spending, and a downturn in
residential fixed investment.61
60
JP Morgan Global Manufacturing & Services PMI,
http://www.markiteconomics.com/ 61
US Bureau of Economic Analysis, “Gross Domestic Product:
First Quarter 2018 (Third Estimate),” news release, 28 June
2018.
https://www.bea.gov/newsreleases/national/gdp/2018/pdf/gd
p1q18_3rd.pdf
Growth in the US economy
holds firm
Meanwhile, the manufacturing PMI increased to
60.2 percent in June from 58.7 percent in May as
new orders continued to expand amid robust
demand.62
The unemployment rate increased to 4.0 percent
in June from 3.8 percent in May. Total nonfarm
payroll employment increased by 213,000 during
the same month, with employment gains in
professional and business services, manufacturing,
and health care. Meanwhile, on a y-o-y basis,
inflation was 2.9 percent in June from 2.8 percent
in May due mainly to higher inflation for medical
care services, food, and transportation services.
The Thomson-Reuters/University of Michigan
Index of Consumer Sentiment increased to
98.2 in June from 98.0 in May.63
Meanwhile,
the Conference Board Consumer Confidence Index
decreased to 126.4 in June from 128.8 in May.64
Consumers’ appraisal of current conditions was
relatively unchanged in June while their optimism
about the short-term outlook eased during the
month. Consumers’ outlook for the labor market
was slightly more favorable.
Euro Area. On a q-o-q basis, real GDP growth in
the euro area decreased to 0.4 percent in Q1 2018
from 0.7 percent in Q4 2017. On a y-o-y basis,
real GDP expanded by 2.5 percent in Q1 2018
from 2.8 percent in Q4 2017.65
Output growth in the euro is
broadly steady
Meanwhile, the composite PMI for the euro area
rose to 54.8 in June from 54.1 in May due to
improved service sector performance and inflows
of new orders.66
62
Institute for Supply Management,
https://www.instituteforsupplymanagement.org 63
University of Michigan Survey of Consumers,
http://www.sca.isr.umich.edu/ 64
The Conference Board, http://www.conference–board.org/ 65
Eurostat news release 93/2018 dated 7 June 2018 66
Flash estimate. Markit Eurozone PMI,
http://www.markiteconomics.com/

Q2 2018 Inflation Report | | | | 40404040
Inflation in the euro area increased to 1.9 percent
in May from 1.3 percent (revised) in April due
to the increases in the price indices for services;
energy; food, alcohol, and tobacco; and
non-energy industrial goods.67
The seasonally
adjusted unemployment rate was 8.4 percent in
May, the same rate posted in April.
The European Commission’s Economic Sentiment
Indicator in the euro area was generally steady at
112.3 in June from 112.5 in May as incrementally
higher confidence in industry, services, and retail
trade was offset by lower confidence in the
construction sector and among consumers.
Japan. On a q-o-q basis, real GDP contracted by
0.2 percent in Q1 2018 from the 0.3 percent
growth in Q4 2017. Meanwhile, on a y-o-y basis,
real GDP grew by 1.1 percent, slower than the 1.9
percent expansion in the previous quarter.68
The
decline in the y-o-y real GDP growth was
attributed to the lower growth in both private and
public demand.
Manufacturing activity in
Japan continues to expand
Meanwhile, the seasonally adjusted manufacturing
PMI rose to 53.0 in June from 52.8 in May as new
orders increased albeit at a slower rate.69
Inflation rose to 0.7 percent in May from
0.6 percent in April due to faster increases in
the price indices of food; fuel, light, and water;
medical care; transportation and communication;
education; and clothes and footwear. The
seasonally adjusted unemployment rate decreased
to 2.2 percent in May from 2.5 percent in April.
China. Real GDP in China expanded by 6.8 percent
y-o-y in Q1 2018, the same rate recorded in the
previous quarter. The GDP expansion was driven
mainly by the services industry and manufacturing.
67
Eurostat news release 97/2018 dated 15 June 2018 68
Second Preliminary Estimate. Department of National
Accounts, Economic and Social Research Institute, Cabinet
Office. http://www/esri.cao.go.jp/ 69
Nikkei Japan Manufacturing PMI,
http://www.markiteconomics .com/
Indicators point to steady
Chinese economic activity
Meanwhile, the seasonally adjusted manufacturing
PMI was broadly unchanged at 51.0 in June from
51.1 in May due to a sustained rise in new
business.70
Inflation was 1.9 percent in June from 1.8 percent
in May as both food and non-food prices increased
during the month.
India. Real GDP in India expanded by 7.7 percent
y-o-y in Q1 2018 from 7.0 percent (revised) in the
previous quarter. The latest GDP growth was
driven by the expansion in agriculture, forestry
and fishing; mining and quarrying; manufacturing;
electricity, gas, water supply and other utility
services; construction; trade, hotels, transport,
and communication; financial, real estate and
professional services; and public administration,
defense, and other services.71
Economic activity in India
expands at a faster pace
Meanwhile, the composite PMI rose to 53.3 in
June from 50.4 in May due to the increase in new
business and new orders in the manufacturing and
service sectors amid strong market demand.
Inflation rose to 4.9 percent in May from
4.6 percent in April as the respective price index of
all commodity groups increased during the month.
ASEAN Region. The Nikkei ASEAN Manufacturing
PMI decreased slightly to 51.0 in June from 51.4 in
May due to weaker increases in both output and
new orders.
70
Caixin China General Manufacturing PMI,
http://www.markiteconomics.com/ 71
Preliminary. Ministry of Statistics and Programme
Implementation. http://mospi.nic.in/

Q2 2018 Inflation Report | | | | 41414141
Manufacturing conditions in
the ASEAN region remain
broadly steady
Output expanded faster in Vietnam and Singapore
while slower rates of expansion were recorded in
the Philippines, Indonesia, and Thailand.
Meanwhile, manufacturing conditions in Malaysia
improved but remained in the contraction
territory.72
Policy Actions by Central Banks. On 29 June 2018,
the Board of Governors of Bank Indonesia (BI)
decided to raise the BI 7-day reverse repo rate
by 50 bps to 5.25 percent. The latest policy rate
hike was considered by BI as a preemptive,
front-loading, and ahead-of-the-curve move
to maintain the domestic financial market’s
competitiveness against several countries’
changing monetary policies and amid elevated
global uncertainty. Previously, the BI also hiked
the 7-day reverse repo rate by 25 bps each during
the policy meetings held last 30 May and 17 May.
The two consecutive policy rate hikes in May were
regarded as preemptive measures to strengthen
the country’s economic stability and to protect
the rupiah against the possible impact of a
higher-than-expected Fed funds rate hike and
escalating global financial market risk.
A number of central banks
tighten their monetary policy
settings
On 20 June 2018, the Monetary Board (MB) of
the BSP raised the interest rate on the
overnight repurchase facility by another 25 bps
to 3.50 percent. The MB’s decision was based
on the assessment that inflation expectations
remained elevated for 2018 and that the risk of
72
Nikkei ASEAN Manufacturing PMI,
http://www.markiteconomics.com/
possible second-round effects from ongoing price
pressures argued for follow-through monetary
policy action. Previously, during its 10 May 2018
monetary policy meeting, the BSP also hiked its
key policy rate by 25 bps to 3.25 percent.
Similarly, on 13 June 2018, the Federal Open
Market Committee (FOMC) decided to raise the
federal funds target range by 25 bps to 1.75 to
2 percent in view of realized and expected labor
market conditions and inflation. The FOMC
expects that further gradual increases in the target
range for the federal funds rate will be consistent
with sustained economic activity expansion, strong
labor market conditions, and inflation near the
2-percent objective over the medium term.
On 6 June 2018, the Reserve Bank of India raised
the policy repo rate by 25 bps to 6.25 percent,
taking into account higher CPI projections for 2018
to 2019 due to the sharp rise in April CPI inflation
excluding food and fuel, the uptick in the price
of Indian basket of crude and other global
commodity prices, and recent global financial
market developments.
Meanwhile, on 20 June 2018, the People’s Bank
of China (PBOC) decided to reduce the reserve
requirement ratio (RRR) by 50 bps to support
qualified debt-to-equity swap programs and boost
the supply of credit to small and micro businesses.
The cut in the reserve requirement ratio shall take
effect on 5 July 2018. The PBOC expects the RRR
reduction to release about 500 billion yuan
(US$77 billion) for China’s five large state banks
and 12 national joint-stock commercial banks, and
about 200 billion yuan in funding for mid-sized and
small banks. An earlier reduction of 100 bps to the
RRR took effect last 25 April 2018, in a move by
the PBOC to encourage financial institutions to
provide loans to small and micro companies and
lower funding costs.

Q2 2018 Inflation Report | | | | 42424242
V. Monetary Policy Developments
At its monetary policy meeting in 10 May, the BSP
raised the key policy rate by 25 bps to 3.25 percent
for the overnight reverse repurchase or RRP
facility. In the 20-June meeting, the BSP decided to
hike the policy rate anew by another 25 bps to
3.50 percent. The interest rates on the overnight
lending and deposit facilities were likewise raised
accordingly.
The BSP raises the key policy
rate twice in Q2 2018
In deciding to raise the key policy interest rate
twice during the review quarter, the BSP noted
that inflation expectations remained elevated for
2018 and that the risk of possible second-round
effects from ongoing price pressures argued for
follow-through monetary policy action. Although
inflation expectations remain within the target
range for 2019, elevated expectations for 2018
highlight the risk posed by sustained price
pressures on future wage and price outcomes.
Equally important, while latest baseline forecasts
have shifted lower for 2018-2019, upside risks
continue to dominate the inflation outlook, even
as various measures of core inflation continue to
rise. Moreover, the impact of international oil and
commodity price movements on overall inflation is
expected to be stronger given prevailing robust
aggregate demand conditions.
Given these considerations, the BSP believes that
the subsequent policy actions enable the BSP to
reinforce its signal on safeguarding
macroeconomic stability in an environment
of rising commodity prices and ongoing
normalization of monetary policy in advanced
economies. The BSP likewise reiterates its
support for carefully coordinated efforts with
other government agencies in implementing
non-monetary measures to mitigate the impact
of supply-side factors on inflation.
Chart 40. BSP Policy Rates
in percent
0
1
2
3
4
5
6
7
Jan
20
13
Fe
bM
ar
Ap
rM
ay
Jun
Jul
Au
gS
ep
Oct
No
vD
ec
Jan
20
14
Fe
bM
ar
Ap
rM
ay
Jun
Jul
Au
gS
ep
Oct
No
vD
ec
Jan
20
15
Fe
bM
ar
Ap
rM
ay
Jun
Jul
Au
gS
ep
Oct
No
vD
ec
Jan
20
16
Fe
bM
ar
Ap
rM
ay
Jun
Jul
Au
gS
ep
Oct
No
vD
ec
Jan
20
17
Fe
bM
ar
Ap
rM
ay
Jun
Jul
Au
gS
ep
Oct
No
vD
ec
Jan
20
18
Fe
bM
ar
Ap
rM
ay
Jun
Overnight RRP Rate
Overnight RP Rate
SDA Rate/Overnight Deposit Facility Rate*
* On 3 June 2016, Special Deposit Accounts (SDAs) were replaced by the Overnight Deposit Facility
(ODF) in line with the implementation of the Interest Rate Corridor (IRC) System.
Source: BSP
The BSP also emphasized its continued vigilance
against financial developments, including
excessive peso volatility, that could affect the
outlook for inflation. The BSP is prepared to take
further policy action as needed to achieve its price
and financial stability objectives.

Q2 2018 Inflation Report | | | | 43434343
VI. Inflation Outlook
BSP Inflation Forecasts
The BSP’s latest baseline forecasts using the
2012-based CPI series show that inflation could
average above the target range for 2018 and
revert to the target range by 2019.73
The risks to the inflation outlook remain on the
upside. Additional wage adjustments and
transport fare hikes due to higher excise taxes
on petroleum products and other key
commodities, pending petitions for adjustments
in transport fares and electricity rates, and
faster-than-expected monetary policy
normalization in the US are the main upside risks
to future inflation.
Meanwhile, slower global economic growth due
to protectionist policies in advanced economies
and geopolitical tensions along with the proposed
reform in the rice industry involving the
replacement of quantitative restrictions with
tariffs and the deregulation of rice importation
continue to be the main downside risks to
inflation.
Inflation is expected to settle
above the high-end of the
target range in 2018 before
settling slightly above the
midpoint of the target range
in 2019
Demand Conditions. Outturns for key demand
indicators attest to the view of robust domestic
real sector activity. The economy grew by 6.8
percent in Q1 2018, faster than the Q4 2017
growth of 6.5 percent. On the expenditure side,
growth was driven by the acceleration in public
73
On 22 February 2018, the Philippine Statistics Authority (PSA)
announced the release of the 2012-based CPI series starting 6
March 2018. The 2006-based and 2012-based CPI series will be
released simultaneously until June 2018. The official CPI data
beginning July 2018 will use the 2012-based series. The initial
release of the 2012-based CPI series covers data beginning
2012 onwards. The PSA plans to release to the public the
historical 2012-based CPI series on September 2018.
consumption as well as stronger capital formation.
On the production side, the industry and services
sectors continue to be the primary drivers of
growth.
Economic activity in the Q2 2018 is expected to
remain firm, partly driven by the continued
strength in public construction with the
implementation of the government’s
infrastructure programs. However, this could
be partly offset by the expected slowdown in the
agriculture sector on account of lower production
in palay and corn and deceleration in tourism due
to the rehabilitation of Boracay.
Looking ahead, prospects for the domestic
economy continue to remain favorable. GDP
expansion could continue to pick up due to
the robust growth in the services sector. Private
demand is expected to remain firm, aided mainly
by sustained remittance inflows. Private capital
formation should likewise contribute to economic
growth with construction and investments in
durable equipment expected to remain solid as
the government’s projects and other
infrastructure programs get underway amid
ample liquidity conditions.
High-frequency real sector indicators point to
firm growth prospects in the near term. Capacity
utilization for the manufacturing sector suggests
more than half of all major manufacturing sectors
operating at above 80.0 percent. The composite
Purchasing Managers’ Index (PMI) also remains
above the 50-point mark as of May 2018,
suggesting sustained expansion across all sectors.
The optimistic economic outlook has also been
reflected in the results of the BSP expectations
surveys as consumer confidence turns more
upbeat in Q2 2018. Similarly, business confidence
is steady in Q2 2018.
Supply Conditions. Food inflation could remain
elevated over the near term due to lower
production of key agricultural products, such
as rice and corn. Similarly, oil prices are expected
to remain flat or slightly higher over the near term
before gradually declining over the medium term
as suggested by futures prices.

Q2 2018 Inflation Report | | | | 44444444
Commodity prices continue to
be elevated over the near
term
Global non-oil prices could rise in the coming
months before moderating over the medium term.
Forecasts by the IMF and World Bank suggest that
benchmark prices of key grains, particularly wheat
and rice, are projected to rise slightly in 2018
before easing in the medium term. The IMF
projects non-fuel commodities to rise by 5.6
percent in 2018 and 0.5 percent in 2019 due to
buoyant global demand. The rise in non-oil
commodity prices for 2018 can be attributed
mainly to higher industrial (9.6 percent) and metal
(13.0 percent) prices due to higher growth in both
advanced and emerging economies.74,75
In the domestic front, palay and corn production
could decline by 2.4 percent and 3.4 percent,
respectively, in Q2 2018 based on standing crop
estimates. The projected reduction in palay and
corn production could be attributed to the shift in
planting and harvest schedules in the previous
quarters. Based on farmers’ expectation, the
decline in palay and corn output could carry over
in Q3 2018.76
International crude oil prices rose significantly
compared to the previous quarter’s level owing
mainly to geopolitical concerns as well as robust
compliance to the production cut by the
Organization of the Petroleum Exporting Countries
(OPEC) and several non-OPEC producers.
Meanwhile, uncertainties surrounding the oil
market could emanate from supply dynamics and
geopolitical concerns. Higher US production and
the recent output increase from Saudi Arabia and
Russia could exert downward pressure on oil
prices. Meanwhile, US sanctions against Iran and
lower output from Venezuela could pose upside
risks to crude oil prices.
The latest futures prices indicate that global crude
oil prices could remain elevated in 2018-2019
before gradually declining over the medium term.
Similarly, the Energy Information Administration
74
IMF, World Economic Outlook, April 2018, available online at
http://www.imf.org 75
World Bank, Commodity Markets Outlook, 24 April 2018,
available online at http://worldbank.org 76
PSA, Rice and Corn Situation Outlook, 15 May 2018, available
online at http://www.psa.gov.ph
(EIA) along with other international agencies
expect crude oil prices to remain relatively flat or
decelerate in 2018-2019.77,78
Output gap remains slightly
positive
The balance of demand and supply conditions as
captured by the output gap (or the difference
between actual and potential output), provides an
indication of potential inflationary pressures in the
near term.79
Given the latest GDP data, estimates by the BSP
show that the output gap remains slightly positive
and is broadly steady relative to the previous
quarter.80
Key assumptions used to generate the BSP’s
inflation forecasts. The BSP's baseline inflation
forecasts generated from the BSP’s econometric
forecasting models are based on the following
assumptions:
1) BSP’s overnight RRP rate at 3.5 percent from
July 2018 to December 2019;
2) NG fiscal deficits for 2018 to 2019, which are
consistent with the DBCC-approved estimates;
3) Dubai crude oil price assumptions consistent
with the trend of futures prices of oil in the
international market;
4) Increase in nominal wage in October 2018
and October 2019 consistent with labor
productivity growth and historical wage
increases;
5) Real GDP growth is endogenously determined;
and
6) Foreign exchange rate is endogenously
determined through the purchasing power
parity and interest rate parity relationships.
77
EIA, Short-Term Energy Outlook, June 2018, available online
at http://www.eia.gov 78
IMF, World Economic Outlook, April 2018, available online at
http://www.imf.org 79
Inflation tends to rise (fall) when demand for goods and
services exert pressure on the economy’s ability to produce
goods and services, i.e., when the output gap is positive
(negative). 80
Based on the seasonally-adjusted GDP growth
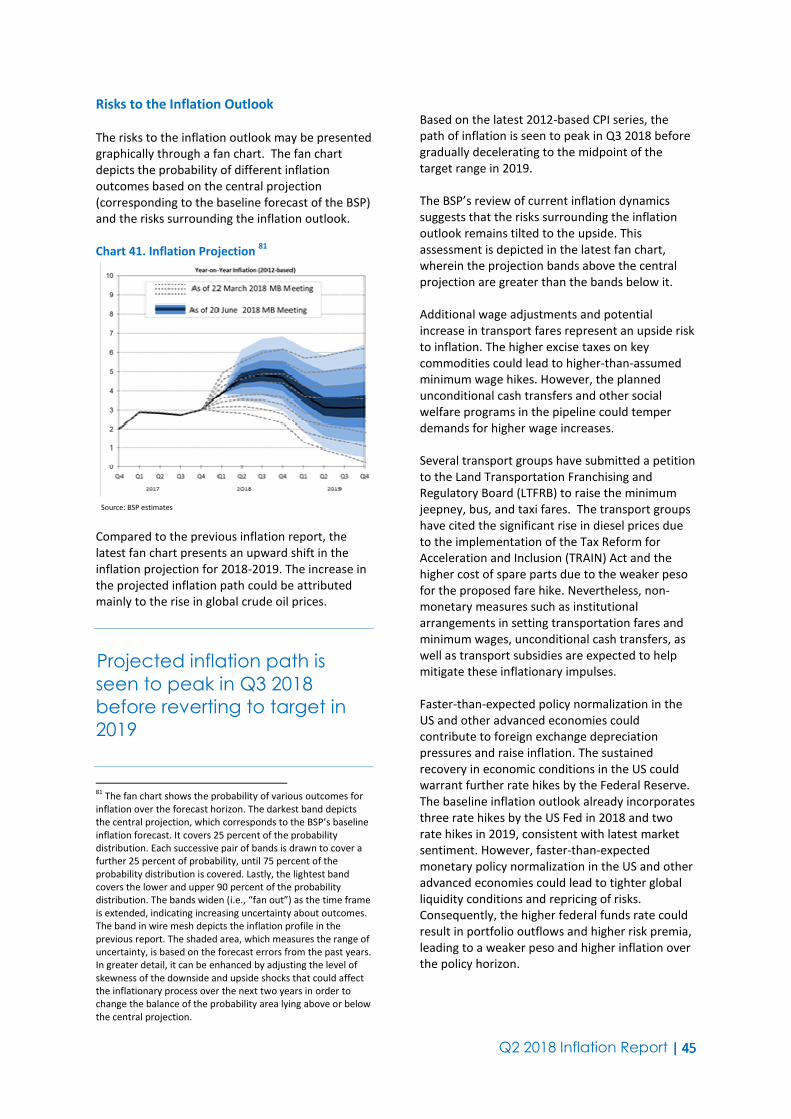
Q2 2018 Inflation Report | | | | 45454545
Risks to the Inflation Outlook
The risks to the inflation outlook may be presented
graphically through a fan chart. The fan chart
depicts the probability of different inflation
outcomes based on the central projection
(corresponding to the baseline forecast of the BSP)
and the risks surrounding the inflation outlook.
Chart 41. Inflation Projection 81
Source: BSP estimates
Compared to the previous inflation report, the
latest fan chart presents an upward shift in the
inflation projection for 2018-2019. The increase in
the projected inflation path could be attributed
mainly to the rise in global crude oil prices.
Projected inflation path is
seen to peak in Q3 2018
before reverting to target in
2019
81
The fan chart shows the probability of various outcomes for
inflation over the forecast horizon. The darkest band depicts
the central projection, which corresponds to the BSP’s baseline
inflation forecast. It covers 25 percent of the probability
distribution. Each successive pair of bands is drawn to cover a
further 25 percent of probability, until 75 percent of the
probability distribution is covered. Lastly, the lightest band
covers the lower and upper 90 percent of the probability
distribution. The bands widen (i.e., “fan out”) as the time frame
is extended, indicating increasing uncertainty about outcomes.
The band in wire mesh depicts the inflation profile in the
previous report. The shaded area, which measures the range of
uncertainty, is based on the forecast errors from the past years.
In greater detail, it can be enhanced by adjusting the level of
skewness of the downside and upside shocks that could affect
the inflationary process over the next two years in order to
change the balance of the probability area lying above or below
the central projection.
Based on the latest 2012-based CPI series, the
path of inflation is seen to peak in Q3 2018 before
gradually decelerating to the midpoint of the
target range in 2019.
The BSP’s review of current inflation dynamics
suggests that the risks surrounding the inflation
outlook remains tilted to the upside. This
assessment is depicted in the latest fan chart,
wherein the projection bands above the central
projection are greater than the bands below it.
Additional wage adjustments and potential
increase in transport fares represent an upside risk
to inflation. The higher excise taxes on key
commodities could lead to higher-than-assumed
minimum wage hikes. However, the planned
unconditional cash transfers and other social
welfare programs in the pipeline could temper
demands for higher wage increases.
Several transport groups have submitted a petition
to the Land Transportation Franchising and
Regulatory Board (LTFRB) to raise the minimum
jeepney, bus, and taxi fares. The transport groups
have cited the significant rise in diesel prices due
to the implementation of the Tax Reform for
Acceleration and Inclusion (TRAIN) Act and the
higher cost of spare parts due to the weaker peso
for the proposed fare hike. Nevertheless, non-
monetary measures such as institutional
arrangements in setting transportation fares and
minimum wages, unconditional cash transfers, as
well as transport subsidies are expected to help
mitigate these inflationary impulses.
Faster-than-expected policy normalization in the
US and other advanced economies could
contribute to foreign exchange depreciation
pressures and raise inflation. The sustained
recovery in economic conditions in the US could
warrant further rate hikes by the Federal Reserve.
The baseline inflation outlook already incorporates
three rate hikes by the US Fed in 2018 and two
rate hikes in 2019, consistent with latest market
sentiment. However, faster-than-expected
monetary policy normalization in the US and other
advanced economies could lead to tighter global
liquidity conditions and repricing of risks.
Consequently, the higher federal funds rate could
result in portfolio outflows and higher risk premia,
leading to a weaker peso and higher inflation over
the policy horizon.
Q2 2018 Inflation Report | | | | 46464646
Various petitions for rate adjustments by Meralco
and PSALM are also considered as upside risks to
inflation and have not yet been added to the
baseline forecasts. Meralco’s petitions include
generation and transmission charges, system loss,
lifeline subsidy, the December 2013 rate
adjustment, which is the subject of Supreme Court
temporary restraining order, and the ₱0.65/ kWh
adjustment for the January 2014 billing period that
is subject to the Energy Regulatory Commission’s
(ERC) approval. PSALM’s petitions cover
adjustments for fuel and foreign exchange costs.
The balance of risks to the
inflation outlook remain tilted
towards the upside
The proposed reforms in rice importation is the
main downside risk to inflation. The House of
Representatives and the Senate have accelerated
discussions to liberalize the country’s rice import
policy by replacing quantitative restrictions (QR)
on rice by reasonable tariff rates. As the
Philippines remains the sole World Trade
Organization (WTO) member that still has special
treatment exemption, RA No. 8178 or the
Agricultural Tariffication Act of 1996 (which
maintains the rice QR) would continue to be in
effect unless amended or repealed by Congress.
Given the significant share of rice in the CPI basket
and lower production costs from major import
sources such as Thailand and Vietnam, the
liberalization of rice importation policy could drive
down domestic rice prices.
The global economic outlook is also another
source of downside risk to the inflation outlook.
The continued policy uncertainty, spillovers from
tighter global financial conditions, the imposition
of inward-looking policies, and geopolitical
tensions could lead to slower global trade and
economic activity on the whole, thereby leading to
potential downward price pressures.
The fan chart shows the probability of various
outcomes for inflation over the forecast horizon.
The darkest band depicts the central projection,
which corresponds to the BSP’s baseline inflation
forecast. It covers 25 percent of the probability
distribution. Each successive pair of bands is
drawn to cover a further 25 percent of probability,
until 75 percent of the probability distribution is
covered. Lastly, the lightest band covers the lower
and upper 90 percent of the probability
distribution. The bands widen (i.e., “fan out”) as
the time frame is extended, indicating increasing
uncertainty about outcomes. The band in wire
mesh depicts the inflation profile in the previous
report.
The shaded area, which measures the range of
uncertainty, is based on the forecast errors from
the past years. In greater detail, it can be
enhanced by adjusting the level of skewness of the
downside and upside shocks that could affect the
inflationary process over the next two years in
order to change the balance of the probability area
lying above or below the central projection.
Implications for the Monetary Policy
Stance
The sum of new information in Q2 calls for
monetary policy response to rein inflation
expectations and contain second-round effects.
With higher baseline inflation projections and the
balance of risks skewing to the upside, an increase
in policy rates is appropriate. Policy rate actions
also serve to arrest the build-up in inflation
expectations and possible second-round effects
from ongoing cost-push price pressures. Headline
and core inflation readings have also been
elevated in Q2 2018 amid broader inflation
pressures. Nevertheless, there is increased
optimism on the passage of the proposed rice
tariffication bill which should result in downward
pressure on food prices and help curb inflation
expectations in the near-term. Meanwhile,
prospects for aggregate demand are expected to
remain solid, suggesting that the economy as a
whole will be able to retain its momentum amid
adjustments in policy interest rates. Social
mitigating measures by the National Government
could also likely provide a stabilizing influence on
inflation expectations in the near term while
allowing sufficient time for the economy to adjust.
The BSP also remains vigilant and ready for
follow-through action as necessary to safeguard
the BSP’s inflation objective.

Q2 2018 Inflation Report | | | | 47474747
Summary of Monetary Policy Decisions
Effectivity Date
Levels (in percent)
Monetary Policy Decisions RRP
Overnight
RP
Overnight
2 0 0 8
31 Jan 2008 5.00 7.00
The Monetary Board (MB) decided to reduce by 25 basis
points (bps) the BSP’s key policy interest rates to 5 percent
for the overnight borrowing or reverse repurchase (RRP)
facility and 7 percent for the overnight lending or repurchase
(RP) facility. The interest rates on term RRPs, RPs, and
special deposit accounts (SDAs) were also reduced
accordingly. In its assessment of macroeconomic conditions,
the MB noted that the latest inflation forecasts indicated
that inflation would fall within the 4.0 percent ± 1
percentage point target range in 2008 and the 3.5 ± 1
percentage point target range in 2009.
13 Mar 2008 5.00 7.00
The MB decided to keep the BSP’s key policy interest rates at
5 percent for the overnight borrowing or RRP facility and
7 percent for the overnight lending or RP facility. The MB also
decided to implement immediately the following refinements
in the SDA facility: (1) the closure of existing windows for the
two-, three-, and six-month tenors; and (2) the reduction of
the interest rates on the remaining tenors. The interest rates
on term RRPs and RPs were also left unchanged.
24 Apr 2008 5.00 7.00
The MB kept the BSP’s key policy interest rates at
5.0 percent for the overnight borrowing or RRP facility
and 7.0 percent for the overnight lending or RP facility.
The interest rates on term RRPs and RPs were also left
unchanged.
5 Jun 2008 5.25 7.25
The MB decided to increase by 25 bps the BSP’s key
policy interest rates to 5.25 percent for the RRP facility
and 7.25 percent for RP facility as emerging baseline
forecasts indicate a likely breach of the inflation target
for 2008 along with indications that supply-driven
pressures are beginning to feed into demand. Given the
early evidence of second-round effects, the MB
recognized the need to act promptly to rein in
inflationary expectations. The interest rates on term
RRPs, RPs, and SDAs were also increased accordingly.
17 Jul 2008 5.75 7.75
The MB increased by 50 bps the BSP’s key policy
interest rates to 5.75 percent for the overnight
borrowing or RRP facility and 7.75 percent for the
overnight lending or RP facility. The interest rates on
term RRPs, RPs, and SDAs were also increased
accordingly.
28 Aug 2008 6.00 8.00
The MB increased by 25 bps the BSP’s key policy
interest rates to 6.0 percent for the overnight
borrowing or reverse repurchase (RRP) facility and
8.0 percent for the overnight lending or repurchase
(RP) facility. The interest rates on term RRPs, RPs, and
SDAs were also increased accordingly.
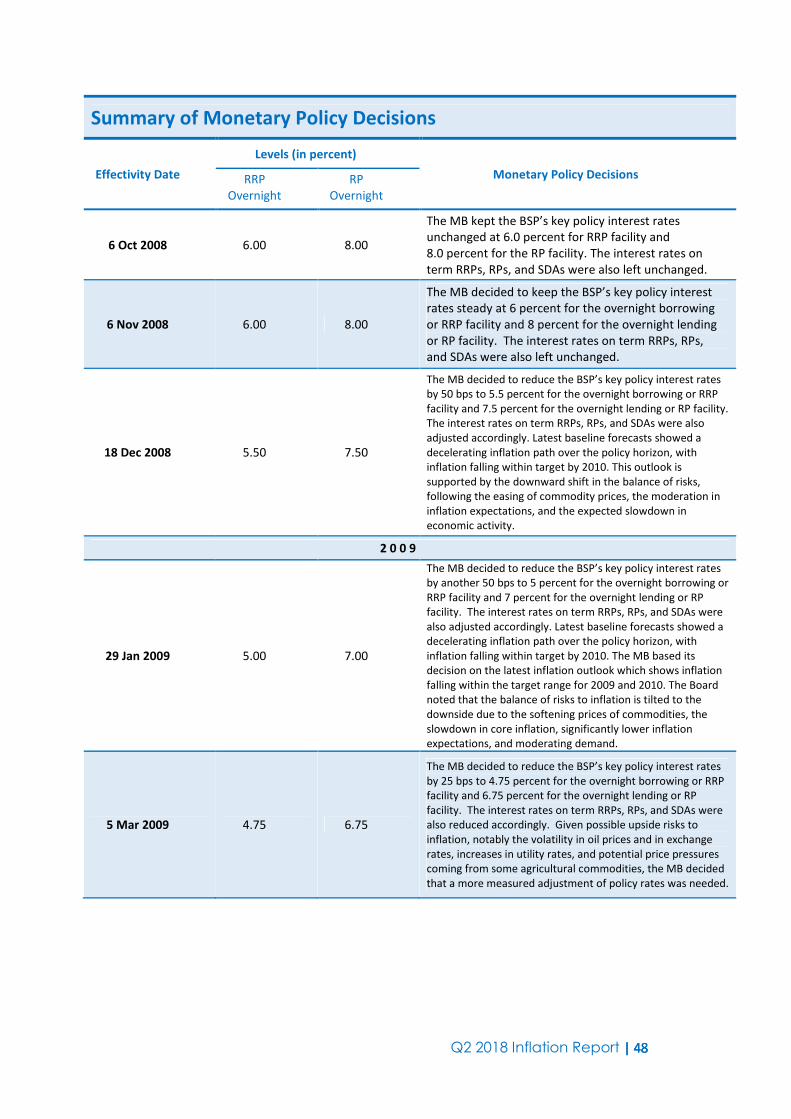
Q2 2018 Inflation Report | | | | 48484848
Summary of Monetary Policy Decisions
Effectivity Date
Levels (in percent)
Monetary Policy Decisions RRP
Overnight
RP
Overnight
6 Oct 2008 6.00 8.00
The MB kept the BSP’s key policy interest rates
unchanged at 6.0 percent for RRP facility and
8.0 percent for the RP facility. The interest rates on
term RRPs, RPs, and SDAs were also left unchanged.
6 Nov 2008 6.00 8.00
The MB decided to keep the BSP’s key policy interest
rates steady at 6 percent for the overnight borrowing
or RRP facility and 8 percent for the overnight lending
or RP facility. The interest rates on term RRPs, RPs,
and SDAs were also left unchanged.
18 Dec 2008 5.50 7.50
The MB decided to reduce the BSP’s key policy interest rates
by 50 bps to 5.5 percent for the overnight borrowing or RRP
facility and 7.5 percent for the overnight lending or RP facility.
The interest rates on term RRPs, RPs, and SDAs were also
adjusted accordingly. Latest baseline forecasts showed a
decelerating inflation path over the policy horizon, with
inflation falling within target by 2010. This outlook is
supported by the downward shift in the balance of risks,
following the easing of commodity prices, the moderation in
inflation expectations, and the expected slowdown in
economic activity.
2 0 0 9
29 Jan 2009 5.00 7.00
The MB decided to reduce the BSP’s key policy interest rates
by another 50 bps to 5 percent for the overnight borrowing or
RRP facility and 7 percent for the overnight lending or RP
facility. The interest rates on term RRPs, RPs, and SDAs were
also adjusted accordingly. Latest baseline forecasts showed a
decelerating inflation path over the policy horizon, with
inflation falling within target by 2010. The MB based its
decision on the latest inflation outlook which shows inflation
falling within the target range for 2009 and 2010. The Board
noted that the balance of risks to inflation is tilted to the
downside due to the softening prices of commodities, the
slowdown in core inflation, significantly lower inflation
expectations, and moderating demand.
5 Mar 2009 4.75 6.75
The MB decided to reduce the BSP’s key policy interest rates
by 25 bps to 4.75 percent for the overnight borrowing or RRP
facility and 6.75 percent for the overnight lending or RP
facility. The interest rates on term RRPs, RPs, and SDAs were
also reduced accordingly. Given possible upside risks to
inflation, notably the volatility in oil prices and in exchange
rates, increases in utility rates, and potential price pressures
coming from some agricultural commodities, the MB decided
that a more measured adjustment of policy rates was needed.

Q2 2018 Inflation Report | | | | 49494949
Summary of Monetary Policy Decisions
Effectivity Date
Levels (in percent)
Monetary Policy Decisions RRP
Overnight
RP
Overnight
16 Apr 2009 4.50 6.50
The MB reduced key policy rates by another 25 bps to
4.5 percent for the overnight borrowing or RRP facility and
6.5 percent for the overnight lending or RP facility, effective
immediately. This rate cut brings the cumulative reduction in
the BSP’s key policy rates to 150 bps since December last
year. The current RRP rate is the lowest since 15 May 1992.
Meanwhile, the interest rates on term RRPs, RPs, and SDAs
were also reduced accordingly. In its assessment of
macroeconomic conditions, the MB noted that the latest
baseline inflation forecasts indicated a lower inflation path
over the policy horizon, with average inflation expected to
settle within the target ranges in 2009 and 2010. In addition,
the MB considered that the risks to inflation are skewed to
the downside given expectations of weaker global and
domestic demand conditions and a low probability of a
significant near-term recovery in commodity prices.
28 May 2009 4.25 6.25
The MB decided to reduce the BSP’s key policy interest rates
by another 25 bps to 4.25 percent for the overnight
borrowing or RRP facility and 6.25 percent for the overnight
lending or RP facility. The interest rates on term RRPs, RPs,
and SDAs were also reduced accordingly. Baseline forecasts
indicated a lower inflation path over the policy horizon, with
average inflation expected to settle within the target ranges
in 2009 and 2010. In addition, the Monetary Board
considered that, on balance, the risks to inflation are skewed
to the downside given expectations of weaker global and
domestic demand conditions and a low probability of a
significant near-term recovery in commodity prices.
9 Jul 2009 4.00 6.00
The MB decided to reduce the BSP's key policy interest rates
by 25 bps to 4 percent for the overnight borrowing or RRP
facility and 6 percent for the overnight lending or RP facility,
effective immediately. The interest rates on term RRPs, RPs,
and SDAs were reduced accordingly. This is the sixth time
since December 2008 that the BSP has cut its policy interest
rates.
20 Aug 2009
1 Oct 2009
5 Nov 2009
17 Dec 2009
4.00 6.00
The MB kept key policy rates unchanged at 4 percent for the
RRP facility and 6 percent for the overnight lending RP facility.
The decision to maintain the monetary policy stance comes
after a series of policy rate cuts since December 2008 totaling
200 bps and other liquidity enhancing measures.
2 0 1 0
28 Jan 2010
11 Mar 2010
22 Apr 2010
3 Jun 2010
15 Jul 2010
26 Aug 2010
7 Oct 2010
18 Nov 2010
29 Dec 2010
4.00 6.00
The MB decided to keep the BSP's key policy interest rates
steady at 4 percent for the RRP facility and 6 percent for the
RP facility. The interest rates on term RRPs, RPs, and SDAs
were also left unchanged.
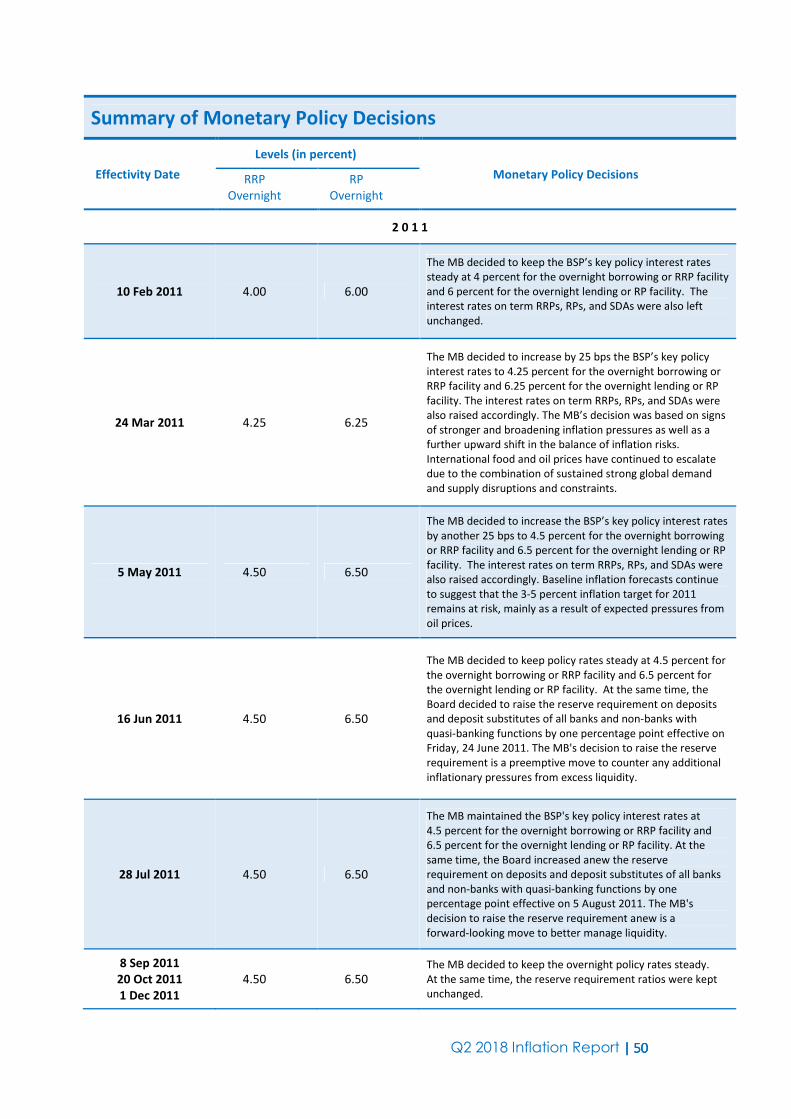
Q2 2018 Inflation Report | | | | 50505050
Summary of Monetary Policy Decisions
Effectivity Date
Levels (in percent)
Monetary Policy Decisions RRP
Overnight
RP
Overnight
2 0 1 1
10 Feb 2011 4.00 6.00
The MB decided to keep the BSP’s key policy interest rates
steady at 4 percent for the overnight borrowing or RRP facility
and 6 percent for the overnight lending or RP facility. The
interest rates on term RRPs, RPs, and SDAs were also left
unchanged.
24 Mar 2011 4.25 6.25
The MB decided to increase by 25 bps the BSP’s key policy
interest rates to 4.25 percent for the overnight borrowing or
RRP facility and 6.25 percent for the overnight lending or RP
facility. The interest rates on term RRPs, RPs, and SDAs were
also raised accordingly. The MB’s decision was based on signs
of stronger and broadening inflation pressures as well as a
further upward shift in the balance of inflation risks.
International food and oil prices have continued to escalate
due to the combination of sustained strong global demand
and supply disruptions and constraints.
5 May 2011 4.50 6.50
The MB decided to increase the BSP’s key policy interest rates
by another 25 bps to 4.5 percent for the overnight borrowing
or RRP facility and 6.5 percent for the overnight lending or RP
facility. The interest rates on term RRPs, RPs, and SDAs were
also raised accordingly. Baseline inflation forecasts continue
to suggest that the 3-5 percent inflation target for 2011
remains at risk, mainly as a result of expected pressures from
oil prices.
16 Jun 2011 4.50 6.50
The MB decided to keep policy rates steady at 4.5 percent for
the overnight borrowing or RRP facility and 6.5 percent for
the overnight lending or RP facility. At the same time, the
Board decided to raise the reserve requirement on deposits
and deposit substitutes of all banks and non-banks with
quasi-banking functions by one percentage point effective on
Friday, 24 June 2011. The MB's decision to raise the reserve
requirement is a preemptive move to counter any additional
inflationary pressures from excess liquidity.
28 Jul 2011 4.50 6.50
The MB maintained the BSP's key policy interest rates at
4.5 percent for the overnight borrowing or RRP facility and
6.5 percent for the overnight lending or RP facility. At the
same time, the Board increased anew the reserve
requirement on deposits and deposit substitutes of all banks
and non-banks with quasi-banking functions by one
percentage point effective on 5 August 2011. The MB's
decision to raise the reserve requirement anew is a
forward-looking move to better manage liquidity.
8 Sep 2011
20 Oct 2011
1 Dec 2011
4.50 6.50 The MB decided to keep the overnight policy rates steady.
At the same time, the reserve requirement ratios were kept
unchanged.
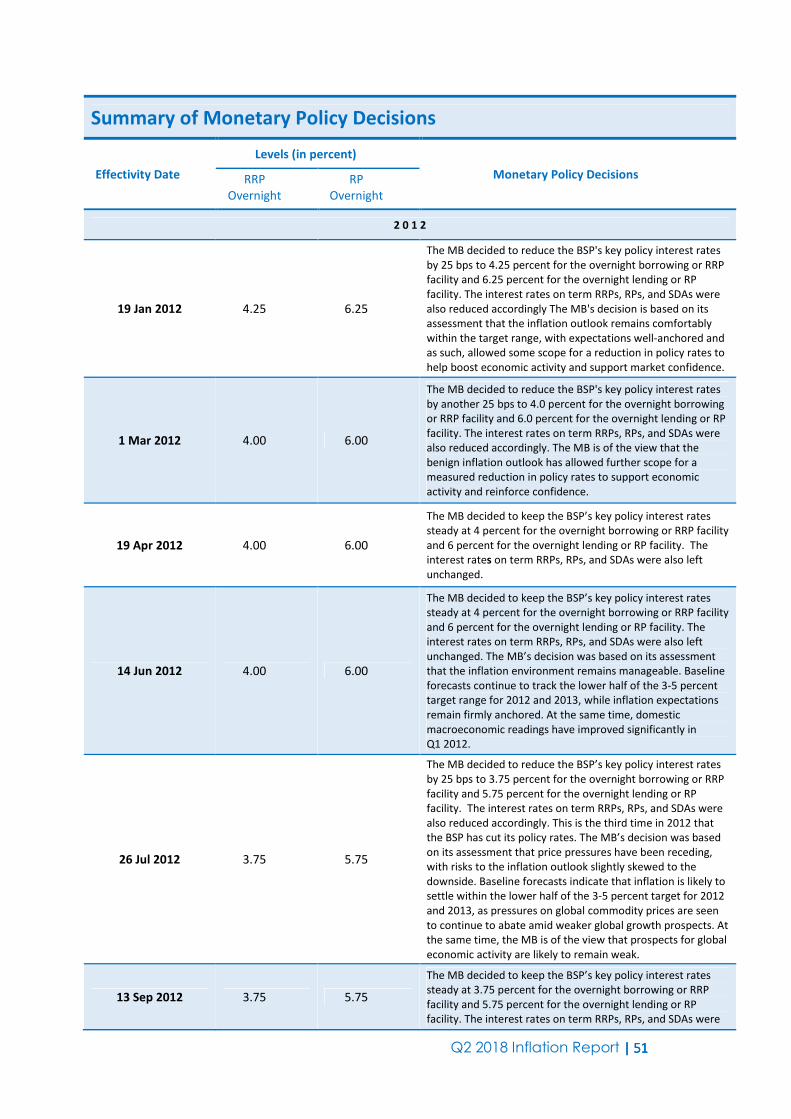
Q2 2018 Inflation Report | | | | 51515151
Summary of Monetary Policy Decisions
Effectivity Date
Levels (in percent)
Monetary Policy Decisions RRP
Overnight
RP
Overnight
2 0 1 2
19 Jan 2012 4.25 6.25
The MB decided to reduce the BSP's key policy interest rates
by 25 bps to 4.25 percent for the overnight borrowing or RRP
facility and 6.25 percent for the overnight lending or RP
facility. The interest rates on term RRPs, RPs, and SDAs were
also reduced accordingly The MB's decision is based on its
assessment that the inflation outlook remains comfortably
within the target range, with expectations well-anchored and
as such, allowed some scope for a reduction in policy rates to
help boost economic activity and support market confidence.
1 Mar 2012 4.00 6.00
The MB decided to reduce the BSP's key policy interest rates
by another 25 bps to 4.0 percent for the overnight borrowing
or RRP facility and 6.0 percent for the overnight lending or RP
facility. The interest rates on term RRPs, RPs, and SDAs were
also reduced accordingly. The MB is of the view that the
benign inflation outlook has allowed further scope for a
measured reduction in policy rates to support economic
activity and reinforce confidence.
19 Apr 2012 4.00 6.00
The MB decided to keep the BSP’s key policy interest rates
steady at 4 percent for the overnight borrowing or RRP facility
and 6 percent for the overnight lending or RP facility. The
interest rates on term RRPs, RPs, and SDAs were also left
unchanged.
14 Jun 2012 4.00 6.00
The MB decided to keep the BSP’s key policy interest rates
steady at 4 percent for the overnight borrowing or RRP facility
and 6 percent for the overnight lending or RP facility. The
interest rates on term RRPs, RPs, and SDAs were also left
unchanged. The MB’s decision was based on its assessment
that the inflation environment remains manageable. Baseline
forecasts continue to track the lower half of the 3-5 percent
target range for 2012 and 2013, while inflation expectations
remain firmly anchored. At the same time, domestic
macroeconomic readings have improved significantly in
Q1 2012.
26 Jul 2012 3.75 5.75
The MB decided to reduce the BSP’s key policy interest rates
by 25 bps to 3.75 percent for the overnight borrowing or RRP
facility and 5.75 percent for the overnight lending or RP
facility. The interest rates on term RRPs, RPs, and SDAs were
also reduced accordingly. This is the third time in 2012 that
the BSP has cut its policy rates. The MB’s decision was based
on its assessment that price pressures have been receding,
with risks to the inflation outlook slightly skewed to the
downside. Baseline forecasts indicate that inflation is likely to
settle within the lower half of the 3-5 percent target for 2012
and 2013, as pressures on global commodity prices are seen
to continue to abate amid weaker global growth prospects. At
the same time, the MB is of the view that prospects for global
economic activity are likely to remain weak.
13 Sep 2012 3.75 5.75
The MB decided to keep the BSP’s key policy interest rates
steady at 3.75 percent for the overnight borrowing or RRP
facility and 5.75 percent for the overnight lending or RP
facility. The interest rates on term RRPs, RPs, and SDAs were

Q2 2018 Inflation Report | | | | 52525252
Summary of Monetary Policy Decisions
Effectivity Date
Levels (in percent)
Monetary Policy Decisions RRP
Overnight
RP
Overnight
also left unchanged. The MB’s decision was based on its
assessment that the inflation environment remains benign,
with the risks to the inflation outlook appearing to be broadly
balanced.
25 Oct 2012 3.50 5.50
The MB decided to reduce the BSP’s key policy interest rates
by 25 bps to 3.50 percent for the overnight borrowing or RRP
facility and 5.50 percent for the overnight lending or RP
facility. The interest rates on term RRPs, RPs, and SDAs were
also reduced accordingly. This is the fourth time in 2012 that
the BSP has cut its policy rates. The MB’s decision was based
on its assessment that the inflation environment continued to
be benign with latest baseline forecasts indicating that the
future inflation path will remain within target for 2012-2014.
A rate cut would also be consistent with a symmetric
response to the risk of below-target inflation.
13 Dec 2012 3.50 5.50
The MB decided to keep the BSP’s key policy interest rates
steady at 3.50 percent for the overnight borrowing or RRP
facility and 5.50 percent for the overnight lending or RP
facility. The interest rates on term RRPs, RPs, and SDAs were
also left unchanged. The MB’s decision was based on its
assessment that current monetary settings remained
appropriate, as the cumulative 100-basis-point reduction in
policy rates in 2012 continued to work its way through the
economy.
2 0 1 3
24 Jan 2013 3.50 5.50
The MB decided to keep the BSP’s key policy interest rates
steady at 3.50 percent for the overnight borrowing or RRP
facility and 5.50 percent for the overnight lending or RP
facility. The interest rates on term RRPs and RPs were also
maintained accordingly. The reserve requirement ratios were
kept steady as well. At the same time, the MB decided to set
the interest rates on the SDA facility at 3.00 percent
regardless of tenor, effective immediately, consistent with
the BSP’s continuing efforts to fine-tune the operation of its
monetary policy tools.
14 Mar 2013 3.50 5.50
The MB decided to keep the BSP’s key policy interest rates
steady at 3.50 percent for the overnight borrowing or RRP
facility and 5.50 percent for the overnight lending or RP
facility. The interest rate on the RRP was also set at
3.50 percent regardless of tenor. Following its previous
decision to rationalize the SDA facility in January 2013, the
MB further reduced the interest rates on the SDA facility by
50 bps to 2.50 percent across all tenors effective
immediately.
25 Apr 2013 3.50 5.50
The MB decided to keep the BSP’s key policy interest rates
steady at 3.50 percent for the overnight borrowing or RRP
facility and 5.50 percent for the overnight lending or RP
facility. The interest rate on the RRP was also set at
3.50 percent regardless of tenor. Meanwhile, the SDA rate
was further reduced by 50 basis points to 2.0 percent across
all tenors.
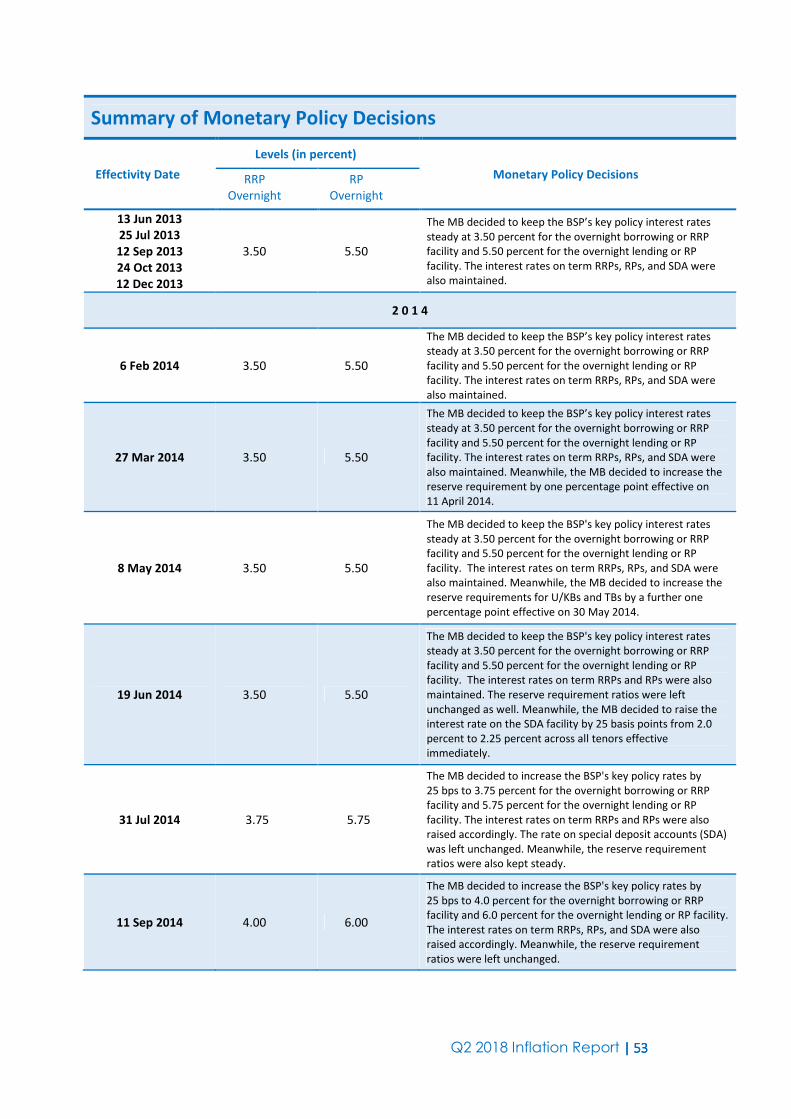
Q2 2018 Inflation Report | | | | 53535353
Summary of Monetary Policy Decisions
Effectivity Date
Levels (in percent)
Monetary Policy Decisions RRP
Overnight
RP
Overnight
13 Jun 2013
25 Jul 2013
12 Sep 2013
24 Oct 2013
12 Dec 2013
3.50 5.50
The MB decided to keep the BSP’s key policy interest rates
steady at 3.50 percent for the overnight borrowing or RRP
facility and 5.50 percent for the overnight lending or RP
facility. The interest rates on term RRPs, RPs, and SDA were
also maintained.
2 0 1 4
6 Feb 2014 3.50 5.50
The MB decided to keep the BSP’s key policy interest rates
steady at 3.50 percent for the overnight borrowing or RRP
facility and 5.50 percent for the overnight lending or RP
facility. The interest rates on term RRPs, RPs, and SDA were
also maintained.
27 Mar 2014 3.50 5.50
The MB decided to keep the BSP’s key policy interest rates
steady at 3.50 percent for the overnight borrowing or RRP
facility and 5.50 percent for the overnight lending or RP
facility. The interest rates on term RRPs, RPs, and SDA were
also maintained. Meanwhile, the MB decided to increase the
reserve requirement by one percentage point effective on
11 April 2014.
8 May 2014 3.50 5.50
The MB decided to keep the BSP's key policy interest rates
steady at 3.50 percent for the overnight borrowing or RRP
facility and 5.50 percent for the overnight lending or RP
facility. The interest rates on term RRPs, RPs, and SDA were
also maintained. Meanwhile, the MB decided to increase the
reserve requirements for U/KBs and TBs by a further one
percentage point effective on 30 May 2014.
19 Jun 2014 3.50 5.50
The MB decided to keep the BSP's key policy interest rates
steady at 3.50 percent for the overnight borrowing or RRP
facility and 5.50 percent for the overnight lending or RP
facility. The interest rates on term RRPs and RPs were also
maintained. The reserve requirement ratios were left
unchanged as well. Meanwhile, the MB decided to raise the
interest rate on the SDA facility by 25 basis points from 2.0
percent to 2.25 percent across all tenors effective
immediately.
31 Jul 2014 3.75 5.75
The MB decided to increase the BSP's key policy rates by
25 bps to 3.75 percent for the overnight borrowing or RRP
facility and 5.75 percent for the overnight lending or RP
facility. The interest rates on term RRPs and RPs were also
raised accordingly. The rate on special deposit accounts (SDA)
was left unchanged. Meanwhile, the reserve requirement
ratios were also kept steady.
11 Sep 2014 4.00 6.00
The MB decided to increase the BSP's key policy rates by
25 bps to 4.0 percent for the overnight borrowing or RRP
facility and 6.0 percent for the overnight lending or RP facility.
The interest rates on term RRPs, RPs, and SDA were also
raised accordingly. Meanwhile, the reserve requirement
ratios were left unchanged.

Q2 2018 Inflation Report | | | | 54545454
Summary of Monetary Policy Decisions
Effectivity Date
Levels (in percent)
Monetary Policy Decisions RRP
Overnight
RP
Overnight
23 Oct 2014
11 Dec 2014 4.00 6.00
The MB decided to maintain the BSP’s key policy interest
rates at 4.0 percent for the overnight borrowing or reverse
repurchase (RRP) facility and 6.0 percent for the overnight
lending or repurchase (RP) facility. The interest rates on term
RRPs, RPs, and special deposit accounts were also kept
steady. The reserve requirement ratios were left unchanged
as well.
2 0 1 5
12 Feb 2015
26 Mar 2015
14 May 2015
25 Jun 2015
13 Aug 2015
24 Sep 2015
12 Nov 2015
17 Dec 2015
4.00 6.00
The MB decided to maintain the BSP’s key policy interest
rates at 4.0 percent for the overnight borrowing or reverse
repurchase (RRP) facility and 6.0 percent for the overnight
lending or repurchase (RP) facility. The interest rates on term
RRPs, RPs, and special deposit accounts were also kept
steady. The reserve requirement ratios were left unchanged
as well.
2 0 1 6
11 Feb 2016
23 Mar 2016
12 May 2016
23 Jun 2016
11 Aug 2016
22 Sep 2016
10 Nov 2016
22 Dec 2016
4.00
3.00
6.00
3.50
The MB decided to maintain the BSP’s key policy interest
rates at 4.0 percent for the overnight borrowing or reverse
repurchase (RRP) facility and 6.0 percent for the overnight
lending or repurchase (RP) facility. The interest rates on term
RRPs, RPs, and special deposit accounts were also kept
steady. The reserve requirement ratios were left unchanged
as well.
The BSP formally adopted an interest rate corridor (IRC)
system as a framework for conducting its monetary
operations. The shift to IRC is an operational adjustment and
not a change in the monetary policy stance. The IRC is a
system for guiding short-term market rates towards the BSP
policy interest rate which is the overnight reverse repurchase
(RRP) rate. The IRC system consists of the following
instruments: standing liquidity facilities, namely, the
overnight lending facility (OLF) and the overnight deposit
facility (ODF); the overnight RRP facility; and a term deposit
auction facility (TDF). The interest rates for the standing
liquidity facilities form the upper and lower bound of the
corridor while the overnight RRP rate is set at the middle of
the corridor. The repurchase (RP) and Special Deposit Account
(SDA) windows will be replaced by standing overnight lending
and overnight deposit facilities, respectively. Meanwhile, the
reverse repurchase (RRP) facility will be modified to a purely
overnight RRP. In addition, the term deposit facility (TDF) will
serve as the main tool for absorbing liquidity.
The interest rates for these facilities will be set as follows
starting 3 June 2016:
� 3.5 percent in the overnight lending facility (a reduction of
the interest rate for the upper bound of the corridor from the

Q2 2018 Inflation Report | | | | 55555555
Summary of Monetary Policy Decisions
Effectivity Date
Levels (in percent)
Monetary Policy Decisions RRP
Overnight
RP
Overnight
current overnight RP rate of 6.0 percent);
� 3.0 percent in the overnight RRP rate (an adjustment from
the current 4.0 percent); and
� 2.5 percent in the overnight deposit facility (no change from
the current SDA rate).
2 0 1 7
9 Feb 2017
23 Mar 2017
11 May 2017
22 Jun 2017
10 Aug 2017
21 Sep 2017
9 Nov 2017
14 Dec 2017
3.00 3.50
The MB decided to maintain the BSP’s key policy interest
rates at 3.0 percent for the overnight reverse repurchase
(RRP) facility, 3.5 percent for the overnight lending facility
(OLF) and 2.5 percent for the overnight deposit facility (ODF).
The reserve requirement ratios were left unchanged as well.
2 0 1 8
8 Feb 2018 3.00 3.50
The MB decided to maintain the BSP’s key policy interest
rates at 3.0 percent for the overnight reverse repurchase
(RRP) facility, 3.5 percent for the overnight lending facility
(OLF) and 2.5 percent for the overnight deposit facility (ODF).
15 Feb 2018
The reserve requirement ratio was reduced by one (1)
percentage point as an operational adjustment to support
the BSP’s shift toward a more market-based implementation
of monetary policy as well as its broad financial market
reform agenda. The reduction will apply to the reservable
liabilities of all banks and non-bank financial institutions with
quasi-banking functions with reserve requirement at twenty
(20) percent.
22 Mar 2018 3.00 3.50
The MB decided to maintain the BSP’s key policy interest
rates at 3.0 percent for the overnight reverse repurchase
(RRP) facility, 3.5 percent for the overnight lending facility
(OLF) and 2.5 percent for the overnight deposit facility (ODF).
10 May 2018 3.25 3.75
The MB decided to increase the BSP’s key policy interest rates
by 25 basis points to 3.25 percent for the overnight reverse
repurchase (RRP) facility, 3.75 percent for the overnight
lending facility (OLF) and 2.75 percent for the overnight
deposit facility (ODF).
24 May 2018
The reserve requirement ratio was reduced by one (1)
percentage point as part of its medium-term financial market
reform agenda to promote a more efficient financial system
by lowering intermediation costs. The reduction will apply to
those reservable liabilities of all banks and non-bank financial
institutions with quasi-banking functions that are currently
subject to a reserve requirement of nineteen (19) percent.

Q2 2018 Inflation Report | | | | 56565656
Summary of Monetary Policy Decisions
Effectivity Date
Levels (in percent)
Monetary Policy Decisions RRP
Overnight
RP
Overnight
2 0 1 8
20 June 2018 3.50 4.00
The MB decided to raise the BSP’s key policy interest rates by
25 basis points to 3.50 percent for the overnight reverse
repurchase (RRP) facility, 4.00 percent for the overnight
lending facility (OLF) and 3.00 percent for the overnight
deposit facility (ODF).
Q2 2018 Inflation Report | | | | 57575757
The BSP Inflation Report is published every quarter by the Bangko
Sentral ng Pilipinas. The report is available as a complete document in
pdf format, together with other general information about inflation
targeting and the monetary policy of the BSP, on the BSP’s website:
www.bsp.gov.ph/monetary/inflation.asp
If you wish to receive an electronic copy of the latest BSP Inflation
Report, please send an e-mail to [email protected].
The BSP also welcomes feedback from readers on the contents of the
Inflation Report as well as suggestions on how to improve the
presentation. Please send comments and suggestions to the following
addresses:
By post: BSP Inflation Report
c/o Department of Economic Research
Bangko Sentral ng Pilipinas
A. Mabini Street, Malate, Manila
Philippines 1004
By e-mail: [email protected]