Embed Size (px)
Citation preview

June 2005
Volume 7 – Number 2
Inflation Report
ISSN 1517-7289

������������� ��������������������
������������������� � � ������ ���� ���� ��� ���� ����������

������������ �
��� �� ����� ��!��������"��#���� �����!��$%%�����&��!! '��(���)�! ����&�**&�'���'�+�����,,,�
-"�����.��(�'��� �%������ �� ������ ���� ��"��/�(���"��� �������"����0����'��"�� ����!������� ������'�( ��"�1
������������ ��� ������ ��2/�%���1�'���!3 ! �(�� 4
������ ����������� ���������'2/�%���1�!����'����3 ! �(�� 4
���������������������������2/�%���1�(� ��3 ! �(�� 4
�������������� �������� �� ������� �� �������� ��������� ������������������� �����������
���������������� ��������
���������������������������������� ������ �!������"� ��������� �#��$��%����� �&'��(��)�����*�+�,�,,�-%.,,� �����$��� ��/� ����0�)1������ 233+'4�"-'-%"�',�����"-'-%"3+�/�(�� 233+'4� "-'-%"+�+#% ���� ����56�6�7���6�
8� 6��� ������� �3,� �����
��������� ���������
������������ ������������6��������������� ���������%�(��������� 1������������������������� �����1���1����1��������7��1�������1���71������������� ���� ����� ����
9�1���6�������������������1����������������� ������7�1����������1�����������:�6���2�4�6������������2'.�,�'.�34��������1�������7�����1�����������������������7�1����������1����������������������������7��� ���������1��� ������� ��1���(�
;���������������������6���������������7��������������������������������7���1��7�������������������7�
<1�����������������������������������6��������7���1����7�������1������������������������
������������������������������� ���
:������� ���������������#��$��%����� ��=���6�������� �!������"� �>�����������,,�-%.,,�����$��� ��/� ����0�
)1����� 233+'4�"-'-� 2����4� � ��-,'���-,����-,"���-,-���-,3���-,+��?� ,*,,� ..�"-3/�(� 233+'4� ""�'%.-3"������� 1��������6�6�7���6�#% ��� ���������56�6�7���6�

��������
�������� ��
��� ����������� ��
���������� ��� � ���1.1 Retail sales __________________________________________________________________ 11
1.2 Output ______________________________________________________________________ 13Crops/livestock _______________________________________________________________ 13
Crop output __________________________________________________________________ 14
Livestock____________________________________________________________________ 19Industrial output ______________________________________________________________ 19
1.3 Labor market _________________________________________________________________ 24
Employment _________________________________________________________________ 24Earnings ____________________________________________________________________ 25
1.4 Gross Domestic Product ________________________________________________________ 26
1.5 Investment __________________________________________________________________ 271.6 Summary ____________________________________________________________________ 31
������ ���2.1 General price indices ___________________________________________________________ 33
2.2 Broad Consumer Price Index _____________________________________________________ 34
2.3 Regulated prices ______________________________________________________________ 352.4 Core inflation_________________________________________________________________ 35
2.5 Market expectations ___________________________________________________________ 36
2.6 Summary ____________________________________________________________________ 37
����� ������ ����������������������� �����3.1 Credit ______________________________________________________________________ 39
Earmarked credit ______________________________________________________________ 40
Non-earmarked credit __________________________________________________________ 413.2 Monetary aggregates __________________________________________________________ 42
Federal public securities and BCB open market operations _____________________________ 46
Real interest rates and market expectations _________________________________________ 47

Capital market ________________________________________________________________ 48
Domestic savings _____________________________________________________________ 48
3.3 Fiscal policy _________________________________________________________________ 49Public sector borrowing requirements _____________________________________________ 49
Federal debt _________________________________________________________________ 51
Net public sector debt __________________________________________________________ 523.4 Summary ____________________________________________________________________ 53
�� ���� ������������� ���4.1 Economic activity _____________________________________________________________ 55
4.2 Monetary policy and inflation ___________________________________________________ 574.3 International financial markets ___________________________________________________ 58
4.4 World trade __________________________________________________________________ 60
4.4.1 Commodities _____________________________________________________________ 624.4.1.1 Oil _______________________________________________________________ 62
4.5 Summary ____________________________________________________________________ 63
��������� �� � �5.1 Foreign exchange flows ________________________________________________________ 65
5.2 Trade balance ________________________________________________________________ 665.3 Services and income ___________________________________________________________ 69
5.4 Capital account _______________________________________________________________ 70
5.5 External sustainability indicators _________________________________________________ 715.6 Summary ____________________________________________________________________ 72
����� ������ ���! ���6.1 Inflation drivers _______________________________________________________________ 78
6.2 Baseline scenario: assumptions and risks __________________________________________ 83
6.3 Inflation forecasts _____________________________________________________________ 87
"���Effects of the Crop Reduction ___________________________________________________ 15
Outlook for GDP in 2005 ________________________________________________________ 28
Evolution of Payroll-Deducted Loans _____________________________________________ 43Balance of Payments Projections _________________________________________________ 73
Twelve-Month Ahead Inflation Expectations ________________________________________ 90
International Experience with Inflation Targeting _____________________________________ 92
#��� ���
����������������������� ��$�
#������ ��$�

����������5�������������� ���5���
������
The Inflation Report is a quarterly publication of the BancoCentral do Brasil, aimed at evaluating the performance ofthe inflation targeting regime and communicating the Bank’soutlook for inflation. The domestic and internationaleconomic conditions underlying the Monetary PolicyCommittee’s (Copom) decisions are also presented.
The Report is divided into six chapters: Economic Activity;Prices; Credit, Monetary, and Fiscal Policies; InternationalEconomy; External Sector; and Prospects for Inflation.The chapter on Economic Activity examines the recentperformance of retail sales, inventories, output, the labormarket, and investment. The following chapter, on Prices,focuses on recent inflation results, the responsiveness ofinflation to monetary policy decisions, and the economicconditions that may impact inflation. The third chapterexamines relevant credit, monetary, and fiscal policies. Thechapter on the International Economy analyzes the mainglobal economic areas and seeks to identify global economicconditions that may affect Brazil’s balance of payments.The External Sector chapter reviews Brazil’s internationaleconomic-financial relations, with an emphasis on recenttrade sector results and external financing conditions.Finally, the chapter on Prospects for Inflation analyzes theinflation outlook.

����������5�������������� ���5���
When compared to the pace of 2004, Brazilian economic growthin early-2005 has clearly moderated. This is confirmed by therecent performance of industrial activity and retail sales, aswell as by the evolution of GDP in the first quarter. Theseindicators posted positive though declining rates of growth whencompared to the same periods of 2004, and relative stability oronly slight growth in comparison to the end of last year. Afterpeaking at historically high levels, the transitory slowdown ineconomic activity is expected to enable more sustainable long-term growth in an environment of price stability.
The more moderate pace of activity has been accompaniedby changes in the composition of demand, as the externalsector has risen in importance, to the detriment of domesticdemand. On the external front, global economic growthcontinues to be the main factor underlying the dynamicperformance of the export sector, and has even neutralizedpossible negative impacts of recent exchange rateappreciation. Domestically, personal consumption has beenimpacted by the self-propagating effects of risingemployment and real earnings and will tend to remain high,despite a slight drop registered in national accounts in thefirst quarter of this year (following six consecutive quartersof growth). Investment has dropped since the end of 2004,after registering high growth for five consecutive quarters.Though, to some extent, this drop resulted from losses infarm machinery demand, it is also a result of the recentmonetary tightening. The favorable performance ofsovereign risk and business sentiment suggest thatinvestment will recover as the uncertainties surrounding theevolution of domestic demand dissipate.
In the first months of 2005, the job market has performedpositively, with significant reductions in the unemploymentrate when compared to the same months of 2004. At thesame time, however, the overall labor force has expandedand new hirings have slowed, consistent with a moderationin economic activity.
��� �������������
*��5�������������� ���5����������
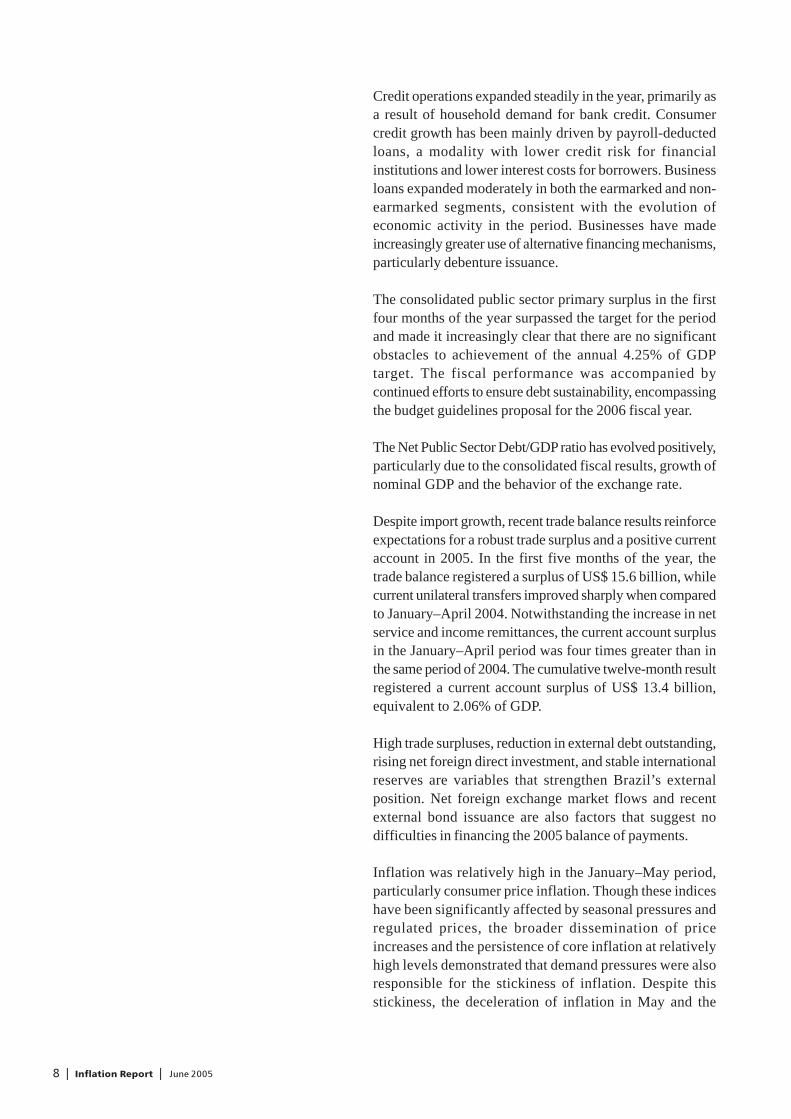
Credit operations expanded steadily in the year, primarily asa result of household demand for bank credit. Consumercredit growth has been mainly driven by payroll-deductedloans, a modality with lower credit risk for financialinstitutions and lower interest costs for borrowers. Businessloans expanded moderately in both the earmarked and non-earmarked segments, consistent with the evolution ofeconomic activity in the period. Businesses have madeincreasingly greater use of alternative financing mechanisms,particularly debenture issuance.
The consolidated public sector primary surplus in the firstfour months of the year surpassed the target for the periodand made it increasingly clear that there are no significantobstacles to achievement of the annual 4.25% of GDPtarget. The fiscal performance was accompanied bycontinued efforts to ensure debt sustainability, encompassingthe budget guidelines proposal for the 2006 fiscal year.
The Net Public Sector Debt/GDP ratio has evolved positively,particularly due to the consolidated fiscal results, growth ofnominal GDP and the behavior of the exchange rate.
Despite import growth, recent trade balance results reinforceexpectations for a robust trade surplus and a positive currentaccount in 2005. In the first five months of the year, thetrade balance registered a surplus of US$ 15.6 billion, whilecurrent unilateral transfers improved sharply when comparedto January–April 2004. Notwithstanding the increase in netservice and income remittances, the current account surplusin the January–April period was four times greater than inthe same period of 2004. The cumulative twelve-month resultregistered a current account surplus of US$ 13.4 billion,equivalent to 2.06% of GDP.
High trade surpluses, reduction in external debt outstanding,rising net foreign direct investment, and stable internationalreserves are variables that strengthen Brazil’s externalposition. Net foreign exchange market flows and recentexternal bond issuance are also factors that suggest nodifficulties in financing the 2005 balance of payments.
Inflation was relatively high in the January–May period,particularly consumer price inflation. Though these indiceshave been significantly affected by seasonal pressures andregulated prices, the broader dissemination of priceincreases and the persistence of core inflation at relativelyhigh levels demonstrated that demand pressures were alsoresponsible for the stickiness of inflation. Despite thisstickiness, the deceleration of inflation in May and the

����������5�������������� ���5��,
outlook for June suggest that recent inflation pressureshave been mostly overcome.
This deceleration is largely attributable to the monetarytightening cycle initiated in September 2004. In comparisonto the beginning of the year, there has been a reduction inthe risks to inflation convergence to the target path. Thepersistence of specific sources of inflationary pressure hasbeen attenuated, at the same time in which improvementshave occurred on the external front, notwithstanding recentinternational oil price increases.
The central forecast for 2005 IPCA inflation in thebenchmark scenario stands at 5.8%. The 0.3 p.p. increasein relation to the forecast in the March Inflation Reportwas caused primarily by higher-than-expected March to Mayinflation, coupled with the upward revision of 2005 regulatedprice inflation, which more than compensated for the effectsof a higher real interest rate and a more appreciatedexchange rate. For 2006, the inflation projection in thebenchmark scenario is 3.7%, 0.1 p.p. below the MarchReport. The fall was due basically to the effects of higherreal interest rates and greater exchange rate appreciation,which more than compensated for the upward revision ofprojections for regulated price inflation in 2006.
The forecasts for the IPCA in the market scenario – basedon the market consensus for interest and exchange ratescompiled by the BCB – stand at 6.3% for 2005 and 4.7%for 2006. These forecasts are above those in the benchmarkscenario, since the market scenario incorporates a declinein interest rates and a depreciation of the exchange rateover the forecast horizon. The current forecast for 2005increased in comparison to the March Report forecast, whilethe forecast for 2006 fell in the period.
In the benchmark scenario, GDP is projected to grow 3.4%in 2005, 0.6% below that estimated in the previous Report.

�������������������������� ��������
���������������
The forecast set out in the March Inflation Report, thatBrazilian economic growth would slow somewhat in early2005, has been confirmed by the recent performance ofindustrial activity and retail sales, as well as by GDP in thefirst quarter of the year. These indicators posted positive –albeit declining – growth, when compared to the sameperiods of 2004, and relative stability or slight growth, whencompared to the final months of 2004. After rising sharply,economic growth has cooled somewhat since the last quarterof 2004. This is a positive development, in light of theobjective of sustainable growth with price stability.
Though the rate of economic growth in early-2005 was quitesimilar to that at end-2004, there was a shift in the relativecomposition of economic activity. Continued export growthhas increased the contribution of external demand to overalloutput. Domestically, following a sharp recovery up to thethird quarter of 2004, investment outlays have diminished,while consumption has been consistently strong, mainly dueto steady credit expansion.
The labor market has posted positive results in 2005, asunemployment dipped below the level registered in the sameperiod of 2004, and new job creation has been strong.
��� ���������
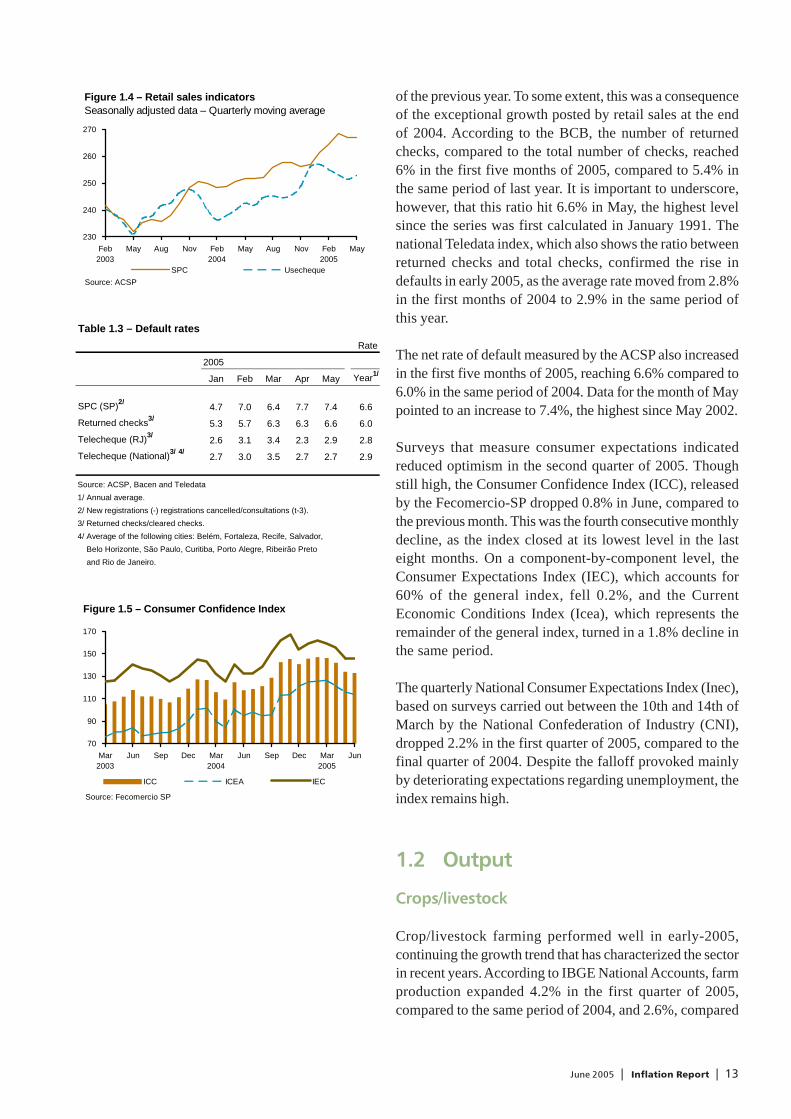
Interrupting the upward trend observed last year, retail salesindicators leveled off at high levels in the early months of2005. This evolution resulted from distinct performanceacross retail sectors, as demand for non-durable goods,which had grown steadily up to January, declined, and salesof durable goods have continued to expand, primarily as aresult of improved credit conditions.
According to the IBGE nationwide survey, the Retail SalesVolume Index dropped 0.5% in the three-month period ended
95
100
105
110
115
Feb2003
Apr Jun Aug Oct Dec Feb2004
Apr Jun Aug Oct Dec Feb2005
Apr
Figure 1.1 – Retail salesSeasonally adjusted data2003=100
Source: IBGE
90
100
110
120
130
140
150
Apr2003
Jul Oct Jan2004
Apr Jul Oct Jan2005
Apr
90
100
110
120
Furniture and home appliances Supermarkets
Figure 1.2 – Retail salesSeasonally adjusted data2003=100
Source: IBGE
Furniture and home appliances Supermarkets

������������������� ���������������
in April, seasonally adjusted, compared to the previous three-month period. Only the segments of furniture and householdappliances, and fabric, clothing and shoes rose, with growthof 4.8% and 3.3%, respectively, while the other segmentsdeclined, with particularly strong contractions for fuel andlubricant (5.7%), and hypermarket and supermarket (2.9%)sales. Autos, motorcycles and spare parts sales, which arenot included in the general index, fell 8.9%. Despite thisperformance, continued credit growth for automobileacquisitions indicates that this retail segment is clearly onthe path to recovery.
Nominal sales revenues in the first four months of 2005increased 12.3%, compared to the same period of theprevious year. This result reflects 5% growth in volume and7% in retail prices. For comparison, the IPCA rose 7.6% inthe same period. Nominal sales rose sharply in the sectorsof furniture and household appliances, 26.3%; autos andmotorcycles, 16.9%; and fabric, clothing and shoes, 15.9%.
Retail sales increased in all 27 states covered by the IBGEsurvey, in the first four months of 2005, compared to thesame period of 2004. The strongest growth occurred in Acre,26%; Amazonas, 23%; Paraíba, 22.2%; and Rio Grande doNorte, 20%.
According to Fecomercio-RJ, in the year through May, retailsales decelerated more sharply than that registered by thenational IBGE survey. Real earnings on retail sales in Riode Janeiro, deflated by the IPCA, dropped 5.2% in the three-month period through April, compared to the previous threemonths and seasonally adjusted.
Other indicators confirmed the slowdown in retail sales atthe margin. The number of consultations of the CreditProtection Service (SPC), an indicator of installment salesof goods with higher aggregate value, released by the SãoPaulo Trade Association (ACSP), increased 0.9% in thethree-month period ended in May, comparing to Februaryand seasonally adjusting. On the other hand, consultationsof the Usecheque, an indicator of lower cost upfrontpurchases, dropped 0.9%, in the same period. Since the endof 2004, these two indicators moved in opposite directions,reflecting the different evolution of sales that are moredependent on credit, which expanded steadily during 2004,and those that are more income-sensitive, which cooled inthe early part of this year.
In the first quarter of 2005 and beginning of the secondquarter, default indicators rose, compared to the same period
Table 1.1 – Retail sales
2005, April
% accumulated growth in 2005
Nominal Volume Price
revenue
Retail sector 12.3 5.0 7.0
Fuel and lubricants 11.4 -6.5 19.2
Supermarkets 7.8 3.9 3.8
Fabrics, apparel and footwear 15.9 5.1 10.3
Furniture and home appliances 26.3 19.6 5.6
Vehicles and motorcycles 16.9 4.1 12.3
Source: IBGE
Table 1.2 – Retail sales
% change
2004 2005
Dec Jan Feb Mar Apr
In the month1/
Retail sector 1.9 -0.7 -1.5 1.4 -0.2
Fuel and lubricants 1.9 -2.7 -3.4 -1.3 -1.1
Supermarkets 1.7 -1.8 -2.6 0.6 -0.5
Fabrics, apparel and footwear 4.6 -0.8 -2.7 0.7 13.7
Furniture and home appliances 5.3 -1.9 1.5 3.7 1.1
Vehicles and motorcycles 15.7 -7.7 -8.5 0.9 -1.2
Quarter/previous quarter1/
Retail sector 1.9 2.7 2.1 0.4 -0.5
Fuel and lubricants -0.3 0.4 -1.2 -4.0 -5.7
Supermarkets 2.7 2.2 0.6 -1.9 -2.9
Fabrics, apparel and footwear 1.7 3.9 2.9 0.9 3.3
Furniture and home appliances 2.8 5.6 6.5 4.8 4.8
Vehicles and motorcycles 3.2 5.4 5.2 -4.5 -8.9
In the year
Retail sector 9.2 6.2 4.4 5.9 5.0
Fuel and lubricants 4.6 -1.1 -3.5 -5.4 -6.5
Supermarkets 7.2 6.3 3.6 6.1 3.9
Fabrics, apparel and footwear 4.7 4.2 2.2 1.7 5.1
Furniture and home appliances 26.4 19.6 18.3 18.2 19.6
Vehicles and motorcycles 17.8 11.4 5.5 5.3 4.1
Source: IBGE
1/ Seasonally adjusted data.
1,500
2,000
2,500
3,000
3,500
Feb2003
May Aug Nov Feb2004
May Aug Nov Feb2005
May
90
100
110
120
130
140
Non-earmarked credit for vehicles
Vehicles, motorcycles and parts
Figure 1.3 – Retail salesSeasonally adjusted data
Source: IBGE and Banco Central do Brasil
CreditIn R$ million of May 2005
Vehicles, motorcycles and parts2003=100
�������������������������� ��������
of the previous year. To some extent, this was a consequenceof the exceptional growth posted by retail sales at the endof 2004. According to the BCB, the number of returnedchecks, compared to the total number of checks, reached6% in the first five months of 2005, compared to 5.4% inthe same period of last year. It is important to underscore,however, that this ratio hit 6.6% in May, the highest levelsince the series was first calculated in January 1991. Thenational Teledata index, which also shows the ratio betweenreturned checks and total checks, confirmed the rise indefaults in early 2005, as the average rate moved from 2.8%in the first months of 2004 to 2.9% in the same period ofthis year.
The net rate of default measured by the ACSP also increasedin the first five months of 2005, reaching 6.6% compared to6.0% in the same period of 2004. Data for the month of Maypointed to an increase to 7.4%, the highest since May 2002.
Surveys that measure consumer expectations indicatedreduced optimism in the second quarter of 2005. Thoughstill high, the Consumer Confidence Index (ICC), releasedby the Fecomercio-SP dropped 0.8% in June, compared tothe previous month. This was the fourth consecutive monthlydecline, as the index closed at its lowest level in the lasteight months. On a component-by-component level, theConsumer Expectations Index (IEC), which accounts for60% of the general index, fell 0.2%, and the CurrentEconomic Conditions Index (Icea), which represents theremainder of the general index, turned in a 1.8% decline inthe same period.
The quarterly National Consumer Expectations Index (Inec),based on surveys carried out between the 10th and 14th ofMarch by the National Confederation of Industry (CNI),dropped 2.2% in the first quarter of 2005, compared to thefinal quarter of 2004. Despite the falloff provoked mainlyby deteriorating expectations regarding unemployment, theindex remains high.
��� � �� �
������������
Crop/livestock farming performed well in early-2005,continuing the growth trend that has characterized the sectorin recent years. According to IBGE National Accounts, farmproduction expanded 4.2% in the first quarter of 2005,compared to the same period of 2004, and 2.6%, compared
230
240
250
260
270
Feb2003
May Aug Nov Feb2004
May Aug Nov Feb2005
May
SPC Usecheque
Source: ACSP
Figure 1.4 – Retail sales indicatorsSeasonally adjusted data – Quarterly moving average
Figure 1.5 – Consumer Confidence Index
70
90
110
130
150
170
Mar2003
Jun Sep Dec Mar2004
Jun Sep Dec Mar2005
Jun
ICC ICEA IEC
Source: Fecomercio SP
Table 1.3 – Default rates
Rate
2005
Jan Feb Mar Apr May Year1/
SPC (SP)2/4.7 7.0 6.4 7.7 7.4 6.6
Returned checks3/5.3 5.7 6.3 6.3 6.6 6.0
Telecheque (RJ)3/2.6 3.1 3.4 2.3 2.9 2.8
Telecheque (National)3/ 4/2.7 3.0 3.5 2.7 2.7 2.9
Source: ACSP, Bacen and Teledata
1/ Annual average.
2/ New registrations (-) registrations cancelled/consultations (t-3).
3/ Returned checks/cleared checks.
4/ Average of the following cities: Belém, Fortaleza, Recife, Salvador,
Belo Horizonte, São Paulo, Curitiba, Porto Alegre, Ribeirão Preto
and Rio de Janeiro.

������������������� ���������������
to the fourth quarter of 2004. It is important to note thatthese results did not incorporate the grain harvest reductionsexpected for the current year.
�����������
Estimates released in May by the National Supply Company(Conab) for the 2005 grain harvest reached 113.7 million tons.This represents a reduction of 16.2 million tons compared tothe first estimate made in October, and is 4.6% below theprevious year’s harvest. The IBGE Systematic FarmProduction Survey (LSPA) for May also highlighted the cropreduction caused by the drought in the states of Mato Grossodo Sul, Paraná and Rio Grande do Sul. According to thissurvey, total output of grains, cereals and legumes should reach113.5 million tons this year, or 15.3% below the Octoberestimate (see box "Effects of the Crop Reduction").
The crops most seriously affected by adverse weatherconditions were corn and soybeans. According to Conabestimates, soybean output should close at 50.2 million tonsin 2005, compared to the originally projected 60.2 million. Incomparison to the 2004 harvest, average crop yield isexpected to drop 7.1%, with growth of 8.6% in the areaunder cultivation and 0.8% in the volume harvested. Cornoutput is forecast at 36 million tons, 16.1% below the initialforecast. Production in the current year is expected to drop14.6% compared to 2004, with reductions of 5.2% in areaunder cultivation and 9.9% in average yield.
In the cases of rice and beans, both of which are importantto domestic price dynamics, the change in recent harvestestimates was less accentuated. Rice output is expected toreach 13.2 million tons, up 2.9% over the 2004 results and9.3% greater than the initial estimate. The increase in areaunder cultivation is estimated at 5.5%, while average yieldis expected to drop by 2.5%. Total bean output should closeat 2.9 million tons, down from the initial forecast of 3 milliontons, reflecting a reduction of 2.8% compared to last year’sharvest. Despite the 13.3% cutback in area under cultivation,average yield should increase 12.1%. In the case of beans,domestic supply should be sufficient to meet demand, asdemonstrated by Conab estimates indicating overall supplyof 3.4 million tons and consumption of 3.1 million tons.
According to the May LSPA, the national sugar cane harvestis estimated at 420.2 million tons, up 0.9% compared to 2004.The area under cultivation should expand by 1.2%, whileaverage yield should drop by 0.3%. The same survey
65
75
85
95
105
115
125
1997 1998 1999 2000 2001 2002 2003 2004 2005
Figure 1.6 – Grain productionIn million of tons
Source: Conab1/ Estimate.
1/
Table 1.4 – Farm productionIn 1,000 tons
Production % change
2004 20051/
Grain production 119 114 113 688 -4.6
Cotton (seed) 2 099 2 220 5.8
Rice 12 829 13 198 2.9
Beans 2 978 2 896 -2.8
Corn 42 128 35 989 -14.6
Soybean 49 793 50 195 0.8
Wheat 5 851 5 846 -0.1
Others 3 435 3 343 -2.7
Source: Conab
1/ Estimate.

�������������������������� ��������
������������������ �����
According to the IBGE’s survey for the month ofMay, the 2005 grain harvest will total 113.5 milliontons, a 4.9% decline compared to 2004. The surveyalso reveals a harvest 15.3% below initial forecasts.These results are compatible with the figures releasedby Conab, which issued an April estimate of a totalgrain harvest of 113.7 million tons, 12.5% below theinitial forecast made last October.
The drop in grain production was caused by adverseweather conditions at end-2004 and early-2005 in themajor production regions, particularly the south andcentral-west, which were hit first by drought and laterby excess rainfall. In addition to grains, otherimportant crops are also expected to register areduction in output, including coffee, with a drop of11.4%, and oranges, with a 3% decline, or very slightgrowth, as in the case of sugar cane, of 0.9%,compared to the 2004 harvest year.
Table 1 shows that corn and soybeans were thehardest hit by adverse weather conditions and,therefore, registered the sharpest reductionscompared to pre-planting crop yield estimates.Compared to 2004, soybean output is expected torise 3.1% in the year.
Among the impacts of the crop reduction, three havesignificant implications for the macroeconomicoutlook:
i) The loss of farm income and its impact ondomestic demand;ii) The influence of reduced supply on the evolutionof domestic prices; andiii) The loss of exports.

������������������� ���������������
As far as income losses are concerned, farmers arefacing the dual problem of production shortfalls causedby poor weather and unfavorable prices for variouscrops, in relation to last year. FGV data indicate thatthe prices of soybeans, wheat, corn and rice droppedby 34%, 18.5%, 11.6% and 7.1%, respectively, in realterms, in the first two months of 2005, compared tothe same period of 2004, using the IPCA as deflator.It is important to stress that several products hit byprice reductions had registered strong price increasesin the 2003/2004 period, such as rice (33%), tobacco(27.1%) and soybeans (7.7%).
Table 2 shows the evolution of income on a product-by-product basis, considering output for each yearand average prices as reference. After 2003 – whenthe grain harvest set a new record and the prices ofseveral products, primarily tradables, were relativelyhigh – income stabilized in real terms in 2004 anddropped sharply in 2005.
The estimated falloff in income in 2005 impactedeleven of the fifteen major crops, with particularlystrong effects on soybeans, corn and rice, whichaccount for a significant share of farm income, aswell as wheat and oranges.
The effects of lower rural sector income are alreadyevident in retail sector data. According to the IBGE’snationwide retail survey, sales closed below the nationalaverage in those states hit by adverse weatherconditions (south and central-west regions) and inwhich farm income has significantly higher importance.
Another important consequence of the loss of farmincome is that the sector has been decapitalized. This
Table 1 – Systematic Farm Production Survey (LSPA)
Grain production (1 000 ton) % change
2004
(A) 1st survey – October 2004 May 2005 estimate (C) (C/A) (C/B)
Soybeans 49 522 63 085 51 077 3.1 -19.0
Corn 41 806 43 409 35 470 -15.2 -18.3
Rice 13 277 12 706 13 234 -0.3 4.2
Beans 2 965 3 058 2 999 1.2 -1.9
Others 11 800 11 783 10 688 -9.4 -9.3
Total 119 369 134 042 113 468 -4.9 -15.3
Source: LSPA / IBGE
2005

�������������������������� �������
has direct implications on investment levels andutilization of inputs and, therefore, on productivity.Early data on machinery, equipment and fertilizeracquisitions indicate a decline in 2005, whencompared to previous years.
The impact of the crop reduction on domestic pricesand, particularly, on consumer prices, is expected tobe negligible. The main crops affected by adverseweather conditions have been soybeans and corn, theprices of which are basically determined byinternational markets. At the same time, the impact ofthe crop reduction on the domestic market has beenminimized by recent exchange rate appreciation. Also,these crops do not have a significant participation inthe composition of consumer price indices – soybeanoil has a weight of 0.33% and corn just 0.02% in theIPCA. The largest impacts of reduced supply of theseproducts are indirect, since they are importantingredients in animal feed. However, in recent months,meat prices have trended downward, benefiting notonly from favorable seasonal factors, but also fromthe evolution of the exchange rate.
Table 2 – Income – Main farm products
Crops 2002 2003 2004 2005
Income1/ Income1/ % change % change Income1/ % change % change Income1/ % change % change
IPCA2/ IPP3/ IPCA2/ IPP3/ IPCA2/ 4/ IPP3/ 4/
Soybeans 21 038 31 778 31.7 17.1 32 527 -4.0 -6.9 26 041 -24.1 -24.4
Sugar cane 9 609 11 724 6.4 -5.5 11 657 -6.7 -9.6 12 945 5.3 4.9
Corn 9 260 15 140 42.5 26.7 12 666 -21.5 -23.9 10 156 -24.0 -24.2
Rice 4 084 5 966 27.4 13.2 8 411 32.2 28.2 7 370 -16.9 -17.2
Oranges 6 335 6 370 -12.3 -22.1 6 211 -8.5 -11.3 6 029 -7.9 -8.3
Manioc 1 797 3 161 53.3 36.3 4 519 34.1 30.0 4 648 -2.4 -2.8
Cotton 1 514 2 432 40.0 24.5 4 515 74.2 68.9 4 479 -5.9 -6.3
Banana 2 717 3 449 10.7 -1.6 3 846 4.6 1.4 3 981 -1.8 -2.2
Coffee 2 209 2 610 3.0 -8.4 3 696 32.8 28.7 3 960 1.6 1.2
Beans 3 503 4 479 11.5 -0.9 3 435 -28.1 -30.3 3 805 5.1 4.7
Tobacco 1 762 2 356 16.6 3.6 3 867 54.0 49.2 3 678 -9.8 -10.1
Tomatoes 1 810 2 634 26.9 12.8 3 131 11.5 8.1 2 819 -14.6 -14.9
Wheat 1 093 2 684 114.1 90.3 2 384 -16.7 -19.2 1 978 -21.3 -21.6
Others 4 027 5 040 9.1 -3.0 5 916 10.1 6.7 5 254 -15.8 -16.1
Total 70 757 99 823 23.0 9.3 106 780 0.3 -2.7 97 143 -13.7 -14.0
Source: IBGE and FGV
1/ In R$ million. Estimated by crops, adjusted by average price.
2/ Real % change, deflated by IPCA.
3/ Real % change, deflated by IPP – Prices Paid by Farm Producers.
4/ First two months of 2005, compared to same period of 2004.
Table 3 – Retail sales – Volume
Quarter/previous quarter1/
2005
Jan Feb Mar Apr
Rio Grande do Sul 1.19 1.46 -0.06 -1.89
Paraná 3.86 0.14 -4.24 -7.53
Santa Catarina 2.57 2.56 1.84 -1.07
Minas Gerais 2.77 0.20 -0.73 -3.26
Mato Grosso 3.52 2.61 -2.64 -2.70
Brazil 2.74 2.12 0.41 -0.51
Source: IBGE
1/ Seasonally adjusted data.

������������������ ���������������
On the other hand, products such as rice and beans,which are important components of the consumerbasket – respective weights of 0.76% and 0.48%in the IPCA – were not significantly affected byweather conditions, as is evident in Table 1. Thoughthe price of rice dropped 21.3% in the first twomonths of the year, compared to the same periodof 2004, the price of beans increased 5.5%.
The effects of the crop reduction have beensignificant for some agricultural export products.According to the Foreign Trade Secretariat of theMinistry of Development, Industry and ForeignTrade (SECEX/MDIC), corn export volume totaled1 million tons in the first five months of 2005,dropping 62.4% in relation to the same period of2004. On the other hand, soybean export volumegrew 11.9% in the first five months of the year. Ofnote, despite the soybean crop reduction relative toinitial predictions, this year’s soybean output will begreater than 2004.
Table 4 – Domestic production and sales of farm machines – January to April
2000 2001 2002 2003 2004 2005
Sales of farm machines (units) 6 630 8 657 10 624 9 974 12 146 7 486
% change - 30.57 22.72 -6.12 21.78 -38.37
Growth in production of capital goods for the agricultural sector (%) 3.37 30.11 4.28 15.80 25.06 -31.73
Growth in production of parts for farm machines (%) - - - 44.83 22.93 -67.96
Source: Fenabrave and IBGE

�������������������������� ��������
indicates a coffee harvest of 2.2 million tons, 11.4% lessthan that of 2004, reflecting falloffs of 0.9% in the areaharvested and 10.6% in average yield.
������
According to the IBGE Quarterly Animal Slaughter Survey,beef production came to 1.5 million tons in the fourth quarterof 2004, mirroring growth of 12.5% compared to the sameperiod in 2003. For the year, production expanded by 19%,the highest annual growth rate since 1997 when the serieswas first compiled. To some extent, this performancereflects the export dynamics of the sector. In the first fourmonths of 2005, exports totaled 304.6 thousand tons, up23.6% over the same period of 2004. Recent figures havealso been positive: beef exports expanded by 9.7% in thethree-month period ended in April, compared to January andseasonally adjusted.
The overall volume of poultry slaughtered increased 13.8%in the last quarter of 2004, compared to the same period ofthe previous year, with annual cumulative growth of 13.4%.Compared to the previous year, 2004 exports totaled 2.4million tons, up 26.1%. In 2005, exports have continuedexpanding, posting an increase of 27% in the first four monthsof the year, compared to the same period of 2004.
Output of swine totaled 464.5 thousand tons in the finalquarter of 2004, reflecting a drop of 4.8% compared to thesame period of 2003. Cumulative production for the yeardeclined 2.6%, partly as a result of import quotas adoptedby Russia, the main market for Brazilian pork exports. Porkexports totaled 471 thousand tons in 2004, up 2.8% year-on-year. In the year through April, pork exports reached169.2 thousand tons, up 39.7% over the same period of 2004.
Data from the IBGE Monthly Industrial Survey (PIM) pointto continued growth in livestock production in the current year.Confirming these expectations, beef and pork slaughteringand manufacturing expanded 3.5% in the first quarter, quarter-on-quarter seasonally adjusted, while poultry output rose 0.3%.
�����������������
In the early months of 2005, the level of industrial activityconfirmed the tendency toward more stable, albeit still high,growth evident since the end of 2004, with only slightvariation at the margin.
Figure 1.7 – Livestock – Total slaughters2002=100
90
95
100
105
110
115
120
125
Mar2003
Jun Sep Dec Mar2004
Jun Sep Dec Mar2005
Cattle and swine Poultry
Source: IBGE
Table 1.5 – Livestock production
Total slaughters
% accumulated growth
2004
Sep Oct Nov Dec
Cattle 21.4 19.7 19.8 19.0
Swine -1.9 -3.5 -3.2 -2.6
Poultry 13.2 12.9 13.1 13.4
Source: IBGE

������������������� ���������������
According to the IBGE, industrial production dropped 0.4%in the quarter ended in April, quarter-on-quarter seasonallyadjusted. Production of the manufacturing sector dropped0.5% and mining output, which accounts for 4.96% of totalindustrial production, increased 3.7%. In annual terms,industrial activity expanded 4.5% in the first four months ofthe year, compared to the same period of 2004, with growthof 7.3% in mining and 4.3% for manufacturing.
The leveling off of growth in industrial activity was evidentin the diffusion index. Based on three-month seasonallyadjusted moving averages, 96% of industrial activitiesregistered positive growth at the end of the first half of 2004,dropping to 57% at end-2004, and standing at 61% at theclose of the first four months of 2005.
Analysis of manufacturing activities by use category showshighly different performance. While consumer durable goodsoutput registered results similar to those of 2004, the outputlevels of the other categories stabilized or declined slightly.
Capital goods output has been relatively stable since thesecond half of 2004, registering a reduction of 1.6% in thequarter ended in April, quarter-on-quarter seasonallyadjusted. In the first four months of 2005, production underthis heading expanded 2.8%, in relation to the same periodof 2004, compared to an average of 4.5% for the aggregateindustrial sector. To some extent, the postponement ofbusiness investments, as demonstrated in the negative ratesof gross fixed capital formation in the national accounts forthe last quarter of 2004 and the first quarter of 2005, partlyexplains the recent performance of capital goods output.
Furthermore, the slowdown in capital goods productionreflected the loss of farm sector profitability in the currentyear, with the drop in the output of capital goods concentratedin those to the farm sector. This is clear in reductions of68% in the production of spare parts for farm machineryand 31.7% in the output of capital goods for the farm sector,when the first four months of 2005 are compared to thesame period of 2004. Capital goods production for theconstruction industry increased by 30.3%, followed byelectricity generation and distribution (14%), andtransportation equipment (11.1%). Production of capitalgoods for the industrial sector expanded 5.9%.
Intermediate goods production, which accounts forapproximately 53.3% of total industrial production, diminished1.3% in the quarter ended in April, quarter-on-quarter,seasonally adjusted. Cumulative production in the first four
Table 1.6 – Industrial production% change
2005
Jan Feb Mar Apr
Industry (total)
In the month1/ - 0.5 - 1.4 1.5 0.0
Quarter/previous quarter1/ 0.6 0.3 - 0.2 - 0.4
Same month of the previous year 5.9 4.1 1.8 6.3
Accumulated in the year 5.9 5.0 3.8 4.5
Accumulated in 12 months 8.5 8.6 7.6 7.5
Manufacturing industry
In the month1/ - 0.3 - 1.2 1.0 - 0.5
Quarter/previous quarter1/ 1.0 0.7 0.1 - 0.5
Same month of the previous year 5.9 4.2 1.6 5.9
Accumulated in the year 5.9 5.1 3.8 4.3
Accumulated in 12 months 8.7 8.8 7.8 7.6
Mining
In the month1/ 1.0 0.2 0.5 7.4
Quarter/previous quarter1/ 0.2 1.2 1.5 3.7
Same month of the previous year 7.4 1.5 6.4 13.7
Accumulated in the year 7.4 4.5 5.1 7.3
Accumulated in 12 months 4.9 4.7 5.2 6.3
Source: IBGE
1/ Seasonally adjusted data.
95
105
115
125
135
145
Apr2003
Jul Oct Jan2004
Apr Jul Oct Jan2005
Apr
Total Manufacturing industry Mining
Figure 1.8 – Industrial productionSeasonally adjusted data2000=100
Source: IBGE

�������������������������� ��������
months of 2005, compared to the corresponding period ofthe previous year, increased 2.1%, the slowest growth amongthe different use categories.
Just as in the case of capital goods, the falloff in intermediategoods output was partly caused by adverse conditions inthe farm sector in the first months of the year. The drop inthe harvest impacted performance in the production offertilizers and soil correction products and pesticides,generating a 1.6% drop under the heading “other chemicalproducts” in the quarter ended in April, quarter-on-quarterseasonally adjusted. Production of intermediate goods alsoreflected the negative performance of petroleum andalcohol1 refining activities, down 7.4% in the same periods.
After peaking in January 2005, production of semi- and non-durable consumer goods dropped 0.7% in the quarter endedin April, quarter-on-quarter. On the one hand, this resultreflected increases in the output of pharmaceutical goods,6.5%; perfumes and cleaning products, 3.6%; clothing andaccessories, 2.5%; and beverages, 1.1%; and, on the otherhand, downturns under food, and shoes and leather goods,with respective declines of 0.6% and 1.9%, in the sameperiods. Cumulative output of this category in the yearthrough April, expanded 6.2%, compared to the first fourmonths of 2004, the year in which growth closed at 4%.
Recent exchange rate appreciation and higher domesticincome levels have favored competitiveness of severalimported semi- and non-durable consumer goods, thoughthis fact has not significantly impacted on domestic output.According to the Foreign Trade Studies Center Foundation(Funcex), in the first quarter of 2005, imports of dairyproducts grew 62%, while clothing imports increased 50.4%and shoes and leather, 22.5%, compared to the same periodof the previous year.
Consumer durable goods was the only category to registerincreased output in the quarter ended in April, quarter-on-quarter seasonally adjusted. The 7.2% growth registered inthe period was due to both the continued expansion inconsumer credit and positive export market figures. In thelatter case, the leading categories were electronics andcommunications devices, and automobiles, pickups and utilityvehicles. Production of electronics and communicationsdevices, which have an estimated weight of 8.8% in thecategory, registered a cumulative increase of 22.2% in thefirst four months of the year, compared to the same period
96
110
124
138
Apr2003
Jul Oct Jan2004
Apr Jul Oct Jan2005
Apr
Figure 1.9 – Industrial productionCapital goodsSeasonally adjusted data2000=100
Source: IBGE
Table 1.7 – Industrial production by category of use% change
2005
Jan Feb Mar Apr
In the month1/
Industrial production - 0.5 - 1.4 1.5 0.0
Capital goods - 1.0 - 3.3 3.9 - 2.9
Intermediate goods - 1.3 - 1.7 0.7 1.3
Consumer goods 1.5 - 1.4 0.8 - 0.2
Durable - 4.6 9.9 - 0.3 - 0.3
Semi and nondurable 3.7 - 4.0 - 0.1 - 0.3
Quarter/previous quarter1/
Industrial production 0.6 0.3 - 0.2 - 0.4
Capital goods 0.6 0.9 - 0.4 - 1.6
Intermediate goods - 0.8 - 0.9 - 1.7 - 1.3
Consumer goods 2.9 3.2 2.6 0.8
Durable - 0.4 3.3 4.0 7.2
Semi and nondurable 4.0 4.4 3.2 - 0.7
In the year
Industrial production 5.9 5.0 3.8 4.5
Capital goods 6.8 3.8 2.6 2.8
Intermediate goods 4.0 2.5 1.5 2.1
Consumer goods 8.3 8.3 6.7 7.7
Durable 3.3 11.4 12.0 13.5
Semi and nondurable 9.5 7.5 5.4 6.2
Source: IBGE
1/ Seasonally adjusted data.
1/ Around 69.6% of oil and alcohol refining is intermediate consumption.

������������������� ���������������
of 2004. This growth was driven mainly by domestic andexternal sales of cellular telephones. Sectoral Funcex dataindicated 99.4% expansion in exports of electronics in thefirst quarter of this year, compared to the same period ofthe previous year.
According to IBGE data, output of automobiles, pickups andutility vehicles, including engines, which account forapproximately 40% of consumer durables produced, rose16.3% in the first four months of 2004, compared to thesame period of the previous year.
Furthermore, information released by the NationalAssociation of Automotive Vehicle Manufacturers(Anfavea) indicates that production of automotive vehicleshas followed a consistently upward trend, driven by theexport market. While output of the automotive industryexpanded 3.2%, seasonally adjusted in the three-monthperiod ended in May, as against the three months throughFebruary, exports increased 6.7% and domestic sales grewby 3.8% in the same period. In year-on-year terms, theexport/domestic growth ratio was quite similar, as 15.4%growth in automotive vehicle output was fuelled by a 45.5%expansion of exports and 4.2% for domestic sales.
According to figures released by the CNI, real industrialsales grew 0.6% in the quarter ended in April, quarter-on-quarter seasonally adjusted. Cumulative growth in the yearstood at 2.6%, seasonally adjusted, with relative stabilityover the last four months at a historically high level.
Other industrial indicators released by the CNI repeatedthe same picture of stability at a high level. In the three-month period ended in April, the indicator of hours workedremained at practically the same average posted in theprevious three-month period, seasonally adjusted.Employment and overall real wages in the industrial sectorincreased 1% and 0.5%, respectively. Hours worked,employment and overall wages rose 7.1%, 6.9% and 9.0%,respectively, in the first four months of the year, comparedto the same period of 2004.
Installed capacity utilization in the manufacturing sectorremained stable in the first quarter of the year, standing at84.5%, compared to 84.6% in the last quarter of 2004,according to Getúlio Vargas Foundation (FGV) dataseasonally adjusted by the BCB. The intermediate goodssector posted the highest level of installed capacity utilization,
95
106
117
128
139
150
Apr2003
Jul Oct Jan2004
Apr Jul Oct Jan2005
Apr
Figure 1.11 – Industrial productionConsumer goodsSeasonally adjusted data2000=100
Source: IBGE
94
97
100
103
106
109
112
Apr2003
Jul Oct Jan2004
Apr Jul Oct Jan2005
Apr
Figure 1.12 – Industrial productionSemi and nondurable goodsSeasonally adjusted data2000=100
Source: IBGE
90
105
120
135
150
165
180
Apr2003
Jul Oct Jan2004
Apr Jul Oct Jan2005
Apr
Semi-manufactured Manufactured
Figure 1.13 – Industrial exports – VolumeSeasonally adjusted data2002=100
Source: Funcex
103
107
110
114
117
Apr2003
Jul Oct Jan2004
Apr Jul Oct Jan2005
Apr
Figure 1.10 – Industrial productionIntermediate goodsSeasonally adjusted data2000=100
Source: IBGE

�������������������������� ��������
88.7%, repeating the previous quarter’s result. In thesegment of consumer goods, installed capacity utilizationrose 1.6 p.p. in the quarter, to 79.6%, while for constructionmaterials this indicator increased 1.1 p.p. to 84.8%. Theonly category whose installed capacity utilization decreasedwas the capital goods industry, with 82.3% in the first quarterof 2005, compared to 83.6% in the last quarter of 2004.
According to CNI, installed capacity utilization reached 81.8%in April, 0.8 p.p below the average for the previous year.
Based on the CNI Industrial Survey, industrial companiesposted inventory growth for finished products and stabilityfor raw materials in the first quarter of the year. Theinventory level of inputs is considered normal, but that offinished products was higher than expected – the indicatorreached 54.4 points in the most recent survey, 3.8 pointsabove the same period of the preceding year. The FGVquarterly survey ratified the result of unplanned inventorygrowth, registering a difference of 8 points betweencompanies that consider their inventories excessive and thosethat considered them insufficient. This was the largestdifference since October 2003. The responses provided bybusiness people regarding inventory formation are consistentwith the deceleration in industrial sales in recent months.
In general, expectation indicators remain optimistic, thoughthere has been a certain dampening of enthusiasm in theindustrial sector. The reduction in confidence has been uniformamong executives from large, small and medium businessesand the CNI Industrial Confidence Index (ICEI) dropped from64.9 points in January to 55.8 points in April. The twocomponents of this indicator registered declines. However,the index of current conditions crossed the divider betweenoptimism and pessimism, falling to 46.1 points, reflecting anevident state of dissatisfaction. At the same time, theexpectations index for the coming six months remained above50 points. In other words, business sentiment regarding currentconditions is worse than their prognosis for the near future.
The disparity between perceptions of the current situationand perceptions of the future is repeated in other indicators.According to the quarterly FGV survey, the proportion ofcompanies that point to insufficient demand as the limitinggrowth factor in their activities rose in the survey for thefirst quarter of 2005, compared to the previous quarter. Morethan half of the companies surveyed, nonetheless, expectdemand for their goods to increase in the second quarter ofthe year and fully intend to raise output in that period.
85
95
105
115
125
135
145
Feb2003
May Aug Nov Feb2004
May Aug Nov Feb2005
May
Production Sales
Figure 1.14 – Vehicles – Production and salesSeasonally adjusted data2002=100
Source: Anfavea
100
110
120
130
140
Apr2003
Jul Oct Jan2004
Apr Jul Oct Jan2005
Apr
Production (IBGE) Sales (CNI)
Figure 1.15 – Industrial production and salesSeasonally adjusted data2000=100
Source: IBGE and CNI
Table 1.8 – Vehicles – Production and sales
% change
2005
Jan Feb Mar Apr May
In the month1/
Production -7.7 8.7 -1.3 3.0 -1.2
Total sales -14.2 7.7 3.0 2.0 4.9
Domestic sales -16.8 2.1 6.9 3.3 -0.3
External sales -0.5 11.5 0.0 -2.2 3.0
Quarter/previous quarter1/
Production -1.1 2.0 0.8 4.7 3.2
Total sales 0.6 3.7 -1.7 3.1 5.7
Domestic sales 1.6 0.9 -6.1 -0.8 3.8
External sales 1.4 12.0 11.0 11.8 6.7
In the year
Production 3.1 11.5 12.6 14.4 15.4
Total sales -4.1 3.8 8.0 12.6 15.0
Domestic sales -11.6 -8.9 -2.1 2.0 4.2
External sales 18.3 45.8 38.1 43.6 45.5
Source: Anfavea
1/ Seasonally adjusted data.

������������������� ���������������
Also according to the FGV survey, the balance of 20 pointsin favor of companies that expect to increase hirings,compared to those that foresee layoffs, confirms theoptimism surrounding industrial evolution in the comingmonths. However, when these data are compared toquarterly CNI figures, the result points to performances thatvary depending on the size of the company.
Small- and medium-sized businesses, with relatively lessaccess to foreign trade and funding, have demonstrated lesswillingness to hire additional labor, though these companiesare already labor intensive. This segment registered areduction in the number of employees in the first quarter of2005, compared to the previous quarter, and stability in thenumber of jobs for the next six months. Large companies,on the other hand, hired additional labor in the first quarterand expressed their intention to continue doing so.
While the tax burden and interest rates remain a point ofconcern among small, medium and large companies, theirpositions differ regarding other factors that may hampershort-term industrial growth. While exchange rateappreciation is cited as the third factor by large companiesand as the ninth by small and medium companies, insufficientdemand is the sixth most important limiting factor accordingto large scale industries, and fourth when judged by smalland medium enterprises.
Therefore, the current scenario suggests an attitude ofrelative caution on the part of businesses, with somewhattempered though still positive expectations regarding industrialsales and inventory formation, coupled with moderate growthin output of capital goods for the industrial sector. It is possiblethat industry has decided to await clearer signs of increaseddemand before deciding on investments and a more dynamicpace of activity.
��� �����������
���������
Unemployment expanded in the first quarter of the year,closing at 10.8% in March (compared to 9.6% in December),stabilized in April and dropped to 10.2% in May, accordingto the IBGE Monthly Employment Survey (PME). Thisbehavior reflected seasonal factors in the period.
Compared to the corresponding period of 2004, averageunemployment in the first five months of the year declined
Figure 1.16 – Utilization of installed capacity in the manufacturing industrySeasonally adjusted data%
78
80
82
84
86
Jan2003
Apr Jul Oct Jan2004
Apr Jul Oct Jan2005
Apr
CNI FGV
Source: CNI and FGV
30
50
70
Apr2002
Jul Oct Jan Apr2003
Jul Oct Jan Apr2004
Jul Oct Jan Apr2005
Icei Current conditions
Expectations
Source: CNI
Figure 1.17 – Business Confidence Index
Table 1.9 – Manufacturing industry inventories1/
2004 2005
I II III IV I
Manufacturing industry
Final products 50.6 50.3 49.6 51.3 54.4
Raw materials/intermediate goods 47.6 48.7 48.8 49.8 50.4
Large companies
Final products 52.2 52.1 51.5 53.8 56.6
Raw materials/intermediate goods 49.7 51.5 51.2 53.6 54.0
Small and medium companies
Final products 49.8 49.4 48.6 50.0 53.3
Raw materials and interm. goods 46.5 47.3 47.6 47.8 48.6
Source: CNI
1/ Values over fifty indicate inventories above the planned level.

�������������������������� ��������
1.8 p.p., indicating expansion of 3.8% in the number of jobholders and a 13.5% drop in the number of unemployedworkers. Using the same comparison basis, 712 thousandjobs were created, of which 513 thousand in the formal sectorof the economy and 181 thousand in the informal market.
Ministry of Labor and Employment (MTE) data confirmthe recovery in job generation. According to the GeneralFile of Employed and Unemployed Individuals (CAGED),770.8 thousand formal jobs were created in the January/May period, compared to 826.8 thousand in the same periodof 2004. The service sector accounted for the largest numberof openings, with 304.5 thousand, followed by manufacturing,with 177 thousand openings; crop/livestock activities, 107.1thousand; commerce, 101 thousand; and the civil constructionsector, 41.9 thousand.
A CNI survey among twelve state industrial associationscorroborates the positive evolution of the labor market in themanufacturing sector, showing an increase of 6.9% inemployed workers in the first four months of 2005, comparedto the same period of the previous year. Industrial employmentgrew 1% in the quarter ended in April, quarter-on-quarterseasonally adjusted. However, growth rates have declinedsince the third quarter of 2004. This behavior is fully consistentwith the recent leveling off of activity in the sector.
��������
The average real earnings of workers in the six metropolitanregions covered by the PME expanded by 1.5% in the firstfive months of 2005, compared to the same period of 2004.In nominal terms, average earnings reached R$932.80 inMay, up 7.7% over the same month of 2004.
On May 1, 2005, the minimum wage increased 15.4% toR$300, a real gain of 8.2%, when the cumulative NationalConsumer Price Index (INPC) from May 2004 to April 2005is used as deflator.
According to CNI, overall real wages in the manufacturingindustry, deflated by INPC, expanded 9.0% in the first fourmonths of 2005, compared to the same period of 2004, and0.5%, quarter-on-quarter seasonally adjusted. Similar toemployment in this sector, overall real wages expanded atlower rates in early-2005. Compared to the immediatelypreceding quarters, growth came to 2.7%, 3.5% and 0.5%in the third and fourth quarters of 2004 and first quarter of2005, respectively.
Figure 1.18 – Unemployment rate%
9
10
11
12
13
14
Jan Feb Mar Apr May Jun Jul Ago Sep Oct Nov Dec
2003 2004 2005Source: IBGE
Figure 1.20 – Average real regular earningsIn R$ of May 2005, deflated by INPC
900
925
950
975
1000
1025
Feb2003
May Aug Nov Feb2004
May Aug Nov Feb2005
May
Source: IBGE
-3
-2
-1
0
1
2
3
4
Feb2004
Apr Jun Aug Oct Dec Feb2005
Apr
Source: CNI
Figure 1.19 – Employment in the manufacturing industry – Quarterly moving averageSeasonally adjusted data% change
Table 1.10 – Formal employment
New job openings – Accumulated in the year (1,000 employees)
2004 2005
Jan Feb Mar Apr May
Total 1 523.3 116.0 189.3 292.2 558.3 770.8
Manufacturing industry 504.9 32.8 33.7 51.6 131.1 177.0
Commerce 403.9 11.2 19.8 33.8 67.1 101.0
Services 470.1 54.5 105.2 159.3 246.8 304.5
Building 50.8 7.9 8.8 15.0 29.6 41.9
Crop and livestock 79.3 4.1 2.6 4.2 48.4 107.1
Public utilities 4.6 2.7 4.5 6.1 7.8 8.5
Others1/9.7 2.8 14.7 22.2 27.5 30.8
Source: MTE
1/ Includes mining, public administration and others.

������������������� ���������������
��� ���������� ��� ��
According to IBGE, GDP expanded by 2.9% in the firstquarter of 2005, compared to the same period of 2004. Thisresult confirms the expected deceleration of economic activity,following the strong recovery of 5.9% and 4.7% in the thirdand fourth quarters of 2004, compared to the same quartersof 2003. A component-by-component analysis of this resultshows across-the-board expansion, in terms of either supplyor demand (see box “Outlook for GDP in 2005”).
A sector-by-sector breakdown shows that the sharpestgrowth, 4.2%, occurred under crop/livestock farming. Thisreflected the positive performance of livestock and relevantfirst quarter crops, such as cotton and rice. It is important tohighlight that the impact of the grain harvest decline will befelt more intensely in the second quarter of the year.
Industry posted growth of 3.1% in the quarter, with aparticularly strong recovery in mining. To a great extent,this was due to 3.8% greater oil output, according to datareleased by the National Petroleum Agency (ANP). Themanufacturing sector grew for the eighth consecutivequarter, 3.6%, though this figure decelerated compared toprevious quarters. Public utilities and the construction industryclosed with positive growth, albeit at a somewhat lesser rate.
In the first quarter of 2005, the service sector expanded2%, keeping pace with the positive performance registeredin other sectors of the economy. Here, it is important tounderscore the performance of commerce, transportationand financial institutions, which grew 4.2%, 4.1% and 2.8%,compared to the first quarter of 2004, while communicationsservices dropped 3.2%. This result followed the reductionin fixed telephone services.
In terms of demand, the dynamics of the external sectorcontinued through the first quarter of 2005. Exportsexpanded by 13.6%, while imports rose 12.2%, comparedto the same period of the previous year. Import volumeincreased mainly for capital goods and consumer goods,reflecting the economic activity rebound. Regarding domesticdemand, household consumption increased 3.1%; gross fixedcapital formation, 2.3% and government consumption, 0.7%.
On quarter-on-quarter seasonally adjusted terms, GDPexpanded by 0.3% in the first quarter, driven mainly by the2.6% expansion in crop/livestock activities. Confirming thebehavior of monthly activity level indicators, industryregistered a falloff of 1.0% and services dropped 0.2%,
94
98
102
106
110
114
118
Feb2003
Apr Jun Aug Oct Dec Feb2004
Apr Jun Aug Oct Dec Feb2005
Apr
Figure 1.22 – Real payroll in the manufacturing industrySeasonally adjusted data2000=100
Source: CNI
140
170
200
230
260
290
320
1998 1999 2000 2001 2002 2003 2004 2005
Figure 1.21 – Real minimum wage1/
In R$ of May 2005
Source: MTE1/ On the readjustment month; deflated by INPC.
-4
-2
0
2
4
6
8
10
12
I2003
II III IV I2004
II III IV I2005
Crop and livestock Industry Services GDP
Source: IBGE
Figure 1.23 – Gross Domestic ProductQuarter/same quarter of the previous year% growth

�������������������������� �������
primarily as a consequence of results in the area of telephoneservices. These two sectors registered positive growth inthe seven previous quarters.
As signaled by leading indicators, recent GDP growthconfirms perceptions of a more moderate pace of economicexpansion, after growing continuously since the secondquarter of 2003.
With the disclosure of the first quarter results, the IBGEhas revised the Quarterly National Accounts, which,according to the new methodology, can be done in anyquarter of the year and not just annually, as before. Therevision covered the second, third and fourth quarters of2004, and altered the GDP growth rate for that year, from5.2% to 4.9%.
��! "�#������
According to IBGE’s Quarterly National Accounts,investments excluding inventory variations dropped 3.0% inthe first quarter of 2005, quarter-on-quarter seasonallyadjusted. This was the second consecutive fall. Comparedto the same quarter of 2004, the growth rate came to 2.3%,with a cumulative four-quarter expansion of 11.0%.
The seasonally adjusted result of the first quarter of theyear was anticipated by some leading investment indicators,which indicated negative results in the early months of theyear, especially January and February.
Indicators for the month of April point to a continued declinein gross fixed capital formation. Construction input andcapital goods production declined 1.1% and 2.9% in April,respectively, on a month-on-month seasonally adjusted basis,while exports and imports of these goods increased 6.2%and 3.0%, respectively.
The modest performance of investments was, in part, dueto the reduction of crop/livestock sector revenues, which inturn impacted demand for farm machinery and equipment.As a consequence, output of farm machinery and equipmentplunged 31.7% and 68%, respectively, in the first four monthsof the year, compared to the same period of 2004. Theseresults contrast sharply with the performance of othersegments of capital goods output, particularly products forthe construction industry, electricity production andtransportation, which grew 30.3%, 14% and 11.1%,respectively, in the same period.
Table 1.11 – Gross Domestic Product
Change quarter/same quarter of the previous year
%
2004 2005
I Q II Q III Q IV Q I Q
Crop and livestock 5.8 6.0 5.9 3.0 4.2
Industry 5.5 6.3 7.0 5.9 3.1
Mining 2.2 2.0 2.0 -8.0 3.7
Manufacturing 9.1 6.8 6.6 8.3 3.6
Construction -0.8 6.9 11.6 5.2 0.6
Public utilities 1.5 5.9 5.2 5.8 2.9
Services 2.4 3.2 4.1 3.6 2.0
Commerce 4.8 8.9 10.5 7.3 4.2
Transportation 10.6 5.9 0.4 3.6 4.1
Communications -1.4 -2.7 -1.4 0.1 -3.2
Financial institutions 2.1 4.6 5.2 5.0 2.8
Other services 2.1 7.1 7.1 6.2 2.0
Rents 1.2 1.5 2.2 2.1 3.7
Public administration 2.0 -0.7 1.3 0.9 0.2
Financial dummy 0.4 5.4 6.0 5.7 2.7
Value added at basic prices 4.0 4.7 5.3 4.2 2.6
Taxes on products 4.0 8.5 11.1 8.9 4.7
GDP at market prices 4.0 5.1 5.9 4.7 2.9
Source: IBGE
Table 1.12 – Gross Domestic ProductQuarter/previous quarter
%
2004 2005
I Q II Q III Q IV Q I Q
GDP at market prices 4.0 5.1 5.9 4.7 2.9
Households consumption 1.6 4.3 5.3 5.0 3.1
Government consumption 0.8 -1.4 0.3 0.8 0.7
Gross fixed capital formation 1.8 13.4 19.3 9.3 2.3
Exports 20.5 17.6 18.2 16.2 13.6
Imports 12.5 14.2 17.7 12.8 12.2
Source: IBGE
Table 1.13 – Gross Domestic Product
%
2004 2005
I II III IV I
Accumulated in the year 4.0 4.6 5.0 4.9 2.9
Accumulated in 4 quarters 1.2 2.4 4.0 4.9 4.6
Quarter/same quarter
of the previous year 4.0 5.1 5.9 4.7 2.9
Quarter/previous quarter
seasonally adjusted 1.8 1.1 1.3 0.4 0.3
Source: IBGE

������������������ ���������������
� ���������� ���$$!
The GDP growth estimate for 2005 was reviseddownward from 4.0% to 3.4%, primarily as aconsequence of three factors: recent demanddynamics, the lower than expected agriculturalharvest, and IBGE’s revision of 2004 QuarterlyNational Accounts.
The economy evolved in line with expectations inthe first quarter of the year, with only slight growth,as had occurred in the last quarter of 2004. However,the GDP result demonstrated a greater-than-expected drop in domestic demand, which was onlypartially offset by stronger external demand. Oncechanges in inventories are excluded, both householdconsumption and investment declined in the quarter.In the case of consumption, the decline was a resultof rising inflation at end-2004 and early-2005 and itsimpact on real earnings, of higher credit default rates,and of the reduction in farm revenues. Investments,which have been declining since the end of 2004,also reflected farm revenue losses, as well as theuncertainties surrounding the evolution of demand inthe context of the monetary tightening cycle.
Aside from lower growth in the first quarter of theyear, the increased inflation contributed to a morerestrictive scenario than that originally anticipated forthe second quarter. Indicators for the early months ofthe quarter point to continued very moderate growthin the economy, just as occurred in the two previousquarters. Consequently, growth estimates for householdconsumption and investments in 2005 were reviseddownwards to 2.6% and 2.3%, respectively.
These growth estimates are based on a recovery inthe pace of growth in the second half of the year,made possible by the convergence of inflation to the

�������������������������� ��������
target path, as already shown in the most recentinflation results and forecasts. With regard toinvestment, continued positive macroeconomicfundamentals – as demonstrated by the reduction insovereign risk – point to a recovery in the secondhalf of the year. The correlation between sovereignrisk and investment showed a highly atypical behaviorin the first quarter of the year.
Contrasting with the estimated reduction inhousehold consumption and investments, the GDPforecast indicates that exports will increase, thusensuring that the growing participation of the
Figure 1 – Investment and Brazil-risk
105
115
125
135
I2000
II III IV I2001
II III IV I2002
II III IV I2003
II III IV I2004
II III IV I2005
II III
300
600
900
1 200
1 500
1 800
2 100
Investment Brazil-risk (t-2)
Brazil-risk (t-2)Investment1990=100
Source: IBGE and J P Morgan Chase
Table 1 – GDP%
Period GDP Household Government Total Gross Fixed Exports Imports
consumption consumption consumption Capital Formation1/
Weight (2004) 100.0 55.3 18.8 74.1 21.3 18.0 -13.3
2000 4.4 3.8 1.3 3.2 10.0 10.6 11.6
2001 1.3 0.5 1.0 0.6 -1.1 11.2 1.2
2002 1.9 -0.4 1.4 0.1 -4.3 7.9 -12.3
2003 0.5 -1.5 1.3 -0.8 -4.5 9.0 -1.7
Contribution (p.p.) -0.8 0.3 -0.6 -0.9 1.5 0.2
2004 1st. half-year 5.0 3.0 0.8 2.5 7.5 18.9 13.4
Contribution (p.p.) 1.7 0.2 1.8 1.6 3.4 -1.8
2004 Through 3rd. quarter 5.3 4.0 0.6 3.1 11.5 18.7 14.9
Contribution (p.p.) 2.2 0.1 2.3 2.4 3.4 -2.0
2004 4.9 4.1 0.1 3.1 6.3 18.0 14.3
Contribution (p.p.) 2.2 0.0 2.3 1.3 3.2 -1.9
2005 (forecast) 3.4 2.6 1.6 2.3 2.3 14.8 11.5
Contribution (p.p.) 1.4 0.3 1.7 0.5 2.7 -1.5
Source: IBGE
1/ Includes inventories.

������������������� ���������������
external sector in GDP will continue. Estimatesregarding the evolution of government consumptionin the year remained unchanged.
As far as supply is concerned, the impact of adverseweather conditions on the grain harvest resulted in areduction in estimates of crops/livestock growth. Theimpact of the reduced harvest on the performanceof the sector is expected to be relatively small, dueto the surge in livestock production, which hasregistered record export levels, and to favorableestimates for specific important crops, such as cottonand manioc. However, there is no denying that theharvest reduction will produce impacts in other areas,such as lower demand of inputs for the sector.
In industry, growth forecasts for the manufacturingand construction industries were revised downward,due to the results of the first four months of the year.Despite the downward revision, annual growth inmanufacturing is estimated at 3.7%, as a result ofincreased exports and recovery in domestic demandin the second half of the year. Furthermore, newPetrobrás drilling platforms went into operation in thesecond quarter, raising output estimates for the miningsector in the current year.
Estimates for the service sector were also altered asa result of reduced growth in industry and agriculture(as well as incorporation of first quarter results), withclear impacts on commerce, transportation, financialinstitutions and other services.
Another factor responsible for the downward revisionin estimates for the service sector was theaccentuated IBGE´s revision of growth for thecommunications sub-sector in 2004, from +2% to -1.4%. Such a change impacted the product of thesector in the first quarter of 2005 and the outlook forthe year.
Table 2 – GDP 2005
Weight % accumulated growth
2004 2004 2005
1st Q Year estimate
Crop and livestock 10.1 5.3 4.2 4.0
Industry 38.9 6.2 3.1 3.7
Mining 4.2 -0.7 3.7 8.3
Manufacturing 24.0 7.7 3.6 3.3
Construction 7.3 5.7 0.6 1.7
Public utilities 3.4 4.6 2.9 4.3
Services 55.7 3.3 2.0 2.7
Commerce 7.8 7.9 4.2 4.0
Transportation 2.2 4.9 4.1 3.9
Communications 3.1 -1.4 -3.2 0.0
Financial institutions 6.6 4.2 2.8 3.6
Other services 10.5 5.6 2.0 3.6
Rents 9.4 1.8 3.7 3.1
Public administration 16.1 0.9 0.2 1.2
Taxes on products 11.7 8.2 4.7 4.6
GDP at market prices 100.0 4.9 2.9 3.4
Quarter/previous quarter
(seasonally adjusted data) 0.3 ...
Source: IBGE

�������������������������� ��������
ANFAVEA data corroborate the behavior of investment inthe farm sector. More specifically, output of farm machinerydropped 12.4% in the year through May, when compared tothe same period of 2004. This result was primarily causedby reductions of 62.9% and 5.9% in the production ofharvesters and farm tractors, respectively. On the other hand,production of buses and trucks rose by 31.9% and 16.4%,respectively, powered mainly by exports, using the samecomparison basis.
Despite recent investment results, FGV surveys point to aseries of factors that suggest an upturn in the coming months,such as rising intentions to expand installed capacityutilization, coupled with the downward trend of Braziliancountry risk and expectations of a monetary policy easing.
The FGV February survey that analyzed investmentsprogrammed by companies for the 2005-2007 period, revealsa rather positive outlook for production capacity expansion.Average growth in capacity for 2005 is projected at 8%,and 19% for 2005-2007. These figures are similar to thosefound in the February 2004 survey. The survey also showsthat, among the factors that have inhibited investment growthin 2005, those most commonly cited by companies were thetax burden, with 46% of the respondents, and uncertaintiesregarding demand, with 33%, the highest level under thisquestion since 2000.
��% & ����'
The leveling off of economic activity since the end of 2004has been accompanied by changes in the composition ofdemand, with the external sector assuming a larger role tothe detriment of the domestic market. Externally, worldeconomic growth has driven the export sector, offsettingpossible impacts of recent exchange rate appreciation.Domestically, consumption has been stimulated by self-propagating forces – namely, increased jobs and higher realearnings. As a result, consumer spending tends to remainhigh, despite the slight drop posted in the first quarter of thisyear, following six consecutive quarters of positive growth.On the other hand, investments have trended downwardsince the end of 2004, partly reflecting the loss of farmincome, but also as a reaction to the recent evolution ofdemand in response to recent monetary tightening. Businessconfidence levels, the country risk, as well as the resultsrevealed by surveys within the industrial business communitypoint to an upturn in investments as soon as uncertaintiessurrounding the evolution of internal demand dissipate.
Table 1.14 – Gross Domestic Product
Quarter/previous quarter
Seasonally adjusted
%
2004 2005
I II III IV I
GDP at market prices 1.8 1.1 1.3 0.4 0.3
Crop and livestock 2.4 0.5 -1.6 1.8 2.6
Industry 1.6 1.0 2.6 0.4 -1.0
Services 1.2 1.0 0.9 0.4 -0.2
Source: IBGE
Tabela 1.15 – Investment indicators
% change
2005
Jan Feb Mar Apr
In the month1/
Capital goods
Production -1.0 -3.3 3.9 -2.9
Imports 1.7 -7.1 0.7 3.0
Exports -6.6 -9.4 0.7 6.2
Inputs for the building industry -0.2 -1.5 0.2 -1.1
In the year
Capital goods
Absorption2/6.2 2.8 2.5 2.1
Production 6.8 3.8 2.6 2.8
Imports 34.7 24.4 25.1 21.3
Exports 68.9 55.5 42.7 43.0
Inputs for the building industry 2.8 1.6 0.8 1.4
BNDES financing 69.5 20.0 11.5 -0.6
Source: IBGE, Funcex and BNDES
1/ Seasonally adjusted data.
2/ Production + imports - exports.
- 8
- 4
0
4
8
I2003
II III IV I2004
II III IV I2005
Figure 1.24 – Gross fixed capital formationQuarter/previous quarterseasonally adjusted data%
Source: IBGE

������������������� ���������������
Table 1.16 – Production of capital goods
% change in the year
2005
Jan Feb Mar Apr
Capital goods 6.8 3.8 2.6 2.8
Industrial 1.6 5.9 5.1 5.9
Serial 0.2 5.0 4.5 5.0
Nonserial 10.5 11.0 8.6 12.0
Agricultural -19.7 -26.7 -29.9 -31.7
Farm parts -70.0 -68.3 -68.4 -68.0
Building 33.8 37.6 33.2 30.3
Electric energy 19.0 17.3 13.7 14.0
Transportation 19.3 13.6 11.6 11.1
Mixed 4.2 -0.9 -1.5 -0.3
Source: IBGE
90
100
110
120
130
Apr2003
Jul Oct Jan2004
Apr Jul Oct Jan2005
Apr
88
93
98
103
Capital goods production Construction inputs
Source: IBGE
Figure 1.25 – Capital goods production and construction inputsSeasonally adjusted data2002=100
Capital goods productionConstruction inputs
Table 1.17 – Production of vehicles
% change
2005
Jan Feb Mar Apr May
In the month1/
Farm vehicles 4.9 -8.2 1.3 -5.8 0.8
Busses -3.7 -8.5 16.0 -1.0 0.2
Trucks -6.7 -6.6 9.2 2.1 -2.5
Quarter/previous quarter1/
Farm vehicles -5.6 -7.3 -6.0 -8.2 -6.4
Busses 19.4 4.4 -1.3 -2.7 7.2
Trucks 2.8 -0.6 -3.2 -3.1 2.3
In the year
Farm vehicles 2.9 -7.5 -10.5 -12.1 -12.4
Busses 65.0 43.7 37.1 34.4 31.9
Trucks 33.3 23.2 19.2 18.4 16.4
Source: Anfavea
1/ Seasonally adjusted data.

�������������������������� ��������
�������
Inflation, and particularly consumer price inflation, wasrelatively high in the first five months of 2005. Though inflationindices have been sharply impacted by seasonal factors andincreases in regulated prices, more widespread disseminationof price increases and persistently high core inflation indicatethat demand pressures were also among the factors thatcontributed to the stickiness of inflation. Nevertheless,inflation slowed in May and the outlook for June suggeststhat the pressures noted over the first half of 2005 havebeen overcome.
��� ��������� ����� ��
After peaking in March, general price indices declined inApril and May. The General Price Index (IGP-DI), calculatedby the FGV, posted a 0.51% increase in April and a 0.25%reduction in May, mostly reflecting the results of thewholesale price index (IPA). The IPA rose a cumulative0.48% in the March–May period, compared to 0.95% in thethree months through February. This result was caused bya 0.88% reduction in agricultural price inflation, comparedto a 1.41% increase in the December–February period,easily offsetting the rise in industrial price inflation from0.79% to 0.93%, in the same period.
The recent trajectory of agricultural prices was mainly dueto an easing of vegetable price inflation and drops in theprices of rice (in the harvest stage) and meats in general.Industrial wholesale prices have remained relatively stablein the period, with the sole exception of April. The majorpressures were generated by increases in fuel prices,principally fuel oils and kerosene, plastics, pharmaceuticalsand minerals. Meanwhile, exchange rate appreciation helpedto ease inflationary pressures in the chemical andmetallurgical industries and is expected to impact the resultsof the wholesale price index going forward.
-4
-3
-2
-1
0
1
2
3
4
May2004
Jul Sep Nov Jan2005
Mar May
Agricultural IndustrialSource: FGV
Figure 2.1 – IPA-10, IPA-M and IPA-DI – Agricultural and industrial pricesMonthly % change
Table 2.1 – General price indices
Monthly % change
2004 2005
Dec Jan Feb Mar Apr May
IGP-DI 0.52 0.33 0.40 0.99 0.51 -0.25
IPA 0.48 0.08 0.39 1.14 0.33 -0.98
IPC-Br 0.63 0.85 0.43 0.70 0.88 0.79
INCC 0.51 0.76 0.44 0.67 0.72 2.09
Source: FGV

������������������� ���������������
The Consumer Price Index – Brazil (IPC-Br) exertedupward pressure on general price indices, rising 2.39% inthe three-month period through May versus 1.92% in theDecember-February period. Just as occurred in the otherconsumer price indices, this result was a consequence ofupward price movement in food, apparel, transportation andhealth and personal care.
��� ���������������� ������
Broad Consumer Price Index (IPCA) inflation has been highsince October 2004, rising 0.61% in March; 0.87% in April;and 0.49% in May. Inflation in the March–May periodaccumulated 1.98%, compared to 2.04% in the Decemberthrough February period. The major factor underlying thisresult was a 2.7% increase in regulated prices, whichaccounts for approximately 30% of the index. In the yearthrough May, the IPCA rose 3.18%, compared to 2.75% inthe same period of last year.
The IPCA diffusion index, defined as the proportion of itemsregistering price increases in the monthly result, remainedrelatively stable from March to May, at an average of 65.6%in the period, versus 68.6% in the previous three-monthperiod. Though still high, this index has trended downwardsin recent months.
As far as market prices are concerned, the items thatregistered the strongest price growth in recent months wereapparel, medicines and milk and dairy products, accountingfor 0.49 p.p. of the segment’s overall contribution of 1.19p.p. to IPCA growth in the March–May period.
Though somewhat attenuated by the strong rise in commodityprices, particularly metals and oil derivatives, exchange rateappreciation has influenced the recent IPCA performance.In the first five months of the year, this group of productsposted cumulative price increases of 2.01%, compared to3.18% for the IPCA.
There appear to be several positive factors developing forthe inflation outlook – including the dissipation of seasonaleffects on apparel, medicine and perishable food prices,as well as steady downward movement in the prices ofprimary products, and a potential drop in medicine pricesas a result of reductions in the taxes on these goods. Theseeffects could, to some extent, offset the impact of hikes inelectricity rates in several regions, particularly São Paulo,and in fixed telephone rates across the country, considering
Figure 2.3 – IPCA – Food12-month % change
0
4
8
12
16
20
24
28
Sep2003
Nov Jan2004
Mar May Jul Sep Nov Jan2005
Mar May
-20
-15
-10
-5
0
5
10
15
20
Total food Industrialized food
Semi industrialized food Perishable food
Source: IBGE
Perishable
Figure 2.2 – IPCAMonthly % change
-1
0
1
2
May2004
Jun Jul Aug Sep Oct Nov Dec Jan2005
Feb Mar Apr May
IPCA Regulated prices Market prices
Source: IBGE
Figure 2.4 – IPCA% of items with increaseQuarterly moving average%
65.6
68.6
63.7
64.1
56
60
64
68
72
Sep2003
Nov Jan2004
Mar May Jul Sep Nov Jan2005
Mar May
Source: IBGE
58.0

�������������������������� ��������
that these two items are expected to be the majordeterminants of increases in the indices in the comingmonths, particularly in July.
��� ����������� ��
In 2005 through May, regulated prices increased 3.38%,accounting for approximately 31%, or 1 p.p. of the 3.18%IPCA increase in the year.
In the period from March through May, IPCA market andregulated price inflation were 1.68% and 2.70%,respectively, compared to 2.02% and 2.1% in the previousthree-month period. Regulated prices accounted for 0.8 p.p.of the 1.98% increase registered by the IPCA in the Marchthrough May period.
Several items with relatively significant weights in the indexregistered price increases, particularly urban bus fares(+8.6%), and water and sewage rates (+4.8%), both ofwhich are defined by municipal governments. Water andsewage rates increased 28.87% in Belo Horizonte; 5.73%in Goiânia; and 11.43% in Porto Alegre. Urban bus faresrose 17.64% in São Paulo; 12.9% in Porto Alegre; and 12.5%in Rio de Janeiro.
Residential electricity rates rose by 4.01%, as a result ofincreases of 21.21% in Fortaleza; 20.16% in Recife; 20.51%in Salvador; 18.48% in Belo Horizonte; and 5.62% in PortoAlegre. A court order later rolled back the increase authorizedby the Brazilian Electricity Regulatory Agency (Aneel) inFortaleza to a ceiling of 11.3%. Part of the increase in PortoAlegre was due to an increase in the Tax on the Circulationof Goods and Services (ICMS). A similar measure was latertaken by the government of the State of Goiás and will beregistered in the state’s electricity costs as of June.
��� ������������
IPCA core inflation, measured by excluding household foodand regulated prices, stood at 0.41% in March, 0.71% inApril and 0.57% in May, a cumulative increase of 1.7% inthe tree-month period. The items of greatest importance tocore inflation in that period were the 5.02% increase inmedicine prices and the 3% rise in apparel prices. Cumulativegrowth in the twelve-month period reached 7.15%.
Figure 2.5 – Price evolutionMetals1995=100
80
90
100
110
120
130
140
Aug2003
Nov Feb2004
May Aug Nov Feb2005
May
25
30
35
40
45
50
55
Metals Brent oil
Source: Commodities Research Bureau
Brent oilUS$/barrel
Figure 2.6 – IPCA12 month % change
4
8
12
16
20
24
May2003
Jul Sep Nov Jan2004
Mar May Jul Sep Nov Jan2005
Mar May
IPCA Market prices Regulated prices
Source: IBGE
Table 2.2 – IPCA
Monthly % change
Weights 2005
Mar Apr May Year In 12 months
IPCA 100.00 0.61 0.87 0.49 3.18 8.05
Regulated prices 29.62 1.29 1.14 0.25 3.38 12.01
Farm products 16.05 0.60 0.98 0.61 3.96 6.71
Services 20.44 0.51 0.38 0.28 3.51 6.52
Others 20.29 0.28 0.90 0.68 2.73 7.46
Prices linked to
exchange rate 13.59 -0.20 0.84 0.90 2.01 4.63
Exchange rate ... 4.12 -4.64 -4.90 -9.76 -20.89
Source: IBGE
Table 2.3 – IPCA
Monthly % change
Weights 2005
Jan Feb Mar Apr May Year
IPCA 100.00 0.58 0.59 0.61 0.87 0.49 3.18
Market prices 70.30 0.61 0.77 0.33 0.76 0.59 3.09
Regulated prices 29.70 0.51 0.16 1.29 1.14 0.25 3.38
Main items
Electricity 4.71 1.28 0.27 -0.03 2.22 1.78 5.62
Water and sewage 1.89 0.41 1.67 4.42 0.12 0.24 6.98
Urban bus 5.18 -0.10 -0.37 5.02 2.57 0.82 8.09
Gasoline 4.22 0.06 -0.79 0.71 0.42 -0.64 -0.25
Fuel alcohol 1.10 -1.23 -1.44 0.57 0.51 -5.42 -6.93
Health plans 2.55 0.90 0.92 0.94 0.92 0.92 4.69
Source: IBGE

������������������� ���������������
Smoothed trimmed-means IPCA core inflation rose 0.62%in March, 0.70% in April and 0.65% in May. This calculationexcludes items with monthly growth above the 80thpercentile distribution level or below the 20th percentiledistribution level. Goods and services with annualreadjustments are smoothed, that is, price increases areredistributed in twelve months. In the twelve-month periodthrough May, this core increased 7.61%. The non-smoothedtrimmed-means core expanded 0.49% in March, 0.70% inApril and 0.46% in May, closing the twelve-month periodwith a cumulative increase of 6.62%.
IPC-Br core inflation calculated by the FGV using the smoothedtrimmed-means method recorded growth of 0.49% in March,0.65% in April and 0.73% in May. In the last twelve months,core inflation registered a cumulative increase of 5.98%.
��� ��� ������ �������
Market participants’ inflation expectations for the 2005 IPCArose from a median of 5.9% in end-March to 6.2% in mid-June, while expectations for 2006 remained stable at 5%.The recent evolution of median IPCA expectations for 2005has been strongly influenced by the revision of very short-term projections, especially for the month of May, as a resultof pressures stemming from increases in agricultural pricesand specific regulated prices. It is important to note thatIPCA expectations for the coming twelve months droppedto 5.1% in mid-June, the lowest level since August 2002.
With regard to market expectations for the general priceindices, the quarter was marked by a sharp decline inforecasts for 2005, as the median projection for the GeneralPrice Index – Market (IGP-M) dropped from 6.5% to 5.6%,the lowest level since May 2004. For the most part, thisdecline was caused by forecasts of an IPA below 5%, afigure that had been revised downward as a result of acontraction in May and preliminary figures for the month ofJune. For 2006, median IGP-M projections remain at 5.5%.
The behavior of inflation expectations in the second quarterwere driven by revisions to market expectations for theexchange rate and monetary policy trajectory, as well as byprojections of wholesale price indices, on the one hand, andincreases in regulated prices in 2005, on the other. Onceagain, the expected 2005 exchange rate trajectory wasrevised, to R$/US$2.58 as of mid-June from R$/US$2.74 inMarch. At the same time, expectations for 2006 medianexchange rates were cut to R$/US$2.77 from R$/US$2.90.
Table 2.4 – Consumer prices and core inflation
Monthly % change
2005
Jan Feb Mar Apr May
IPCA 0.58 0.59 0.61 0.87 0.49
Exclusion 0.56 0.93 0.41 0.71 0.57
Trimmed means
Smoothed 0.66 0.60 0.62 0.70 0.65
Non smoothed 0.59 0.43 0.49 0.70 0.46
IPC-Br 0.85 0.43 0.70 0.88 0.79
Core IPC-Br 0.61 0.36 0.49 0.65 0.73
Source: Bacen and FGV
Figure 2.8 – Daily evolution of market expectations for inflation (IPCA) (median)
4
5
6
7
8
2.162004
3.31 5.14 6.28 8.9 9.21 11.5 12.20 2.22005
3.18 5.3 6.15
%
2004 2005 2006
Figure 2.9 – Daily evolution of market expectations for inflation (IGP-M) (median)
3
5
7
9
11
13
2.162004
3.31 5.14 6.28 8.9 9.21 11.5 12.20 2.22005
3.18 5.3 6.15
%
2004 2005 2006
Figure 2.7 – Core inflation12-month % change
5
7
9
11
13
Feb2003
May Aug Nov Feb2004
May Aug Nov Feb2005
May
IPCA – ExclusionIPCA – Smoothed trimmed meansCore IPC-Br – Smoothed trimmed means
Source: Bacen and FGV

�������������������������� ��������
During the quarter, the market also revised its medium-termmonetary policy outlook, raising expectations for the Selicrate target (average in period) for 2005 from 18.8% p.a. to19.2% p.a. and increasing the December target from 17.5%p.a. to 18% p.a. This scenario is based on expectations ofSelic rate stability from June through August, followed by aSeptember cut of 25 bps and three successive reductions of50 bps in the final quarter of the year. For 2006, the medianSelic rate projection rose from 15.9% p.a. to 16.5%p.a.,while the projected end-of-year rate rose from 15% p.a. to15.5% p.a.
��! "�����#
The relatively high level of inflation since last Octoberresulted mainly from a series of on-off factors: increases inmedicine and specific regulated prices, education outlaysand the impact of seasonal factors on food products. At thesame time, economic activity remained strong, albeit withonly modest growth at the margin. This scenario indicatedthat demand conditions tended to drive dissemination of priceincreases and profit margin increases by companies.
It is important to highlight the fact that greater disseminationof price increases has clearly been hampered by the currentrestrictive monetary policy. As a matter of fact, once theimpacts registered in recent months had been overcome,the measures adopted were fundamental to establishing theconditions required for price indices to converge to theinflation target path defined by the National MonetaryCouncil, as evident in the current inflation expectations andactual inflation results.
Table 2.5 – Summary of market expectations
2005 2006 2005 2006 2005 2006
IPCA 5.70 5.00 5.88 5.00 6.21 5.00
IGP-M 6.58 5.50 6.47 5.50 5.55 5.50
IPA 6.89 5.93 6.74 5.93 4.44 5.93
Regulated Prices 7.09 6.00 7.12 5.80 7.60 6.00
Selic (end-of-period) 16.00 14.38 17.50 15.00 18.00 15.50
Selic (average) 17.10 14.70 18.83 15.92 19.15 16.50
Exchange rate (end-of-period) 2.95 3.13 2.80 2.95 2.66 2.80
Exchange rate (average) 2.88 3.06 2.74 2.90 2.58 2.77
GDP growth 3.50 4.00 3.68 3.70 3.12 3.50
12.30.2004 6.15.20053.31.2005

�������������������������� ��������
�������������� �������������������
��� �����
Financial system credit continued to expand from Marchthrough May, due mainly to strong growth in non-earmarkedcredit and particularly payroll-deducted loans to households.Reflecting both the relative deceleration in the pace ofeconomic activity and current interest rate levels, theexpansion of business financing was considerably less robustin the period.
In May, overall financial system credit stood at R$518.3billion, an increase of 4% in the three-month period and18.4% over twelve months. Consequently, the ratio of creditto GDP rose to 27.2%, from 26.6% last February and 25.5%in May 2004.
Loans granted by private financial institutions totaled R$314.8billion, up 4.8% compared to February, accounting for 60.7%of the total credit stock. Growth was mainly due to a rise inconsumer lending, and to a lesser degree corporate lending.Loans granted by public financial institutions totaled R$203.5billion, an increase of 2.8% in the three-month period. Aswas the case with private institutions, the upturn in consumerlending was the main driver.
Credit to the private sector, including both non-earmarkedand earmarked funds, totaled R$498.8 billion in May, forgrowth of 4.1% over February. Aside from the strong 10.7%growth in operations with individuals, which totaled R$147.3billion, this result also reflected a 1.6% expansion in industrialfinancing, totaling R$128.6 billion, concentrated in theautomotive and energy generation sectors. Financing to theservices sector rose 0.5% to a total of R$82 billion,concentrated mainly in operations with credit cardadministration companies, communications and energydistribution companies. Loans to commerce increased 1.9%to R$57.8 billion, with a strong upturn in operations with theretail sector.
Table 3.1 – Credit operations
R$ billion
2005 % growth
Feb Mar Abr Mai 3 12
months months
Total 498.2 506.7 515.9 518.3 4.0 18.4
Non-earmarked 284.9 291.1 299.5 302.4 6.1 21.8
Corporations 163.6 165.5 169.6 167.9 2.6 12.0
With external funding 48.5 49.5 49.6 48.1 -0.9 -16.4
Individuals 121.3 125.5 129.8 134.4 10.8 36.8
Earmarked 179.3 180.5 180.5 179.7 0.3 11.5
Housing 24.5 24.7 24.9 25.0 2.0 6.1
Rural 55.2 55.8 56.7 56.7 2.6 21.2
BNDES 95.9 96.4 95.4 94.3 -1.7 7.4
Others 3.6 3.6 3.6 3.8 3.7 23.8
Leasing 14.9 15.6 16.3 16.7 12.5 57.9
Public sector 19.1 19.6 19.5 19.5 1.6 8.8
% participation:
Total/ GDP 26.6 26.8 27.2 27.2
Non-earmarked/GDP 15.2 15.4 15.8 15.9
Earmarked/GDP 9.6 9.6 9.5 9.4

������������������� ���������������
Operations with the public sector reached R$19.5 billion, 1.6%more than in February. Growth was driven by a 1.7% increasein credits to sub-national governments, with a balance ofR$14.4 billion reflecting increased credit to state-ownedelectricity companies, and by a 1.3% increase in financing tothe federal government, with a total of R$5 billion.
The leasing portfolio totaled R$16.7 billion in May, withgrowth of 12.5% compared to February. Operations byindividuals rose from 28.8% in February to 29.6% of thetotal, concentrated mainly in auto leasing contracts.
��������������
Earmarked credit totaled R$179.7 billion in May, with growthof 0.3% over February. This result was driven by a 1.7%decline in financing provided by the National Bank ofEconomic and Social Development (BNDES), whichregistered a balance of R$94.3 billion, and by the 2.6%expansion in operations to the rural sector.
BNDES disbursements totaled R$15.1 billion in the first fivemonths of the year, for growth of 8.5% compared to thesame period of 2004. A segment-by-segment analysis showsthat corporate financing totaled R$7.5 billion, for growth of23.4%, with a sharp increase in operations with the airlineindustry. Micro-, small- and medium-sized enterprisesabsorbed 31% of total disbursements, reflecting growth of7.5%. The bulk of these resources was channeled tocompanies operating in the infrastructure sector. Credit tothe commerce and services sector totaled R$5.9 billion, whilethose to the agricultural sector came to R$1.7 billion, withrespective changes of 9.8% and -30.2%.
Credit applications sent to BNDES, used as an indicator offuture investment, totaled R$35.1 billion from January throughMay, for growth of 2.1% compared to the same period oflast year. Applications by the industrial sector grew 19.3%,mainly driven by the food and beverage, and paper and pulpsectors. At the same time, applications by the commerceand services sector dropped 7.5%, basically due to reduceddemand from the construction industry and a falloff of 47.4%in applications by the agricultural sector.
Total rural credit reached R$56.7 billion. The highlight was farminvestment operations, mainly based on government programs.The participation of this modality in total rural financingoperations reached 52.7%, while current expenditure and salestransactions accounted for 43.2% and 4.1%, respectively.
Table 3.2 – BNDES disbursements
R$ million
Jan-May % growth
2004 2005
Total 13 912 15 101 8.5
Industry 6 065 7 486 23.4
Other transportation equipment1/ 1 402 2 718 93.9
Motor vehicles 1 418 920 - 35.1
Food and drink products 981 656 - 33.1
Cellulose and paper 323 473 46.4
Metallurgy 372 653 75.5
Machines and equipment 402 607 51.0
Commerce/Services 5 340 5 865 9.8
Electricity, gas and hot water 2 342 1 623 - 30.7
Overland transport 1 173 2 339 99.4
Construction 509 506 - 0.6
Vehicle dealer ship and reparation 493 265 - 46.2
Crop and livestock 2 508 1 750 - 30.2
Source: BNDES
1/ Includes aircraft industry.
Figure 3.1 – Rural and housing creditR$ billion
20
25
30
35
40
45
50
55
60
May2003
Aug Nov Feb2004
May Aug Nov Feb2005
May
Rural Housing

�������������������������� ��������
Agricultural sector debts were rescheduled due to the severedrought in southern Brazil. Finame Farm operations andcurrent expenditure financing for the 2004 wheat harvestwere extended to the June–August period. Aside from this,a term of one to two years was granted for payment ofcontracts not covered by the Farm Activity GuaranteeProgram (Proagro), involving products from the 2004/2005harvest that had suffered losses of more than 30% due tothe drought.
Financing to the housing sector, including both non-earmarked and earmarked resources, totaled R$26.5 billionin May, an increase of 1.9% over February. Resourcesdrawn from savings accounts accounted for the largest shareof total disbursements and reached R$1.1 billion in the three-month period ended in April, for growth of 6.2% over theprevious three-month period. The CMN recently altered therules covering requirements in housing financing. Financialinstitutions will not have to comply with the minimuminvestment requirement of 65% of their savings accountbalances, provided that new financing increases 30% and45% in the first and second quarters of 2005, respectively,compared to the same periods of the previous year.
� ����������������
In May, non-earmarked credit operations totaled R$302.4billion, for growth of 6.1% compared to February and 21.8%over twelve months. These loans represented 58.3% of totalfinancial system credit, compared to 57.2% in February.
Corporate credit expanded 2.6% in the period, to R$167.9billion. For the most part, this performance was driven bygrowth of 4.1% in domestically funded operations,particularly working capital operations. The balance offoreign currency denominated loans was impacted byexchange rate appreciation in the period and totaled R$48.1billion, reflecting a drop of 0.9% in comparison to February.
Credit to individuals totaled R$134.4 billion in May, 10.8%above February. To a great extent, this performance wasdriven by growth in payroll-deducted loans, particularly thosewith Social Security (INSS) retirees and pensioners.According to data provided by thirteen financial institutionswith significant participation in these operations, the balanceof payroll-deducted loans totaled R$17.8 billion in May, up27.2% in the period (see box "Evolution of Payroll-DeductedLoans"). Financing for acquisition of goods continued toincrease, rising 6.8% in the three-month period.
-30
-20
-10
0
10
20
30
40
May2003
Aug Nov Feb2004
May Aug Nov Feb2005
May
TotalDomestic fundings – CorporatesExternal funding – CorporatesIndividuals
Figure 3.2 – Non-earmarked credit% growth in 12 months
25
30
35
40
45
50
55
60
May2003
Aug Nov Feb2004
May Aug Nov Feb2005
May
Average Corporate
Figure 3.3 – Interest rates on non-earmarked credit% p.y.

������������������� ���������������
Average interest rates on non-earmarked loans ended Mayat 49.4% p.a., 1.9 p.p. above February. This result reflectedrising costs in major credit modalities, as well as increasedparticipation of operations with individuals in financialinstitution credit portfolios.
In the consumer segment, the average cost of loans (the bulkof which are contracted with fixed interest rates) was 65.7%p.a. in May, an increase of 1.7 p.p. in the three-month period.Mention should be made of the rise in interest rates chargedon personal credit operations (1.9 p.p.), and vehicle acquisitions(1.2 p.p.), as well as the 5.9 p.p. drop in the interest rate onfinancing for acquisitions of goods, except vehicles. This declinewas a direct result of agreements signed between financialinstitutions and department store chains.
The average interest rate on corporate credit was 33.7%p.a. in May, an increase of 1.3 p.p. versus February. In thethree-month period, increases were registered in themodalities of guaranteed overdraft accounts, 2.9 p.p., andworking capital, 1.6 p.p.
The banking spread in non-earmarked credit operations rose1.3 p.p. in the three-month period ended in May, closing at30 p.p. This rise reflected a change in credit portfoliocomposition, with a relative increase in loans to individuals.
Considering arrears of more than fifteen days, delinquenciesin non-earmarked credit operations stood at 7.4% in May, areduction of 0.1 p.p. compared to February. The level ofcorporate loans in arrears was 3.4%, while consumer loansin arrears reached 12.5%. These figures represent a drop of0.3 p.p. and an increase of 0.1 p.p. in the period, respectively.
�� �� ���������������
At the end of May, the money supply (M1) measured inaverage daily balances totaled R$116.3 billion. The 13.4%increase in the last twelve months reflected growth of 15.9%in the average balances of currency held by the public and11.9% in demand deposits. Deflated by the IPCA andseasonally adjusted, M1 grew 2.1% in the three-month period,compatible with the level of economic activity and the growthin credit operations.
The average monetary base totaled R$80.4 billion in May,up 17.2% in twelve months, reflecting increases of 16.7%in the average balance of currency issued and 18.3% inbanking reserves.
60
65
70
75
80
85
May2003
Aug Nov Feb2004
May Aug Nov Feb2005
May
Figure 3.4 – Interest rates on fixed rate credit – Individuals% p.y.
10
15
20
25
30
35
May2003
Aug Nov Feb2004
May Aug Nov Feb2005
May
40
45
50
55
60
65
Average Corporate Individuals
p.p. – Individuals
Figure 3.5 – Average spread on non-earmarked creditp.p. – Average and corporate
40
50
60
70
80
90
100
110
120
130
May2002
Aug Nov Feb2003
May Aug Nov Feb2004
May Aug Nov Feb2005
May
R$ billion
Monetary base M1
Figure 3.7 – Monetary base and M1 – Average daily balances
Figure 3.6 – Credit default rates1/
% – Average and corporate
3
4
5
6
7
8
9
May2003
Aug Nov Feb2004
May Aug Nov Feb2005
May
11
12
13
14
15
16
17
Average Corporate Individuals
1/ Non-earmarked credit in arrears of more than 15 days.
% – Individuals

�������������������������� ��������
������� ����������������������� �
Since 2004, non-earmarked credit operations withindividuals have increased sharply, primarily as aresult of greater access to payroll-deducted loans.These operations are part of a strategy aimed atbroadening the access of the population to credit atmore favorable interest rates and tenors, and haveplayed a major role in reducing banking spreads andimproving household debt profiles.
Development of this type of credit, previouslyoffered by very few financial institutionsexclusively to civil servants, became possible as aresult of Law 10,820, dated 12.17.2003. This lawcreated the legal framework for these operationsand extended them to all workers covered byConsolidated Labor Legislation (CLT), as well asto Social Security retirees and pensioners.
At the end of the first half of 2004, total payroll-deducted loans granted by banks and financecompanies came to R$8.7 billion, correspondingto an increase of 34% over December 2003,according to a BCB sampling of thirteen selectedinstitutions. At that time, 87% of loans were tocivil servants.
Given the growing attractiveness of payroll-deducted loans to financial institutions, since end-2004, large banks have created partnerships withsmaller financial institutions specialized in thismarket. These partnerships provide the fundingneeded by smaller institutions to leverage their creditoperations, at the same time in which the largerinstitutions are able to increase their participationin the market, taking advantage of the specializationand structures of smaller institutions.
Table 1 – Payroll-deducted loans
R$ billion1/
2005 % growth
Feb Mar Apr May 3 12
months months
Total 14.0 15.5 16.6 17.8 27.2 120.1
Civil servants2/ 12.0 13.3 14.2 15.3 28.2 114.8
Private-sector workers 2.1 2.2 2.3 2.5 21.0 158.9
Interest rates % p.y.
Payroll-deducted loans1/ 37.4 37.1 36.5 35.6 -1.9 -2.9
Other credit operations 92.4 91.5 93.9 96.8 4.4 15.6
Personal credit average 75.3 74.4 75.0 77.2 1.9 4.5
1/ Sampling of thirteen financial institutions operating with personal credit.
2/ Includes social security retirees and pensioners.

������������������� ���������������
17.8
0
5
10
15
20
Jan2004
Mar May Jul Sep Nov Jan2005
Mar May
R$ billion
Figure 1 – Payroll-deducted loans
Source: Sampling of thirteen financial institutions operating with personal credit.
Another factor that has contributed significantlyto growth in these credit operations has been loansto retirees and pensioners. The first loans of thistype were extended to beneficiaries in May 2004and expanded sharply, as an increasingly largernumber of financial institutions began offering thistype of operation.
According to the Social Security Technology andInformation Company (Dataprev), 3.1 million contractswere signed with retirees and pensioners up to May,totaling R$6.8 billion. Operations granted to the incomebracket of up to one minimum monthly wage accountedfor 46.1% of total contracts and a value of R$1.8 billion.The number of INSS beneficiaries able to contractthese loans is approximately 18 million, of whomapproximately 6 million are rural workers. These figuresalone are sufficient to illustrate the growth potential ofthese operations.
An additional factor underlying the growth potentialof payroll-deducted loans is that operations with thecivil servants still play a dominant role, accountingfor 86% of total loans at end-May.
In May, payroll-deducted loans totaled R$ 17.8 billion,for growth of 41.4% in the year and 120% over theprevious twelve months. As a consequence, payroll-deducted loans came to account for 33% of thepersonal loan portfolio and 13% of the total creditstock to individuals, easily surpassing the volume ofthe overdraft accounts.
The growing participation of payroll-deducted loansin personal credit operations has exerted a significantinfluence on interest rates and tenors. The lowerinterest rates charged on this type of loan (averageof 35.6% p.a. in May) has helped reduce the averagecost of personal credit operations from 79.1% p.a. inJanuary 2004 to 77.2% p.a. in May. In much thesame way, the average tenor of personal creditoperations in the same period was lengthened from230 to 290 days.
The evolution of these credit operations and theirutilization in paying off debts has stimulated reductionsin default levels, involving both bank debts as well asothers contracted outside the financial system. Theresult has been sharp improvement in household debt
Table 2 – Payroll-deducted loans to social security retirees
May, 2005
Contracts Volume Average value
Thousand % R$ million % R$
Income bracket (minimum wages)
Up to 1 mw 1 420 46.1 1 829 26.9 1 288
> 1 to 2 mw 490 15.9 853 12.6 1 741
> 2 to 3 mw 357 11.6 901 13.3 2 525
> 3 to 4 mw 289 9.4 945 13.9 3 272
> 4 to 5 mw 263 8.5 1 033 15.2 3 923
> 5 mw 264 8.6 1 237 18.2 4 682
Total 3 084 100.0 6 799 100.0 2 205
Source: Dataprev
3 089
0
500
1 000
1 500
2 000
2 500
3 000
3 500
6.22004
8.3 10.27 12.17 2.172005
4.4 6.2
Figure 2 – Payroll-deducted loans to social security retireesThousands of contracts
Source: Dataprev

�������������������������� �������
30
34
38
42
46
50
Jan2004
Apr Jul Oct Jan2005
Apr
40
50
60
70
80
90
100
Payroll-deducted Other Average
% p.y. – Other / Average
Figure 3 – Personal credit interest rate% p.y. – Payroll-deducted
profiles. Coupled with lower risk of default in payroll-deducted operations, this has made it possible toexpand credit in a framework of sustained growth indomestic demand.

������������������ ���������������
With regard to the sources of primary currency issuance inthe three-month period ended in May, the National Treasurywas contractionary in R$23.2 billion, while external sectoroperations produced an expansionary impact of R$10.6billion. Overall operations with the financial system producedan expansionary impact of R$2.1 billion, due to releases ofreserve requirements on the deposits of the Brazilian Systemof Savings and Loans (SBPE) and additional reservesrequirements on deposits which, taken together, totaledR$1.5 billion. In light of these factors and the R$616 milliongrowth in demand for banking reserves, the monetary liquidityadjustment was effected through redemptions of R$11.1billion in federal public securities.
Evolution of the broader money supply demonstrated theexpansionary impact of financial system loan operations. Inthe M2 concept, which includes M1 plus savings depositsand time deposits, the money supply expanded 2.8% in thethree-month period ended in May and 18.3% over twelvemonths. Performance in the three-month period resultedfrom drops of 1.5% in M1 and 0.5% in the savings accountbalance, offset by 7.6% growth in time deposits. Savingsdeposits posted net outflows of R$3.9 billion, while timedeposits registered a positive inflow of R$8.2 billion.
In the M3 concept, which incorporates mutual funds andfederal public securities used in repo operations into M2,the money supply expanded 3% in the March–May periodand 16.9% in twelve months. Mention should be made ofthe 2.7% growth in mutual funds in the three-month period.M4, which includes M3 and public securities held by non-financial entities, closed May with a balance of R$1.2 trillion,up 3.2% over the three-month period ended in Februaryand 15.3% over twelve months.
����������������������������� ���������� ����� ��
The net result of federal public security auctions wascontractionary by R$6 billion in the March–May period, withplacements of R$95.3 billion and redemptions of R$89.3billion (excluding exchange operations, which totaled R$12.4billion). National Treasury Bills (LTNs) represented 71.3%of total issuance in May (up from 40% in March), accountingfor 60.2% of issuance in the period, versus TreasuryFinancing Bills (LFTs), which accounted for 38.1%.
In the period, US$3.4 billion in reverse FX-swaps wereplaced, contributing to a reduction in the share of domestic
6270788694
102110118126
May Aug Nov Feb2003
May Aug Nov Feb2004
May Aug Nov Feb2005
May
R$ billion
M1 Monetary base
1/ Deflated by IPCA.
Figure 3.8 – M1 and monetary base at May 2005
prices seasonally adjusted1/
0
6
12
18
24
30
May2003
Aug Nov Feb2004
May Aug Nov Feb2005
May
%
M2 M3 M4
Figure 3.9 – Broad money supply12-month growth
0
2
4
6
8
10
12
14
16
Mar2004
May Jul Sep Nov Jan2005
Mar May
R$ billion
Figure 3.10 – Net redemption of exchange rate securities and swaps

�������������������������� ��������
debt indexed to the exchange rate. In the three-month period,exchange rate-linked debt maturities totaled US$668 million,with US$399 million in securities and US$269 million in swaps.
The net financing position in the open market dropped fromR$52.1 billion in February to R$38.5 billion in May, drivenby the R$23.2 billion contractionary impact of the NationalTreasury result (excluding securities), and the R$10.6 billionexpansionary impact of external sector operations.
The BCB took a preventive stance in liquidity control throughLTN exchanges from its own portfolio, redeeming R$15billion in shorter tenor bonds. The BCB also sold R$3.8 billionof LTNs through outright operations.
In May, the BCB interrupted the 28-day repo operationsdue to the reduction in short-term excess liquidity in thebanking reserves market, and instead controlled liquidity viathree-month and short-term operations.
In April, the National Association of Open Market Institutions(Andima) began publishing the Andima Market Index (IMA).This index is composed of four other indices, representingfixed rate securities, Selic-indexed securities, IGP-M-indexedsecurities and IPCA-indexed securities, and includes virtuallyall federal public securities traded in the market. The purposeof this initiative is to provide the market with an alternativebenchmark for evaluating fund manager performance.
������������������������������������� ��
Based on the June 24 survey conducted by BCB, the realone-year ex-ante interest rate came to 11.1% p.a., comparedto 11.6% p.a. at the end of February. The recent reductionin market inflation expectations impacted the nominal yieldcurve, and consequently the real interest rate trajectory,which moved more sharply downward.
In the March to May period, the futures yield curve initiallysteepened, and later reversed course. The rate on 360-dayDI-swap x fixed rate contracts reached 19.4% p.a. in mid-April, compared to 18.5% p.a. in February. The increasewas impacted by the monetary tightening begun by theCopom in September 2004 and by expectations for a changein the monetary policy stance of the U.S. Federal Reserve.At end-May, the same contracts were traded at 18.7% p.a.
0
15
30
45
60
75
90
Sep Nov Jan2004
Mar May Jul Sep Nov Jan2005
Mar May
R$ billion
Figure 3.11 – Net financing position of the federal public securities – Daily average
-10
0
10
20
30
40
50
60
70
Mar2004
May Jul Sep Nov Jan2005
Mar May
R$ billion
< 30 days > 30 days
Figure 3.12 – Central Bank repo operations – Maturity – End of period
7
8
9
10
11
12
Feb2004
Apr Jun Aug Oct Dec Feb2005
Apr Jun
Figure 3.13 – Ex-ante real interest rate – Deflated by 12 month IPCA expectations % p.y.
Figure 3.14 – Selic x swap DI x Pre
16
17
18
19
20
11.42004
12.3 12.31 1.282005
3.1 3.30 4.28 5.27
% p.y.
Selic 30-day swap 360-day swap
Source: BM&F

������������������� ���������������
�������������
The São Paulo Stock Market Index (Ibovespa) closed Mayat 25,207 points, down 10.4% compared to February. At thesame time, international investor expectations were impactedby uncertainties regarding the pace of U.S. interest rateincreases and the consequences of spiraling oil prices forglobal economic activity. External investor operations on theBovespa registered net sales of R$4.1 billion in the three-month period ended in May. The average daily tradingvolume reached R$1.6 billion in the period, up 1.9% comparedto the three-month period ended in February.
In dollar terms, the Ibovespa dropped 3.3% in the period.The Bovespa performance was similar to the result of theDow Jones index, which dropped 2.8% in the same period,while the Nasdaq rose 0.8%.
Primary issuance registered at the Securities and ExchangeCommission (CVM) by companies in the local capitalmarkets through stock, debenture and promissory noteoperations totaled R$14.7 billion from March through May,compared to R$6.6 billion in the previous three-month period.This result reflected debenture issuance, totaling R$13.7billion in the three-month period, and R$18.2 billion in theyear up to May. To a large extent, these operations werecarried out by leasing companies. Given that the debentureissuance pipeline registered at the CVM totaledapproximately R$7 billion at end-May, the outlook for thismarket is considered highly positive.
The Credit Rights Investment Fund (FIDC) market has alsobeen an important source of corporate funding. Accordingto CVM data, registrations of FIDC issues totaled R$2 billionup to May, for growth of 49% over the same period of 2004.Additional requests for new FIDC issues still under analysisat the CVM at the end of May amounted to R$1.3 billion.
� �����������
Savings accounts, time deposits and investment funds,totaled R$963 billion in May, up 2.6% over February.
At the end of May, the net worth of investment funds totaledR$648.8 billion, an increase of 2.4% in comparison toFebruary. In that period, the net worth of financial investmentfunds (FIF) expanded 3.7% to R$584.4 billion, registeringnet inflows of R$6.1 billion. Fixed income funds accountedfor 53.3% of total FIF, followed by mutual funds, 22.5%;
Figure 3.15 – IbovespaPoints
20 000
22 000
24 000
26 000
28 000
30 000
7.62004
8.10 9.15 10.21 11.29 1.32005
2.10 3.17 4.25 5.31
-2 000
-1 000
0
1 000
2 000
3 000
4 000
May2003
Aug Nov Feb2004
May Aug Nov Feb2005
May
Source: Bovespa
Figure 3.16 – Net foreign investment in BovespaR$ million
0
4
8
12
16
20
Stocks Debentures Commercial papers
2002 2003 2004 2005
Source: CVM
Figure 3.18 – Primary issues in capital marketR$ billion – Accumulated through May
Figure 3.17 – Stock exchangesMay 2004 = 100
80
100
120
140
160
180
Feb2004
May Aug Nov Feb2005
May
Ibovespa (in dollar) Dow Jones Nasdaq

�������������������������� ��������
multi-market funds, 20%; short-term funds, 3.7%; andexchange rate funds, 0.4%.
The negative slope of the yield curve was reflected in theconsolidated three-month position of the investment fundportfolio. The share of fixed rate securities rose from 20.5%in February to 23% in May, while the share of floating ratesecurities dropped from 65.2% to 63.5%. The participationof FX-indexed and price-indexed securities dropped by 0.2p.p. and 0.7 p.p., respectively, in the same period. The volumeof private sector securities in the portfolio of these fundsincreased to R$67.6 billion in May, compared to R$60.6billion in February.
In May, the balance of savings accounts came to R$158.1billion. The 0.5% decline in the three-month period reflected anet negative flow of R$3.9 billion. The volume of time depositsincreased 8.7% in the March–May period, closing at R$214billion, posting net inflows of R$8.2 billion in the three-monthperiod and R$12.1 billion in the year. This movement wasgenerated, to some extent, by increased credits.
Investments in stock funds and mutual privatization funds(FMP), involving resources originating in the EmploymentCompensation Fund (FGTS), registered equity of R$47.8billion in May, of which R$41.2 billion were stock funds andR$6.6 billion were FMP. The cumulative 11.3% negativereturns in the three-month period reflected stock marketperformance, with losses of 10.7% in stock funds and 15.7%in FMP.
��� �������������
�������� ��� �� ���������������
The non-financial public sector primary surplus came toR$16.3 billion in April, the best monthly result since the serieswas first published in 1991. The central government posteda surplus of R$14.3 billion, while sub-national governmentsclosed with R$1.8 billion and state-owned enterprises withR$219 million.
The government’s commitment to public debt sustainabilityand compliance with the fiscal objective in the BudgetGuidelines Law (Law 10,934/2004) was clear in the creationof four-month targets for the primary surplus. This was donewith the objective of ensuring compliance with the 2005 targetof a consolidated public sector fiscal surplus equivalent to4.25% of GDP.
500
520
540
560
580
600
May2004
Jul Sep Nov Jan2005
Mar May
140
155
170
185
200
215
FIF CDB Savings deposits
FIF
Figure 3.20 – CDB, FIF and savings depositsR$ billion
CDB, savings deposits
-3
0
3
6
9
May2004
Jun Jul Aug Sep Oct Nov Dec Jan2005
Feb Mar Apr May
R$ billion
Savings deposits Time deposits
Figure 3.22 – Net inflow – Savings deposits and timedeposits
60
65
70
75
May2004
Jun Jul Aug Sep Oct Nov Dec Jan2005
Feb Mar Apr May
% – Selic
0
5
10
15
20
25
Selic Fixed rate
Exchange rate Inflation indexed
% – Inflation indexed, exchange rate and fixed rate
Figure 3.21 – Public securities in investment funds – Portfolio by indexer
0
4
8
12
16
20
Jan Feb Mar Apr May Jun Jul Aug Sep Oct Nov Dec
2005 2004 2003 2002
Source: CVM
Figure 3.19 – Debentures primary issuesR$ billion – Accmulated in the Year
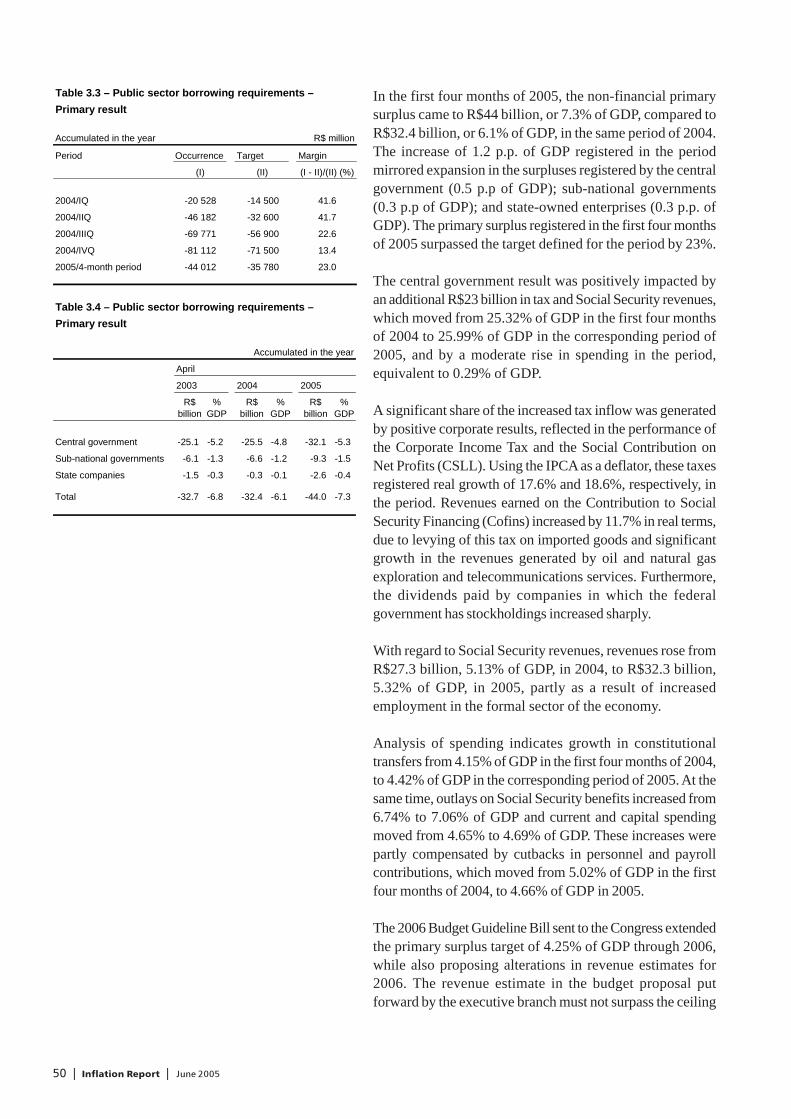
������������������ ���������������
In the first four months of 2005, the non-financial primarysurplus came to R$44 billion, or 7.3% of GDP, compared toR$32.4 billion, or 6.1% of GDP, in the same period of 2004.The increase of 1.2 p.p. of GDP registered in the periodmirrored expansion in the surpluses registered by the centralgovernment (0.5 p.p of GDP); sub-national governments(0.3 p.p of GDP); and state-owned enterprises (0.3 p.p. ofGDP). The primary surplus registered in the first four monthsof 2005 surpassed the target defined for the period by 23%.
The central government result was positively impacted byan additional R$23 billion in tax and Social Security revenues,which moved from 25.32% of GDP in the first four monthsof 2004 to 25.99% of GDP in the corresponding period of2005, and by a moderate rise in spending in the period,equivalent to 0.29% of GDP.
A significant share of the increased tax inflow was generatedby positive corporate results, reflected in the performance ofthe Corporate Income Tax and the Social Contribution onNet Profits (CSLL). Using the IPCA as a deflator, these taxesregistered real growth of 17.6% and 18.6%, respectively, inthe period. Revenues earned on the Contribution to SocialSecurity Financing (Cofins) increased by 11.7% in real terms,due to levying of this tax on imported goods and significantgrowth in the revenues generated by oil and natural gasexploration and telecommunications services. Furthermore,the dividends paid by companies in which the federalgovernment has stockholdings increased sharply.
With regard to Social Security revenues, revenues rose fromR$27.3 billion, 5.13% of GDP, in 2004, to R$32.3 billion,5.32% of GDP, in 2005, partly as a result of increasedemployment in the formal sector of the economy.
Analysis of spending indicates growth in constitutionaltransfers from 4.15% of GDP in the first four months of 2004,to 4.42% of GDP in the corresponding period of 2005. At thesame time, outlays on Social Security benefits increased from6.74% to 7.06% of GDP and current and capital spendingmoved from 4.65% to 4.69% of GDP. These increases werepartly compensated by cutbacks in personnel and payrollcontributions, which moved from 5.02% of GDP in the firstfour months of 2004, to 4.66% of GDP in 2005.
The 2006 Budget Guideline Bill sent to the Congress extendedthe primary surplus target of 4.25% of GDP through 2006,while also proposing alterations in revenue estimates for2006. The revenue estimate in the budget proposal putforward by the executive branch must not surpass the ceiling
Table 3.4 – Public sector borrowing requirements –
Primary result
Accumulated in the year
April
2003 2004 2005
R$ % R$ % R$ %billion GDP billion GDP billion GDP
Central government -25.1 -5.2 -25.5 -4.8 -32.1 -5.3
Sub-national governments -6.1 -1.3 -6.6 -1.2 -9.3 -1.5
State companies -1.5 -0.3 -0.3 -0.1 -2.6 -0.4
Total -32.7 -6.8 -32.4 -6.1 -44.0 -7.3
Table 3.3 – Public sector borrowing requirements –
Primary result
Accumulated in the year R$ million
Period Occurrence Target Margin
(I) (II) (I - II)/(II) (%)
2004/IQ -20 528 -14 500 41.6
2004/IIQ -46 182 -32 600 41.7
2004/IIIQ -69 771 -56 900 22.6
2004/IVQ -81 112 -71 500 13.4
2005/4-month period -44 012 -35 780 23.0

�������������������������� �������
of 16% of GDP. This same level would also be used as thereference for any revision introduced by the Congress. Shouldrevenues exceed that limit in 2006, the extra funds could onlybe used through supplementary credits at the initiative of theexecutive branch. In the following fiscal year, however, thegovernment would be obligated to adopt measures to lowerthe tax burden to the 16% level. Aside from this, a limit of17% of GDP was imposed on primary government spending,excluding obligatory transfers and investments.
The result registered by sub-national governments was drivenby ICMS revenues and by constitutionally dictated federalgovernment endowments. Using the IGP-DI as deflator,these endowments expanded by 8.8% in the first quarter of2005, compared to the same period of the previous year. Atthe same time, ICMS revenue increased 3.5%, withparticularly strong growth in São Paulo, 5.6%; Minas Gerais,with 10.7%; and Espírito Santo, with 15.4%.
Nominal interest on an accrual basis totaled R$13.3 billionin April. In the year, the total paid came to R$51.2 billion(8.4% of GDP), versus R$41.3 billion (7.8% of GDP) in2004. Cumulative interest paid over twelve months totaledR$138.2 billion (7.5% of GDP), compared to R$134.8 billion(7.4% of GDP) in March.
Excluding the impact of exchange rate fluctuations andincluding the effects of swap operations, the rate ofcapitalization of the net public sector debt maintained astrong correlation with the Selic rate. From January 2003 toApril 2005 the correlation was 0.94.
Non-financial public sector borrowing requirements,encompassing the primary result plus nominal interest paid,posted a deficit of R$7.2 billion (1.2% of GDP) in the firstfour months of 2005, versus R$8.8 billion (1.7% of GDP) inthe same period of 2004. The increase in interest expenditureswas offset by growth in the primary surplus.
Regarding the sources of financing for the nominal deficitin the four-month period, net external debt declined R$31.3billion, while domestic securities financing grew R$63.3billion. Bank financing dropped R$15.7 billion and themonetary base diminished by R$10.9 billion.
������������
Federal securitized debt increased from R$810 billion (43.7%of GDP) in December 2004, to R$874 billion (45.8% of
14
16
18
20
22
24
26
Jan2003
Apr Jul Oct Jan2004
Apr Jul Oct Jan2005
Apr
% p.y.
12 months Selic12 months capitalization rate (excluding exchange rate variation)
Figure 3.23 – Selic rate x capitalization rate NPSD
Table 3.5 – Public sector borrowing requirements
Accumulated in the year
April
2004 2005
R$ billion % GDP R$ billion % GDP
Uses 8.8 1.7 7.2 1.2
Primary - 32.4 - 6.1 - 44.0 - 7.3
Interest 41.3 7.8 51.2 8.4
Sources 8.8 1.7 7.2 1.2
Domestic financing 31.9 6.0 38.5 6.3
Securities financing 38.0 7.1 63.3 10.4
Bank financing 3.8 0.7 - 15.7 - 2.6
Others - 9.8 - 1.9 - 9.2 - 1.5
External financing - 23.1 - 4.3 - 31.3 - 5.2

������������������ ���������������
GDP) in April 2005. The factors that contributed to the resultwere the increase in net issuance of R$20.1 billion on theprimary market and incorporation of R$45.2 billion in interest,while the 4.6% appreciation of the real against the dollargenerated a R$1.7 billion decline in the debt stock.
Including both primary issuance and swap operations, theshare of the federal domestic debt indexed to the dollardropped from R$80.1 billion to R$40.6 billion in the period.The factors underlying this result were a R$32.3 billionreduction in swap operation exposure, as well as R$7 billionin net redemptions of dollar-linked securities and appreciationof the real against the dollar. The participation of dollar-linked securities in the debt, including swap operations,decreased from 9.9% in December 2004 to 4.6% in April2005, while the share represented by fixed rate debt movedfrom 20.1% to 20.3%, a level reached for the first timesince mid-1998.
In April, excluding financing operations, the amortizationschedule of outstanding public sector debt was as follows:R$248.9 billion, 28.5% of the total, maturing between Mayand December 2005; R$300.7 billion, 34.4% of the total,in 2006; and, R$324.2 billion, 37.1% of the total as ofJanuary 2007.
FX-swap outstanding in April totaled R$6.1 billion, versusR$38.3 billion in December 2004. Defined as the differencebetween DI returns and exchange rate variation plus coupon,these operations produced a positive result of R$1.2 billionfor the BCB in the four-month period (accrual basis). Underthe cash criterion, the result was also positive (R$1.3 billion).
������������ ������
Net public sector debt closed April at R$956.7 billion (50.1%of GDP), versus R$965.9 billion (50.8% of GDP) in March,and R$957 billion (51.6% of GDP) in December 2004. TheApril reduction in net debt reflected the R$3.1 billion nominalsurplus in the month, as well as the R$7.4 billion impact of5.1% exchange appreciation in the period.
The 1.5 p.p. decline in the net public sector debt to GDPratio in the first four months of 2005 was basically causedby GDP growth, fiscal performance and exchange rateappreciation. Analysis of these factors in 2005 demonstratesthat the nominal deficit was offset by the impact of exchangerate appreciation, with nominal GDP growth accounting forthe 1.5 p.p. reduction in debt-to-GDP in the period.
0
10
20
30
40
50
60
70
Over/Selic Fixed-rate Price indices Exchangerate
Referencerate
Dec/2004 Apr/2005
Figure 3.24 – Federal securities debt structure %
Table 3.6 – Net debt growth
Conditioning factors
2003 2004 2005 – Apr
R$ % R$ % R$ %
million GDP million GDP million GDP
Total net debt –
Balance 913 145 57.2 956 994 51.6 956 677 50.1
Flows Accumulated in the year
Net debt – Growth 32 037 1.7 43 851 - 5.6 - 317 - 1.5
Conditioning
factors 32 037 2.0 43 851 2.4 - 317 0.0
PSBR 79 030 4.9 47 144 2.5 7 173 0.4
Primary -66 173 - 4.1 -81 112 - 4.4 -44 012 - 2.3
Interest 145 203 9.1 128 256 6.9 51 185 2.7
Exchange
adjustment -64 309 - 4.0 -16 193 - 0.9 -6 608 - 0.3
Domestic securities
debt1/ -22 715 - 1.4 -3 335 - 0.2 -1 664 - 0.1
External debt -41 594 - 2.6 -12 858 - 0.7 -4 944 - 0.3
Others2/ 16 712 1.0 7 137 0.4 - 652 0.0
Skeletons 604 0.0 5 841 0.3 - 230 0.0
Privatizations - - - 78 0.0 - -
GDP growth effect - 0.3 - 7.9 - 1.5
1/ Domestic dollar – Indexed securities.
2/ Parity of the basket of currencies in the net external debt.

�������������������������� �������
The gross general government debt (federal government,social security and state and municipal governments)reached R$1.37 trillion (71.9% of GDP) in April, comparedto R$1.39 trillion (73% of GDP) in March, and R$1.33 trillion(71.8% of GDP) in December 2004. The factors thataccounted for the April drop were net security redemptionsand exchange rate appreciation in the month.
��� �!!���
In the three-month period ended in May, financial system creditexpanded steadily, primarily as a result of household demandfor bank credit. Payroll-deducted loans became the primarycredit modality since they have the dual advantage of lowerinterest rates for borrowers and lesser credit risk for financialinstitutions. At the same time, lending to the corporate sectorposted moderate growth in both the earmarked and non-earmarked credit segments, fully compatible with the evolutionof economic activity in the period.
This movement was paralleled by strong growth in alternativefinancing mechanisms, such as debenture issuance, mainlyby leasing companies, as leasing operations have registereda strong recovery over the past two years.
The primary fiscal surplus in the four-month period surpassedthe previously defined target, further strengthening theoutlook for meeting the year-end target. At the same time,measures have been taken to ensure the public sector debtsustainability, as evinced by the budget guidelines set outfor the 2006 fiscal period.
The major determinants of the net public sector debt-to-GDP ratio have registered consistently positive results,including all levels of the public sector.

�������������������������� ��������
������������� ������
Though somewhat below the pace registered in 2004, globaleconomic growth in the first quarter of 2005 remained strongand consistent with expectations for the year. There appearsto be a cooling of growth in the United States, continuedstrong expansion in China, moderate growth in the otheremerging economies, and recovery in Japan and, to a lesserextent, in the Euro Area, although several indicators suggestthat growth in the latter two regions will be somewhatweaker in the second quarter.
Despite the pressures generated by higher commodityprices, particularly metals and oil, inflation has remainedlow, thus enhancing monetary policy predictability in themajor economies.
The volatility in international financial markets has beenrooted primarily in credit quality weaknesses at certain largeUnited States corporations, with negative but temporaryeffects on emerging market securities. However, thesedevelopments have not impaired the external financingoutlook for emerging market countries, due to positive worldtrade dynamics.
��� ���������� ��
Driven mainly by domestic demand, the United Stateseconomy registered 3.5% annualized quarterly growth inthe first quarter of 2005. Though private investment andconsumer spending decelerated in the period, they areexpected to close the year with results similar to last year’sstrong performance. On the other hand, the net contributionof external trade remained negative in early 2005. Followinga downturn in the second half of last year that gave rise todoubts about medium term growth sustainability, productivitygains in the first quarter turned sharply upward, shiftingtoward an accelerated growth trajectory capable of ensuringnon-inflationary expansion.

������������������� ���������������
U.S. Industrial output has been growing at a pace belowthe rest of the economy, with cumulative growth of 0.4% inApril relative to December 2004, compared to 1.3% in April2004 relative to December 2003. This result coincide withbusiness confidence indicators that point to a significantlymore moderate pace of activity in the manufacturing sector.Following a decline in the January to April period, the mainconsumer confidence indices showed signs of recovery inMay, suggesting the existence of positive expectationsregarding the job market, together with assimilation of thenegative impacts stemming from rising oil prices.
Driven by fixed investment and, to a lesser extent, consumerspending, the Japanese economy registered annualizedquarterly growth of 5.3% in the first quarter of 2005. Whilethe result generated some optimism with regard to thesustainability of growth, and particularly domestic demand,the quarterly gain was partly attributed to a reversal of theadverse weather conditions that had negatively impactedactivity at the end of 2004. Industrial output closed the firstfour months of 2005 with a cumulative decline of 0.4%,compared to December 2004, despite some recovery in April.Expectations for the coming quarters suggest somewhatslower growth in activity. The main risks to medium-termgrowth are the persistent deflationary environment and thepossibility of a drop in external demand, in the case of sharpdepreciation of the U.S. dollar.
Driven by a 4.1% expansion in Germany, the annualizedrate of GDP growth of the twelve Euro Area countries rose2% in the first quarter of 2005, compared to the previousquarter. In an environment of high oil prices and euroappreciation, the outlook points to more moderate rates ofactivity expansion in the coming quarters, closing the yearat a level below 2004.
The Chinese economy has expanded strongly with growthrates above 9% since the third quarter of 2003, year-on-year.In the first quarter of 2005, GDP expanded 9.4% over thecorresponding period of the previous year. Despite recentdeclines, investment will continue leading the growth processin 2005, notwithstanding accelerated expansion of exports anddomestic consumption, both of which are becomingincreasingly important among the factors driving the economy.
Expectations point to higher rates of growth in the LatinAmerican economies in 2005, though somewhat below thoseregistered in 2004. Persistently strong prices for variouscommodities have benefited the terms of trade of the majoreconomies of the region.
Figure 4.3 – Euro Area – GDP1/
-2
-1
0
1
2
3
4
5
I2002
III I2003
III I2004
III I2005
Source: Eurostat1/ Quarterly growth. Seasonally adjusted annualized rates.
%
Germany France Italy Euro Area
Figure 4.1 – USA and Japan – GDP1/
-2
0
2
4
6
8
10
I2002
II III IV I2003
II III IV I2004
II III IV I2005
Sources: Bureau of Economic Analysis, Economic and Social Research Institute1/ Quarterly growth. Seasonally adjusted annualized rates.
%
USA Japan
85
90
95
100
105
Apr2000
Oct Apr2001
Oct Apr2002
Oct Apr2003
Oct Apr2004
Oct Apr2005
2000 = 100
USA Japan Euro Area
Figure 4.2 – USA, Japan and Euro Area – Industrial production
Source: Federal Reserve, Economic and Social Research Institute, Eurostat
Figure 4.4 – China – GDP1/
5
6
7
8
9
10
I2002
II III IV I2003
II III IV I2004
II III IV I2005
Source: Bloomberg1/ Growth rate over the same period of preceding year.
%

�������������������������� ��������
With the exception of the Euro Area, unemployment ratesin the principal world economies suggest a gradual andprolonged process of job market recovery. In the UnitedStates, unemployment has remained relatively stable in therange of 5.2% in March and April of this year. Other jobmarket indicators, however, point to a more favorablescenario. Hirings have risen, reaching an April record of133.3 million workers. In Japan, unemployment moveddownward, dropping to 4.4% in April, compared to 4.7% inFebruary. Unemployment in the Euro Area remained highand stable, at approximately 8.8% in March, the same levelas twelve months ago.
��� �����������������������
Despite high oil prices, there are no signs of rising inflation,albeit in the United States core inflation increased to a newhigher level. Consequently, the major economies areexpected to maintain their monetary policy stances.
Though oil prices have had a negative impact on bothwholesale and retail inflation in the U.S., they have had littleimpact on medium and long run inflation expectations. Inthis context, the Federal Reserve (Fed) has not altered itsgradual monetary tightening. Reaffirming this gradualistapproach, the Fed raised interest rates from 1% p.a. inJune 2004 to 3% p.a. in May 2005, underscoring the currentgrowth potential of the economy, as demonstrated by idleindustrial capacity, productivity gains in the non-farm sectorand the recent falloff in crude oil prices, following a sharpincrease early in the year.
Inflation remained stable in the Euro Area with only smalloscillations around the 2% p.a. target. Here, it is importantto stress that the low level of domestic demand is expectedto dampen the potential for passing sharply higher producerprices on to final consumers. Expectations regardingmonetary policy implementation by the European CentralBank (ECB) indicate that the official interest rate target of2% p.a. will be maintained. The heterogeneous pace ofeconomic activity and inflation within the region makes itdifficult for the ECB to fine-tune its monetary policy, sincethe same interest rate is viewed in some countries asexpansionary, and contractionary in others.
In May, the Bank of England maintained the repo rate at4.75% p.a., despite higher inflation, which came to 1.9%p.a. in March and April, the peak of the last seven years.The recent surge does not necessarily compromise the 2%
Figure 4.5 – USA, Japan and Euro Area – Unemployment rates
2
4
6
8
10
Apr2000
Oct Apr2001
Oct Apr2002
Oct Apr2003
Oct Apr2004
Oct Apr2005
%
USA Japan Euro Area
Source: Bureau of Labor Statistics, Statistics Bureau, Eurostat
0
1
2
3
4
5
May2003
Sep Jan2004
May Sep Jan2005
May
Source: Federal Reserve, ECB and Bank of England
USA Euro Area United Kingdom
Figure 4.6 – Official interest ratesAnnual rates%
Figure 4.7 – Inflation – USAAnnual growth%
0
1
2
3
4
5
Apr2003
Aug Dec Apr2004
Aug Dec Apr2005
Source: Bureau of Labor StatisticsPPI CPI
Figure 4.8 – Consumer inflation – Euro AreaAnnual growth%
1
2
3
Apr2003
Aug Dec Apr2004
Aug Dec Apr2005
Source: Eurostat
HICP – Core HICP

������������������� ���������������
inflation target. Though economic growth has been higherthan the long-term average over the last seven quarters, ithas declined since mid-2004, in response to the monetarypolicy tightening cycle in the November 2003 through August2004 period.
In Japan, the central bank maintained the banking reservetarget within the interval of ¥30 trillion to ¥35 trillion.However, in the minutes of the May meeting, the monetaryauthority raised an alert regarding the possibility that thebanking reserve balance could close below the official targetdue to exceptionally weak liquidity demand. This fact wasconstrued as the first step toward reducing the official targetinterval, before eliminating it all together and, eventually,terminating the country’s zero interest rate policy. However,persistent deflation continues to undermine monetary policyeffectiveness. Aside from this, inflation expectations remainlow, with no sign of any significant short-term monetarypolicy shift.
Following a consumer price spike in February that, to someextent, reflected the Lunar New Year festivities, inflation inChina dropped sharply in April, moving to the October 2003level, notwithstanding the rising importance of domesticconsumption in sustaining Chinese economic growth.
��� ��������������������������
Strong demand for long-term government bonds has heldthe yields on these securities to historically low levels in theindustrial economies. Though many factors can be cited inexplaining this behavior, the most important are demand fromAsian central banks and pension funds. However, betweenmid-March and mid-April, yields on long-term securities rose,particularly in the United States.
This movement reflected not only the reversal ofspeculative positions and an oil price surge, but also morepessimistic expectations regarding inflation and FederalReserve monetary policy implementation. Nevertheless,more benign prognoses for underlying inflation and evidencethat the pace of economic activity had leveled off returnedlong-term yield to lower levels, both in the U.S. and in themain industrialized economies.
More recently, the downward pressure on yields hasreflected a “flight to quality”, due to the ratings downgrades
0
1
2
3
Apr2003
Aug Dec Apr2004
Aug Dec Apr2005
Source: Bloomberg
Figure 4.9 – Consumer inflation – United Kingdom Annual growth%
-1.0
-0.5
0.0
0.5
1.0
Apr2003
Aug Dec Apr2004
Aug Dec Apr2005
Source: BloombergCPI CPI – Core
Figure 4.10 – Consumer inflation – JapanAnnual growth%
0
1
2
3
4
5
6
Apr2003
Aug Dec Apr2004
Aug Dec Apr2005
Source: Bloomberg
Figure 4.11 – China – Consumer inflation
Annual growth%
0
1
2
3
4
5
May2003
Aug Nov Feb2004
May Aug Nov Feb2005
May
% per year
USA Germany Japan
Source: Bloomberg1/ Monthly average of nominal yields on 10 year bonds.
Figure 4.12 – Yield on Government bonds1/

�������������������������� ��������
of large U.S. automakers. Annual yields on ten-year U.S.Treasuries averaged 4.16% in February, rising to 4.49% inMarch. In April and May, average rates dropped to 4.32%and 4.16%, respectively.
Most global stock markets registered losses in the Marchthrough May period, compared to the level registered at theend of February. In the U.S., the Dow Jones Index and theStandard & Poor’s 500 declined 3.3% and 1.6%,respectively, while the Nasdaq remained stable. TheJapanese Nikkei index fell 4.3%. In Europe, the German(DAX) and French (CAC) indices rose by 1.8% and 1.6%,in that order, while the FTSE 100 in England fell by 0.7%.In the emerging markets, mention should be made ofreductions in the stock market indices of South Korea(Kospi), 4.1%; Mexico (IPC), 6.1%; Russia (RTS), 3.7%;Brazil (Ibovespa), 9.1%; and Argentina (Merval), 7.1%.
Stock markets in general registered moderate recovery inmid-April, reflecting renewed optimism regarding reductionsin oil prices during part of the period, and reduced concernsabout an accelerated monetary tightening in the United States.
Starting in the second half of March, spread widening waswidespread across credit markets. Since then, the EmergingMarket Bond Index (Embi+) has traded in the range of384 basis points over comparable U.S. Treasuries versusan average of 338 basis points in the first half of March,thus reversing the downward trend observed since mid-May 2004.
The temporary rise in government bond yields in theindustrialized countries further destabilized already nervouscredit markets. Concerns about sharp adjustments in hedgefund positions due to the automotive company credit ratingdowngrades also contributed to greater risk aversion andmore acute volatility. It is important to recognize, however,that the search for yield in an environment of abundantinternational liquidity, prudent macroeconomic policies in mostemerging market countries, and sustained strong globaleconomic activity contribute to reverse this deterioration.
The outlook for private foreign capital flows to emergingmarkets in 2005 remains consistent with the positive outlookprevailing at the start of the year. Despite rising riskperceptions measured by spreads, this outlook is supportedby steady growth in the major emerging market economiesand still high commodity prices.
Figure 4.13 – Stock exchanges – USA 1.4.2002=100
85
90
95
100
105
110
12.112003
1.262004
3.8 4.19 5.28 7.8 8.18 9.29 11.9 12.20 1.282005
3.9 4.20 5.31
Source: BloombergDJIA S&P 500 Nasdaq
65
75
85
95
105
115
12.112003
1.262004
3.8 4.19 5.28 7.8 8.18 9.29 11.9 12.17 1.272005
3.9 4.20 5.31
Source: Bloomberg
FTSE 100 DAX Nikkey 225
Figure 4.14 – Stock exchanges – Europe and Japan1.4.2002=100
90
120
150
180
210
240
12.112003
1.262004
3.8 4.19 5.28 7.8 8.18 9.29 11.9 12.20 1.282005
3.9 4.20 5.31
Source: Bloomberg
South Korea Brazil Mexico
Figure 4.15 – Stock exchanges – Emerging markets 1.4.2002=100
320
384
448
512
576
640
4.102003
6.19 8.29 11.7 1.202004
3.30 6.9 8.19 10.28 1.72005
3.18 5.31
b. p.
Source: Bloomberg
Figure 4.16 – Emerging Markets Bond Index Plus (Embi+)

������������������� ���������������
In March, the Institute of International Finance (IIF)2 raisedits projection for foreign capital flows to emerging marketeconomies, projecting a 7.2% rise in foreign direct investmentand a 2.4% increase in total foreign capital flows, comparedto 2004. The also forecasts a 19.3% increase in 2005 in netforeign direct investment flows to the developing economies.
Deceleration in FDI flows to China in the first four monthsof the year was apparently due to pre-funding in the fourthquarter of 2004, generated by renewed expectations for amore flexible exchange rate policy. Though exchange ratepolicy has not been altered, the Chinese government isimplementing measures viewed as paving the way for areform. On May 183, the government finalized theoperational structure that will improve cross-currencyquotations for the renminbi, while more recent measuresare targeted at strengthening domestic foreign currencydemand and, therefore, attenuating the pressures generatedby domestic currency appreciation.
The growing interest rate differential between the UnitedStates and other international financial centers, provokedby reduced 2005 economic growth forecasts for Europe,coupled with robust economic expansion in the U.S.,sustained private capital flows to that country in the three-month period ended in May. In tandem with declining importgrowth, this process drove dollar appreciation, starting atthe end of last December.
When compared to February positions, the average U.S.dollar exchange rate appreciated against the Canadian dollar,1.3%; the euro, 2.5%; the pound sterling, 1.7%; and theyen, 1.6%, returning to October 2004 levels.
Over the same period, the U.S. dollar exchange rate tendedto depreciate against emerging market currencies, excludingChile and South Africa. The countries that posted thestrongest appreciation against the dollar were Brazil, 5.8%;South Korea, 2%; and Mexico, 1.5%.
��� ����������
In the first quarter of 2005, global trade were leveraged bystrong economic activity in the U.S. and China, in aframework of rising oil and commodity prices.
2/ Update on Capital Flows to Emerging Market Economies, March 2005.
3/ Interbank market trading with 8 currencies was initiated, in addition to U.S. dollar, euro, yen, and the Hong Kong dollar.
Figure 4.17 – Dollar exchange rates9.19.2003=100
80
90
100
110
1.92003
20.10 8.12 26.12004
15.3 3.5 21.6 9.8 27.9 15.11 3.12005
21.2 11.4 30.5
Source: Bloomberg
Euro/Dollar Pound Sterling/Dollar
Yen/Dollar Can. Dollar/Dollar

�������������������������� �������
International trade in the United States increased onlymoderately from January to March 2005, compared to thefinal quarter of 2004, as exports expanded 2.7% and importsincreased 2.2%. The higher level of exports in the period isexplained by greater external demand for consumer andcapital goods. At the same times, domestic demand forimports fell, despite higher oil prices. Merchandising tradedeficit peaked in February (US$64.6 billion), or US$60.6billion when services are included.
In China, the larger trade surplus in the early months of2005 stemmed from increased exports, which repeated thestrong performance of the final quarter of 2004, whiledemand for imports diminished. Chinese exports in the firstquarter were driven by sales of electronics, textiles and steel.With the end of textile export quotas in January, internationalpressures to appreciate the renminbi intensified.
The strong integration of the Asian industrial productive chainmade it possible for countries of the region to benefit fromstrong Chinese economic growth. This was most evident inJapan, since that country’s exports were driven mainly byEast Asian demand, particularly in China, in a frameworkof recovery in sectors related to information technology.
Foreign trade in the Euro Area moved in the oppositedirection. The region’s trade flows dropped in the first quarterof 2005 versus the final quarter of 2004. Imports fell 1.2%and exports by 0.2%, registering an increase of 23.9% inthe trade surplus in the period.
However, the performances of the major economies variedfrom one country to another. German foreign sales expandedas a result of strong demand in the emerging Asian andEuropean countries. In France, low export competitiveness,coupled with strong domestic demand for consumer goodsand high energy costs, drove a 7.5% increase in the firstquarter trade deficit. In Italy, external trade flowsdeteriorated, with a 1.3% fall in exports and a 1.4% declinein imports, and a 2.3% rise in the trade deficit in the period.
Most Latin American countries benefited from continuedhigh commodity prices, particularly oil and metals. Firstquarter prices were higher than expected, thus generatingmore favorable terms of trade, despite lower soybean prices.Parallel to this, abolition of textile export quotas benefitedsome countries of the region.
The prognosis for the world economy in the coming monthspoints to less robust trade flows through the end of 2005, in
70
80
90
100
110
120
9.12003
10.20 12.8 1.262004
3.15 5.3 6.21 8.9 9.27 11.15 1.32005
2.21 4.11 5.30
Peso/Dollar Rand/DollarLira/Dollar Baht/Dollar
Figure 4.18 – Emerging markets currenciesChile, South Africa, Turkey and Thailand9.19.2003=100
Source: Bloomberg
10
15
20
25
30
35
40
45
50
Sep2002
Dec Mar2003
Jun Sep Dec Mar2004
Jun Sep Dec Mar2005
US$ billion
EU China Japan
Source: Bloomberg1/ Quarterly moving average.
Figure 4.20 – USA – Bilateral trade deficit1/
-35
-20
-5
10
25
40
55
Sep2002
Dec Mar2003
Jun Sep Dec Mar2004
Jun Sep Dec Mar2005
Asia EU USA Japan
Source: Bloomberg1/ Quarterly moving average.
Figure 4.21 – China – Trade balance1/
US$ billion
80
90
100
110
120
9.12003
10.20 12.8 1.262004
3.15 5.3 6.21 8.9 9.27 11.15 1.32005
2.21 4.11 5.30
Won/Dollar Real/Dollar Peso/Dollar
Figure 4.19 – Emerging markets currenciesBrazil, Mexico and Korea9.19.2003=100
Source: Bloomberg

������������������ ���������������
line with deceleration in the pace of global economic activity.Nonetheless, the World Trade Organization forecasts 2005growth of 6.5% in global merchandising trade, while theIMF and World Bank project 7.9% and 7.7%, respectively.
����� ���������
Despite deceleration in the global economy in the first fourmonths of 2005, global commodity demand remained strong,sustaining rising prices in the period, notwithstanding a slightdip in April.
In the January–April period, the prices of metals followed thegrowth trajectory evident in the last two years, rising to thehistoric high since 1980, according to the IMF. The favorableperformance of metal prices, particularly copper, stem frompositive global economic performance in the last two yearsand, primarily, the demand pressures generated by China.
Following a sharp downturn in the second half of 2004compared to the highpoint registered in April of that year,average agricultural commodity prices were positive in thefirst four months of 2005, with growth of 3.6% compared tothe previous four months, despite a slight drop in April. Sincethe products included in this index had varied performances,as a result of weather conditions, this movement cannot yetbe construed as a broader trend.
International coffee prices reflected harvest failures in Braziland other important producer countries, such as Vietnamand Colombia. While an increase in international wheatsupplies relative to the last harvest appears likely,international prices have remained relatively unchanged.Soybean exports from the southern hemisphere and theUnited States are below expectations, which could generatepressures on international prices.
������� ��
The path of oil prices is a key uncertainty in the globalscenario, given its influence on inflation and the dynamicsof the world economy. In the March through May period,international oil prices remained near record levels. Thebehavior of prices mirrors a market in which expansion ofsupply seems limited by the lack of refining capacity andproblems in producer countries, while global growth is drivingdemand upward, particularly to meet greater consumptionneeds in China and India.
Figure 4.22 – Commodity price index in SDR1995 = 100
70
80
90
100
110
120
130
140
150
Jul2002
Oct Jan2003
Apr Jul Oct Jan2004
Apr Jul Oct Jan2005
Apr
Food index Metals
Source: IMF

�������������������������� ��������
Figure 4.23 – Oil – Spot marketUS$ per barrel
28
32
36
40
44
48
52
56
5.102004
6.22 8.3 9.14 10.26 12.7 1.212005
3.4 4.18 5.31
Brent WTISource: Bloomberg
Figure 4.24 – Brent Oil – Futures market
50
51
52
53
54
55
56
Jul2005
Sep Nov Jan2006
Mar May
3.31.2005 4.29.2005 5.31.2005
Source: Bloomberg
US$ per barrel
The average price per barrel of Brent crude in the Marchthrough May period was US$51.19, a 46.8% increase overthe same period of 2004.
Though the Organization of Petroleum Exporting Countries(Opec) raised output by 2 million barrels/day as of March,and U.S. inventories rose to 332.4 million barrels in May, thesefactors were insufficient to push prices significantlydownward. Brent price hit US$55.76 on April 18, beforedropping back into the range of US$50 at the end of May.
Futures market prices indicate that oil price will remain highat approximately US$50.00 in the coming months. Thoughfutures prices do point to a slight decline, prices will bepressured by ongoing geopolitical factors and problems inthe producer countries, thus facilitating speculative futuresmarket operations.
��� �������
After reaching a fifteen-year peak in 2004, global growth isexpected to slightly decelerate this year. Growth will bedriven by the U. S. and China, while Japan and the EuroArea are expected to post lower rates of expansion.
The outlook for inflation remains relatively optimistic,lessening expectations for a sharp correction in monetarypolicy stances around the globe.
Accommodative monetary policy stances have createdfavorable liquidity conditions in higher risk credit markets.However, since mid-February, this rather benign environment– which has sustained high global levels of investment andconsumption – has proven somewhat unstable. This doesnot reflect any real deterioration in economic fundamentals,since many emerging market countries are posting low fiscaldeficits and healthy balance of payments positions, whichevidently enhance the sustainability of their economies. It isimportant to note that only a sharp downturn in globaleconomic activity, marked by lower commodity prices andtrade flows, could significantly jeopardize the credit ratingsof the emerging markets. And this is clearly considered aremote possibility, despite continued high oil prices.

�������������������������� ��������
��������� �����
External sector results in the first half of 2005 wereconsistently positive. Despite rising imports, robust exportgrowth generated steadily larger trade surpluses, sharplyreducing external financing requirements and, consequently,further strengthening Brazil’s external account sustainability.Furthermore, there were net foreign currency inflows intoBrazil in the year through May, with trade-related inflowsexceeding financial outflows.
In the twelve-month period ended in May, the currentaccount recorded a surplus of US$13.4 billion, compared toUS$6.4 billion in the twelve-months through May 2004. Givenexpectations that this performance will continue throughoutthe remainder of the year, Brazil appears poised to post acurrent account surplus for the third consecutive year.
The external sector projections in this Report include upwardrevisions for the trade surplus and net remittances of profitsand dividends, compared to forecasts in the previous InflationReport. The forecasts for net foreign direct investment andthe rollover rates for medium- and long-term private sectorexternal liabilities remain unchanged. Consequently, the outlookfor the 2005 balance of payments financing remains favorable.
��� �������� ���������
The currency market registered a surplus of US$8 billion inthe year through May, 3% less than in the same period of2004. Net financial settlements linked to trade operationstotaled US$17.8 billion, a reduction of 1% compared to thesame period of 2004. Export contracts totaled US$44.8billion, while import contracts came to US$26.9 billion, forrespective increases of 15.8% and 30.5% in the period.
Financial operations posted net outflows of US$9.3 billion,1.5% above January-May 2004, with a 33.7% increase inpurchase volume and a 26.2% increase in sales volume.
Table 5.1 – Foreign exchange flows
US$ billion
2004 2005
May Jan- Year May Jan-
May May
Operations with clients in Brazil 1.7 8.8 11.9 -0.8 8.5
Trade operations 5.2 18.0 36.7 4.3 17.8
Exports 9.2 38.7 93.5 10.3 44.8
Imports 4.0 20.6 56.8 6.0 26.9
Financial operations1/-3.4 -9.2 -24.7 -5.1 -9.3
Purchases 5.4 30.3 84.6 6.9 40.5
Sales 8.8 39.5 109.4 12.0 49.9
Operations with banks abroad (net) -0.2 -0.6 -5.6 0.0 -0.5
Net flows 1.6 8.3 6.4 -0.8 8.0
1/ Excluding interbank operations and Central Bank foreign operations.

������������������� ���������������
Net BCB foreign exchange acquisitions were concentratedentirely in the period up to March and totaled US$10.2 billion.
With these results, the short banking sector position in thespot market shifted from US$1.4 billion at the end of 2004to US$3.3 billion in May.
��� ���������� �
Exports set a new record of US$9.8 billion in May, thethird consecutive month in which exports exceeded US$9billion. Average daily exports also reached a new high ofUS$467.6 billion, 23.6% above the levels of May 2004.Cumulative exports in the first five months of the year hitUS$43.5 billion, a record for the period and 27.9% abovethe same period in 2004.
Imports also set records in both absolute and average terms,closing May with US$6.4 billion and a daily average ofUS$303.2 million, 31.8% higher than May 2004. Cumulativeimports in the year reached a record high of US$27.8 billion,22.2% above the same period of 2004.
In May, the trade surplus totaled US$3.5 billion. The 15.2%drop in the daily average surplus compared to the previousmonth was primarily due to import growth. The year-to-May surplus totaled US$15.6 billion, 39.6% above January/May 2004. Total trade reached record levels of US$16.2billion in May and US$71.3 billion in the year. These figureswere 26.7% and 25.6%, respectively, above the results forthe same periods of 2004.
In the twelve-month period ended in May, exports totaledUS$106 billion, imports totaled US$67.9 billion, the tradesurplus closed at US$38.1 billion, and total trade wasUS$173.8 billion. All of these figures represented twelve-month cumulative records.
Average daily exports in May and in the first five months ofthe year also set new records for these periods across allexport product categories. In May, exports of manufacturedgoods increased 24.9% compared to last year, followed bysemi-manufactured products, with a 31% increase, andprimary products, up 16.7%.
Cumulative export growth in the year through May (versusthe same period of 2004) was 35.7% for semi-manufacturedgoods, 34.4% for manufactured products, and 15.4% forprimary products. Sales of manufactured goods have played
Table 5.2 – Trade balance – FOB
US$ million
Period Exports Imports Balance Total trade
Jan-May 2005 43 471 27 826 15 645 71 297
Jan-May 2004 33 979 22 774 11 205 56 753
% change 27.9 22.2 39.6 25.6
Source: MDIC/Secex
Table 5.3 – Exports by aggregate factor – FOB
Daily average – January-May
US$ million
2004 2005 % change
Total 329.9 426.2 29.2
Primary products 99.8 115.2 15.4
Industrial products 224.9 302.9 34.7
Semimanufactured goods 46.0 62.4 35.7
Manufactured goods 178.9 240.5 34.4
Special operations 5.2 8.2 58.2
Source: MDIC/Secex

�������������������������� ��������
a significant role in overall export performance, asdemonstrated by the increase in participation of this segmentin total exports to 56.4% from 54.2%. Manufactured exportproduct growth was driven by exports of passenger cars,aircraft, auto parts, flat rolled iron and steel products, andvehicle engines.
The decline in the share of primary products in overallexports, from 30.3% to 27% in the period, is attributable tothe 13.1% decline in soybean exports.
In the period from January to May 2005, sales oftransportation equipment, metallurgical goods, meats,chemicals, soybeans and mechanical equipment accountedfor 55.3% of Brazilian exports.
According to the Foreign Trade Study Center Foundation(Funcex), the 27.9% growth registered by Brazilian exportsin the January through May period of 2005, compared tothe same period of 2004, was due to increases of 15.6% involume and 10.5% in the prices of export products. Thoughthese two indices registered growth under all productcategories, there was a notable 19.7% increase in the pricesof semi-manufactured goods and a 19.5% rise in the volumeof manufactured exports.
The Herfindahl-Hirschman index shows that concentrationof exports on a product basis declined in the January throughMay period of 2005, compared to the same period of 2004.This downward trajectory is clearly beneficial to exportstability and has been noted since 2001.
After declining in 2003 and 2004, the concentration ofBrazilian exports by markets stabilized in the first five monthsof 2005. This stabilization mirrored increased concentrationin exports of semi-manufactured goods and, to a lesserextent, in exports of primary products, counterbalanced bya reduction in the concentration of manufactured exports.
From January through May, average daily imports totaledUS$272.8 million, an increase of 23.4% over the same periodof 2004. Expansion of more than 20% was registered in allfinal use categories, led by purchases of fuels and lubricants(up 30.9%) and capital goods (up 27.2%). Raw materialsand intermediate goods imports (over half of total imports)rose 20.5%. Reflecting increased income and exchange rateappreciation, consumer goods imports expanded 20.2% inthe period, led by a 24.3% rise in nondurable goods imports.
0
5
10
15
20
25
Total Primary Semimanufact. Manufactured
%
Price VolumeSource: Funcex
Figure 5.2 – Exports – Price and volume indexJanuary-May – 2005/2004
-15 0 15 30 45 60
Mechanical equipment
Soybeans
Chemicals
Meat
Metallurgical
Transport material
Figure 5.1 – Main exports
January-May – 2005/2004 – % change
Source: MDIC/Secex
0.017
0.018
0.019
0.02
0.021
0.022
0.023
1996 1997 1998 1999 2000 2001 2002 2003 2004 2004* 2005*
Figure 5.3 – Exports concentration, by products Herfindahl-Hirschman Index
*January-May

������������������� ���������������
Imports of fuels and lubricants, mechanical equipment,electronics, chemicals, vehicles and plastics rose sharplyfrom January to May, compared to the same period in 2004,representing 65.2% of cumulative imports in the year.
According to Funcex, the increase in imports in the first fivemonths of 2005, compared to the same period of 2004,reflected growth of 9.7% in volume and 11.2% in prices. Alluse categories posted volume increases, with the exceptionof fuels and lubricants, which declined 8.2%. Growth wasdriven by capital goods imports (24.3%), reflecting acquisitionsof industrial machinery, office and scientific researchequipment, and parts for industrial capital goods. Consumerdurable imports rose 23.5%, driven by personal adornmentgoods, passenger cars and home appliances, while non-durableconsumer goods imports increased 11.9%.
Import prices rose across all use categories. Prices of fuelsand lubricants rose by 35.9%, followed by raw materialsand intermediate goods (9.2%), non-durable consumergoods (8.1%), durable consumer goods (3.6%), and capitalgoods (0.3%).
A comparison of Brazilian export destinations in the firstfive months of 2005 with the same period of 2004 showsan increase in exports to the major regions and tradingpartners. Average daily exports to Eastern Europeincreased 61.8%, followed by exports to Argentina (41.8%),Latin American except Mercosur and Mexico (51.4%),Japan (35.2%), and the U.S. (30.1%). Sales ofmanufactured products were driven not only by traditionalgoods, but also by the burgeoning participation of itemswith historically minimal participation, such as boats, aircraftengines and turbines, and cast iron goods. Latin Americacountries and the United States absorbed most of theproducts shipped abroad under these categories.
Using the same basis of comparison, Brazilian imports fromAsia increased 48%, followed by the European Union (24.7%)and Latin America (21.7%) – in this case, imports fromArgentina rose 19.5%, accounting for approximately 55% ofBrazilian imports from these countries, coupled with growthof 29.9% from Mexico. The increase in imports from Mexicowas driven by two trade preference agreements, one forgeneral products and the other for the automotive sector.
Trade with China has taken on growing importanceparticularly after China’s entry into the World TradeOrganization (WTO). While Brazilian sales to China consistmostly of primary products, including iron ore, soybeans and
100
111
122
133
144
155
Apr2001
Aug Dec Apr2002
Aug Dec Apr2003
Aug Dec Apr2004
Aug Dec Abr2005
100
106
112
118
124
130
Raw material imports Industrial production
Industrial productionImports
Figure 5.6 – Raw material imports x industrial production – 3-month moving averageSeasonally adjusted indices
1999 = 100
Source: IBGE and Funcex
Figure 5.4 – Exports concentration, by marketsHerfindahl-Hirschman Index
208
0
0.02
0.04
0.06
0.08
0.1
1997 1998 1999 2000 2001 2002 2003 2004 2004* 2005*
Inde
x
192
194
196
198
200
202
204
206
208
210
Nº
of c
oun
trie
s
Index Nº of countries* January-May
Table 5.4 – Imports by end-use category – FOB
Daily average – January-May
US$ million
2004 2005 % change
Total 221.1 272.8 23.4
Capital goods 44.0 55.9 27.2
Raw materials 118.5 142.8 20.5
Naphtha 3.4 4.3 24.8
Consumer goods 25.1 30.2 20.2
Durable 11.8 13.6 15.5
Passenger vehicles 2.2 2.7 22.2
Nondurable 13.4 16.6 24.3
Fuels 33.6 43.9 30.9
Crude oil 24.5 29.3 19.4
Source: MDIC/Secex
0 6 11 17 22 28 33 39 44 50 55
Plastics
Vehicles and parts
Chemicals
Electric/electronics
Mechanical equipment
Fuels
Figure 5.5 – Imports by main sectors January-May – 2005/2004 – % change
Source: MDIC/Secex

�������������������������� ��������
oil, imports from that country are composed mainly of highervalue-added products, such as capital goods, electroniccircuits, engines and generators, and textiles. In the firstfive months of 2005, Brazilian exports to the Chinese marketfell 3% compared to the same period of 2004, in contrast toa 59% expansion in Brazilian imports from China.
��� ����� ������� ���
The current account surplus increased in the first five monthsof the current year, notwithstanding deterioration in theservice and income account. The surplus totaled US$4.1billion in the January-May period, compared to US$2.3 billionin the same period of 2004. This performance was generatedby the surging trade surplus (made possible by the exportsector dynamics) and, to a lesser extent, by current transfers.The twelve-month current account surplus totaled US$13.4billion, equivalent to 2.06% of GDP. In both value andpercentage of GDP terms, this was the second best resultever, surpassed only by April 2005, with US$14.2 billion and2.22% of GDP, respectively.
Net outlays on services totaled US$2.5 billion in the Januarythrough May period, with growth of 86.4% over the firstfive months of 2004. Net profit remittances grew by 18.7%to US$10.5 billion.
The net service account reflected a deficit of US$25.9 millionin international travel, caused by an increase of 60.8% inoutlays in the first five months of the year. It should bestressed that, though cumulative twelve-month revenuesreached the highest level since the series was first calculated(with US$3.4 billion in May), spending has also increased,explained by its high sensitivity to income and exchange rate.Since February 2005, cumulative twelve-month internationaltravel spending has exceeded US$3 billion, reaching US$3.5billion through May, the highest figure since September 2001.
Compared to January-May 2004, net outlays on equipmentrentals more than doubled to US$1.6 billion, while netspending in the transportation account dropped 23.1% inthe same period.
The income account, which traditionally registers a deficit,closed the January-May 2005 period with a US$10.5 billiondeficit, compared to a US$8.8 billion deficit in the sameperiod of the previous year. This result reflected 56% growthin net profit and dividend remittances while, in line with the
60
75
90
105
120
135
Apr2001
Aug Dec Apr2002
Aug Dec Apr2003
Aug Dec Apr2004
Aug Dec Abr2005
100
105
110
115
120
125
Capital goods imports Industrial production
Industrial productionImports
Figure 5.7 – Capital goods imports x industrial production – 3-month moving averageSeasonally adjusted indices
1999 = 100
Source: IBGE and Funcex
-15
-3
9
21
33
45
Total Capitalgoods
Intermediategoods
Durablegoods
Nondurablegoods
Fuels andlubricants
%
Price VolumeSource: Funcex
Figure 5.8 – Imports – Price and volume indexJanuary-May – 2005/2004
Table 5.5 – Exports and imports by geographic area – FOB
Daily average – January-May
US$ million
Exports Imports Balance
2004 2005 % 2004 2005 % 2004 2005
change change
Total 330 419 27.1 221 270 22.1 109 149
Latin America 67 93 39.3 36 44 21.7 31 49
Mercosur 31 43 37.6 23 27 17.3 8 15
Argentina 25 36 41.8 20 24 19.5 5 12
Other 6 7 18.2 3 3 3.8 2 3
Mexico 13 16 22.6 2 3 29.9 11 13
Other 23 34 51.4 10 13 29.9 13 21
USA1/ 68 88 30.1 43 49 13.3 25 39
EU2/ 86 102 18.6 57 72 24.7 29 30
E. Europe3/ 8 13 61.8 4 4 - 7.5 4 10
Asia 51 61 19.9 40 59 48.0 11 1
Japan 10 13 35.2 10 13 32.2 0 0
South Korea 5 6 21.4 6 8 33.6 - 1 - 2
China 21 20 - 3.0 11 18 59.0 9 2
Other 15 22 40.5 13 20 57.1 2 1
Others 50 62 22.9 41 43 5.2 10 19
Source: MDIC/Secex
1/ Includes Puerto Rico.
2/ Includes ten countries that joined the EU in 2004.
3/ Eight countries that were formerly included in this group are now in the EU.

������������������� ���������������
reduction in external debt, net interest payments dropped2.9% in the period.
Growth in total net profit and dividend remittances, whichreached US$5.1 billion in the first five months of 2005,reflected the 67.3% rise in net direct investment remittances,consistent with the stock of foreign direct investment andits maturity structure. Net profit and dividend remittancesbased on portfolio investments expanded by 43%.
��� ���������� � �
The capital account registered net inflows of US$5.2 billionfrom January through May 2005, compared to US$512million in the corresponding period of 2004. Net foreign directinvestment increased more than 100% in the period, totalingUS$7.2 billion, of which US$4.9 billion was equity investmentand US$2.3 billion was inter-company loans.
Foreign portfolio investment registered net cumulative inflowsof US$3.2 billion up to May, compared to net outflows ofUS$2.7 billion in the same period of 2004. Equity investmentstotaled US$1.8 billion, with inflows of US$1.4 billion intodomestically traded stocks and US$382 million into AmericanDepositary Receipts. Investments in fixed income securitiesregistered net outflows of US$1.4 billion. Government bondsnet inflows stood at US$2.5 billion, of which US$3.4 billion innew issues, US$15 million in payments of installments on pre-Bradies in March and US$ 930 million of installments onBradies in April. Private sector bonds and notes, andcommercial paper registered net outflows of US$599 millionand US$953 million, respectively. Net disbursements on short-term securities totaled US$358 million.
Inflows in the first five months of 2005 made it possible toachieve rollover rates of 60% for private medium- and long-term debt, with 48% for securities (bonds, notes and commercialpaper) and 92% for direct loans. Projections for the year indicaterollover rates near 70%, both for securities and direct loans.
Net outflows of Brazilian direct investment reflect growth inBrazilian assets abroad and totaled US$1.6 billion in the five-month period ended in May, compared to US$361 million inthe same period of 2004. Of total remittances, equity increasestotaled US$1.6 billion, while loans from Brazilian companiesto those in which they hold equity positions abroad registerednet returns of US$38 million. Brazilian portfolio investmentsposted net outflows of US$964 million in the same period of2005, with US$825 million in equity investments.
Table 5.6 – Current account
US$ billion
2004 2005
May Jan- Year May Jan- Year1/
May May
Current account 1.5 2.3 11.6 0.6 4.1 4.6
Trade balance 3.1 11.2 33.7 3.5 15.6 30.0
Exports 7.9 34.0 96.5 9.8 43.5 108.0
Imports 4.8 22.8 62.8 6.4 27.8 78.0
Services -0.2 -1.4 -4.8 -0.8 -2.5 -6.1
Transportation -0.1 -0.7 -2.1 -0.2 -0.6 -1.7
International travel 0.1 0.4 0.4 -0.1 0.0 -0.2
Computer and informat. -0.1 -0.5 -1.2 -0.2 -0.7 -1.5
Operational leasing -0.1 -0.7 -2.2 -0.4 -1.6 -3.2
Other 0.0 0.2 0.4 0.0 0.3 0.4
Income -1.7 -8.8 -20.5 -2.3 -10.5 -22.5
Interest -0.9 -5.7 -13.4 -0.9 -5.5 -13.7
Profits and dividends -0.8 -3.2 -7.3 -1.4 -5.1 -9.0
Compensation of emplo. 0.0 0.1 0.2 0.0 0.1 0.2
Current transfers 0.3 1.3 3.3 0.3 1.4 3.3
1/ Forecast.

�������������������������� �������
In the January–May 2005 period, gross international reservesrose US$7.8 billion, standing at US$60.7 billion at the end ofMay. Adjusted net international reserves increased US$11.7billion to US$39.2 billion. Taking advantage of the abundantsupply of dollars in the domestic market, particularly in thefirst quarter, the BCB acquired US$10.2 billion in the spotmarket. With respect to sovereign external operations, thehighlights were inflows of US$3.4 billion in government bondsand net expenditures of US$3.9 billion on external debtservice, particularly interest on bonds (US$2.6 billion); bondamortizations (US$945 million); interest payments to the IMF(US$626 million); and amortizations with the Paris Club(US$177 million), together with US$520 million in earningson reserves. Amortizations with the IMF totaled US$1.2billion and settlements of National Treasury currency marketpurchases closed at US$1.5 billion, while other operationsgenerated outlays of US$2.3 billion.
Projections for 2005 indicate gross reserves of US$57.7billion in December. Including the January through Mayperiod, forecasts point to payments of US$11.9 billion inexternal debt service, coupled with US$6.8 billion inamortizations with the IMF, disbursements of US$1.5 billionby international organizations and bond issuance totalingUS$4.5 billion. Settlements of BCB foreign exchangepurchases in the domestic market are projected at US$10.2billion, all of which were concentrated in the first quarter,while National Treasury settlements linked to external debtservice are forecast at US$9.5 billion. Net reserves areexpected to increase this year US$14.2 billion, to US$41.8billion (see box "Balance of Payments Projections").
��� !�������� ����������"��� �����
External sustainability indicators for the first quarter improvedconsiderably, due to increases in the dollar value of exportsand GDP, coupled with the reduction in external debt andthe accumulation of international reserves.
In the twelve months through March, debt service costsdropped 8%, compared to the corresponding period endedin March of last year. The value of exports rose 31%,reducing the ratio of debt service to exports from 70.9% to49.8%. Parallel to this, total external debt as a share ofGDP dropped from 40.4% to 32.1%, due to the 19.1%increase in the dollar value of GDP and the 5.4% reductionin total external debt from March 2004 to March 2005.
Table 5.7 – Financial account
US$ billion
2004 2005
May Jan- Year May Jan- Year1/
May May
Capital account -1.5 0.5 -7.7 -0.3 5.2 1.9
Direct investments 0.2 2.9 8.7 0.0 5.7 14.0
Abroad 0.0 -0.4 -9.5 -0.7 -1.6 -2.0
In Brazil 0.2 3.3 18.2 0.7 7.2 16.0
Equity capital 0.4 3.9 18.6 0.5 4.9 12.0
Intercompany loans -0.2 -0.5 -0.4 0.2 2.3 4.0
Portfolio investments -0.9 -3.1 -4.8 -0.4 2.3 -1.0
Assets -0.2 -0.3 -0.8 0.0 -1.0 -0.8
Liabilities -0.7 -2.7 -4.0 -0.3 3.2 -0.2
Derivatives -0.3 -0.2 -0.7 0.0 0.2 0.0
Other investments -0.6 0.8 -11.0 0.0 -3.0 -11.0
Assets -2.7 0.3 -2.2 -0.4 -1.9 -1.0
Liabilities 2.1 0.5 -8.8 0.4 -1.1 -10.1
1/ Forecast.
Table 5.8 – BP financing sources
Selected items
US$ billion
2004 2005
May Jan- Year May Jan- Year1/
May May
Medium and
long-term funds 0.7 5.8 14.8 0.7 5.6 13.8
Public bonds 0.0 1.5 5.7 0.5 3.4 4.5
Private debt securities 0.3 2.7 5.3 0.1 1.3 7.4
Direct loans 0.4 1.6 3.8 0.1 0.9 1.9
Short-term loans (net)2/ 1.2 -0.1 -1.2 0.2 2.1 0.0
Short-term securities (net) -0.1 -0.4 0.4 0.1 0.2 0.0
Roll-over rates
Private sector: 74% 98% 65% 24% 60% 70%
Debt securities 36% 80% 49% 12% 48% 70%
Direct loans 287% 156% 127% 77% 92% 70%
1/ Forecast.
2/ Includes direct loans and trade credits transferred by banks.

������������������ ���������������
The debt service/GDP ratio dropped from 10.4% to 8%.The ratio of total external debt to exports fell from 2.8 to 2.Net external debt, which represented 1.9 times the value ofexports for the last twelve-month period through March 2004,dropped to 1.3 in March of this year. As a share of GDP,net external debt dropped from 27.9% to 20.3%.
With the 20% increase in international reserves from March2004 to March 2005, the reserves to total debt indicatorclimbed from 24.2% to 30.7%, attesting the enhancedexternal solidity of the Brazilian economy.
��# � ����"
Even when one considers the rise in imports triggered by therecent surge in economic activity, trade balance performanceclearly supports projections of a strong 2005 trade surplus.This result, in turn, will make it possible to obtain a currentaccount surplus, albeit at a lower level than in 2004.
In the first five months of the year, the trade balanceregistered a surplus of US$15.6 billion and current transfersimproved sharply over the January through May 2004 result.Even with the upturn in the service and income deficits, thecurrent account surplus for the first five months of the yearwas almost twice the surplus obtained in the same period of2004. Cumulative twelve-month through May result showsthat the current account surplus totaled US$13.4 billion,equivalent to 2.06% of GDP, the second best result ever.
The turnaround in balance of payments financing needs asof 2003 was generated by the exceptional trade balanceperformance. Successive current account surpluses, addedto net foreign direct investment flows, shifted from 3.04%of GDP in the twelve-month period ended in May 2004 to5.45% of GDP in May 2005. The strong improvement inexternal accounts in the recent past will enable the increasein international reserves in the current year.
Successive strong trade surpluses, lower external debt,increased net foreign direct investment, and risinginternational reserves clearly strengthen Brazil’s externalposition. Coupled with positive flows in the foreign exchangemarket in the first five months of the year and recentsovereign bond issuance, no difficulties will be encounteredin financing the 2005 balance of payments.
Table 5.9 – International reserves
US$ billion
2004 2005
Jan- Year Jan- Year1/
May May
Reserve position in
previous period 49.3 49.3 52.9 52.9
Net Banco Central purchases 2.6 5.3 10.2 10.2
Debt servicing (net) -6.8 -12.6 -3.9 -11.9
Interest -2.7 -5.5 -2.7 -5.6
Credit 0.5 1.1 0.5 1.2
Debit -3.1 -6.6 -3.2 -6.8
Amortization -4.2 -7.1 -1.2 -6.2
Disbursements 1.5 6.7 3.4 6.0
Multilateral organizations 0.0 1.0 - 1.5
Sovereign bonds 1.5 5.7 3.4 4.5
International Monetary Fund -1.4 -4.4 -1.2 -6.8
Disbursement - - - -
Amortization -1.4 -4.4 -1.2 -6.8
Others2/ -1.2 1.2 -2.3 -2.3
Treasury's purchases 6.5 7.3 1.5 9.5
Change in assets 1.2 3.6 7.8 4.7
Gross reserve position 50.5 52.9 60.7 57.7
Net reserve position 24.5 27.5 39.2 41.8
1/ Forecast.
2/ Includes payments/receipts in the framework of the Reciprocal Credits and
Payments Agreement (CCR), fluctuations in prices of securities, exchange
parities and price of gold, discounts and premiums, duty fees and release
of collaterals.
Table 5.10 – Sustainability indicators
US$ billion
2003 2004 2005
Dec Mar Jun Sep Dec Mar
Exports 73.1 77.5 83.4 90.6 96.5 101.5
Debt service 53.0 54.9 55.8 56.5 51.9 50.5
Total external debt 214.9 213.5 205.6 202.2 201.4 201.9
Net external debt 151.0 147.5 145.4 141.1 135.7 127.8
International reserves 49.3 51.6 49.8 49.5 52.9 62.0
GDP 507 529 553 580 604 630
Indicators
Total external debt/GDP (%) 42.4 40.4 37.2 34.9 33.3 32.1
Net external debt/GDP (%) 29.8 27.9 26.3 24.3 22.5 20.3
Total external debt/exports 2.9 2.8 2.5 2.2 2.1 2.0
Net external debt/exports 2.1 1.9 1.7 1.6 1.4 1.3
Debt service/exports (%) 72.5 70.9 66.9 62.4 53.8 49.8
Reserves/total external debt (%) 22.9 24.2 24.2 24.5 26.3 30.7

�������������������������� ��������
$��� �����%�"�����%��&� ����
The balance of payments projections for the yearhave been updated in relation to the March InflationReport. This update involved incorporation ofchanges in the external debt position, recent exportsector results, and the evolution of profit and dividendremittances. Aside from this, the effects of the policyof rebuilding international reserves were alsoconsidered, as well as revised estimates forsettlements of National Treasury commitments in theforeign exchange market.
The current account surplus for 2005 was estimatedat US$4.6 billion (0.6% of GDP), considerably higherthan the previous projection of US$2.1 billion (0.3%of GDP). The increase in this forecast resulted fromthe large trade surplus registered in 2005 through Mayand expectations that these surpluses will continuethrough the end of the year.
In the first five months of 2005, cumulative exportstotaled US$43.5 billion, with a daily average of US$426million, 29.2% above the same period of 2004. Foreignexchange settlements linked to exports registered adaily average of US$439 million, up 17.1% comparingto the same period of last year. Aside from increasesin external prices of products of considerable weightin overall Brazilian exports, export volumes have alsoincreased steadily, at the same time in which bothproducts and markets have been diversified.Consequently, the projected value for 2005 exportshas been revised upward from US$105 billion toUS$108 billion. One should note that, in May 2005,the overall cumulative value of exports over theprevious twelve months stood at US$106 billion.
Projections for 2005 imports were maintained atUS$78 billion, for growth of 24.2% over the 2004
Table 1 – Uses and sources
US$ billion
2004 2005
May Jan- Year May Jan- Year1/
May May
Uses -0.3 -11.1 -21.6 -0.8 -4.6 -24.0
Current account 1.5 2.3 11.7 0.7 4.1 4.6
Amortizations ML-term2/ -1.8 -13.5 -33.3 -1.5 -8.8 -28.7
Securities -0.8 -7.6 -17.6 -0.6 -3.8 -16.2
Paid -0.8 -7.3 -16.4 -0.6 -3.8 -16.0
FDI conversions 0.0 -0.3 -1.2 0.0 -0.2 -0.2
Suppliers' credits -0.2 -1.0 -2.4 -0.1 -0.9 -1.9
Direct loans3/ -0.9 -4.9 -13.3 -0.8 -4.1 -10.6
Sources 0.3 11.1 21.6 0.8 4.6 24.0
Capital account 0.1 0.3 0.7 0.1 0.3 0.5
FDI 0.2 3.3 18.2 0.7 7.2 16.0
Domestic securities4/ -0.1 1.1 2.1 -0.4 1.9 4.0
ML-term disbursem.5/ 1.1 7.9 20.4 0.9 7.2 21.1
Securities 0.3 4.2 11.0 0.6 4.7 11.9
Supliers' credits 0.1 0.4 1.0 0.1 0.3 0.8
Loans6/ 0.7 3.2 8.4 0.3 2.2 8.4
Brazilian assets abroad -3.1 -0.3 -11.2 -1.0 -4.1 -3.3
Loans to Bacen 0.0 -1.4 -4.4 0.0 -1.2 -6.8
Other7/ 1.8 2.4 -2.0 0.7 3.4 -0.5
Reserve assets 0.3 -2.2 -2.2 -0.2 -10.1 -7.0
1/ Forecast.
2/ Registers amortization of medium and long-term supliers' credit, loans and
securities placed abroad minus refinancing and discounts. Excludes
amortizations referring to loans to International Monetary Fund (IMF) and
intercompany loans.
3/ Registers amortizations loans borrowed from foreign banks, buyers,
agencies and multilateral organizations.
4/ Includes foreign investment in equity and debt securities traded in the
domestic market.
5/ Excludes intercompany loans disbursements.
6/ Includes multilateral and bilateral financing and buyers' credits.
7/ Registers net values of bond swaps, short-term securities, short-term trade
credit, financial derivatives, nonresident deposits, other liabilites and errors &
omissions.

������������������� ���������������
result. Up to May, cumulative imports totaled US$27.8billion, with a daily average of US$272.8 million,23.4% more than in the same period of 2004. Theaverage daily value of financial settlements for importoperations increased 32%. With these forecasts forexports and imports, the trade balance should post asurplus of US$30 billion, US$3 billion more thanforecasted in the March Inflation Report.
Projections for the two major components of theincome account were also revised. Net interestpayments increased slightly, moving from US$13.6billion to US$13.7 billion. The underlying reason forthis revision was that the external debt outstandingin March was slightly revised upward in relation toDecember 2004. Projected net remittance of profitsand dividends increased from US$7.8 billion to US$9billion, reflecting the recent behavior of remittancesof earnings on direct investments.
The revised projection for the balance of paymentscapital account estimates a surplus of US$1.9 billion,instead of a deficit of US$6 billion, as banks set asideless assets abroad. This process is explained by netBCB purchases and by National Treasury acquisitionson the exchange market. To a lesser extent, thereversal in the capital account reflects the newestimate for amortizations, since calculation of thisfigure was based on the March external debt position.
Net foreign direct investment have been increasingsince the final quarter of 2004, reaching US$7.2 billionin the first five months of 2005. Despite this result,the projection for net foreign direct investment inflowsin the year was maintained at US$16 billion.
Medium and long-term amortizations were revisedfrom US$29.9 billion in the last Inflation Report toUS$28.7 billion, as a result of the amortization profilederived from the external debt position in March. Theassumptions of rolling over 70% of the external privatesector medium- and long-term debt were maintained.
Banking sector assets held abroad are expected todecline by US$1.5 billion, compared to an increaseof US$7.3 billion projected in March. The balance ofpayments result for the year is projected at a surplusof US$7 billion, compared to a deficit of US$3.7 billionestimated in March. These results were due as much

�������������������������� ��������
to net BCB purchases in the exchange market(US$10.2 billion in the first quarter of the year), asto settlement of National Treasury maturities for 2005through acquisitions of US$9.5 billion in the market,compared to US$2.5 billion previously estimated.These operations had the effect of reducing externalprivate sector assets.
In regard to National Treasury operations, aside fromthe US$4.5 billion for purposes of servicing therestructured debt in 2005 (Bradies, pre-Bradies andParis Club), as stated in the external sector pressrelease for the month of April, it is also forecast thatmaturities for the second half of the year, involvingbond principal and interest, will be settled withacquisitions in the exchange market (up to US$2.5billion and US$2.4 billion, respectively).
Table 2 – Balance of payments – Market
US$ billion
2004 2005
May Jan- Year May Jan- Year1/
May May
Current account 1.7 2.5 14.4 1.0 6.3 6.8
Capital (net) 0.7 -1.3 -10.6 -1.0 4.0 1.8
Foreign direct investment 0.2 3.3 18.2 0.7 7.2 16.0
Portfolio investment -0.1 1.1 2.2 -0.4 2.0 4.0
Medium and long term loans -0.4 -5.3 -13.5 -0.9 -3.8 -12.4
Trade credits – Short,
medium and long term 2.3 2.5 -2.3 0.7 1.2 -1.0
Banks 0.9 -1.3 -3.4 0.0 1.6 0.0
Other 1.3 3.8 1.2 0.7 -0.4 -1.0
Brazilian investment abroad -0.7 -1.7 -13.4 -1.0 -4.0 -4.8
Other -0.6 -1.2 -1.8 -0.1 1.3 0.0
Financial gap 2.4 1.2 3.9 0.0 10.3 8.7
Banco Central net interventions 0.0 -2.6 -5.3 0.0 -10.2 -10.2
Bank deposits -2.4 1.4 1.4 0.0 -0.1 1.5
1/ Forecast.
Table 3 – National Treasury – External debt services1/
US$ million
Maturity profile Maturity settlement
Amortization InterestTotal Market Reserves Total
2003 Year 4 743 5 221 9 965 5 507 4 458 9 965
2004 Year 6 951 5 403 12 354 7 335 5 020 12 354
20052/ 6 094 5 697 11 791 9 497 2 294 11 791
Jan 177 660 836 194 642 836
Feb 0 508 508 0 508 508
Mar 16 212 228 29 199 228
Apr 930 1 025 1 954 1 318 636 1 954
May 0 177 177 0 177 177
Jun3/ 823 213 1 036 ... ... ...
Jul 2 526 705 3 230 ... ... ...
Aug 0 401 401 ... ... ...
Sep 16 352 368 ... ... ...
Oct 930 1 035 1 965 ... ... ...
Nov 0 279 279 ... ... ...
Dec 678 131 809 ... ... ...
1/ Includes amortization and interest maturities related to Paris Club and bonds.
2/ The National Treasury may purchase foreign currency in the domestic
exchange market in order to pay principal and interest related to Paris Club,
Brady and pre-Brady bonds debt falling due between May and June 2005,
estimated at US$905 million, plus US$2,088 million falling due between July
and December 2005. The National Treasury may also purchase foreign currency
in order to pay principal and interest related to bonds falling due between
July and December 2005, estimated at US$ 4,963 million.
3/ As of June, forecast.

�������������������������� ��������
����������������
This chapter of the Inflation Report presents theCopom’s evaluation of the Brazilian economy sincerelease of the last Report, as well as the outlook for GDPgrowth in 2005 and inflation through 2006. The inflationprojections are presented under two main scenarios. Thebenchmark scenario assumes that the Selic rate willremain unchanged, at 19.75% p.a. (the rate decided atthe June Copom meeting), and that the exchange ratewill remain at the level prevailing on the eve of the JuneCopom meeting (R$/US$ 2.47). The market scenarioforecast uses the consensus interest and exchange ratetrajectories compiled by the BCB’s Investor RelationsGroup (Gerin) on the eve of the June Copom meeting.These scenarios are used only as tools to inform themonetary policy decision-making process, and theassumptions contained therein should not be viewed asthe Copom’s forecasts for the future behavior of interestor exchange rates.
The inflation and GDP growth forecasts published in thisReport are not point estimates. They incorporate probabilityintervals that reflect the degree of uncertainty present atthe moment in which the interest rate decision was taken.Inflation forecasts depend not only on interest and exchangerate assumptions, but also on assumptions regarding thebehavior of certain exogenous variables (those that arebeyond BCB control). The assumptions considered mostlikely by the Copom form the scenarios to which theCommittee attributes the greatest weight when makinginterest rate decisions. By presenting these assumptions,the Copom aims to enhance the transparency of monetarypolicy decision-making and thereby improve its ability tocontrol inflation, the Committee’s ultimate objective.

������������������� ���������������
��� �������� �����
Since publication of the March Inflation Report, economicactivity has expanded steadily, albeit at a somewhat slowerpace. Given the strong growth posted throughout 2004 andthe historically high activity levels, this accommodation wasexpected and is consistent with more sustainable economicgrowth. In the first quarter of 2005, GDP expanded 0.3% inseasonally adjusted quarter-on-quarter terms, and 2.9% inyear-on-year terms. As expected, the monetary tighteningcycle begun in September 2004 has affected economicactivity. Industrial output expanded a seasonally adjusted1.5% in March and remained stable in April, in line withleading and coincident indicators. Thus, industrial activityheld steady at a level near the historic high reached inDecember last year.
On the other hand, headline inflation remained relatively highin early-2005. Monthly IPCA inflation was in a range of 0.60%in the first quarter, rising to 0.87% in April and dropping backto 0.49% in May. Core inflation measures also followed thispattern. However, more recent data indicate a leveling off ofconsumer price inflation, suggesting a higher probability ofinflation convergence to the target path.
As stated in recent Inflation Reports and Copom Minutes,in an environment marked by a high level of installed capacityutilization, the inflation path will depend on the capacity ofcurrent and prospective supply increases to meet demandconditions. In regard to supply conditions, the recentslowdown in investment growth reflects a sharp drop in farmmachinery investment and a higher comparison base,following strong growth last year (when investment registeredthe strongest growth since 1994). Capital goods output postedcumulative growth of 13% in the twelve-month period endedin April. Though there would seem to be little likelihood thatthe recent leveling off of investment will persist over themedium term, the performance of aggregate supply in thecoming quarters will remain a source of concern with regardto inflation dynamics.
On the external front, improvements have occurred inrelation to the scenario considered in the last InflationReport, despite the continued volatility of internationalfinancial markets. Beginning in March, statements made byFederal Reserve officials regarding the United Statesinflation outlook and the potential mis-pricing of longer-termU.S. Treasuries led to an increase in the yield curve. Thisdevelopment, coupled with the credit quality downgrades of

�������������������������� ��������
certain large U.S. companies, had an adverse impact onemerging market bonds. However, after rising steadily earlierin the year, at end-May U.S. Treasury yields (particularlythe 10-year note) hit lows not seen since April 2004 (priorto the beginning of the U.S. monetary tightening cycle). Atthe same time, the impact from the U.S. corporate creditdowngrades seems to have been at least partially absorbed.
In Brazil, these developments were initially accompanied byan increase in sovereign risk and, following a pattern observedin other emerging markets, local currency depreciation.Recently, however, the international financial marketenvironment has improved and movements in Brazil’s countryrisk and exchange rate have been reversed. Nevertheless,liquidity conditions and market stability remain tied tomacroeconomic developments in the industrialized countries,particularly the United States, and on the Federal Reserve’spotential monetary policy response to those conditions. Anadditional point of concern is the external account imbalancesin some of the major economies, and the possibility thateventual adjustments will result in significant currencymovements. Despite these concerns, about which there is asignificant degree of uncertainty, the Copom continues toassign a low probability to a significant deterioration ininternational financial markets.
Following a decline at the end of 2004, oil prices haveremained high and volatile. After reaching record highs atthe end of March and early-April, prices dropped throughmid-May, only to rise again in recent weeks. Not only is thisthe potentially most adverse external factor, it also representsa greater risk to the future inflation path than initiallyevaluated in the March Inflation Report.
Given this environment, in the April-June period the Copomcontinued the monetary tightening process begun lastSeptember. The Selic rate was raised by 0.25 p.p. in bothApril and May and, in June, held at 19.75% p.a.
Over the first five months of the year, cumulative IPCAinflation was 3.18%. In May, regulated and market priceinflation rose 0.25% and 0.59%, respectively, both of whichwere below April levels. The increase in tradable goods prices,0.72%, exceeded the monthly average for the first four monthsof the year, while non-tradable goods prices rose 0.43%, thelowest increase since November.
In the twelve-months through May 2004, IPCA inflation was5.15%, with market and regulated price inflation of 5.34%and 4.69%, respectively. In the twelve-months through May

������������������� ���������������
2005, IPCA inflation stood at 8.05%, with increases of 6.47%and 12.01% for market and regulated prices, respectively.“Vehicle fuel” contributed, individually, 1.12 p.p. tocumulative inflation in the period.
After accelerating in the second half of 2004, core IPCAinflation under the three measures monitored by the Copom– by exclusion of household food and regulated prices andtrimmed means (smoothed and non-smoothed) – stabilizedin early 2005 and declined in May. However, twelve-monthcumulative core inflation measures remain high and abovelevels compatible with the inflation target path.
IGP-DI inflation rose in March after decelerating early inthe year, nearly doubling in the month, to 0.99%. Starting inthe second quarter, however, IGP-DI inflation decelerated to0.51% in April and -0.25% in May. These figuresapproximately mirrored the behavior of wholesale prices,which increased 1.14% in March (as a result of risingagricultural prices caused by the drought in Southern Brazil).In May, however, the IPA posted -0.98%. More recent dataindicate that the decline in agricultural wholesale prices hasslowed, while the drop in industrial wholesale prices hasaccelerated. In any case, there is increasing evidence thatwholesale prices in general have leveled off. As stated in recentCopom Minutes, the slowdown in IPA inflation is, to someextent, a consequence of exchange rate appreciation and theeffects of monetary policy, and could have positive spilloverson future consumer price inflation. The intensity of this pass-through will depend on prospective demand conditions andprice-setters’ expectations for the future inflation path.
Until end-May, market inflation expectations had remainedlargely unaffected by favorable developments that could coolinflationary pressures, such as signs of accommodation inthe pace of economic growth, downward movement inwholesale industrial prices, improved market expectationsfor the exchange rate path, and the more restrictive monetarypolicy stance. By mid-March, IPCA inflation expectationsfor 2005 had risen slightly to 5.77%, mainly in response tohigher-than-expected increases in several regulated prices anda less favorable international scenario. At the time of theApril and May Copom meetings, IPCA inflation expectationsfor 2005 had deteriorated further, to 6.10% and 6.39%,respectively. In mid-June, IPCA expectations have fallen to6.12%. Expectations for twelve-month ahead IPCA have alsofallen, but at a more rapid pace than that of 2005 expectations.On the other hand, since publication of the March InflationReport, market IPCA expectations for 2006 have remainedstable. These factors suggest that the monetary policy stance
Graph 6.1 – Inflation target path and market expectations
for twelve-month ahead inflation
0
2
4
6
8
10
12
Mar2003
Jun Sep Dec Mar Jun Sep Dec Mar Jun
(%)
Target path Market expectations

�������������������������� ��������
has not only dampened short-term inflationary pressures,but has also contributed to the consolidation of a morefavorable longer-term macroeconomic environment.
Based on revised IBGE figures, cumulative 2004 GDPexpanded 4.9%. The sectors that posted the strongestperformance were industry, growing 6.2%, and crop/livestockfarming, up 5.3%. The services sector grew 3.3%, comparedto 3.7% before the figures were revised. In quarter-on-quarter,seasonally adjusted terms, GDP grew 0.3% in the first quarterof 2005. This result confirms the trend toward a more gradualpace of economic growth, after eight consecutive quarters ofexpansion that brought economic activity to record levels.Growth was driven by the crop/livestock sector, up 2.6%,while industry and services fell 1% and 0.2%, respectively.Leading indicators of economic activity and the progressiveconsolidation of the monetary tightening process suggest thatthe pace of economic growth will begin to accelerate in thecoming quarters.
When the March Inflation Report was published, industrialproduction indicators were sending mixed signals on longer-term trends, with positive growth in December and declinesin November and January. This uneven behavior persisted inmore recent data, with a drop in February industrial output,followed by a March spike and stability in April. The morestable industrial production quarterly moving average showedstabilization in April, at a high level - 6.3% above the sameperiod in 2004, with 22 of the 26 sectors surveyed registeringpositive performance and consumer goods production leadinggrowth. In cumulative 2005 terms, industrial output expanded4.5% through April, with positive performances in 20 of the26 sectors surveyed, 55 of the 76 subsectors and all usecategories led, once again, by consumer goods output. In thetwelve-month period ended in April, cumulative growth cameto 7.5%. Again, consumer durables were the highlights,followed by capital goods, with respective growth of 19.2%and 13.0%.
The more moderate pace of first quarter 2005 growth wasevident in the domestic demand components as shown in theNational Accounts. Compared to the fourth quarter of 2004,seasonally adjusted data indicate declines of 3% in gross fixedcapital formation and 0.6% in household consumption.Investment declined for the second consecutive quarter,following five uninterrupted quarters of growth starting inmid-2003. In turn, household consumption declined followingsix consecutive quarters of growth. Net export growthconfirmed the heightened importance of external demand asone of the underlying factors of GDP growth this year.

������������������� ���������������
In April, retail sales fell 0.2% (seasonally adjusted), followinggrowth in March and contraction in February. Similar toindustrial output, the quarterly moving average for salesseems to have plateaued in recent months, following a periodof strong growth dating to mid-2003.
The historically high levels of activity have been reflected inpositive labor market results in recent quarters. Accordingto IBGE, the unemployment rate was 10.8% in March andApril, below typical seasonal levels, before dropping furtherto 10.2% in May. This rate is 2 p.p. below the figure for thesame month of 2004. The number of persons employedexpanded 3.8% in the six main metropolitan regions,compared to the same month of last year. Average realearnings of employed individuals were equivalent to that ofMay last year. Based on CNI data seasonally adjusted by theBCB, overall real wages in the manufacturing sector movedsideways in April compared to March, with growth of 8.7%compared to April 2004.
Formal employment calculated by the Ministry of Labor andEmployment (MTE) continues to expand. The creation of266,000 new positions reflected the highest growth for themonth of April since the series was first published. In May,the pace of hiring remained strong, at 212,000 new hires. Withthese results, 1.5 million new positions were created over thelast twelve months. As stated in the March and DecemberInflation Reports, as well as in recent Copom Minutes,favorable labor market developments have helped to sustainongoing aggregate growth in industrial output and retail sales.
The strong growth and subsequent moderation of both retailsales and production are reflected in the level of installedindustrial capacity utilization. According to FGV data seasonallyadjusted by the BCB, capacity utilization reached 84.47% inApril, a slight reduction compared to the 84.62% registered inJanuary. In turn, CNI data seasonally adjusted by the BCB showsthat installed capacity utilization in the manufacturing sectordropped 1.1 p.p. in the year, to 81.8% in April.
In light of high industrial output and installed capacityutilization levels, the monitoring of investment levels hasbecome important to avoiding a surge in inflationarypressures. According to the IBGE, there was a 3% quarter-on-quarter decline in gross fixed capital formation in the firstquarter of 2005, but a 2.3% year-on-year increase. Capitalgoods absorption in April is estimated to have postedcumulative growth of 1.8% in the year, compared to the sameperiod of last year. As already mentioned, the slowdown ingrowth at the margin mainly reflects the sharp drop in farm

�������������������������� �������
equipment investment, as well as the very high comparisonbase following strong investment expansion throughout 2004(at the fastest pace since 1994). In turn, capital goods outputgrew 13% in the twelve-month period that ended in April.
Since investment is highly correlated with installed capacityand – with a somewhat longer lag – with sovereign risk, thebehavior of these leading indicators suggests an upswing ininvestment in the coming months. Until this occurs, theuncertainties cited in recent Copom Minutes and InflationReports will persist, regarding the pace of the near-termexpansion in productive capacity and path of the economy’slonger-term potential growth. Despite the recentaccommodation in the pace of growth, monetary policy mustremain vigilant to ensure that demand does not outpacesupply, so as avoid significant inflationary pressures.
��� ���������������������������� �����
The Copom’s projections are based on a set of assumptionsregarding the behavior of key economic variables. Theseassumptions and the associated risks form the baseline scenarioon which the Committee bases its decision-making process.
The risks to inflation dynamics identified in the March issueof the Inflation Report are still present, though improvementshave occurred on both the domestic and external fronts.Domestically, the main risks included uncertainties regardingthe expansion of productive capacity to meet growing demandfor goods and services and the behavior of market inflationexpectations. On the external front, the main risks includerising international oil prices and external account imbalancesof several major world economies.
Since the March Report was issued, the economy hascontinued to expand, albeit at a slower pace than in 2004, asexpected. The leveling off evident since the fourth quarter of2004 marks a transition to a more sustainable rate of growth,following the strong upturn in economic activity that beganin the second quarter of 2003. Therefore, there is a higherprobability that demand will not generate undue inflationarypressures and thereby hamper the recovery in real incomes.To the extent that the effects of the monetary tightening begunin September 2004 are consolidating, one can expect aprogressive acceleration in the pace of economic expansion.Early evidence can be found in the fact that the second quarter

������������������ ���������������
of 2005 might register growth slightly above that of theprevious quarter.
As mentioned in previous Inflation Reports, price dynamicsare affected by, among other factors, potential imbalancesbetween aggregate supply and demand. Analysis of quarterlyFGV data points to a slight drop in average installed industrialcapacity utilization between January and April. On a sector-by-sector basis, one important factor in evaluating potentialgrowth is the level of capital goods capacity utilization, whichhas been significantly higher when compared to the historicaverage. Capital goods absorption indicates that, despite highaggregate levels of capacity utilization, there is still roomfor the economy’s productive capacity to expand at a pacecompatible with minimization of additional risks to monetarypolicy implementation.
Though still high in relation to the inflation target path,market inflation expectations are now being more heavilyinfluenced by positive developments, and may wellcontribute to mitigating inflationary pressures in thecoming months. After increasing sharply since March andpeaking in May, inflation expectations for 2005 have beendropping in recent weeks. Expectations for 2006 remainstable. Expectations for twelve-month ahead inflation showunmistakable signs of a downward shift (see box:“Inflation Expectations for the Next Twelve Months”).Here, it is important to stress that 12-month aheadprojections are subject to less uncertainty than thoseavailable for calendar year 2006. These developmentssuggest that the monetary stance adopted since September2004 has not only contained short-term inflationarypressures, but has also contributed to the consolidation ofa more favorable longer-term macroeconomicenvironment. In order for inflation to converge to the targetpath with the least possible reduction in economic activity,it is essential that expectations continue converging towardthe inflation target path.
The latent risk of industrial prices to consumer price inflationhas diminished since the March Inflation Report. Followinga spike in April, industrial wholesale prices registereddeflation in May and a cumulative increase of 1.34% in 2005through May. To some extent, subdued wholesale industrialprice inflation reflects recent currency appreciation and theimpact of monetary policy and could have beneficial effectson future consumer price inflation. In much the same way,wholesale agriculture price inflation turned negative in Mayfor the third time this year, with cumulative deflation of 0.23%in 2005. The intensity of the pass-through of wholesale

�������������������������� ��������
inflation to consumer price inflation will depend onprospective demand conditions and price setters’ expectationsregarding the future inflation path.
In recent months, the Copom has cited specific factorsamong the uncertainties that normally surroundmacroeconomic projection exercises and that could hinderthe process of inflation convergence to the target path.However, compared to the March Inflation Report, theCopom identified a reduction in the risks to which theprocess of convergence is subject. This analysis is supportedby both inflation at the margin and twelve-month aheadprojections. The effects of the monetary tightening are nowbeing transmitted to current inflation results, as well asforward-looking inflation projections. Economic activitycontinues to expand, though at a slower pace that is morecompatible with supply conditions.
As previously mentioned, despite continued internationalfinancial market volatility, the external environment hasimproved vis-à-vis the scenario in March. The shocksgenerated by the increase in the U.S. Treasury yield curveand the credit downgrades of major U.S. corporates seemto have been at least partially absorbed, contributing to areduction in Brazilian country risk and local currencyappreciation. However, liquidity conditions and marketstability remain dependent on the macroeconomic conditionsin the industrialized countries, particularly the U.S., andon the Federal Reserve’s potential monetary policy responseto those conditions. An additional source of concern is theexternal account imbalances in some of the majoreconomies, and the possibility that eventual adjustmentscould result in significant currency movements.Notwithstanding these uncertainties, the Copom continuesto assign a low probability to the significant deteriorationin international financial market conditions.
After falling in mid-May, international oil prices have reversedcourse in recent weeks. The significant uncertaintiessurrounding oil price projections are currently centered onthe scope and persistence of recent price shifts. This has ledthe Copom to maintain its baseline assumption that therewill be no changes in domestic fuel prices in 2005. However,while recent international oil price increases have nottranslated into domestic fuel price increases, internationaloil price trends continue to represent a risk to the futureinflation path via the potential effects on oil-intensive productsas well as private sector inflation expectations. This downsiderisk in the external environment has come to represent, at themargin, a growing risk to the future inflation path.

������������������� ���������������
The benchmark scenario assumes a 7.3% increase inregulated prices in 2005, 0.4 p.p. above the 6.9% increaseprojected in the March Inflation Report. There is no changeprojected for gasoline and bottled gas prices in 2005, in linewith the March forecast. Projections for other regulated pricesin the current year point to increases of 8.6% for fixedtelephone rates and 10.8% for household electricity. Theprojected increase for all regulated prices for 2006 wasrevised upward by 0.6 p.p., to 5.7% from 5.1%. This revisionwas based on the fact that several increases in regulated pricesfor 2005 have already been implemented, thus making itpossible to project individual increases for the coming yearmore precisely. For other items, projections for 2006 continueto follow the model of endogenous determination, which takesinto account seasonal factors, the exchange rate, market priceinflation, and the change in the IGP.
The benchmark scenario also assumes maintenance of theSelic rate at 19.75% p.a., the target defined by Copom at itsJune meeting, and the exchange rate at R$/US$ 2.47. Theprocedure of maintaining constant interest and exchange ratesis standard practice in Copom simulations. The benchmarkscenario is compatible with a six-month spread of 19 basispoints over the Selic rate in the fourth quarter of 2005 and40 basis points for the same period of 2006.
The robust balance of payments is reflected in the exchangerate trajectory under the market scenario. Market participantexchange rate projections stand at R$/US$ 2.64 for the fourthquarter of 2005 and R$/US$ 2.84 for the fourth quarter of2006, both of which are lower than the figures stated in theMarch Report (R$/US$ 2.78 and R$/US$ 2.97, respectively).At the same time, market participants adjusted theirprojections for the monetary policy path, raising theirprojections for the Selic rate from 17.42% to 18.50% for thefourth quarter of 2005 and from 15.13% to 15.60% for thefourth quarter of 2006. These new figures result in projectedspreads for 180-day swaps of 2 basis points and -277 basispoints in the fourth quarters of 2005 and 2006, respectively.The expected increases in regulated prices in the marketscenario stands at 8.3% for 2005 and 6.4% for 2006.
With regard to fiscal policy, the results through May 2005support expectations for compliance with the 2005-2007consolidated public sector primary surplus targets.

�������������������������� ��������
��� ����������������
Based on the assumptions discussed above, the associatedrisks and available information, projections were constructedfor cumulative four-quarter IPCA inflation, based on theinterest and exchange rate paths used in the benchmark andmarket scenarios. The benchmark scenario assumes that theSelic rate will be unchanged at 19.75% p.a., and that theexchange rate will remain constant at R$/US$ 2.47. Basedon market expectations collected by Gerin, the marketscenario indicates an average Selic rate of 19.67% p.a. inthe third quarter of 2005, dropping to 18.50% p.a. in thefourth quarter of 2005 and 15.60% p.a. at the end of 2006.This scenario also assumes local currency depreciation froman average of R$/US$ 2.54 in the third quarter of 2005 toR$/US$ 2.64 and R$/US$ 2.84 in the fourth quarters of 2005and 2006, respectively.
The central forecast in the benchmark scenario showsdownward movement in cumulative four-quarter inflationduring 2005, shifting from 7.5% in the second quarter to5.8% at the end of the year. The latter figure is above theCopom’s 5.1% objective. The downward inflation path isprimarily a consequence of the effects of the recent monetarytightening. Table 6.1 shows that the sharpest drop in thisprojection occurs between the third and fourth quarters ofthe year, when cumulative four-quarter inflation drops 1 p.p.(from 6.8% to 5.8%), as a result of the substitution of 2004fourth quarter inflation (2%) with a lesser value (1.03%) inthe same period of 2005. According to the benchmarkscenario, as demonstrated by the confidence interval in thetable, the probability of surpassing the upper limit of thetolerance interval for the 2005 inflation target isapproximately 23% or slightly less than the 24% presentedin the March Inflation Report. Inflation projections for 2006also point to a downward trajectory, with four-quartercumulative inflation starting the year at 5.2% and droppingto 3.7% in the final quarter, thus closing the year below thecentral inflation target for 2006 (4.5%).
Since the market scenario incorporates falling interest ratesand exchange rate depreciation throughout the forecasthorizon, inflation projections were higher than those underthe benchmark scenario. Projections for cumulative inflationin both 2005 and 2006, 6.3% and 4.7%, respectively, wereabove the central inflation targets. Just as in the benchmarkscenario, cumulative four-quarter inflation in the marketscenario indicates a downward though less intense trend overtime. The probability of exceeding the upper tolerance limit
Graph 6.3 – Forecasted IPCA-inflation with market
expected interest and exchange rates
Inflation fan chart
-202468
1012141618
I2003
II III IV I2004
II III IV I2005
II III IV I2006
II III IV
(%)
Note: Accumulated inflation in 12 months (% p.a.).
Graph 6.2 – Forecasted IPCA-inflation with interest
rate constant at 19.75 p.a. (Benchmark scenario)
Inflation fan chart
Note: Accumulated inflation in 12 months (% p.a.).
-2
0
2
4
6
8
10
12
14
16
18
I2003
II III IV I2004
II III IV I2005
II III IV I2006
II III IV
(%)
Table 6.1 – IPCA-inflation with interest rate constant at 19.75% p.a.(Benchmark scenario)
Year Q Central
projection
2005 2 7.2 7.3 7.5 7.6 7.7 7.9 7.5
2005 3 6.1 6.4 6.7 7.0 7.2 7.5 6.8
2005 4 4.7 5.2 5.6 6.0 6.4 6.9 5.8
2006 1 3.7 4.3 4.9 5.4 6.0 6.6 5.2
2006 2 2.9 3.6 4.3 4.9 5.5 6.3 4.6
2006 3 2.1 2.9 3.7 4.4 5.1 5.9 4.0
2006 4 1.7 2.6 3.4 4.1 4.9 5.8 3.7
Note: accumulated inflation in 12 months (% p.a.).
Confidence interval
10%
30%
50%
Table 6.2 – IPCA-inflation with market expected
interest and exchange rates1/
Year Q Central
projection
2005 2 7.2 7.3 7.5 7.6 7.7 7.9 7.5
2005 3 6.4 6.7 7.0 7.3 7.5 7.9 7.1
2005 4 5.3 5.7 6.1 6.5 7.0 7.4 6.3
2006 1 4.4 5.0 5.5 6.1 6.6 7.2 5.8
2006 2 3.7 4.4 5.1 5.7 6.4 7.1 5.4
2006 3 3.1 3.9 4.7 5.4 6.1 6.9 5.0
2006 4 2.7 3.6 4.4 5.1 5.9 6.8 4.7
Confidence intervals
10%
30%
50%
Note: Accumulated inflation in 12 months (% p.a.)1/ According to Gerin.

������������������� ���������������
for 2005 inflation is greater than in the benchmark scenario(approximately 34%) and slightly higher than the 33%estimated in March.
As described in section 6.2, the benchmark scenario assumesregulated price inflation of 7.3% in 2005, as compared to8.3% in the market scenario. For 2006, the benchmarkscenario assumes cumulative regulated price inflation of5.7%, while the market scenario indicates 6.4% based on themodel of endogenous determination.
Comparison of the trajectories presented in this InflationReport with those published in March (see the centralprojections in Table 6.3) show an increase in projections ofcumulative inflation for 2005 in both scenarios and a slightreduction for 2006. In March, the benchmark and the marketscenarios indicated a gradual reduction in inflation, closing2005 with cumulative levels of 5.5% and 6.1%, respectively.Though similar to the trajectory presented in March, currentprojections for 2005 inflation (5.8% in the benchmarkscenario and 6.3% in the market scenario) increased. Thisincrease resulted primarily from two sources: i) inflation inthe March-May period above that forecasted in the MarchReport; and ii) upward revisions to regulated price inflationfor the year, more than offsetting the impacts of increasesin real interest rates and exchange rate appreciation on theinflation projection. As far as cumulative inflation for 2006is concerned, the benchmark scenario and the marketscenario registered a reduction of 0.1 p.p., basically due tothe impact of higher real interest rates and stronger nominalcurrency appreciation on inflation projections. These factorsmore than offset the upward revision to projected regulatedprice increases in 2006.
Chart 6.4 shows the evolution of cumulative inflation in thelast twelve months according to the benchmark and marketscenarios, as well as the inflation path interpolated from the2003 and 2004 targets, the 5.1% objective adopted by BCBfor 2005 inflation and the 2006 target. Through May 2005,the values refer to twelve-month cumulative inflation. As ofJune, the trajectories are based on the sum of cumulativeinflation up to May plus projections as of that month.According to the benchmark scenario, cumulative inflationis above the target path through early 2006, only droppingbelow this path as of the second quarter of the year. In themarket scenario, cumulative inflation remains above thetarget path through the end of 2006, notwithstanding theoverall shift downward.
Graph 6.4 – Forecast and target paths for twelve-month
cumulative inflation
2
3
4
5
6
7
8
9
Apr2004
Jun Aug Oct Dec Feb2005
Apr Jun Aug Oct Dec Feb2006
Apr Jun Aug Oct Dec
(%)
Target Market scenario
Benchmark scenario
PeriodBenchmark
scenarioMarket
scenario
2005 I 7.5 7.5
2005 II 7.2 7.3
2005 III 6.5 6.9
2005 IV 5.5 6.1
2006 I 5.0 5.6
2006 II 4.6 5.3
2006 III 4.1 4.9
2006 IV 3.8 4.8
Table 6.3 – March 2005 Inflation Report forecast

�������������������������� ��������
The output growth fan chart at the left is constructed basedon benchmark scenario assumptions. It should be stressedthat forecasting errors resulting from GDP growth projectionsare significantly greater than in the case of inflationprojections, since the model used in the projections workswith a breakdown of output into two components that arenot directly observable – potential output and the output gap.At the same time, measurement of output levels is a muchmore complex and less precise task than measuring inflation.According to the benchmark scenario, the GDP growthforecast for 2005 is 3.4%, 0.6 p.p. below the level projectedin March, for the reasons explained in the box “Outlook for2005 GDP”, in chapter 1.
Graph 6.5 – GDP growth with interest rate constant
at 19.75% p.a. (Benchmark scenario)
Output fan chart
-5
-3
-1
1
3
5
7
9
11
I2003
II III IV I2004
II III IV I2005
II III IV
(%)

������������������� ���������������
������������ ��� ���������!"�������
The calculation period for twelve-month aheadinflation expectation, published every Monday in theMarket Readout, is automatically altered every timea new monthly price index is disclosed. At thatmoment, the calculation period moves forward onecalendar month; while the month for which the priceindex was published is eliminated, the equivalentmonth of the following year is included. Thus, theseries of twelve-month ahead inflation expectationstypically presents discontinuities on the days on whichinflation rates are published, caused by the differencebetween the expected inflation for the monthincirporated into the series and that for the eliminatedmonth, as observed in Graph 1, referring to the IPCAmedian expectations.
In order to diminish the impact of each discontinuityon the twelve-month ahead expected inflation trend,one alternative in each period between the day ofpublication of the month’s price index and the dayprior to publication of the next index is to aggregateinto the measure the difference between expectedinflation for the 13th month forward (the next monthto be incorporated into the twelve-month calculation)and for the month to be eliminated from thecalculation, weighted by the number of days elapsedin the period. Consequently, the smoothed inflationexpectation for the next twelve months would be:
in which, for the period between the day of publicationof the most recent inflation index up to the day priorto publication of the next index, for each institutionin the survey:
100*)1)))100
)(1/()
100
)(1((*)
100
)(1((()(' )/(11312
12 −+++= ndpndemmmm
dEdEdEdE
Graph 1 – IPCA – Median of expectations for the
next twelve months
% p.a.
5.0
5.2
5.4
5.6
5.8
6.0
6.2
6.4
6.6
Jul2004
Jul Aug Sep Oct Nov Dec Jan2005
Jan Feb Mar Apr May Jun

�������������������������� ��������
d: current day;E’
12m(d): smoothed inflation expectation for the next
twelve months;E
12m(d): inflation expectation for the next twelve
months;ndp: total number of days in period;nde: number of days elapsed in period, nde=1,2,..., ndp;E
m13(d): expectation, on d, of inflation for the 13th
month forward;E
m1(d): expectation, on d, of inflation on the month to
be eliminated from the calculation.
In the case of a positive (negative) difference betweenthe median/average expectations of the 13th monthforward and the month to be eliminated, the smoothedexpectations for the next twelve months will be alteredpositively (negatively) and proportionately to thenumber of days elapsed in the period. The result is asmoothed series, with a clear underlying trend, withoutthe “steps” in the original series, as shown in the Graph2, for the IPCA.
The same exercise applied to the IGP-DI, IGP-M andthe IPC-Fipe leads to the results shown alongside.
Graph 2 – IPCA – Median of expectations for the
next twelve months
% p.a.
5.0
5.2
5.4
5.6
5.8
6.0
6.2
6.4
6.6
Jul2004
Jul Aug Sep Oct Nov Nov Dec Jan2005
Feb Mar Apr Apr May
12m 12m smoothed
Graph 3 – IGP-DI – Median of expectations for the
next twelve months
% p.a.
5.0
5.5
6.0
6.5
7.0
7.5
Jul2004
Jul Aug Sep Oct Nov Nov Dec Jan2005
Feb Mar Apr Apr May
12m 12m smoothed
Graph 4 – IGP-M – Median of expectations for the
next twelve months
% p.a.
5.4
5.8
6.2
6.6
7.0
7.4
7.8
Jul2004
Jul Aug Sep Oct Nov Nov Dec Jan2005
Feb Mar Apr Apr May
12m 12m smoothed
Graph 5 – IPC-Fipe – Median of expectations for the
next twelve months
% p.a.
5.1
5.3
5.5
5.7
5.9
6.1
6.3
Jul2004
Jul Aug Sep Oct Nov Nov Dec Jan2005
Feb Mar Apr Apr May
12m 12m smoothed

������������������� ���������������
�����������!"����������������������#��#
This box describes international experience with inflationtargeting regimes and is aimed at identifying othercountry cases against which the Brazilian experiencecan be compared and more effectively evaluated.
With the collapse of the Bretton Woods internationalfinancial arrangement and the oil shocks of the 1970s,central banks around the world sought new ways toimplement monetary policy and more effectivelyensure price stability. In December 1989, the NewZealand Parliament approved implementation of aninflationtargeting regime. From the very start, NewZealand’s experience was based on three fundamentalprinciples: 1) definition of a numerical inflation targetto be pursued; 2) definition of the temporal horizonfor compliance with that target; and 3) commitmentto compliance with the target and transparency. Thesethree pillars made it possible for economic agents andthe general public to better understand monetarypolicy goals and instruments, thus greatly reducingimplementation costs.
Since its introduction in New Zealand to the present,22 countries have explicitly adopted inflationtargeting regimes: Chile and Canada in 1991; Israeland the UK in 1992; Australia, Finland and Swedenin 1993; Mexico and Spain in 1995; the CzechRepublic and South Korea in 1998; Brazil, Colombiaand Poland in 1999; South Africa and Thailand in2000; Iceland, Hungary and Norway in 2001; andPeru and the Philippines in 2002. The EuropeanCentral Bank and Switzerland adopted variants ofinflation targeting regimes in 1998 and 2000,respectively. In 2002, Turkey began a transition toinflation targeting, which is to be explicitly adoptedin early 2006. Aside from these cases, 39 othercountries are evaluating the possibility of

�������������������������� �������
implementing inflation targeting frameworks as amechanism for conducting monetary policy.
In the inflation targeting regime, an important issueis the specification of the inflation measure: aconsumer price index, which can be very volatile andinvolve additional difficulties for monetary policydecision-making, or a core inflation measure thatpurges variations in highly volatile prices, but thatcan also generate less confidence on the part of thepublic regarding compliance with the target.
Among the countries that pioneered this framework,there was a general tendency to adopt a core inflationmeasure. More recently, new inflation targeters havetended to use headline consumer price indices, in orderto make monetary policy more transparent. Even someof the countries that initially opted for core measureshave migrated to headline inflation indices, includingNew Zealand, Canada, Australia and the CzechRepublic. Currently, only South Africa, South Koreaand Thailand use some type of core target.
In defining numerical targets, most countries optedfor a point target with a tolerance interval (forinstance, a central target of 2% with a tolerance ofmore or less one percentage point). Other countriesadopted an interval (for example, an inflation targetbetween 1% and 3% or below 2%).
Several countries implemented inflation targetingregimes in environments of high inflation as a strategyto disinflate the economy. In contrast, other countriesdecided to use fixed targets from the start. Amongthe countries that adopted declining targets wereBrazil, Chile, Colombia, Israel, Mexico, Poland, theCzech Republic, South Korea, Hungary and Turkey.Today, most countries set inflation targets between1% and 3%, independently of the tolerance interval.Exceptions are South Africa (3% to 6%), Brazil (4.5%+/-2.5% in 2005, with the tolerance interval narrowingto 2% in 2006), Colombia (5% +/- 0.5), the CzechRepublic (2% to 4%), South Korea (2.5% to 3.5%),the Philippines (4% to 5%), Hungary (4% +/- 1%),Thailand (0% to 3.5%) and Turkey (8%).
Various countries established annual inflation targets,while others sought medium-term targets and stillothers established undetermined periods of time. In

������������������ ���������������
general, countries that introduced the regime in highinflation environments tended to adopt annual targets,since this choice has important advantages inconducting the disinflation process. As inflationconverged to the targets, most of these countrieslengthened their target horizons. Chile, Colombia,South Korea, Israel, Mexico, Poland and the CzechRepublic followed this approach.
Currently, Australia, Canada, Chile, Norway, Poland,South Korea and the European Central Bank definetargets for a medium-term horizon, consistent withtheir economic cycles. South Africa, Iceland, Israel,Mexico, New Zealand, Peru, the UK, the CzechRepublic, Sweden, Switzerland and Thailand adopttargets for an undefined horizon, while Brazil,Colombia, the Philippines, Hungary and Turkeymaintain annual targets.
At the outset, most countries verified compliance withtheir targets in December of each year. This is still donein Brazil, Colombia, Hungary, Peru, the Czech Republicand Turkey. As target horizons were being lengthened,there was also a trend to converge toward a continuousassessment of compliance. International literatureindicates that continuous assessment tends to enhancemonetary policy credibility. Together with the fact of asix to twelve month lag in the monetary policytransmission mechanism, that evidence has driven mostcountries to adopt continuous target assessment.
Several countries have imposed legal demands on theirmonetary authorities if they do not comply with thetargets. These countries include Brazil, Iceland,Norway, New Zealand, Poland, the UK and Thailand.In these countries, the central bank must issue a publicreport stating the reasons for noncompliance with thetarget, the measures required to bring inflation backto target and their expected timing. In exceptionalcases, usually associated with important supplyshocks or natural catastrophes, some countries likethe Philippines, the Czech Republic and Switzerlandapply escape clauses.

�������������������������� ��������
��� �
�������������$��������#�������������%�&���%'������('����)
Date: March 15th, from 4:29PM to 6:53PM, andMarch 16th, from 4:43PM to 7:03PMPlace: BCB’s Headquarters meeting rooms – 8th
floor on March 15th and 20th floor on March 16th –Brasília – DF
In attendance:Members of the CommitteeHenrique de Campos Meirelles – GovernorAfonso Sant’Anna BevilaquaAlexandre SchwartsmanAntônio Gustavo Matos do ValeEduardo Henrique de Mello Motta LoyoJoão Antônio Fleury TeixeiraPaulo Sérgio CavalheiroRodrigo Telles da Rocha AzevedoSérgio Darcy da Silva Alves
Department Heads (present on March 15th)Altamir Lopes – Economic DepartmentAndré Minella – Research Department (also presenton March 16th)João Henrique de Paula Freitas Simão – OpenMarket Operations DepartmentJosé Antônio Marciano – Department of BankingOperations and Payments SystemJosé Pedro Ramos Fachada Martins da Silva –Investor Relations GroupRenato Jansson Rosek – International ReservesOperations Department
Other participants (present on March 15th)Alexandre Pundek Rocha – Advisor to the BoardFlavio Pinheiro de Melo – Advisor to the Board
Hélio José Ferreira – Executive SecretaryJoão Batista do Nascimento Magalhães – SpecialAdvisor to the GovernorJocimar Nastari – Press SecretaryKatherine Hennings – Advisor to the Board
The members of the Monetary Policy Committeeanalyzed the recent performance of and prospectsfor the Brazilian and international economies underthe monetary policy framework, which is designedto comply with the inflation targets established bythe government.
Recent Evolution of Inflation 1. Consumer inflation remained high in Februarymainly due to isolated price increases thatovershadowed the deceleration of price increases inthe majority of components of the indices. Seasonaladjustments to education costs were a key driver ofthe Broad National Consumer Price Index (IPCA)inflation. Meanwhile, despite the cooling of industrialprice inflation, agricultural prices (particularlyvegetables) were a key driver of ongoing wholesaleprice inflation. 2. In February, the IPCA rose 0.59%, after rising0.58% in January. The accumulated increase in thetwelve months through February reached 7.39%,versus 7.41% in January. Regulated prices in the IPCArose 0.16% (0.51% in January) and accounted for0.05 p.p. of the monthly change in the index. Marketprices rose 0.77% (0.61% in January), accountingfor the remaining 0.54 p.p. of the IPCA monthly
������������������� ���������������
change. In addition to education, which accountedfor 0.25 p.p. of the monthly change, perishable foodprices rose 6.39% and accounted for 0.09 p.p. of theresult. Overall food prices increased 0.49%, despitethe deceleration of important products in the essentialbasket of consumer goods.
3. The General Price Index (IGP-DI) rose 0.40%in February, compared to 0.33% in January, andaccumulated a 10.86% increase in twelve months.Among the IGP-DI components in February, theConsumer Price Index – Brazil (IPC-Br) rose 0.43%,after a 0.85% increase in January, when it reflectedthe bulk of the seasonal impact of education priceadjustments. The National Index of Civil Construction(INCC) rose 0.44%, below the 0.75% increaseobserved in January, due to stable labor costs in theperiod. The Wholesale Price Index (IPA-DI) rose0.39%, versus 0.08% in January, accumulating atwelve-month increase of 12.74%.
4. The acceleration of IPA-DI inflation in Februarywas due to the 1.28% increase in agricultural prices,compared to the 0.63% fall in January. Notableincreases in the prices of eggs (26.3%), vegetablesand fruits (13.6%), and coffee (9.1%) outweighed thefall in the prices of chicken, soy, swine, beans andbovines. Industrial prices rose only 0.08%, comparedto 0.33% in January, due to a deceleration in inflationacross the majority of industrial goods prices. IPAinflation for final (particularly perishable foods) andintermediate goods accelerated from January toFebruary, while the fall in raw material prices wasmore intense in February (–1.10%), compared toJanuary (–0.64%). 5. IPCA core inflation, calculated under thetrimmed means methods, decelerated in February.The smoothed core reached 0.60%, compared to0.66% in the previous month, and totaled 7.58% inthe twelve months through February. The non-smoothed core slowed to 0.43% from 0.59% inJanuary, with an accumulated twelve-month increaseof 6.50% through February. 6. IPCA core inflation calculated by the exclusionof household food and regulated prices was affectedby the increase in education prices in the month,reaching 0.93%, compared to 0.56% in January, and
accumulating 7.78% in twelve months. Notconsidering education, the core by exclusion wouldhave increased only 0.50% in the month. 7. IPC-Br core inflation, calculated by the GetúlioVargas Foundation (FGV) under the symmetrictrimmed means method, decelerated to 0.36% inFebruary from 0.61% in January, for a cumulativetwelve-month increase of 5.72%. 8. The IPCA diffusion index fell to 64.6% inFebruary, after three consecutive months of steadyincreases (73.6% in January, 68.0% in December, and67.6% in November).
Assessment of Inflation Trends
9. The inflation shocks and their impacts werereassessed according to newly available information.The scenario considered in the simulations assumedthe following hypotheses: a) The projection for the adjustment of both gasolineand bottled gas prices for 2005 remained unchangedat 0%;
b) Projections for adjustments of fixed telephone ratesand household electricity remained unchanged for2005, at 8.7% and 9.5%, respectively;
c) For all regulated prices, which represented a totalweight of 29.6% in the February IPCA, a 6.9% increaseis projected for 2005 (0.2 p.p above the prior projection);
d) The projection for regulated price adjustments in2006, following the model of endogenousdetermination, which takes into account seasonalcomponents, the exchange rate, market price inflation,and the change in the IGP-DI, stands at 5.1%;
e) The projection for the 6-month spread over the Selicrate, following the specification of a VectorAutoregressive model based on the Selic and the swaprates on the eve of the Copom meeting, increases from19 basis points in the first quarter of 2005 to 46 basispoints in the last quarter of 2006.
10. Regarding fiscal policy, it is assumed that theconsolidated public sector primary surplus target of

�������������������������� ��������
4.25% of GDP for 2005 and 2006 will be achieved.The related assumptions considered in the FebruaryCopom meeting were maintained. 11. Assuming the maintenance of the Selic rate at18.75% p.a. and the exchange rate at the levelprevailing on the eve of the Copom meeting (R$/US$2.70), the IPCA inflation rate was projected abovethe 5.1% objective for 2005, but below the 4.5%central target for 2006. Using the consensus Selic rateand exchange rate projections compiled by the BCB’sInvestor Relations Group (Gerin) on the eve of theCopom meeting, inflation was also projected abovethe 2005 objective and the 2006 central target.
Monetary Policy Decision 12. IPCA inflation rose 0.59% in February, a pacesimilar to that registered in January. Seasonal factors,particularly the annual adjustment of tuition fees,prevented the IPCA deceleration. In effect, the rise ineducation prices (5.28%) contributed 0.25 p.p. to theFebruary IPCA result. In addition, due to weatherconditions, perishable food prices rose 6.39% andcontributed to the rigidity of IPCA inflation. Pricesof non-tradable goods rose 1.68%, in contrast to thebehavior of tradable goods and regulated prices, whichincreased 0.06% and 0.16%, respectively. Eventhough inflation remained at a level similar to that ofJanuary, there was a reduction in the number of itemsregistering price increases, reversing the recent trend.
13. IGP-DI inflation accelerated slightly in February,reaching 0.40%, after two consecutive months ofdeceleration. The larger increase in wholesale inflationin February relative to January (0.39% compared to0.08%) was due to strong pressure from agriculturalprices, due to adverse weather conditions, andcontrary to expectations for an anticipating favorableseasonal effect. Agricultural price increases maycontinue in the coming months, reflecting the recentincrease in agricultural commodities prices in theinternational market. Industrial IPA continued thedeceleration observed since December, rising just0.08% in February, and accumulating a 0.79%increase in the three-month period to February. Theminimal increases in the industrial IPA in recentmonths partially reflect the exchange rateappreciation in the period and the effects of monetary
policy, and may positively affect the evolution ofconsumer prices. Naturally, the intensity of the pass-through will depend on prospective demandconditions and price setters’ expectations relative tothe inflation trajectory. 14. The smaller number of items subject toinflationary pressures contributed to the decelerationof trimmed-means core inflation, both with andwithout smoothing, reversing the trend observedthrough December. However, core IPCA inflationcalculated by excluding household food items andregulated prices accelerated in February, due to thetuition fee increases, which had an unsurprisinglyhigher impact on the core than on headline IPCA. Hadeducation costs not been considered, the core byexclusion would have decelerated. 15. The Brazilian Institute of Geography and Statistics(IBGE) announced that GDP grew 5.2% in 2004, thehighest in the last ten years. Household consumptiongrew 4.3%, the highest annual rate since 1995. Grossfixed capital investment rose 10.9%, the highest ratesince 1994. In the fourth quarter of 2004, householdconsumption rose 1.3% while gross fixed capitalinvestment fell 3.9%, compared to the previous quarter(seasonally adjusted data). Considering the high growthrates recorded in the previous quarters for gross fixedcapital formation, especially in the third quarter (6.8%),the fall registered in the last quarter may be only atemporary adjustment and reflective of the significantvolatility of investment data. GDP grew 0.4% in thefourth quarter of 2004 in seasonally adjusted terms;given the strong growth in prior quarters, thisaccommodation was expected and is consistent withthe continuation, at a more sustainable pace, of theexpansion begun in the second half of 2003. Ashighlighted in previous Copom Minutes, it is naturalthat, after an initial strong impulse at the outset of theeconomic recovery, the growth process tends toconverge to rates more compatible with the pace ofoutput capacity expansion. 16. The economy has continued to expand in recentmonths, but as could be expected, at a slower pacethan that registered throughout 2004. Althoughindustrial output fell 0.5% in January in month-on-month seasonally adjusted terms, this decelerationwas not as strong as expected by analysts, and does

������������������� ���������������
not indicate a downward trend for the level of industrialoutput. In fact, production has been stable in recentmonths on a quarterly moving average basis, at levelsabove the already high levels registered in mid-2004.In the twelve-month period ending in January, industrialoutput continued to register a high growth rate (8.5%),compared to the preceding twelve months. Leadingand coincident indicators anticipate a new increase inindustrial output in February.
17. Non- and semi-durable consumer goodsproduction grew 3.7% in January, the thirdconsecutive month-on-month increase, accumulatinga 7.4% expansion in three months. The othercategories slowed in January compared to December.As highlighted in previous Copom Minutes, thisperformance underscores the recent shift in thecomposition of economic activity, as growth hasincreasingly been supported by more income-sensitivesectors. On a quarterly moving average basis, semi-and non-durable consumer goods expanded atincreasingly higher rates in recent months, while othercategories were stable or declined slightly.
18. The recent behavior of the labor market alsoconfirms that an income-driven economic cycle isunder way. According to IBGE, the unemploymentrate increased to 10.2% in January, in line withseasonal patterns of reversion in relation to the end ofthe year. However, the January rate stood well belowthe 11.7% registered in January 2004. The numberof employed workers declined in January, but payrollsincreased. In the manufacturing sector, the NationalIndustry Confederation (CNI) reported an increasein employment in January, continuing the positivetrend observed since end-2003. Real industrialpayrolls registered modest accommodation,nevertheless remaining 10.4% above the levelregistered in January last year.
19. Retail sales grew notably in recent months. The0.3% decline measured by IBGE and seasonallyadjusted by the BCB in January is not significant,considering that it occurred after retail sales had grown3.8% in December, on a month-on-month basis. Themost income- and employment-sensitive items haveshown the strongest growth. On a quarterly movingaverage basis, hyper-and supermarket salescontinued the strong growth trend begun in mid-2004.
In the last two months, fabrics, clothing and shoesalso posted strong growth. The Consumer ConfidenceIndex (ICC) measured by the Federação do Comérciodo Estado de São Paulo (Fecomercio-SP) showed asmall decline in March relative to February, butremained at historic highs. In addition, non-earmarkedcredit grew 2.5% in February relative to January.These indicators, together with employment andincome indicators, suggest that retail sales shouldremain on a growth trend.
20. As repeatedly emphasized in prior CopomMinutes, and due to the significant activity expansionobserved since end-2003, the performance ofaggregate supply in the coming quarters remains animportant concern for prospective inflation dynamics.Installed capacity utilization, measured by the CNIand seasonally adjusted by the BCB, registered someaccommodation in January, falling 0.3% relative toDecember, but still at record levels at 82.6%.
21. With regard to external trade, a robust surpluswas maintained in February, and the outlook for theyear remains highly favorable. Exports and importscontinued to expand at high rates in the first two monthsof the year, relative to the same period of 2004. In thetwelve months through February, exports grew 33.9%,relative to the previous twelve months, while importsrose 33.5%, responding to the strong expansion ofdomestic demand. The trade balance totaled US$35.1billion in the twelve months through February, whichrepresents a 34.6% expansion relative to the priortwelve months. In volume terms, and comparingJanuary with the same month of 2004, manufacturedexports continued to lead growth, while capital goodswere the most notable category on the import side. Thetrade balance supported a current account surplus ofUS$11.7 billion, equivalent to 1.9% of GDP, in thetwelve-month period through February.
22. International capital market conditions havedeteriorated since the last Copom meeting. In theUnited States, heightened inflation concerns by theFederal Reserve (FED) and the comments of FEDauthorities regarding the adequacy of the priceadjustment of long-term bonds provoked a rise in thelong end of the yield curve, with repercussions foremerging market countries. Brazilian country riskincreased and, following the adjustment in several

�������������������������� ��������
other emerging market currencies, the realdepreciated. As stressed in prior Copom Minutes,abundant international liquidity and market stabilityremain tied to macroeconomic conditions in theindustrialized countries, especially the U.S., and tothe FED´s potential monetary policy response toeconomic developments. Despite the volatility ofrecent weeks, the Copom continues to attribute a lowprobability to a significant deterioration ininternational financial markets driven by abruptchanges in the conduct of U.S. monetary policy.
23. International oil prices have risen, almostcontinuously, since the second week of February, andrecently reached new highs, above those of lastOctober. Oil prices have been driven by news relatedto demand conditions and the available oil stock inthe main consumer countries – particularly in light ofweather conditions in the northern hemisphere – aswell as possible supply restrictions among producingcountries. With the increase in oil prices, internationalgasoline prices have returned to levels above those inthe domestic market. The persistence of prices at theselevels remains surrounded by a considerable degreeof uncertainty, such that the Copom maintained theassumption in its benchmark scenario that domesticfuel prices will not be upwardly adjusted in 2005.However, the more unfavorable external environmentnow represents a bigger risk to the future inflationtrajectory than it did at the February Copom meeting.Even if this recent uptick in international prices hasnot translated into an increase in domestic gasolineprices, it affects the prices of petroleum derivativesand market inflation expectations.
24. Since the previous Copom meeting, the medianof market expectations for 2005 IPCA inflationincreased slightly to 5.77% from 5.72%. As mentionedin prior Copom Minutes, inflation expectations for2005 remain high, despite favorable developments thatcould dampen inflationary pressures, such as signsof a deceleration in economic growth, the reevaluationof market expectations for the exchange ratetrajectory, the decline in wholesale industrial prices,and the more restrictive monetary stance of recentmonths. The marginal increase in inflationexpectations for the year is, however, related mainlyto the higher than expected adjustment of someregulated prices, as was the case for urban bus fares,
and to the less favorable international environment.Nonetheless, inflation expectations for the next twelvemonths and for 2006 remain stable, suggesting thatthe more restrictive monetary stance has preventedshort-term inflationary pressures from contaminatinglonger-term inflation expectations.
25. Under the benchmark scenario – which assumesthe maintenance of the Selic rate at 18.75% p.a. andthe exchange rate at R$/US$ 2.70 during the forecastperiod – projected inflation rose in comparison to theFebruary meeting, standing above the 5.1% objectivefor the year. The deterioration was due to a range offactors, such as higher than expected Februaryinflation, the updating of the output gap with fourthquarter data, the exchange rate depreciation betweenthe February and March meetings, and the revisionof estimates for regulated price changes in 2005. Theforecasts based on the market scenario – whichincorporates the consensus exchange rate and Selicrate trajectories on the eve of the Copom meeting –exceeded the benchmark scenario forecast, but fellrelative to the previous month, due to lower projectionsfor exchange rate depreciation and expectations ofa steeper yield curve. For 2006, the forecasts showedan improvement at the margin, with the benchmarkscenario forecast below the target established by theNational Monetary Council (CMN) for the year, andthe market scenario forecast above the target. Theimprovement in projections for 2006 reflects theconsolidation of the monetary tightening processbegun in September, and also the fact that the factorsaffecting 2005 inflation forecasts are concentratedin the first quarter.
26. The Copom also analyzed inflation forecasts forthe 12-month periods ending in March, June andSeptember of 2006. The results for these periods willbe more responsive to current monetary policydecisions than those of calendar year 2005, and theavailable inflation projections are more reliable thanthose for calendar year 2006. The benchmark scenarioforecast for the twelve-month period ending in March2006 is slightly above the value interpolated from the5.1% inflation objective for 2005 and the 4.5% targetestablished by the CMN for 2006. The benchmarkscenario forecasts for the twelve-month periods endingin June 2006 and September 2006 are below the valuesof the inflation target trajectory for these periods.

�������������������� ���������������
27. As in the February meeting, the Copomconsidered that the more favorable inflation resultsin the beginning of the year, and the BCB and marketprojections for longer periods, reflect the effects ofthe tighter monetary policy stance initiated lastSeptember. Economic activity continues to expand,but at a slower pace and more in line with supplyconditions, so as not to result in significantinflationary pressures.
28. On the other hand, specific pressures on currentinflation and the recent deterioration of the externalenvironment (with increasing oil prices and higheruncertainty regarding U.S. monetary policy) increasedthe risks to inflation convergence to the target path,in comparison to the Copom’s evaluation in theFebruary meeting.
29. Under the inflation-targeting regime, themonetary authority’s decision-making process isoriented around the projected inflation path, analyzingalternative scenarios for the main variables that affectprices dynamics. Heightened risks for short-terminflation tend to increase the uncertainty surroundingthe future path of inflation, so that both the monetaryauthority’s assessment of scenarios and thecoordination of private sector expectations becomemore difficult. In such an environment, heighteneduncertainty caused by risk factors that may reversein the short term could have a more lasting affect oninflation expectations. Therefore, the monetaryauthority must remain vigilant so that short-termpressures do not contaminate longer time horizons.
30. Considering the reasons stated above, the Copomunanimously decided to increase the Selic rate targetto 19.25%, with no bias, and to carefully monitor theevolution of the inflation outlook until its next meeting,to then define the next steps in the monetary policystrategy implemented since September. As highlightedin the last Copom Minutes, the monetary authorityshould be ready to adjust the pace and magnitude ofthe interest rate adjustment process to thecircumstances, if there is a deterioration in the riskfactors monitored by the Committee.
31. At the conclusion of the meeting, it wasannounced that the Copom will reconvene on April 19for technical presentations, and on the following day
to discuss the monetary policy decision, as establishedin Communiqué 12,631 of October 29, 2004.
Summary of Data Analyzedby the Copom
Economic Activity
32. According to the IBGE nationwide survey, retailsales (seasonally adjusted by the BCB) fell 0.3% inJanuary, relative to December. All sectors’ salesincluded in the index fell. The most notable decline,however, was in autos, motorcycle and spare partssales, which is not included in the general index (-2.6%). On a year-on-year basis in January, salesexpanded 9.3%.
33. After steady increases in prior months, São PauloTrade Association (ACSP) data showed a 1.0% declinein the number of database consultations for credit salesand a 1.2% reduction in consultations of the Usechequesystem, both on a month-on-month seasonally adjustedbasis. In the year through February, these indicatorsincreased 6.7% and 5.0%, respectively, in comparisonto the same period of 2004.
34. The March Fecomercio-SP survey showed a0.6% month-on-month decline in the ConsumerConfidence Index, which had reached a record levelin February. The decrease in the month wasattributable to a 1.4% decline in the ConsumerExpectations Index (IEC), which more than offset the0.8% increase in the Current Economic ConditionsIndex (ICEA). The ICEA reached a record level of126.6 in February (on a scale of 0 to 200).
35. Capital goods imports increased 2.6% month-on-month in January, in seasonally adjusted terms,accelerating the expansion begun last year. On theother hand, domestic capital goods productiondeclined 1.5% month-on-month in January, after a19.7% growth in 2004. The production of constructioninputs fell 0.2% in January, in seasonally adjustedmonth-on-month terms, but grew 2.6% compared tothe same month of 2004.
36. According to IBGE, industrial productiondeclined 0.5% in January (month-on-month seasonallyadjusted) as a result of a 1.1% increase in mining

�������������������������� ���������
and a 0.3% fall in manufacturing. The three-monthmoving average series registered a 0.1% increase inindustrial output in January, reaching a record high.
37. Analysis of industrial production by activityreveals that the January production fall reflecteddeclines in 13 of the 23 activities, and 3 of the 4 usecategories. The production of semi- and non-durableconsumer goods, the only category recording month-on-month growth (of 3.7%), recorded a 7.4%cumulative increase in the three-month period toJanuary, confirming the rebound in domestic demand.
38. CNI manufacturing data showed stability inreal industrial sales and a decline of 1.4% in hoursworked in January, on a month-on-month seasonallyadjusted basis. Compared to the same month of2004, real industrial sales and hours workedincreased 3.1% and 8.2%, respectively. Installedcapacity utilization reached 82.6% in January, witha 0.3% decline in the month-on-month seasonallyadjusted series, and an increase of 1.9% comparedto the same month of 2004.
39. Leading indicators for the industrial sectoranticipate some recovery in February, comparedto January. Particularly notable are the positivegrowth rates in automotive production, the numberof road tolls paid by trucks, and shipments ofcorrugated cardboard.
Labor Market
40. In January, formal employment rose 0.6%(seasonally adjusted, month-on-month) according tothe Ministry of Labor and Employment. Comparedto the same month of 2004, there was a 6.6%expansion in formal employment, with the creationof 1,539 thousand jobs, led by manufacturing.
41. According to the IBGE survey in the six mainmetropolitan regions of the country, the unemploymentrate reached 10.2% in January, versus 9.6% inDecember and 11.7% in January last year. Theincrease in unemployment was seasonal, with a 5.0%monthly increase in the number of unemployedindividuals and a 1.4% decline in the number ofemployed individuals. The labor force, estimated at21.7 million individuals, fell 0.7% in the month.
42. In the industrial sector, according to the CNIindices seasonally adjusted by the BCB, employmentrose 0.3% and real payrolls fell 0.1% in January, ona month-on-month basis. Compared to the same monthof 2004, real payroll and employed workers grew10.4% and 7.1%, respectively.
Credit and Delinquency Rates
43. Non-earmarked credit grew 2.5% in February.Credit operations with individuals increased 3.2%,driven mainly by the expansion in personal credit, asa result of the increase in payroll-deducted loans.Corporate credit with domestic funding expanded by1.9%, mainly driven by working capital loans.Corporate credit with external funding increased2.3%, with increases in export-linked loans.
44. The average interest rate on non-earmarked creditincreased from 46.8% p.a. in January to 47.5% p.a.in February. The average corporate rate stood at32.4% p.a., a 0.2 p.p. increase in the period. Theaverage rate for credit to individuals increased 0.6p.p. to 64.0% p.a.
45. The default rate on non-earmarked credit(considering payments delinquent for 15 days or more)was unchanged at 7.3% in February. The corporatedefault rate fell to 3.5% from 3.6%, while the individualdefault rate was 12.4%, unchanged from January.
46. The retail sales default rate measured by theACSP increased to 7.0% in February, from 4.7% inJanuary, roughly the same level of February last year.The number of new negative registers rose 4.6%, whilethe number of cancelled registrations fell 7.9%. Inthe year to February, the average default rate stoodat 5.9%, versus 6.0% in the first two months of 2004.
External Environment
47. In the U.S., GDP grew 4.4% in 2004. Recentdata show the favorable economic momentum, withongoing activity expansion and a recovery inemployment. However, greater concern is being paidto some indicators, such as productivity trends, unitlabor costs, and the pass-through of higher producerprice inflation to consumer price inflation, given theimplications for medium- and long-term price stability.

�������������������� ���������������
The Treasury market has become more volatile,following the moves in the foreign exchange markets,and mirroring the uncertainties regarding thesustainability of the fiscal and external deficits.
48. In the Euro Area, economic indicators for thefourth quarter of 2004 showed deceleration. In Japan,revised fourth quarter GDP data showed a 0.1%growth, compared to the previous quarter, for a 2.7%expansion in the year.
49. In the main economies, there are still no signs ofinflationary surges in the near term, which has easedconcerns about changes in the monetary policystances. Annualized consumer price inflationdecelerated in January in the U.S., UK and Japan,reaching 3.0%, 1.4%, and –0.1%, respectively.However, annualized consumer price inflation rosein the Euro Area and in China, reaching 2.1% and3.9%, respectively, in February.
50. Agricultural commodity prices reversed theirdownward trajectory in February, due to worse thanexpected harvests. Oil and metal prices have risenconsistently since mid-February, with futures pricesat even higher levels.
Foreign Trade and Balance of Payments
51. In February, the Brazilian trade balance postedrecord highs – on monthly, year-through-Februaryaccumulated, and twelve-month accumulated bases.In the month, the trade balance posted a US$2.8 billionsurplus. Exports and imports rose 35.6% and 32.5%,respectively, compared to February 2004 dailyaverages, to reach US$7.8 billion and US$5.0 billion.In the first two weeks of March (nine working days),the trade surplus reached US$1.4 billion, with exportsand imports growing by 21.6% and 11.6%,respectively, compared to March 2004 daily averages.
52. The increase in key export products has beenaccompanied by an increase in growth of typically low-participation items, underscoring the exportdiversification currently under way. In addition, it isimportant to highlight the broadening of exportdestinations, even to markets with low participation inBrazilian exports. Export revenues have also beneficedfrom the rise in prices of important export products.
53. Import growth in February and in the first twomonths of 2005 was disseminated. In the first twomonths of the year, imports of non-durable consumergoods (37.6%), capital goods (27.9%), andintermediate goods grew 37.6%, 27.9% and 24.6%,respectively, compared to the same period of 2004.Fuel and lubricant imports increased 49.4% in thesame period.
54. Both international reserves and adjusted netreserves (IMF concept) increased US$6.1 billion inFebruary, compared to the end of 2004, to levels ofUS$59.0 billion and US$31.4 billion, respectively.
Money Market and Open Market Operations
55. After the release of the February Copom Minutes,the long end of the yield curve shifted downward.Between February 16 and March 16, the 1-monthinterest rate increased by 0.16 p.p., while the 6-month,1-year, 2-year and 3-year rates fell by 0.12 p.p., 0.19p.p., 0.04 p.p. and 0.05 p.p., respectively. In the sameperiod, the real interest rate measured by the ratiobetween the one-year nominal interest rate and the12-month-ahead inflation expectation increased to12.42% from 12.32%.
56. With the objective of reducing the public sector’sforeign exchange exposure, the BCB continuedconducting FX swap auctions, in which the BCBassumes a long FX position and short interest rateposition. The auctions conducted since the beginningof February totaled US$7.3 billion. As a result, thenet redemption of FX instruments totaled US$14.5billion in the year.
57. The National Treasury raised a total of R$15.9billion via four auctions of LTNs, with maturities inApril 2006 and January 2007. The Treasury raisedadditional R$620 million via four NTN-F auctions,with maturities in January 2008 and January 2010.The Treasury also conducted eight auctions of LFTsmaturing in 2006, 2007 and 2008, four of which weresales and four of which were exchanges. The foursales of LFTs totaled R$12.4 billion, and the fourexchanges totaled R$8.1 billion.
58. In its open market operations – aimed at reducingexcess liquidity projected for the second quarter –

�������������������������� ��������
the BCB conducted four auctions, selling, from itsportfolio, LTNs maturing in July 2005, and buyingLTNs maturing in April 2005. These operations totaledR$3.8 billion. The BCB also conducted four additionalsales from its portfolio of LTNs maturing in July 2005,for a total amount of R$7.5 billion.
59. The BCB also intervened in the open market ona weekly basis with 3-month fixed-rate repooperations and 1-month floating-rate repo operations,and conducted daily liquidity management operations.The BCB also conducted eighteen fixed-rate overnightrepo operations, nine of which were overnight
borrowings and nine of which were overnight lendings.The excess liquidity sterilized from the bankingreserves market via operations with tenors less than30 days averaged R$14.3 billion, and the amountsterilized via operations with three-month tenorsaveraged R$37.4 billion.
60. In February, net securitized domestic public debtgrew 2.3%, due to the accrual of interest and the netplacement of R$9.5 billion in securities. The dollar-linked share in net securitized domestic debt fell to6.0% in February from 8.0% in January, mainly dueto the net redemption of FX instruments.
�������������$*�������#�������������%�&���%�'�����('����)
Date: April 19th, from 5:30PM to 8:00PM, andApril 20th, from 4:43PM to 7:03PMPlace: BCB’s Headquarters meeting rooms – 8th
floor on April 19th and 20th floor on April 20th –Brasília – DF
In attendance:Members of the CommitteeHenrique de Campos Meirelles – GovernorAfonso Sant’Anna BevilaquaAlexandre SchwartsmanAntônio Gustavo Matos do ValeEduardo Henrique de Mello Motta LoyoJoão Antônio Fleury TeixeiraPaulo Sérgio CavalheiroRodrigo Telles da Rocha AzevedoSérgio Darcy da Silva Alves
Department Heads (present on April 19th)Altamir Lopes – Economic DepartmentIvan Luís Gonçalves de Oliveira Lima – OpenMarket Operations DepartmentJosé Antônio Marciano – Department of BankingOperations and Payments SystemJosé Pedro Ramos Fachada Martins da Silva –Investor Relations GroupMarcelo Kfoury Muinhos – Research Department(also present on April 20th)Renato Jansson Rosek – International ReservesOperations Department
Other participants (present on April 19th)Alexandre Pundek Rocha – Advisor to the BoardEduardo Fernandes – Advisor to the BoardFlavio Pinheiro de Melo – Advisor to the BoardJoão Batista do Nascimento Magalhães – SpecialAdvisor to the GovernorJocimar Nastari – Press SecretaryKatherine Hennings – Advisor to the Board
The members of the Monetary Policy Committeeanalyzed the recent performance of and prospectsfor the Brazilian and international economies underthe monetary policy framework, which is designedto comply with the inflation targets established bythe government.
Recent Evolution of Inflation 1. While most components of the consumer priceindices decelerated in March, consumer price inflationremained high mainly due to isolated price increasesthat had material impacts on the evolution of the mainprice indices. The increase in Broad NationalConsumer Price Index (IPCA) inflation was virtuallyof the same magnitude as that observed in February,due to the acceleration in regulated prices anddeceleration in market prices. Wholesale agriculturalprices increased, reflecting the effects of the droughton grain harvests.

������������������� ���������������
2. In March, the IPCA rose 0.61%, after rising0.59% in February. The accumulated increase in thetwelve months through March reached 7.54%, or1.79% in the year. Regulated prices in the IPCA rose1.29% and accounted for 0.38 p.p. of the monthlychange in the index, with highlights for urban busfares in São Paulo and Porto Alegre (contributing0.25 p.p. for the result in the period), while waterand sewage price adjustments in six capitalscontributed 0.08 p.p. Market prices rose 0.33%(0.77% in February), accounting for the remaining0.23 p.p. of the IPCA monthly change. Education,which increased 0.4% in March compared to 5.3%in February, contributed significantly to this result.
3. The General Price Index (IGP-DI) rose 0.99%in March, compared to 0.40% in February, for anaccumulated 1.73% in the first quarter of the year,and a 10.92% increase in twelve months. Amongthe IGP-DI components in March, the ConsumerPrice Index – Brazil (IPC-Br) rose 0.7%, after a0.43% increase in February, also reflecting transportand housing price increases, as in the IPCA. TheNational Index of Civil Construction (INCC) rose0.67%, above the 0.44% increase observed inFebruary, due to increases in labor costs in the period.The Wholesale Price Index (IPA-DI) rose 1.14%,versus 0.39% in February, accumulating a twelve-month increase of 12.8%.
4. The acceleration of IPA-DI inflation in Marchwas mainly due to the 3.59% increase in agriculturalprices, compared to the 1.29% increase in February,driven by increases in the prices of rice, corn, wheatand soy. Industrial prices rose 0.3%, compared to0.08% in February. IPA inflation for final andintermediate goods cooled from February to March,while raw material prices increased 2.91%, afterfalling 1.1% in February, mainly due to agriculturalcomponents. 5. IPCA core inflation, calculated under thetrimmed means methods, accelerated in March. Thesmoothed core reached 0.62%, compared to 0.60%in the previous month, and totaled 7.42% in the twelvemonths through March. The non-smoothed core roseto 0.49% from 0.43% in February, with anaccumulated twelve-month increase of 6.33%through March.
6. IPCA core inflation calculated by the exclusionof household food and regulated prices fell to 0.41%in March, from 0.93% in February, due to the easingof seasonal education price pressures. This measureof core inflation increased 7.31% in the twelvemonths through March. 7. IPC-Br core inflation, calculated by the GetúlioVargas Foundation (FGV) under the symmetrictrimmed means method, reached 0.49% in Marchfrom 0.36% in February, for a cumulative twelve-month increase of 5.68%. 8. The IPCA diffusion index fell for the secondconsecutive month, reaching 63.9% in March (64.6%in February and 73.2% in January).
Assessment of Inflation Trends
9. The inflation shocks and their impacts werereassessed according to newly available information.The scenario considered in the simulations assumedthe following assumptions: a) The projection for the adjustment of both gasolineand bottled gas prices for 2005 remained unchangedat 0%;
b) Projections for adjustments of fixed telephone ratesfor 2005 fell to 7.9% from 8.7% as of the previousmeeting, while projections for adjustments ofhousehold electricity increased to 10.8% from 9.5%;
c) For all regulated prices, which represented a totalweight of 29.4% in the March IPCA, a 7.2% increaseis projected for 2005 (0.3 p.p above the prior projection);
d) The projection for regulated price adjustments in2006, following the model of endogenousdetermination, which takes into account seasonalcomponents, the exchange rate, market price inflation,and the change in the IGP-DI, stands at 5.1%;
e) The projection for the 6-month spread over theSelic rate, following the specification of a VectorAutoregressive model based on the Selic and theswap rates on the eve of the Copom meeting,increases from 34 basis points in the second quarterof 2005 to 44 basis points in the last quarter of 2006.

�������������������������� ���������
10. Regarding fiscal policy, it is assumed that theconsolidated public sector primary surplus target of4.25% of GDP for 2005 and 2006 will be achieved.The related assumptions considered in the FebruaryCopom meeting were maintained. 11. Assuming the maintenance of the Selic rate at19.25% p.a. and the exchange rate at the levelprevailing on the eve of the Copom meeting (R$/US$2.60), the IPCA inflation rate was projectedabove the 5.1% objective for 2005, but below the4.5% central target for 2006. Using the consensusSelic rate and exchange rate projections compiledby the BCB’s Investor Relations Group (Gerin) onthe eve of the Copom meeting, inflation was alsoprojected above the 2005 objective and the 2006central target.
Monetary Policy Decision 12. IPCA inflation rose 0.61% in March, a pacesimilar to that registered in the two previous months.Inflation in the month was significantly influenced byadjustments in urban bus fares. In addition, water andsewage fees accelerated strongly in March. On theother hand, there was an end to the impact of theannual adjustment of school tuition fees and marketprices decelerated, especially for non-tradable goods.Even though inflation remained at a level similar tothat of January and February, a reduction in the numberof items registering price increases occurred again.
13. IGP-DI inflation accelerated for the secondconsecutive month, reaching 0.99% in March, mainlydriven by the IPA change. Again in March, theincrease in wholesale inflation was due to strongpressure from agricultural prices, owing to adverseweather conditions, with a 3.59% increase, comparedto 1.29% in February. Agricultural price increasesmay continue in the coming months, reflecting therecent increase in agricultural commodity prices inthe international market. Industrial IPA has postedonly modest changes since December, but recentlyregistered a slight acceleration. As highlighted inMarch Copom Minutes, the minimal increases in theindustrial IPA in recent months partially reflect theexchange rate appreciation in the period and theeffects of monetary policy, and may positively affectthe evolution of consumer prices. Naturally, the
intensity of the pass-through will depend onprospective demand conditions and price setters’expectations relative to the inflation trajectory. 14. Core IPCA inflation calculated by excludinghousehold food items and regulated prices deceleratedstrongly in March, due to the end of the effects ofschool tuition fee increases in February. Had educationcosts not been considered, core by exclusion wouldhave decelerated steadily in recent months. In turn,trimmed-means core inflation, both with and withoutsmoothing, accelerated when compared to February.Core by exclusion decelerated because it does notconsider the recent high increases in regulated prices,while trimmed-means core accelerated because itpartially incorporates items affected by seasonalfactors. Throughout the first quarter, the underlyingcore inflation trend remained above the targettrajectory, even considering the deceleration observedrelative to the last quarter of 2004. 15. Industrial production declined for the secondconsecutive month in February, seasonally adjustedby the IBGE. While this result contradicted thatsuggested by leading and coincident indicators, theaccommodation is unsurprising given the elevated levelsof industrial production at the close of 2004. In addition,specific sectoral factors, such as the delay in the sugar-cane harvest and the slowdown in oil refining, couldhave influenced the February result for overall industrialproduction.The normalization of these sectors shouldlead to a reversal of the temporarily negative effectthat they may have had on aggregate production. Thedecline in production in February could also bereflecting fluctuations inherent to the series and theseasonal adjustment process for moving holidays. Asemphasized in the March Copom Minutes, theeconomy continues to show signs of expansion;however, as could be expected, at a slower pace thanthat registered in 2004. Looking at the more stablethree-month moving average series, which smoothesthe effects of seasonally adjusted monthly variations,industry continues to demonstrate the high levels ofproduction registered in recent months. Leading andcoincident indicators signal industrial productionexpansion in March. 16. In terms of the composition of industrial activity,consumer goods continued to expand on a three-

�������������������� ���������������
month moving average basis, relative to January.Consumer durable goods production expanded moststrongly, at 3.2%, driven by the strong growth inproduction of exports goods – such as cell phones andautomobiles. The production of consumer semi-durables and non-durables grew at a slower pace, of0.84%. The other categories registered deceleration.The pattern registered in February, in which consumerdurables continued to post strong performance whilemore income-sensitive sectors lost dynamism and evendeclined in month-on-month seasonally adjusted terms,appears inconsistent with the current stage of theeconomic cycle. Given the positive evolution of thelabor market and incomes in recent months, and themonetary policy stance, one would not expect areversal in the shifting composition of economic activity,of economic growth being sustained increasingly byincome-sensitive sectors. Some sectoral factors that,as mentioned above, negatively impacted industrialproduction in February, particularly impacted the moreincome-dependent use categories, so that theunderstanding of both the aggregate series and thecomponents of industrial activity is more difficult. Moreobservations will be necessary to better characterizechanges in the pattern of industrial activity.
17. The labor market has followed the seasonalpattern observed in prior years, with theunemployment rate increasing for the secondconsecutive month in February to 10.6%, from 10.2%in January, but remaining below the level of last year.The number of employed workers declined slightlyfrom January to February, while payrolls and realaverage incomes rose in the period. CNI data,seasonally adjusted by the BCB, shows that industrialemployment continued the expansion begun inDecember 2003, while real industrial payrolls heldsteady in February relative to January, but at a levelsignificantly above that of February 2004. Data fromthe Ministry of Labor and Employment (MTE) onformal employment showed a 6.4% increase in thefirst two months of the year.
18. After expanding significantly through 2004, retailsales have shown some signs of accommodation inthe last two months. In February, sales fell 3.2%,according to the IBGE and seasonally adjusted bythe BCB. This result could have been influenced bythe same problems with seasonal adjustment as
supposed in the case of industrial production. Furnitureand household appliance sales posted the strongestgrowth, at 0.7%, while all other categoriescontracted. On a three-month moving average basis,sales continued to grow, driven by the expansion infurniture and household appliances, while the othercategories declined. This contrast between theperformance of consumer durable and non-durablesales is similar to that observed for industrialproduction, and is equally out of tune with what onewould expect at this stage of the economic cycle. Asin the case of industrial production, more observationswill be necessary to better characterize changes inthe pattern of retail sales.
19. As repeatedly emphasized in prior CopomMinutes, given the strong expansion of economicactivity since 2003, the performance of aggregatesupply in the coming quarters remains a key point ofconcern with regard to prospective inflation dynamics.Installed capacity utilization, measured by CNI andseasonally adjusted by the BCB, showedaccommodation in February (81.9%), potentiallyreflecting the maturation of new investments made inrecent months and also the accommodation ineconomic activity. Despite the recent evolution, theindex remains at historic highs. Capital goodsabsorption grew a cumulative 2.8% in the first twomonths of the year, in seasonally adjusted terms. Giventhe strong growth of investment in 2004, one can expectthat there will be a reduction in its pace of growth asresults will be compared to a higher base.
20. Strong trade surpluses continued in March,reinforcing the more favorable outlook for the year.Exports and imports continued to expand at a strongpace in the first three months of the year, relative tothe same period of the previous year. In the twelvemonths through March, exports grew 31.0% in valueterms, relative to the preceding twelve months, whileimports grew 30.3% on the back of strong domesticdemand. In monthly terms, both exports and importsgrew at a pace slightly below than that of February.The trade balance reached a twelve-monthcumulative US$35.9 billion in March, an increase of32.2% over the same period of 2004. In volume terms,manufacturing exports continued to post the strongestgrowth, when comparing the first two months of 2005with the same period of 2004. The robust performance

�������������������������� ���������
of the trade balance contributed to the currentaccount surplus of US$12.7 billion in the twelvemonths through March, equivalent to 2.1% of GDP.External demand, therefore, continues to contributeto the economic expansion.
21. International capital market conditions haveremained volatile since the last Copom meeting. Inaddition to the uncertainties regarding U.S. monetarypolicy, market instability has been driven by riskaversion in U.S. credit markets, due to difficultiesfaced by some large companies which could resultin portfolio reallocations that could prove unfavorableto emerging market countries. As a consequence,Brazilian country risk was very volatile, posting thehighest spreads in recent months. The real, afterdepreciating in mid-March, appreciated to Februarylevels. As stressed in prior Copom Minutes, abundantinternational liquidity and market stability remain tiedto macroeconomic conditions in the industrializedcountries, especially the U.S., and to the FED´spotential monetary policy response to economicdevelopments. Despite the volatility of recent weeks,the Copom continues to assign a low probability to asignificant deterioration in international financialmarkets driven by abrupt changes in the conduct ofU.S. monetary policy.
22. International oil prices have recently registereda slight decline, after reaching record highs at theend of March and beginning of April. Oil prices haveremained driven by news related to demand conditionsand available oil inventories in the main consumercountries, as well as possible supply restrictionsamong producing countries. Despite the slight declineobserved since the last Copom meeting, internationalgasoline prices have remained above domestic prices.The persistence of prices at these levels remainssurrounded by a considerable degree of uncertainty,such that the Copom maintained the assumption inits benchmark scenario that domestic fuel prices willnot be upwardly adjusted in 2005. However, thisunfavorable component of the external scenario nowrepresents a bigger risk to the future inflationtrajectory, as mentioned in the March Copom MeetingMinutes. Even if this recent uptick in internationalprices has not translated into an increase in domesticgasoline prices, it affects the prices of petroleumderivatives and market inflation expectations.
23. Since the previous Copom meeting, the medianof market expectations for 2005 IPCA inflationdeteriorated to 6.10% from 5.77%. As mentioned inprior Copom Minutes, inflation expectations for 2005remain high, despite favorable developments that coulddampen inflationary pressures, such as signs of adeceleration in economic growth, the decline inwholesale industrial prices, the reevaluation of marketexpectations for the exchange rate trajectory, and themore restrictive monetary stance of recent months.
24. The marginal increase in 2005 inflationexpectations, however, is mainly tied to higher-than-expected adjustments of some regulated prices, suchas urban bus fares, April inflation expectations, andless favorable external conditions. The impact of badweather conditions on short-run food prices alsocontributed to higher inflation expectations for theyear, although these effects on general price levelstend to reverse as soon as normal agriculture supplyconditions are reestablished. The expectations fortwelve-month ahead inflation also deteriorated in thelast weeks. However, these upward adjustments wereof the same magnitude as those for second quarterinflation expectations, suggesting that the morerestrictive monetary policy stance has preventedshort-term inflationary pressures from contaminatinglonger forecast periods. The existence of well-anchored inflation expectations is strengthened bystable 2006 inflation forecasts.
25. Under the benchmark scenario – which assumesthe maintenance of the Selic rate at 19.25% p.a. andthe exchange rate at R$/US$ 2.60 during the forecastperiod – projected inflation rose in comparison to theMarch meeting, standing above the 5.1% objectivefor the year. The deterioration was due to a range offactors, such as the revision of estimates for regulatedprice changes in 2005, which resulted mainly in anupward adjustment to April inflation estimates. Theforecasts based on the market scenario – whichincorporates the consensus exchange rate and Selicrate trajectories on the eve of the Copom meeting –exceeded the benchmark scenario forecast, and alsorose relative to the previous month, due to the samereasons stated for the benchmark scenario. For 2006,the forecasts improved, with the benchmark scenarioforecast below the target established by the NationalMonetary Council (CMN) for the year, and the
�������������������� ���������������
market scenario forecast above the target. Theimprovement in projections for 2006 reflects thelonger time horizon for the consolidation of the effectsof the monetary tightening process begun inSeptember 2004.
26. The Copom also analyzed inflation forecasts forthe 12-month periods ending in March, June andSeptember of 2006. The results for these periods willbe more responsive to current monetary policydecisions than those of calendar year 2005, and theavailable inflation projections are more reliable thanthose for calendar year 2006. The benchmark scenarioforecast for the twelve-month period ending in March2006 is above the value interpolated from the 5.1%inflation objective for 2005 and the 4.5% targetestablished by the CMN for 2006. This forecast isalso above the forecast made at the March CopomMeeting. On the other hand, the benchmark scenarioforecasts for the twelve-month periods ending in June2006 and September 2006 are below the values ofthe inflation target trajectory for these periods. Theforecast for the twelve-month period ending in June2006 is the same of that made at the March meeting,while the forecast for the twelve-month period endingin September 2006 is below the estimate made at thelast Copom meeting.
27. The Copom reaffirms that, as stated in theFebruary and March Minutes, the effects of themonetary tightening begun in September 2004 arealready influencing first quarter inflation results andfuture inflation, as forecasted by the BCB and themarket. Economic activity continues to expand,although at a slower pace and more in line withsupply conditions, so that there are no significantpressures on inflation. However, as in the Marchmeeting, the Copom identified some factors thatheightened the risks to inflation convergence withthe target path. These risks are associated with thepersistence of some isolated pressure points oncurrent inflation and the deterioration in the externalenvironment, given the persistence of high oil pricesand the possibility of ongoing volatility in internationalcapital markets. 28. The Copom also reiterates that, under theinflation-targeting regime, its decision-making isoriented toward forecasted future inflation, analyzing
alternative scenarios for the evolution of the mainvariables that affect price dynamics. The continuationof heightened risks to short-term inflation tends toincrease the uncertainty regarding future inflation,so that both the monetary authority’s assessment ofinflation dynamics and the coordination of privatesector expectations are more difficult. In suchcircumstances, heightened uncertainty caused byfactors that could reverse in the short term, couldnevertheless have a more lasting effect on inflationexpectations. Therefore, monetary policy shouldremain vigilant so that short-term pressures do notcontaminate longer time horizons. 29. Due to the short-term risks and their persistencein recent months, the Copom determined thatmaintaining rates for a sufficiently long time at thelevel established in the March meeting would notensure inflation convergence to the target path. Thus,the Copom, unanimously decided to increase theOver-Selic rate target to 19.50% p.a., without bias,and closely follow the evolution of the inflation outlookuntil the next meeting, and then define the next stepsin the monetary policy strategy implemented sinceSeptember 2004. As highlighted in the March CopomMinutes, the Monetary Authority must remain readyto adapt the pace and magnitude of the interest rateadjustment process to the prevailing circumstances,in case of an exacerbation of the risk factorsmonitored by the Copom. 30. At the conclusion of the meeting, it wasannounced that the Copom will reconvene on May 17for technical presentations, and on the following dayto discuss the monetary policy decision, as establishedin Communiqué 12,631 of October 29, 2004.
Summary of Data Analyzedby the Copom
Economic Activity
31. Retail sales (seasonally adjusted by the BCB)fell 3.2% in February, compared to the previousmonth, according to the IBGE nationwide survey.Among all sectors included in the index, only furnitureand appliances sales expanded in the period (0.7%).Autos, motorcycle and spare parts sales, which arenot included in the general index, declined 4.8%.

�������������������������� ���������
Despite the negative change, sales in the first twomonths of the year were favorable, although showingsigns of accommodation. Still under the effects ofthe high increase in December sales, the three-monthmoving average reached a record level in Februaryand expanded 8.9% in the last twelve months. 32. In March, data from the São Paulo TradeAssociation (ACSP) showed a 2.6% increase in thenumber of database consultations for credit sales anda 1.5% increase in consultations of the Usechequesystem, both on a month-on-month seasonallyadjusted basis. In the year through March, theseindicators increased 6.3% and 4.0%, respectively,compared to the same period in 2004. 33. The Fecomercio-SP survey showed a 3% month-on-month fall in the Consumer Confidence Index inApril, attributable to a 4.1% decline in the CurrentEconomic Conditions Index (Icea) and a 2.5% declinein the Consumer Expectations Index (IEC). 34. The Consumer Expectations National Index(Inec), calculated quarterly by the CNI in anationwide survey, declined 2.2% in March,compared to December 2004, influenced bydeterioration in expectations regarding the evolutionof employment and inflation during this year. 35. Regarding seasonally adjusted investmentindicators, the production of construction inputs,domestic capital goods production, and capital goodsimports fell 1.3%, 3.1% and 6.9%, respectively, inFebruary. The expansion of domestic capital goodsproduction decelerated in the first two months of theyear, due to the sharp fall in agricultural machineryand parts production, in turn driven by the drop inorders from producers in the South because of theprolonged summer drought. 36. The partial and preliminary release of the FGVManufacturing Industry Survey showed thatentrepreneurs’ perceptions regarding the generalbusiness environment in April 2005 were similar tothat observed in April 2004. Regarding expectationsfor the coming months, a slight decline was observedin expected demand. Thus, the production andindustrial employment indicators continue to suggesta favorable outlook. However, compared to the
January 2005 survey, there was an increase in thenumber of respondents who considered currentinventory levels to be excessive. 37. According to the IBGE Monthly IndustrialSurvey (PIM), industrial production fell 1.2% inFebruary in month-on-month seasonally adjustedterms. The decline was driven by the 1.1%contraction in manufacturing, while extractive mineralproduction remained virtually stable. Key drivers ofthe negative industrial activity results for Februarywere the decline in the sugarcane sector (a drop of25.4% in sugar production and refining, and 5.6% inethanol production, seasonally adjusted) and the 4.6%contraction in oil refining. These results negativelyinfluenced the monthly result and were caused byrestrictions related to the production process, whichshould be overcome in the next month.
38. Analysis of industrial production by activityreveals that the fall in February production reflecteddeclines in 11 of the 23 activities, and 3 of the 4 usecategories, in seasonally adjusted terms. The mostnotable declines were in the sectors ofpharmaceuticals, food, beverages, oil refining andethanol production. Regarding the use categories,durable goods were the only category to record apositive result in February, with an increase of 11.8%in the month-on-month seasonally adjusted series,mainly resulting from the positive growth ratesobserved in automotive production and mobile phoneproduction. Semi- and non-durable goods productiondeclined 4.3% in February, after having reaching arecord peak in January.
39. CNI manufacturing data showed an increase of1% in real industrial sales and a decline of 0.2% inhours worked in February, on a month-on-monthseasonally adjusted basis. Compared to the samemonth of 2004, real industrial sales and hours workedincreased 5.9% and 7.2%, respectively. Installedcapacity utilization reached 81.9% in February, witha 0.3% decline in the month-on-month seasonallyadjusted series, and an increase of 1.1% comparedto the same month of 2004.
40. Leading indicators for the industrial sectorsuggest some recovery in March compared toFebruary. Particularly notable are the strong growth

�������������������� ���������������
rates in automotive production, the highest ratereached since January 1979, and the strong growthof corrugated cardboard shipments.
Labor Market
41. In February, formal employment rose 0.2%(seasonally adjusted, month-on-month) according tothe Ministry of Labor and Employment. Comparedto the same month of 2004, there was a 6.2%expansion in formal employment, with the creationof 1,473 thousand jobs, led by manufacturing.
42. According to the IBGE survey in the six mainmetropolitan regions of the country, the unemploymentrate reached 10.6% in February, versus 10.2% inJanuary and 12% in February last year. The increasein unemployment was seasonal, with a 5.0% monthlyincrease in the number of unemployed individuals anda 0.3% decline in the number of employed individuals.The labor force, estimated at 21.7 million individuals,increased 0.2% in February.
43. In the industrial sector, according to the CNIindices seasonally adjusted by the BCB, employmentrose 0.2% and real payrolls were unchanged inFebruary, on a month-on-month basis. Compared tothe same month of 2004, real payroll and employedworkers grew 8.1% and 6.8%, respectively.
Credit and Delinquency Rates
44. Non-earmarked credit grew 2.1% in March.Credit operations with individuals increased 3.5%,driven mainly by the expansion in personal credit, asa result of the increase in payroll-deducted loans.Corporate credit with domestic funding expanded by0.9%, while corporate credit with external fundingincreased 1.9%.
45. The average interest rate on non-earmarkedcredit increased from 47.5% p.a. in February to47.8% p.a. in March. The average corporate ratestood at 32.9% p.a., a 0.5 p.p. increase in the period.The average rate for credit to individuals wasunchanged at 64.0% p.a.
46. The default rate on non-earmarked credit(considering payments delinquent for 15 days or
more) stood at 12.7% in March, a 0.3p.p. increasemonth-on-month. The corporate default rate rose to3.8% in March from 3.7% in February.
47. The retail sales default rate measured by theACSP declined to 6.4% in March, from 7.0% inFebruary, roughly the same level of March last year(6.5%). The number of new negative registers rose21.6%, while the number of cancelled registrationsincreased 23.2%. In the year to March, the averagedefault rate stood at 6.0%, versus 6.1% in the firstquarter of 2004. The number of returned checks,compared to the total number of checks, reached 6.3%in March, also reaching the highest level of the series.
External Environment
48. According to the main international organizations,global economic growth was robust in 2004, presentingthe highest rate of expansion in the last fifteen years,driven by the United States and China. For 2005, theforecast is for lower, but sustained growth; however,projections point to less evenly distributed growthacross countries. The United States and China willcontinue to lead the global expansion, whereas Japanand the Euro Area will post modest performance,below their potential capacities.
49. According to the International Monetary Fund(IMF), global trade volume grew 9.9% in 2004, andthe forecast points to a 7.4% increase for 2005.Similar estimates had been released by the WorldTrade Organization (WTO), which projecs a 6.5%expansion in global trade in 2005, compared to the9% increase last year. The International Institute ofFinance (IIF) projects an increase in net capital flowsto the emerging markets, with a particular increasein foreign direct investment. However, there are somerisks to this scenario, such as high oil prices, higher-than-expected interest rate increases, and a strongslowdown in the Chinese economy.
50. Results thus far in 2005 have confirmed theinternational organizations’ projections for the year.In the U.S., industrial production grew 0.3% inMarch, the same pace recorded in February. Installedcapacity stood at 79.4%, an increase of 0.1 p.p. abovethe level reached in February, the highest result sinceDecember 2000. U.S. business expectations, despite

�������������������������� ���������
declining, continue to point to economic expansion.The current level of the ISM indicator formanufacturing (PMI) is compatible with the 4.5%GDP growth rate, while services (BAI) iscompatible with a 5% expansion of GDP. RegardingJapan, industrial production recorded a 2.3% declinein March, with business expectations (Tankan)declining, the same trend recorded in Germany,France and Italy.
51. Despite the pressures from commodity priceincreases, especially metals and oil, there has not beeninflation acceleration in the main economies, withconsumer price indices remaining within the limitsestablished by the monetary authorities.
52. In the international financial markets, yields on10-year U.S. Treasuries fell in late-March (afterrising in late-January) and demonstrated significantvolatility in the period. The moves in U.S. Treasuriesaffected emerging market debt, which recordedvolatility and relative deterioration at the beginningof April.
Foreign Trade and Balance of Payments
53. In March, the Brazilian trade balance postedrecord highs – on monthly, year-through-Marchaccumulated, and twelve-month accumulated bases.In the month, the trade balance posted a US$3.3 billionsurplus. Exports and imports rose 22.0% and 15.5%,respectively, compared to March 2004 daily averages,to reach US$9.3 billion and US$5.9 billion. In twelvemonths, the trade balance and total external tradereached US$35.9 billion and US$167.1 billion,respectively. In the first eleven working days of April,the trade balance totaled US$2.3 billion, with exportsand imports growing by 42.0% and 12.2%,respectively, compared to April 2004 daily averages.
54. Regarding exports, in addition to the increase involumes, key export products have registered priceincreases. Furthermore, this increase has beenaccompanied by an increase in growth of typicallylow-participation items, underscoring the exportdiversification currently under way. In addition, it isimportant to highlight the broadening of exportdestinations, even to markets with low participationin Brazilian exports.
55. Import growth in March and in the first quarterof 2005 was broadly disseminated, with notableincreases in imports of fuel and lubricants (41.6%),capital goods (27.4%), non-durable consumer goods(26.6%), and raw-material and intermediate goods(17.5%), compared to the daily averages of the sameperiod of 2004.
56. International reserves increased US$2.9 billionin March, to US$62.0 billion, while adjusted netreserves stood at US$39.5 billion (BCB concept),recording a US$4.7 billion increase compared to thesame period of 2004.
Money Market and Open Market Operations
57. After the March Copom meeting, the yield curveshifted upward in response to the Copom decision,to the rising inflation expectations and to the concernsregarding the external outlook. The upward shift waspartially reversed, especially in the short end, by therelease of both the March Copom Minutes on March24 and the IPCA-15 result. However, the subsequentrelease of higher-than-expected headline and coreinflation results put pressure on future interest rates,while IBGE’s announcement of production and retailsales data put downward pressure on rates. Thevolatility in the external outlook and the increase ofthe degree of risk-aversion strongly affected the longend of the yield curve. As a result, the increase ofthe yield curve between the March and April Copommeetings was higher in the long end of the yield curve.Between March 16 and April 20, 1-month and 6-month interest rates increased by 0.39 p.p., and 0.48p.p., respectively, while 1-year, 2-year and the 3-yearrates increased by 0.58 p.p., 0.68 p.p. and 0.85 p.p.,respectively. In the same period, the real interest ratemeasured by the ratio between the one-year nominalinterest rate and the 12-month-ahead inflationexpectations reached 12.86% from 12.42%.
58. The BCB did not rollover any FX instrumentsmaturing in the period. As a result, the net redemptionof FX instruments, including interest payments, totaledUS$224 billion in April and US$14.7 billion in the firstfour months of the year.
59. The National Treasury raised a total of R$21.9billion via auctions of LTNs, maturing in October 2005,

�������������������� ���������������
April 2006, July 2006, and January 2007. TheTreasury raised an additional R$500.5 million via fiveNTN-F auctions, with maturities in January 2008 andJanuary 2010. The Treasury also conducted tenauctions of LFTs maturing in 2007, 2008 and 2009,five of which were sales and five of which wereexchanges. The five sales of LFTs totaled R$18.1billion, and the five exchanges totaled R$2.1 billion.
60. Aimed at reducing excess liquidity projected forthe next quarter, on March 23 the BCB sold LTNsmaturing in July 2005 from its portfolio, and boughtLTNs maturing in April 2005. Similarly, on April 6,April 13 and April 20 the BCB sold LTNs maturingin October 2005, and bought LTNs maturing in July2005. These operations totaled R$5.1 billion.
61. In its open market operations, the BCBintervened in the open market on a weekly basis with3-month fixed-rate repo operations and 1-month
floating-rate repo operations, and conducted dailyliquidity management operations. The BCB alsoconducted twenty fixed-rate overnight repooperations, seven of which were overnightborrowings; three were borrowings with a two-to-five-working-day tenure; and ten of which wereovernight lending. The excess liquidity sterilized fromthe banking reserves market via operations withtenors less than 30 days averaged R$19.2 billion, andthe amount sterilized via operations with three-monthtenors averaged R$39.9 billion.
62. In March, net securitized domestic public debtgrew 3.3%, due to the accrual of interest and the netplacement of R$14.5 billion in securities. The dollar-linked share in net securitized domestic debt fell to4.9% in March from 6.0% in February, mainly dueto the net redemption of FX-linked securities and dueto the reverse swap auctions in which the BCBassumed long FX position.
�������������$+�������#�������������%�&���%'������('����)
Date: May 17th, from 3:10PM to 5:25PM, and May18th, from 5:02PM to 7:30PMPlace: BCB’s Headquarters meeting rooms – 8th
floor on May 17th and 20th floor on May 18th –Brasília – DF
In attendance:Members of the CommitteeHenrique de Campos Meirelles – GovernorAfonso Sant’Anna BevilaquaAlexandre SchwartsmanAntônio Gustavo Matos do ValeEduardo Henrique de Mello Motta LoyoJoão Antônio Fleury TeixeiraPaulo Sérgio CavalheiroRodrigo Telles da Rocha Azevedo
Department Heads (present on May 17th)Altamir Lopes – Economic DepartmentAndré Barbosa Coutinho Marques – InvestorRelations GroupDaso Maranhão Coimbra – International ReservesOperations Department
Ivan Luís Gonçalves de Oliveira Lima – OpenMarket Operations DepartmentJosé Antônio Marciano – Department of BankingOperations and Payments SystemMarcelo Kfoury Muinhos – Research Department(also present on May 18th)
Other participants (present on May 17th)Alexandre Pundek Rocha – Advisor to the BoardFlavio Pinheiro de Melo – Advisor to the BoardHelio Mori – Advisor to the BoardJocimar Nastari – Press SecretaryKatherine Hennings – Advisor to the Board
The members of the Monetary Policy Committeeanalyzed the recent performance of and prospectsfor the Brazilian and international economies underthe monetary policy framework, which is designedto comply with the inflation targets established bythe government.

�������������������������� ��������
Recent Evolution of Inflation 1. Consumer price inflation rose in April, affectedby both the acceleration in market price inflation, andby still high regulated price inflation. April wholesaleprice inflation fell, driven mainly by the drop inagricultural prices, which outweighed the effect ofthe moderate acceleration of industrial price inflation. 2. In April, the IPCA rose 0.87%, after rising 0.61%in March. The accumulated increase in the twelvemonths through April reached 8.07%, or 2.68% inthe year. Market prices rose 0.76% (0.33% in March),accounting for 0.53 p.p. of the IPCA monthly change.Among market prices, food and beverage pricesincreased 0.81%, contributing 0.18 p.p. to the monthlyresult, while increases in medicine prices contributed0.13 p.p. Regulated prices rose 1.14% (1.29% inMarch) and accounted for the remaining 0.34 p.p. ofthe monthly change in the index, driven by adjustmentsin urban bus fares in three capitals (contributing 0.13p.p. for the result in the period), and in electricityrates in five capitals (contributing 0.10 p.p. to themonthly change).
3. The General Price Index (IGP-DI) rose 0.51% inApril, compared to 0.99% in March, for anaccumulated 2.24% increase in the first four monthsof the year, and a 10.22% increase in twelve months.Among the IGP-DI components, the Consumer PriceIndex – Brazil (IPC-Br) rose 0.88% (0.70% in March),mainly reflecting food and medicine price increases,as in the case of the IPCA. The National Index of CivilConstruction (INCC) rose 0.72% (0.67% in March),due to labor cost pressures. The Wholesale Price Index(IPA-DI) rose 0.33% (1.14% in March), accumulatinga twelve-month increase of 11.43%.
4. The deceleration of IPA-DI inflation in April wasmainly due to the 1.6% drop in agricultural prices,compared to the 3.59% increase in March. Industrialwholesale prices ran the opposite way: acceleratingfrom 0.30% in March to 1.01% in April, but withpressures stemming from a few items, such as mining,engines, fuel, pharmaceutical products and plastics.IPA inflation for final goods cooled from March toApril, particularly due toan easing of perishable foodprice inflation, while intermediate goods pricesaccelerated from 0.18% in March to 0.93% in April.
Raw material prices declined, accompanyingagricultural prices, outweighing the acceleration ofmineral raw material prices. 5. IPCA core inflation accelerated in April. The corecalculated under the smoothed trimmed means methodreached 0.7%, compared to 0.62% in the previousmonth, and totaled 7.55% in the twelve monthsthrough April. The non-smoothed core rose to 0.7%from 0.49% in March, with an accumulated twelve-month increase of 6.59% through April. Core inflationcalculated by the exclusion of household food andregulated prices reached 0.71% from 0.41% in March,accumulating 7.3% in twelve months. 6. IPC-Br core inflation, calculated by the GetúlioVargas Foundation (FGV) under the symmetrictrimmed means method, reached 0.65% in April from0.49% in March, for a cumulative twelve-monthincrease of 5.81%. 7. The IPCA diffusion index reached 67.2% inApril, compared to 63.9% in March.
Assessment of Inflation Trends
8. The inflation shocks and their impacts werereassessed according to newly available information.The scenario considered in the simulations utilizedthe following assumptions: a) The projection for the adjustment of bothgasoline and bottled gas prices for 2005 remainedunchanged at 0%;
b) Projections for adjustments of fixed telephone ratesfor 2005 increased to 8.6% from 7.9% at the previousmeeting, while projections for adjustments ofhousehold electricity were kept at 10.8% for 2005;
c) For all regulated prices, which represented a totalweight of 29.6% in the April IPCA, a 7.3% increase isprojected for 2005 (0.1 p.p above the prior projection);
d) The projection for regulated price adjustments in2006, following the model of endogenousdetermination, which takes into account seasonalcomponents, the exchange rate, market price inflation,and the change in the IGP-DI, remains at 5.1%;

������������������� ���������������
e) The projection for the 6-month spread over theSelic rate, following the specification of a VectorAutoregressive model based on the Selic and theswap rates on the eve of the Copom meeting,increases from 14 basis points in the second quarterof 2005 to 42 basis points in the last quarter of 2006.
9. Regarding fiscal policy, it is assumed that theconsolidated public sector primary surplus target of4.25% of GDP for 2005 and 2006 will be achieved.The related assumptions considered in the previousCopom meeting were maintained. 10. Assuming the maintenance of the Selic rate at19.5% p.a. and the exchange rate at the levelprevailing on the eve of the Copom meeting (R$/US$2.50), the IPCA inflation rate was projected abovethe 5.1% objective for 2005, but below the 4.5%central target for 2006. Using the consensus Selic rateand exchange rate projections compiled by the BCB’sInvestor Relations Group (Gerin) on the eve of theCopom meeting, inflation was projected above the2005 objective and the 2006 central target.
Monetary Policy Decision 11. IPCA inflation rose 0.87% in April, above therelatively high 0.6% average posted in the first quarterof the year. The spike in April was due to the increasein tradable goods prices, and occurred despite theslowdown in perishable food price inflation. Regulatedprice inflation slowed modestly, but remained at a veryhigh level. The adjustment in urban bus fares in somecities and the increase in medicine prices were amongthe main drivers of inflationary pressures in the month.Also worth noting, after falling for a few months, therewas an increase in the IPCA diffusion index in April.
12. IPCA core inflation accelerated in April, underall measures monitored by the Copom – by exclusionand trimmed means (smoothed and non-smoothed).After posting a modest change in March, core byexclusion accelerated in April even if adjusted for thetemporary spike in medicine prices. Therefore, theunderlying inflation trend remains at an inconsistentlevel vis-à-vis the inflation target path.
13. IGP-DI inflation decelerated in April, rising by0.51% versus 0.99% in March. The deceleration was
primarily attributable to the sharp drop in wholesaleinflation, particularly supported by the drop inagricultural prices. Data for the first ten days of Mayfor the IGP-10 showed an even larger fall for theagricultural IPA component in the period. Likewise,industrial IPA inflation, after increasing sharply inApril, decelerated more recently. As emphasized inprior Copom Minutes, the lower variation in industrialIPA in recent months reflects, in part, exchange rateappreciation and the effects of monetary policy, andcould have positive spillovers for the future behaviorof consumer prices. The intensity of the pass-throughwill depend on demand conditions and price setters’expectations for the future inflation path.
14. Industrial production rose 1.5% in March,seasonally adjusted, confirming the trend suggested byleading and coincident indicators, and bringing theseries close to the record high reached at end-2004.The March performance could reflect the normalizationof factors that contributed to the poor result in February,such as the delay in the sugar-cane harvest and theslowdown in oil refining, as well as the correction ofinherent fluctuations in the series due to seasonaladjustment for moving holidays. The less volatile three-month moving average remained stable in March, atthe elevated level observed since end-2004. Theeconomy continues to show signs of expansion, but ascould be expected, at a slower pace than that registeredin 2004. Leading and coincident indicators suggestcontinued industrial production growth in April.
15. In terms of industrial activity composition, thestrongest contribution in March stemmed from thecapital goods sector, which grew 5.4%, after twoconsecutive months of contraction. There was acontraction in consumer durable, semi- and non-durable goods production, while the production ofintermediate goods remained stable. In three-monthmoving average terms, consumer durables continuedto grow, while capital goods remained stable. Semi-and non-durable consumer goods production showedsome accommodation, after strong growth in recentmonths. Finally, intermediate goods productioncontinued to slow, possibly reflecting the negativeshock to the agricultural sector in southern Brazil,which affected demand for related goods. Asmentioned in the April Copom Minutes, the patternof the last two months – in which consumer durables

�������������������������� ���������
production remains strong, while more income-sensitive sectors are less robust – appears inconsistentwith the current phase of the economic cycle. Giventhe favorable evolution of the labor market and wagesin recent months, and the monetary policy stance, onewould expect growth to be increasingly sustained byincome-sensitive sectors. More data will be necessaryto better characterize potential changes in the patternof industrial activity.
16. Recent labor market data shows continuation ofthe strong performance of recent quarters. Accordingto the Brazilian Institute of Geography and Statistics(IBGE) survey, the unemployment rate increasedslightly in March (to 10.8% from 10.6% in February),in line with the seasonal pattern of recent years, butbelow 2004 levels. The number of employed workersrose 0.5% relative to February, and there wereincreases in real payrolls and real average earnings.Manufacturing employment, measured by theNational Industry Confederation (CNI) and seasonallyadjusted by the BCB, has been growing since the firstquarter of 2003. Real manufacturing payrolls, afterfalling in the January/February period, grew again inMarch. Formal employment, measured by theMinistry of Labor and Employment (MTE), alsocontinued to expand, with growth of 1.07% in April,for a total of 266,095 new hires, the highest value forthe month since the creation of the series in 1992.This result brings new job creation to 1.54 millionover the last twelve months.
17. Retail sales measured by the IBGE rose 1.75%in March, in seasonally adjusted terms. The resultcould be attributable, in part, to the reversal of theseasonal effect of moving holidays. Furniture andhousehold appliance sales posted the strongestperformance, followed by hyper- and supermarketsales. The only component that declined was the groupfuel and lubricants. In three-month moving averageterms, after posting strong growth from May 2003 toMay 2004, retail sales moderated. Among retail salescomponents, hyper- and supermarket sales haveposted consistently strong growth since end-2003.Furniture and household appliance sales have shownmodest accommodation since end-2004, while fabric,clothing and shoes sales have recently declined. TheFecomercio-SP consumer confidence index fell inMay, but remains at an elevated level.
18. As repeatedly emphasized in recent CopomMinutes, given the strong expansion of activity sinceend-2003, the performance of aggregate supply in thecoming quarters remains a key point of concern withregard to prospective inflation dynamics. Installedcapacity utilization, measured by the CNI andseasonally adjusted by the BCB, rose to 83.1% inMarch, returning to the record levels observed in thesecond half of 2004. Capital goods absorption rose2.4% in the twelve months ending in March 2005,relative to the preceding twelve months. The slowerpace of growth, at the margin, reflects comparison ofa significantly higher base, following the stronginvestment expansion in 2004. Capital goodsproduction accumulated growth of 14.7% in the lasttwelve months, despite the fact that recent data havebeen negatively affected by the sharp drop inproduction of capital goods for the agricultural sector.
19. Strong trade surpluses were maintained in April,reinforcing expectations for stronger than expectedexternal trade results this year. Exports and importscontinued to expand at a fast pace in the first fourmonths of 2005, relative to the same period last year.In the twelve months through April, exports grew32.8% in value terms, relative to that accumulated inthe twelve-month period through April 2004. On thesame comparison base, imports grew 30.0%,responding to the strong expansion in domesticdemand. With exports growing at a faster pace thanimports, the trade balance increased to US$37.8billion in the last twelve months, which represents a38.1% expansion over the twelve months ending inApril 2004. In volume terms, comparing the firstquarter of 2005 with the same period of last year,manufactured exports continued to post the strongestgrowth. The positive performance of the trade balancecontributed to a current account surplus of US$14.2billion in the twelve months ending in April, equivalentto 2.2% of GDP. Therefore, external demandcontinues to contribute to the economic expansion.
20. International capital markets have remainedvolatile since the April Copom meeting, but appear tohave partially absorbed the shock of the downgrade ofkey large corporates in the United States. Braziliancountry risk showed less volatility, and remained in arange below that registered in the period preceding the

�������������������� ���������������
April meeting. The Brazilian currency continued toappreciate, bringing the real-dollar exchange rate tothe lowest levels of the year. As emphasized in priorMinutes, ample international liquidity and marketstability remain tied to macroeconomic conditions inthe industrialized countries, especially the United States,and to the Fed’s potential monetary policy response toeconomic developments. The Copom continues toassign a low probability to a significant deteriorationin international financial markets, driven by abruptchanges in the conduct of U.S. monetary policy.
21. International oil prices continued to decline in thesecond half of April. Oil price behavior continues toreflect information about demand conditions andavailable oil inventories in the main consumer countries,as well as possible supply restrictions among producingcountries. Despite the reduction observed since the AprilCopom meeting, international gasoline prices remainabove those of the domestic market. Projections for thefuture path of oil prices remain surrounded by aconsiderable degree of uncertainty, concentrated, at themoment, on doubts about the persistence of the currentdownward trend. Current oil price behavior increasesthe probability of meeting the Copom’s baseline scenario,which assumes that a sharp deterioration in oil prices isa latent risk and not a central premise. The Committeemaintains the assumption that there will not be anadjustment to domestic fuel prices in 2005. Nevertheless,it is important to note that, given the significant oscillationof international oil prices around high levels, this doescontinue to represent a risk to the future inflation path,although not as significant as last month.
22. Since the April Copom meeting, the median of2005 IPCA inflation expectations collected by Gerinhas deteriorated to 6.39% from 6.10%. As emphasizedin the last Copom Minutes, expectations for 2005inflation have been only minimally effected by positivedevelopments that could dampen inflationarypressures, such as signs of a deceleration in the paceof economic growth, the reassessment of marketexpectations for the exchange rate trajectory, and themore restrictive monetary policy stance. The increasein 2005 expectations is mainly due to the higher thanexpected adjustment of some regulated prices, tohigher inflation expectations in the second quarter,and less favorable external conditions. Expectationsfor twelve-month ahead inflation also deteriorated in
recent weeks, but the deterioration was practicallyin line with the revision for second quarter 2005inflation, suggesting that the more restrictivemonetary policy stance has prevented short-terminflationary pressures from contaminating longer timehorizons. The existence of well-anchored inflationexpectations is confirmed by the stability of inflationexpectations for the second half of 2005 and for full-year 2006.
23. The inflation forecast under the benchmarkscenario – which assumes the maintenance of the Selicrate at 19.5% p.a. and the exchange rate at R$/US$2.50 during the forecast period – increased incomparison to the April Copom meeting, and was abovethe 5.1% objective for the year. This deterioration wasdue to the up-side surprise in April inflation, whichmore than compensated for exchange rate appreciation.The forecasts based on the market scenario – whichincorporate the consensus exchange rate and Selic ratetrajectories on the eve of the Copom meeting – wereabove the benchmark scenario, and also increasedrelative to April, due to the same reasons stated for thebenchmark scenario. There was no change in thebenchmark forecast for 2006 inflation, which remainedbelow the target established by the National MonetaryCouncil for next year. There was, however, a slightincrease in the forecast under the market scenario,which remained above the central target.
24. The Copom also analyzed inflation forecasts forthe twelve-month period ending in March, June, andSeptember 2006. The results for these periods will bemore responsive to current monetary policy decisionsthan those for calendar year 2005, and also morereliable than those for calendar year 2006. Thebenchmark scenario forecast for the twelve-monthperiod ending March 2006 is above the valueinterpolated from the 5.1% inflation objective for 2005and the 4.5% target for 2006, and is also above thevalue projected for the same period at the April Copommeeting. The benchmark scenario forecasts for thetwelve months ending in June and September 2006 arebelow the inflation target path for these periods, and atroughly the same level as forecast at the April meeting.
25. The Copom reaffirmed the view that the effectsof the tightening cycle begun in September 2004 arebeing reflected in first quarter 2005 inflation results

�������������������������� ���������
and in longer-term inflation projections. Economicactivity continues to expand, but at a slower paceand more in line with supply conditions, reducing thelikelihood of significant inflationary pressures. Inaddition, there was an improvement in the externalscenario and the gap between domestic andinternational prices fell. Nevertheless, as in the Marchand April meetings, the Copom identified factors thatheightened the risks to inflation convergence with thetarget path. These risks are associated with thepersistence of isolated pressures on current inflation,which contaminated April inflation, contributed todeteriorate inflation expectations for 2005, and drovethe still high core inflation.
26. The Copom reiterates that, under the inflation-targeting regime, its decision-making is orientedtoward forecasted future inflation and the analysis ofalternative scenarios for the evolution of the mainvariables affecting price dynamics. The continuationof heightened risks for short-term inflation tends toincrease the uncertainty regarding future inflation, sothat both the monetary authority’s assessment ofinflation dynamics and the coordination of privatesector expectations are more difficult. In suchcircumstances, heightened uncertainty driven by theincrease in current headline and core inflation, whichshould reverse in response to monetary policy, couldhave a more lasting effect on inflation expectations.Therefore, monetary policy should remain particularlyvigilant so that short-term pressures do notcontaminate longer-term inflation expectations. Sucha stance is justified despite the monetary policytransmission lag and the fact that the monetaryadjustment cycle initiated in September 2004 has notyet been fully incorporated into price dynamics.
27. Given the short-term risks and their persistence inrecent months, the Copom decided that maintaining ratesfor a significant period of time at the level established atthe April meeting would be insufficient to assure inflationconvergence to the target path. Considering the reasonsstated above, the Copom unanimously decided toincrease the Selic rate target to 19.75% p.a., withoutbias, and closely monitor the inflation outlook until thenext meeting, to then define the next steps in themonetary adjustment process begun in September. Ashighlighted in prior Minutes, the monetary authority mustremain ready to adapt the pace and magnitude of the
interest rate adjustment process to the prevailingcircumstances, in case of an exacerbation of the riskfactors monitored by the Committee.
28. At the conclusion of the meeting, it was announcedthat the Copom would reconvene on June 14 fortechnical presentations, and on the following day todiscuss the monetary policy decision, as established inCommuniqué 12,631 of October 29, 2004.
Summary of Data Analyzedby the Copom
Economic Activity
29. According to the IBGE nationwide survey, retailsales data seasonally adjusted by the BCB expanded1.8% in March, month-on-month. Among thesurveyed sectors, only fuel and lubricants salesdecreased. Overall retail activity increased 8.6% incomparison to March 2004, driven by the 18% risein furniture and household appliance sales. Hyper-and supermarket sales rose 10.9% in the same period.Autos, motorcycle and spare parts sales, which arenot included in the general index, increased 5% forthe same comparison basis. In the first quarter of theyear, retail sales as a whole increased 5.9%, ascompared to the same period of 2004.
30. In April, data from the São Paulo TradeAssociation (ACSP) showed declines of 2.7% and 2%,respectively, for the number of database consultationsfor credit sales and the consultations of the Usechequesystem, on a month-on-month seasonally adjustedbasis. In the year through April, these indicatorsincreased 6.3% and 4.8%, respectively, in comparisonto the same period of the previous year.
31. The Fecomercio-SP survey showed a 5.5%month-on-month decline in the Consumer ConfidenceIndex in May, due to the declines of 6.1% inconsumer expectations and of 4.5% in currenteconomic conditions.
32. Regarding investment indicators, month-on-monthseasonally adjusted data showed 0.8%, 5.4% and 0.8%increases in March, respectively, for the production ofconstruction inputs, domestic capital goods production,and capital goods imports. Capital goods output

�������������������� ���������������
decelerated in the first quarter, in comparison to thesame period of 2004, mainly because of a significantfall in agricultural machinery production. However,there have been notable increases in the production ofconstruction, electrical energy and transportationequipment. Capital goods imports have also shownhigher expansion rates in 2005, posting 25% growthin the first quarter of the year.
33. According to the IBGE monthly industrial survey,industrial production rose 1.5% in March in month-on-month seasonally adjusted terms. After twoconsecutive monthly declines, the March outcomewas close to the peak level of December 2004,reflecting 1.2% and 0.4% increases, respectively, inmanufacturing and mining output.
34. Analysis of seasonally adjusted data for industrialproduction by activities shows that the growth ofindustrial output in March reflected expansion in 15of the 23 sectors surveyed, mainly pharmaceuticals,machinery, cellulose and paper, and communicationand electronic materials. In terms of use categories,the recovery of capital goods production is noteworthy,with a 5.4% increase, after two consecutive falls. Witha 0.1% increase, intermediate goods productionslightly exceeded the February result, while theproduction of durable and non-durable goods declined0.7% and 0.2%, respectively.
35. CNI manufacturing data showed 0.2% increasesfor both real sales and hours worked in March, on amonth-on-month seasonally adjusted basis. Comparedto the same month of 2004, real sales and hoursworked increased 0.7% and 4.2%, respectively.Installed capacity utilization reached 83.1% in March,with 0.6% month-on-month growth in the seasonallyadjusted series, and an increase of 0.8% in comparisonto March 2004.
36. The 2004-2005 harvest is expected to reach 113.7million tons, according to the April survey of theCompanhia Nacional de Abastecimento (Conab).The forecasted figure is 4.9% below the estimates ofMarch, and corresponds to a 4.6% decline incomparison to 2003-2004 season, due to the prolongeddrought which mainly affected soy and cornproduction in the states of Rio Grande do Sul, Paranáand Mato Grosso do Sul.
37. Leading indicators for the industrial sector signalsome moderate growth in April, in the month-on-month seasonally adjusted series, enough to sustainthe high output level of the last months. Automotiveproduction has been particularly strong, increasing14.4% in the year through April. Labor Market
38. Formal employment rose 0.6% in April (month-on-month, seasonally adjusted), according to theMinistry of Labor and Employment. Compared to thesame month of 2004, there was a 6.5% expansion informal employment, with the net creation of over 1.5million jobs, driven by significant increases incommerce and manufacturing.
39. According to the IBGE survey in the six mainmetropolitan regions of the country, the unemploymentrate reached 10.8% in March, compared to 10.6% inFebruary and 12.8% in March 2004. The month-on-month deterioration occurred despite the 0.7%increase in the number of employed people, whileunemployed individuals grew 2.7%, in line withseasonal patterns. The labor force, estimated at 21.9million individuals, rose 0.9% in March. The samesurvey indicated that real average incomes increased0.5% and 1.7%, in comparison to February and March2004, respectively.
40. According to the BCB’s seasonal adjustment ofthe CNI indices, employment and real payrolls in theindustrial sector expanded 0.2% and 2% in March,respectively, in comparison to February, and 6.5%and 9.5% compared to March 2004.
Credit and Delinquency Rates
41. Non-earmarked credit grew 2.9% in April. Creditoperations with individuals increased 3.5%, drivenmainly by the expansion of personal credit, reflectingthe growth of payroll-deducted loans, mainly thosecontracted by retirees. Corporate credit with domesticfunding rose 3.5%, while the corporate credit withexternal funding increased 0.2%.
42. The average interest rate on non-earmarkedcredit rose to 48.4% p.a. in April, from 47.8% p.a. inMarch. The average corporate rate increased 0.4

�������������������������� ���������
p.p. to 33.3% p.a., while the average rate of creditto individuals increased 0.5 p.p., reaching 64.5% p.a.
43. The default rate on non-earmarked creditoperations to individuals reached 12.3% in April, 0.4p.p. below that of March. The corporate default ratestood at 4% in April, up from 3.8% in March.
44. The retail sales default rate, measured by theACSP, increased to 7.7% in April from 6.4% inMarch, mainly reflecting a slower pace of past-duedebt renegotiation by credit institutions. The numberof new negative registers fell 7.2%, but the drop inthe number of cancelled registrations was higher,9.9%. In the year through April, the average defaultrate stood at 6.4%, in comparison with 6.2% in thefirst four months of 2004. The number of returnedchecks, compared to the total number of checks,reached 6.4% in April, a new peak in the series.
External Environment
45. Initial data on first quarter economic growth inthe main global economies were in line withexpectations. Chinese GDP grew 9.5% on a quarter-on-quarter basis, while growth in the Euro Zone was0.5%, supported by higher than expected Germangrowth. GDP contracted for the second consecutivequarter in Italy (-0.4% in the fourth quarter of 2004and -0.5% in the first quarter of 2005, on a quarterlybasis). In the UK, GDP rose 0.6% in the first quarter,in the same comparison basis. In the United States,the first estimate of GDP growth for the first quarterposted an annualized rate of 3.1%.
46. Despite better than expected first quarter data,expectations for GDP growth in the Euro Area and theUK are not very optimistic, with recent indicatorssuggesting a slowdown in economic activity. This is incontrast to expectations for the U.S. and China. Thelower than expected U.S. trade deficit in March (US$55billion) should lead to an upward revision in the firstquarter GDP result. Meanwhile, China continues to postlarge merchandise trade surpluses – US$21.2 billion inthe first four months of the year, versus a deficit ofUS$11 billion in the same period of 2004.
47. The inflation trajectory appears to be manageable.The broad decline in commodity prices, and particularly
oil prices, will have a positive impact on consumer andproducer price inflation in the coming months. In March,these indices rose 3.1% and 4.9%, respectively, in theU.S.; 1.9% and 2.8% in the U.K.; and 2.1% and 4.2%in the Euro Zone. In China, consumer price inflationrose 1.8% in April, relative to the same month last year.
48. The Bank of England held interest rates steady at4.75% p.a. in May, for the ninth consecutive month.The Fed continued its policy of gradual interest rateincreases, bringing the fed funds rate to 3% p.a. in May.
49. In the international financial markets, the mainpressure point was the potential problems at hedgefunds, which have highly leveraged positions in therecently downgraded, large U.S. automotivecompanies, with negative (although limited) effectson emerging market debt prices.
Foreign Trade and Balance of Payments
50. New trade balance record highs were reachedfor the month of April, the first four months of theyear, and the twelve-month period ending in April. Inthe month, the trade balance registered a surplus ofUS$3.9 billion. For the twelve months, the tradebalance and total external trade reached US$37.8billion and US$170.4 billion, respectively, with growthof 38.1% and 31.7% over the previous period. In thefirst 10 working days in May, the trade balancereached US$1.4 billion, with export and import growthof 16.8% and 31.4%, respectively, over the averagelevel reached in May 2004.
51. Exports totaled US$9.2 billion in April and postedthe largest daily average ever recorded (US$460.1million), an increase of 39.6% compared to April2004. All goods categories posted record levels, inline with higher prices for important export productsand an increase in export volumes. Strong growthhas been registered across export products, includingtraditionally low-participation items, confirming theexport diversification process that is underway. Inaddition, it is important to highlight the expansion ofexport destinations, even to markets with a lowparticipation in Brazilian exports.
52. Imports totaled US$5.3 billion, growing 15% interms of daily averages, compared to daily averages

�������������������� ���������������
in April 2004. The growth in imports occurred despitethe 10.2% contraction in fuel and lubricant imports.In the first four months of the year, all importproducts categories registered growth. Of note werethe 26.2% increase in imports of fuel and lubricants,25.8% of capital goods, 21.3% of consumer goods,and 18% of primary and intermediate goods, allmeasured in daily averages compared to the sameperiod last year.
53. At the end of April, international reserves totaledUS$61.6 billion and net adjusted reserves totaledUS$39 billion, a reduction of US$368 million andUS$509 million, respectively, relative to end-March.
Money Market and Open Market Operations
54. In the period following the April Copom meeting,the yield curve shifted upward for tenors less thansix months, in response to the Committee’s monetarypolicy decision, the increase in inflationexpectations, and the release of industrial productionand retail sales data. In contrast, rates fell in thelong end of the curve, driven mainly by the MayU.S. Federal Open Market Committee decision (thecommuniqué of which indicated a continuation ofmeasured interest rate increases), the reduction inBrazilian country risk, the drop in oil prices, and theincrease in foreign investment flows. Between April20 and May 18, one- and three-month interest ratesrose 0.21 p.p. and 0.12 p.p., respectively, while six-month, one-year, two-year, and three-year rates fell0.05 p.p., 0.35 p.p., 0.58 p.p., and 0.68 p.p.,respectively. The real interest rate, measured bythe ratio between the one-year nominal interest rateand the twelve-month-ahead inflation expectation,fell to 12.66% from 12.86%.
55. Since the last Copom meeting, the NationalTreasury completed three fixed rate security auctionsof LTNs maturing in October 2005, July 2006, andJanuary 2007, and NTN-Fs maturing in January 2008
and January 2010. The sale of LTNs totaled R$14.5billion and of NTN-Fs, just the shorter maturity,totaled R$105.3 million. The Treasury also conductedfour auctions of LFTs maturing in March 2008,December 2008, and September 2009, for a total ofR$7.1 billion. Aimed at reducing the volume ofsecurities maturing on July 1, 2005, the Treasuryconducted a buy-back of LTNs totaling R$2.9 billion,via two auctions.
56. In its open market operations, the BCB conductedweekly repo operations, with three-month fixed raterepos and one-month floating rate repos, as well asdaily liquidity management operations. The BCB alsoconducted thirteen short-term repo operations, nineof which were overnight and four of which were twoto three working days. As a result of current liquidityconditions, one-month repo operations weresuspended beginning on May 4. The excess liquiditysterilized from the banking reserves market viaoperations with tenors of three months averagedR$42.1 billion. Operations with tenors less than thirtydays averaged R$1.3 billion.
57. Aimed at reducing excess liquidity projected forthe third quarter, on April 27, May 4, and May 11,the BCB sold LTNs maturing in October 2005 fromits portfolio and purchased LTNs maturing in July2005. These operations totaled R$3.8 billion.
58. Through May 18, the net redemption of FXinstruments, including interest payments, reachedR$307 million. Since the beginning of the year, thenet redemption totals R$15.0 billion.
59. In April, net securitized public debt remainedstable relative to the previous month, due to the netredemption of securities and the currencyappreciation. The dollar-linked share of net domesticdebt fell to 4.6% at end-April from 4.9% at end-March, mainly due to the effect of exchange rateappreciation on the stock of securities and swaps.

�������������������������� ���������
����������������� ���
�������������������� ���������������������������
Circular 3,274, 2.10.2005 – Redefined and consolidatedthe rules on reserve requirements on demand resources,considering the alterations introduced into the system ofsettlement of payment instruments. The following BancoCentral Circulars were consolidated:a) Circular 3,177, 2.19.2003 – Increased the amount deducted
from the arithmetic average of the amounts subject toreserve requirements from R$4,000,000.00 (four millionreais) to R$44,000,000.00 (forty four million reais);
b) Circular 3,199, 8.8.2003 – Reduced the reserve ratio ondemand resources from 60% to 45%; and
c) Circular 3,257, 9.8.2004 – Includes investment depositsin the amounts subject to reserve requirements on demandresources and the additional reserve.
Resolution 3,272, 3.24.2005 – Determined that, by July1, 2005, financial institutions and other institutions authorizedto operate by Banco Central do Brasil should registersecurities they have issued, accepted or guarantied, withthe exception of stocks, in systems of registration andfinancial settlement authorized by this institution or by theSecurities and Exchange Commission (CVM).
Resolution 3,273, 3.24.2005 – Maintained the Long-Term Interest Rate (TJLP) at 9.75% for the second quarterof 2005.
Resolution 3,277, 3.31.2005 – Defined special conditionsof an emergency and extraordinary character, applicableexclusively to the 2004/2005 harvest, for purposes ofextending the maturities of debts generated by the droughtthat affected municipalities in the states of Rio Grande doSul, Paraná and Santa Catarina. Consequently, in the contextof the Farm Activity Guaranty Program (Proagro), farmerswere given an additional period of two years in which toeffect payment of their installments on current expenditure

�������������������� ���������������
financing matured or due to mature in the current year,provided that the borrower has declared losses of morethan 30% of expected production. At the same time, thismeasure extended the period for payment of installmentsmatured or to mature in 2005 for an additional period of upto one year subsequent to the maturity of the finalcontracted installment, in cases involving investmentfinancing operations for which group “E” borrowers in theframework of the National Program for StrengtheningFamily Farming (Pronaf) are responsible.
Resolution 3,278, 4.28.2005 – Determined that entitiesproviding settlement, registration and custody services mayperform lending services involving the securities in theircustody, stressing that, in the past, this type of operationwas permitted only with stocks issued by open capitalcorporations. The conditions for carrying out such operationsare as follows:a) the prior authorization of those holding title to the securities
to be used in the lending operation must be in writing;b) in security lending operations, intermediation is to be
performed by security brokerage or distributioncompanies; and
c) the regulations covering security-lending operations mustbe approved beforehand by the CVM.
Circular 3,282, 4.28.2005 – Defined the period forregistration of securities based on the terms of Resolution3,272, 3.24.2005. Registration must be effected within threebusiness days of contracting of the operation. Stocks andsecurities issued by a single institution in the benefit of asingle holder of title with an overall value of less thanR$50,000.00 (fifty thousand reais) are exempt from theregistration requirement.
Resolution 3,280, 4.29.2005 – Altered the targeting ofresources received in the form of savings deposits bymember institutions of the Brazilian System of Savings andLoans (SBPE). These institutions are dispensed fromcompliance with the requirement of minimum investmentof 65% of their savings account resources, provided thatthe operations granted in the months of April, May andJune 2005 be 45% greater than the volumes registered inthe same period of 2004.
Resolution 3,284, 5.25.2005 – Deals with investment ofthe available cash resources originating in the revenues ofstate-owned companies and joint capital corporations thatare part of the indirect federal administration, involvingextramarket funds managed by Banco do Brasil. This rule

�������������������������� ���������
fosters adjustment of extramarket funds to the new ruleson the functioning of investment funds issued by the CVM.The rule requiring investment of the resources in the portfoliosof these funds remains in effect, with at least 75% inacquisitions of papers issued by the National Treasury anda maximum of 25% in time deposits in institutions that arecomponents of the Banco do Brasil conglomerate. Theremaining resources of these investment funds may bechanneled into repo operations with securities issued by theNational Treasury, maintained in demand deposit accountsor targeted to derivative market operations. Aside from this,it is important to note that derivative market operations canonly be carried out by exclusive extramarket funds.
����������������������
Decree 5,379, 2.25.2005 – Deals with budget and financialprogramming for the 2005 fiscal year and defined theexecutive branch monthly disbursement schedule. In theprocess of elaborating the disbursement schedule, R$15.9billion were conditioned to the availability of resources,including R$8.7 billion in investment outlays and R$7.2 billionin current expenditures. Just as occurred in previous years,once estimated revenues have been confirmed, the blockedamounts will be gradually released.
Provisional Measure 242, 3.24.2005 – Altered theprovisions in Law 8,213, dated 7.24.1991, in such a way asto introduce modifications into the system and calculationof illness assistance benefits.
Decree 5,385, 3.4.2005 – Instituted the Public-PrivatePartnership Management Committee (CGP) which has theprincipal objective of selecting priority investment projectssupported by the Public-Private Partnership Law (PPP).
Law 11,107, 4.6.2005 – Deals with general rules to befollowed by federal, state and municipal governments in thecontracting of consortia of public entities in the pursuing ofobjectives in the common interest, and takes other measures.
Decree 5,411, 4.6.2005 – Authorized payment of quotasin the Public-Private Partnership Guaranty Fund (FGP)through the use of stocks that are representative of thefederal government’s stock participation in joint capitalcompanies available for sale.

�������������������� ���������������
Provisional Measure 248, 4.20.2005 – Set the value ofthe minimum wage at R$300.00 to go into effect as of5.1.2005.
Decree 5,442, 5.9.2005 – Reduced the rate of theContribution to PIS/Pasep and the Contribution to Financingof the Social Security System (Cofins) to zero on financialrevenues generated by operations carried out for hedgingpurposes, when such are earned by legal entities subject tothe system of noncumulative levying of the statedcontributions. It is stressed that Decree 5,164, dated7.30.2004, which instituted the zero rate for financialrevenues, did not cover hedge operations. Only thosefinancial revenues originating in interest on the entity’s owncapital remain subject to these contributions.
Decree 5,443, 5.9.2005 – Increased the benefits paid bythe National Social Security System (INSS) by 6.355%. Thispercentage includes retirement and pension benefits inamounts above one minimum monthly wage and does notapply to those benefits that were increased when the wagefloor was raised. This measure, which went into effect onMay 1, also set the ceiling on the contribution wage andbenefit wage at R$2,688.15.
Presidential Messages 264, 265 and 266 issued on5.11.2005 – Informed the President of the Federal Senatethat three bills that authorized an increase of 15% in thewages of the Legislative Branch (Chamber of Deputies,Federal Senate and Federal Budget Court) were vetoed intheir entirety since they violated constitutional principlesand were not in keeping with the terms of the FiscalResponsibility Law.
Decree 5,447, 5.20.2005 – Altered the Appendix toDecree 3,803, dated 4.24.2001, which lists the medicinesentitled to exemption from the contributions to PIS/Pasepand Cofins. Decree 3,803/2001 grants corporate entitiesresponsible for the industrialization or import of medicinesdestined for the internal market that require medicalprescriptions and that must be identified by a red or blackstripe on their packaging, the right to utilize the system ofpresumed credit for the PIS/Pasep and Cofins programs.The measure will make it possible to reduce market pricesby an average of 11%, representing a savings for consumersin the range of R$125 million per year. This is a measure ofparticular importance to those people who require continueduse of certain medicines.

�������������������������� ���������
Law 11,119, 5.25.2005 (conversion of Provisional Measure243, 3.31.2005) – Validated the updating of the individualincome tax table, which went into effect on 1.1.2005,andrevoked the other provisions of Provisional Measure 232,12.30.2004.
���������������������������������
Secex Circular 13, 2.28.2005 (DOU 3.2.2005) –Announced distribution of a quota of 6,000 light automotivevehicles among national companies, entitled to 100% tariffpreference in exports from Brazil to Uruguay, based on theterms of the 60th Additional Protocol to EconomicComplementation Agreement n. 2.
Camex Resolution 5, 3.3.2005 (DOU 3.7.2005) –Altered the list of exceptions to the TEC. Fifteen steelproducts were included with a zero Import Tax rate, includingcold rolled coils, hot rolled coils and tinplate. At the sametime, products from the medical area, barley and somefertilizers were excluded.
CMN Resolution 3,270, 3.17.2005 – Instituted a creditline based on resources from the Coffee Defense Fund(Funcafé) to be used in the financing of the coffee harvestand stocking in the 2004/2005 farm year and deals withthe marketing of Arabic and robust coffees from the 2004/2005 harvest, based on the terms of the Special CreditLine (LEC).
Mapa Normative Instruction 4, published in the DOUdated 3.17.2005, and republished in the DOU dated3.21.2005 and 3.22.2005 (Vigiagro) – Determined thatimports or exports of any animal, plant, their products andsubproducts, as well as all raw materials and inputs used incrop and livestock farming are, when regulated or capableof transmitting pests or diseases, subject to inspection bythe Crop/Livestock Inspection System, which is subordinatedto the Ministry of Agriculture, Livestock and Supply.
Law 11,105, 3.24.2005 (DOU 3.28.2005) – Regulatedindents II, IV and V of paragraph 1 of article 225 of theFederal Constitution, defines safety standards and theinspection mechanisms to be applied to activities involvingGenetically Modified Organisms and their derivatives,creates the National Biosafety Council, restructures theNational Biosafety Technical Commission, and deals withNational Biosafety Policy.

�������������������� ���������������
Camex Resolutions 8, 10, 13 and 14, respectivelydated 3.24.2005, 4.25.2005, 5.20.2005 and 6.7.2005(DOU, 3.30.2005, 4.27.2005, 5.23.2005 and 6.8.2005(Ex-Tariff) – Altered the ad valorem Import Tax rates onthe capital goods specified therein to 2%, up to 12.31.2006,in the case of the first rule, and up to 6.30.2007, for theothers, in the ex-tariff condition, and adopts other measures.
STN Directives 252, 4.1.2005, and 300, 5.2.2005 –Authorized issue of National Treasury Notes Series I, NTN-I, in respective amounts of R$15,062,249.74 (fifteen million,sixty two thousand, two hundred and forty nine reais andseventy four centavos) and R$3,449,325.33 (three million,four hundred and forty nine thousand, three hundred andtwenty five reais and thirty three centavos), registered underamounts to be paid on 12.15.2004, to be used in the paymentof interest rate equalization in the financing of exports ofBrazilian goods and services under the terms of Proex.
Provisional Measure 246, 4.6.2005 (DOU, 4.7.2005,rectified in DOU 4.8.2005) – Deals with restructuring ofthe railway sector and conclusion of the process of liquidationof the Federal Railway Network S.A., regulated by Decree5,412, dated 4.6.2005.
Secex Circular 24, 4.18.2005 (DOU 4.19.2005) –Distributed a quota of 185,000 automotive vehicle unitsamong the companies specified therein involving Brazilianimports from Mexico in 2005, based on EconomicComplementation Agreement n. 55.
Camex Resolution 12, 4.25.2005 (DOU 3.7.2005) –Altered the Income Tax rates in the TEC of the productsspecified therein, including chemical products, leather andhides and others.
Bacen Circular 3,283, 4.29.2005 – Altered theprocedures related to registration of electronic interbankexchange operations.
Law 11,116, 5.18.2005 (DOU 5.19.2005) – Deals withthe Special Registration of biodiesel producers or importersat the Federal Revenue Secretariat of the Ministry ofFinance and with levying of the Contribution to PIS/Pasepand Cofins on revenues generated by sales of that product;alters Laws 10,451, 5.10.2002, and 11,097, 1.13.2005, andtakes other measures. Conversion into law of ProvisionalMeasure 227, dated 12.6.2004.

�������������������������� ��������
Decree 5,541, 6.1.2005 (DOU 6.2.2005) – Deals withimplementation of United Nations Security CouncilResolution 1,556, dated 6.30.2004, which, among othermeasures, imposed an arms embargo on nongovernmentalentities and individuals operating in the region of Darfur, inthe Sudan.

�������������������������� ���������
��������
����������������� ������������
����� ������������������������������������

�������������������������� ���������
���� �����������������������
�����
Henrique de Campos MeirellesGovernor
Afonso Sant'Anna BevilaquaDeputy Governor
Alexandre Antonio TombiniDeputy Governor
Alexandre SchwartsmanDeputy Governor
Antonio Gustavo Matos do ValeDeputy Governor
João Antônio Fleury TeixeiraDeputy Governor
Paulo Sérgio CavalheiroDeputy Governor
Rodrigo Telles da Rocha AzevedoDeputy Governor
Sérgio Darcy da Silva AlvesDeputy Governor

�������������������� ���������������
����������������������������� ���������� �����
������ �� ��
Henrique de Campos MeirellesGovernor
Afonso Sant'Anna BevilaquaDeputy Governor
Alexandre Antonio TombiniDeputy Governor
Alexandre SchwartsmanDeputy Governor
Antonio Gustavo Matos do ValeDeputy Governor
João Antônio Fleury TeixeiraDeputy Governor
Paulo Sérgio CavalheiroDeputy Governor
Rodrigo Telles da Rocha AzevedoDeputy Governor
Sérgio Darcy da Silva AlvesDeputy Governor
��������� �� ��
Altamir LopesHead of the Departament of Economics (Depec)
Daso Maranhão CoimbraHead of the Departament of International ReserveOperations (Depin)
José Antonio MarcianoHead of the Departament of Banking Operations andPayments System (Deban)
José Pedro Ramos Fachada Martins da SilvaHead of the Investor Relations Group (Gerin)
Marcelo Kfoury MuinhosHead of the Research Departament (Depep)
Ivan Luis Gonçalves de Oliveira LimaHead of the Departament of Open Market Operations(Demab)

�������������������������� ���������
�������
ACSP São Paulo Trade Association
ADR American Depositary Receipts
Aladi Latin American Integration AssociationAndima National Association of Financial Market Institutions
Anfavea National Association of Automotive Vehicle Manufacturers
ANP National Petroleum AgencyBNDES Brazilian Development Bank
Bovespa São Paulo Stock Exchange
Caged General File of the Employed and UnemployedCMN National Monetary Council
CNI National Confederation of Industry
Cofins Contribution for the Financing of Social SecurityConab National Supply Company
CSLL Social Contribution on Net Profit
CVM Securities and Exchange Commission of BrazilDJIA Dow Jones Industrial Average
DPMFi Internal federal public securities debt
ECB European Central BankEmbi+ Emerging Market Bond Index Plus
FBCF Gross Fixed Capital Formation
FDI Foreign Direct InvestmentsFecomercio RJ Trade Federation of the State of Rio de Janeiro
Fecomercio SP Trade Federation of the State of São Paulo
Fed Federal Reserve SystemFGTS Severance Fund Contribution
FGV Getulio Vargas Foundation
FIDC Credit Rights Investment FundFIF Financial Investment Funds
FMP Mutual privatization funds
Funcex Foreign Trade Study Center FoundationGDP Gross Domestic Product
Gerin Investor Relations Group of the Central Bank of Brazil
IBGE Brazilian Institute of Geography and StatisticsIbovespa São Paulo Stock Exchange Index
ICC Consumer Confidence Index
Icea Index of Current Economic ConditionsIcei Current Industrial Employment Index
ICMS Tax on the Circulation of Merchandise and Services

�������������������� ���������������
IEC Consumer Expectation Index
IGP General Price Index
IGP-DI General Price Index – Domestic SupplyIGP-M General Price Index – Market
IIF Institute of International Finance
IMA Andima Market IndexIMF International Monetary Fund
INEC Consumer Expectation National Index
INPC National Consumer Price IndexINSS National Social Security Institute
IPCA Broad National Consumer Price Index
IPC-Br Consumer Price Index – BrazilIRF-M Market Fixed Income Tax
IRPJ Corporate Income Tax
LDO Budget Directives LawLFT National Treasury Financing Bills
LSPA Systematic Farm Production Survey
LTN National Treasury BillsMTE Ministry of Labor and Employment
Nasdaq National Association of Securities Dealers Automated Quotation
Opec Organization of Petroleum Exporting Countriesp.p. Percentage points
p.y. Per year
PEA Working PopulationPIM Monthly Industrial Survey
PMC Monthly Trade Survey / Montly Survey of Trade (do IBGE)
PME Monthly Employment SurveyProagro Farm Activity Guaranty Program
PSND Public sector net debt
RGPS General Social Security SystemSBPE Brazilian System of Savings and Loans
Selic Special System of Clearance and Custody
SITC Standard International Trade ClassificationSPC Secretariat of Complementary Social Security
USA United States of America
WPI Wholesale Price IndexWTO World Trade Organization